Detailed Mapping of Urban Land Use Based on Multi-Source Data: A Case Study of Lanzhou
by
 ,
,
Leli Zong
1 ,
,
Sijia He
1,
Jiting Lian
2,
Qiang Bie
1,3,
Xiaoyun Wang
1,4,
Jingru Dong
1 and
Yaowen Xie
1,4,* 1
College of Earth and Environment Sciences, Lanzhou University, Lanzhou 730000, China
2
School of Economic and Trade, Hebei GEO University, Shijiazhuang 050031, China
3
Faculty of Geomatics, Lanzhou Jiaotong University, Lanzhou 730070, China
4
The Key Laboratory of Western China’s Environmental Systems, Ministry of Education (MOE), Lanzhou 730000, China
*
Author to whom correspondence should be addressed.
Remote Sens. 2020, 12(12), 1987; https://0-doi-org.brum.beds.ac.uk/10.3390/rs12121987
Submission received: 15 May 2020
/
Revised: 14 June 2020
/
Accepted: 16 June 2020
/
Published: 20 June 2020
(This article belongs to the Special Issue Urban Land Use Mapping and Analysis in the Big Data Era)
Abstract
:Detailed urban land use information is the prerequisite and foundation for implementing urban land policies and urban land development, and is of great importance for solving urban problems, assisting scientific and rational urban planning. The existing results of urban land use mapping have shortcomings in terms of accuracy or recognition scale, and it is difficult to meet the needs of fine urban management and smart city construction. This study aims to explore approaches that mapping urban land use based on multi-source data, to meet the needs of obtaining detailed land use information and, taking Lanzhou as an example, based on the previous study, we proposed a process of urban land use classification based on multi-source data. A combination road network dataset of Gaode and OpenStreetMap (OSM) was synthetically applied to divide urban parcels, while multi-source features using Sentinel-2A images, Sentinel-1A polarization data, night light data, point of interest (POI) data and other data. Simultaneously, a set of comparative experiments were designed to evaluate the contribution and impact of different features. The results showed that: (1) the combination utilization of Gaode and OSM road network could improve the classification results effectively. Specifically, the overall accuracy and kappa coefficient are 83.75% and 0.77 separately for level I and the accuracy of each type reaches more than 70% for level II; (2) the synthetic application of multi-source features is conducive to the improvement of urban land use classification; (3) Internet data, such as point of interest (POI) information and multi-time population information, contribute the most to urban land use mapping. Compared with single-moment population information, the multi-time population distribution makes more contributions to urban land use. The framework developed herein and the results derived therefrom may assist other cities in the detailed mapping and refined management of urban land use.
1. Introduction
Cities are important part of human civilization. Since the 20th century, the process of urbanization has been accelerating, and has become one of the most important factors affecting human society and economy. Rapid urbanization has brought about a series of urban problems, such as environmental degradation, resource exhaustion, traffic congestion, the foam of real estate and poor living environment [1,2,3]. Urban land use could display the spatial structure of the city directly [4], which is an important premise and foundation for the implementation of urban land use policies, and is of great significance for solving urban problems and assisting the scientific and rational formulation of urban planning [5]. Remote sensing technology has been widely used in the field of land use survey, mapping and dynamic monitoring of change information, due to its rapid, macroscopic, comprehensive, accurate, periodic advantages and low cost [6,7,8]. Currently, using remote sensing images is a common method of land use classification [9,10]. However, urban land use often has certain functional semantic characteristics, which are the specific attributes (i.e., commercial, residential) given to the land by humans in the actual course of using. Due to the high similarity of different land use types in spectral and texture, it is difficult to use remote sensing images to achieve land use classification in urban areas [11].
With the development of information and communication technologies, mobile phone signaling data [12], traffic sensor data [13], social media data [14,15], point of interest (POI) data [16] and other spatiotemporal data [17] with semantic characteristics continue to emerge, providing a new perspective for urban land use classification and functional area research. Yuan et al. (2012) used GPS data and the potential Dirichlet model to realize the spatial clustering of residents’ travel characteristics, and used POI data to identify the functional types of the parcels [18]; Toole et al. (2012) selected mobile phone call records within a week, mining the spatial distribution characteristics of user density at different times, using random forest (RF) to analyze the relationship between population activity and urban land use [19]. Liu et al. (2016) used the road network data to divide the basic parcels of the study area, and then introduced POI data to obtain the types of the parcels [20]. However, due to the incompleteness of data user coverage and high noise [21], most studies just identify their dominant function types on the block scale, which is difficult to meet the needs of fine regional management.
Multi-spectral and microwave data in remote sensing images could reflect the physical attributes of different land use types, night lighting data could reflect its socioeconomic status to a certain extent and POI social media data could represent the semantic function information. The combination of multi-source data makes it possible to achieve detailed land use classification in urban areas [22,23]. The essential urban land use categories (EULUC), a parcel-based urban land use map covering the entire country of China for 2018, is proposed by Gong, et al. [24]. The EULUC is based on random forest model using multi-source remote sensing images and social media data. However, the accuracy of EULUC’s cartographic results is not up to the application requirement in some places. Taking Lanzhou as an example, the accuracy both for level I and II category are less than 60%, which cannot meet the needs of regional management. There are two main reasons: (1) the parcels used as basic classification units tend to have a high degree of mixed land use; (2) the part of the data used to extract features is too coarse with slight contributes for land use classification (e.g., 1 km Tencent mobile phone locating-request data) [25]. Moreover, in the previous work, a series of features were applied to urban land use classification, but there is a lack of guidance information on feature selection. Although the importance of different types of features has been compared, the impact of different features and their combinations on classification are not quantitatively characterized and fully discussed.
To better solve these problems, taking Lanzhou as an example, we explored the urban land use classification based on multi-source data. This study aims to provide a reference for detailed urban land use classification and data support for refined urban management. For this purpose, the urban parcels were divided as basic mapping units, with a synthetically utilization of the Gaode and OpenStreetMap (OSM) road network data multiple features, including spectral, texture, nighttime light, backscatter, POI, and time-series of population density features, extracted and filtered based on multi-source data and random forest (RF) algorithm was applied for urban land use classification. Finally, the impact of different features and their combinations on classification were analyzed.
2. Study Area and Data Sources
2.1. Study Area
The main city of Lanzhou, which located in a dumbbell-shaped river valley (between 36°00′–36°09′N and 103°33′–103°57′E), was chosen as the study area (Figure 1). Lanzhou, the capital of Gansu Province, is an important transportation hub connecting the western border areas of China like Xinjiang, Qinghai, and Tibet provinces. As a major town for industrial and economic development in the northwest region of China, Lanzhou has experienced, and is experiencing, rapid urbanization. The types of land use in the main city of Lanzhou are diverse, including residential, industrial, commercial, and public. The classification system of EULUC was adopted as the basic system in study. The two-level scheme adapted from Chinese Standard of Land Use Classification could fit the land use characters of Lanzhou City [24]. On the other hand, mapping based on unified classification system so that easy comparisons with other cities in China could be made. Therefore, we divided the urban land into five Level I classes of residential, commercial, industrial, transportation and public. On this basis, each type in Level I was redefined combining with the land use status of Lanzhou City. Table 1 shows the detailed information of the classification system.
2.2. Data Sources and Pretreatment
2.2.1. Remote Sensing Data
The Sentinel-1A data used in this study are interferometric wide swath (IW) ground distance multi-vision product, with an acquisition time of 23 December 2018, and the polarization modes are vertical transmit (VV) and horizontal receive (VH). For Sentinel-2A data, the Level-1C products, with an acquisition time of 24 August 2018, which have been processed by radiation calibration and geometric correction, were adopted in this study. Specifically, the four 10 m spectral bands of red, green, blue, near-infrared, and two 20 m short-wave infrared (SWIR) bands in the Sentinel-2A data were used. The Sen2Cor, a processor for Sentinel-2 Level 2A product generation and formatting tool [26], was used for atmospheric correction, which is performed using a set of Look-Up tables based on the LIBRADTRAN radiative transfer model [27]. Both Sentinel-1A and Sentinel-2A data were obtained from sentinel open access hub (https://sentinel.esa.int/web/sentinel/sentinel-data-access).
Many studies have shown that nighttime light data could be used to characterize regional population, urbanization, and economy development status [28,29]. The greater the intensity of human activity, the greater the intensity of the nighttime lights. In fact, there is a certain degree of correlation between the intensity of nighttime light and the type of urban land. For example, areas with high economic activity such as commercial and industrial land usually have high-intensity public and commercial lights, while the light intensity of residential land is relatively weak. Compared with DMSP/OLS and VIIRS-DNB data, Luojia-1 could provide high-resolution nighttime light imagery with clearer spatial details [30]. Therefore, the Luojia-1 nighttime light images used in this study, with an acquisition time of 23 August 2018, and a spatial resolution of 130 m, coming from the data and application platform of high-resolution earth observation system for Hubei province, China (http://www.hbeos.org.cn/). Geometric correction for Luojia-1 images were processed based on prominent features, such as road intersections and inflections as reference points.
2.2.2. Internet Data
The Easygo data was acquired from Tencent big data platform (https://heat.qq.com/index.php), which records the real-time locations of active users on Tencent, one of the largest social media platforms in China. The Easygo data could provide the real-time spatial distribution of the population in the study area [14]. We implement a web crawler to acquire the Easygo data within the study area for an entire week from 16–22 December 2019 (16–20 are weekdays, 21–22 are weekends), with a spatial resolution of 25 m and a temporal resolution of two hours.
The Gaode POI data were acquired via the application programming interface (API) provided by the official website of Gaode Maps (https://lbs.amap.com/), with a collection time of December 2019. Each POI record has a series of attributes such as the name, type, address, latitude, and longitude. All POIs were reclassified into 11 categories of residential, village, business, commercial, industrial, administrative, educational, medical, sport and cultural, greenspace and undeveloped.
2.2.3. Road Network Data
The road data consist of OSM road data and Gaode road data, OSM road data were acquired from the OpenStreetMap platform (https://www.openstreetmap.org), and Gaode road data were acquired from Gaode Maps (https://lbs.amap.com/) via a web crawler, respectively. OSM data has the advantages of fast update speed, high current and low cost. It has been widely applied to urban block division and parcel generation [14,22]. As a volunteered geographic dataset, OSM road data are dense and applicable in large and medium-sized cities [31]. However, the completeness of high- level roads such as highways and urban arterial roads are more than that of low-level roads in Lanzhou city. Specifically, areas with strong human activities have dense roads, areas with weak activities have sparse roads relatively (such as roads in the suburbs), the completeness of high-level roads such as highways and urban arterial roads are more than that of low-level roads. Therefore, the parcels generated only using the OSM road network have a high urban land-use mixed degree, which could not meet the needs of the refined mapping of land use in Lanzhou City. The Gaode road network data providing detailed roads could help to better divide the urban parcels.
3. Method
Based on road network segmentation, the RF algorithm was chosen for the classification of the parcels. The specific process (Figure 2) is as follows. (1) The boundary of the downtown area of Lanzhou is obtained by visually interpreting high-resolution Google images. Water bodies (NDWI > 0.1) [32] were excluded. (2) OSM and Gaode road networks were used to divide the parcels as the basic mapping units. (3) All features, such as spectral, texture, time-series population density, were extracted based on remote sensing data and Internet data. (4) To obtain the preferred feature dataset, the ReliefF method was used to eliminate redundant features. (5) The RF algorithm was applied to classify urban land use types with preferred features. Based on validation samples, the indicators based on confusion matrix consist of user accuracy (UA), producer accuracy (PA), overall accuracy (OA) and kappa coefficients were used to evaluate the classification performance [33]. By constructing different feature sets based on preferred features, the classification accuracies of different feature sets and the contribution of different features to the classification results were further analyzed.
3.1. Parcel Generation
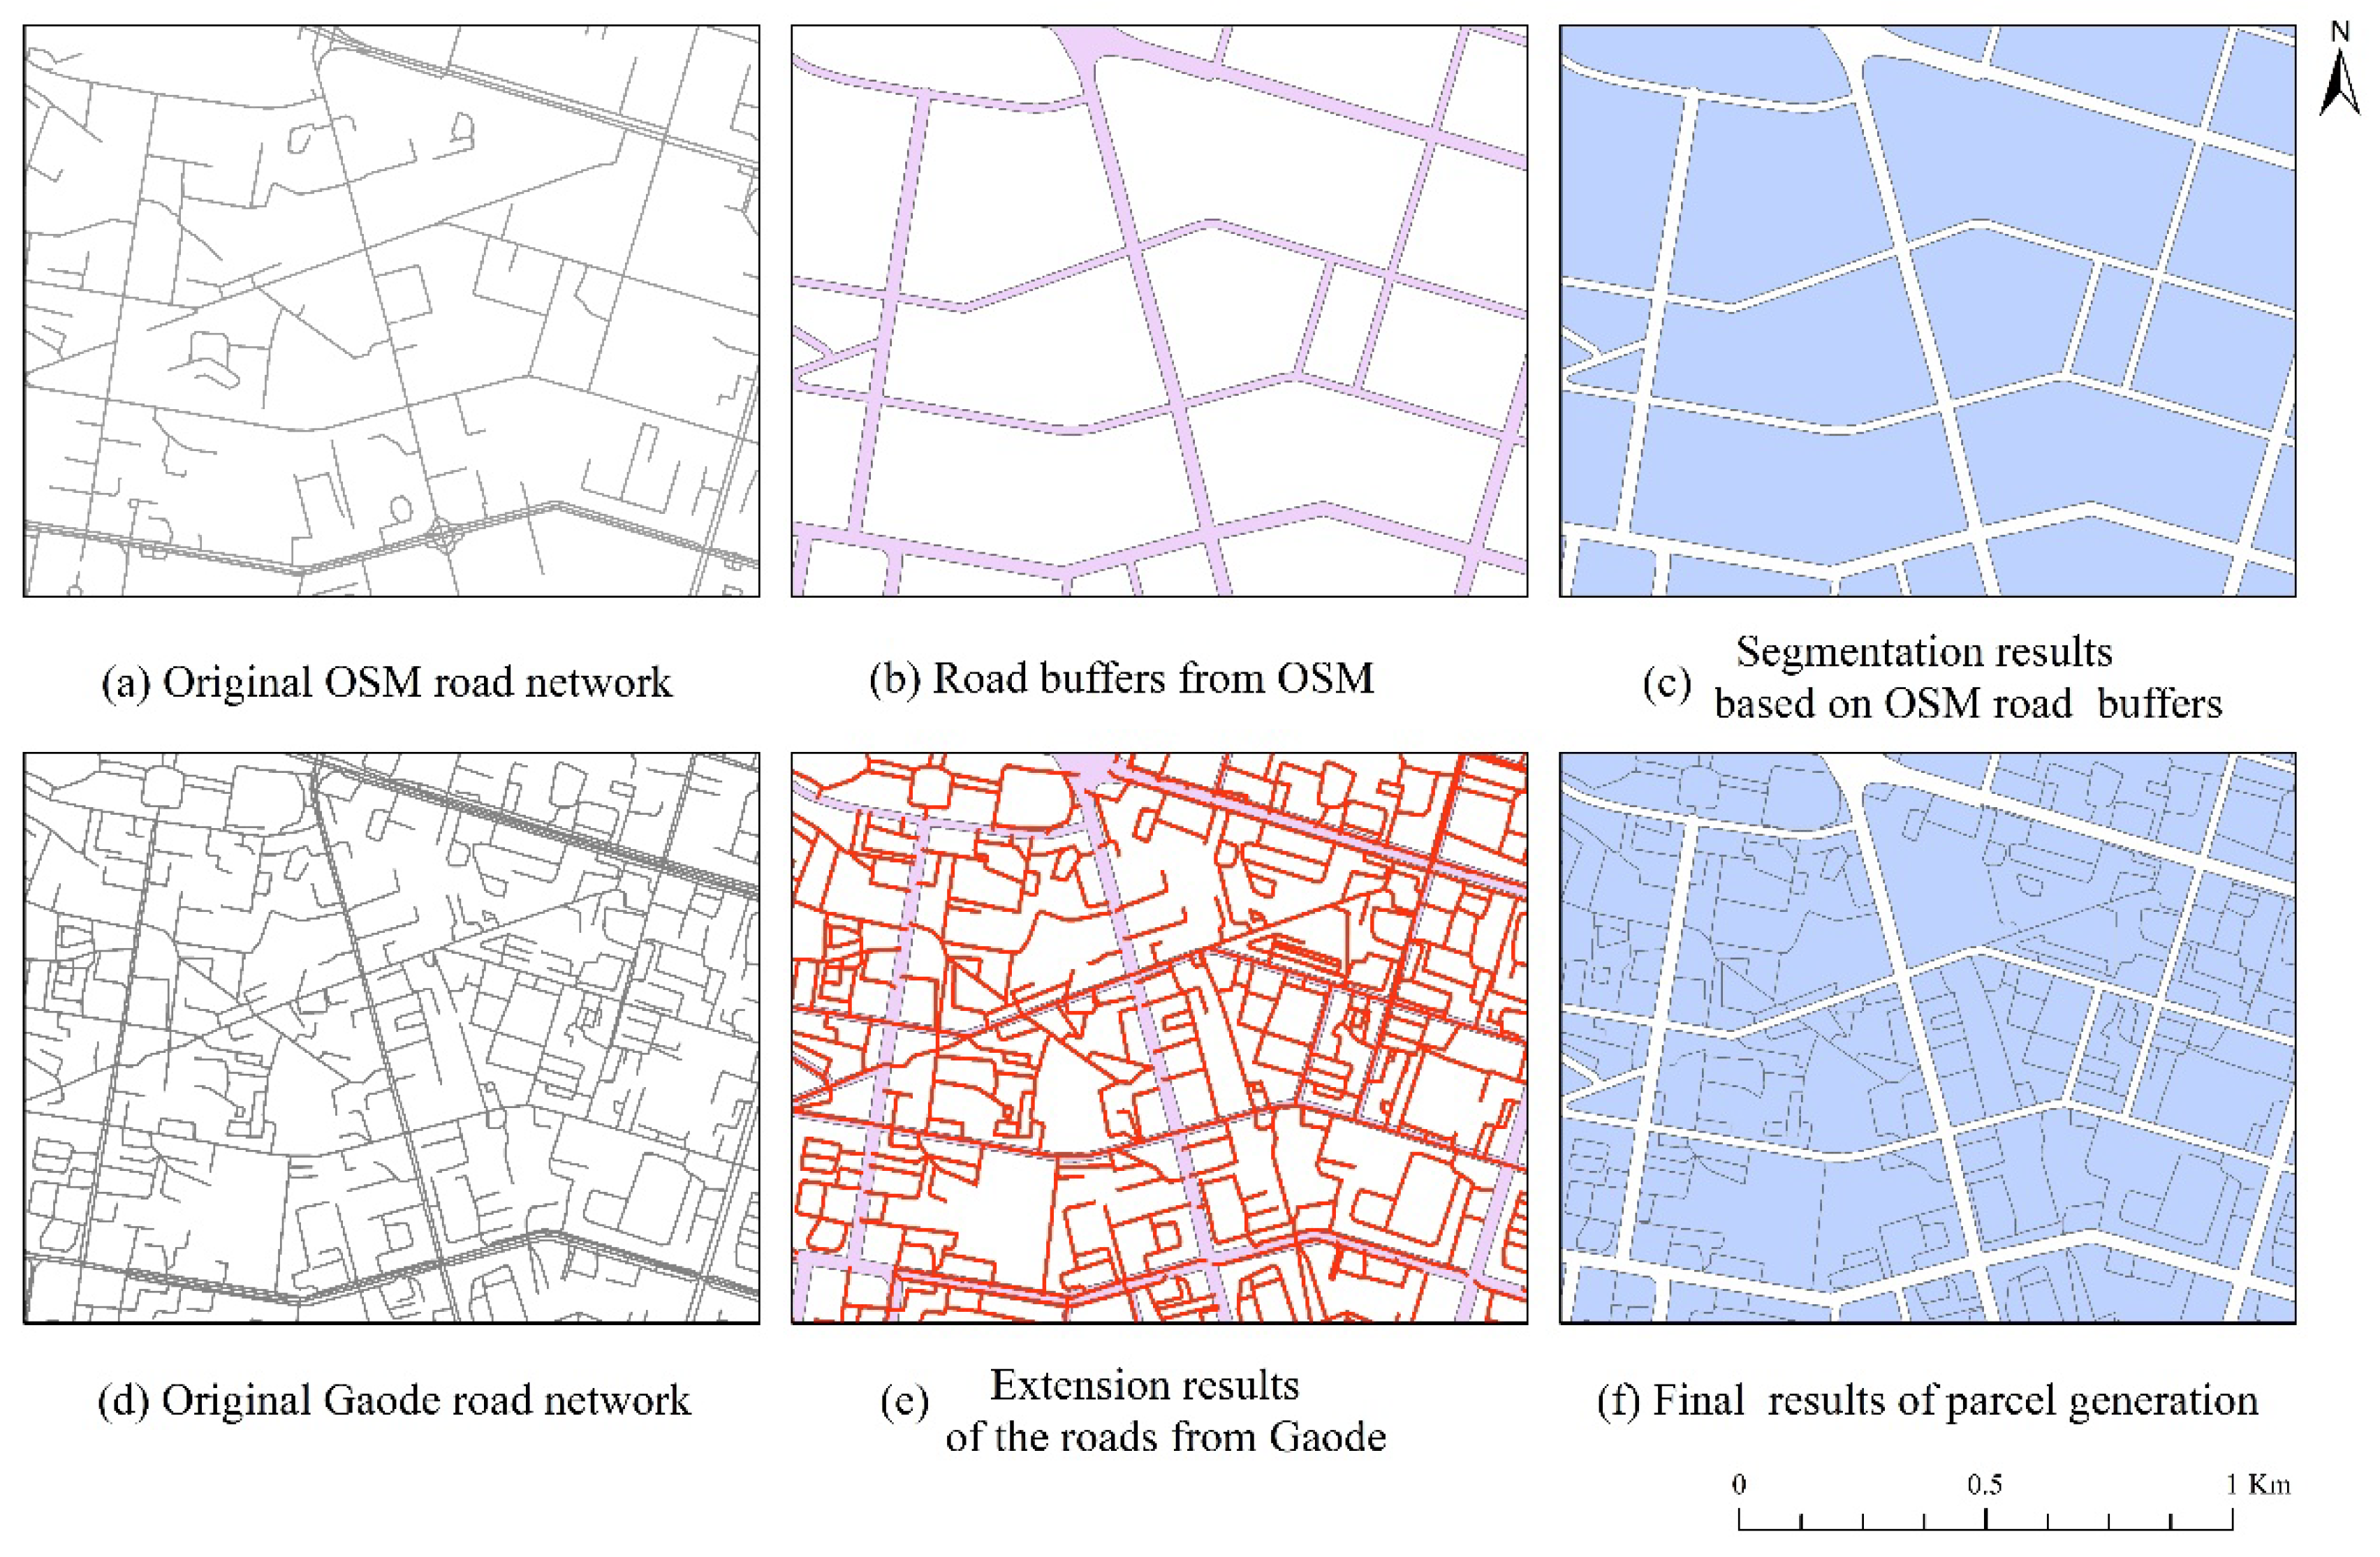
Gaode road network data was used as a supplement to generate parcels based on the OSM data. Original OSM and Gaode road network data are shown in Figure 3a,d, respectively. After preprocessing operations including simplification, merging and geometric correction on the road network data, the segmentation processes in the study were carried out as follows. First, we conducted width sampling on roads of different levels according to the attribute of the OSM road data. The road buffers were built based on the sampling results, in which the width of railway, motorway, primary, secondary and tertiary road are set to 7.8 m, 25 m, 48 m, 28 m and 18 m, respectively (Figure 3b). Second, the buffered roads were used to split the boundary of the main city into independent street blocks (Figure 3c). Third, we used levelThreeRoad, levelFourRoad, and roadsBeingBuilt in the Gaode Road Network (Figure 3e) to divide the street blocks. The independent roads with the distance of less than 10 m from the adjacent roads at both ends were extended to allow them to connect adjacent roads. To remove debris parcels, we merged parcels with an area of less than 1000 square meters with adjacent parcels, and the results of the parcels are shown in Figure 3f.
3.2. Feature Extraction
The features of parcels used in this study include spectral, texture, backscatter, nighttime lights, POI, and temporal population density features (Table 2). Spectral features were calculated based on the bands of Sentinel-2A and typical spectral indices, including the normalized vegetation index (NDVI), the normalized water index (NDWI), the normalized built-up index (NDBI). Texture features were calculated by the Grey Level Concurrence Matrix (GLCM), including the mean, standard deviation, homogeneity, contrast, heterogeneity, entropy. Backscatter and nighttime light features were calculated based on Sentinel-1A and Luojia-1 images. For time-series population density features, the population density at different periods within each parcel was extracted base on Easygo data. POI features consisted of the total number of all POIs, total number, and proportion of each type of POIs within each parcel.
3.3. Feature Reduction
To eliminate the interference of redundant features on the classification accuracy as much as possible, and to obtain the feature variables with strong intra-class aggregation and high-class separability, the ReliefF algorithm was used to reduce the dimension of the extracted features. The main idea of the ReliefF algorithm is as follows: given a training data set D, a sample x is randomly selected from it, and the k nearest neighbor samples H (x) and M (x) from the sample set of the same and heterogeneous samples are randomly selected [34]. The sum of the distance between the sample x and the k nearest neighbor samples H (x) and M (x) are calculated respectively, and the feature weights are updated according to the distance. After multiple iterations, the final weight of each feature is obtained. The formula (1) presents the weight update of the ReliefF.
where represents the distance between different samples of feature ; and represent the nearest neighbor samples of the same kind and heterogeneity with sample ; represents the class probability; is the number of iterations; is the number of nearest neighbor samples; and is the randomly selected samples.
According to the feature weights calculated by ReliefF algorithm, the feature variables were added to the RF in order, and the feature subset with the highest accuracy was selected as the final specific features.
3.4. Model Building
3.4.1. Random Forest Model
The RF is a new machine-learning algorithm based on the integration of multiple Classification and Regression Tree (CART) decision trees, which is proposed by Leo Breiman and Adele Cutler [35]. The RF algorithm extracts samples from the original training set randomly, using the bagging method, to construct multiple independently growing and distributed decision trees; in the growth process of each tree, a certain number of features are randomly selected from all the features for nodes dividing; finally, the classification results of each tree are counted by voting, and the category with the most votes is the final result. The main parameters that affect performance of the RF are the number of decision trees and the size of the features [36]. The grid search method based on the out-of-bag (OOB) error value was used for parameter optimization in this study. The algorithm was implemented using scikit-learn, a python-based data analysis toolkit. According to the classification results, the confusion matrix was calculated to obtain the overall accuracy and kappa coefficient.
3.4.2. Classification Based on Different Feature Combination
To evaluate the impact of different types of features on the urban land use classification, ten sets of experiments were designed based on different combinations of features. Table 3 represents the summary of classification experiments based on different feature combinations.
3.4.3. Samples for Training and Validation
According to the specified classification system, the preliminary selection and discrimination of parcels were made based on Google Maps, and then sampling points were arranged for field sampling. Based on the field survey results, the land use types and proportions were revised. In this study, a total of 11,536 parcels was generated, and 580 parcels with a purity of more than 95% were selected as samples. In these samples, 70% were used as training samples, while the rest were used for testing. Additionally, a total of 400 parcels were selected randomly for validation. The numbers of each type of parcels in the validation samples were determined by its proportion in the classification results.
4. Results
4.1. Feature Selection Result
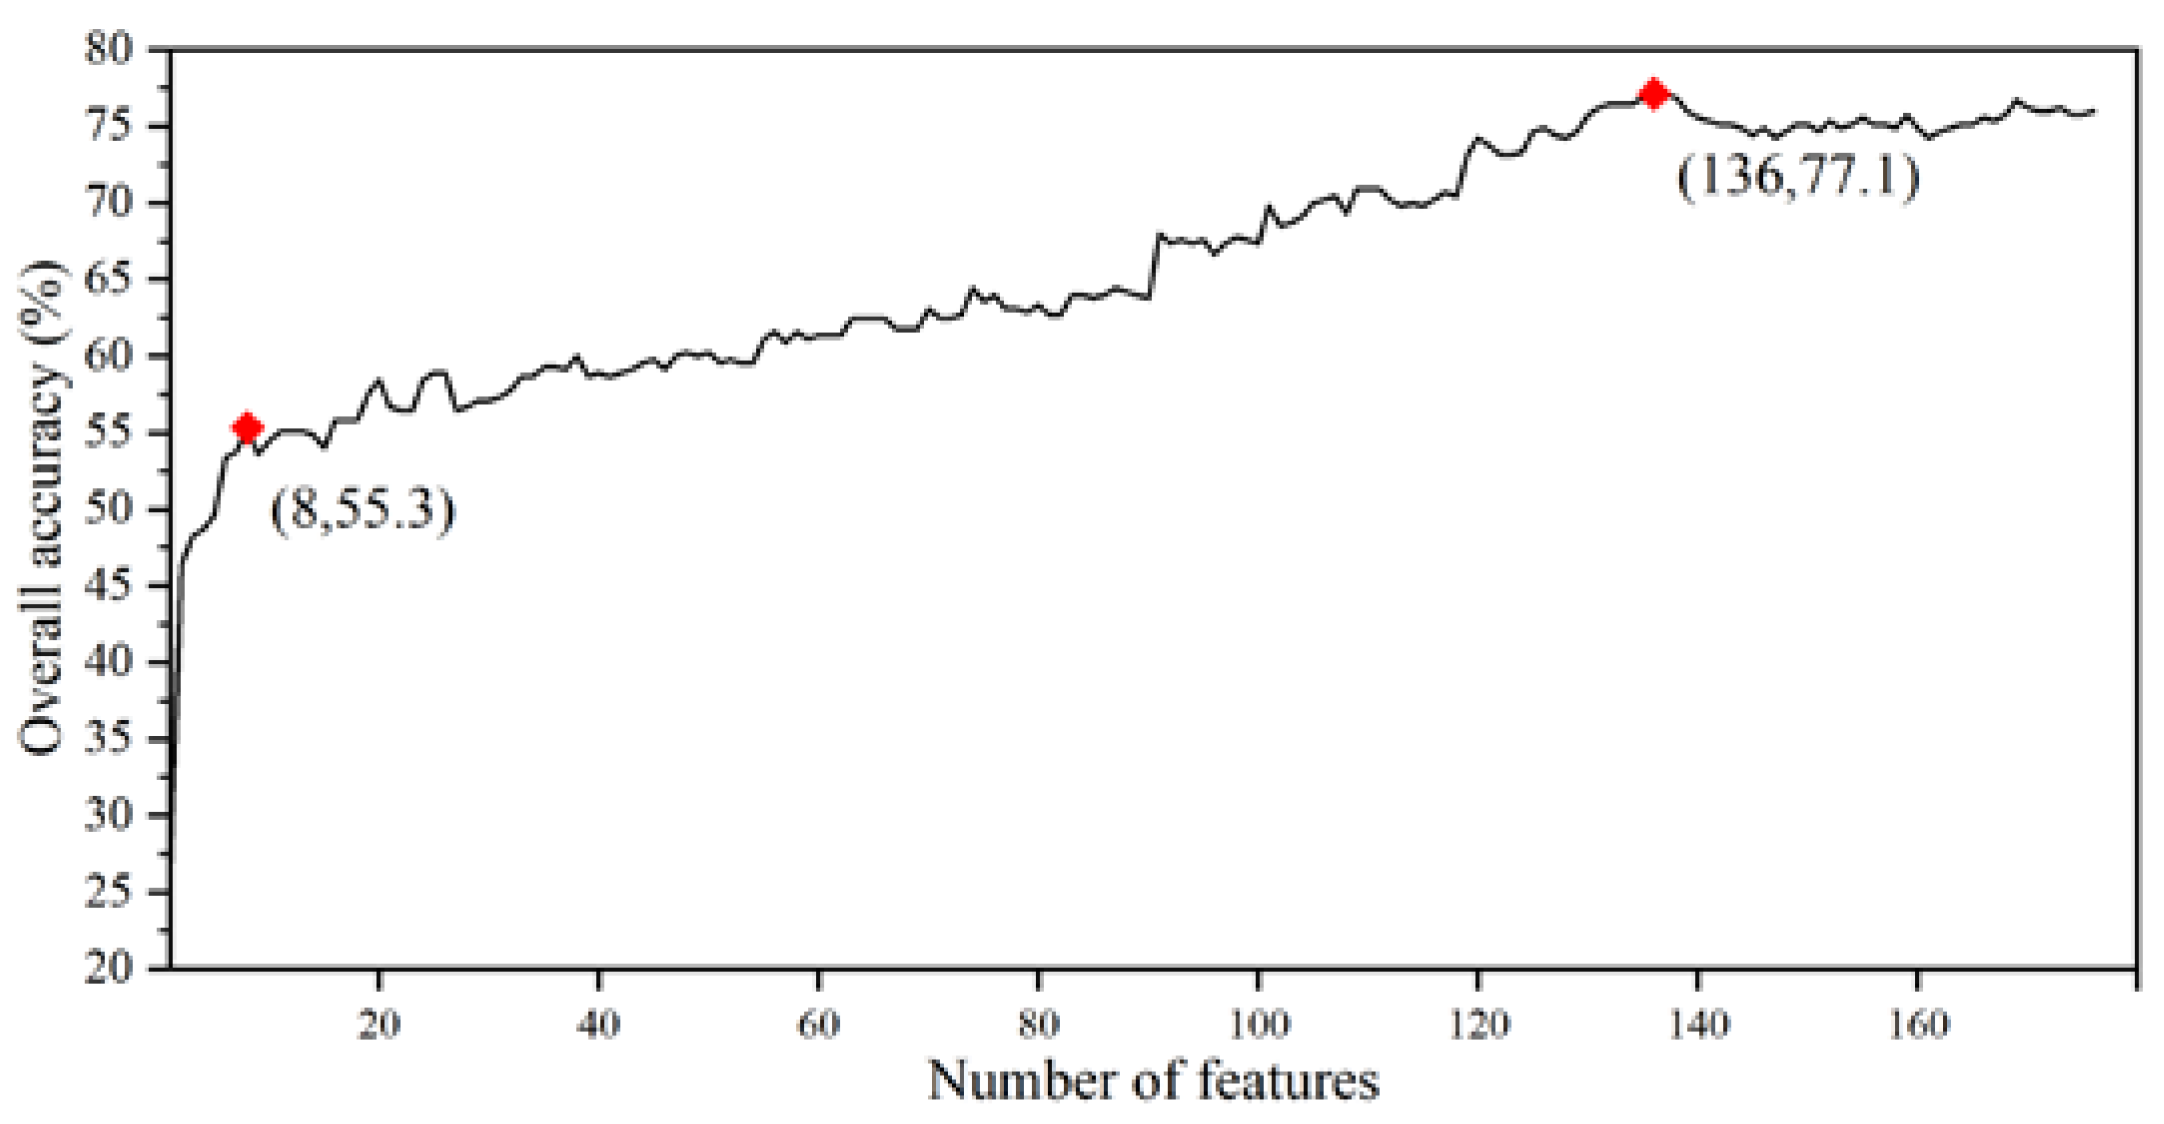
The overall accuracy (OA) of classification results with different numbers of features for the Level II category are showed in Figure 4. It can be seen that when the number of features involved in classification process is less than eight, the accuracy increased rapidly as the number of features increased; when the number of features is between 8 and 136, the rate of growth of accuracy slowed markedly; when it exceeded 136, there was no significant change in classification accuracy. Obviously, the overall accuracy was the largest (77.1%) when the number of feature variables was 136.
Therefore, a total number of 136 features was selected in this study, which consist of nine spectral features (mean values of blue, green, NIR, SWIR1, SWIR2, NDVI, NDWI and standard deviation of SWIR1 and SWIR2,), 16 texture features (entropy of blue, green, red, NIR, SWIR1 and SWIR2; autocorrelation of blue, green, red, SWIR1 and SWIR2; contrast of green, red, NIR, SWIR1 and SWIR2), three backscatter features (sum and mean of VV and mean of VH), 18 POI feature variables, six nighttime light features and 84 time-series population density features.
4.2. Classification Results
4.2.1. Classification Results Based on Multi-Source Features Using RF Model
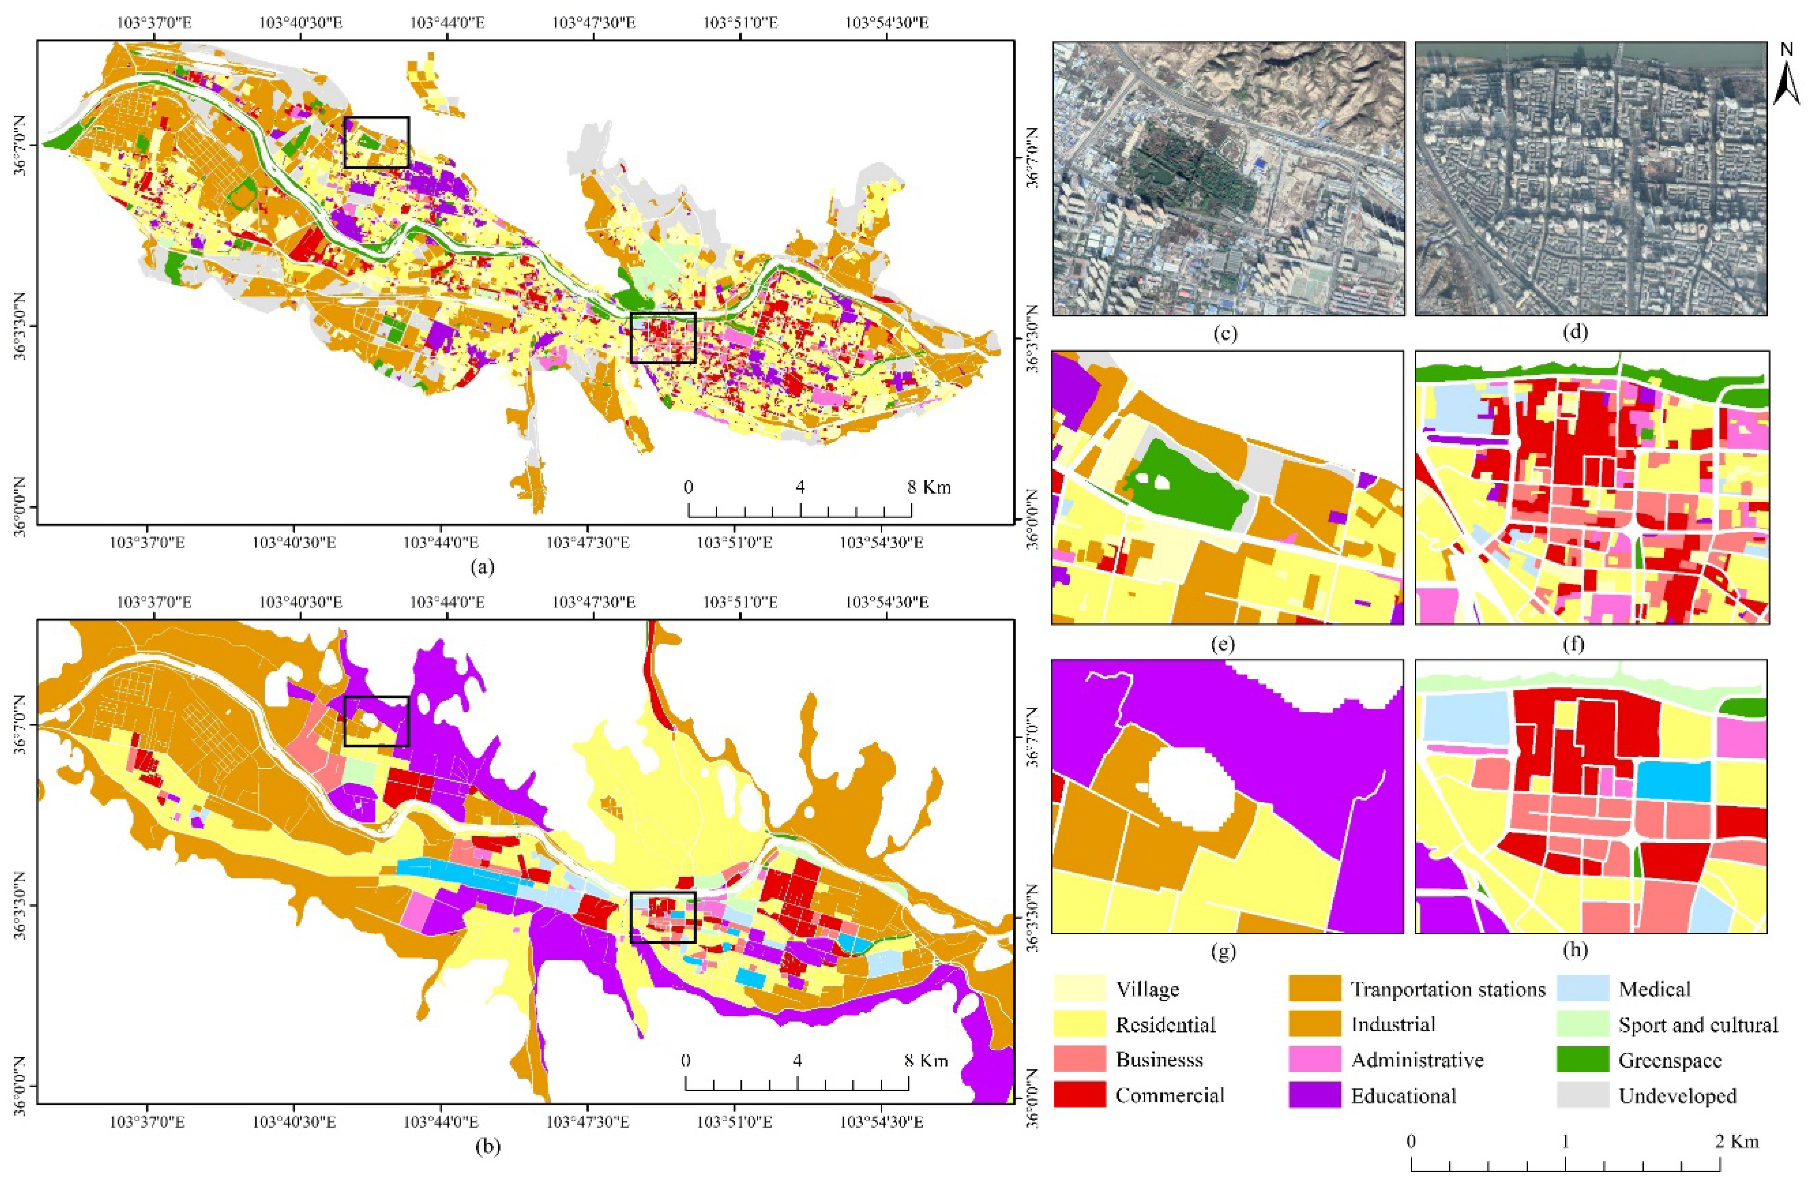
The pattern and distribution of urban land use based on optimized multi-source features for Level II category are shown in Figure 5a. Compared with the Lanzhou City Master Plan (2011–2020) [37] via visual interpretation, it was found that the overall consistency in spatial distribution was high. The confusion matrix was used to evaluate the accuracy of the classification results for the Level I category (Table 4). Accordingly, the OA and kappa coefficient for the four level I classes were 83.75% and 0.77, respectively, and the classification accuracies were overall higher than 70%. Residential area had the highest accuracy, with user accuracy and producer accuracy of 93.17% and 84.27%, respectively, while industrial and public areas had low accuracy relatively, and the confusion with other land types was serious.
4.2.2. Comparison with EULUC Results
Due to the inconsistency between the classification system and the sample, the difference between the classification results obtained in this paper and the results of EULUC [24] cannot be directly compared numerically. Therefore, the classification results were compared with the mapping results of EULUC in Lanzhou from the distribution of urban land use. Overall, both our work (Figure 5a) and the EULUC (Figure 5b) were similar in spatial distribution. However, the large parcels of EULUC had resulted in large areas of continuous urban land being classified into the same type (Figure 5g). The mapping results were relatively coarse, especially in the suburbs, where the mixed degree of land use is high, had high misclassification. In contrast, the results of the study were more elaborate. For example, land types with a relatively small internal area (such as commercial office land, which often exists in the form of individual buildings) can be better distinguished (Figure 5f). Therefore, combining the OSM and the Gaode road network could divide the land more finely, effectively improving the classification effect, to better express the detailed information of land use within the city.
4.3. Feature Importance Analysis
4.3.1. Comparison of Classification Accuracy of Different Feature Combinations
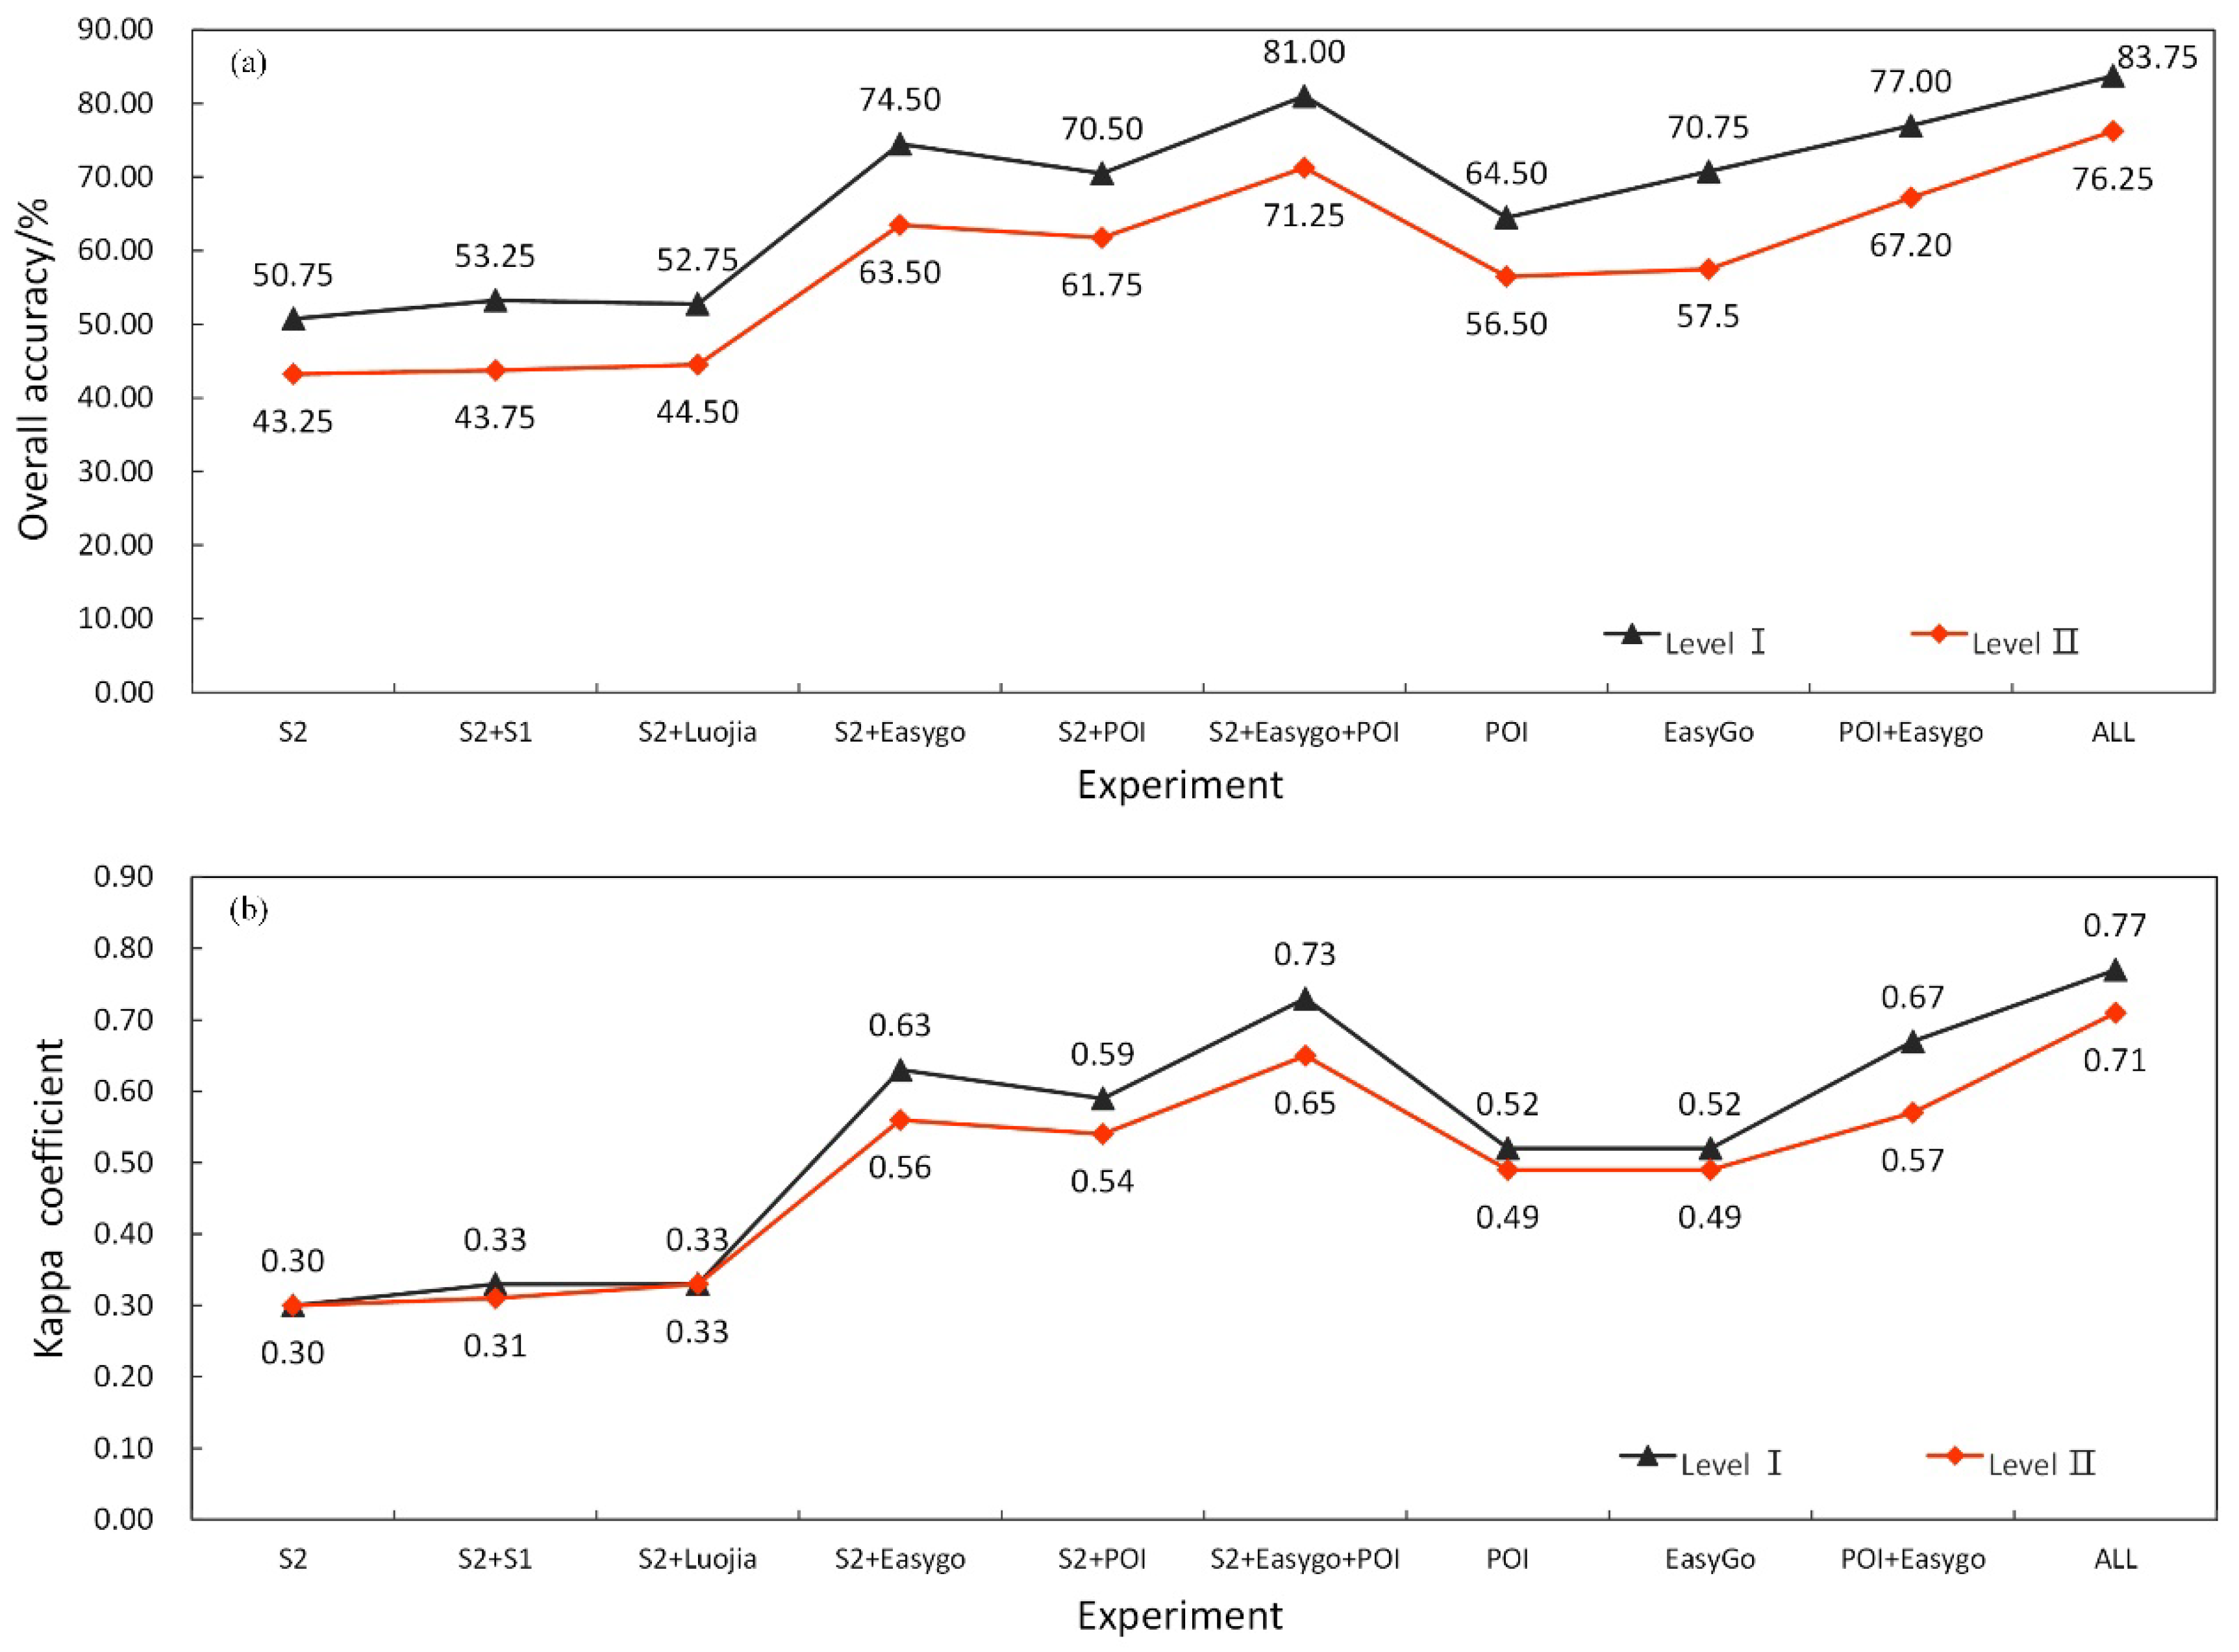
Figure 6 illustrates the comparisons of the OA and kappa coefficients of different combinations of features for level I and level II categories. Comprehensive utilization of all features (experiment ALL) had the highest classification accuracy, with an OA of 83.75% and a kappa coefficient of 0.77, for level I categories, 76.25 and 0.71 for level II. When only using spectral and texture features, the accuracy was the lowest, with overall accuracies of 50.75% and 43.25% for level I and level II categories, respectively. Based on spectral and texture features, the addition of backscatter features, POI features, population density features and other types of features could improve the accuracy at different degree (Figure 6a,b). Experiments S2 + S1 and S2 + Luojia added backscatter and nighttime light features, respectively, both could both improve the accuracy slightly, but the urban land use classification accuracy was still less than 60%. In contrast, experiments S2 + Easygo and S2 + POI added time-series population density and POI features, which improved the classification accuracy effectively. Compared with S2, the overall accuracies of improved by 23.75% and 19.75% for level I categories, for level II, 20.25% and 18.5%, respectively. What deserves to be mentioned is that, both POI and temporal population density features further improved classification accuracy compared with adding temporal population density (or POI) features alone.
Although both POI and time-series population density features could effectively improve the classification accuracy, using either alone or both cannot meet the accuracy requirements. When only using POI or time-series population density features, the classification accuracy for level II were less than 60% (Figure 6a). Only using POI and time-series population density features for classification, the overall accuracy and kappa coefficient for level I categories were 77% and 0.67, but for level II were only 67.2 and 0.57, respectively. Compared with ALL, the OA decreased by 6.75% for level I categories and 9.5% for level II, respectively, while the kappa coefficient decreased by 0.1 for level I and 0.14 for level II, respectively. It was shown that the remote sensing features were indispensable for the improvement of accuracy in urban land use classification.
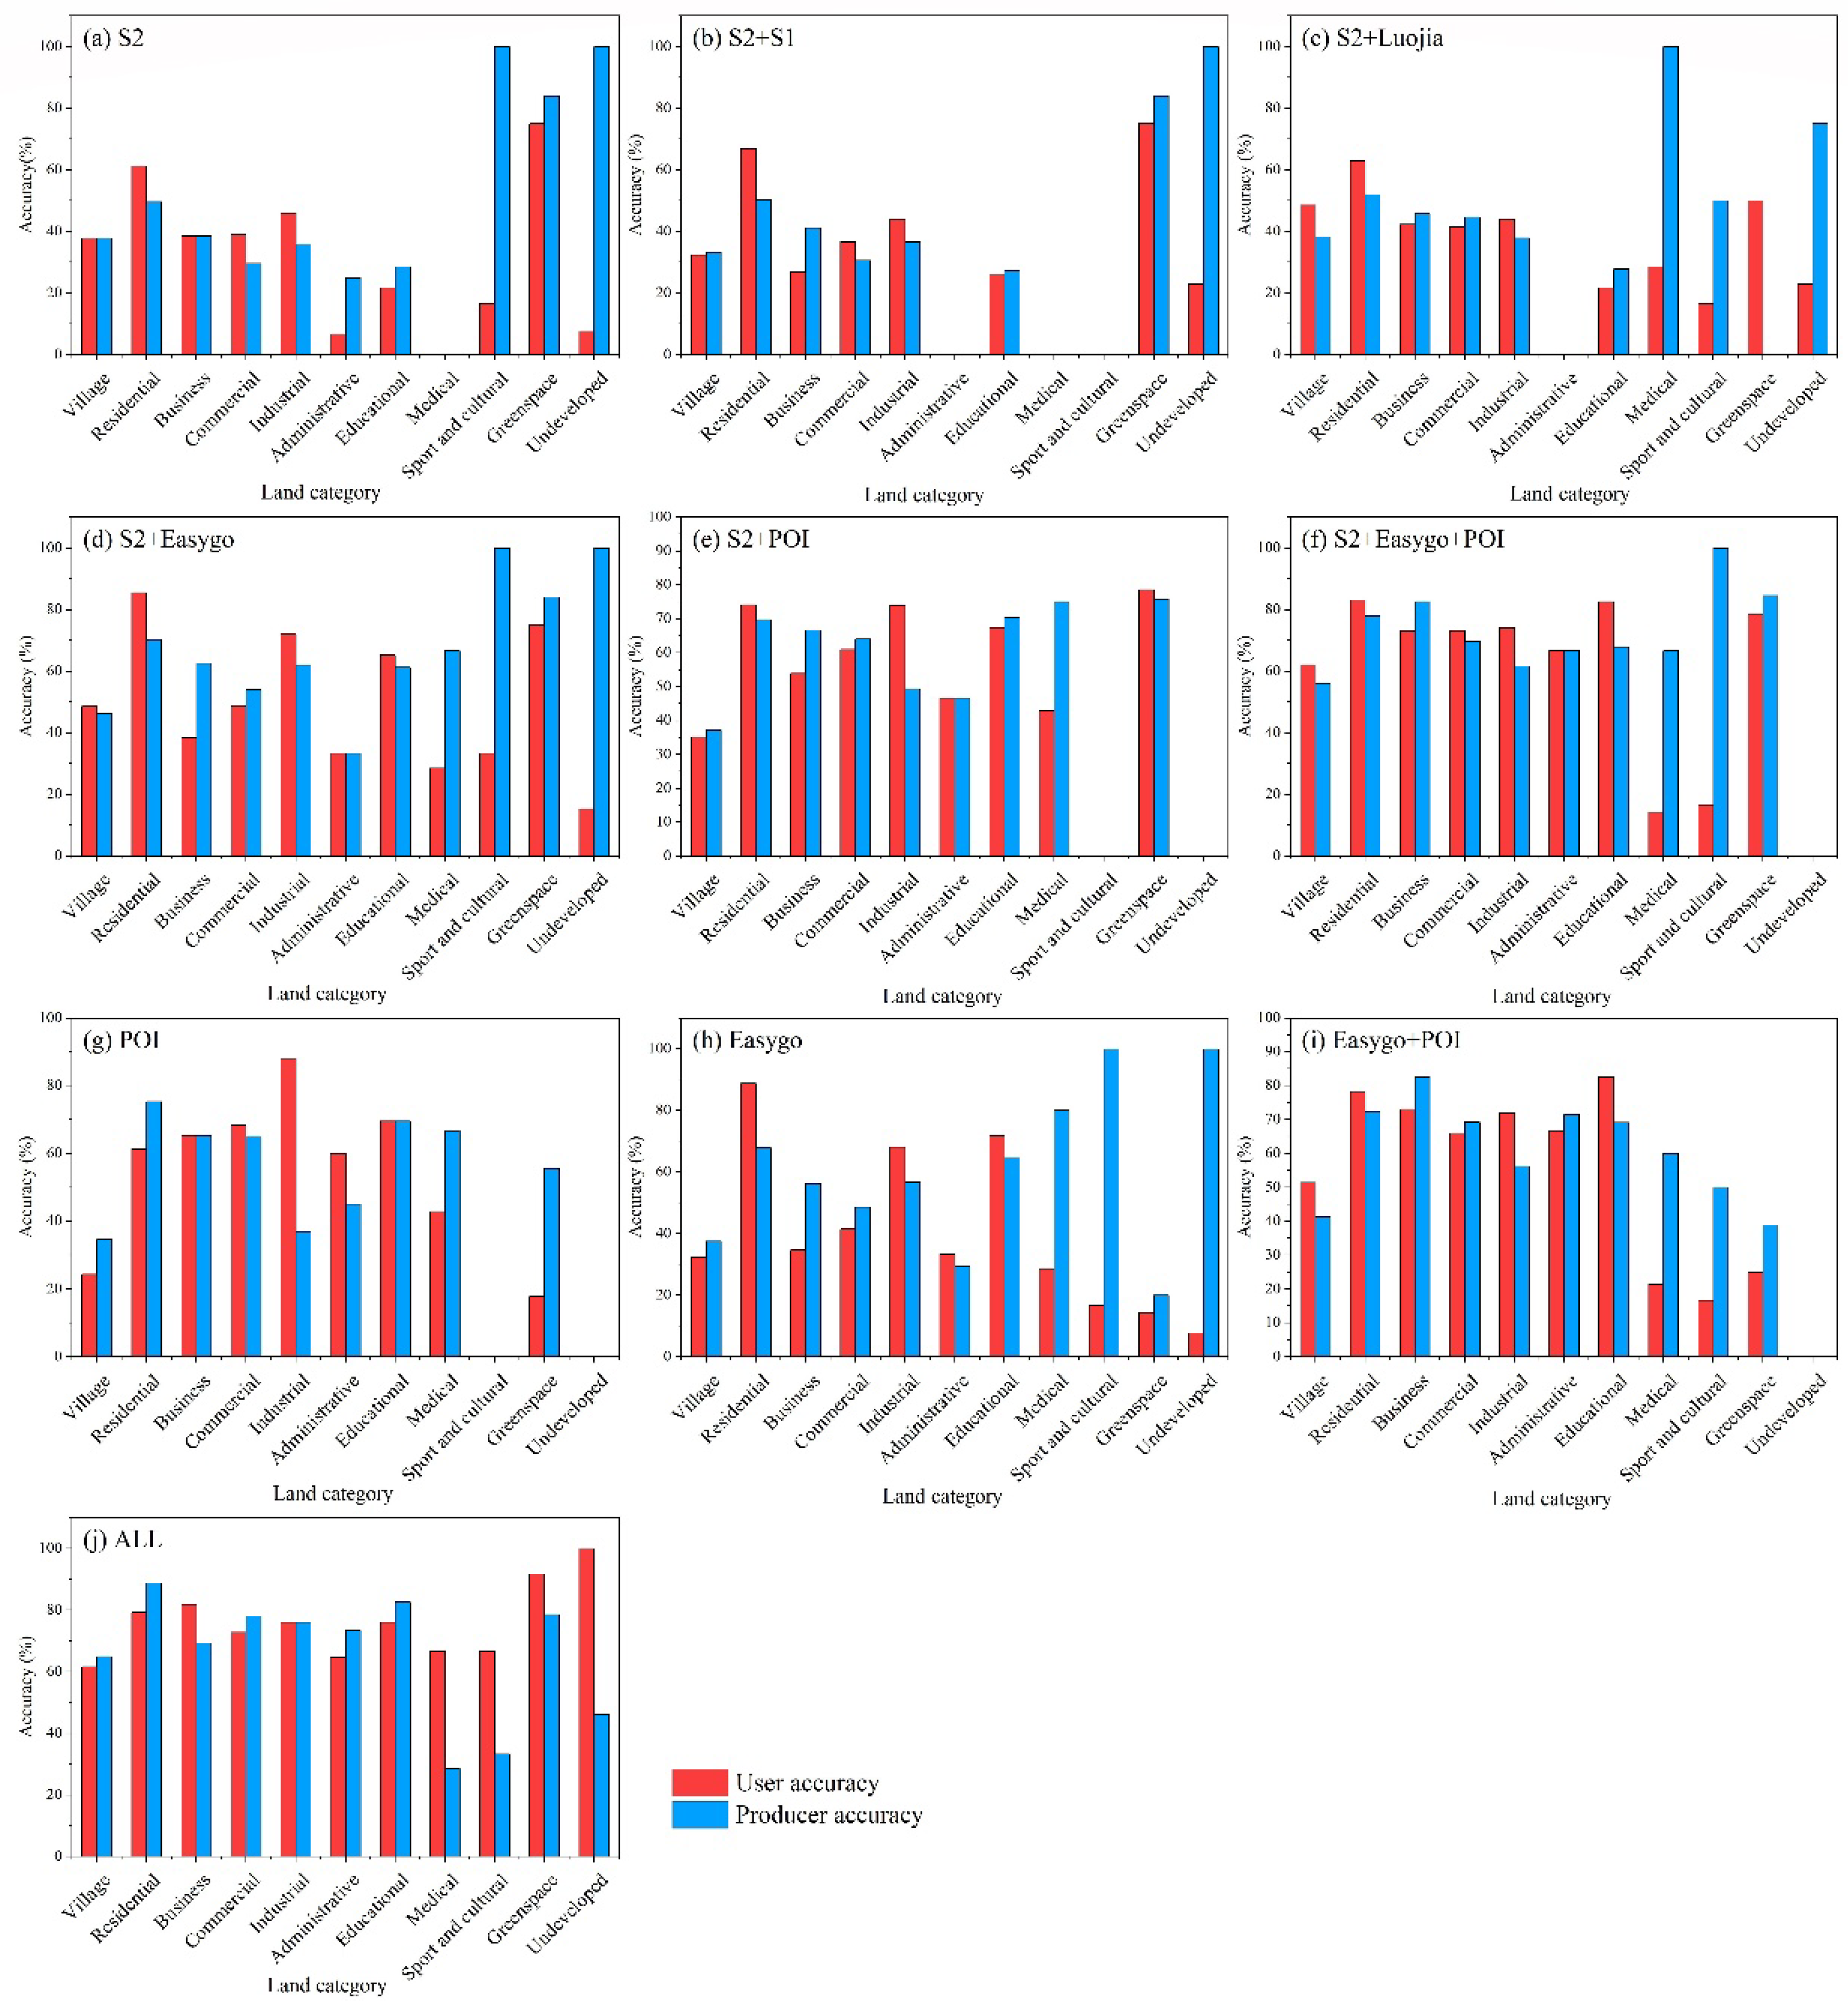
Figure 7 represents UA and PA of different land use classes based on different feature combinations for level II categories (the detailed numerical results of classification accuracy are shown in Table A1). Analyzing from the classification accuracy of a single land use class for level II, there were different effects of various features on urban land use types. In experiment S2, only using the spectral and texture feature classification, the UA and PA of the greenspace were the highest, at 75% and 84% (see in Table A1), respectively. Meanwhile, the addition of other features was not obvious for the improvement of its accuracy, indicating that the classification of greenspace mainly depended on the spectral and texture features. Compared with S2, the accuracy of the urban residential and educational lands in experiment S2 + S1 were improved slightly, indicating that the backscatter features could improve the classification of the urban residential land and educational land, but the degree of improvement was limited. Experiment S2 + Luojia showed that the nighttime light features could improve the UA of the land use classes with strong social and economic activities, such as village, business, commercial lands, etc. When only using remote sensing features (Figure 7a–c), administrative, educational, medical, sport and cultural lands had low accuracies extremely, which indicated that their classification mainly depended on the characteristics of time-series population density and POI features.
Based on spectral and texture features, the addition of Internet features such as POI, time-series population density, or their combination could effectively improve the accuracy of almost all types of land (Figure 7d,e). When only using POI or time-series population density features, some land types, such as industrial, educational, and commercial land can achieve higher accuracy, but the classification accuracy of most land types was lower. In contrast, experiment ALL (Figure 7k) integrating all the features have significantly improved the accuracy of all land types, especially village, greenspace and undeveloped.
Using the remote sensing features or Internet data features alone to classify urban land use types had relatively low accuracy, but when all features were used, the accuracy of urban land use classification was the highest, indicating that the synthesis of multi-source features was conducive to the improvement of classification results. Different types of features can improve the classification accuracy to varying degrees. Remote sensing features such as spectral, texture, backscatter and night light information could improve the classification accuracy of some land categories, while POI features and temporal population density features could improve accuracy of all classes significantly.
4.3.2. Importance of Different Features
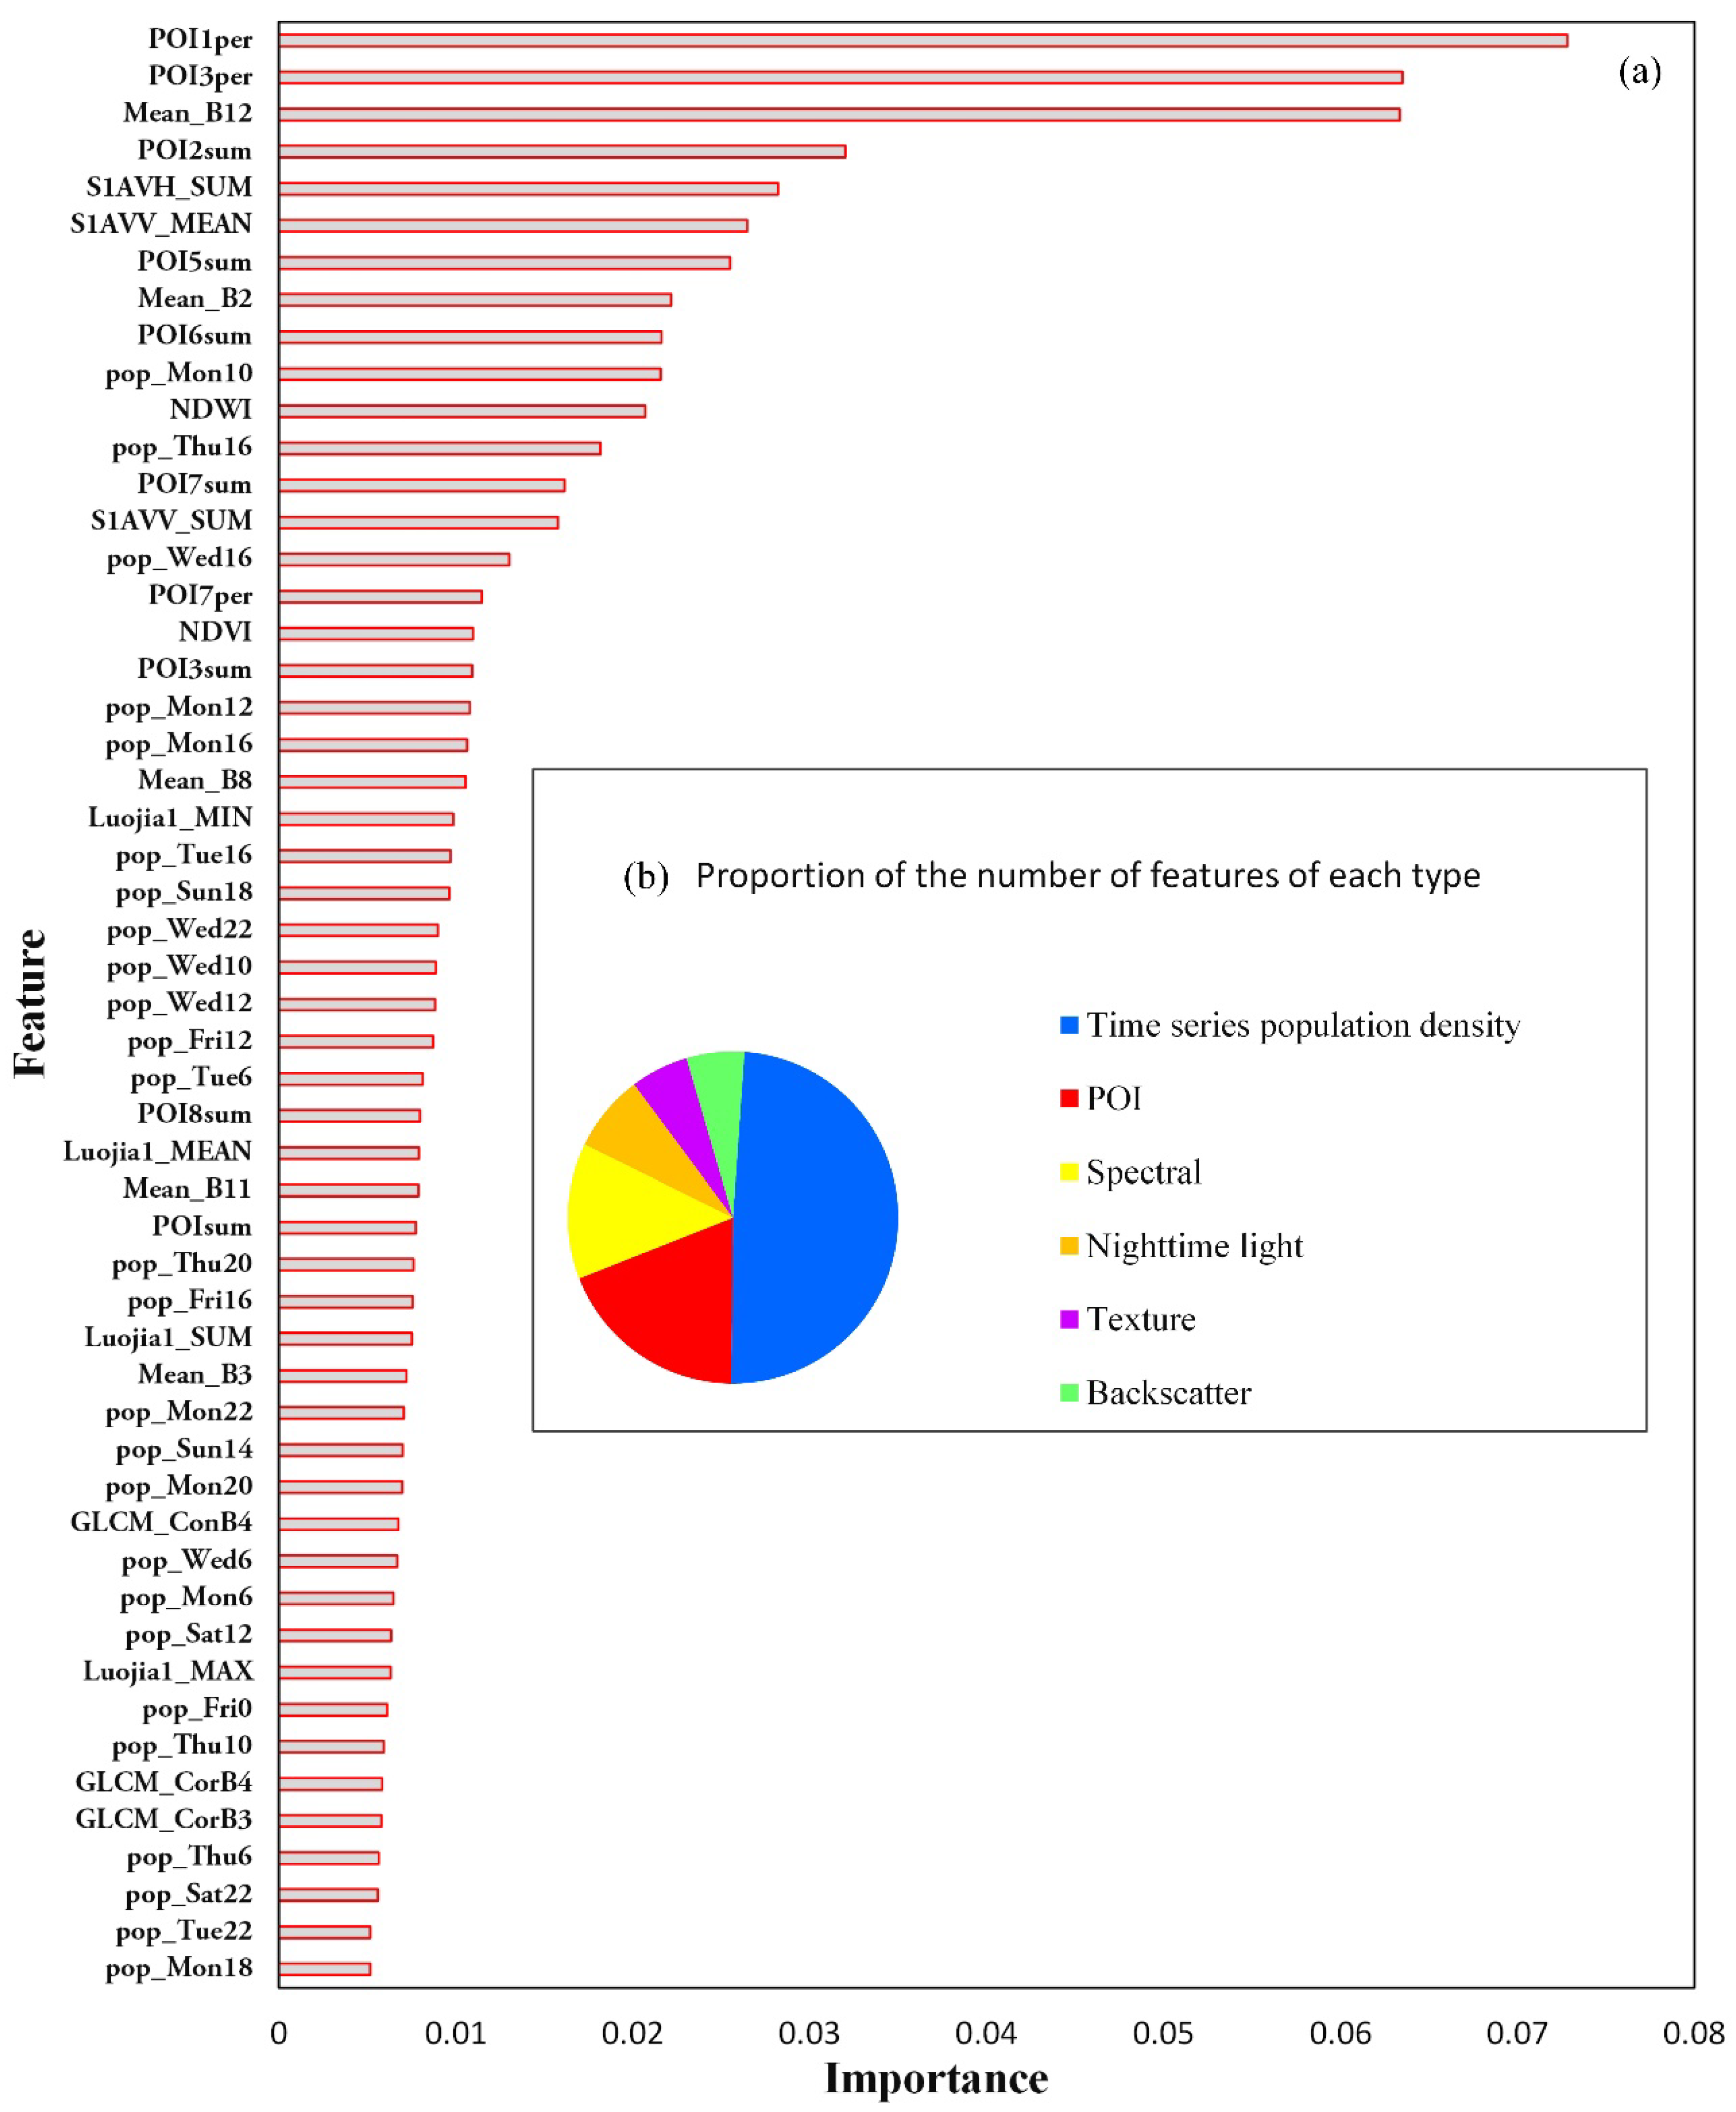
Mean impurity decrease derived in RF was used to calculate the importance of each feature in the optimized feature subset. Given the large number of features, the features with importance greater than 0.005 (Figure A1) were selected for analysis.
The characteristics of time-series population density and POI played important roles in urban land use classification, and other types of features contributed less to the classification results. Among the features of POI, a different type of POIs had significant differences in feature importance. POI1per (proportion of residential of POIs), POI3per (proportion of commercial of POIs) had the most significant contribution to land use classification. At the same time, the features of types with fewer POIs, such as POI8sum (the total number of sport and culture of POIs), were relatively less important. Compared with POI features, population density features accounted for a large proportion, but the importance of population density features at a single moment was generally low. It was shown that the population distribution information at a single moment had little effect on the urban land use classification, while the multi-time population distribution contributed a lot to the urban land use classification. People’s travel characteristics and agglomeration laws could reflect the social functional attributes of the parcel to a certain extent, and it also illustrated from the side that the RF model could mine the dynamic characters of data.
5. Discussion
This study combined the two road network data of Gaode and OSM to divide the parcels as the basic mapping units, extracted the multi-source feature information such as spectral, texture, POI, and on this basis, constructed a model for detailed mapping of regional urban land use. Our approach demonstrates the potential of utilization of OSM and Gaode road network for parcel segmentation. Compared with methods that focus on national mapping [20,24], the mapping results in this study represents more details in urban land use. For regional mapping and analysis, some studies have introduced image segmentation to address the issue of mixed land use within the parcels generated by the OSM road network, and have yielded good classification results [25]. In contrast, the parcels extracted by Gaode road in our study may be more regular and suitable for mapping habits of people in urban areas. In addition, dynamic population distribution was utilized to random forest for urban land use mapping, which improved the classification accuracy significantly compared with static distribution.
Our findings are consistent with the standpoints in previous studies that the integration of multi-source data consisting of remote sensing and Internet data could provide more comprehensive information of urban land use [38,39]. The preferred feature set takes advantage of multi-source information to maximize the useful information, and its classification accuracy is higher than other feature combinations or a single feature. However, the contribution of different features for urban land use classification diversified greatly. POI and Easygo data contribute the most to classification in our results. Land use information describes that how human use land [40], which focus on the functional characteristics in urban areas. The characteristics could be represented by both POI and Easygo data. Due to its type information, POI can often reflect the categories of parcels directly. Moreover, the spatiotemporal dynamic patterns of population density in the Easygo data could represent the functional characteristics of urban land indirectly. For example, on weekdays, people gather from the residential to the business land in the morning, and return to the residential at night [17]. On the other hand, despite the relatively small contribution of remote sensing features (i.e., spectral, texture and backscatter), they are important to the improvement of some urban land use type identification. For example, NDVI could help classify the greenspace, nighttime light is beneficial for the categories where human have strong social and economic activities like commercial and business lands.
Although our method has achieved good classification results in main city of Lanzhou, some limitations should be considered. The first limitation relates to the mixing degree of land use within the parcel. As suggested by Grippa et al. [22], it is difficult to make all the parcels to be homogeneous in terms of land use. In fact, actual land use is often a mix. Rapidly growing cities tend to expand in three-dimension like increasing building height to improving land use efficiency, accompanied by more and more phenomena of three-dimensional land use [41]. For example, some buildings are commercial on the lower floors and business on the upper floors. Moreover, the boundaries of some parcels may not be roads, but fences, or there may be no obvious boundaries. Although these parcels are few in quantity in the study area, they still may decline the accuracy of mapping results. In this study, the overall accuracy of urban land use is high, but the user accuracies of sport and cultural lands and medical lands in public are low, are 33.33% and 28.57% for level Ⅱ category, respectively. These lands are often mixed with residential land, and there are many types of land in the same parcel. It is difficult to use the road network to divide them accurately, causing some interference to the classification. The second limitation is linked to the imbalanced distribution of data, which is not only reflected in the imbalance of the type of data itself, but also in the spatial distribution. We have found that POI and Easygo data contribute the most to the classification in this study. However, a lack of these data in some lands, such as suburbs or undeveloped areas, which is the one of the reasons why the accuracy of some categories (e.g., undeveloped land) are low. Moreover, there are imbalanced POIs size in different categories. For instance, the number of commercial and residential types of POIs are generally higher than that of industrial.
Further effort should be made to improve the mapping results. As for the mix degree of land, the process of parcel segmentation could be optimized. When reducing the mix of parcels, the integrity of the parcel should be considered. A hierarchical classification that different segmentation strategies could be used in terms of the characteristics of different lands could be considered. For example, objects that are subjectively inseparable but have finer roads inside, such as universities and large communities, can be identified, and then, small objects could be segmented by finer roads and classified. In addition, for some lands with three-dimensional land use, a parcel may be labeled with multiple categories. As for imbalanced distribution of data, a possible strategy is giving weight to different POI categories to removes the effects of the imbalance. In addition, for areas lack of POI or Easygo data, higher resolution images [10] and other social media data, such as mobile phone signals [12], could be supplemented for classification.
6. Conclusions
Given the current issues in urban land use classification, on the basis of road network segmentation of urban areas, comprehensive utilization of spectral, texture, backscatter, nighttime light, POI and time-series population density information, the fine extraction of urban land use information was achieved in the main urban area of Lanzhou City. The conclusions are summarized as follows.
- (1)
- The random forest classifier conducted on multi-source data achieves good classification results. Specifically, for level I categories, the overall accuracy is as high as 83.75%, the kappa coefficient is 0.77, for level II, the accuracy of each type reaches more than 70%. Compared with the results of EULUC, the results in this study represent more details of urban land use.
- (2)
- The combination of multi-source features of remote sensing and Internet data is conducive to the improvement of urban land use classification effects. POI features and temporal population density features could improve the accuracy of all classes significantly; remote sensing features could improve the classification accuracy of some land categories.
- (3)
- POI and time-series population density features contribute the most to urban land use classification, followed by spectral features, while night lighting features and backscatter features have the fewest contributions. Compared single-moment population information, the multi-time population has more contributions for urban land use. Remote sensing data is indispensable for the improvement of urban land use classification, although its contribution relatively little compared with other features.
Author Contributions
Conceptualization, L.Z.; methodology, L.Z.; software, L.Z.; validation, L.Z. and S.H.; formal analysis, L.Z. and S.H.; investigation, L.Z. and S.H.; resources, L.Z. and Y.X.; data curation, L.Z., S.H and J.D.; writing—original draft preparation, L.Z.; writing—review and editing, L.Z., S.H., J.L., Q.B., X.W. and Y.X.; supervision, L.Z. and Y.X.; project administration, L.Z. and Y.X.; funding acquisition, Y.X. and X.W. All authors have read and agreed to the published version of the manuscript.
Funding
This work was funded by the Science and Technology Basic Resource Investigation Program of China [No. 2017FY101003], the National Key Research and Development Program of China [NO. 2018YFA0606404-03], the Strategic Priority Research Program of Chinese Academy of Sciences [NO. XDA2009000001], and the Fundamental Research Funds for the Central Universities [NO. lzujbky-2019-it27, lzujbky-2020-71].
Acknowledgments
The authors would like to thank Peng Gong for his constructive comments, and providing us with the mapping results of EULUC in Lanzhou.
Conflicts of Interest
The authors declare no conflict of interest.
Appendix A

Table A1.
User accuracy and producer accuracy of different land use classes based on different feature combinations (Level II category).
Table A1.
User accuracy and producer accuracy of different land use classes based on different feature combinations (Level II category).
| Urban Land Use Class | S2 | S2+S1 | S2+Luojia | S2+Easygo | S2+POI | S2+Easygo+POI | POI | Easygo | Easygo+POI | ALL |
|---|---|---|---|---|---|---|---|---|---|---|
| UA/PA | UA/PA | UA/PA | UA/PA | UA/PA | UA/PA | UA/PA | UA/PA | UA/PA | UA/PA | |
| Village | 37.84/37.84 | 32.43/33.33 | 48.65/38.3 | 48.65/46.15 | 35.14/37.14 | 62.16/56.1 | 24.32/34.62 | 32.43/37.5 | 51.35/41.3 | 64.86/61.54 |
| Residential | 61.29/49.67 | 66.94/50.3 | 62.90/52.00 | 85.48/70.2 | 74.19/69.7 | 83.06/78.03 | 61.29/75.25 | 88.71/67.9 | 78.23/72.39 | 88.71/79.14 |
| Business | 38.46/38.46 | 26.92/41.18 | 42.31/45.83 | 38.46/62.5 | 53.85/66.67 | 73.08/82.61 | 65.38/65.38 | 34.62/56.25 | 73.08/82.61 | 69.23/81.82 |
| Commercial | 39.02/29.63 | 36.59/30.61 | 41.46/44.74 | 48.78/54.05 | 60.98/64.10 | 73.17/69.77 | 68.29/65.12 | 41.46/48.57 | 65.85/69.23 | 78.05/72.73 |
| Industrial | 46.00/35.94 | 44.00/36.67 | 44.00/37.93 | 72.00/62.07 | 74.00/49.33 | 74.00/61.67 | 88.00/36.97 | 68.00/56.67 | 72.00/56.25 | 76.00/76.00 |
| Administrative | 6.67/25.00 | 0/0 | 0/0 | 33.33/33.33 | 46.67/46.67 | 66.67/66.67 | 60.00/45.00 | 33.33/29.41 | 66.67/71.43 | 73.33/64.71 |
| Educational | 21.74/28.57 | 26.09/27.27 | 21.74/27.78 | 65.22/61.22 | 67.39/70.45 | 82.61/67.86 | 69.57/69.57 | 71.74/64.71 | 82.61/69.09 | 82.61/76.00 |
| Medical | 0/0 | 0/0 | 28.57/100.00 | 28.57/66.67 | 42.86/75.00 | 14.29/66.67 | 42.86/66.67 | 28.57/80.00 | 21.43/60.00 | 28.57/66.67 |
| Sport and cultural | 16.67/100 | 0/0 | 16.67/50.00 | 33.33/100 | 0/0 | 16.67/100.00 | 0/0 | 16.67/100 | 16.67/50.00 | 33.33/66.67 |
| Greenspace | 75.00/84.00 | 75.00/84.00 | 50/.0082.35 | 75/84 | 78.57/75.86 | 78.57/84.62 | 17.86/55.56 | 14.29/20.00 | 25.00/38.89 | 78.57/91.67 |
| Undeveloped | 7.69/100 | 23.08/100 | 23.08/75.00 | 15.38/100 | 0/0 | 0/0 | 0/0 | 7.69/100.00 | 0/0 | 46.10/100.00 |
Figure A1.
Features with importance greater than 0.005. (a) feature importance based on mean impurity decrease; (b) proportion of the number of features of each type. Note: Mean_B3, Mean_B8, Mean_B11, Mean_B12, Mean_B2, NDVI, NDWI represent mean of green, near-infrared, SWIR 1, SWIR 2, blue, normalized vegetation index, normalized water index, respectively; Luojia1_MIN, Luojia1_MAX, Luojia1_SUM represent the maximum, minimum, and sum of night light intensity, respectively; S1AVV_SUM, S1AVV_MEAN and S1AVH_SUM represent the sum and mean VV and the sum of VH respectively; POI1per, POI3per, and POI7per represent the proportion of residential, commercial, and medical of POIs, POI2sum, POI3sum, POI5sum, POI6sum, POI7sum, POI8sum represent the total number of business, commercial, administrative, educational, medical of POIs, respectively; pop_Sat22 represents the population density at 22:00 on Saturday, and so on for other population density features.

References
- Brockmann, D.; Helbing, D. The Hidden Geometry of Complex, Network-Driven Contagion Phenomena. Science 2013, 342, 1337–1342. [Google Scholar] [CrossRef] [PubMed] [Green Version]
- Foley, J.A.; Ramankutty, N.; Brauman, K.A.; Cassidy, E.S.; Gerber, J.S.; Johnston, M.; Mueller, N.D.; O’Connell, C.; Ray, D.K.; West, P.C.; et al. Solutions for a cultivated planet. Nature 2011, 478, 337–342. [Google Scholar] [CrossRef] [PubMed] [Green Version]
- McKinney, M.L. Urbanization, Biodiversity, and Conservation. BioScience 2002, 52, 883–890. [Google Scholar] [CrossRef]
- Kuang, W.; Zhang, S.; Liu, J.; Shao, Q. Methodology for classifying and detecting intra-urban land use change: A case study of Changchun city during the last 100 years. J. Remote Sens. 2010, 14, 351–363. [Google Scholar] [CrossRef]
- Zhao, P. Reading New Code For Classification Of Urban Land Use And Planning Standards of Development Land: Its Application And Prospects. Planners 2012, 28, 10–16. Available online: http://en.cnki.com.cn/Article_en/CJFDTOTAL-GHSI201202004.htm (accessed on 18 April 2020).
- Alabi, T.; Haertel, M.; Chiejile, S. Investigating the Use of High Resolution Multi-spectral Satellite Imagery for Crop Mapping in Nigeria Crop and Landuse Classification using WorldView-3 High Resolution Multispectral Imagery and LANDSAT8 Data. In Proceedings of the 2nd International Conference on Geographical Information Systems Theory, Applications and Management (GISTAM), Rome, Italy, 26–27 April 2016; SciTePress: Setubal, Portugal, 2016; pp. 109–120. [Google Scholar]
- Venkateshwarlu, C.; Rao, K.G.; Prakash, A. Artificial neural networks in the improvement of spatial resolution of thermal infrared data for improved landuse classification. In Proceedings of the 2nd Grss/ISPRS Joint Workshop on Remote Sensing and Data Fusion over Urban Areas, Berlin, Germany, 22–23 May 2003; IEEE: Piscataway, NJ, USA, 2012; pp. 162–166. [Google Scholar]
- Kishore, D.D.; Gopal, R.K.; Prakash, A. Improvement of effective spatial resolution of thermal infrared data for urban landuse classification. In Proceedings of the IEEE/ISPRS Joint Workshop on Remote Sensing and Data Fusion over Urban Areas, Rome, Italy, 8–9 November 2001; IEEE: Piscataway, NJ, USA, 2002; pp. 332–336. [Google Scholar]
- Wu, S.-S.; Qiu, X.; Usery, E.L.; Wang, L. Using Geometrical, Textural, and Contextual Information of Land Parcels for Classification of Detailed Urban Land Use. Ann. Assoc. Am. Geogr. 2009, 99, 76–98. [Google Scholar] [CrossRef]
- Huang, B.; Zhao, B.; Song, Y. Urban land-use mapping using a deep convolutional neural network with high spatial resolution multispectral remote sensing imagery. Remote Sens. Environ. 2018, 214, 73–86. [Google Scholar] [CrossRef]
- Wang, C.; Wang, A.; Wang, J.; Liu, Z. Land Use Information Extraction in the Inner City of Beijing Based on Object-oriented Classification Method. J. Nat. Resour. 2015, 30, 705–714. [Google Scholar]
- Tu, W.; Cao, J.; Yue, Y.; Shaw, S.-L.; Zhou, M.; Wang, Z.; Chang, X.; Xu, Y.; Li, Q. Coupling mobile phone and social media data: A new approach to understanding urban functions and diurnal patterns. Int. J. Geogr. Inform. Sci. 2017, 31, 2331–2358. [Google Scholar] [CrossRef]
- Zhong, C.; Huang, X.; Arisona, S.M.; Schmitt, G.; Batty, M. Inferring building functions from a probabilistic model using public transportation data. Comput. Environ. Urban. Syst. 2014, 48, 124–137. [Google Scholar] [CrossRef]
- Chen, Y.; Liu, X.; Li, X.; Liu, X.; Yao, Y.; Hu, G.; Xu, X.; Pei, F. Delineating urban functional areas with building-level social media data: A dynamic time warping (DTW) distance based k-medoids method. Landsc. Urban. Plan. 2017, 160, 48–60. [Google Scholar] [CrossRef]
- Ty, H.; Yang, J.; Xuecao, L.; Gong, P. Mapping Urban Land Use by Using Landsat Images and Open Social Data. Remote Sens. 2016, 8, 151. [Google Scholar]
- Zhu, L.F.; Zhou, L.; Liu, Y.; Chen, Y.X. A New Method with POI Data Applied in the Determination of Urban Functional Agglomeration Regions. In Proceedings of the 2019 IEEE 4th International Conference on Big Data Analytics (ICBDA), Suzhou, China, 15–18 March 2019; IEEE: Piscataway, NJ, USA, 2019; pp. 79–82. [Google Scholar]
- Peng, Z.; Sun, Z.; Cheng, Q.; Jiao, H.; Chen, W. Urban Land Use Function Recognition Method Using Sequential Mobile Phone Data. Geomat. Inform. Sci.Wuhan Univ. 2018, 43, 1399–1407. [Google Scholar]
- Yuan, J.; Zheng, Y.; Xie, X. Discovering regions of different functions in a city using human mobility and POIs. In Proceedings of the KDD ‘12: The ACM SIGKDD International Conference on Knowledge Discovery and Data Mining, Beijing, China, 12–16 August 2012; Association for Computing Machinery: New York, NY, USA, 2012; pp. 186–194. [Google Scholar]
- Toole, J.L.; Ulm, M.; Bauer, D.; Gonzalez, M.C. Inferring land use from mobile phone activity. In Proceedings of the UrbComp ‘12, the ACM SIGKDD International Conference on Knowledge Discovery and Data Mining, Beijing, China, 12–16 August 2012; Association for Computing Machinery: New York, NY, USA, 2012; pp. 1–8. [Google Scholar]
- Liu, X.; Long, Y. Automated identification and characterization of parcels with OpenStreetMap and points of interest. Environ. Plan. B 2016, 43, 341–360. [Google Scholar] [CrossRef]
- Liu, Y.; Wang, F.; Xiao, Y.; Gao, S. Urban land uses and traffic ‘source-sink areas’: Evidence from GPS-enabled taxi data in Shanghai. Landsc. Urban. Plan. 2012, 106, 73–87. [Google Scholar] [CrossRef]
- Grippa, T.; Georganos, S.; Zarougui, S.; Bognounou, P.; Diboulo, E.; Forget, Y.; Lennert, M.; Vanhuysse, S.; Mboga, N.; Wolff, E. Mapping Urban Land Use at Street Block Level Using OpenStreetMap, Remote Sensing Data, and Spatial Metrics. ISPRS Int. J. Geo-Inform. 2018, 7, 246. [Google Scholar] [CrossRef] [Green Version]
- Zhang, Y.; Li, Q.; Huang, H.; Wu, W.; Du, X.; Wang, H. The Combined Use of Remote Sensing and Social Sensing Data in Fine-Grained Urban Land Use Mapping: A Case Study in Beijing, China. Remote Sens. 2017, 9, 865. [Google Scholar] [CrossRef] [Green Version]
- Gong, P.; Chen, B.; Li, X.; Liu, H.; Wang, J.; Bai, Y.; Chen, J.; Chen, X.; Fang, L.; Feng, S.; et al. Mapping Essential Urban Land Use Categories in China (EULUC-China): Preliminary results for 2018. Sci. Bull. 2020, 65, 182–187. [Google Scholar] [CrossRef] [Green Version]
- Tu, Y.; Chen, B.; Zhang, T.; Xu, B. Regional Mapping of Essential Urban Land Use Categories in China: A Segmentation-Based Approach. Remote Sens. 2020, 12, 1058. [Google Scholar] [CrossRef] [Green Version]
- Main-Knorn, M.; Pflug, B.; Debaecker, V.; Louis, J. Calibration and Validation plan for the L2A processor and products of the Sentinel-2 mission. In Proceedings of the 36th International Symposium on Remote Sensing of Environment, Berlin, Germany, 11–15 May 2015; pp. 1249–1255. [Google Scholar]
- Mayer, B.; Kylling, A. Technical Note: The libRadtran Software Package for Radiative Transfer Calculations - Description and Examples of Use. Atmos. Chem. Phys. 2005, 5, 1855–1877. [Google Scholar] [CrossRef] [Green Version]
- Li, X.; Xu, H.M.; Chen, X.L.; Li, C. Potential of NPP-VIIRS Nighttime Light Imagery for Modeling the Regional Economy of China. Remote Sens. 2013, 5, 3057–3081. [Google Scholar] [CrossRef] [Green Version]
- Bennett, M.M.; Smith, L.C. Advances in using multitemporal night-time lights satellite imagery to detect, estimate, and monitor socioeconomic dynamics. Remote Sens. Environ. 2017, 192, 176–197. [Google Scholar] [CrossRef]
- Jiang, W.; He, G.; Long, T.; Guo, H.; Yin, R.; Leng, W.; Liu, H.; Wang, G. Potentiality of Using Luojia 1-01 Nighttime Light Imagery to Investigate Artificial Light Pollution. Sensors 2018, 18, 2900. [Google Scholar] [CrossRef] [PubMed] [Green Version]
- Luo, L.; Liu, B.; Xuechao, L. Data Quality Assessment and Application Analysis for OpenStreetMap Road Network. Jiangxi Sci. 2017, 35, 151–157. Available online: http://www.wanfangdata.com.cn/details/detail.do?_type=perio&id=jxkx201701030 (accessed on 6 February 2020).
- Wang, D.; Wang, S.; Huang, C. Comparison of Sentinel-2 imagery with Landsat8 imagery for surface water extraction using four common water indexes. Remote Sens. Land Resour. 2019, 31, 157–165. [Google Scholar]
- Congalton, R.G. A review of assessing the accuracy of classifications of remotely sensed data. Remote Sens Environ. 1991, 37, 35–46. [Google Scholar] [CrossRef]
- Kononenko, I. Estimating attributes: Analysis and extensions of RELIEF. In Proceedings of the European Conference on Machine Learning: ECML-94, Catania, Italy, 6–8 April 1994; Springer: Berlin/Heidelberg, Germany, 1994; pp. 171–182. [Google Scholar]
- Breiman, L. Random Forests. Mach. Learn. 2001, 45, 5–32. [Google Scholar] [CrossRef] [Green Version]
- Kulkarni, V.Y.; Sinha, P.K. Pruning of Random Forest classifiers: A survey and future directions. In Proceedings of the 2012 International Conference on Data Science & Engineering (ICDSE), Cochin, Kerala, India, 18–20 July 2012; IEEE: Piscataway, NJ, USA, 2012; pp. 64–68. [Google Scholar]
- Department of Natural Rescources of Lanzhou. Available online: http://zrzyj.lanzhou.gov.cn/art/2017/9/19/art_10426_554643.html?authkey=frmul3 (accessed on 14 March 2020).
- Su, M.; Guo, R.; Chen, B.; Hong, W.; Wang, J.; Feng, Y.; Xu, B. Sampling Strategy for Detailed Urban Land Use Classification: A Systematic Analysis in Shenzhen. Remote Sens. 2020, 12, 1497. [Google Scholar] [CrossRef]
- Liu, X.P.; He, J.L.; Yao, Y.; Zhang, J.B.; Liang, H.L.; Wang, H.; Hong, Y. Classifying urban land use by integrating remote sensing and social media data. Int. J. Geogr. Inform. Sci. 2017, 31, 1675–1696. [Google Scholar] [CrossRef]
- Manonmani, R.; Suganya, G.M.D. Remote sensing and GIS application in change detection study in urban zone using multi temporal satellite. Int. J. Geomat. Geosci. 2010, 1, 60–65. [Google Scholar]
- He, S.; Wang, X.; Dong, J.; Wei, B.; Duan, H.; Jiao, J.; Xie, Y. Three-Dimensional Urban Expansion Analysis of Valley-Type Cities: A Case Study of Chengguan District, Lanzhou, China. Sustainability 2019, 11, 5663. [Google Scholar] [CrossRef] [Green Version]
Figure 1.
Overview of the study area.

Figure 2.
Technique flow chart.

Figure 3.
Parcel generation process combining OpenStreetMap (OSM) and Gaode roads.

Figure 4.
Relationship between the number of features and classification accuracy (Level II category).
Figure 4.
Relationship between the number of features and classification accuracy (Level II category).

Figure 5.
Comparison of the results of this paper with the results of the essential urban land use categories (EULUC) in the main city of Lanzhou. (a) overview mapping results implemented in this study; (b) overview mapping results of EULUC; (c,d) Google images corresponding to the local mapping areas; (e,f) local details of Figure 5a; (g,h) local details of Figure 5b.

Figure 6.
Overall accuracy (a) and kappa coefficient (b) of RF model based on different feature combinations.
Figure 6.
Overall accuracy (a) and kappa coefficient (b) of RF model based on different feature combinations.

Figure 7.
User accuracy and producer accuracy of different land use classes based on different feature combinations (Level II category).
Figure 7.
User accuracy and producer accuracy of different land use classes based on different feature combinations (Level II category).

Table 1.
Classification system.
| Level I | Level II |
|---|---|
| Residential | Village, Residential |
| Commercial | Business, Commercial |
| Industrial | Industrial |
| Transportation | Transportation |
| Public | Administrative, Educational, Medical, Sport and cultural, Greenspace, Undeveloped |
Table 2.
Summary of features.
| Feature Information | Parameter | Count |
|---|---|---|
| Spectral | Mean and standard deviation of red, green, blue, near-infrared, and two short-wave infrared bands; mean of NDVI, NDWI and NDBI | 15 |
| Texture | Parameters (mean, standard deviation, homogeneity, contrast, heterogeneity, entropy) based on GLCM of red, green, blue, near-infrared, and two short-wave infrared bands | 36 |
| Backscatter | Mean, maximum, minimum, standard deviation, range, and the sum of VV and VH | 12 |
| Nighttime light | Mean, maximum, minimum, standard deviation, range, and the sum of light intensity | 6 |
| POI | Total number of all POIs Total number of each type of POIs The proportion of each type of POIs | 23 |
| Time series population density | Population density values at every two hours in a week | 84 |
Table 3.
Classification summary experiments based on different feature combinations.
| Experiment | Feature Combination |
|---|---|
| S2 | Spectral and texture features |
| S2 + S1 | Spectral, texture, and backscatter features |
| S2 + Luojia | Spectral, texture, and nighttime light features |
| S2 + Easygo | Spectral, texture, and time-series population density features |
| S2 + POI | Spectral, texture, and POI features |
| S2 + Easygo + POI | Spectral, texture, POI, time-series population density features |
| POI | POI features |
| Easygo | Time-series population density features |
| POI + Easygo | POI and time-series population density features |
| All | Spectral, texture, nighttime light, backscatter, POI, and time-series population density features |
Table 4.
Confusion matrix of results based on multi-source features using the random forest (RF) model (Level I category).
Table 4.
Confusion matrix of results based on multi-source features using the random forest (RF) model (Level I category).
| Actual Results | Classification Results | UA/% | |||
|---|---|---|---|---|---|
| Residential | Commercial | Industrial | Public | ||
| Residential | 150 | 6 | 1 | 4 | 93.17 |
| Commercial | 2 | 54 | 4 | 7 | 80.60 |
| Industrial | 8 | 2 | 38 | 2 | 76.00 |
| Public | 18 | 4 | 7 | 93 | 76.23 |
| PA/% | 84.27 | 81.82 | 76.00 | 87.74 | |
| OA = 83.75% kappa coefficient = 0.77 | |||||
© 2020 by the authors. Licensee MDPI, Basel, Switzerland. This article is an open access article distributed under the terms and conditions of the Creative Commons Attribution (CC BY) license (http://creativecommons.org/licenses/by/4.0/).
Share and Cite
MDPI and ACS Style
Zong, L.; He, S.; Lian, J.; Bie, Q.; Wang, X.; Dong, J.; Xie, Y. Detailed Mapping of Urban Land Use Based on Multi-Source Data: A Case Study of Lanzhou. Remote Sens. 2020, 12, 1987. https://0-doi-org.brum.beds.ac.uk/10.3390/rs12121987
AMA Style
Zong L, He S, Lian J, Bie Q, Wang X, Dong J, Xie Y. Detailed Mapping of Urban Land Use Based on Multi-Source Data: A Case Study of Lanzhou. Remote Sensing. 2020; 12(12):1987. https://0-doi-org.brum.beds.ac.uk/10.3390/rs12121987
Chicago/Turabian StyleZong, Leli, Sijia He, Jiting Lian, Qiang Bie, Xiaoyun Wang, Jingru Dong, and Yaowen Xie. 2020. "Detailed Mapping of Urban Land Use Based on Multi-Source Data: A Case Study of Lanzhou" Remote Sensing 12, no. 12: 1987. https://0-doi-org.brum.beds.ac.uk/10.3390/rs12121987
Note that from the first issue of 2016, this journal uses article numbers instead of page numbers. See further details here.