A Plant-by-Plant Method to Identify and Treat Cotton Root Rot Based on UAV Remote Sensing
by
 , , and
Tianyi Wang
1,* ,
,
J. Alex Thomasson
1,2,
Thomas Isakeit
3,
Chenghai Yang
4 and
Robert L. Nichols
5 1
Department of Biological and Agricultural Engineering, Texas A&M University, College Station, TX 77843, USA
2
Department of Agricultural and Biological Engineering, Mississippi State University, Starkville, MS 39762, USA
3
Department of Plant Pathology and Microbiology, Texas A&M University, College Station, TX 77843, USA
4
USDA-Agricultural Research Service, Aerial Application Technology Research Unit, 3103 F&B Road, College Station, TX 77845, USA
5
Cotton Incorporated, Agricultural & Environmental Research, 6399 Weston Parkway, Cary, NC 27513, USA
*
Author to whom correspondence should be addressed.
Remote Sens. 2020, 12(15), 2453; https://0-doi-org.brum.beds.ac.uk/10.3390/rs12152453
Submission received: 25 June 2020
/
Revised: 20 July 2020
/
Accepted: 28 July 2020
/
Published: 30 July 2020
(This article belongs to the Special Issue UAVs for Vegetation Monitoring)
Abstract
:Cotton root rot (CRR), caused by the fungus Phymatotrichopsis omnivora, is a destructive cotton disease that mainly affects the crop in Texas. Flutriafol fungicide applied at or soon after planting has been proven effective at protecting cotton plants from being infected by CRR. Previous research has indicated that CRR will reoccur in the same regions of a field as in past years. CRR-infected plants can be detected with aerial remote sensing (RS). As unmanned aerial vehicles (UAVs) have been introduced into agricultural RS, the spatial resolution of farm images has increased significantly, making plant-by-plant (PBP) CRR classification possible. An unsupervised classification algorithm, PBP, based on the Superpixel concept, was developed to delineate CRR-infested areas at roughly the single-plant level. Five-band multispectral data were collected with a UAV to test these methods. The results indicated that the single-plant level classification achieved overall accuracy as high as 95.94%. Compared to regional classifications, PBP classification performed better in overall accuracy, kappa coefficient, errors of commission, and errors of omission. The single-plant fungicide application was also effective in preventing CRR.

1. Introduction
The United States (U.S.) produced 20.9 million 218-kg (480-lb) bales of cotton in the 2017–2018 season with a production value of $7.2 billion (USD), ranking 3rd after India and China, and it is the largest cotton-exporting country in the world [1]. The state of Texas produced 9.5 million bales, approximately 44% of U.S. cotton production, ranking 1st in the U.S. [1]. While Texas is by far the largest producing state, a major obstacle to cotton production in Texas is a disease called cotton root rot (CRR) or Texas root rot. The disease is caused by the soilborne fungus, Phymatotrichopsis omnivora, a destructive plant disease throughout the southwestern U.S. The first documented study of CRR was in the 19th century by Pammel [2]. The disease rots the root, disrupting the vascular system and preventing water and nutrients from being transported from the roots to the rest of the plant, eventually killing the plant. An infected cotton plant usually dies within 10 days. If the disease develops in an early stage of growth, the plants will die before bearing fruit. If it develops after flowering, the disease will reduce yield and lower the quality of the cotton lint by stopping transport of nutrients to the maturing bolls.
The fungus spreads within a field by direct root contact between plants and the growth of its mycelia through the soil [3]. Infested field areas are commonly circular in shape [4], providing an indication of the cause of plant death. One study reported that the overall area of plants infected with CRR in a particular field increased from 10% to 50% from August to September [4], during a later growth stage of the crop. Until the recent advent of soil-applied flutriafol fungicide, several control practices (e.g., crop rotation, soil fumigation, host resistance) were tested but found to be either not economical or not effective [4]. As CRR generally occurs at the same place in a field from year to year, its position can be mapped, allowing for targeted spot treatments of flutriafol fungicide. Both multispectral and hyperspectral imagery can distinguish infected areas accurately, but three-band multispectral is a preferred technique, being effective, less expensive, more widely available, and simpler to use than hyperspectral [5].
The large sizes of typical cotton fields make it impractical to map CRR position from ground-based platforms. Remote sensing, on the other hand, can provide such data quickly and relatively inexpensively, and it is thus an important technology for practical CRR sensing [5]. Visible, near-infrared (NIR), and thermal remote sensing data have been studied widely with aerial and satellite platforms to understand many crop phenomena [6]. Biotic and abiotic stresses, including insects, pathogens, weeds, drought, and nutrition deficiencies have been widely studied with remote sensing [7,8,9,10,11,12], in addition to applications such as yield prediction and general crop management [13,14,15,16]. In cotton, remote sensing has been used to evaluate the effectiveness of defoliation and regrowth control strategies [17] as well as in other applications.
Remote sensing has also been used to map CRR in cotton fields dating back to 1929 [18]. Nixon et al. later introduced color-infrared (CIR) technology to document the distribution of CRR infestation and to detect the effect of chemical treatment for CRR [19]. Multispectral video imagery of CRR was evaluated and reported as early as 1987 [20], and Yang et al. reported using manned-aircraft based remote sensing and high precision global positioning system (GPS) technology to map CRR in 2015 [21].
Satellite images typically have relatively low resolution but can be acquired periodically at a reasonable cost. However, there is a risk that clouds may cover the view when the images are taken. Aerial images commonly have higher spatial resolution that may be advantageous as well as some flexibility in timing, but the cost of acquisition is relatively high [22]. Previous research indicates that airborne and satellite multispectral imagery data can be used to successfully detect the CRR-infested area in both dryland and irrigated fields [23,24,25,26]. The resolution of such imagery limits CRR mapping to field zones, but unmanned aerial vehicles (UAVs) have recently emerged as remote-sensing tools that provide resolution high enough to potentially enable even single-plant level prescription map creation. Compared to manned aircraft, UAVs have a limited payload capacity, but they can fly lower and slower than manned aircraft. The above-ground level (AGL) with UAVs is commonly 20–120 m, providing for spatial resolution at the cm level. The temporal resolution of UAVs is commonly improved as well [27] because UAVs can be flown any time the weather permits. In addition, UAV flights generally cost less than traditional manned aircraft remote sensing.
Rotary-wing UAVs are much more common than fixed-wing UAVs for agricultural remote sensing. Rotary-wing UAVs are slower and more stable in flight and thus are able to generate higher-quality mosaicked images. However, the slower flying speed also generally leads to smaller coverage area. On the other hand, fixed-wing UAVs flying at the legally allowable limit of 120 m AGL are commonly able to cover a 24–40 ha (60–100 acre) area on one battery charge (about 20 min), depending on the weather conditions. Therefore, fixed-wing UAVs appear to be well-suited to the large-area farming that is commonly seen in cotton production.
UAV remote sensing has been increasingly used in agricultural research in recent years and has been considered for general production management, yield prediction, and disease detection [16,17,28,29,30,31,32]. RGB (red, green, and blue) and other multispectral sensors are commonly used, but the frequently used normalized difference vegetation index (NDVI) requires the NIR band. Without the NIR band, the normalized difference photosynthetic vigor ratio (NDPVR) and the visible atmospherically resistant index (VARI) can be calculated, and they have been used to estimate crop yield [28,29]. Both RGB and other multispectral images have been used for rice growth and yield estimation. However, the vegetation indices (VIs) derived from multispectral images including NIR correlate better with grain yield than VIs derived from RGB images [29]. Albetis et al. used the support vector machine (SVM) classifier on UAV images to differentiate diseased from non-diseased areas of vineyards. Due to the high spatial resolution, they could distinguish grapevine vegetation from bare soil, shadow, and inter-row vegetation. A high classification accuracy of 97–99% was achieved in four vineyards [30]. Furthermore, artificial neural networks (ANNs) have been used to estimate water potential in vineyards based on UAV data [31]. While a great deal of recent agricultural research has involved UAV-based remote sensing, there is scant research about UAV-based remote sensing for the delineation of CRR.
In general, classification procedures are a way to categorize data according to various characteristics. Classification in RS means categorizing or mapping an image into different classes depending on the features of the data such as tone, texture, pattern, etc. Unsupervised and supervised classification are common and differ according to whether human-guided training is involved in classifying the data.
The Superpixel algorithm segments images into many multi-pixel pieces (superpixels) based on shape, color, texture, etc. In essence, the Superpixel method converts images from pixel-level to district-level, and thus belongs to the image segmentation category in image processing. The Superpixel algorithm keeps the main features of the aggregated pixels, resulting in a sharp reduction in the number of data-containing units. As a result, it improves the image processing speed significantly. Sultani et al. used the Superpixel algorithm to detect objects in pavement images [33]. Different shaped objects such as patches, maintenance hole covers, and markers could be detected efficiently. After dividing the images into many small segments, features like histogram of oriented gradients (HOG), co-occurrence matrix (COOC), intensity histogram (IH), and mean intensity (MI) of each superpixel were calculated. HOG and COOC are texture and shape characteristics, while IH and MI are spectral intensity variations. Then, SVM was used to generate classifications based on each feature. The Superpixel algorithm has also been used to detect disease in agricultural crops. Zhang et al. developed a new method based on the Superpixel algorithm to detect cucumber diseases [34,35]. Leaf images were divided into superpixels, and then the expectation maximization (EM) method was applied to obtain lesion images. After feature extraction, SVM was used to detect the disease. The result indicated that the proposed method had the highest recognition rate and fastest processing speed compared to four other methods that have been used for cucumber disease recognition. Zhang et al. later proposed a new leaf recognition method based on the Superpixel algorithm, k-means, and pyramid of histograms of orientation gradients (PHOG) algorithms [34,35]. First, the RGB leaf image was divided into segments with the Superpixel algorithm. Then, k-means clustering was applied to segment the lesion section of the leaf. PHOG features were extracted and used to recognize the disease. Three apple and three cucumber leaf diseases were used to assess the method. The result indicated that the proposed method was effective and usually achieved the highest recognition rate compared to other methods that had been used for cucumber disease recognition.
Conventional CRR identification methods developed for 1-m resolution aerial images can only detect the CRR-infested area at the regional level, leading to the application of a large amount of fungicide to field areas that do not need it. UAV remote sensing makes high-resolution data collection possible, meaning that fungicide treatments could conceivably be applied at the level of individual plants. To take advantage of these high-resolution data, a novel high-precision CRR identification method is proposed to enable high-precision CRR detection and treatment. The objectives of this research were thus to (1) develop and evaluate a plant-by-plant (PBP) CRR detection and classification method; (2) compare the PBP classification method to common regional classification methods; (3) examine the effectiveness of PBP fungicide treatment to validate the necessity for the method.
2. Materials and Methods
2.1. Study Sites
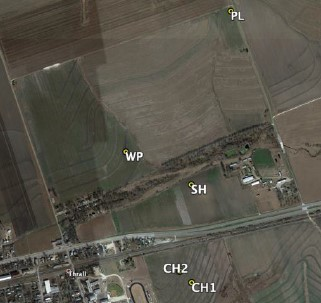
This study involved five selected regions in four dryland cotton fields (Figure 1) in central Texas, USA, near the town of Thrall: Chase Section 1 (CH1), Chase Section 2 (CH2), West Poncho (WP), School House (SH), and a field for a plot test (PL) to examine the effectiveness of various fungicide treatments. All of these fields and regions have a history of CRR infestation.
2.2. Data Collection
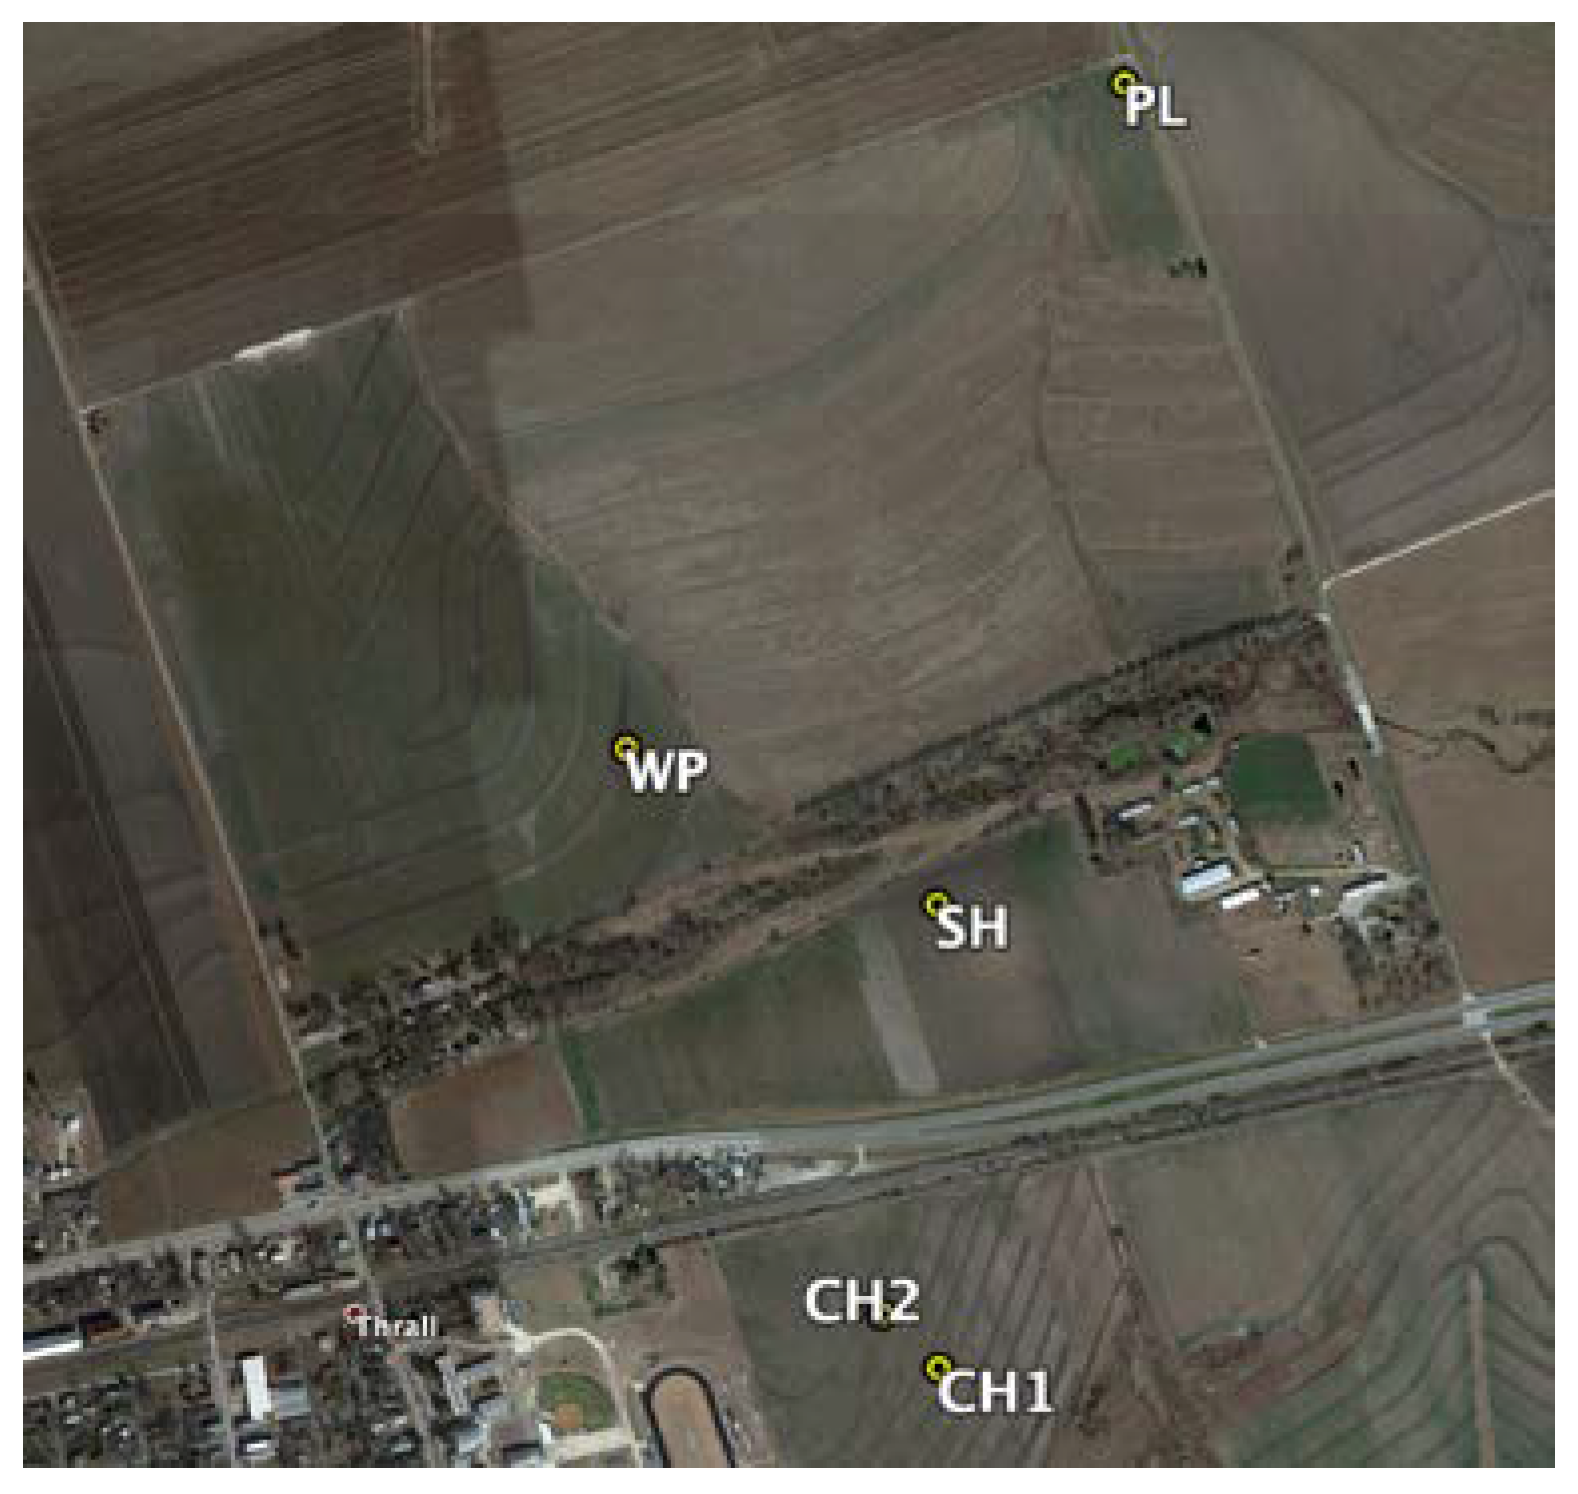
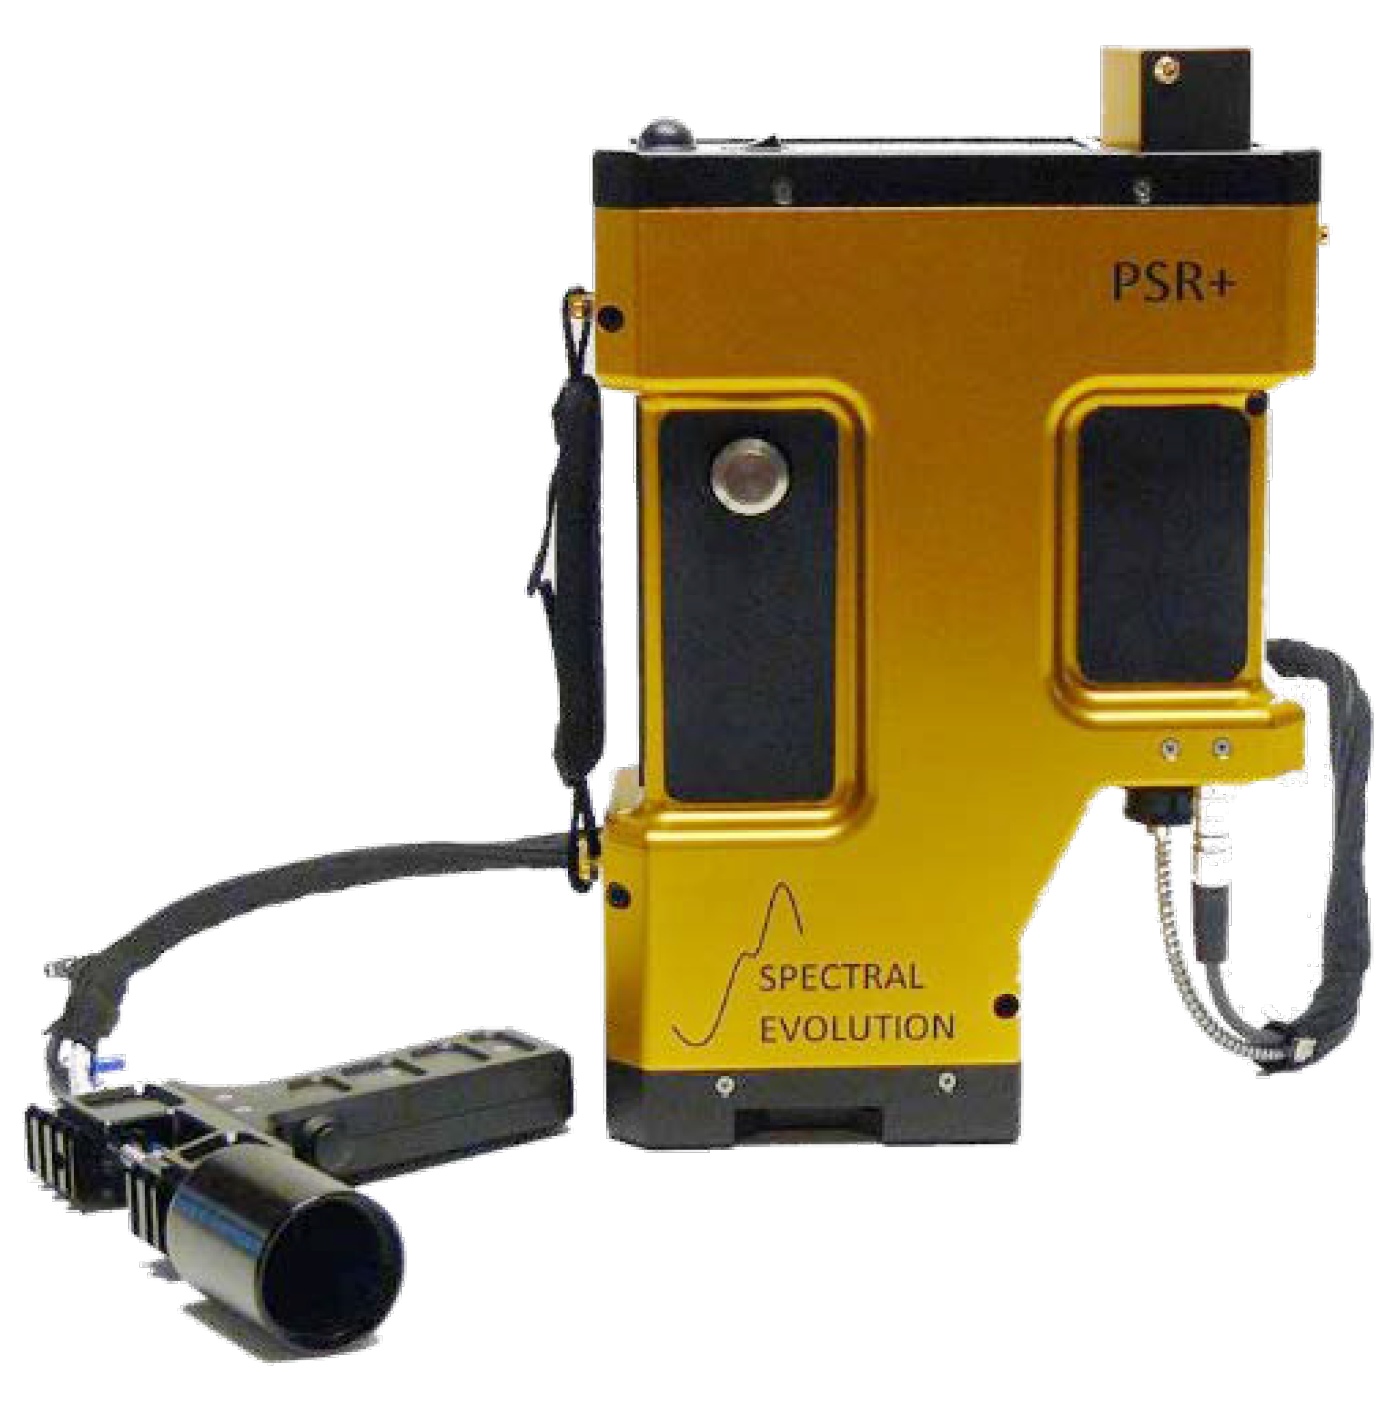
A fixed-wing UAV (Tuffwing Mapper, Tuffwing LLC, Boerne, TX, USA; Figure 2a) was used to acquire image data of all the fields and regions on a cloud-free day, August 20, 2017. This UAV is equipped by the manufacturer with a global navigation satellite system (GNSS) receiver and an inertial measurement unit (IMU). A multispectral camera (RedEdge, Micasense, Seattle, WA, USA; Figure 2b) mounted on the UAV collected images at 120-m above ground level (AGL). The images had a pixel resolution of 7.64 cm and contained five spectral bands: blue (≈475–500 nm), green (≈550–565 nm), red (≈665–675 nm), red edge (≈715–725 nm), and NIR (≈825–860 nm). The images were taken between 11:00 and 13:00 local time with an optimized fixed-exposure. Eight ground control points (GCPs) were used during each flight to improve the geographical accuracy of the mosaicked image of each field area. The GCPs were placed in each field at the four corners and four midpoints of each side. Ground-truth data were collected on August 25 2017, and involved using a GPS receiver to record boundary locations of some CRR zones (Figure 3). A total of about 20 plants from these zones were removed and evaluated for the presence of the fungus on the roots in order to validate the presence of CRR in the zone.
2.3. Data Preprocessing
A 0.95-ha area was covered in each image with the AGL and camera used. An 80% forward overlap and 70% side overlap flight plan was used for image acquisition. The raw images were collected in tiff format with data from the GNSS receiver and IMU stored as image metadata. Image mosaicking was conducted with Pix4D software (Pix4D S.A, Lausanne, Switzerland). A Geoexplorer 6000 (Trimble, Sunnyvale, CA, USA) GNSS receiver was used in the fields to collect the coordinates of the GCP centroids for geo-referencing of the images, also conducted in Pix4D. The centers of the GCPs in each raw image were manually linked to the corresponding ground-truth GNSS coordinates during the geo-referencing process.
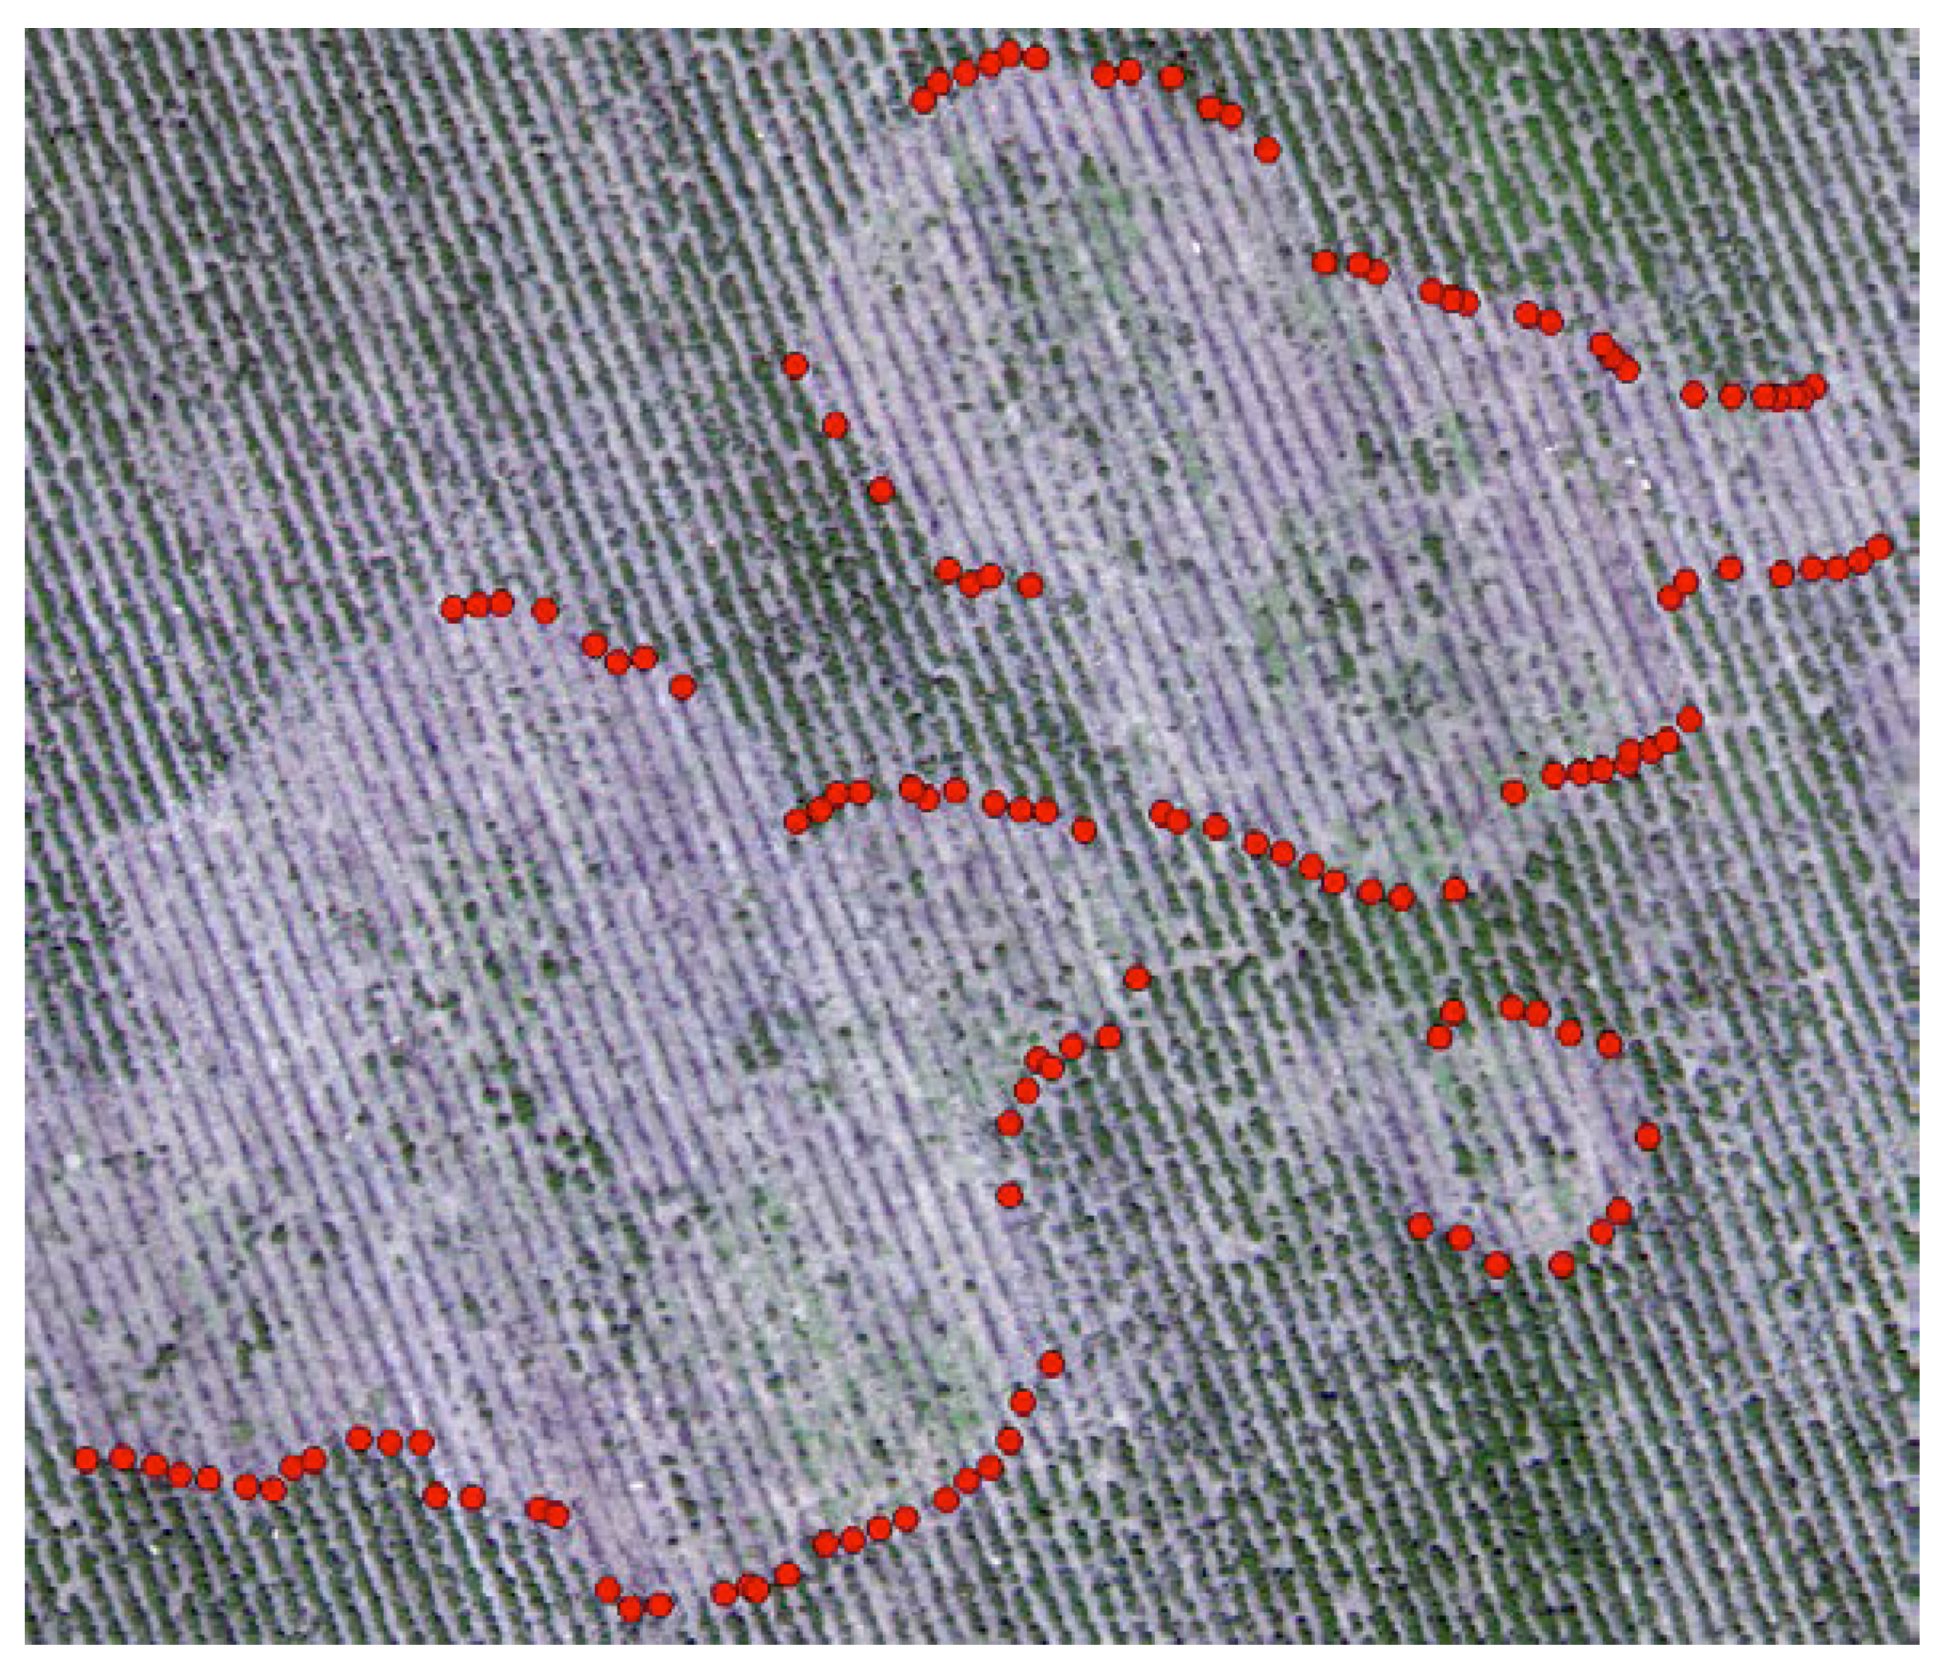
Three spectrally flat reference tiles were used for radiometric calibration: dark gray (≈3% reflectance) medium gray (≈20% reflectance), and light gray (≈45% reflectance). The actual reflectance spectra of the calibration tiles were collected with a portable spectroradiometer (Figure 4) (PSR+ 3500, Spectral Evolution, Haverhill, MA, USA). A linear relationship between known reflectance and image-pixel digital numbers (DNs) was established for each band. All DN images were converted to reflectance images in ENVI software (Harris geospatial solution, Boulder, CO, USA) based on these relationships.
2.4. Regional Classification
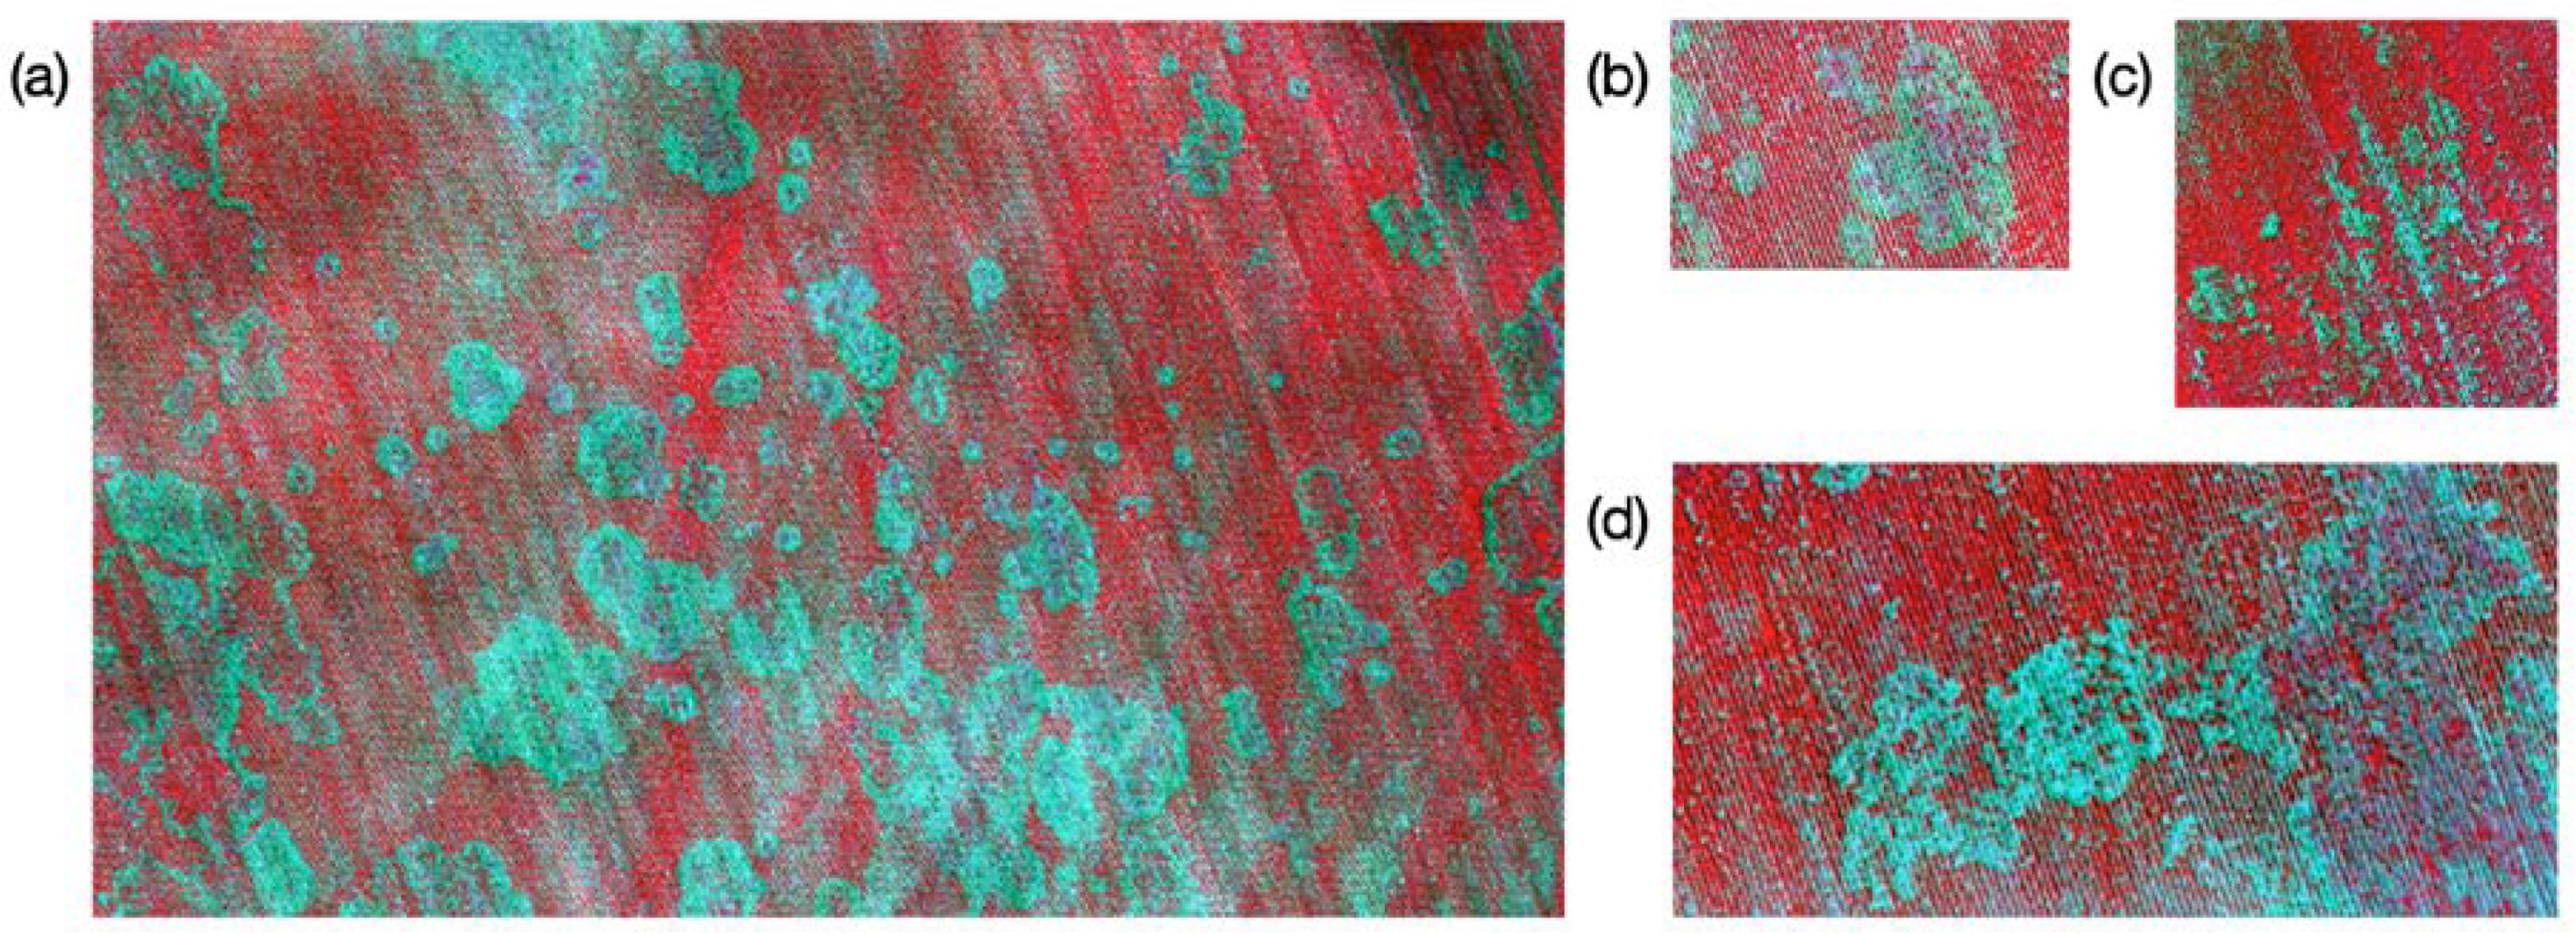
Previous studies have used regional classification for CRR detection [4,5,21,24,36,37]. In a related prior study involving UAV remote sensing of CRR [38], each CRR-infested zone was identified as a region of plants rather than individual plants. The image data were classified into healthy and CRR-infested regions with unsupervised, semi-supervised, and supervised classification methods. The unsupervised and semi-supervised methods were based on k-means clustering and included one two-class method (unsupervised) and three multi-class (3, 5, and 10 classes) methods that combined more classes to form two classes based on user knowledge and judgment (semi-supervised). The supervised methods, which required selection of training data by a human operator, were two-class methods and included support vector machine (SVM), minimum distance (MD), maximum likelihood (ML), and Mahalanobis distance (MHD) classifiers. The CIR images of four of the five regions described above (the other region in the current study was used for a fungicide application test as described below) were used to evaluate the classification methods by comparing their overall accuracies, errors of omission and commission, and kappa coefficients. These images covered 5.68, 0.15, 0.42, and 0.34 ha of field regions CH1, CH2, SH, and WP, respectively (Figure 5). In the current study, the regional classification results from the related prior study were used for comparison with plant-by-plant classification.
2.5. Plant-by-Plant Classification
The high spatial resolution of UAV RS images makes it possible to detect CRR infection at a plant-by-plant (PBP) level of precision. The 7.64-cm resolution in the current study provides for roughly 120 pixels per plant zone at full canopy cover, assuming 76-cm (30-in.) row spacing and average seeding distance of 12 cm (4.6 in.) at 45,000 seeds per 0.405 ha (1.0 ac.). This number of pixels per plant should be adequate for identifying specific features to enable discrimination of plants based on spectral and spatial information. A new PBP classification method was thus proposed and based on Superpixel and k-means algorithms. This combination of algorithms was selected because the Superpixel algorithm, used appropriately, should have the capability to identify single plant zones, and k-means has been demonstrated to distinguish CRR-infected from healthy plants.
The simple linear iterative clustering (SLIC) Superpixel algorithm [39,40] is based on visual color converted to the three-dimensional (3D) spherical CIE-Lab color space. CIE-Lab expresses colors in numeric terms and deals with the issue that colorimetric distance in measurements does not correspond with the color difference perceived by humans. In this study, CIR images were used based on the fact that healthy plants are more easily visually differentiated from unhealthy plants with CIR instead of visual color images. In CIR images, the image spectral bands are converted from green to blue, red to green, and NIR to red for visual display. Other researchers have used NIR to enhance the SLIC Superpixel algorithm results based on RGB [41], but in this study the SLIC Superpixel algorithm was used on the RGB-channel outputs of the CIR images, so CIR was directly converted to an artificial CIE-Lab by way of a CIR-based XYZ color space.
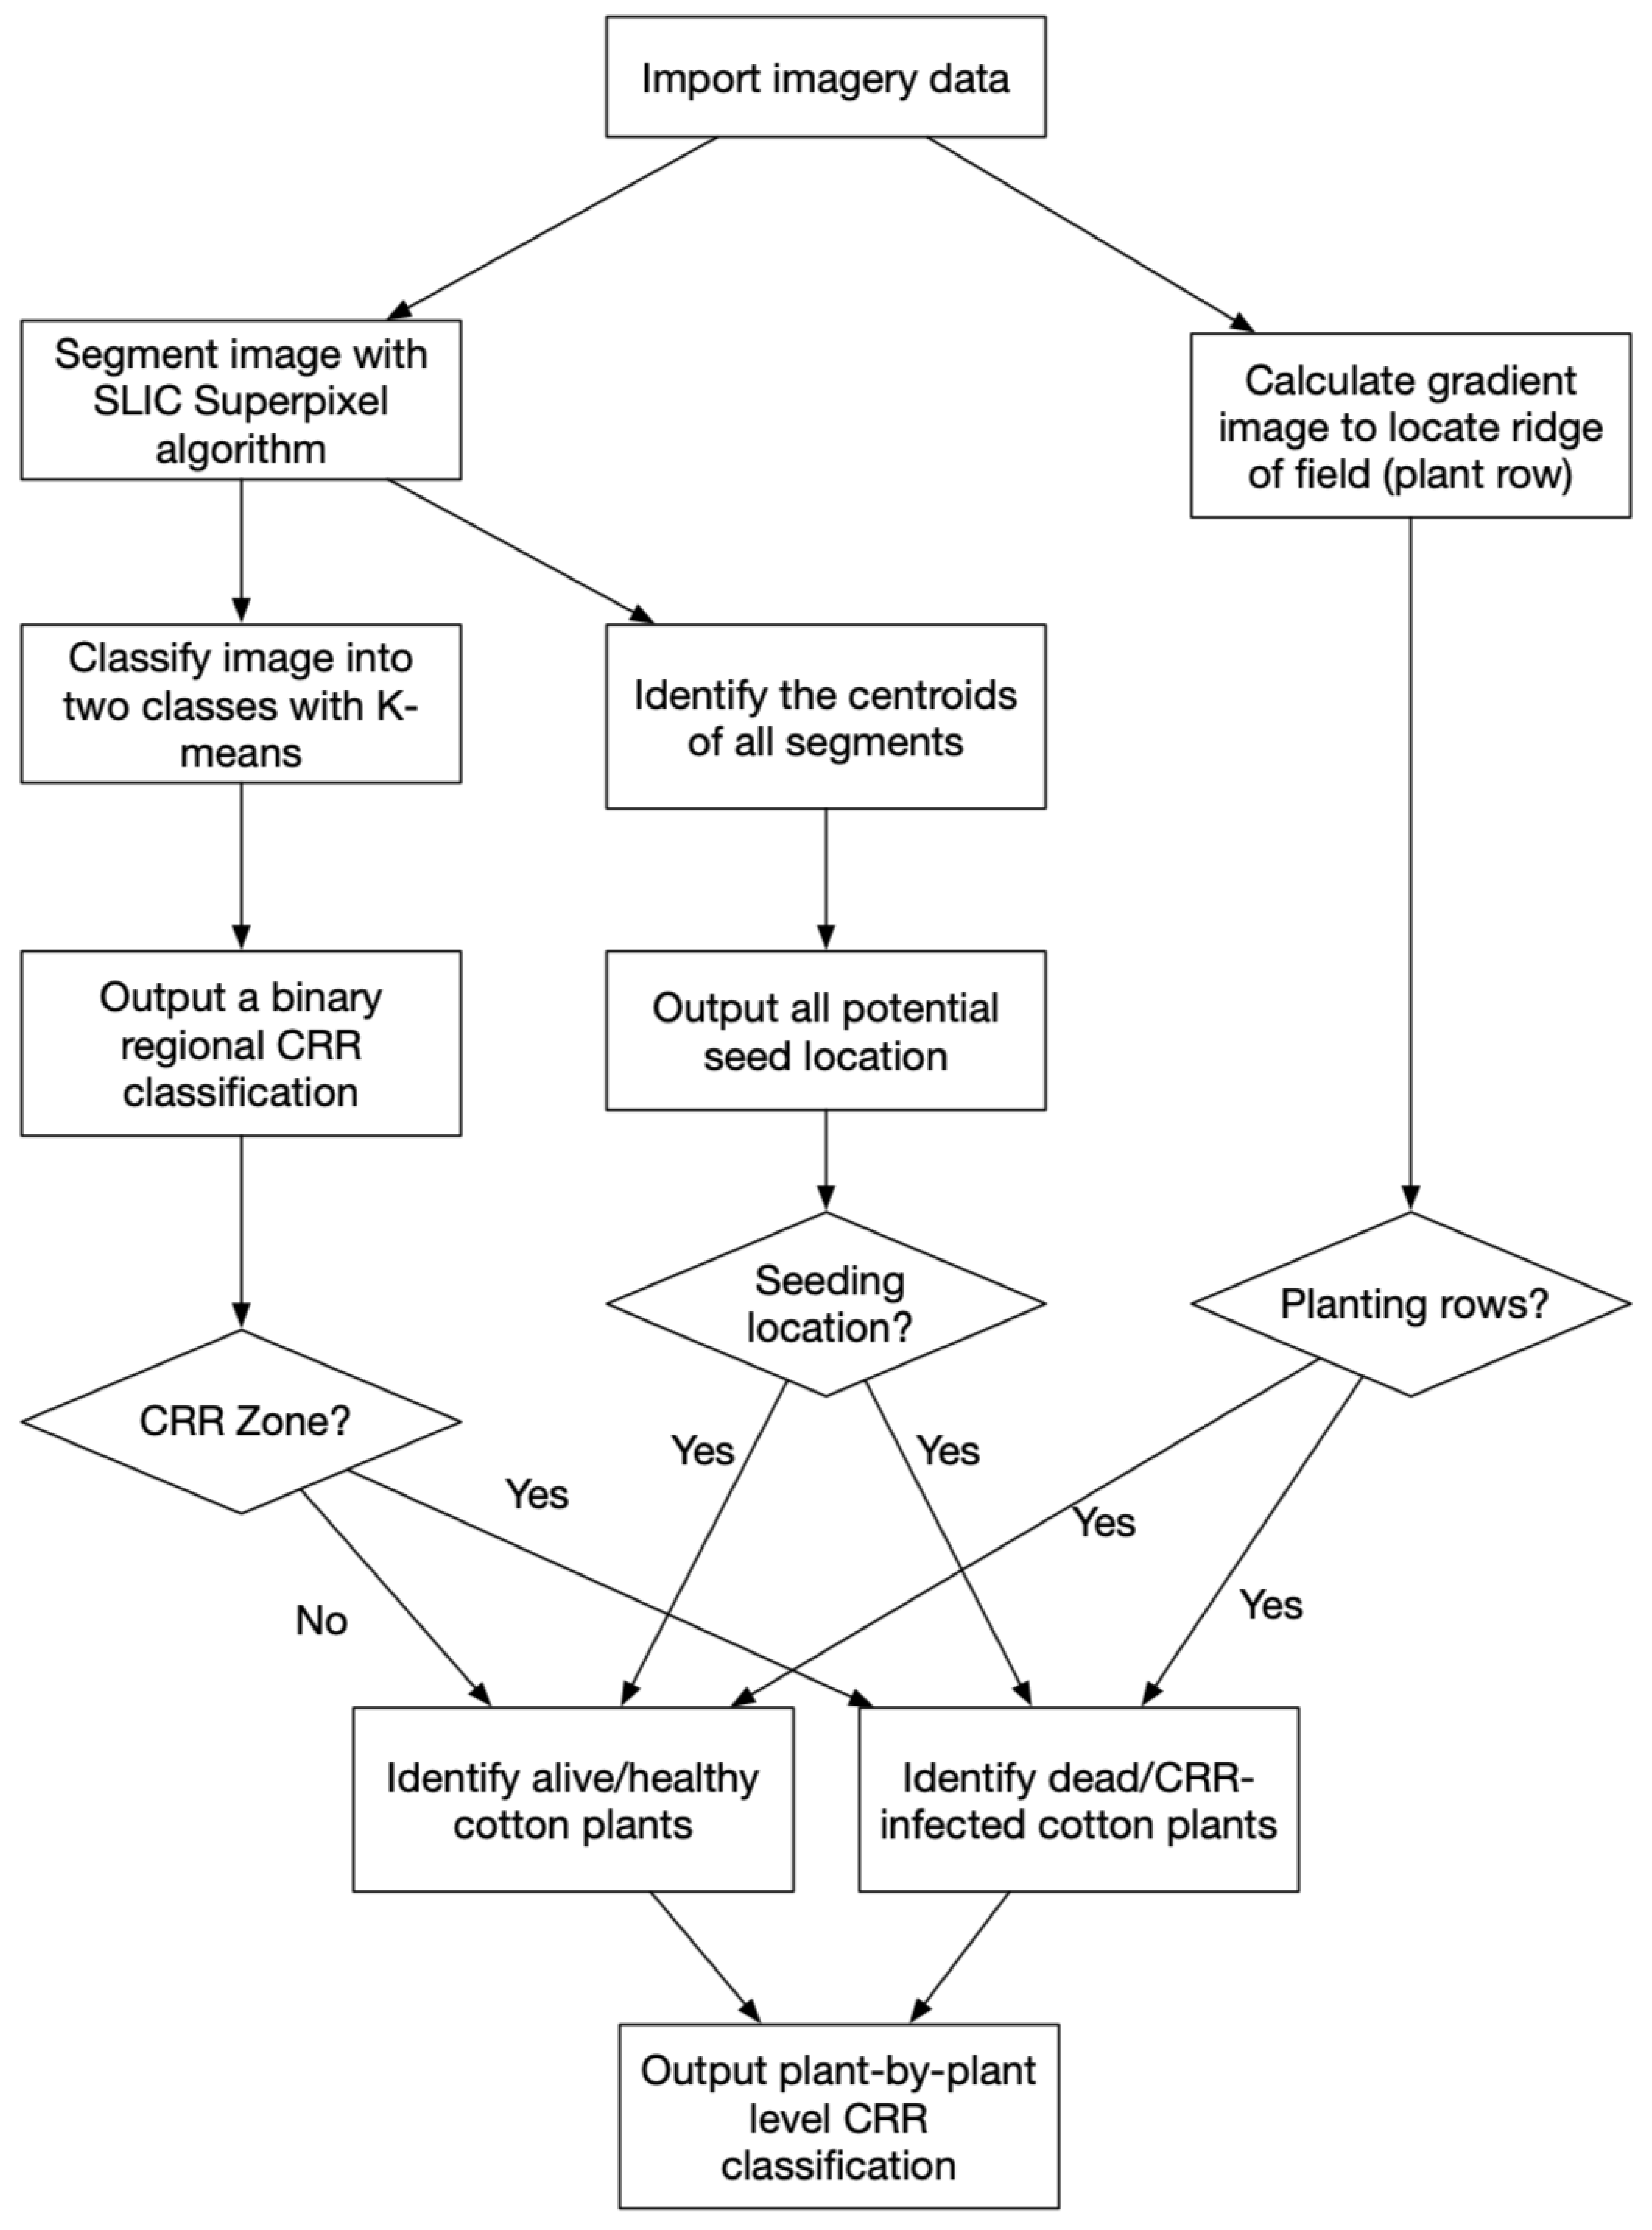
Figure 6 is the flowchart of the PBP classification algorithm. The SLIC Superpixel algorithm was first applied to a CIR image, and a number (k) of superpixel “seeds” were then generated and distributed uniformly across the image. The imported image was then divided into superpixels (small, rather homogenous, areas in the image) based on spectral and shape information around each “seed.” The mean of the DN values within each superpixel was calculated and assigned to the superpixel so that it had a single DN value. The number (k) of superpixels was user-determined and provided to the algorithm based on the field planting rate; i.e., the number of superpixels was expected to be similar to the number of cotton plants in the image, multiplied by a scaling factor to account for bare soil areas in the image. K-means clustering was applied to the superpixel image to achieve a two-class regional classification, with “1” and “0” to represent CRR and healthy zones, respectively. At the same time, planting rows were detected by calculating the gradient of the raw image. A binary plant row image was generated, with “0” and “1” representing plant rows and the gaps between them, respectively. The centroids of each superpixel were identified and marked as potential cotton plant centroids, with “1” and “0” representing cotton plant and bare soil, respectively. The centroids of superpixels located in the CRR zone (as determined by k-means) and the planting row were regarded as locations of CRR-infected plants. The centroids of superpixels located in healthy zones and within the planting row were regarded as locations of healthy plants.
The classifier logic was applied to all image pixels and can be expressed with the following equation:
where is the regional classification based on k-means, in which value “0” = healthy zone, and value “1” = CRR zone; is the status of superpixel centroid location or not superpixel centroid location, in which value “0” = not superpixel centroid location, and value “1” = superpixel centroid location; is the status of planting row or gap between rows, in which value “0” = gap, and value “1” = row; and is an overall class containing all pixel classes.
While C = 0, the superpixel centroid location is marked as an individual healthy cotton plant. While C = 1, the superpixel centroid location is marked as a CRR-infected plant. C = 2 represents no superpixel centroid at this location, no matter whether the pixel is classified as healthy or infested.
2.6. Accuracy Assessment
Accuracy assessment involves specific means of evaluating the performance of classifications [42,43]. A ground-truth map was drawn manually on the original high-resolution UAV images. In this process, the ground-truth data collected on August 25 2017, were used as a visual reference when applying the following protocol. Zones in the field with more than approximately 10 immediately adjacent infected plants were categorized as CRR-infested zones. In larger CRR-infested zones, more than 10 immediately adjacent healthy plants were categorized as healthy zones. The regional classification maps were resampled to the higher resolution of the ground-truth map and compared to it on a pixel-by-pixel basis. This method is common for accuracy assessment of raster-based classification maps. On the other hand, the PBP classification maps, which were vector point maps, were compared to the ground-truth map at only the locations of the superpixel centroids; i.e., the classification of a superpixel was compared to the pixel at its centroid location on the ground-truth map. This method was selected to enable comparison to the ground-truth map at the plant level instead of the pixel level. It should be noted that the number of comparisons between a regional classification and the ground-truth map was much higher than the number for PBP classification. However, the methods used are considered reasonable for the type of data being evaluated; e.g., the regional classification maps did not have adequate resolution for plant-level comparison. Confusion matrices were developed based on the individual comparisons within these zones (Table 1).
The kappa coefficient, which indicates the agreement between the “predicted” and “true” values, was calculated from the derived confusion matrices and the following formula:
where N is the total number of pixels; i is the class number; is the correctly classified number of pixels in Class i; is the total number of pixels classified as Class i in ground-truth data; and is the total number of pixels classified as Class i in the predicted data.
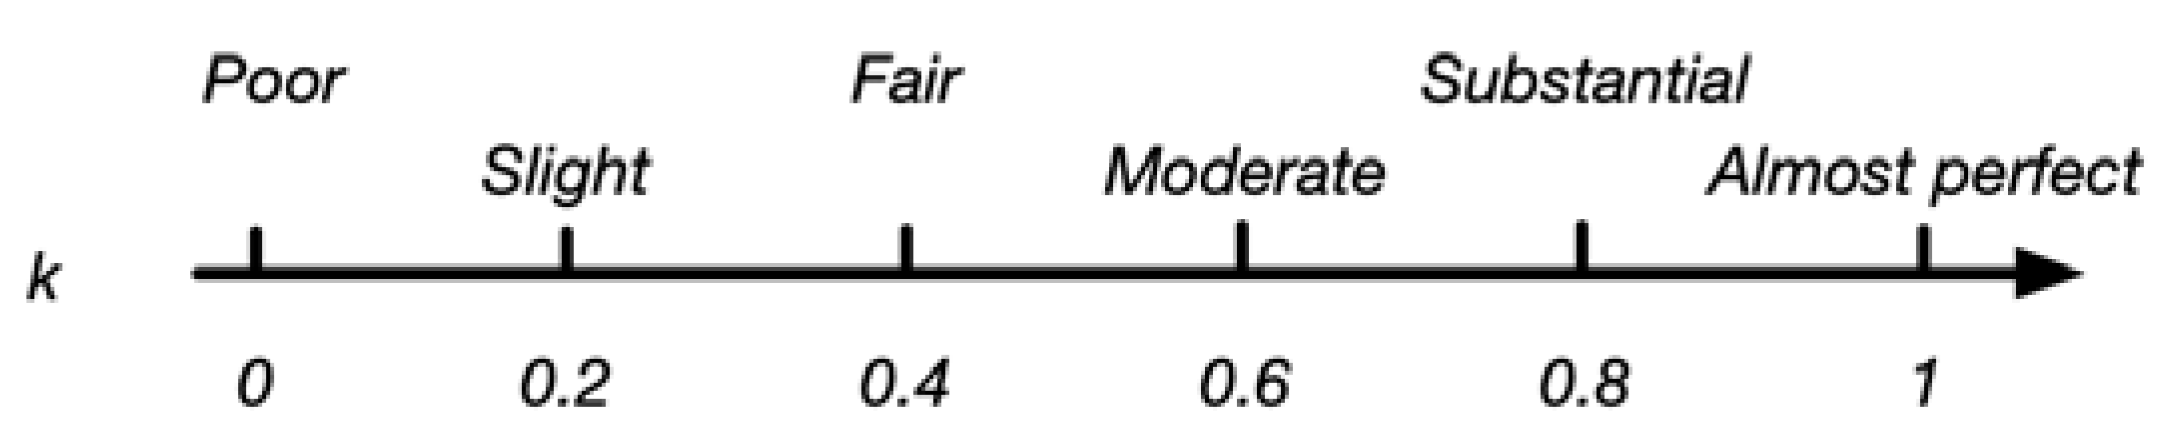
A kappa value of 1 indicates that the classification has perfect agreement with the true value, and a value of 0 indicates no agreement between the classification and ground truth (Figure 7). The errors of commission, representing a measure of false-positives, and errors of omission, representing a measure of false-negatives, were also calculated to evaluate the classifiers. Regional classification methods including k-means, SVM, MD, ML, and MHD were compared to the PBP classification method based on overall classification accuracy, the kappa coefficient, and errors of commission and omission.
2.7. Test of PBP Fungicide Treatment in the Field
An in-furrow, at-planting spray application is the most common way to apply the Topguard Terra (FMC Agricultural Solutions, Philadelphia, PA, USA) fungicide (flutriafol) that is licensed for treatment of CRR. The continuous application of the fungicide over the top of seeds as they are planted treats not only soil close to the seed, but also a length of soil between seeds that may not need treatment. This process may result in applying more product than necessary, so it is important to determine whether applying the fungicide to individual seeds or plants is effective. To test whether PBP fungicide treatment is effective in protecting cotton plants from CRR infection, a stem-drench treatment—also proven in research trials to be an effective application method—was used in place of the at-planting application method. Specifically, the fungicide spray solution was applied to the stem of the cotton plant and a small amount of soil surrounding the stem. An 18.3 × 30.5 m (60 × 100 ft) test plot in field region PL was used to conduct this experiment.
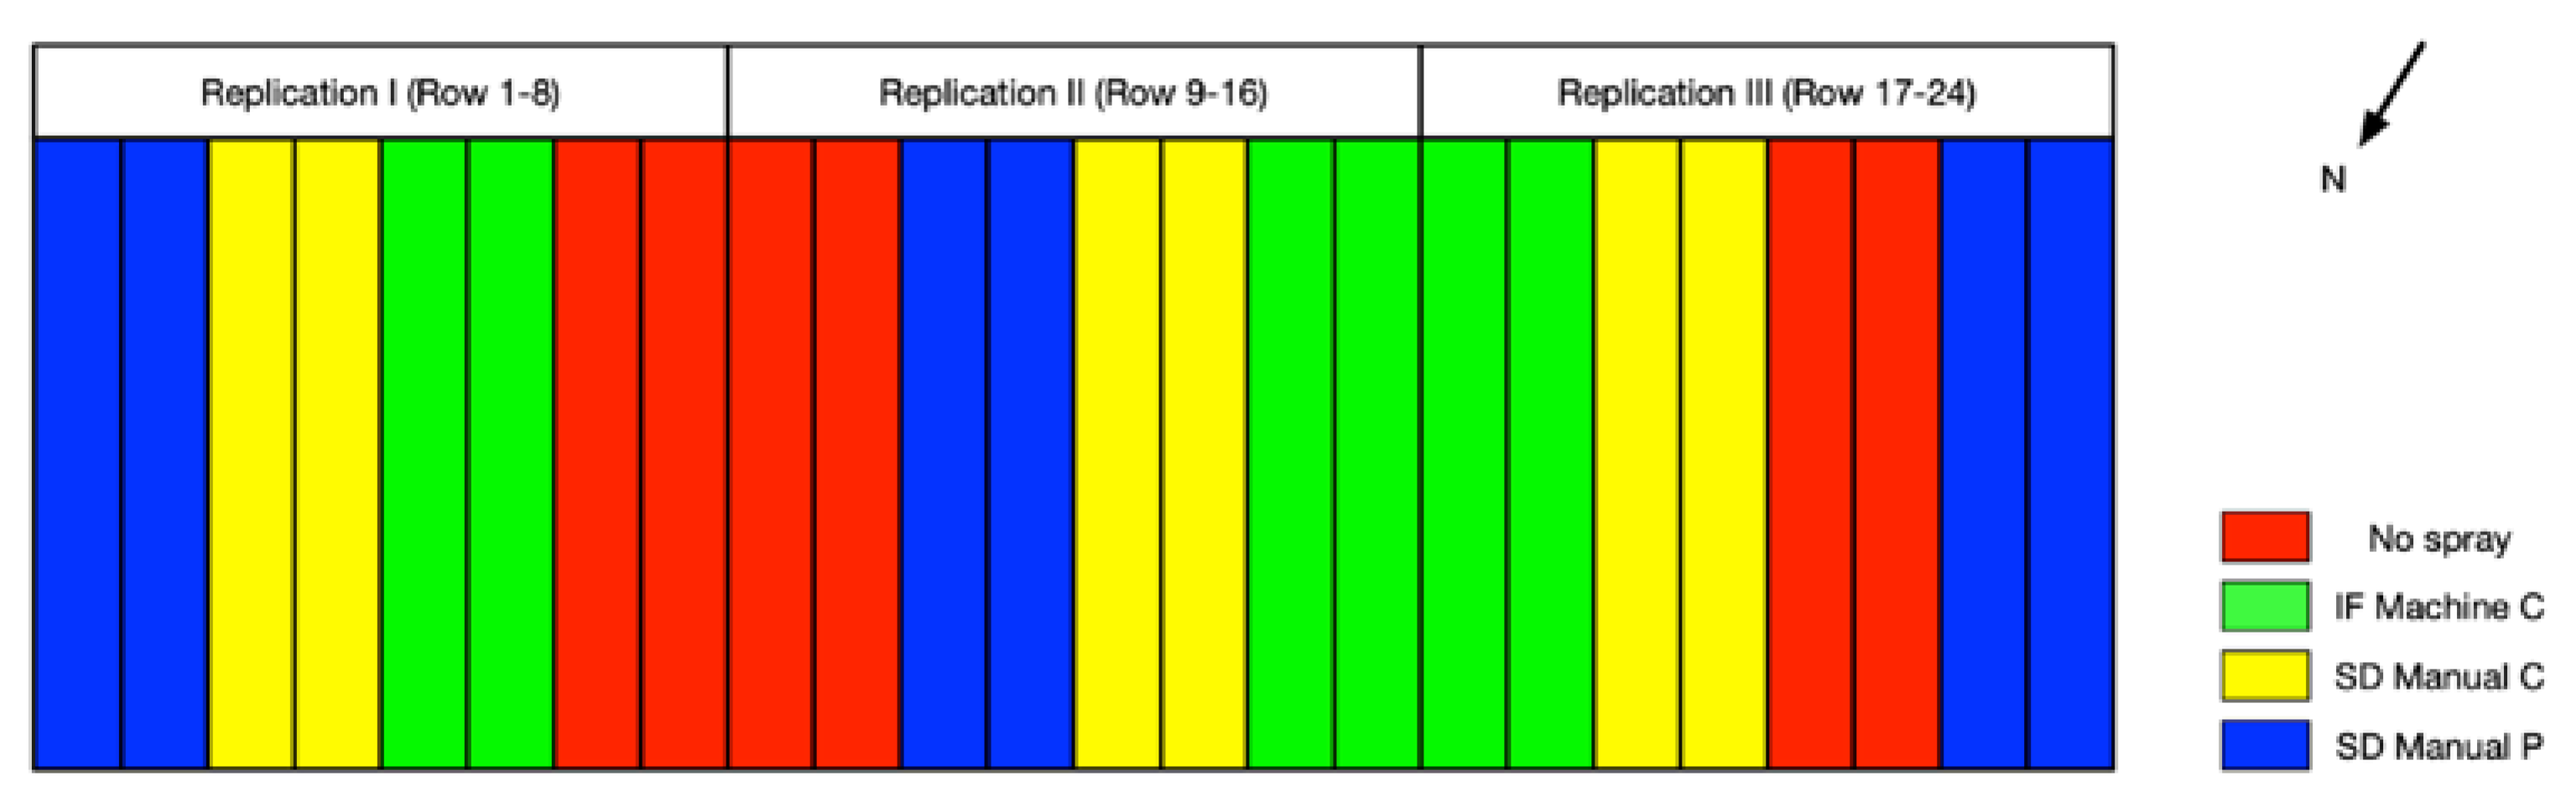
Four treatments were applied: (1) a conventional at-planting treatment of in-furrow continuous spray over the top of planted seeds, applied with a tractor-pulled planter; (2) a stem-drench continuous spray, applied manually with a backpack sprayer; (3) a stem-drench pulsed spray on individual plants, applied manually with a backpack sprayer; (4) a no-fungicide control. The experiment had 24 rows (Figure 8) of 100 ft (30.48 m) in length, with an adjacent pair of rows receiving a treatment, and three replications per treatment, arranged in a randomized complete block design. For the two continuous-spray treatments, Topguard Terra was applied at 0.675 g active ingredient in 216 mL per 30.5 m (100 ft) of row length. This rate is equivalent to the labeled application rate of 237 mL (8 fluid oz.) formulation in 37.9 L (10 gal.) of water applied to 0.405 ha (1.0 ac.).
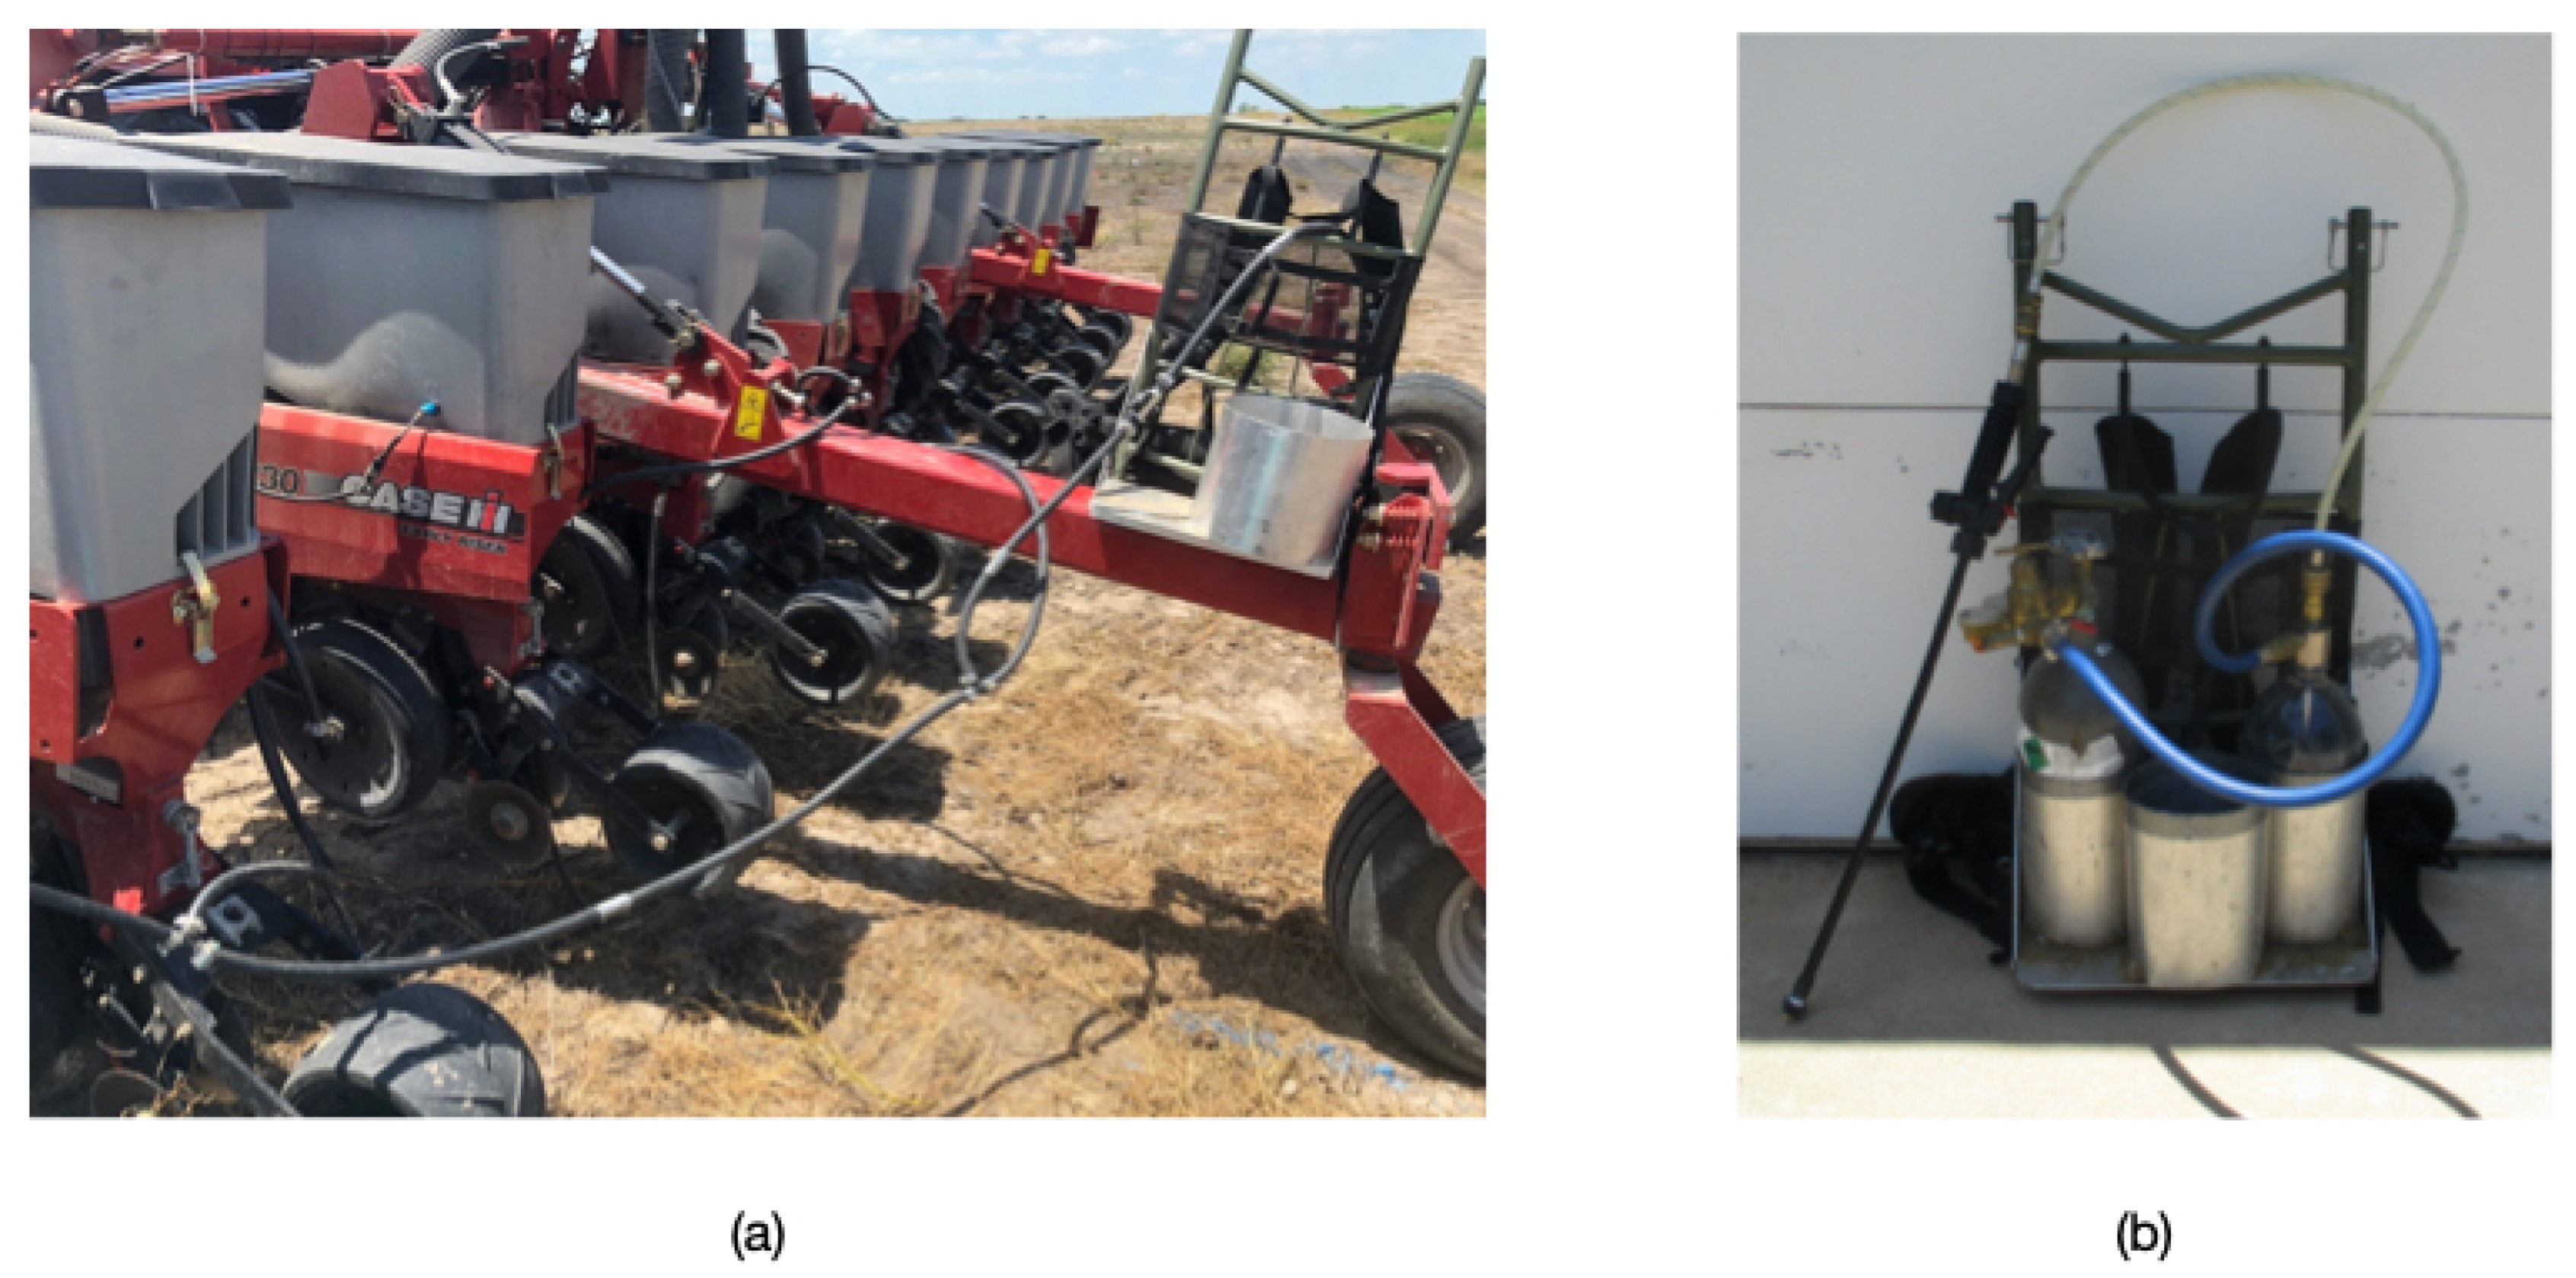
A CASE IH 1230 12-row Early Riser planter (Case Corp., Wisconsin, USA) with 76.2 cm (30-inch) row spacing was used for seeding of all treatments and the application of the in-furrow fungicide treatment (Figure 9a). The seeding rate of Phytogen 490 cotton seed was roughly 45,000 per 0.405 ha (1.0 ac.). For the manual continuous-spray and pulsed stem-drench treatments, a pressurized CO2 backpack sprayer was used (Figure 9b) with a pressure of 241 kPa (35.0 psi). Plots were planted and the in-furrow treatment was applied at planting on May 10, 2018. The soil temperature was 34 °C (94 °F).
The manual continuous and pulsed stem-drench spray treatments were applied when the cotton plants were at the four true leaf growth stage, on June 6, 2018. Spray was applied close to the stems at a height of 2–3 cm above the ground. With the pulse treatment, the volume of water containing the fungicide applied to the rows varied depending upon plant stand and spacing, with an average of 268 mL per 30.5 m (100 ft) of row; the application range was 160–450 mL. In other words, 1.67 mL of flutriafol (active ingredient) was used on average per 30.5-m-length of cotton plant row, and the actual flutriafol application range was 1.00–2.80 mL. For comparison, in-furrow planting consumed 1.68 mL flutriafol per 30.5-length of row. The experiment was repeated in 2019 with a reduction in fungicide application rate. An average of 122 mL of fungicide (0.67 mL flutriafol) was used per row for stem drench pulse spray treatment in 2019 (range: 60–130 mL).
3. Results
3.1. Plant-by-Plant Classification
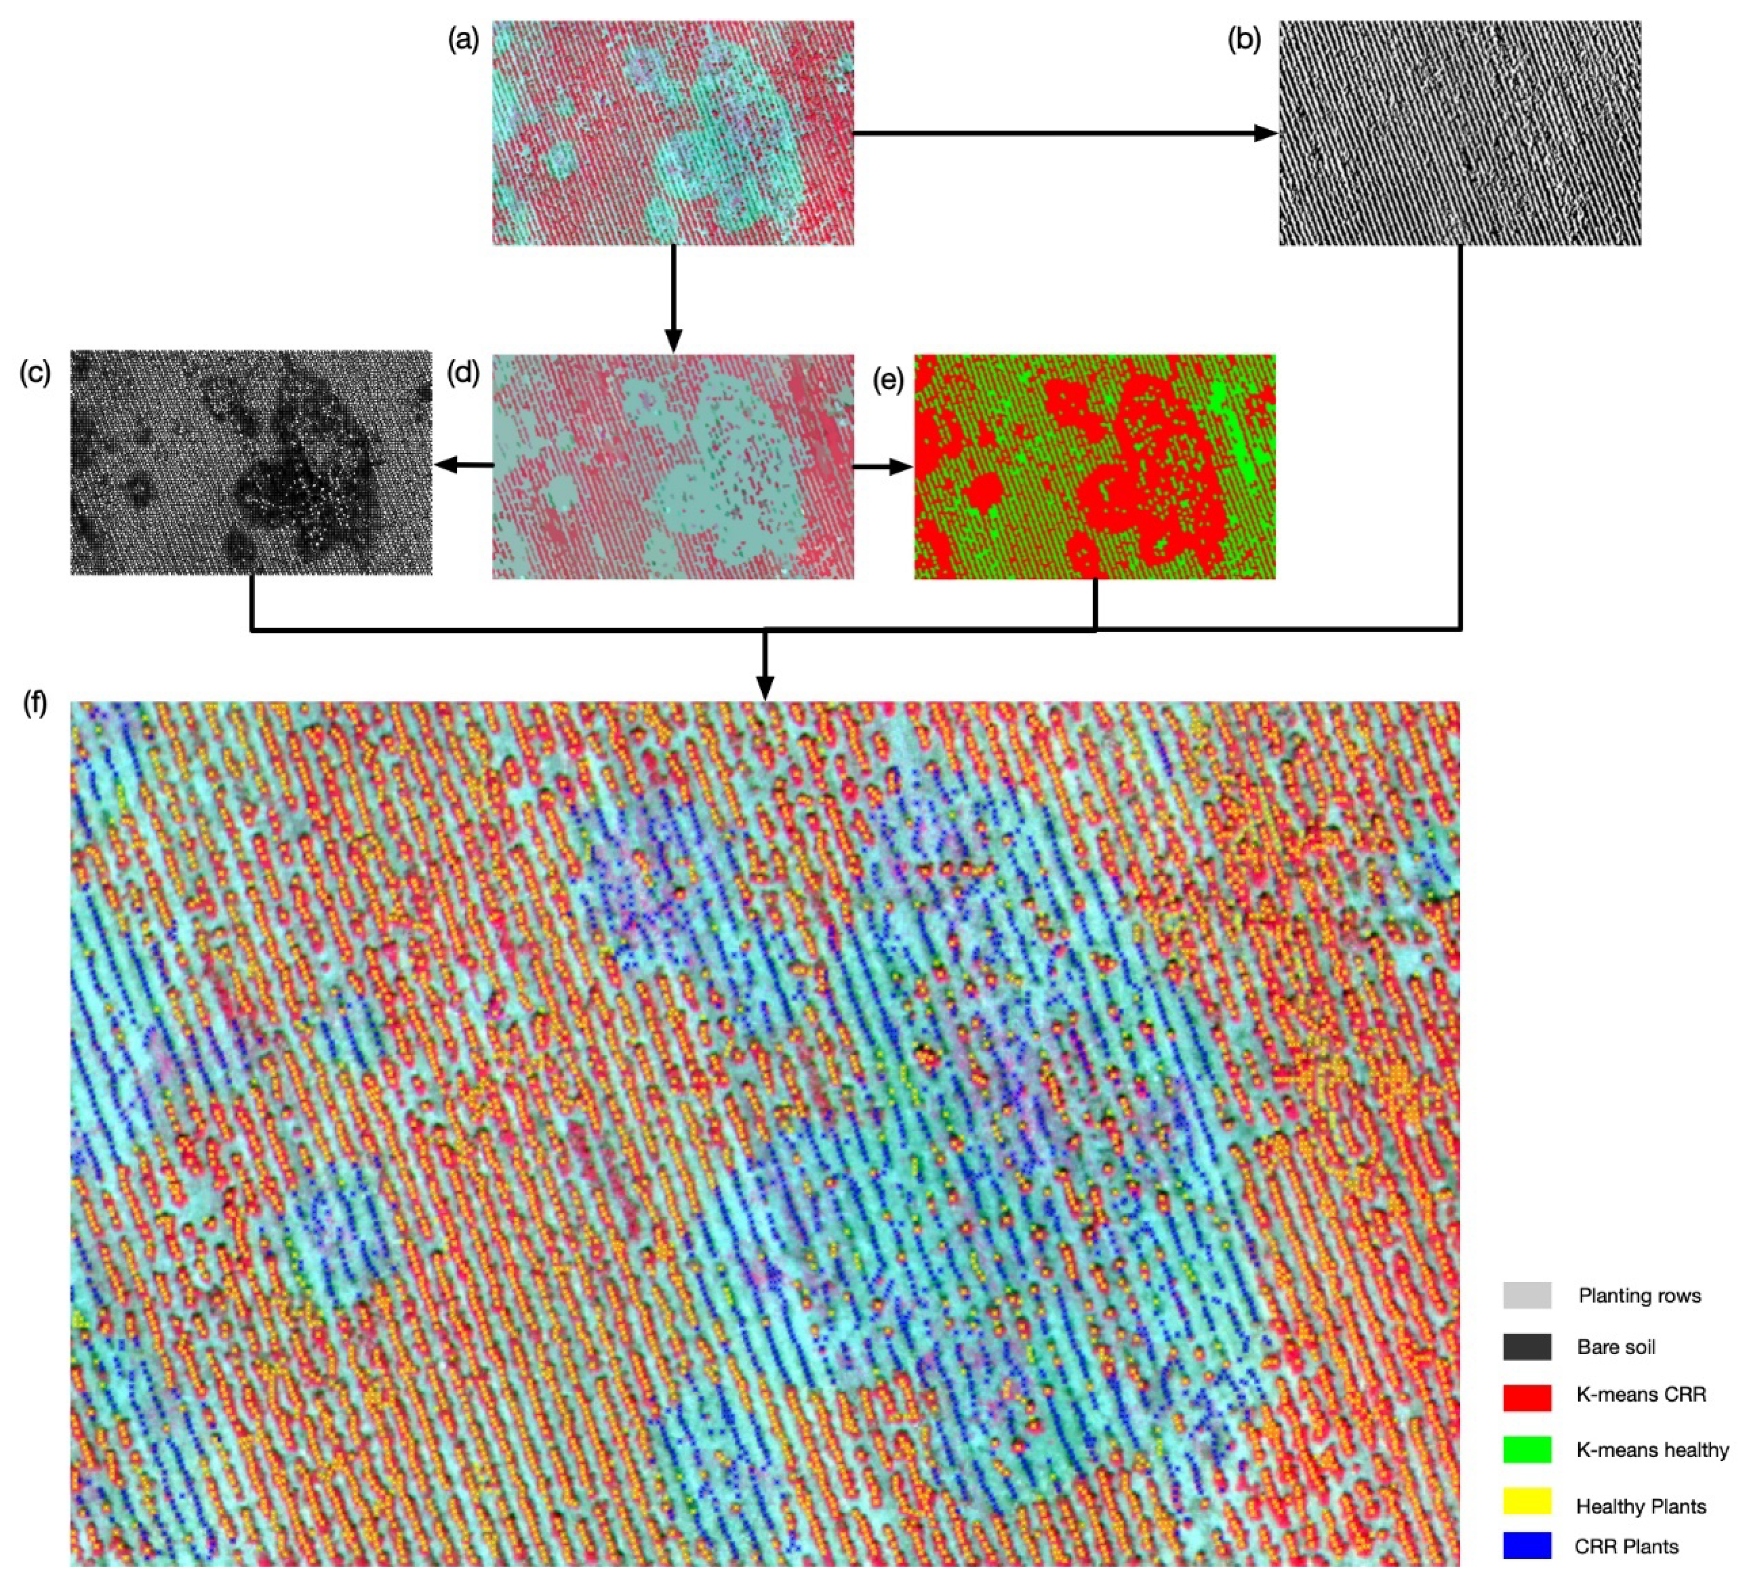
One example (Region CH2) of the progression of the image processing results from each step in the PBP classification method is shown in Figure 10. The raw image (Figure 10a) gradient was calculated to identify the planting rows (Figure 10b). SLIC Superpixel segmentation was applied to the gradient map to determine possible locations of individual plants (Figure 10c). The original pixels of the raw image were aggregated into larger superpixels (Figure 10d) to identify individual plant locations. The k-means algorithm was applied to the superpixels to generate a two-class regional classification (Figure 10e). The final result of PBP classification is shown in Figure 10f, in which each individual healthy plant is marked with a yellow point, and each CRR-infected plant is marked with a blue point.
The accuracy assessment of PBP classification showed that it is a highly accurate method of differentiating between healthy and CRR-infected plants at the individual-plant level. In Region CH2, the PBP classification had the highest overall accuracy of 95.94%, as well as the highest kappa coefficient of 0.8617, which indicated very strong agreement between classification and ground-truth data (Table 2). Table 2 is the confusion matrix for PBP classification applied to Region CH2. Over 11,000 plants identified by the PBP algorithm in CH2 were evaluated, and about 82% of those were identified as healthy according to ground-truth data. About 13.1% of the healthy plants were misclassified as CRR-infected (overclassification), while about 9.5% of the actually CRR-infected plants were misclassified as healthy (underclassification).
The PBP classifications were also generated for CH1, WP, and SH. In CH1, the PBP algorithm achieved an overall accuracy of 93.5%, a kappa coefficient of 0.7848, an error of commission of 16.1%, and an error of omission of 18.6%. In SH, the PBP algorithm also had a high accuracy of 90.6% with a kappa coefficient of 0.7494. The errors of commission and omission were 12.2% and 8.5%, respectively. Compared to the other regions, WP had the lowest accuracy of 88.4%, but even this level would typically be acceptable for field application. The kappa coefficient, error of commission, and error of omission for WP were 0.6048, 20.9%, and 26.8%, respectively.
3.2. Comparison to Regional Classifications
Thirty-six confusion matrices were generated from the results of the nine overall classification methods as applied to the four field regions. These confusion matrices are summarized in Table 3. The two-class k-means classifier identified CRR-infected cotton plants in the image automatically, but the overall accuracy averaged only 77.5%. The kappa coefficient of 0.491 also indicated relatively weak agreement between the classification and ground-truth data. The error of commission of 46% indicated that almost half the plants classified as CRR-infected were overclassified. Manually combining three-class, five-class, and 10-class k-means classifications improved the overall accuracy to 83.5%, 84.4%, and 84.1%, respectively. The kappa coefficients also increased to 0.547, 0.552, and 0.576, respectively, indicating moderate agreement between classification and ground truth. However, it must be noted that combining classes required expertise from and implementation by the user, meaning that the ideal of automated processing was not realized.
Using supervised classifiers including SVM, MD, ML, and MHD increased the overall accuracy to 86.3%, 85.7%, 86.5%, and 87.7%, respectively. All of these classifiers performed significantly better (α = 0.05) than two-class k-means in overall accuracy. The kappa coefficients for these classifiers were 0.659, 0.636, 0.667, and 0.786, respectively. While supervised classifiers performed better than the unsupervised and semi-supervised classifiers, they did not perform as well as the PBP classifier, and it must be noted that these also need human intervention, specifically for selection of training data based on subjective judgment.
The PBP classification method averaged 92.1% overall accuracy, by far the best among all classifiers considered. This accuracy level was significantly higher (α = 0.05) than that of the unsupervised and combined unsupervised classifiers. The average kappa coefficient was 0.786, indicating strong agreement between the classifications and ground truth, and this value was significantly better (α = 0.05) than that of all the other classifiers considered. The average errors of commission and omission, 15.56% and 15.85%, were also the lowest in the overall comparison group.
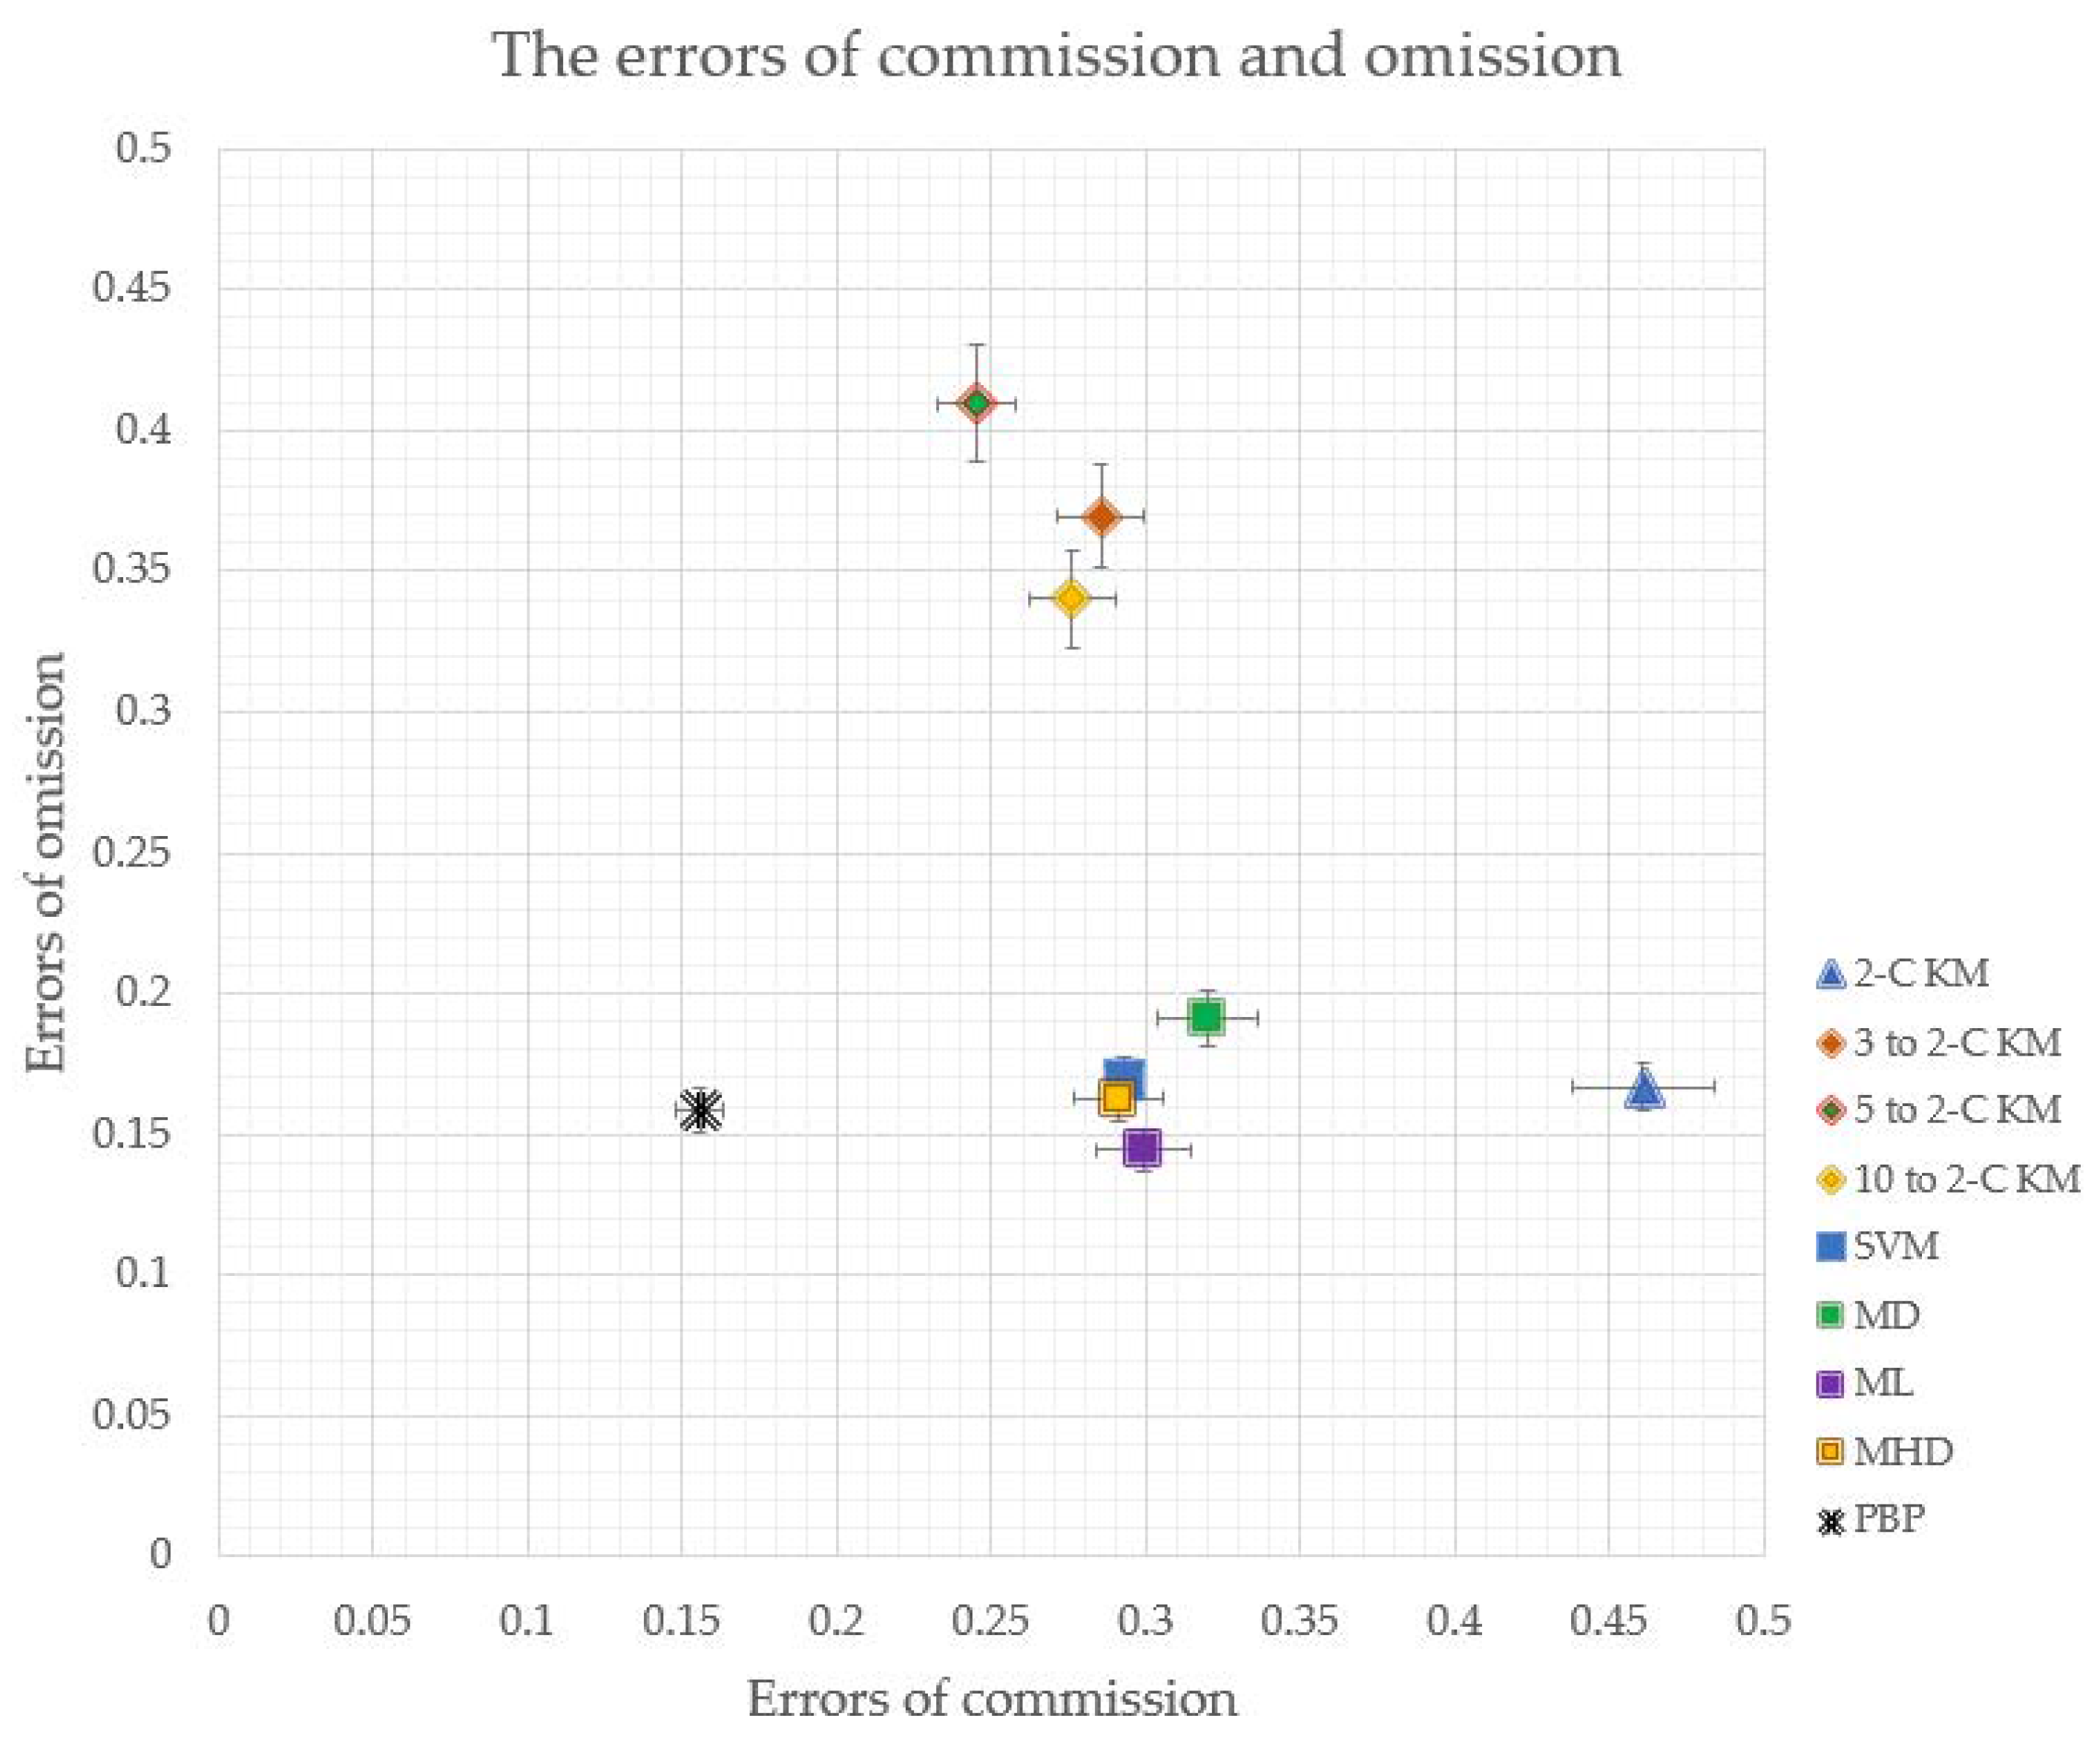
A comparison chart of the errors of commission and omission is shown in Figure 11. Theoretically, the ideal classifier, which has 100% accuracy and thus no errors of commission or omission, should be located at the origin of this coordinate system. The PBP classifier is the one closest to the origin by far, indicating that it clearly performed the best in terms of overall accuracy. It is worth noting here that in the aforementioned related prior study [38], two methods proposed to take advantage of the high resolution of UAV images, k-means plus support vector machine (KMSVM) and k-means segmentation (KMSEG), were evaluated with only regions CH1, WP, and SH. The two methods had approximately 22% and 16% error of commission and 18% and 11% of error of omission, respectively. The KMSEG classifier, which is a fully automated regional classifier, generated similar results to the PBP classifier on a somewhat different data set. Both KMSEG and KMSVM are regional classifiers that were designed to take advantage of the morphological information available in high-resolution UAV images. Thus, like the PBP classifier, they were meant as improvements over traditional regional classifiers. The added advantage of the PBP classifier is that it is designed to classify individual plants, a tremendous advantage when subsequently applying fungicide on a PBP basis.
3.3. Test of Method of Fungicide Application for CRR Control
In the study on fungicide application methods, the application of Topguard Terra generally reduced the incidence of CRR compared to the control (Table 4), as expected. The manually pulsed stem-drench treatment had the lowest plant mortality among the treatments, but the difference from the other two fungicide treatments was not significant. While in most years, the portion of the field (PL) used in this experiment eventually approaches 100% mortality from CRR, the dry weather in 2018, the first year this study was conducted, resulted in low severity of CRR. Assuming a 5% significance level, there was no statistically significant difference among all the treatments. However, the pulsed stem-drench (i.e., PBP) treatment would be considered significantly better than the no-spray control treatment if a 15% level of significance were assumed. While this is an uncommonly weak significance level, it is reasonable to believe that all three methods of applying fungicide, including the PBP method, offered some protection against CRR. Due to even drier conditions in 2019 than 2018, no CRR development was observed during the experiment, so efficacy could not be assessed in 2019.
4. Discussion
In this study, the errors of commission represent the percentage of plants over-classified into the CRR category. The errors of omission represent the percentage of CRR-infected plants misclassified as healthy plants. From an economics perspective, omission plays a more important role than commission for CRR detection, because over-spraying of fungicide caused by over-classification would likely cost less than the loss of CRR-infected plants that could have been protected. The zones with weeds growing on bare soil, very possibly next to a dead cotton plant, contributed to the errors of omission. While not necessarily critical, it should be noted that the errors of commission were commonly observed at zones where bare soil was evident where there was no CRR-infected plant. The mixed pixels of soil, plant leaves, and shadow of plants, which were commonly present at the boundaries between healthy and infested zones, also caused a large number of errors of commission and omission with the regional classifiers, because the mixed pixels do not represent the reflectance information from a single object.
The homogeneity of the field could also affect the classification accuracy. Regions CH1 and CH2 were from the same cotton field, and the images of them were from the same flight mission. The patterns of planting and disease as well as the reflectance information were similar, and the lighting conditions were the same. The main difference between the regions was that CH2 was smaller than CH1. The results of classification in CH2 were better than in CH1 in most cases, especially for unsupervised classification. One reason is that unsupervised classification clusters data into different classes based on the “otherness” of data. Once the sample size becomes larger, more diverse data besides healthy and infected cotton are introduced into the field of view, such as a concrete road, power line, pond, or other objects. All of this “noise” can reduce the accuracy of classifiers. A prerequisite for an accurate automated classification is to have images consisting of only rows of cotton plants. All the classifiers had relatively low accuracies on Region WP compared to the other three regions. It is possible this was because the planter experienced mis-seeding during planting, causing a narrow and long “dead zone” consisting mainly of bare soil. Manual manipulation can be used as postprocessing to correct the misclassification from mis-seeding, but it violates the intent of automation in classification. Morphological image processing tools such as erosion and dilation could be introduced in the future to improve the performance of differentiating mis-seeding from cotton root rot while maintaining the automation of classification [38].
Comparing regional and PBP classifications is challenging because regional classification is based on pixels while PBP classification is based on individual plants. To make the comparison even more convincing, the classifications should ideally be evaluated with the same protocols. Comparing pixel differences between all classifications (PBP and regional classifications) and the same ground-truth map is a fair way to evaluate and compare classifications, but it is not readily done when the classifiers produce different types of maps as results. The PBP classifier output a vector point map, whereas the regional classifiers output raster maps, so the comparisons to the ground-truth map had to be done with different methods appropriate to each form of data.
In the comparison of fungicide application methods, the results should be validated by further study, as the disease pressure was low in both years due to dry weather conditions. However, the experiment did substantially support the concept of pulse application to reduce fungicide use. In 2018, the manual application of the pulse spray method was inefficient and actually resulted in the application of a greater amount of fungicide than the continuous spray, but in 2019, an average of 43% less fungicide was used because of improvements in the application technique. If efficacy of the fungicide holds up with that method and application rate, the overall concept of PBP detection, mapping, and fungicide application will be validated.
Considering computational requirements, the PBP algorithm required more computing time than the regional classification methods, because segmenting and locating seed positions is computationally intensive. For the 0.15-ha CH2 image, about 30 s was required to generate the classification on a 2016 Macbook Pro computer with an Intel i7-6920HQ central processing unit (CPU) and Radeon Pro 460 graphic processing unit (GPU). The PBP classification algorithm is slower than other conventional regional classification methods, but it is still acceptably fast. While a larger field might require a few hours to complete the classification, these classifications do not need to be done in real time. Rather, they can be performed between growing seasons.
As discussed previously, UAVs provide much higher resolution (decimeter level to centimeter-level) remote sensing data than manned aircraft or satellites (meter level). This study intended to explore how to make use of the high-resolution data in CRR detection in the creation of PBP prescription maps. The application of fungicide at the PBP level is clearly possible from a technological standpoint. Wilkerson et al. tested a seed-specific in-furrow fungicide application system and found that the system could achieve as high as 95% accuracy for seed-specific treatment in cotton [44]. However, identifying, predicting, locating, and treating the disease at the PBP level are the obstacles to high-precision treatment of CRR, as well as other plant diseases. This study shows that CRR-infected plants in the current season can be individually identified with high accuracy, and PBP fungicide treatment appears to be effective in controlling CRR. The remaining challenges to be investigated are (1) whether the precise location of individual CRR-infected plants is predictive for the following year, and (2) whether previously developed precision-spray technology [44] enables fungicide to be practically applied at these locations on a seed-by-seed basis.
There is no evidence to suggest that CRR can be cured once a plant is infected; the fungicide must be applied prior to disease development. Thus, PBP application of fungicide requires previous years’ data to predict CRR-infested areas in future years. The entire PBP classification process can be conducted automatically if an appropriate seeding rate is known beforehand. Management of other crop diseases that can be treated during the growing season could potentially benefit from this type of high-resolution classifier.
5. Conclusions
This study involved development and evaluation of a PBP classifier that is able to detect CRR-infected plants at the single-plant level automatically. The PBP classifier is mainly based on the Superpixel segmentation and k-means clustering algorithms. Eight conventional regional and PBP classification methods, based on UAV remote sensing image mosaics of cotton, were evaluated in four field sections with a history of CRR. Among the regional classification methods, the unsupervised two-class k-means classifier achieved an overall accuracy of 77.48%, lower than the semi-supervised (83.47–84.12%) and supervised (85.68–87.72%) classifiers but requiring less human involvement. Compared to these conventional regional classification methods, the PBP method achieved the highest overall accuracy of 92.1%, the highest kappa coefficient of 0.786, the lowest errors of commission of 15.6%, and the second-lowest errors of omission of 15.9%. Furthermore, the PBP method is able to classify the image mosaics automatically. The PBP-based fungicide treatment in the field appeared to be effective in controlling CRR infection. These results generally validate the idea of plant-level CRR treatment and suggest the likelihood of major advances in high-resolution precision agriculture practices in the future.
Author Contributions
Conceptualization, T.W. and J.A.T.; methodology, T.W., J.A.T., T.I. and C.Y.; software, T.W.; validation, T.W., J.A.T., T.I. and C.Y.; formal analysis, T.W.; investigation, T.W.; resources, J.A.T.; data curation, T.W.; writing—original draft preparation, T.W.; writing—review and editing, T.W., J.A.T., C.Y., T.I. and R.L.N.; visualization, T.W.; funding acquisition, R.L.N. All authors have read and agreed to the published version of the manuscript.
Funding
This research was funded by Cotton Incorporated, Cooperative Research Agreement number 16-233.
Acknowledgments
We thank Cody Bagnall, Lantian Shangguan, Xiongzhe Han, Xiwei Wang, and Roy Graves for helping in data collection. We thank Ryan M. Collett for helping in selection of survey fields.
Conflicts of Interest
The authors declare no conflict of interest.
References
- USDA-NASS Agricultural Statistics. 2017. Available online: https://quickstats.nass.usda.gov (accessed on 30 July 2020).
- Pammel, L.H. Root rot of cotton or “cotton blight”. Tex. Agric. Exp. Stn. Bull. 1888, 4, 450–465. [Google Scholar]
- Streets, R.B.; Bloss, H.E. Phymatotrichum root rot. Phytopathol. Monogr. 1973, 8, 1–38. [Google Scholar]
- Yang, C.; Odvody, G.N.; Fernandez, C.J.; Landivar, J.A.; Minzenmayer, R.R.; Nichols, R.L.; Thomasson, J.A. Monitoring cotton root rot progression within a growing season using airborne multispectral imagery. J. Cotton Sci. 2014, 93, 85–93. [Google Scholar]
- Yang, C.; Everitt, J.H.; Fernandez, C.J. Comparison of airborne multispectral and hyperspectral imagery for mapping cotton root rot. Biosyst. Eng. 2010, 107, 131–139. [Google Scholar] [CrossRef]
- Mahlein, A.K.; Oerke, E.C.; Steiner, U.; Dehne, H.W. Recent advances in sensing plant diseases for precision crop protection. Eur. J. Plant Pathol. 2012, 133, 197–209. [Google Scholar] [CrossRef]
- Gogoi, N.K.; Deka, B.; Bora, L.C. Remote sensing and its use in detection and monitoring plant diseases: A review. Agric. Rev. 2018, 39, 307–313. [Google Scholar] [CrossRef]
- Qin, Z.; Zhang, M. Detection of rice sheath blight for in-season disease management using multispectral remote sensing. Int. J. Appl. Earth Obs. Geoinf. 2005, 7, 115–128. [Google Scholar] [CrossRef]
- Chen, X.; Ma, J.; Qiao, H.; Cheng, D.; Xu, Y.; Zhao, Y. Detecting infestation of take-all disease in wheat using landsat thematic mapper imagery. Int. J. Remote Sens. 2007, 28, 5183–5189. [Google Scholar] [CrossRef]
- Barton, C.V.M. Advances in remote sensing of plant stress. Plant Soil 2012, 354, 41–44. [Google Scholar] [CrossRef]
- Hazaymeh, K.; Hassan, Q.K. Remote sensing of agricultural drought monitoring: A state of art review. AIMS Environ. Sci. 2016, 3, 604–630. [Google Scholar] [CrossRef]
- Gerhards, M.; Schlerf, M.; Mallick, K.; Udelhoven, T. Challenges and future perspectives of multi-/Hyperspectral thermal infrared remote sensing for crop water-stress detection: A review. Remote Sens. 2019, 11, 1240. [Google Scholar] [CrossRef] [Green Version]
- Cook, C.G.; Escobar, D.E.; Everitt, J.H.; Cavazos, I.; Robinson, A.F.; Davis, M.R. Utilizing airborne video imagery in kenaf management and production. Ind. Crops Prod. 1999, 9, 205–210. [Google Scholar] [CrossRef]
- Calvão, T.; Pessoa, M.F. Remote sensing in food production—A review. Emir. J. Food Agric. 2015, 27, 138–151. [Google Scholar] [CrossRef] [Green Version]
- Campos, I.; González-Gómez, L.; Villodre, J.; Calera, M.; Campoy, J.; Jiménez, N.; Plaza, C.; Sánchez-Prieto, S.; Calera, A. Mapping within-field variability in wheat yield and biomass using remote sensing vegetation indices. Precis. Agric. 2019, 20, 214–236. [Google Scholar] [CrossRef]
- Matese, A.; Toscano, P.; Di Gennaro, S.F.; Genesio, L.; Vaccari, F.P.; Primicerio, J.; Belli, C.; Zaldei, A.; Bianconi, R.; Gioli, B. Intercomparison of UAV, aircraft and satellite remote sensing platforms for precision viticulture. Remote Sens. 2015, 7, 2971–2990. [Google Scholar] [CrossRef] [Green Version]
- Yang, C.; Greenberg, S.M.; Everitt, J.H.; Fernandez, C.J. Assessing cotton defoliation, regrowth control and root rot infection using remote sensing technology. Int. J. Agric. Biol. Eng. 2011, 4, 1–11. [Google Scholar]
- Taubenhaus, J.J.; Ezekiel, W.N.; Neblette, C.B. Airplane photography in the study of cotton root rot. Phytopathology 1929, 19, 1025–1029. [Google Scholar]
- Nixon, P.R.; Lyda, S.D.; Heilman, M.D.; Bowen, R.L. Incidence and control of cotton root rot observed with color infrared photography. MP Tex. Agric. Exp. Stn. 1975, 1241, 4. [Google Scholar]
- Nixon, P.R.; Escobar, D.E.; Bowen, R.L. A multispectral false-color video imaging system for remote sensing applications. In Proceedings of the 11th Biennial Workshop on Color Aerial Photography and Videography in the Plant Sciences and Related Fields, Weslaco, TX, USA, 1 September 1987; pp. 295–305. [Google Scholar]
- Yang, C.; Odvody, G.N.; Fernandez, C.J.; Landivar, J.A.; Minzenmayer, R.R.; Nichols, R.L. Evaluating unsupervised and supervised image classification methods for mapping cotton root rot. Precis. Agric. 2015, 16, 201–215. [Google Scholar] [CrossRef]
- Gogineni, S.; Thomasson, J.A.; Iqbal, J.; Wooten, J.R.; Kolla, B.M.; Sui, R. Remote sensing input to GIS-integrated cotton growth model: Preliminary results. In Proceedings of the Optical Science and Technology, the SPIE 49th Annual Meeting, Denver, CO, USA, 2 August 2004; Volume 5544, p. 186. [Google Scholar] [CrossRef]
- Yang, C.; Fernandez, C.J.; Everitt, J.H. Mapping phymatotrichum root rot of cotton using airborne three-band digital imagery. Trans. ASAE 2005, 48, 1619–1626. [Google Scholar] [CrossRef]
- Song, X.; Yang, C.; Wu, M.; Zhao, C.; Yang, G.; Hoffmann, W.C.; Huang, W. Evaluation of Sentinel-2A satellite imagery for mapping cotton root rot. Remote Sens. 2017, 9, 906. [Google Scholar] [CrossRef] [Green Version]
- Huang, Y.; Brand, H.J.; Sui, R.; Thomson, S.J.; Furukawa, T.; Ebelhar, M.W. Cotton yield estimation using very high-resolution digital images acquired with a low-cost small unmanned aerial vehicle. Trans. ASABE 2016, 59, 1563–1574. [Google Scholar]
- Yang, C.; Odvody, G.N.; Thomasson, J.A.; Isakeit, T.; Minzenmayer, R.R.; Drake, D.R.; Nichols, R.L. Site-specific management of cotton root rot using airborne and high-resolution satellite imagery and variable-rate technology. Trans. ASABE 2018, 61, 849–858. [Google Scholar] [CrossRef]
- Bagheri, N. Development of a high-resolution aerial remote-sensing system for precision agriculture. Int. J. Remote Sens. 2017, 38, 2053–2065. [Google Scholar] [CrossRef]
- Huang, Y.; Thomson, S.J.; Brand, H.J.; Reddy, K.N. Development and evaluation of low-altitude remote sensing systems for crop production management. Int. J. Agric. Biol. Eng. 2016, 9, 1–11. [Google Scholar]
- Zhou, X.; Zheng, H.B.; Xu, X.Q.; He, J.Y.; Ge, X.K.; Yao, X.; Cheng, T.; Zhu, Y.; Cao, W.X.; Tian, Y.C. Predicting grain yield in rice using multi-temporal vegetation indices from UAV-based multispectral and digital imagery. ISPRS J. Photogramm. Remote Sens. 2017, 130, 246–255. [Google Scholar] [CrossRef]
- Albetis, J.; Duthoit, S.; Guttler, F.; Jacquin, A.; Goulard, M.; Poilvé, H.; Féret, J.B.; Dedieu, G. Detection of Flavescence dorée grapevine disease using unmanned aerial vehicle (UAV) multispectral imagery. Remote Sens. 2017, 9, 308. [Google Scholar] [CrossRef] [Green Version]
- Romero, M.; Luo, Y.; Su, B.; Fuentes, S. Vineyard water status estimation using multispectral imagery from an UAV platform and machine learning algorithms for irrigation scheduling management. Comput. Electron. Agric. 2018, 147, 109–117. [Google Scholar] [CrossRef]
- Mattupalli, C.; Moffet, C.A.; Shah, K.N.; Young, C.A. Supervised classification of RGB Aerial imagery to evaluate the impact of a root rot disease. Remote Sens. 2018, 10, 917. [Google Scholar] [CrossRef] [Green Version]
- Sultani, W.; Mokhtari, S.; Yun, H.B. Automatic pavement object detection using Superpixel segmentation combined with conditional random field. IEEE Trans. Intell. Transp. Syst. 2017, 19, 2076–2085. [Google Scholar] [CrossRef]
- Zhang, S.; Zhu, Y.; You, Z.; Wu, X. Fusion of superpixel, expectation maximization and PHOG for recognizing cucumber diseases. Comput. Electron. Agric. 2017, 140, 338–347. [Google Scholar] [CrossRef]
- Zhang, S.; Wang, H.; Huang, W.; You, Z. Plant diseased leaf segmentation and recognition by fusion of superpixel, K-means and PHOG. Optik 2018, 157, 866–872. [Google Scholar] [CrossRef]
- Yang, C.; Odvody, G.N.; Thomasson, J.A.; Isakeit, T.; Nichols, R.L. Change detection of cotton root rot infection over 10-year intervals using airborne multispectral imagery. Comput. Electron. Agric. 2016, 123, 154–162. [Google Scholar] [CrossRef] [Green Version]
- Song, H.; Yang, C.; Zhang, J.; He, D.; Thomasson, J.A. Combining fuzzy set theory and nonlinear stretching enhancement for unsupervised classification of cotton root rot. J. Appl. Remote Sens. 2015, 9, 96013. [Google Scholar] [CrossRef]
- Wang, T.; Thomasson, J.A.; Yang, C.; Isakeit, T.; Nichols, R.L. Automatic Classification of Cotton Root Rot Disease Based on UAV Remote Sensing. Remote Sens. 2020, 12, 1310. [Google Scholar] [CrossRef] [Green Version]
- Achanta, R.; Shaji, A.; Smith, K.; Lucchi, A.; Fua, P.; Susstrunk, S. SLIC Superpixels; EPFL Technical Report No. 149300; EPFL: Lausanne, Switzerland, 2010; Available online: https://infoscience.epfl.ch/record/149300?ln=en (accessed on 30 July 2020).
- Achanta, R.; Shaji, A.; Smith, K.; Lucchi, A.; Fua, P.; Süsstrunk, S. SLIC Superpixels compared to state-of-the-art superpixel methods. IEEE Trans. Pattern Anal. Mach. Intell. 2012, 34, 2274–2282. [Google Scholar] [CrossRef] [Green Version]
- Haccius, C.; Hariharan, H.P.; Herfet, T.; Hach, T.; Cine, R.; Gmbh, T. Infrared-aided superpixel segmentation. In Proceedings of the 9th International Workshop on Video Processing and Quality Metrics for Consumer Electronics (VPQM), Chandler, AZ, USA, 5–6 February 2015. [Google Scholar]
- Congalton, R.G. A review of assessing the accuracy of classifications of remotely sensed data. Remote Sens. Environ. 1991, 37, 35–46. [Google Scholar] [CrossRef]
- Huang, C.; Davis, L.S.; Townshend, J.R.G. An assessment of support vector machines for land cover classification. Int. J. Remote Sens. 2002, 23, 725–749. [Google Scholar] [CrossRef]
- Wilkerson, J.B.; Hancock, J.H.; Moody, F.H.; Newman, M.A. Design of a seed-specific application system for in-furrow chemicals. Trans. ASAE 2004, 47, 537–645. [Google Scholar] [CrossRef]
Figure 1.
The study was conducted on Stiles farm located in Williamson County, central Texas. The five areas of field experiments are marked on the map.
Figure 1.
The study was conducted on Stiles farm located in Williamson County, central Texas. The five areas of field experiments are marked on the map.

Figure 2.
The images were captured from (a) a fixed-wing unmanned aerial vehicle (UAV) “TuffWing UAV Mapper” with (b) MicaSense RedEdge camera.
Figure 2.
The images were captured from (a) a fixed-wing unmanned aerial vehicle (UAV) “TuffWing UAV Mapper” with (b) MicaSense RedEdge camera.

Figure 3.
A portion of ground-truth data collected on August 25 2017. Totally, 627 ground-truth data points (in red) were recorded to delineate the boundary of some cotton root rot (CRR)-infested zones.
Figure 3.
A portion of ground-truth data collected on August 25 2017. Totally, 627 ground-truth data points (in red) were recorded to delineate the boundary of some cotton root rot (CRR)-infested zones.

Figure 4.
The PSR+ 3500 Spectroradiometer was used to collect reflectance data.

Figure 5.
Multispectral color-infrared (CIR) images for (a) Region ‘CH1’ (Scale 1:3000), (b) Region ‘CH2’ (Scale 1:2000), (c) Region ‘WP’ (Scale 1:2400), and (d) Region ‘SH’ (Scale 1:3800). The regions are shown in different scales for a better visualization of details.
Figure 5.
Multispectral color-infrared (CIR) images for (a) Region ‘CH1’ (Scale 1:3000), (b) Region ‘CH2’ (Scale 1:2000), (c) Region ‘WP’ (Scale 1:2400), and (d) Region ‘SH’ (Scale 1:3800). The regions are shown in different scales for a better visualization of details.

Figure 6.
Flow chart of unsupervised plant-by-plant (PBP) classification algorithm. CRR = cotton root rot; SLIC = simple linear iterative clustering.
Figure 6.
Flow chart of unsupervised plant-by-plant (PBP) classification algorithm. CRR = cotton root rot; SLIC = simple linear iterative clustering.

Figure 7.
The interpretation of the kappa coefficient.

Figure 8.
Plot design for testing the effectiveness of fungicide on plant-by-plant treatment. Note: IF Machine C = in-furrow machinery continuous spray, SD manual C = stem-drench manual continuous spray, and SD Manual P = stem-drench manual pulsed spray.
Figure 8.
Plot design for testing the effectiveness of fungicide on plant-by-plant treatment. Note: IF Machine C = in-furrow machinery continuous spray, SD manual C = stem-drench manual continuous spray, and SD Manual P = stem-drench manual pulsed spray.

Figure 9.
(a) A Case IH 1230 planter was used for in-furrow application; and (b) a CO2-pressurized backpack sprayer was used for manual treatments.
Figure 9.
(a) A Case IH 1230 planter was used for in-furrow application; and (b) a CO2-pressurized backpack sprayer was used for manual treatments.

Figure 10.
The imagery results getting from each step of unsupervised PBP classification algorithm. each image indicated: (a) CIR raw image, (b) the location of planting row, (c) the position of each individual plant, (d) the result of Superpixel segmentation, (e) the regional distribution of CRR-infested areas, and (f) the final result of PBP classification. In (b), planting rows are shown in light grey, and bare soil is shown in black. In (e), healthy regions are shown in green, and CRR-infested regions are shown in red. In (f), each yellow dot represents a healthy cotton plant, and each blue dot represents and a CRR-infected plant.

Figure 11.
Comparison of the errors of commission and omission among classifiers.


Table 1.
Confusion matrix to evaluate classification methods.
| Class Types Determined from Reference Source (Ground-Truth) | ||||
|---|---|---|---|---|
| Class types determined from classified map | Healthy plant | Infested plant | Totals | |
| Healthy plant | A | B | A + B | |
| Infested plant | C | D | C + D | |
| Totals | A + C | B + D | A + B + C + D | |
Table 2.
Confusion matrix of PBP classification for Region CH2.
| Class Types Determined from Reference Source (Ground-Truth) | Commission | Omission | ||||
|---|---|---|---|---|---|---|
| Class types determined from classified map | Healthy plant | Infected plant | Totals | |||
| Healthy plant | 8963 | 186 | 9149 | 186/9149 2.03% | 268/9231 2.9% | |
| Infected plant | 268 | 1771 | 2039 | 268/2039 13.14% | 186/1957 9.5% | |
| Totals | 9231 | 1957 | 11,188 | |||
Table 3.
The accuracy comparison between unsupervised, combined-unsupervised, supervised classifications, and proposed automatic regional classifications.
Table 3.
The accuracy comparison between unsupervised, combined-unsupervised, supervised classifications, and proposed automatic regional classifications.
| Overall Accuracy (%) | Kappa Coefficient | ||||||||||||
| CH1 | CH2 | WP | SH | Mean | Std. Dev. | CH1 | CH2 | WP | SH | Mean | Std. Dev. | ||
| U | 2-class KM | 71.11 | 78.60 | 78.76 | 81.44 | 77.48 a | 4.42 | 0.3826 | 0.5106 | 0.4527 | 0.6162 | 0.4905 a | 0.0988 |
| S-S | 3 to 2-class KM | 78.28 | 88.89 | 87.26 | 79.45 | 83.47 ab | 5.38 | 0.3875 | 0.6868 | 0.5751 | 0.5392 | 0.5471 ab | 0.1236 |
| 5 to 2-class KM | 76.50 | 88.67 | 88.81 | 83.49 | 84.37 ab | 5.80 | 0.4232 | 0.6085 | 0.5293 | 0.6452 | 0.5516 ab | 0.0983 | |
| 10 to 2-class KM | 76.36 | 90.97 | 88.01 | 81.14 | 84.12 ab | 6.61 | 0.4264 | 0.6986 | 0.5885 | 0.5911 | 0.5762 ab | 0.1122 | |
| S | SVM | 87.04 | 92.02 | 78.66 | 87.48 | 86.30 bc | 5.57 | 0.6962 | 0.7587 | 0.4481 | 0.7345 | 0.6594 ab | 0.1432 |
| MD | 85.65 | 88.12 | 86.14 | 82.79 | 85.68 bc | 2.20 | 0.6721 | 0.6753 | 0.5604 | 0.6346 | 0.6356 ab | 0.0534 | |
| ML | 88.55 | 91.71 | 77.92 | 87.65 | 86.46 bc | 5.95 | 0.7342 | 0.7498 | 0.4419 | 0.7422 | 0.6670 ab | 0.1502 | |
| MHD | 87.89 | 89.60 | 87.13 | 86.27 | 87.72 bc | 1.42 | 0.7238 | 0.7076 | 0.5764 | 0.7144 | 0.6806 bc | 0.0698 | |
| P | PBP | 93.52 | 95.94 | 88.43 | 90.64 | 92.13 c | 3.28 | 0.7848 | 0.8617 | 0.6048 | 0.7494 | 0.7855 c | 0.0746 |
| Errors of Commission (%) | Errors of Omission (%) | ||||||||||||
| CH1 | CH2 | WP | SH | Mean | Std. Dev. | CH1 | CH2 | WP | SH | Mean | Std. Dev. | ||
| U | 2-class KM | 49.89 | 50.43 | 56.88 | 27.16 | 46.09 a | 13.01 | 26.72 | 7.84 | 14.10 | 18.00 | 16.67 a | 7.90 |
| S-S | 3 to 2-class KM | 26.46 | 30.04 | 40.17 | 17.43 | 28.53 ab | 9.40 | 60.87 | 17.22 | 28.28 | 41.43 | 36.95 b | 18.77 |
| 5 to 2-class KM | 40.18 | 14.26 | 24.23 | 19.36 | 24.51 ab | 11.21 | 42.32 | 44.58 | 51.63 | 25.30 | 40.96 b | 11.17 | |
| 10 to 2-class KM | 40.83 | 10.85 | 37.51 | 21.20 | 27.60 ab | 14.08 | 40.57 | 34.95 | 29.83 | 30.73 | 34.02 b | 4.90 | |
| S | SVM | 25.38 | 18.50 | 57.07 | 16.18 | 29.28 ab | 18.93 | 16.21 | 19.66 | 15.04 | 16.69 | 16.90 a | 1.97 |
| MD | 29.17 | 32.90 | 43.70 | 22.15 | 31.98 ab | 9.00 | 14.13 | 14.48 | 24.71 | 23.19 | 19.13 a | 5.60 | |
| ML | 23.85 | 19.38 | 57.88 | 18.53 | 29.91 ab | 18.79 | 11.92 | 20.17 | 13.23 | 12.39 | 14.43 a | 3.87 | |
| MHD | 26.13 | 28.74 | 40.79 | 20.73 | 29.10 ab | 8.48 | 9.91 | 15.18 | 26.86 | 13.25 | 16.30 a | 7.37 | |
| P | PBP | 16.06 | 13.14 | 20.88 | 12.16 | 15.56 b | 3.91 | 18.59 | 9.5 | 26.80 | 8.51 | 15.85 a | 8.60 |
Note: U = unsupervised, S-S = semi-supervised, S = supervised, P = proposed method, KM = k-means, MD = minimum distance, ML = maximum likelihood, MHD = Mahalanobis distance, PBP = plant-by-plant. Letters a, b, and c in Column Mean indicate statistical different groups (α = 0.05, Duncan test).
Table 4.
Effect of Topguard Terra application method on CRR (% mortality) in the 2018 experiment.
| Method * | Replication 1 | Replication 2 | Replication 3 | Mean ** |
|---|---|---|---|---|
| No spray | 4.79 | 0.32 | 7.69 | 4.27 a |
| In-furrow | 3.92 | 0.57 | 0.98 | 1.83 ab |
| Stem Drench C | 0.00 | 2.45 | 2.17 | 1.54 ab |
| Stem Drench P | 0.62 | 1.42 | 1.05 | 1.03 b |
* C = continuous application, P = pulse application. ** The different letters indicate statistically different groups (α = 0.15, Duncan test).
© 2020 by the authors. Licensee MDPI, Basel, Switzerland. This article is an open access article distributed under the terms and conditions of the Creative Commons Attribution (CC BY) license (http://creativecommons.org/licenses/by/4.0/).
Share and Cite
MDPI and ACS Style
Wang, T.; Thomasson, J.A.; Isakeit, T.; Yang, C.; Nichols, R.L. A Plant-by-Plant Method to Identify and Treat Cotton Root Rot Based on UAV Remote Sensing. Remote Sens. 2020, 12, 2453. https://0-doi-org.brum.beds.ac.uk/10.3390/rs12152453
AMA Style
Wang T, Thomasson JA, Isakeit T, Yang C, Nichols RL. A Plant-by-Plant Method to Identify and Treat Cotton Root Rot Based on UAV Remote Sensing. Remote Sensing. 2020; 12(15):2453. https://0-doi-org.brum.beds.ac.uk/10.3390/rs12152453
Chicago/Turabian StyleWang, Tianyi, J. Alex Thomasson, Thomas Isakeit, Chenghai Yang, and Robert L. Nichols. 2020. "A Plant-by-Plant Method to Identify and Treat Cotton Root Rot Based on UAV Remote Sensing" Remote Sensing 12, no. 15: 2453. https://0-doi-org.brum.beds.ac.uk/10.3390/rs12152453
Note that from the first issue of 2016, this journal uses article numbers instead of page numbers. See further details here.