Article

Effects of Winter Snow Cover on Spring Soil Moisture Based on Remote Sensing Data Product over Farmland in Northeast China

1
Key Laboratory of Digital Earth Science, Aerospace Information Research Institute, Chinese Academy of Sciences, Beijing 100094, China
2
Northeast Institute of Geography and Agroecology, Chinese Academy of Sciences, Changchun 130102, China
3
University of Chinese Academy of Sciences, Beijing 100049, China
4
College of Surveying and Geo-Informatics, North China University of Water Resources and Electric Power, Zhengzhou 450045, China
*
Author to whom correspondence should be addressed.
Remote Sens. 2020, 12(17), 2716; https://0-doi-org.brum.beds.ac.uk/10.3390/rs12172716
Submission received: 28 June 2020 / Revised: 12 August 2020 / Accepted: 17 August 2020 / Published: 22 August 2020
(This article belongs to the Special Issue Recent Advances in Cryospheric Sciences)

Abstract

:
Spring soil moisture (SM) is of great importance for monitoring agricultural drought and waterlogging in farmland areas. While winter snow cover has an important impact on spring SM, relatively little research has examined the correlation between winter snow cover and spring SM in great detail. To understand the effects of snow cover on SM over farmland, the relationship between winter snow cover parameters (maximum snow depth (MSD) and average snow depth (ASD)) and spring SM in Northeast China was examined based on 30 year passive microwave snow depth (SD) and SM remote-sensing products. Linear regression models based on winter snow cover were established to predict spring SM. Moreover, 4 year SD and SM data were applied to validate the performance of the linear regression models. Additionally, the effects of meteorological factors on spring SM also were analyzed using multiparameter linear regression models. Finally, as a specific application, the best-performing model was used to predict the probability of spring drought and waterlogging in farmland in Northeast China. Our results illustrated the positive effects of winter snow cover on spring SM. The average correlation coefficient (R) of winter snow cover and spring SM was above 0.5 (significant at a 95% confidence level) over farmland. The performance of the relationship between snow cover and SM in April was better than that in May. Compared to the multiparameter linear regression models in terms of fitting coefficient, MSD can be used as an important snow parameter to predict spring drought and waterlogging probability in April. Specifically, if the relative SM threshold is 50% when spring drought occurs in April, the prediction probability of the linear regression model concerning snow cover and spring SM can reach 74%. This study improved our understanding of the effects of winter snow cover on spring SM and will be beneficial for further studies on the prediction of spring drought.

Graphical Abstract

1. Introduction

Soil moisture (SM) is an essential element of the earth’s ecosystem. As an important indicator for monitoring agricultural drought and waterlogging, spring SM especially has significant implications for seed germination and agricultural production [1], and agriculture is therefore significantly vulnerable to associated hazards when spring SM over farmland is abnormal (e.g., exceeding or less than the suitable SM for seed germination). In most cold regions, because of the accumulation of water in the snowpack in winter and its subsequent release during the springtime snowmelt, snow cover is an important source of spring SM and increases spring SM. Spring agricultural water supply in arid or semiarid regions with abundant snow in winter mainly comes from snowmelt runoff [2,3], underscoring the nonnegligible impact of winter snow cover on spring SM. In the context of global climate change and uneven distribution of water resources in China, snow water resources should be given full attention and rationally used. Therefore, estimating the contribution of winter snow cover to spring SM is critical for agricultural water resource management. Furthermore, exploring the relationship between winter snow cover and spring SM can effectively urge policy departments to formulate immediate adaptation and mitigation measures based on winter snow cover in order to reduce agricultural hazards.
The importance of snow cover and SM to microclimate has long been recognized, and these are always applied in drought estimation [4,5]. Most previous research has focused on snow–ground thermal interactions. For example, Walsh et al. [6] assessed the impacts of snow cover and SM on temperature according to the observed snow cover, the computed SM index, and the station temperature. Goodrich [7] reported that seasonal snow cover could result in an increase in mean annual ground temperatures in permafrost. Zhang [8] demonstrated the characteristics of seasonal snow cover and reviewed the studies concerning its impacts on the ground temperature. Li et al. showed the effects of snow cover on the ground thermal regime. Several studies have been conducted with respect to the effect of snow cover and SM. Ambadan et al. [3] assessed the influence of snowmelt and initial snow water equivalent uncertainty on SM anomaly and its memory. Shinoda [9] indicated the yearly maximum snow depth has a significate impact on SM. However, relatively little research has examined the correlation between winter snow cover and spring SM in great detail, or attempted to predict spring SM with the information of snow cover. The change of SM during spring is closely associated with winter snow cover conditions. Additionally, the methods used previously have been mostly based on single-point models in general and are limited to small scales. The obtained conclusions are essentially mostly qualitative. The data used in the calculations are from weather stations or measurements, and it is time-consuming as well as difficult to achieve regional-scale results. Remote sensing has been proven to be an efficient method to monitor snow depth (SD) and SM at the global and regional scales, and some corresponding data products have been provided to the public [10,11,12,13]. It is convenient and relevant to use these remote-sensing products to study the impact of snow cover on spring SM for preparing farmland in advance and realizing the prediction of spring drought and waterlogging on a large scale.
The spring drought occurs during the period between the sowing of spring maize to the growth of seedlings (from April to June in Northeast China), which is significantly associated with spring SM. Appropriate spring SM is conducive to the growth of spring crop seeds over farmland [14]. When SM is less than the threshold needed by crops during seed emergence, it may cause spring drought. In contrast, if SM exceeds the threshold required for crop growth, the possibility of spring waterlogging in farmland will increase. Consequently, spring SM is an important indicator used to judge the occurrence of spring drought and waterlogging. Winter snow cover has a nonnegligible impact on spring SM. To date, few relevant studies have taken snow cover parameters into consideration to predict spring drought and waterlogging in farmland soil. Thus, the present study is not only a further application and extension of the snow cover and SM models, but also an exploration of probability prediction of spring drought and waterlogging based on winter snow cover. It will also be an extremely valuable achievement for agricultural hazard warning when these models are used to determine snow cover parameter threshold values corresponding to the occurrence of spring drought and waterlogging.
Northeast China is one of the major food production bases and important agricultural regions in China, and is also one of the important snow areas [15,16]. The three plains located in Northeast China, including the plains of the Liao River, the Songnen Plain, and the Sanjiang Plain, together produce more than 40% of the grain produced in China. Rich snow cover in Northeast China provides important water resources for agriculture. Not only does snowmelt runoff affect agricultural irrigation, but the amount of snow cover also directly affects the spring SM. Spring SM is a significant tool used to guide the spring farming time. The farmers in Northeast China usually start planting in April or May when soil conditions are suitable for the germination of seeds [15]. However, if the SM is too low in spring, it will be necessary to delay planting even if the soil temperature is suitable. This will inevitably shorten the limited growth period of crops in Northeast China and increase the risk of low-temperature damage to food production in autumn. Therefore, it is necessary to establish a model relating winter snow cover and spring SM (in April and May) over farmland in order to predict the spring SM in advance through winter snow cover, and to inform preparations and early warnings for spring sowing.
In this study, we provide a detailed description of the relationship between snow cover parameters and spring SM at the region scale by adopting long-time-series remotely sensed SD data from 1980 to 2009 and SM products from 1981 to 2010. The 30 year period investigated was considered long enough to ascertain a reliable relationship between winter snow cover and spring SM over farmland in Northeast China. The correlations of annual maximum snow depth (MSD) and annual average snow depth (ASD) in winter with respect to spring monthly SM were calculated. Based on these findings, regression models of snow cover and spring SM were established. Furthermore, 4 year SD and SM data were used to validate the accuracy of the models. Additionally, the effects of meteorological factors on spring SM also were analyzed using multiparameter linear regression models. Next, as a specific application, the best-performing model was used to predict the probability of spring drought and waterlogging. The principal objective of this study was to evaluate the impact of winter snow cover on spring SM in farmland in Northeast China. The prediction of spring SM can help agricultural management departments to make advance decisions, and also contribute to the further development of SM prediction models. The paper is organized as follows. Data and methods are briefly introduced in Section 2. Section 3 describes in detail the correlation between snow cover parameters and spring SM, the linear regression models concerning SD and spring SM, the validation of models, analysis of meteorological factors, and prediction of spring drought and waterlogging probability. Finally, the discussion and conclusions are given in Section 4 and Section 5, respectively.

2. Data and Methods

2.1. Study Area

Northeast China (115.51°–135.78°E, 38.72°–53.56°N) is the main grain base of China, covering an area of 790,000 km2, including Heilongjiang, Jilin, Liaoning, and the eastern provinces of Inner Mongolia. It has a temperate continental monsoon climate [16]. The soil types in this region are mainly black soil, clay, and sand, which are subject to annual freeze–thaw cycles. In general, the soil in farmland starts to freeze in early November and begins to thaw in late February or early March. By late March, the soil frost will disappear completely [15]. Since most regions in Northeast China are frozen in March, SM in April and May is crucial for seed germination and late plant products. Besides, Northeast China is one of the three primary snow-covered regions in China [2]. Snowfall is mainly concentrated from October to March. Most regions of Northeast China are arid or semiarid regions. A related study indicated the annual precipitation rate in Northeast China fluctuates between 435 mm/year and 680 mm/year, and the precipitation in the months of April and May is about 20 mm and 40 mm, respectively [17]. Summer precipitation (from June to August) accounts for 65.7% of the annual precipitation, based on 98 meteorological stations’ observations over a 48 year period, which implies that most of the precipitation in the region occurs during the summer months [17]. Farmland accounts for approximately 30% of all land area in Northeast China (Figure 1a), being mainly located on the plains of the Liao River, Songnen Plain, and Sanjiang Plain. The land-cover data were charted at a scale of 1:1,000,000 in 2015, generated from Landsat 8 images through visual interpretation and released by the Resource and Environment Data Cloud Platform (http://www.resdc.cn/). It should be noted that the classification of “farmland” includes the paddy fields and dry land shown in Figure 1a. Owing to their significant human influence (i.e., artificial farmland irrigation), paddy fields were not considered in this study and only the dry land in Northeast China was considered as farmland. Additionally, in order to match the SD and SM products with the spatial resolution selected in this study, 0.25°, therefore the percentage of dry land within a 0.25° grid corresponding to the satellite products was counted, and the pixels in which the dry land was greater than 50% were regarded as farmland in the study (Figure 1b).

2.2. Data

2.2.1. Satellite Snow Depth Data Product

The satellite snow depth data product used in this study was a daily snow depth long-term series dataset provided by the West Data Center in China (WestDC) with a spatial resolution of 0.25° × 0.25°. It spans over 30 years and covers the period from October 1978 to December 2016 with full coverage of China. The daily microwave brightness temperature of the scanning multichannel microwave radiometer (SMMR) onboard Nimbus-7, the special sensor microwave imager/sounder (SSM/I) of Defense Meteorological Satellite Program (DMSP), and the Advanced Microwave Scanning Radiometer for Earth Observing System (AMSR-E) onboard the Aqua satellite are used to derive the daily snow depth, which is recorded by the National Snow and Ice Data Center (NSIDC). Due to the inconsistency of different sensor platforms, the brightness temperature obtained from different sensors was cross-calibrated in advance [18], and then a snow depth inversion algorithm proposed by Che et al. [19] was used to generate the snow depth products for China. When compared with the existing snow products, the snow depth retrieval algorithm used in this dataset takes the actual snow condition in China into account and uses a decision-tree algorithm for surface snow cover/land classification. More details can be found in the literature by Che et al. [19] and Dai et al. [20]. The data product has been applied to related research in trends and variation of snow depth [18,21]. It has been proven to be more accurate than the other snow depth products in China, and can be downloaded freely at http://westdc.westgis.ac.cn/after registration. In this study, the daily snow depth data for the period of 1980 to 2009 were applied to estimate winter snow cover parameters.

2.2.2. Satellite Soil Moisture Data Product

The European Space Agency (ESA) Climate Change Initiative (CCI) surface SM product is the first purely multidecadal satellite-based daily SM product that covers the data-rich period from November 1978 to the present with global coverage. The dataset has a grid spatial resolution of 0.25°. It consists of three surface SM datasets, including the “active product”, the “passive product”, and the “combined product” [22]. The active product is created by fusing scatterometer SM products derived from the advanced scatterometer (ASCAT), while the passive product is the fusion of radiometer SM products obtained by the SMMR, the SSM/I, the Tropical Rainfall Measuring Mission Microwave Imager (TMI), the AMSR-E, and the AMSR2. The combined product is a blended product based on the former two datasets [23]. More detail of the theoretical and algorithmic base relating to the generation of the SM product can be seen in Wagner et al. [24]. The SM data for the combined products are provided in volumetric units (m3·m−3) (representing the ratio of the volume of voids to the total volume). The uncertainty of SM is taken into account in the production process, and the dataset uses standard deviation to evaluate its data accuracy. Additionally, the ESA CCI SM product has been fully validated and intercompared using ground-based observations [25,26]. The results demonstrate that it can be regarded as an effective dataset for application in the investigation of long-term dynamics [27,28]. In this study, the combined product for 1981 to 2010, which is freely available from ERA after completion and verification of the registration (https://www.esa-soilmoisture-cci.org/), was used to estimate the monthly SM.

2.2.3. Auxiliary Data

In this study, the monthly precipitation and air temperature data retrieved from the National Aeronautics and Space Administration (NASA) Global Land Data Assimilation System (GLDAS) Noah Land Surface Model for the period of 1981 to 2010 were applied. The goal of the NASA GLDAS is to generate optimal fields of land surface states and fluxes by ingesting satellite and ground-based observational data products, using advanced land surface modeling and data assimilation techniques [29], which provide three components for GLDAS-2, including GLDAS-2.0, GLDAS-2.1, and GLDAS-2.2. The temporal resolutions for the GLDAS-2 products are 3 hourly, daily, and monthly. Considering the time overlap coverage and the consistency of spatiotemporal resolution with respect to the snow and soil moisture products, we selected the GLDAS-2 monthly dataset at 0.25° × 0.25°, which is generated through temporal averaging of the 3 hourly products and currently covers January 1948 to December 2014. GLDAS-2 is forced entirely with the Princeton meteorological forcing input data [30] and contains a series of land surface parameters simulated using the Noah Model 3.6. The precipitation parameters include the total precipitation rate, which is the sum of rain and snow precipitation rates. It also includes liquid precipitation rate and frozen precipitation rate, namely rain precipitation rate and snow precipitation rate, respectively. A full description of and information related to these data are given in the document for NASA GLDAS Version 2 Data Products [31]. This dataset is currently free of charge and accessible via the https://disc.gsfc.nasa.gov/datacollection/GLDAS_NOAH025_M_2.0.html website. Due to the significant contribution of rainfall to soil moisture, liquid precipitation was used in our study and monthly cumulative precipitation in April and May was calculated, respectively.
Soil data for China were also applied in this study, and were drawn from the Harmonized World Soil Database (HWSD) (version 1.1) constructed by the Food and Agriculture Organization of the United Nations and the Vienna International Institute of Applied Systems [32]. HWSD is a new comprehensive soil dataset. The new soil map of China in HWSD is at a 1:1,000,000 scale [33], which is considered to be of moderate reliability [32]. The data are provided by Geographic Data Sharing Infrastructure, College of Urban and Environmental Science, Peking University and is publicly available at http://geodata.pku.edu.cn. In this study, the soil parameters (e.g., soil bulk density, sand fraction, and clay fraction) were extracted from the soil data and resampled to a 0.25° spatial resolution using nearest interpolation methods for a consistent spatial resolution with SD and SM products.

2.3. Methods

Prior to statistical analysis, we defined the winter season in Northeast China as extending from 1 October to 31 March of the following year. The snow cover parameters in the winter season were extracted from the daily SD product provided by WestDC from 1980 to 2009, including annual MSD and annual ASD. In this study, the daily maximum value and the daily average value of snow depth in the winter season were defined as the annual maximum snow depth and the annual average snow depth of the given year, respectively. Furthermore, based on the ESA CCI surface SM product, the monthly SM values for April and May in the period of 1981 to 2010 were calculated from daily SM. The spatial distribution patterns of the correlation between annual snow cover parameters and spring SM were then analyzed. The Pearson correlation coefficient (R) was used as the statistical metric to quantitatively evaluate the correlation. In addition, the p-value was considered to reflect the signification of correlation. Base on the results of the correlation analysis, linear regression models for winter snow cover and spring SM were constructed using data covering 30 years, and the structure was
y S M = a x s n o w + b
where y S M represents spring SM, and x s n o w is MSD or ASD, respectively. a and b are defined as the coefficients of the regression equation.
To further validate the accuracy of the regression models, snow cover parameters for the period from 2010 to 2013 and monthly SM for the period from 2011 to 2014 were used to test results. Evaluation metrics used in validation included the root-mean-square error (RMSE), mean bias (Bias), and correlation coefficient (R), which reflected the performance of the model. Three metrics were calculated using the following formulas.
RMSE = k = 1 N ( y o b s y s i m ) 2 N
Bias = k = 1 N ( y o b s y s i m ) N
R = k = 1 N ( y o b s y o b s ¯ ) ( y s i m y s i m ¯ ) k = 1 N ( y o b s y o b s ¯ ) 2 k = 1 N ( y o b s y s i m ¯ ) 2
where y o b s and y o b s ¯ are the observed and average values for spring SM, respectively; y s i m and y s i m s ¯ are same as y o b s and y o b s ¯ , but for the spring SM estimated by the linear regression models; and N is the number of data.
To further demonstrate the reliability of the linear regression model, the multiparameter linear regression model was adopted to analyze the effects of monthly cumulative precipitation and air temperature on SM over farmland in Northeastern China, expressed as follows:
y S M = c 1 x s n o w + c 2 x P r e + c 3 x T e m + c 4
where y S M and x s n o w are as the same as in Equation (1). x P r e and x T e m are monthly cumulative precipitation and air temperature, respectively. c i   ( i = 1 , 2 , 3 , 4 ) is defined as the coefficients of the regression equation and also indicate the contribution of snow cover and meteorological factors to spring SM. All factors were non-dimensionally processed via the extremum method (normalization results between 0 and 1).
Finally, we used the established regression model that performed best in this study to predict the spring drought and waterlogging probability. The crops grown in farmland in Northeast China are mainly maize. The suitable relative SM (RSM) for the germination of maize seeds (sowing and emergence) is slightly higher than for other periods. According to the maize meteorological statistical data, for this study, RSM values of 50% and 70% were selected as the thresholds to assess the spring drought and waterlogging probability, respectively. Table 1 gives a drought and waterlogging evaluation index based on RSM at stages of maize planting.
RSM is determined as the soil moisture divided by the field capacity [34]. The field capacity is calculated using the ratio of sandy and clay soils referring to Martínez-Fernández et al. [35], which is established via pedo-transfer functions based on in situ data. In this study, the proportions of sand and clay were extracted from the soil data in China [33]. The transformation of volumetric SM to RSM and the field capacity calculation was as follows.
RSM = m v ρ s o i l · θ F C
θ F C = 0.186 + ( 0.00127 · f s a n d ) + ( 0.00325 · f c l a y )
where the m v and θ F C represent spring SM and field capacity. ρ s o i l , f s a n d , and f c l a y are the soil bulk density, sand fraction, and clay fraction, respectively. RSM is relative soil moisture.

3. Results

In this section, the spatial patterns of MSD, ASD, and spring SM over 30 years are presented. It was necessary to analyze the spatial pattern of SD and spring SM in order to understand the characteristics of snow cover and SM over farmland in Northeast China. The correlations of snow cover parameters and spring SM were then calculated. Furthermore, linear regression models concerning winter snow cover and spring SM were established and the models’ accuracies were validated. Additionally, the contributions of meteorological factors to spring SM were analyzed. Finally, snow cover parameters that are most relevant to spring SM are selected to predict spring drought and waterlogging probability.

3.1. Spatial Patterns of SD and Spring SM

The average MSD and ASD values were calculated over 30 years from 1980 to 2009. In order to better visualize the differences in the spatial distribution of snow depth, the intervals represented by the displayed color in Figure 2a,b are different. As seen in Figure 2a, the range of MSD was from 0 to 30 cm, which mainly exhibited an increasing trend from south to north over farmland in Northeast China. The smaller MSD values of less than 10 cm were mainly distributed in Liaoning Province and the central region of Jilin Province, while the largest MSD values reached 25 cm to 30 cm and were primarily located in Heilongjiang Province. The spatial pattern of ASD was similar to MSD, as shown in Figure 2b (namely the larger ASD distributed in northern and the smaller ASD distributed in southern Northeast China). Shallow snow cover of less than 6 cm was mainly distributed in Liaoning Province and middle regions of Northeast China. The spatial distribution of ASD showed consistency with previous research results [18].
Figure 2c,d presents the average monthly SM in April and May from 1981 to 2010, respectively. The range of monthly SM in April and May was from 0.1 m3·m−3 to 0.35 m3·m−3. However, the monthly SM values of most pixels were concentrated between 0.15 m3·m−3 and 0.25 m3·m−3, in which the larger SM values were distributed in the eastern regions of Northeast China. The spatial distribution of the monthly SM values in April and May was consistent, but the monthly SM in April was overall higher than that in May. The range of 0.1 m3·m−3 to 0.15 m3·m−3 in monthly SM was mainly distributed in Inner Mongolia, where the averaged MSD and ASD values were relatively smaller. Additionally, it was found that snow cover parameters and spring SM had high consistency in terms of spatial patterns. The regions where the MSD and ASD were high presented higher spring monthly SM.

3.2. Correlation Analysis of Snow Cover and Spring SM

Correlation analyses between MSD and monthly SM in April and May were performed, and the Pearson correlation coefficients were calculated. The spatial distribution results are displayed in Figure 3. The statistically significant pixels (p < 0.05) are also marked in the figures.
In April, it was seen that most pixels exhibited positive correlations between MSD and spring SM, as well as between ASD and spring SM, indicating the contribution of snow cover to spring SM. However, there were slightly negative correlations between MSD and SM, and this also was found for ASD and SM in the same month. These negative correlations pixels were mainly distributed in Jilin Province and Liaoning Province, which have lower MSD and ASD in winter. The reason for the negative correlation may be because snow cover is not the main source of spring SM in these areas, a fact associated with the local climate and the amount of snow accumulation in winter. The thinner snow cover has a shorter retention time and sublimates quickly, resulting in the snow cover making little contribution to spring SM. In these regions, spring SM is mainly affected by precipitation and climate. The farmland pixels which indicated significant correlations had a similar spatial distribution and were concentrated in the northwestern part of Heilongjiang Province. The number of significantly related farmland pixels in the northeast farmland gradually decreased from south to north and the correlation gradually weakened. The nonsignificant related pixels were sparsely distributed at the boundary of the study area, showing a weak correlation.
The MSD and ASD in May were shown to be positively correlated to spring monthly SM, also demonstrating that snow cover has a significant effect on spring SM. In terms of spatial distribution, this was consistent with the significant pixels in April and was concentrated in the northwest part of Heilongjiang Province. The correlation coefficient between the MSD/ASD and monthly SM in May gradually increased from south to north. Additionally, significantly related pixels increased in May and were mainly distributed in the northern part of Heilongjiang, central Jilin Province, and northern Liaoning Province. The number of significantly related pixels was higher than that of April, which may be because snow cover may have a lagging effect on SM [3], considering the lower precipitation in May over farmland in Northeast China. Compared with the spatial correlation distribution of the ASD and monthly SM, the MSD had a stronger correlation with monthly SM in May.
Table 2 lists the percentage of significant-correlation pixels that accounted for the farmland in Northeast China. The number of significant-correlation pixels for the MSD/ASD and SM in April were 45.8% and 52.2% of all pixels in the study area, whereas the significant-correlation pixels of those in May accounted for 53.8% and 67.8% of the total farmland, respectively. In most of the northeast farmland, the snow cover parameters (MSD and ASD) and spring SM (April and May) display a significant correlation relationship. However, in terms of some farmland pixels (e.g., in Jilin and Liaoning Province), the effect of snow cover on spring SM was more significant in May, demonstrating that when the snow cover melted in March, this effect was not immediately apparent in April. The averaged correlation coefficients of MSD and SM in April and May were 0.53 and 0.52, while those of ASD and SM in April and May were 0.55 and 0.54, respectively. In general, winter snow cover has a strong correlation with SM in April. The reason may be snow cover in the northeast farmland is basically completely gone at the end of March. At this time, the influence of the snowmelt on SM is obvious.
Overall, snow cover had positive impacts on spring monthly SM in most areas, although some pixels exhibited an insignificant negative correlation in space. The highest correlation coefficients reached 0.8. Winter snow cover is beneficial for spring SM retention, implying that the deeper the average snow depth and larger maximum snow depth, the greater the spring SM. However, the contribution of snow cover to spring SM over farmland in Northeast China showed large spatial differences and was inconsistent. Additionally, it displayed a delayed effects of snow cover on spring SM. In farmland pixels accounting for 8% to 16% of total farmland pixels, snow cover had no significant effect on SM in April but a significant effect on SM in May. The contribution of snow cover to spring SM in the early stage will also lead to changes in SM in the later period, which may last until May.

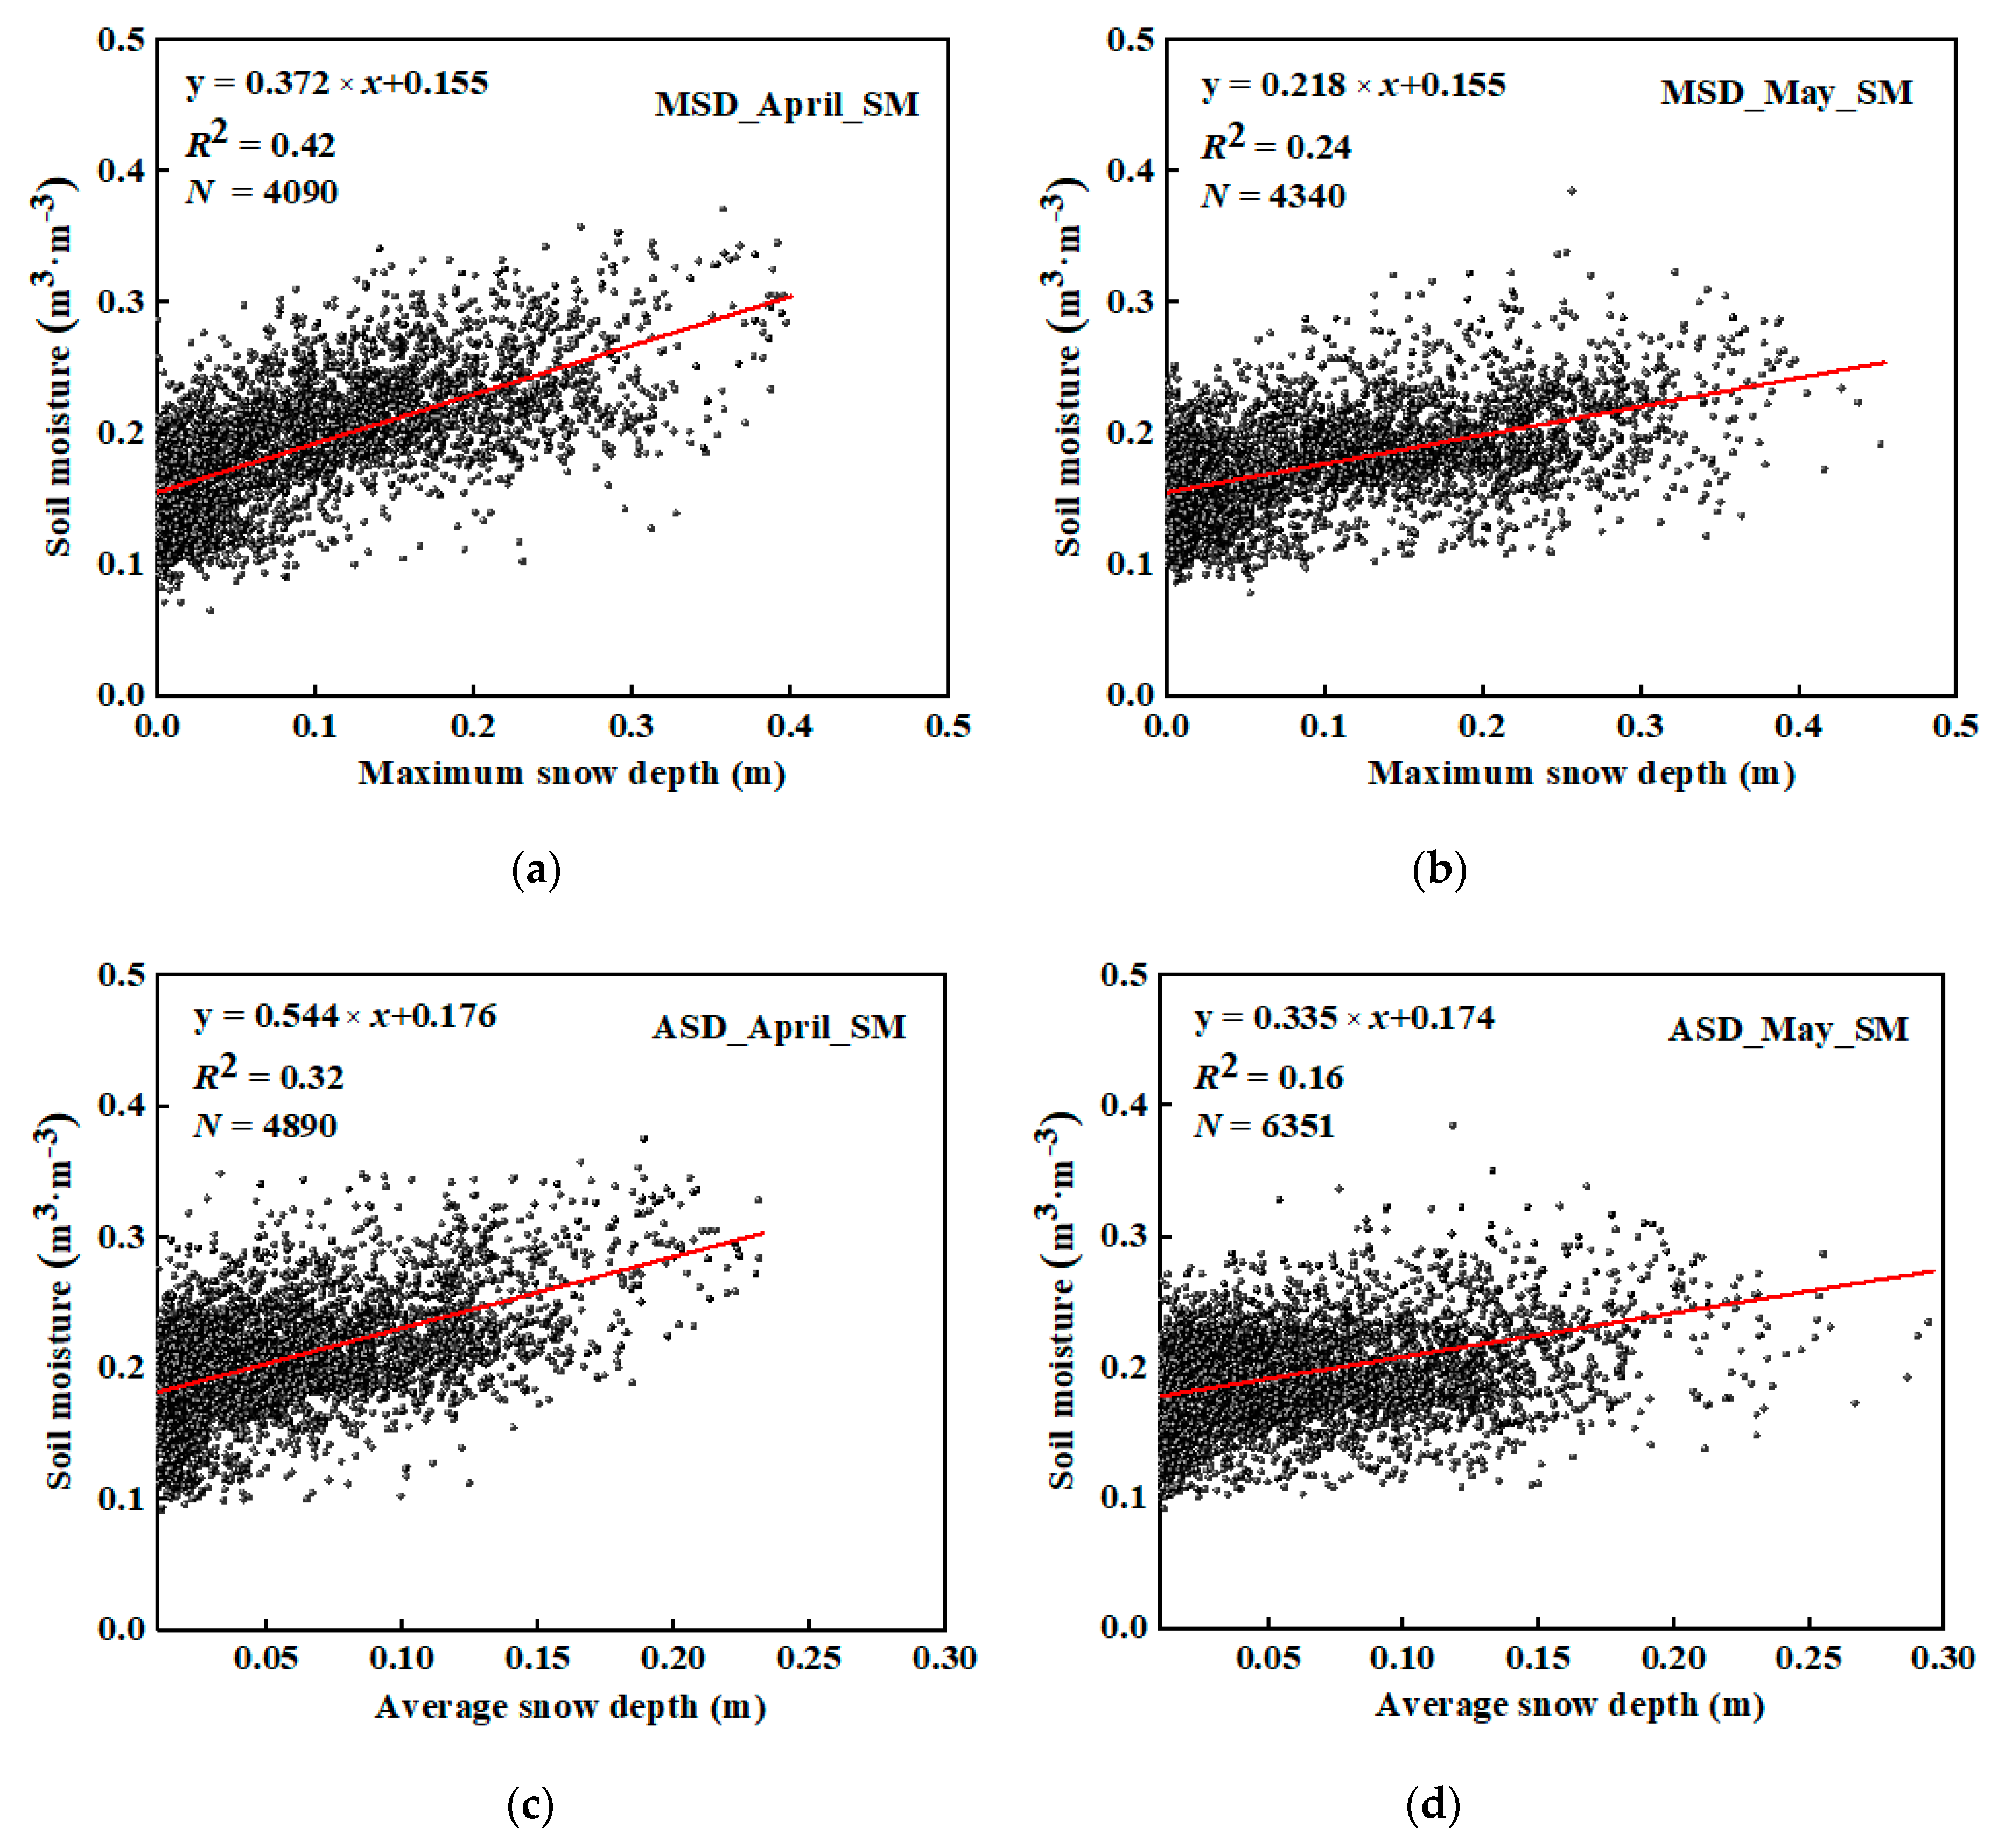
3.3. Linear Regression Model Concerning Snow Cover and Spring SM

According to the correlation analysis results, winter snow cover and spring SM had a significant spatial correlation. Subsequently, all the spatially significantly related pixels (p-value < 0.05) were extracted to further quantitatively analyze the relationship of snow cover with SM in April and May, respectively. A linear regression fitting was adopted to establish the model concerning the contribution of snow cover to SM in April and May.
Figure 4 shows the scatter maps of MSD and ASD correlations with SM in April and May, respectively. The number of samples used to establish the models was greater than 4000. As shown in Table 3, the fitting coefficients (R2) of MSD and ASD with SM in April and May were 0.42, 0.24, 0.32, and 0.16, respectively. All the fitting equations passed the test with a confidence of 0.01. The MSD correlation with SM in April had the highest R2, which illustrates that the MSD had better performance in establishing the linear regression model concerning the contribution of snow cover to spring SM. Compared with April, the fitting coefficients of the linear equations in May were relatively lower, indicating that the snow cover was more suitable for constructing the monitoring and predicting model of monthly SM in April. The effect of snow cover on SM was more pronounced in April. It should be noted that the points were small fluctuations and were scattered on both sides of the fitted curve, and many points appear to pile up in Figure 4. This is mainly due to small variations of snow cover and spring SM in some pixels. Another reason is that spring SM is influenced by many factors; it was not consistent with snow cover parameters at some points. Despite these factors, snow cover and spring SM still exhibited a positive trend to a general extent. Therefore, this was an effective attempt to build spring SM forecast model using snow cover parameters as independent variables and SM as dependent variables.

3.4. Validation of Linear Regression Models

Based on the established linear regression models, the same farmland pixels in space as were used in the linear regression model were selected to validate the performance of the models. The 4 year SD data from 2010 to 2013 and monthly SM from 2011 to 2014 were extracted and calculated.
Figure 5 displays the bias relative frequency distribution of simulated SM. The bias was mainly distributed between −0.1 and 0.1 m3·m−3. The validation results are summarized in Table 4. The average bias values of four linear regression models were smaller than 0.02 m3·m−3. The models for April underestimated monthly SM, whereas the models for May overestimated monthly SM. However, the accuracy of the models of MSD and SM in April and the model of ASD and SM in May were all within 0.04 m3·m−3, within the allowable range of SM inversion e accuracy. The model of MSD and SM in April generally performed best compared with others with the highest R of 0.66, indicating that the linear regression model better captured the variety of spring SM. There are many reasons that may result in the uncertainty of such models. The accuracies of models depend on multiple factors (e.g., the limitations of the accuracy of the remote-sensing dataset, the explicit consideration of the effect of snow cover on soil moisture). On the whole, MSD can be used as an essential snow cover parameter for spring SM forecasts.

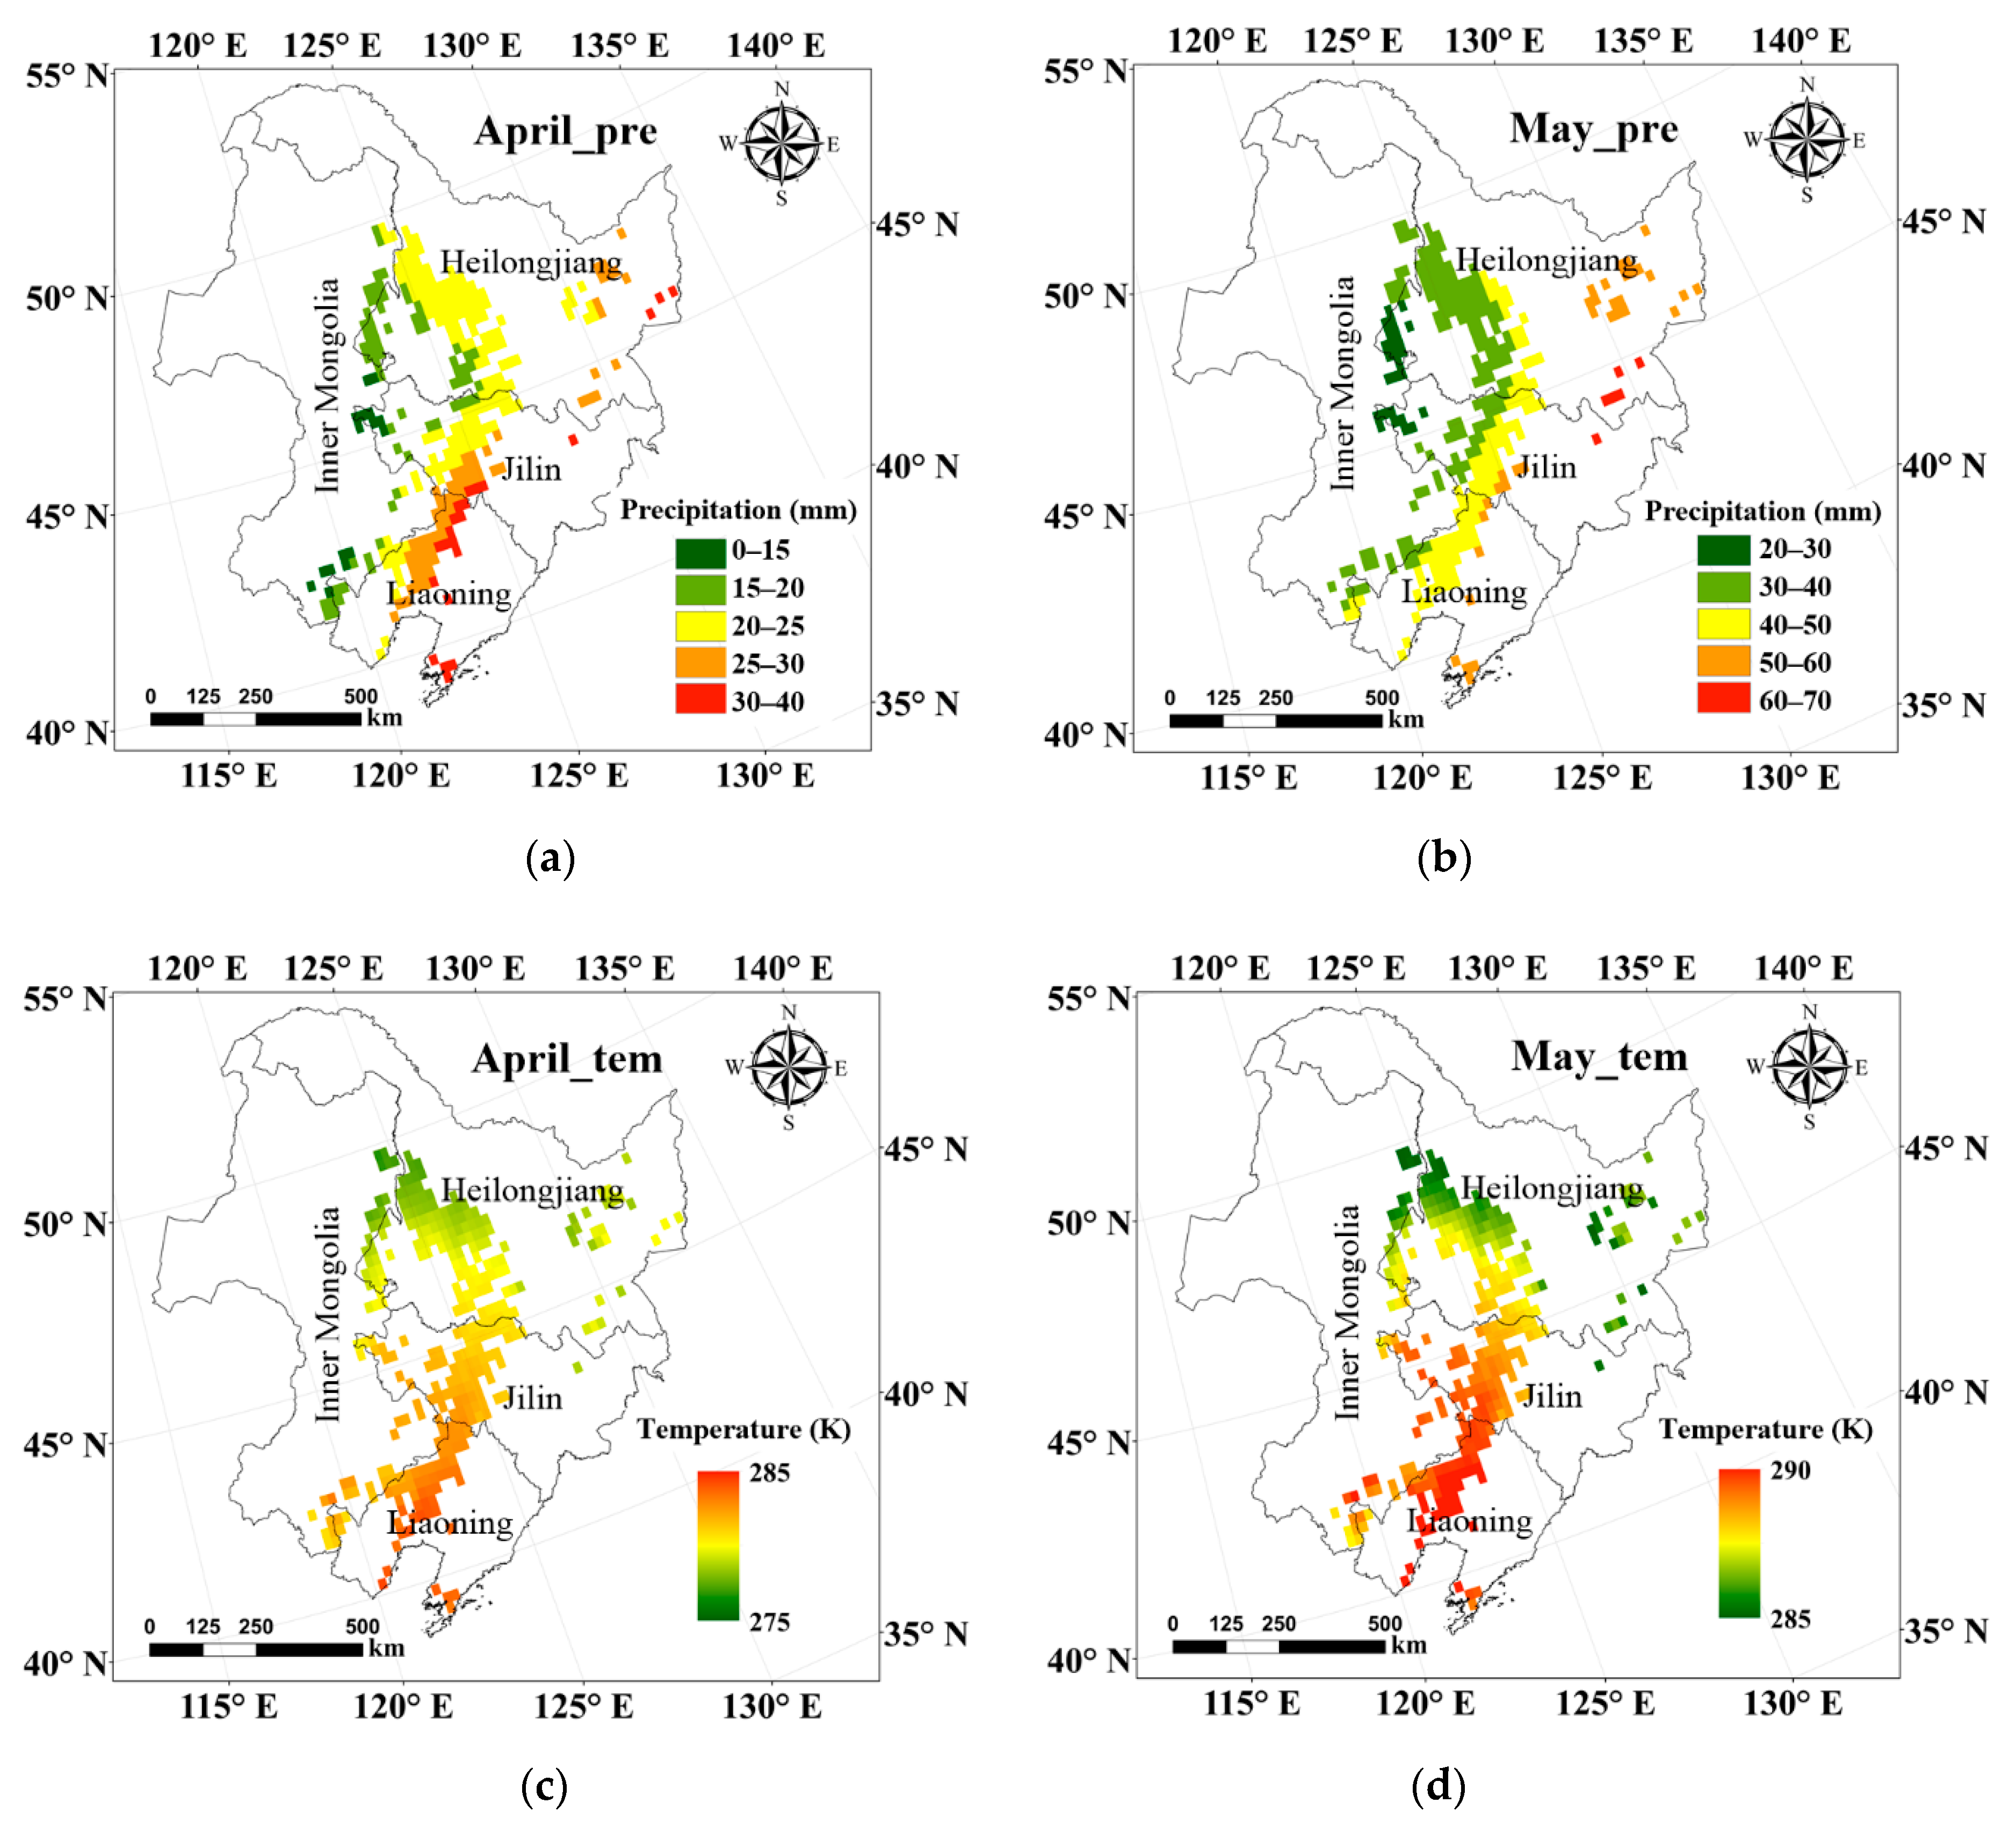
3.5. Analysis of Meteorological Factors

Meteorological factors have important effects on spring SM, e.g., the precipitation can increase SM, whereas air temperature changes SM by influencing the sublimation of soil’s snowmelt. The relationship between monthly meteorological factors (cumulative precipitation and air temperature) and spring SM were analyzed to demonstrate their contributions to spring SM. Figure A1 shows the spatial patterns of correlation between meteorological factors and spring SM. As expected, the air temperature had a negative spatial correlation with spring SM, whereas cumulative precipitation displayed a positive correlation with spring SM over most farmland areas. It should be noted that the correlation of cumulative precipitation and SM in April was not significant, mainly due to the scarce precipitation over farmland in Northeast China in April. Furthermore, the scatter maps of meteorological factors and spring SM for significantly related pixels over farmland are exhibited in Figure 6. The results indicated that cumulative precipitation and air temperature have different effects on spring SM. Overall, air temperature plays a leading role in April SM. However, cumulative precipitation has a greater influence on SM in May.
The multiparameter linear regression models of snow cover and meteorological factors concerning spring SM are listed in Table 5. Compared with the linear regression model of snow cover alone and spring SM in terms of the fitting coefficient (R2), the multiparameter linear regression models performed better, except for the linear regression model of MSD and SM in April. It was indicated that spring SM is affected by the combination of winter snow cover and meteorological factors. Table 6 gives the percentage contributions of the snow parameter and meteorological factors to spring SM, which demonstrated that winter snow cover makes a relatively greater contribution to SM in April than meteorological factors. As time delays, the contribution of snow cover decreases, and the meteorological factors’ influence increases. However, it is worth noting that the linear regression model relating MSD and SM in April had slightly better performance than the multiparameter linear regression model. Thus, a linear regression model can also be effectively applied in the prediction of spring SM to some extent.

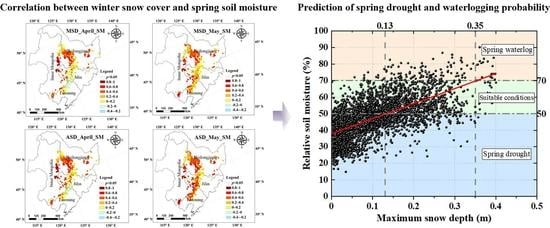
3.6. Prediction of Spring Drought and Waterlogging Probability

In this section, the linear regression model of MSD and SM in April was selected due to it having the highest correlation and fitting coefficient. The application of the MSD as a prediction parameter had the advantage that it is the most easily measured snow cover parameter in winter. Previous studies showed that the MSD in Northeast China is generally in January and February [18], demonstrating that model input parameter can be obtained earlier than predictor.
As shown in Figure 7, the soil bulk density and field capacity over farmland in Northeast China were distributed in from 1.0 kg·dm−2 to 1.4 kg·dm−2 and 0.25 to 0.35, respectively. The ρ s o i l · θ F C values of the pixels, where there was significant correlation between MSD and SM in April, are listed in Figure 8. The mean value with the biggest counts (i.e., ρ s o i l · θ F C = 0.41 ) was selected as the final value to bring into the linear regression model.
The linear regression model of MSD and monthly SM in April based on Section 3.3 was as follows.
y S M = 0.372 x s n o w + 0.155
RSM = ( 0.372 x s n o w + 0.155 ) / ( ρ s o i l · θ F C )
x s n o w = ( % 0.41 0.155 ) / 0.372
where y S M and x s n o w represent MSD and spring SM, respectively. RSM indicates relative soil moisture. According to Equation (10), the thresholds of 50% and 70% RSM corresponded to MSD of 0.13 m and 0.35 m, respectively.
In order to further explore the performance of this method to predict spring drought and waterlogging probability, the dataset used to construct the model was selected to analyze the probability of prediction. Figure 9 shows the schematic diagram of spring drought, suitable conditions, and waterlogging based on the RSM thresholds of 50% and 70%.
Table 7 displays the prediction probability of spring drought, suitable conditions, and waterlogging based on Figure 9. As seen in Table 7, the probability of predicting the occurrence of spring drought and waterlogging were 74.73% and 49.09% of the total number, respectively. However, the prediction probabilities of suitable conditions and waterlogging were similar when MSD was above 0.35 m, it is because spring waterlogging is also affected by other factors, such as the process of evapotranspiration. Although there is abundant snow in winter, spring drought may also be caused by strong winds, high temperatures, and low precipitation in spring. On the whole, the model applied in this study has a higher probability of predicting spring drought than waterlogging.

4. Discussion

The objective of this study was to evaluate the impact of winter snow cover over farmland in Northeast China on spring SM via remote-sensing observations, and to predict the spring drought and waterlogging probability based on the findings. Although winter snow cover provides a complementary predictor for spring SM, there are still many limitations to this study that need to be discussed in detail and further analyzed.
Snow cover acts as an insulator to isolate energy exchange between the soil and the environment due to its high albedo and low thermal conductivity [36]. A number of studies have revealed that snow cover significantly influences the thermal regime of the ground [7,8,37,38,39]. Snow cover can regulate soil water and heat variation, and affect the freezing and thawing dates of the soil, which will indirectly change spring SM [40,41]. The freezing and thawing of the soil are important processes of the spring soil: thawing will increase SM, and freezing will reduce SM. However, the effect is limited by the conditions of winter snow cover [42]. Additionally, spring snowmelt also provides a large supply of SM [43,44,45]. The infiltration rate of snowmelt into the soil depends on the physicochemical properties of soil, e.g., the soil texture, saturation, hydraulic conductivity, etc. Thus, the contribution and influence of snow cover to spring SM are complicated in terms of the mechanism. Besides, previous studies have shown that precipitation and temperature are both important climate factors for snow cover and SM [46,47,48,49]. Meteorological factors also play an important role in the contribution of winter snow cover to spring SM. For example, the atmospheric temperature can affect winter snow accumulation and evapotranspiration rate of the soil in spring, resulting in changes of SM. The precipitation issues in spring can also increase SM. Average monthly cumulative precipitation and air temperature over 30 years can explain the spatial difference of correlation between snow cover and spring SM (Figure A2 in Appendix A). The accumulated precipitation and air temperatures in April were lower than in May, and decreased from the southeast to the northwest in space. SM in April was significantly affected by winter snow cover in this study, which may closely relate to less precipitation and lower air temperature. Moreover, snow cover in the regions with less accumulated precipitation had relatively high correlations with SM, whereas that in the regions with relatively larger accumulated precipitation regions was not significantly related to SM in April. From Figure A1a,b, those areas where accumulated precipitation has a higher correlation with spring SM have a low correlation between snow cover parameters and spring SM. For example, the western part of Jilin Province showed the strongest correlation between snow cover and spring SM and a weaker correlation between cumulative precipitation and spring SM in this study. The rainfall in this region is mostly concentrated in July, August, and September, not between October and May in the next year. Spring SM over farmland mainly comes from the supply of winter snow, which indicates the important contribution of winter snow cover to spring SM. For another example, the correlation between the snow cover and spring SM over farmland in the northern Liaoning Province showed a weak correlation and was not significant. This may be because the higher air temperature in April and May results in faster snowmelt and sublimation, which can be explained by the correlation between air temperature and spring SM. As shown in Figure A1c,d, air temperature had a higher correlation with spring SM in this region. Moreover, spring SM over farmland is mainly affected by meteorological factors for the regions with shallower snow depth, so the contribution of snow to SM over farmland is not obvious. Overall, spatial differences in precipitation and air temperature may lead to different responses of spring SM to snow cover in different regions over farmland in Northeast China.
In this study, linear regression models were selected to estimate the contribution of winter snow cover to spring SM. The main reason why the fitting coefficient of the linear model was not as good as expected is that the effect of snow on SM is not entirely linear. The errors of the linear model come from the factors identified in the above analysis. Although there is a certain degree of uncertainty, the establishment of univariate linear equations can simply describe the relationship between snow cover and spring SM and facilitates the prediction of spring drought and waterlogging. In the future, the water balance should be fully considered, and the effects of precipitation, sublimation, evaporation, and runoff on spring SM should also be added.
In addition, the spatial resolution of passive microwave remote-sensing data products used in this study was relatively coarse, and the spatial heterogeneity of snow cover and SM may bring some errors to the results. However, the passive microwave remote-sensing is the only effective way to derive snow depth and SM in regional and global scales [10,19,50,51]. It cannot be denied that the accuracy of these products had a certain effect on the results. In this study, average monthly SM and interannual snow cover parameters are calculated and used, which as much as possible reduced the accuracy error of products to a certain extent. In the future, a more detailed analysis can be performed when some data with a higher spatial and temporal resolution can be obtained.

5. Conclusions

Understanding the relationship between winter snow cover and spring SM at the regional scale is crucial for strengthening the regulation and management of spring SM over farmland. This study examined the relationship between winter snow cover and spring SM over farmland in Northeast China using WestDC snow depth products during the period of 1980 to 2009, and ERA CCI surface SM products during the period of 1981 to 2010. The correlations of MSD and ASD with spring SM (in April and May) were calculated, respectively. Linear regression models concerning snow cover and spring SM were established. The effects of meteorological factors on spring SM also were analyzed using multiparameter linear regression models. Moreover, the most relevant of snow parameters with respect to spring SM was selected to predict spring drought and waterlogging probability. The determination of key parameters of snow cover provided a theoretical basis and reference for the construction of the spring SM forecasting model. Simultaneously, remote-sensing methods were extended to agricultural applications, which is conducive to the development of smart agriculture and provides new insights for agricultural monitoring.
The MSD and ASD values over 30 years were spatially consistent over farmland, in which the regions have deeper SD were primarily distributed in northern of Northeast China. The monthly SM in April was overall higher than that in May. The correlation analysis showed that snow cover parameters have a positive impact on spring SM. In terms of the spatial distribution, MSD and ASD were significantly positively correlated with the April and May SM in the most farmland areas of Northeast China. The number of significantly related pixels accounted for more than 45% of the total study area. The average significant correlation coefficient (R) of SD and spring SM was above 0.5. Therefore, where the MSD and ASD were deeper, spring SM was higher. However, the correlations showed different distribution patterns in different regions. Additionally, the air temperature had a negative correlation with spring SM in space, whereas cumulative precipitation displayed a positive correlation with spring SM over most farmland areas. Overall, air temperature plays a leading role in SM in April, whereas cumulative precipitation has a greater influence on SM in May. Compared to the multiparameter linear regression models in terms of fitting coefficient, the MSD performed better to establish the linear regression model concerning the contribution of snow cover to SM in April, with the highest fitting coefficient of 0.42. The performance of the relationship between snow cover and monthly SM in April was better than that in May. Thus, MSD can be used as an important snow parameter for monthly SM forecasting in April. Furthermore, the model conducted in this study has a higher prediction probability of spring drought than waterlogging, which can reach 74%.
Spring SM forecasting has important guiding significance for monitoring drought and waterlogging in agriculture and reducing agricultural hazard losses. This study reveals that the remote-sensing method can be applied to spring SM prediction on a regional scale based on winter snow cover, and has great potential in agricultural irrigation guidance and hazard assessment. To address deficiencies and limitations in this study, more parameters can be considered in the future, which will further improve the accuracy of the prediction model.

Author Contributions

Conceptualization, X.L. (Xiaofeng Li); methodology, X.L. (Xiaofeng Li); software, S.L. and D.Q.; validation, S.L. and D.Q.; formal analysis, S.L.; investigation, X.L. (Xiaofeng Li) and T.J.; resources, X.L. (Xiaofeng Li) and X.Z.; data curation, S.L.; writing—original draft preparation, S.L. and X.L. (Xiaofeng Li); writing—review and editing, X.L. (Xiaofeng Li), X.Z. and X.L (Xiaojie Li); visualization, S.L. All authors have read and agreed to the published version of the manuscript.

Funding

This research was funded by Science & Technology Basic Resources Investigation Program of China “Investigation on snow characteristics and their distribution in China”, grant number 2017FY100500 and the Natural Science Foundation of China (No. 41871248).

Acknowledgments

The authors thank the WESTDC China Meteorological Administrate for providing the satellite snow depth products, European Space Agency for providing the satellite soil moisture products, and Environment Data Cloud Platform for providing the land cover dataset. Acknowledgement for the data soil database support from “Geographic Data Sharing Infrastructure, College of Urban and Environmental Science, Peking University (http://geodata.pku.edu.cn)”.

Conflicts of Interest

The authors declare no conflict of interest.

Appendix A

Table A1. A List of abbreviations and acronyms.
AbbreviationsDefinitionAbbreviationsDefinition
AMSR-EAdvanced Microwave Scanning Radiometer for Earth Observing SystemNASANational Aeronautics and Space Administration
ASDAnnual average snow depthNSIDCNational Snow and Ice Data Center
ASCATAdvanced ScatterometerRCorrelation coefficient
BiasMean biasRMSERoot-mean-square error
CCIClimate Change InitiativeRSMRelative soil moisture
DMSPDefense Meteorological Satellite ProgramSDSnow depth
ESAEuropean Space AgencySMSoil moisture
GLDASGlobal Land Data Assimilation SystemSMMRScanning Multichannel Microwave Radiometer
HWSDHarmonized World Soil DatabaseSSM/ISpecial Sensor Microwave Imager/Sounder
MSDMaximum snow depthWestDCWest Data Center in China
Figure A1. Spatial patterns of correlation between meteorological factors and spring SM. (a) Monthly cumulative precipitation and monthly SM in April; (b) monthly cumulative precipitation and monthly SM in May; (c) monthly air temperature and monthly SM in April; (d) monthly air temperature and monthly SM in May.
Remotesensing 12 02716 g0a1
Figure A2. Average monthly cumulative precipitation and air temperature over 30 years in the period of 1981 to 2010. (a) Monthly cumulative precipitation in April; (b) monthly cumulative precipitation in May; (c) monthly air atmospheric temperature in April; (d) monthly air atmospheric temperature in May.
Remotesensing 12 02716 g0a2

References

  1. Tao, F.; Yokozawa, M.; Hayashi, Y.; Lin, E. Changes in agricultural water demands and soil moisture in China over the last half-century and their effects on agricultural production. Agric. For. Meteorol. 2003, 118, 251–261. [Google Scholar] [CrossRef]
  2. Li, X.; Cheng, G.; Jin, H.; Kang, E.; Che, T.; Jin, R.; Wu, L.; Nan, Z.; Wang, J.; Shen, Y. Cryospheric change in China. Glob. Planet. Chang. 2008, 62, 210–218. [Google Scholar] [CrossRef]
  3. Ambadan, J.T.; Berg, A.A.; Merryfield, W.J.; Lee, W.-S. Influence of snowmelt on soil moisture and on near surface air temperature during winter–spring transition season. Clim. Dyn. 2018, 51, 1295–1309. [Google Scholar] [CrossRef]
  4. Kumar, S.V.; Peters-Lidard, C.D.; Mocko, D.; Reichle, R.; Liu, Y.; Arsenault, K.R.; Xia, Y.; Ek, M.; Riggs, G.; Livneh, B. Assimilation of remotely sensed soil moisture and snow depth retrievals for drought estimation. J. Hydrometeorol. 2014, 15, 2446–2469. [Google Scholar] [CrossRef]
  5. Potopová, V.; Boroneanţ, C.; Možný, M.; Soukup, J. Driving role of snow cover on soil moisture and drought development during the growing season in the Czech Republic. Int. J. Climatol. 2016, 36, 3741–3758. [Google Scholar] [CrossRef] [Green Version]
  6. Walsh, J.E.; Jasperson, W.H.; Ross, B. Influences of snow cover and soil moisture on monthly air temperature. Mon. Weather Rev. 1985, 113, 756–768. [Google Scholar] [CrossRef]
  7. Goodrich, L.E. The influence of snow cover on the ground thermal regime. Can. Geotech. J. 1982, 19, 421–432. [Google Scholar] [CrossRef] [Green Version]
  8. Zhang, T. Influence of the seasonal snow cover on the ground thermal regime: An overview. Rev. Geophys. 2005, 43. [Google Scholar] [CrossRef]
  9. Li, X.; Zheng, X.; Wu, L.; Zhao, K.; Jiang, T.; Gu, L. Effects of snow cover on ground thermal regime: A case study in Heilongjiang Province of China. Chin. Geogr. Sci. 2016, 26, 527–538. [Google Scholar] [CrossRef] [Green Version]
  10. Shinoda, M. Climate memory of snow mass as soil moisture over central Eurasia. J. Geophys. Res. Atmos. 2001, 106, 33393–33403. [Google Scholar] [CrossRef]
  11. Che, T.; Dai, L.; Zheng, X.; Li, X.; Zhao, K. Estimation of snow depth from passive microwave brightness temperature data in forest regions of northeast China. Remote Sens. Environ. 2016, 183, 334–349. [Google Scholar] [CrossRef]
  12. Frei, A.; Tedesco, M.; Lee, S.; Foster, J.; Hall, D.K.; Kelly, R.; Robinson, D.A. A review of global satellite-derived snow products. Adv. Space Res. 2012, 50, 1007–1029. [Google Scholar] [CrossRef] [Green Version]
  13. Njoku, E.G.; Entekhabi, D. Passive microwave remote sensing of soil moisture. J. Hydrol. 1996, 184, 101–129. [Google Scholar] [CrossRef]
  14. Dorigo, W.A.; Scipal, K.; Parinussa, R.M.; Liu, Y.Y.; Wagner, W.; De Jeu, R.A.; Naeimi, V. Error characterisation of global active and passive microwave soil moisture datasets. Hydrol. Earth Syst. Sci. 2010, 14, 2605. [Google Scholar] [CrossRef] [Green Version]
  15. Su, Z.; Yacob, A.; Wen, J.; Roerink, G.; He, Y.; Gao, B.; Boogaard, H.; Van Diepen, C. Assessing relative soil moisture with remote sensing data: Theory, experimental validation, and application to drought monitoring over the North China Plain. Phys. Chem. Earth Parts A/B/C 2003, 28, 89–101. [Google Scholar] [CrossRef]
  16. Wang, G.; Jia, H.; Tang, L.; Lu, Y.; Guo, L.; Zhuang, J. Standing corn residue effects on soil frost depth, snow depth and soil heat flux in Northeast China. Soil Tillage Res. 2017, 165, 88–94. [Google Scholar] [CrossRef]
  17. Yang, X.; Lin, E.; Ma, S.; Ju, H.; Guo, L.; Xiong, W.; Li, Y.; Xu, Y. Adaptation of agriculture to warming in Northeast China. Clim. Chang. 2007, 84, 45–58. [Google Scholar] [CrossRef]
  18. Liang, L.; Li, L.; Qiang, L. Precipitation variability in Northeast China from 1961 to 2008. J. Hydrol. 2011, 404, 67–76. [Google Scholar] [CrossRef]
  19. Dai, L.; Che, T. Spatiotemporal variability in snow cover from 1987 to 2011 in northern China. J. Appl. Remote Sens. 2014, 8, 084693. [Google Scholar] [CrossRef]
  20. Che, T.; Li, X.; Jin, R.; Armstrong, R.; Zhang, T. Snow depth derived from passive microwave remote-sensing data in China. Ann. Glaciol. 2008, 49, 145–154. [Google Scholar] [CrossRef] [Green Version]
  21. Dai, L.; Che, T.; Wang, J.; Zhang, P. Snow depth and snow water equivalent estimation from AMSR-E data based on a priori snow characteristics in Xinjiang, China. Remote Sens. Environ. 2012, 127, 14–29. [Google Scholar] [CrossRef]
  22. Qiao, D.; Li, Z.; Nianqin, W.; Zhou, J.; Zhang, P.; Gao, S. Validation of the daily passive microwave snow depth products over northern China. Int. Arch. Photogramm. Remote Sens. Spat. Inf. Sci. 2018, 42. [Google Scholar] [CrossRef] [Green Version]
  23. Liu, Y.Y.; Dorigo, W.A.; Parinussa, R.; De Jeu, R.A.; Wagner, W.; McCabe, M.F.; Evans, J.; Van Dijk, A. Trend-preserving blending of passive and active microwave soil moisture retrievals. Remote Sens. Environ. 2012, 123, 280–297. [Google Scholar] [CrossRef]
  24. Liu, Y.Y.; Parinussa, R.; Dorigo, W.A.; De Jeu, R.A.; Wagner, W.; Van Dijk, A.; McCabe, M.F.; Evans, J. Developing an improved soil moisture dataset by blending passive and active microwave satellite-based retrievals. Hydrol. Earth Syst. Sci. 2011, 15, 425–436. [Google Scholar] [CrossRef] [Green Version]
  25. Wagner, W.; Dorigo, W.; De Jeu, R.; Fernandez, D.; Benveniste, J.; Haas, E.; Ertl, M. Fusion of active and passive microwave observations to create an essential climate variable data record on soil moisture. ISPRS Ann. Photogramm. Remote Sens. Spat. Inf. Sci. (ISPRS Ann.) 2012, 7, 315–321. [Google Scholar]
  26. Dorigo, W.; Gruber, A.; De Jeu, R.; Wagner, W.; Stacke, T.; Loew, A.; Albergel, C.; Brocca, L.; Chung, D.; Parinussa, R. Evaluation of the ESA CCI soil moisture product using ground-based observations. Remote Sens. Environ. 2015, 162, 380–395. [Google Scholar] [CrossRef]
  27. An, R.; Zhang, L.; Wang, Z.; Quaye-Ballard, J.A.; You, J.; Shen, X.; Gao, W.; Huang, L.; Zhao, Y.; Ke, Z. Validation of the ESA CCI soil moisture product in China. Int. J. Appl. Earth Obs. Geoinf. 2016, 48, 28–36. [Google Scholar] [CrossRef]
  28. Dorigo, W.; Wagner, W.; Albergel, C.; Albrecht, F.; Balsamo, G.; Brocca, L.; Chung, D.; Ertl, M.; Forkel, M.; Gruber, A. ESA CCI Soil Moisture for improved Earth system understanding: State-of-the art and future directions. Remote Sens. Environ. 2017, 203, 185–215. [Google Scholar] [CrossRef]
  29. Dorigo, W.; De Jeu, R.; Chung, D.; Parinussa, R.; Liu, Y.; Wagner, W.; Fernández-Prieto, D. Evaluating global trends (1988–2010) in harmonized multi-satellite surface soil moisture. Geophys. Res. Lett. 2012, 39. [Google Scholar] [CrossRef] [Green Version]
  30. Rodell, M.; Houser, P.; Jambor, U.; Gottschalck, J.; Mitchell, K.; Meng, C.-J.; Arsenault, K.; Cosgrove, B.; Radakovich, J.; Bosilovich, M. The global land data assimilation system. Bull. Am. Meteorol. Soc. 2004, 85, 381–394. [Google Scholar] [CrossRef] [Green Version]
  31. Sheffield, J.; Goteti, G.; Wood, E.F. Development of a 50-year high-resolution global dataset of meteorological forcings for land surface modeling. J. Clim. 2006, 19, 3088–3111. [Google Scholar] [CrossRef] [Green Version]
  32. Rui, H.; Beaudoing, H. README Document for NASA GLDAS Version 2 Data Products. Goddart Earth Sci. Data Inf. Serv. Cent. (GES DISC) Greenbelt MD USA 2018. Available online: https://www.google.com.hk/url?sa=t&rct=j&q=&esrc=s&source=web&cd=&ved=2ahUKEwiZmYnOzq3rAhVM7WEKHbr6DDcQFjAAegQIBRAB&url=https%3A%2F%2Fdata.mint.isi.edu%2Ffiles%2Fraw-data%2FGLDAS_NOAH025_M.2.0%2Fdoc%2FREADME_GLDAS2.pdf&usg=AOvVaw1RLtgsWOIq2ncdYbKZ81dz (accessed on 28 June 2020).
  33. Nachtergaele, F.; Van Velthuizen, H.; Verelst, L.; Batjes, N.; Dijkshoorn, K.; Van Engelen, V.; Fischer, G.; Jones, A.; Montanarela, L. The harmonized world soil database. In Proceedings of the 19th World Congress of Soil Science, Soil Solutions for a Changing World, Brisbane, Australia, 1–6 August 2010; pp. 34–37. [Google Scholar]
  34. Shi, X.; Yu, D.; Warner, E.; Pan, X.; Petersen, G.; Gong, Z.; Weindorf, D. Soil database of 1: 1,000,000 digital soil survey and reference system of the Chinese genetic soil classification system. Soil Surv. Horiz. 2004, 45, 129–136. [Google Scholar] [CrossRef]
  35. Vinnikov, K.Y.; Yeserkepova, I. Soil moisture: Empirical data and model results. J. Clim. 1991, 4, 66–79. [Google Scholar] [CrossRef] [Green Version]
  36. Martínez-Fernández, J.; González-Zamora, Á.; Sánchez, N.; Gumuzzio, Á.; Herrero-Jiménez, C.M. Satellite soil moisture for agricultural drought monitoring: Assessment of the SMOS derived Soil Water Deficit Index. Remote Sens. Environ. 2016, 177, 277–286. [Google Scholar] [CrossRef]
  37. Pomeroy, J.; Brun, E. Physical properties of snow. Snow Ecol. Interdiscip. Exam. Snowcover. Ecosyst. 2001, 45–126. Available online: https://www.researchgate.net/profile/John_Pomeroy2/publication/252454769_Snow_Ecology/links/5863689108ae8fce490a7cfc/Snow-Ecology.pdf (accessed on 28 June 2020).
  38. Ling, F.; Zhang, T. Impact of the timing and duration of seasonal snow cover on the active layer and permafrost in the Alaskan Arctic. Permafr. Periglac. Process. 2003, 14, 141–150. [Google Scholar] [CrossRef]
  39. Qiang, F.; Renjie, H.; Zilong, W.; Tianxiao, L.; Xianghao, W. Soil thermal regime under snow cover and its response to meteorological factors. Trans. Chin. Soc. Agric. Mach 2015, 46, 154–161. [Google Scholar]
  40. Fu, Q.; Hou, R.; Li, T.; Wang, M.; Yan, J. The functions of soil water and heat transfer to the environment and associated response mechanisms under different snow cover conditions. Geoderma 2018, 325, 9–17. [Google Scholar] [CrossRef]
  41. Hou, R.; Li, T.; Fu, Q.; Liu, D.; Cui, S.; Zhou, Z.; Yan, P.; Yan, J. Effect of snow-straw collocation on the complexity of soil water and heat variation in the Songnen Plain, China. Catena 2019, 172, 190–202. [Google Scholar] [CrossRef]
  42. Fu, Q.; Hou, R.; Li, T.; Yan, P.; Ma, Z. The critical depth of freeze-thaw soil under different types of snow cover. Water 2017, 9, 370. [Google Scholar] [CrossRef]
  43. Bales, R.C.; Hopmans, J.W.; O′Geen, A.T.; Meadows, M.; Hartsough, P.C.; Kirchner, P.; Hunsaker, C.T.; Beaudette, D. Soil moisture response to snowmelt and rainfall in a Sierra Nevada mixed-conifer forest. Vadose Zone J. 2011, 10, 786–799. [Google Scholar] [CrossRef]
  44. Niu, G.-Y.; Yang, Z.-L. Effects of frozen soil on snowmelt runoff and soil water storage at a continental scale. J. Hydrometeorol. 2006, 7, 937–952. [Google Scholar] [CrossRef]
  45. Harpold, A.A.; Molotch, N.P.; Musselman, K.N.; Bales, R.C.; Kirchner, P.B.; Litvak, M.; Brooks, P.D. Soil moisture response to snowmelt timing in mixed-conifer subalpine forests. Hydrol. Process. 2015, 29, 2782–2798. [Google Scholar] [CrossRef]
  46. Bednorz, E. Snow cover in eastern Europe in relation to temperature, precipitation and circulation. Int. J. Climatol. J. R. Meteorol. Soc. 2004, 24, 591–601. [Google Scholar] [CrossRef]
  47. Mintz, Y.; Walker, G. Global fields of soil moisture and land surface evapotranspiration derived from observed precipitation and surface air temperature. J. Appl. Meteorol. 1993, 32, 1305–1334. [Google Scholar] [CrossRef] [Green Version]
  48. Qiao, D.; Wang, N. Relationship between winter snow cover dynamics, climate and spring grassland vegetation phenology in inner Mongolia, China. ISPRS Int. J. GeoInf. 2019, 8, 42. [Google Scholar] [CrossRef] [Green Version]
  49. Qiao, D.; Zhou, J.; Liang, S.; Fu, X. Combined Effects of Precipitation and Temperature on the Responses of Forest Spring Phenology to Winter Snow Cover Dynamics in Northeast China. IEEE Access 2019, 7, 138950–138962. [Google Scholar] [CrossRef]
  50. Zheng, X.; Feng, Z.; Xu, H.; Sun, Y.; Li, L.; Li, B.; Jiang, T.; Li, X.; Li, X. A New Soil Moisture Retrieval Algorithm from the L-Band Passive Microwave Brightness Temperature Based on the Change Detection Principle. Remote Sens. 2020, 12, 1303. [Google Scholar] [CrossRef] [Green Version]
  51. Schmugge, T.; O′Neill, P.E.; Wang, J.R. Passive microwave soil moisture research. IEEE Trans. Geosci. Remote Sens. 1986, 12–22. [Google Scholar] [CrossRef]
Figure 1. The location of Northeast China and the study area. (a) Location of Northeast China (pink shading) and land-cover distribution; (b) farmland fraction with a spatial resolution of 0.25° calculated from (a).
Remotesensing 12 02716 g001
Figure 2. Spatial patterns of winter snow cover and spring monthly SM over 30 years. (a) Maximum snow depth; (b) average snow depth; (c) monthly SM in April; (d) monthly SM in May.
Remotesensing 12 02716 g002
Figure 3. Spatial patterns of correlation between snow cover and spring SM. (a) MSD and monthly SM in April; (b) MSD and monthly SM in May; (c) ASD and monthly SM in April; (d) ASD and monthly SM in May.
Remotesensing 12 02716 g003
Figure 4. Scatter maps of snow cover and spring SM for significantly related pixels over farmland. Table 3 provides the fitting function and fitting coefficients. N is the number of samples. (a) MSD and monthly SM in April; (b) MSD and monthly SM in May; (c) ASD and monthly SM in April; (d) ASD and monthly SM in May.
Remotesensing 12 02716 g004
Figure 5. Bias relative frequency distributions of monthly SM. The bias is equal to the model simulation value minus the satellite observation value. (a) & (b) are monthly SM simulation bias based on the model of MSD and monthly SM in April and May, respectively; (c) & (d) are monthly SM simulation bias based on the model of ASD and monthly SM in April and May, respectively.
Remotesensing 12 02716 g005
Figure 6. Scatter maps of meteorological factors and spring SM for significantly related pixels over farmland. The red line indicates the fitted straight line. R2 is the fitting coefficient. N is the number of samples. (a) Monthly air temperature and monthly SM in April; (b) monthly air temperature and monthly SM in May; (c) monthly cumulative precipitation and monthly SM in April; (d) monthly cumulative precipitation and monthly SM in May.
Remotesensing 12 02716 g006
Figure 7. Spatial distribution maps of soil bulk density and field capacity over farmland in Northeast China. (a) soil bulk density; (b) field capacity.
Remotesensing 12 02716 g007
Figure 8. The multiplication result count distribution of soil bulk density and field capacity over farmland in Northeast China.
Remotesensing 12 02716 g008
Figure 9. The schematic diagram of spring drought and waterlogging based on RSM.
Remotesensing 12 02716 g009
Table 1. Spring drought and waterlogging evaluation index based on relative SM (RSM).
ConditionRSM
Drought<50%
Suitable conditions50–70%
Waterlogging>70%
Table 2. The correlation between snow cover and spring SM. R is the correlation coefficient (p-value < 0.05). The percentage indicates the percentage of significantly correlated pixels accounting for all farmland pixels. N is the number of samples.
Snow Cover ParametersMonthly SM in AprilMonthly SM in May
RPercentageNRPercentageN
MSD0.5345.8%1440.5253.8%169
ASD0.5552.2%1640.5467.8%213
Table 3. The linear regression models relating snow cover and spring SM. y S M and x s n o w represent monthly SM and snow cover parameters, respectively. R2 is the fitting coefficient.
Snow Cover ParametersMonthly SM in AprilMonthly SM in May
Fitting FunctionR2Fitting FunctionR2
MSD y S M = 0.372 × x s n o w + 0.1550.42 y S M = 0.218 × x s n o w + 0.1550.24
ASD y S M = 0.544 × x s n o w + 0.1760.32 y S M = 0.335 × x s n o w + 0.1740.16
Table 4. Error metrics of the linear regression models. Bias and RMSE represent the mean bias and root-mean-square error. N is the number of samples. The unit of both bias and RMSE is m3·m−3.
Linear Regression ModelMonthly SM in AprilMonthly SM in May
BiasRMSERNBiasRMSERN
MSD and SM−0.010.040.668580.020.050.401008
ASD and SM−0.020.050.589420.010.040.261230
Table 5. The multiparameter linear regression models of snow cover and meteorological factors concerning spring SM. y S M , x s n o w , x P r e , and x T e m are monthly SM, snow cover parameters, monthly cumulative precipitation, and monthly air temperature, respectively. R2 is the fitting coefficient.
Snow Cover ParametersMonthly SM in AprilMonthly SM in May
Fitting FunctionR2Fitting FunctionR2
MSD y S M = 0.19 + 0.09 x s n o w + 0.03 x P r e − 0.05 x T e m 0.38 y S M = 0.15 + 0.06 x s n o w + 0.08 x P r e − 0.01 x T e m 0.38
ASD y S M = 0.19 + 0.10 x s n o w + 0.03 x P r e − 0.05 x T e m 0.41 y S M = 0.15 + 0.07 x s n o w + 0.08 x P r e − 0.03 x T e m 0.39
Table 6. The percentage contributions of snow cover and meteorological factors to spring SM.   y S M , x s n o w , x P r e , and x T e m are as the same as in Table 5.
Snow Cover ParametersMonthly SM in AprilMonthly SM in May
x s n o w x P r e x T e m x s n o w x P r e x T e m
MSD52.94%17.65%29.41%40.00%53.33%6.67%
ASD55.55%16.67%27.78%38.89%44.44%16.67%
Table 7. The prediction probability of spring drought, suitable conditions, and waterlogging based on MSD threshold.
MSDSpring Drought
(RSM < 50%)
Suitable Condition
(50% < RSM < 70%)
Spring Waterlogging
(RSM > 70%)
<0.13 m74.73%24.73%0.54%
0.13 m–0.35 m28.15%62.47%9.38%
>0.35 m1.82%49.09%49.09%

