Explicitly Identifying the Desertification Change in CMREC Area Based on Multisource Remote Data


1
State Key Laboratory of Resources and Environmental Information System, Institute of Geographic Sciences and Natural Resources Research, Chinese Academy of Sciences, Beijing 100101, China
2
College of Resources and Environment, University of Chinese Academy of Sciences, Beijing 100049, China
3
Jiangsu Center for Collaborative Innovation in Geographical Information Resource, Nanjing 210023, China
4
Key Laboratory of Water Cycle and Related Land Surface Processes, Chinese Academy of Sciences, Beijing 100101, China
*
Author to whom correspondence should be addressed.
Remote Sens. 2020, 12(19), 3170; https://0-doi-org.brum.beds.ac.uk/10.3390/rs12193170
Submission received: 17 August 2020
/
Revised: 24 September 2020
/
Accepted: 25 September 2020
/
Published: 27 September 2020
(This article belongs to the Special Issue Fusion of High-Level Remote Sensing Products)
Abstract
:Explicitly identifying the desertification changes and causes has been a hot issue of eco-environment sustainable development in the China–Mongolia–Russia Economic Corridor (CMREC) area. In this paper, the desertification change patterns between 2000 and 2015 were identified by operating the classification and regression tree (CART) method with multisource remote sensing datasets on Google Earth Engine (GEE), which has the higher overall accuracy (85%) than three other methods, namely support vector machine (SVM), random forest (RF) and Albedo-normalized difference vegetation index (NDVI) models. A contribution index of climate change and human activities on desertification was introduced to quantitatively explicate the driving mechanisms of desertification change based on the temporal datasets and net primary productivity (NPP). The results show that the area of slight desertification land had increased from 719,700 km2 to 948,000 km2 between 2000 and 2015. The area of severe desertification land decreased from 82,400 km2 to 71,200 km2. The area of desertification increased by 9.68%, in which 69.68% was mainly caused by human activities. Climate change and human activities accounted for 68.8% and 27.36%, respectively, in the area of desertification restoration. In general, the degree of desertification showed a decreasing trend, and climate change was the major driving factor in the CMREC area between 2000 and 2015.
1. Introduction
Desertification, as a major type of land degradation around the world, has been a hot topic in the field of global change and sustainable development, especially in arid areas [1,2,3,4]. Desertification directly affects the subsistence of about three billion people living in desertified areas, which would put at risk the livelihoods of about 135 million people around the world by 2045 [5,6]. The cropland is being converted to barren land at a rate of 120,000 km2 per year, in which the degraded ecosystems have the potential to store up to three billion tons of carbon annually [7].
The China–Mongolia–Russia Economic Corridor (CMREC) area, located in the eastern–central part of Eurasia, is one of the six major economic corridors proposed by the Belt and Road Initiative (BRI) [8,9]. The CMREC area is a typical arid zone with a poor environment that is sensitive to climate change and human activities, particularly on the China–Mongolia border and in the Gobi Desert area [3,10]. Thus, how to effectively monitor the desertification trend and understand the driving factors have become the two significant issues in the sustainable development of the CMREC area, especially on the China–Mongolia border.
The current studies of desertification show that the vegetation indices can be used to analyze the desertification processes [11,12], such as normalized difference vegetation index (NDVI), enhanced vegetation index (EVI), and modified soil-regulated vegetation index (MSAVI) [13,14,15,16]. However, those indices just consider the relationship between vegetation changes and desertification, and cannot address the needs of land degradation monitoring and eco-environment management [17,18,19,20,21]. Multiple parameters need to be combined for identifying the desertification change pattern [22,23], such as NDVI, topsoil grain size index (TGSI), land surface albedo (Albedo), soil-regulated vegetation index (MSAVI), and bare soil index (BSI) [23]. Multi-parameter integrated studies [17] show that the dynamic changes in desertification can be assessed and monitored via the methods of classification and regression tree (CART) [24], support vector machine (SVM) [25], random forest (RF) [26] and Albedo-NDVI models [25,26], and by combining the parameters of NDVI, normalized difference water index (NDWI), iron oxide index and surface temperature [27,28]. However, the current studies of desertification are mainly based on the traditional modes rather than cloud platforms, which make it difficult to select an optimal model and require a lot of time to collect the available multi-resource data [29].
Moreover, how to select a suitable assessment method is important to analyze the difference between climate change and human activities [30]. Current studies primarily focus on statistical methods such as correlation analysis [31], regression models [32], and principal components analysis [33]. Some driving factors are selected subjectively and it is difficult to distinguish human activities from climate factors. In order to address this issue, some researchers tried to choose vegetation health status as an indicator to reveal the impacts of climate change and human activities on desertification [34,35]; others adopt net primary productivity (NPP) to discriminate the role of climate change from human activities on the ecosystem [36,37,38]. NPP can be formed by potential net primary productivity (PNPP), actual NPP (ANPP), and human appropriation NPP (HANPP). HANPP presents the difference between ANPP and PNPP, which can be used to measure the impact of human activities on the ecosystem [39,40]. However, it rarely integrates high-resolution multispectral remote data and other related environmental data to improve the accuracy of desertification classification and monitoring on the Google Earth Engine (GEE) cloud platform [41,42,43], especially in the CMREC area.
In this paper, the accuracy of CART, SVM, RF, and Albedo-NDVI models for identifying the desertification degree in the CMREC area are compared on the GEE cloud platform, and then the change patterns of desertification are explicitly identified by operating the optimal model with multisource remote sensing data from 2000 to 2015. The linear trend method is introduced to calculate the impacts of climate change and human activities on desertification. In general, the aims of this study are to identify the change patterns of desertification in the CMREC area between 2000 and 2015, explicate the differences between climate change and human activities on the desertification change, and discuss the driving mechanisms of desertification expansion and reversion.
2. Materials and Methods
2.1. Study Area
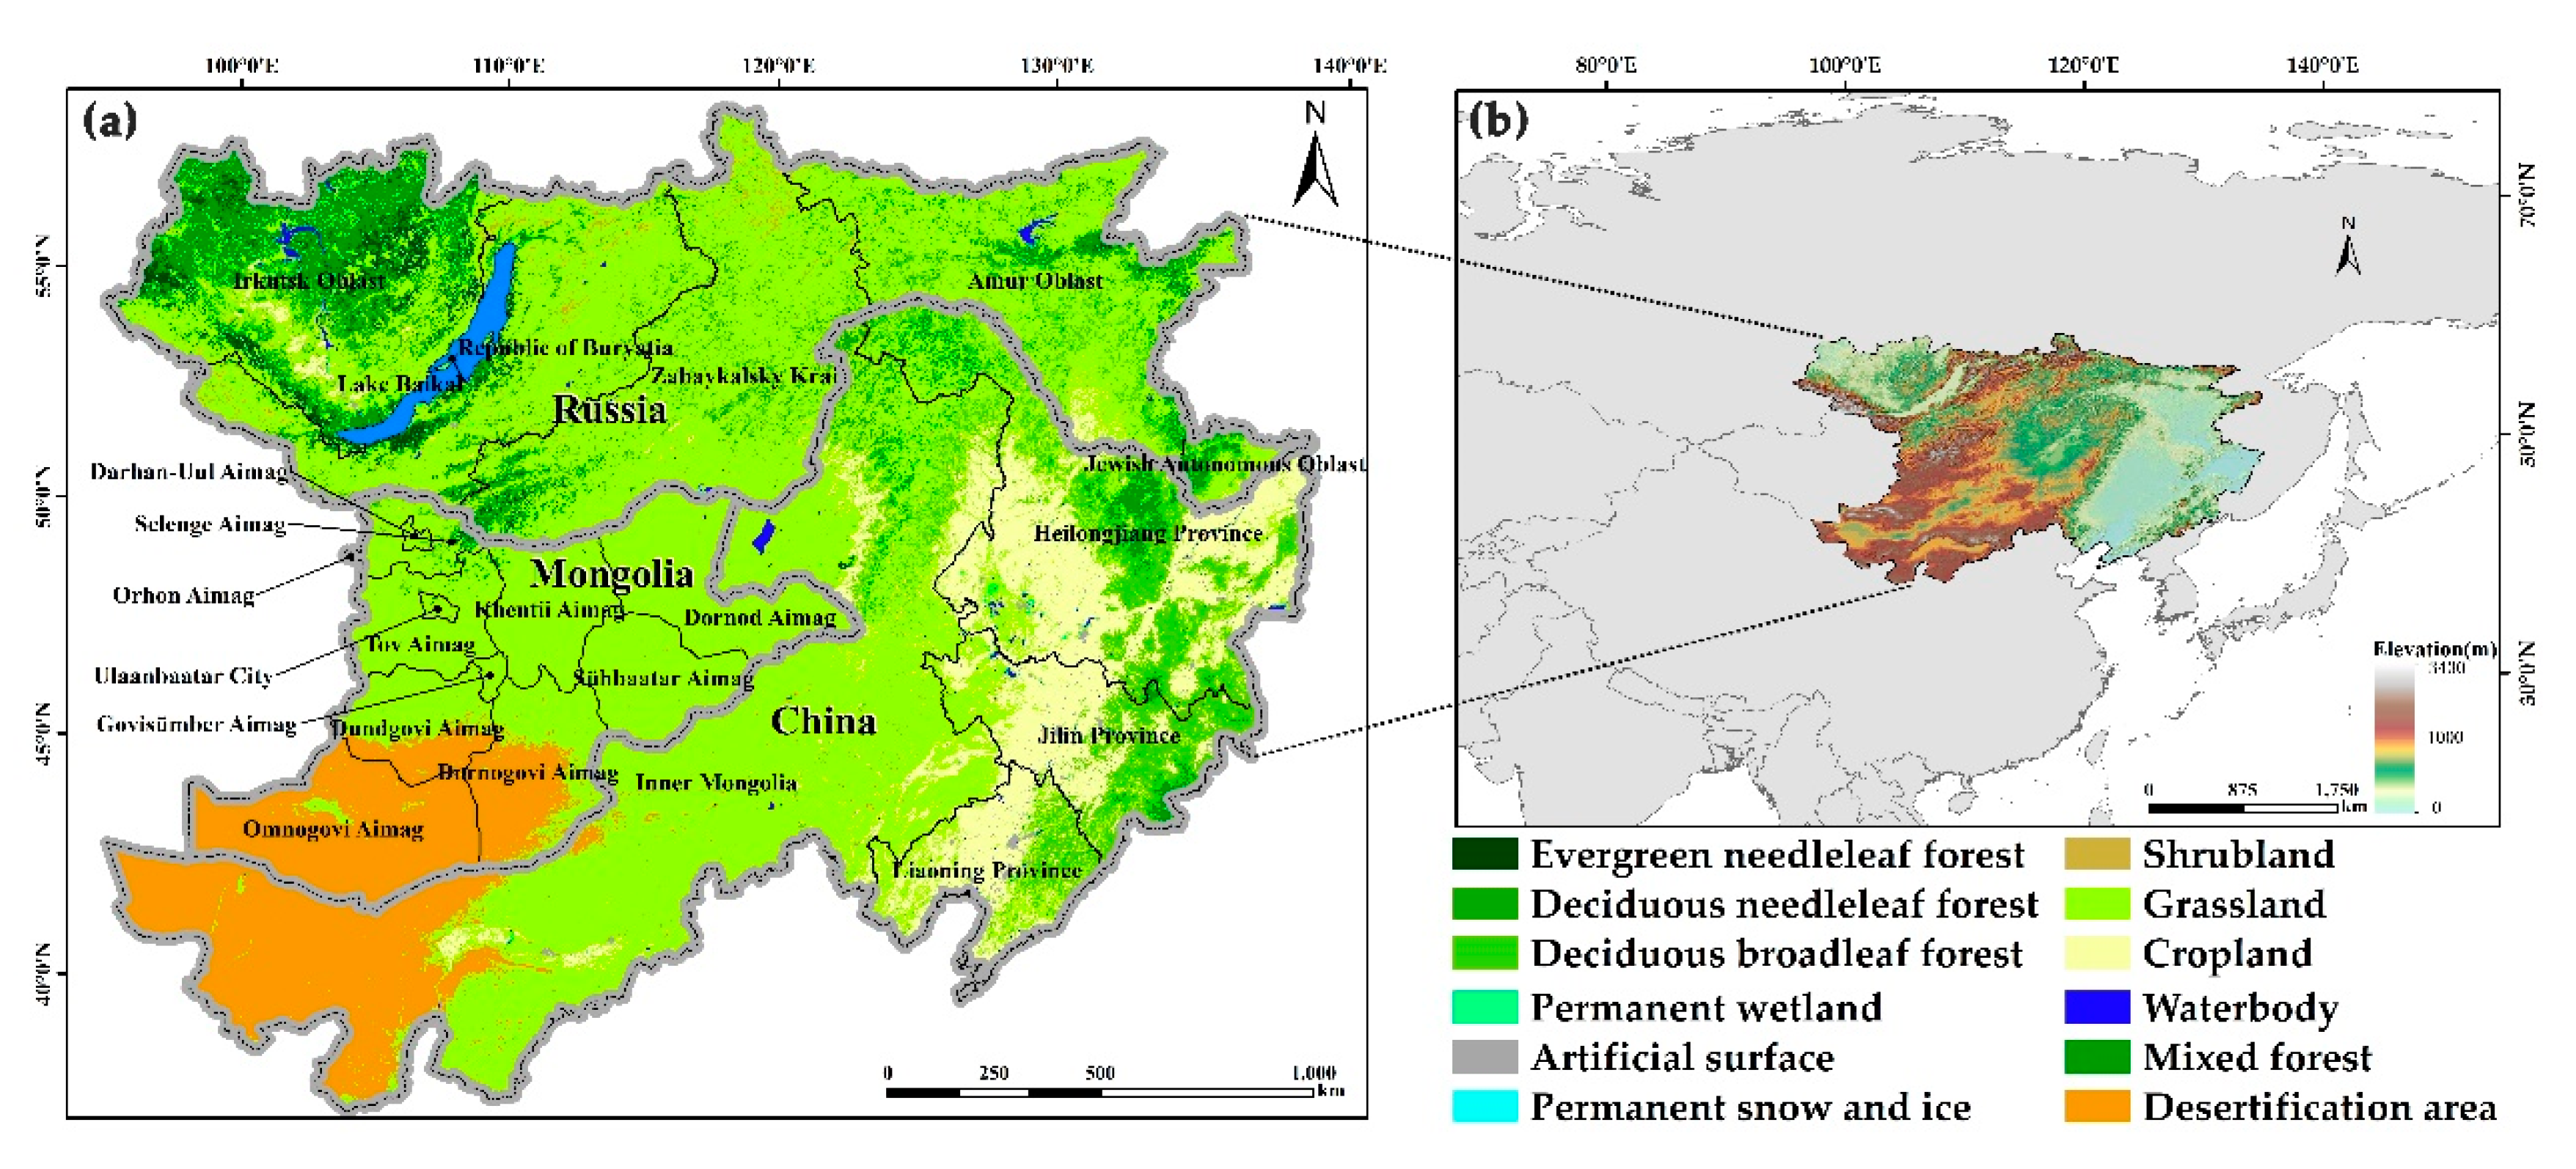
The CMREC is located in the northernmost part of the six major economic corridors (37°24′N–58°34′N and 97°7′E–135°7′E) included in the Belt and Road Initiative (BRI) [9]. It approximately covers an area of 63.26 million km2 and administratively consists of four provinces in northern China, 12 provinces in eastern Mongolia, and five provinces in eastern Russia (Figure 1). The climate conditions, such as temperature and precipitation, vary widely across the study area, ranging from an arid climate to a subpolar climate [44]. The altitude gradually increases from the Northeast Plain to the Mongolian Plateau in its eastern part, and from the Central Siberian plateau to the Yabronov Mountains in its western part. The types of land cover mainly include cropland, grassland, bare land, and forest, which account for 20.95%, 49.21%, 14.59%, and 13.94% of the total area, respectively. The Gobi Desert on the China–Mongolia border is the sixth largest desert in the world.
2.2. Materials
The multisource remote sensing data used in the study (Table 1) were all collected from the GEE cloud platform. The Surface Reflectance Tier 1 data of Landsat 5/7/8 imagery in 2000 and 2015 were used to obtain the index products of vegetation and soil. The terrain data were derived from the Shuttle Radar Topography Mission V3 (SRTM3) dataset of enhanced digital elevation models (DEMs) with a spatial resolution of 30 m × 30 m. The Land Surface Temperature (LST) data of Moderate Resolution Imaging Spectroradiometer (MODIS) with a spatial resolution of 1000 m × 1000 m were applied as climate textures [45,46]. In addition, the classification criteria of desertification status were defined with the multisource data, including Google historical imagery, Google photos, European Space Agency global land cover products (ESALC), MODIS land cover products (MCD12Q1), Landsat Vegetation Continuous Field tree cover layers (VCF), Open Land Map sand content products, global flux observation tower sites data, and Sentinel-2 Level-1C satellite imagery (Table 2), which referred to the classification criteria of desertification in China and Mongolia and the desertification assessment standards of Food and Agriculture Organization (FAO) and United Nations Environment Programme (UNEP) [22,47,48]. The desertification types were divided into five degrees of non-desertification: slight, moderate, high and severe desertification in the CMREC area (Table 2).
Moreover, in order to explicate the differences between climate change and human activities on the desertification change, the NPP was formed by potential net primary productivity (PNPP), actual NPP (ANPP), and human appropriation NPP (HANPP) which was defined as the difference between ANPP and PNPP [39,40]. The ANPP was obtained from MODIS NPP data, and used to analyze the impacts between climate change and human activities. The impact of PNPP affected by climate change was measured on the basis of the Thornthwaite memorial model [49], and the difference between ANPP and PNPP were used to calculate the impact of HANPP affected by human activities.
The driving mechanism of desertification change in the CMREC area was further explained in terms of the annual total precipitation, average temperature, annual total evapotranspiration, and the per capita Gross Domestic Product (GDP) dataset. The evapotranspiration came from Penman–Monteith–Leuning evapotranspiration data every 8 days (PML), and GDP was derived from the Gridded Population of the World (GPW) data. All kinds of datasets were interpolated to the same spatial resolution of 30 m × 30 m by the bilinear interpolation method in the GEE cloud platform.
2.3. Methods
2.3.1. Flowchart of Technical Process
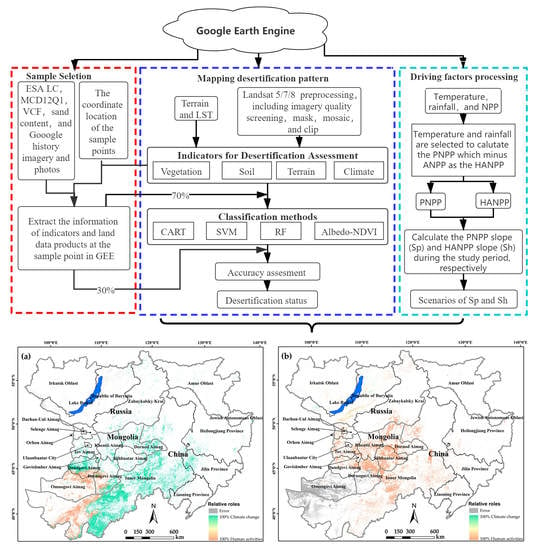
The flowchart of the desertification assessment and mechanism analysis in the CMREC area (Figure 2) can be divided into three steps.
Firstly, 3700 and 2813 data scenes of Landsat imagery in 2000 and 2015 were obtained by using the quality screening and cloud mask functions on the GEE cloud platform, respectively. The surface reflectance image with the best vegetation growth status was extracted by operating the NDVI maximum synthesis method with the composite data without shadow and cloud coverage, which was used to obtain the vegetation and soil indicators. The elevation, slope, aspect, and climate indices were extracted from the terrain and LST datasets. The no-vegetation zones such as water bodies, permanent snow and ice, and urban land were excluded.
Secondly, with the support of multisource datasets, 70% of reference samples, as training samples, were used to train the classifier of each classification method, while 30% of reference samples, as verification samples, were applied to evaluate accuracy assessment. Then, the change patterns of desertification were identified on the basis of the training sample dataset combined with the vegetation, soil, terrain and climate indices in 2000 and 2015.
Finally, the linear trend method was introduced to quantitatively calculate the impacts of climate change and human activities on desertification based on the temperature, rainfall, and NPP dataset.
2.3.2. Indicators
The indicators (Table 3) for desertification assessment include four types parameters of vegetation, soil, terrain, and climate, which were selected in terms of the principles of invertibility, reliability, and practicability. The NDVI, Fractional Vegetation Cover (FVC), MSAVI, and NDWI are normally used to represent the biophysical characteristics and coverage condition of the surface vegetation [50]. MSAVI is useful to increase the dynamic range of the vegetation signal and reduce the soil background influences [51]. NDWI can be used to evaluate the canopy relative water content by combining the leaf relative water content with measures of canopy structure [52]. The soil context indices of TGSI, land Albedo, and BSI can be used to describe the physical properties of soil [22,23]. Moreover, the algorithms of terrain function were applied to obtain elevation, slope, and aspect indicators. The formulas of all multi-spectral indices are summarized in Table 3.
2.3.3. Classification and Accuracy Assessment Methods
The CART, SVM, RF, and Albedo-NDVI methods (Table 4) were selected to identify the degrees of desertification. The CART algorithm, which consists of many decision trees, can be used for both classification and continuous variable prediction [54]. The SVM algorithm, based on statistical learning theory, can be used for dealing with the nonlinear fractionable data in high dimensional space to complete linear separability [55]. The RF method is suitable for multi-category and multi-feature data because they consist of many classification decision trees and can be used to process relatively complex remote sensing images [56]. Those methods, being more like black box models, usually show superior predictive performance due to their effectiveness in handling correlations and multicollinearity among predictor variables [57,58]. Additionally, the Albedo-NDVI model can also be used to effectively identify the degrees of desertification combined with the Albedo and NDVI index degree [25]. These algorithms often show different advantages in different research areas with different explanatory mechanisms (Table 4).
In order to compare the accuracy of classifications simulated by the CART, SVM, RF, and Albedo-NDVI methods, the accuracy index of overall accuracy (OA), Kappa, the producer’s accuracy, (PA), and the user’ s accuracy (UA) were introduced and the confusion matrix was built based on verification sample degrees [59,60]. OA is usually expressed as a percentage where reference samples are classified correctly. The Kappa coefficient is a statistical measure to assess the overall reliability between classification and the multisource data product reference. PA represents the probability that the known desertification degree samples are correctly classified into degrees. UA indicates the percentage of the verification samples that are correctly classified as a known desertification degree. In this study, 120 sample points were selected to assess the accuracy of the desertification degree, which included 24 global flux observation tower sites in the CMREC area, and 96 samples randomly generated on the GEE platform. The equations can be expressed, respectively, as follows:
where N represents the sum of sample number; Xii represents the sample number in row i and column i; Xi+, and X+i, respectively, represent the totals of row i and column i.
2.3.4. Quantitative Assessment of the Driving Mechanisms
The ANPP data product, simulated by the Biome-BioGeochemical Cycles(Biome BGC) model and Carnegie–Ames–Stanford Approach (CASA) model, was normally derived from MODIS annual NPP datasets [61]. The simulated PNPP using the Thornthwaite memorial model refers to the NPP of no human disturbance [62]. The change trends of PNPP and HANPP between 2000 and 2015 were, respectively, used to present the relative contributions of climate change and human activities on desertification, and the slopes of the PNPP trend (SP) and HANPP trend (SH) were, respectively, calculated by ordinary least squares regressions in the GEE cloud platform, which can be formulated, respectively, as follows:
where r represents annual precipitation (mm), t represents annual average temperature (°C); if y is PNPP, the slope will be the slope of the PNPP trend (SP), and if y is HANPP, the slope will be the slope of the HANPP trend (SH), and n represents the time interval from 2000 to 2015; the positive SP or negative SH, respectively, indicate that climate change or human activities benefited desertification reversion, and negative SP or positive SH, respectively, represent that climate change or human activities promoted desertification expansion [38,62]. Moreover, a series of possible scenarios between SP and SH can be mapped on the pixel scale, which are reliable enough to extinguish the relative roles of climate change and human activities (Table 5).
3. Results
3.1. Quality Assessment
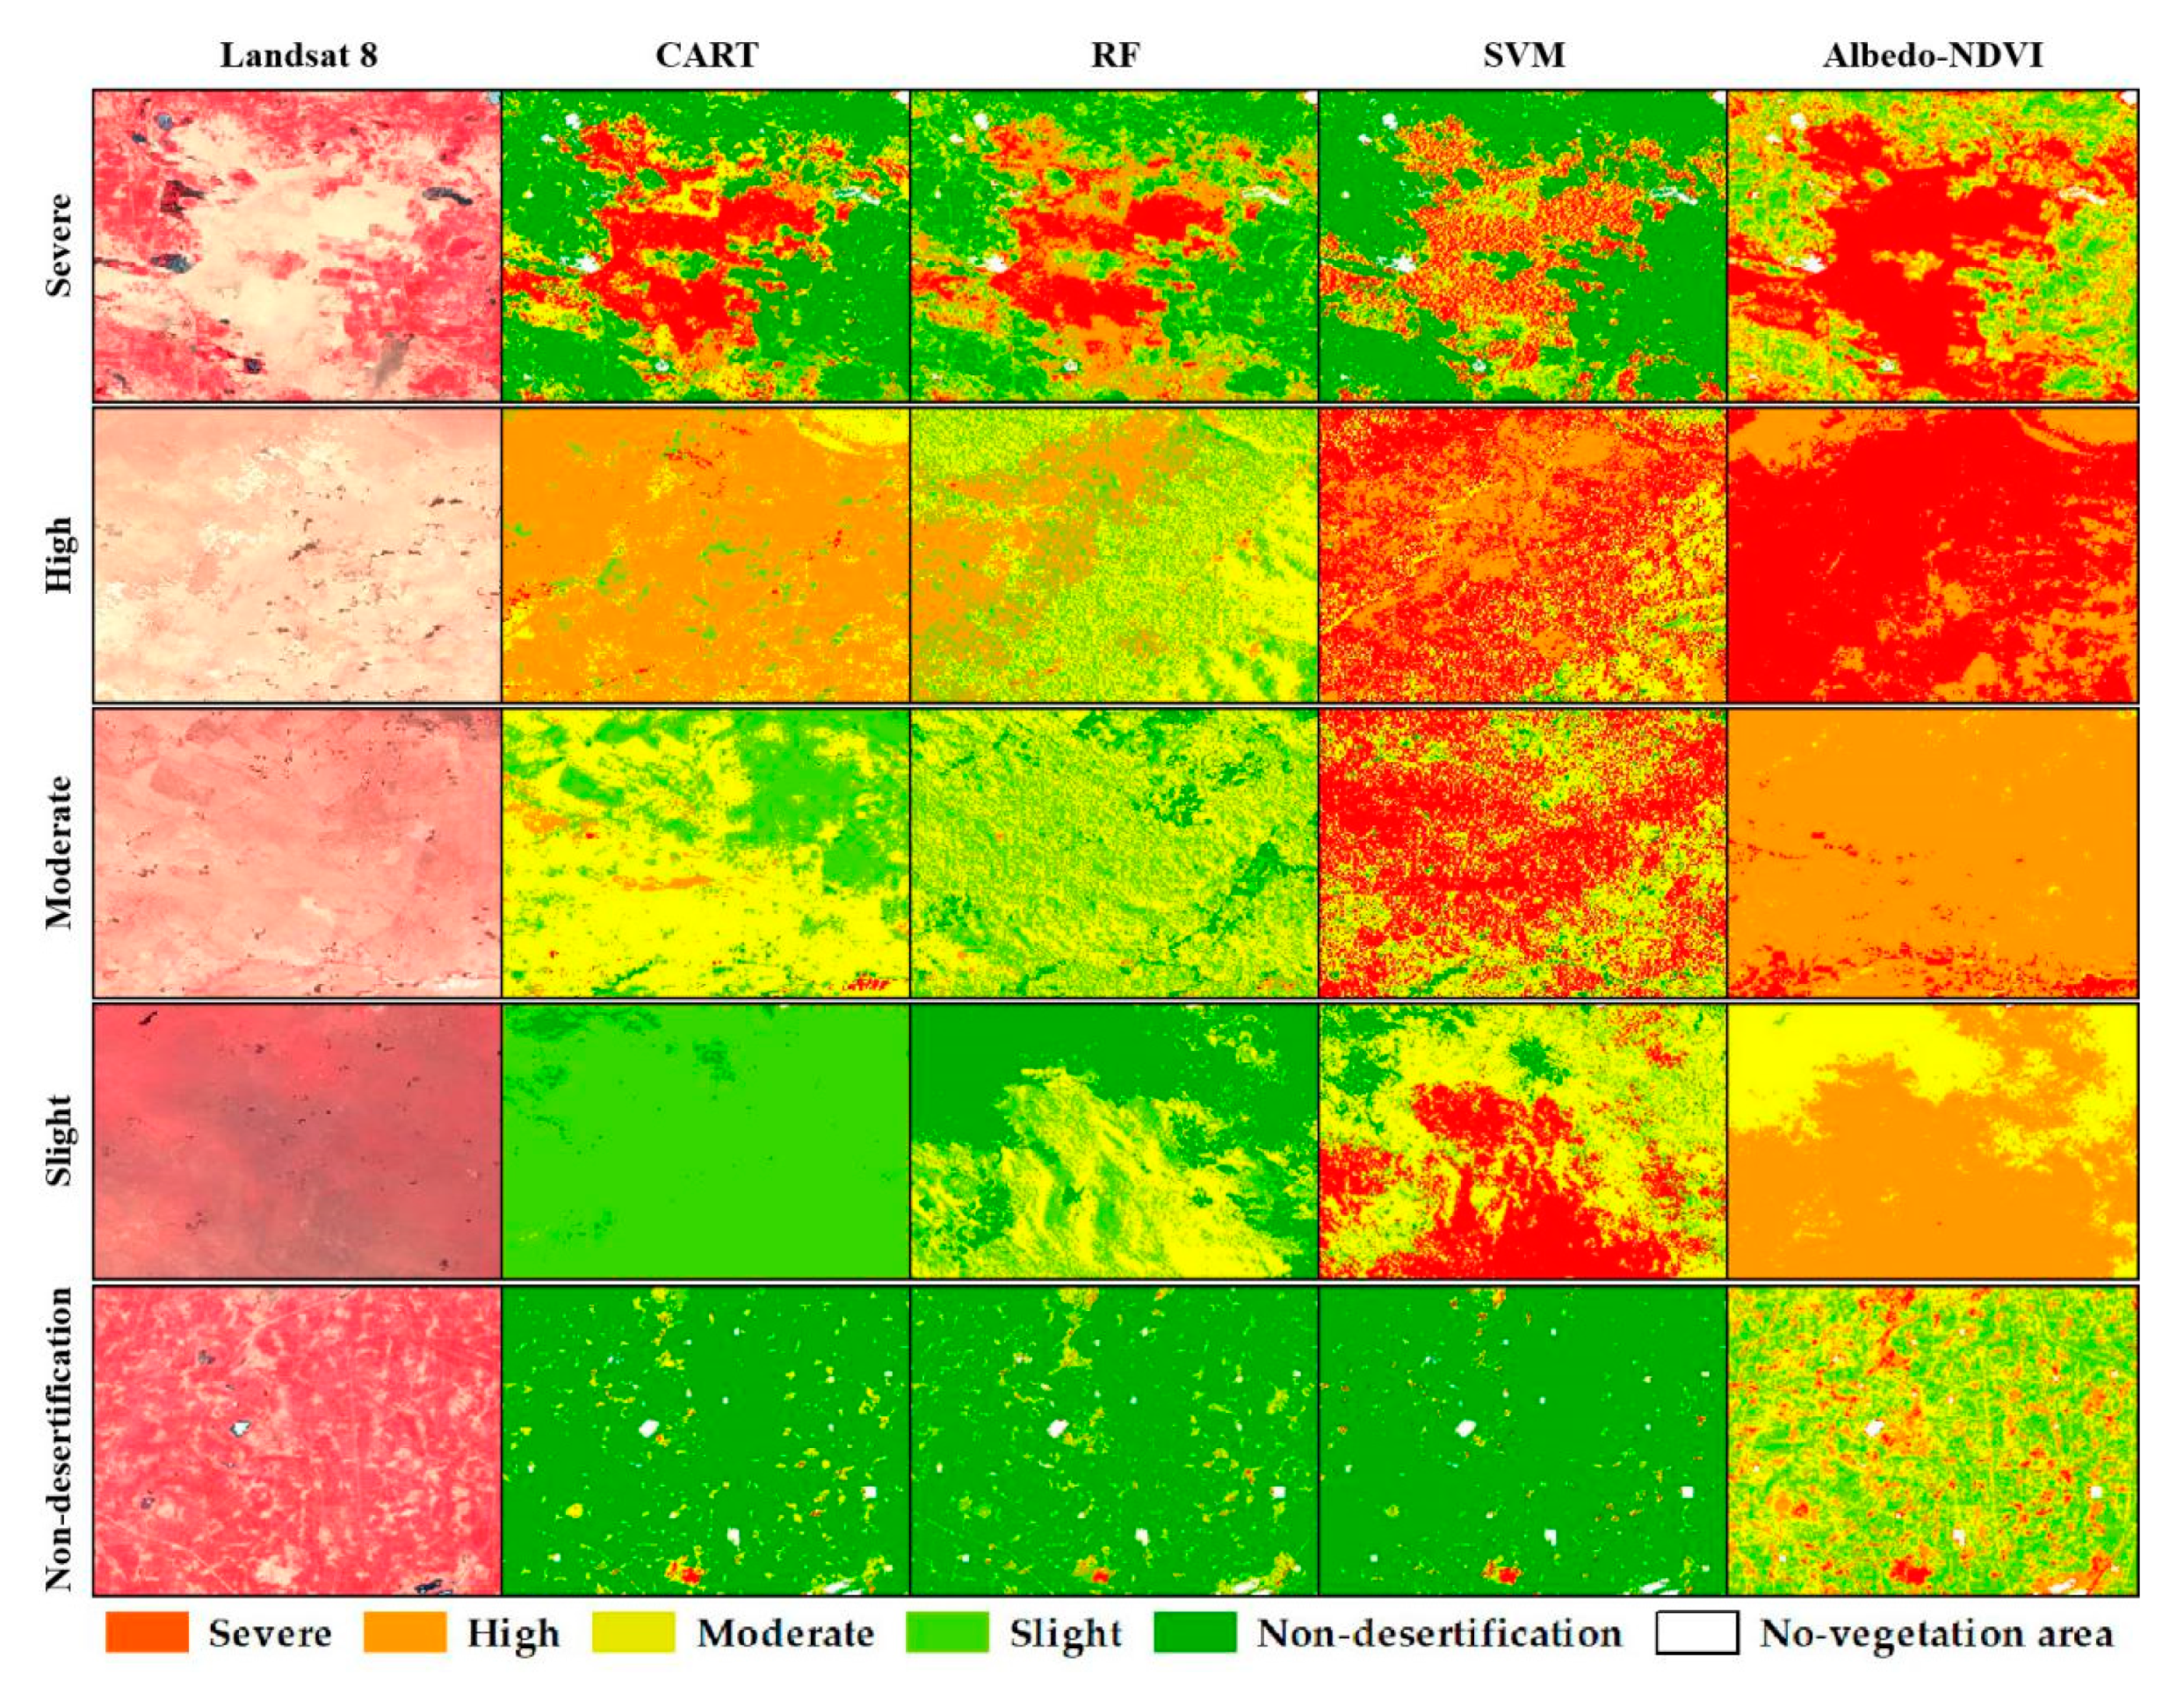
Based on the Landsat 8 data, and the products obtained by CART, RF, SVM, and Albedo-NDVI methods in this study, we selected severe desertification, high desertification, moderate desertification, slight desertification, and non-desertification to conduct an intuitive comparison (Figure 3). In general, the desertification pattern products obtained by the CART model efficiently reflected the true desertification type in the Landsat 8 satellite image. The desertification classification quality was better than those of the RF and SVM product. Moreover, the accuracy of the CART product was roughly equivalent to the Albedo-NDVI product in the severe desertification type, and superior to the accuracy of the Albedo-NDVI product for classifying the high desertification, moderate desertification, slight desertification, and non-desertification areas.
The classification accuracy (Table 6) of desertification in the CMREC area by operating the four methods of CART, RF, SVM, and Albedo-NDVI shows that the accuracy of the CART model (OA = 85%, Kappa = 0.754) is higher than other methods. The SVM model has the lowest accuracy (OA = 58.75%, Kappa = 0.396). The overall accuracy of the Albedo-NDVI model is equal to the CART model, but it has a lower Kappa coefficient (Kappa = 0.722). Moreover, the CART model has a higher producer’s accuracy (PA) at all degrees of desertification, indicating that the desertification degree samples are efficiently classified into these degrees. The Albedo-NDVI model displays higher PA values for moderate desertification, high desertification, and severe desertification, but its PA value for slight desertification is the lowest. According to the user’s accuracy (UA) values, the accuracy of the CART model for various desertification degrees also maintains a high level, especially for the non-desertification area, which shows that the verification samples can correctly classify the known desertification degree better. The Albedo-NDVI model displays low UA and PA value for slight desertification recognition and cannot be efficiently used to assess slight desertification. The SVM and RF models with lower UA and PA values are also not suitable for identifying desertification degrees in the CMREC area.
3.2. Change Patterns of Desertification
The identified results of desertification change in the CMREC area between 2000 and 2015 (Figure 4) show that the severe desertification region was mainly distributed in the southwest of the CMREC area, especially in the Inner Mongolia region of China, and Omnogovi aimag, Dundgovi aimag, and Dornogovi aimag of Mongolia. High desertification areas were mainly distributed in the Omnogovi aimag in 2000, and the central China–Mongolia border in 2015. The moderate desertification region was mainly distributed in Inner Mongolia, which had been converted into a slightly desertified area between 2000 and 2015. Slight desertification areas were mainly distributed in the transition zones between moderate desertification and non-desertification areas in the northeast of the CMREC area. The total area of various desertification degrees covered more than 30% of the whole area (Table 7). Slight desertification was the major desertification type, accounting for 11.01%. The areas of severe, high, and moderate desertification were 501,814 km2, 420,091 km2, and 161,111 km2, and accounted for 7.68%, 6.43% and 2.47%, respectively. From 2000 to 2015, the non-desertification area declined by 2.63% from 4,557,600 km2 to 4,431,900 km2, and the slight desertification area increased by 228,314 km2. The total areas of severe, high, and moderate desertification decreased from 1,148,100 km2 to 1,017,900 km2, while their areas, respectively, fell by 13.58%, 9.79%, and 8.27%. On a national level (Table 7), the total area of various desertification degrees, including severe, high, moderate, and slight desertification, decreased by 3.27% from 995,100 km2 to 962,600 km2 in China, especially in the severe desertification area, decreasing by 24.99% (90,680 km2). Conversely, most areas in Mongolia were non-desertified in 2000 and slightly desertified in 2015, accounting for 32.78% and 36.14% of the study area in Mongolia, respectively. Slight desertification areas increased by 32.76% from 301,878 km2 to 400,772 km2, while non-desertification areas were reduced by 25.81% from 363,434 km2 to 269,648 km2. Furthermore, the severe and moderate desertification areas expanded, respectively, by 19,008 km2 and 12,031 km2. The study area of Russia was dominated by the non-desertification type, accounting for more than 90% of the total area from 2000 to 2015.
The change patterns of desertification in the CMREC area between 2000 and 2015 were divided into significant expansion, expansion, no conversion, reversion and significant reversion. The significant expansion presents the desertification degree in a certain pixel as intensified by two levels or more and thus slight desertification was transformed into high or severe desertification. Expansion presents the desertification degree in a certain pixel as intensified by one level. No conversion presents the desertification degree in a certain pixel with no change. Reversion presents the desertification degree in a certain pixel as decreased by a level. Significant reversion presents the desertification degree in a certain pixel as decreased by two or more levels (Figure 5). Between 2000 and 2015, the significant expansion and expansion zones were mainly distributed in the central and southwest of the CMREC area, involving the northwestern and central regions of Inner Mongolia in China, and the Omnogovi aimag, and eastern aimags of Mongolia. However, the significant reversion and reversion zones were mainly located in the southern part of the CMREC area, especially in China. The total area of the significant expansion and expansion zones accounted for 9.68% of the entire area measurements (Table 8) of the significant expansion and expansion areas were 82,143 km2 and 550,516 km2, respectively. The desertification reversion area, including the significant reversion and reversion region, accounted for 9.4% of the total, which was 17,764 km2 less than the desertification aggravation area. The desertification reversion area was 386,725 km2, which was 151,908 km2 larger than the desertification aggravation area in China. However, the desertification reversion areas were, respectively, 132,003 km2 and 37,615 km2 in Mongolia and Russia, which were smaller than the desertification aggravation area. In general, the desertification degrees showed changing trends between 2000 and 2015 (Table 8). In total, 147,545 km2 of severe desertification was converted into the high desertification, 88,306 km2 of severe desertification was transformed into slight desertification, and 22,950 km2 of severe desertification was converted into moderate desertification. Moreover, 178,268 km2 of the high desertification area degraded into severe desertification. In total, 121,532 km2 of high desertification was converted into light desertification, in which the areas of moderate, slight, and non-desertification were 33,143 km2, 84,278 km2, and 4111 km2, respectively. Moreover, 60,573 km2 of the moderate desertification deteriorated into severe and high desertification, accounting for 1.58%, and 34.6%, respectively. Conversely, 41.63% (69,710 km2) of the moderate desertification area was transformed into slight and non-desertification. The slight desertification and non-desertification areas showed a better stability (Figure 6).
3.3. Impacts of Human Activities and Climate Change on Desertification
The spatial differences between human activities and climate change on desertification change showed significant spatial heterogeneity (Figure 7). The increase in the desertification reversion area was mainly driven by climate change between 2000 and 2015. The contribution of climate change to desertification in the CMREC area is higher than 50%, amounting to 68.8% (381.162 km2) of the total desertification reversion area (Table 9). The desertification reversion areas were mainly distributed in the eastern and central regions of Inner Mongolia in China, and the east of Mongolia. The reversion areas, mainly caused by human activities, accounted for 27.36% (151.598 km2) of the whole desertification reversion area, which was distributed across the western regions of Inner Mongolia in China, and the eastern area of Mongolia. However, the degraded area reached up to 69.68% (396.648 km2) between 2000 and 2015, and was majorly distributed in the central regions of Inner Mongolia in China and the western area of Mongolia, in which the impacts of human activities were higher than 50%.
Moreover, comparing the differences in desertification change from 2000 to 2015 between China, Mongolia and Russia in the CMREC area shows that the areas of desertification reversion and expansion were, respectively, 269.88 km2 and 78.03 km2, in which the expansion area caused by human activities was 144.91 km2 (68.64%) in China. The areas of desertification reversion and expansion were, respectively, 97.1 km2 (57.3%) and 70.81 km2 (42.1%), in which the expansion area mainly caused by human activities was 188.27 km2 (65.62%) in Mongolia. The areas of desertification reversion and expansion were, respectively, 14.18 km2 (37.84%) and 63.47 km2 (95.52%) in Russia.
The result of the driving mechanism incorporated some “Error” regions defined in Table 5. The “Error” area of the desertification reversion indicated that the actual vegetation growth was getting better, but the impact of climate change and human activities were causing more land degradation. Those areas were mainly distributed in Russia, accounting for 3.83% of the whole desertification reversion area (Table 9). Conversely, the “Error” area of the desertification expansion was defined as the region where the actual vegetation status was degraded, but the impact of climate change and human activities benefited better from vegetation growth, and those areas amounted to 28.87% of the total desertification expansion area. In general, these phenomena, marked as “Error” regions, were mainly caused by the uncertainty of multisource remote sensing data to map the desertification pattern, and the driving mechanism based on NPP was often affected by the noise of climate factors, so it is difficult to avoid these “Error” areas [31].
In order to further explain the relative roles of human activities and climate change in desertification in the CMREC area, annual total precipitation, average temperature and annual total evapotranspiration were selected to represent climate change, and per capita GDP was used to describe human activities (Figure 8). Combining these alternative indices can also explicitly illuminate the driving mechanism of the “Error” regions mapped by the temporal datasets and NPP. The annual average temperature in the CMREC area increased by 1.57 °C, especially in the southwestern CMREC area where severe desertification was mainly distributed between 2000 and 2015. The significant reversion and reversion areas of desertification were mainly located in the region where the annual total precipitation increased by more than 50 mm from 2000 to 2015, especially in the northeast plain, the south of the Greater Hinggan Mountains and the Ordos Plateau (Figure 5 and Figure 8) of China. The distribution of the reversed desertification area was consistent with the increased precipitation area and the decreased evapotranspiration area (Figure 8). The annual total precipitation in the severe and high desertification areas showed an increasing trend, and the annual evapotranspiration also increased by more than 25 mm in Mongolia. In general, the significant expansion and expansion areas in the CMREC area were mainly affected by the increasing trend of temperature and evapotranspiration, which showed that the rising temperature contributed to the increasing soil evaporation that additionally accelerated land degradation, especially in the “Error” area.
However, the change trend of climate change cannot be used to explicitly describe the dynamics of desertification due to the spatial–temporal heterogeneity of climate change in the CMREC area. The impact of human activities on desertification expansion was more than that of climate change in the CMREC area between 2000 and 2015. The per capita GDP of the total area increased by USD 6369. The Omnogovi aimag of Mongolia, in the “Error” region, had the fastest growth in per capita GDP, mainly due to its rich mineral resources, such as Oyu Tolgoi, the world’s largest copper mine, which is likely to be associated with desertification expansion. Moreover, the desertification in China was restored due to the implementation of a series of national major ecological projects, such as the Beijing and Tianjin Sand Source Control Project since 2002, and the Return Grazing to Grass Program since 2003.
4. Discussion
Based on the GEE cloud platform, multisource remote sensing datasets and vegetation, soil, terrain and climate data can be conveniently combined to monitor the long-term dynamics of desertification changes in large-scale areas [29,41,43]. Moreover, the identified results of desertification degrees in the CMREC area show that the CART, SVM, RF, and Albedo-NDVI models [25,26] can be conveniently operated in the GEE cloud platform, in which the optimal model is selected to extract the change patterns of desertification with multisource remote sensing data in different periods. Based on different types of basic data, there are different accuracies in relation to a certain study object [27,28]. To identify the desertification, the CART model is better than the RF and SVM methods, and could be used to efficiently extract the change patterns of desertification in the CMREC area.
Different vegetation indices [23], such as NDVI, topsoil grain size index (TGSI), land surface albedo (Albedo), soil-regulated vegetation index (MSAVI), and bare soil index (BSI), can be used to explain different change trends of land cover [8,12,59]. Multi-parameters can assess dynamic desertification change [17] through classification regression tree (CART) methods [24]. Thus, PNPP and HANPP could be integrated to explain the changing trends of desertification under the effects of climate change and human activities. The linear trend method could be introduced to calculate the impacts of climate change and human activities on desertification. However, currently, during the process of identifying the change patterns of desertification in the CMREC area, the downscaling process for the vegetation, soil, terrain, and climate indicators with different resolutions may be affecting the accuracy [62]. In future works, the important textural features of land types and the interannual changes in various indicators will be considered, which can provide cropland shape information and growth curves of vegetation [63,64]. Moreover, the object-oriented approach, coupled with the SVM model for mapping desertification, can be used to obtain land cover change information with time series images [65]. These approaches will help the CART model to further distinguish the difference between desertification and other similar land cover types, such as fallow cropland and bare land.
Since the 21st century, areas of severe, high, and moderate desertification have decreased, while areas of slight desertification have increased in the CMREC area [29,35,40]. Meanwhile, the total area of various desertification degrees, including severe, high, moderate, and slight desertification, declined in China, but severe and moderate desertification areas expanded heavily in Mongolia [41,66]. These results are consistent with some recent research studies conducted in China, Mongolia, and Russia [22,23,38,67]. Furthermore, grassland was the main land cover type, accounting for 49.12% of the CMREC area, and bare land was also widely distributed, accounting for 14.59%, especially in the southwestern CMREC area between 2000 and 2015. The degradation of grassland areas meant that they were mainly converted into bare land, accounting for 89.94% of the total increased bare land area. These land cover changes also indicated that extremely severe desertification areas experienced a reducing trend [68], which additionally verifies the research results. Moreover, current studies show that drylands are one of the most sensitive areas to climate change and human activities [4], and the increasing temperature, evapotranspiration and growing human activities will exacerbate the risk of land degradation and desertification in the near future in the drylands of developing countries [69,70]. Therefore, we should not only consider the impact of climate warming, but also pay more attention to the impact of human activities on the desertification in the CMREC area in the future.
5. Conclusions
The research results indicate that the CART model is more suitable to identify the changing patterns of desertification in the CMREC area than the other three methods. The total area of the severe, high, and moderate desertification types showed a declining trend, while the area of slight desertification increased in the CMREC area between 2000 and 2015. The total area of land degradation zones decreased in China, but contrarily increased in Mongolia and Russia. Severe desertification areas were mainly converted into high desertification areas, and the slight desertification areas were mainly converted into non-desertification areas in desertification reversion areas. High desertification areas were mainly converted into severe desertification areas in desertification expansion areas. In general, the impact of climate change on desertification degradation was higher than that of human activities in the CMREC area. Moreover, understanding the changing patterns of desertification would be beneficial in order to understand the future carbon balance of vegetation ecosystems, which could be approved by the data supporting plans for the sustainable development of countries in the CMREC area.
Author Contributions
Conceptualization, Z.F.; methodology, Z.F. and S.L.; software, Z.F. and S.L.; validation, Z.F. and S.L.; formal analysis, Z.F. and H.F.; investigation, Z.F. and S.L.; resources, Z.F. and S.L.; data curation, Z.F., S.L. and H.F.; writing—original draft preparation, Z.F. and S.L.; writing—review and editing, Z.F. and H.F.; visualization, Z.F. and S.L.; supervision, Z.F. and H.F.; project administration, Z.F. and H.F.; and funding acquisition, Z.F. and H.F. All authors have read and agreed to the published version of the manuscript.
Funding
This work was supported by the Strategic Priority Research Program (A) of the Chinese Academy of Sciences (XDA20030203), the National Key R&D Program of China (2017YFA0603702 and 2018YFC0507202), the National Natural Science Foundation (41971358, 41930647 and 41977066), and the Innovation Project of the State Key Laboratory of Resources and Environmental Information Systems (O88RA600YA).
Conflicts of Interest
The authors declare no conflict of interest.
References
- United Nations Convention to Combat Desertifification (UNCCD). United Nations Convention to Combat Desertifification in Countries Experiencing Serious Drought and/or Esertifification, Particularly in Africa; United Nations: Paris, France, 1994. [Google Scholar]
- Collado, A.D.; Chuvieco, E.; Camarasa, A. Satellite remote sensing analysis to monitor desertification processes in the crop-rangeland boundary of Argentina. J. Arid Environ. 2002, 52, 121–133. [Google Scholar] [CrossRef]
- Ma, H.; Zhao, H. United Nations: Convention to combat desertification in those countries experiencing serious drought and/or desertification, particularly in Africa. Int. Legal. Mater. 1994, 33, 1328–1382. [Google Scholar]
- Reynolds, J.F.; Smith, D.M.S.; Lambin, E.F.; Turner, B.L.; Mortimore, M.; Batterbury, S.P.J.; Downing, T.E.; Dowlatabadi, H.; Fernández, R.J.; Herrick, J.E.; et al. Global Desertification: Building a Science for Dryland Development. Science 2007, 316, 847–851. [Google Scholar] [CrossRef] [PubMed] [Green Version]
- Barbut, M.; Alexander, S. Land degradation as a security threat amplifier: The new global frontline. In Land Restoration; Academic Press: Cambridge, MA, USA, 2016; pp. 3–12. [Google Scholar]
- Johnson, P.M.; Mayrand, K.; Paquin, M. Governing Global Desertification: Linking Environmental Degradation, Poverty and Participation; Ashgate Publishing, Ltd.: Farnham, UK, 2006. [Google Scholar]
- Chasek, P.; Akhtar-Schuster, M.; Orr, B.J.; Luise, A.; Ratsimba, H.R.; Safriel, U. Land degradation neutrality: The science-policy interface from the UNCCD to national implementation. Environ. Sci. Policy 2019, 92, 182–190. [Google Scholar] [CrossRef]
- Fan, Z.; Bai, R.; Yue, T. Scenarios of land cover in Eurasia under climate change. J. Geogr. Sci. 2020, 30, 3–17. [Google Scholar] [CrossRef] [Green Version]
- Fan, Z.; Fan, B.; Yue, T. Terrestrial ecosystem scenarios and their response to climate change in Eurasia. Sci. China-Earth Sci. 2019, 62, 1607–1618. [Google Scholar] [CrossRef]
- Sternberg, T.; Rueff, H.; Middleton, N. Contraction of the Gobi desert, 2000–2012. Remote Sens. 2015, 7, 1346–1358. [Google Scholar] [CrossRef] [Green Version]
- Del Valle, H.; Elissalde, N.; Gagliardini, D.A.; Milovich, J. Status of desertification in the Patagonian region: Assessment and mapping from satellite imagery. Arid Land Res. Manag. 1998, 12, 95–121. [Google Scholar] [CrossRef]
- Jiang, L.; Jiapaer, G.; Bao, A.; Kurban, A.; Guo, H.; Zheng, G.; De Maeyer, P. Monitoring the long-term desertification process and assessing the relative roles of its drivers in Central Asia. Ecol. Indic. 2019, 104, 195–208. [Google Scholar] [CrossRef]
- Tucker, C.J.; Dregne, H.E.; Newcomb, W.W. Expansion and contraction of the Sahara Desert from 1980 to 1990. Science 1991, 253, 299–300. [Google Scholar] [CrossRef]
- Holm, A.M.; Cridland, S.W.; Roderick, M.L. The use of time-integrated NOAA NDVI data and rainfall to assess landscape degradation in the arid shrubland of Western Australia. Remote Sens. Environ. 2003, 85, 145–158. [Google Scholar] [CrossRef]
- Geerken, R.; Ilaiwi, M. Assessment of rangeland degradation and development of a strategy for rehabilitation. Remote Sens. Environ. 2004, 90, 490–504. [Google Scholar] [CrossRef]
- Karnieli, A.; Bayarjargal, Y.; Bayasgalan, M.; Mandakh, B.; Dugarjav, C.; Burgheimer, J.; Khudulmur, S.; Bazha, S.; Gunin, P. Do vegetation indices provide a reliable indication of vegetation degradation? A case study in the Mongolian pastures. Int. J. Remote Sens. 2013, 34, 6243–6262. [Google Scholar] [CrossRef]
- Jiang, Z.; Lian, Y.; Qin, X. Rocky desertification in Southwest China: Impacts, causes, and restoration. Earth-Sci. Rev. 2014, 132, 1–12. [Google Scholar] [CrossRef]
- Becerril-Pina, R.; Mastachi-Loza, C.A.; González-Sosa, E.; Díaz-Delgado, C.; Bâ, K.M. Assessing desertification risk in the semi-arid highlands of central Mexico. J. Arid Environ. 2015, 120, 4–13. [Google Scholar] [CrossRef]
- Zhao, H.-L.; Zhao, X.-Y.; Zhou, R.-L.; Zhang, T.-H.; Drake, S. Desertification processes due to heavy grazing in sandy rangeland, Inner Mongolia. J. Arid Environ. 2005, 62, 309–319. [Google Scholar] [CrossRef]
- Wang, X.; Hua, T.; Lang, L.; Ma, W. Spatial differences of aeolian desertification responses to climate in arid Asia. Glob. Planet. Chang. 2017, 148, 22–28. [Google Scholar] [CrossRef] [Green Version]
- Tollefson, J.; Gilbert, N. Rio report card: The world has jailed to deliver on many of the promises it made 20 years ago at the Earth summit in Brazil. Nature 2012, 486, 20–24. [Google Scholar] [CrossRef]
- Lamchin, M.; Lee, J.Y.; Lee, W.K.; Lee, E.J.; Kim, M.; Lim, C.H.; Choi, H.A.; Kim, S.R. Assessment of land cover change and desertification using remote sensing technology in a local region of Mongolia. Adv. Space Res. 2016, 57, 64–77. [Google Scholar] [CrossRef]
- Ma, Z.; Xie, Y.; Jiao, J.; Wang, X. The Construction and Application of an Aledo-NDVI Based Desertification Monitoring Model. Procedia Environ. Sci. 2011, 10, 2029–2035. [Google Scholar] [CrossRef] [Green Version]
- Chen, F.; Wang, S.J.; Bai, X.Y.; Liu, F.; Zhou, D.Q.; Tian, Y.C.; Luo, G.J.; Li, Q.; Wu, L.H.; Zheng, C.; et al. Assessing spatial-temporal evolution processes and driving forces of karst rocky desertification. Geocarto Int. 2019. [Google Scholar] [CrossRef]
- Xu, E.Q.; Zhang, H.Q.; Li, M.X. Object-based mapping of karst rocky desertification using a support vector machine. Land Degrad. Dev. 2015, 26, 158–167. [Google Scholar] [CrossRef]
- Guo, Q.; Fu, B.; Shi, P.; Cudahy, T.; Zhang, J.; Xu, H. Satellite Monitoring the Spatial-Temporal Dynamics of Desertification in Response to Climate Change and Human Activities across the Ordos Plateau, China. Remote Sens. 2017, 9, 525. [Google Scholar] [CrossRef] [Green Version]
- Noyola-Medrano, C.; Martinez-Sias, V.A. Assessing the progress of desertification of the southern edge of Chihuahuan Desert: A case study of San Luis Potosi Plateau. J. Geogr. Sci. 2017, 27, 420–438. [Google Scholar] [CrossRef] [Green Version]
- Pan, J.H.; Li, T.Y. Extracting desertification from Landsat TM imagery based on spectral mixture analysis and Albedo-Vegetation feature space. Nat. Hazards 2013, 68, 915–927. [Google Scholar] [CrossRef]
- Hu, Y.F.; Hu, Y. Land cover changes and their driving mechanisms in central asia from 2001 to 2017 supported by google earth engine. Remote Sens. 2019, 11, 554. [Google Scholar] [CrossRef] [Green Version]
- Veron, S.; Paruelo, J.; Oesterheld, M. Assessing desertification. J. Arid Environ. 2006, 66, 751–763. [Google Scholar] [CrossRef]
- Sun, D.F.; Dawson, R.; Li, B.G. Agricultural causes of desertification risk in Minqin, China. J. Environ. Manage. 2006, 79, 348–356. [Google Scholar]
- Xu, H.L.; Ye, M.; Song, Y.D.; Chen, Y.N. The natural vegetation responses to the groundwater change resulting from ecological water conveyances to the lower tarim river. Environ. Monit. Assess. 2007, 131, 37–48. [Google Scholar] [CrossRef]
- Xie, L.; Zhong, J.; Chen, F.; Cao, F.; Li, J.; Wu, L. Evaluation of soil fertility in the succession of karst rocky desertification using principal component analysis. Solid Earth 2015, 6, 515. [Google Scholar] [CrossRef] [Green Version]
- Wessels, K.; Prince, S.; Reshef, I. Mapping land degradation by comparison of vegetation production to spatially derived estimates of potential production. J. Arid Environ. 2008, 72, 1940–1949. [Google Scholar] [CrossRef]
- Evans, J.; Geerken, R. Discrimination between climate and human-induced dryland degradation. J. Arid Environ. 2004, 57, 535–554. [Google Scholar] [CrossRef]
- Haberl, H. Human appropriation of net primary production as an environmental indicator: Implications for sustainable development. Ambio 1997. [Google Scholar] [CrossRef]
- Zhang, C.; Wang, X.; Li, J.; Hua, T. Roles of climate changes and human interventions in land degradation: A case study by net primary productivity analysis in China’s Shiyanghe Basin. Environ. Earth Sci. 2011, 64, 2183–2193. [Google Scholar] [CrossRef]
- Zhou, W.; Gang, C.; Zhou, F.; Li, J.; Dong, X.; Zhao, C. Quantitative assessment of the individual contribution of climate and human factors to desertification in northwest China using net primary productivity as an indicator. Ecol. Indic. 2015, 48, 560–569. [Google Scholar] [CrossRef]
- Vitousek, P.M.; Ehrlich, P.R.; Ehrlich, A.H.; Matson, P.A. Human appropriation of the products of photosynthesis. BioScience 1986, 36, 368–373. [Google Scholar] [CrossRef]
- Xu, D.; Li, C.; Song, X.; Ren, H. The dynamics of desertification in the farming-pastoral region of North China over the past 10 years and their relationship to climate change and human activity. Catena 2014, 123, 11–22. [Google Scholar] [CrossRef]
- Dong, J.; Xiao, X.; Menarguez, M.A.; Zhang, G.; Qin, Y.; Thau, D.; Biradar, C.; Moore III, B. Mapping paddy rice planting area in northeastern Asia with Landsat 8 images, phenology-based algorithm and Google Earth Engine. Remote Sens. Environ. 2016, 185, 142–154. [Google Scholar] [CrossRef] [Green Version]
- Markert, K.N.; Schmidt, C.M.; Griffin, R.E.; Flores, A.I.; Poortinga, A.; Saah, D.S.; Muench, R.E.; Clinton, N.E.; Chishtie, F.; Kityuttachai, K. Historical and operational monitoring of surface sediments in the lower mekong basin using landsat and google earth engine cloud computing. Remote Sens. 2018, 10, 909. [Google Scholar] [CrossRef] [Green Version]
- Nyland, K.E.; Gunn, G.E.; Shiklomanov, N.I.; Engstrom, R.N.; Streletskiy, D.A. Land cover change in the lower Yenisei River using dense stacking of landsat imagery in Google Earth Engine. Remote Sens. 2018, 10, 1226. [Google Scholar] [CrossRef] [Green Version]
- Peel, M.C.; Finlayson, B.L.; McMahon, T.A. Updated world map of the Köppen-Geiger climate classification. Hydrol. Earth Syst. Sci. 2007. [Google Scholar] [CrossRef] [Green Version]
- Ershadi, A.; McCabe, M.F.; Evans, J.P.; Walker, J.P. Effects of spatial aggregation on the multi-scale estimation of evapotranspiration. Remote Sens. Environ. 2013, 131, 51–62. [Google Scholar] [CrossRef]
- Zhao, M.S.; Heinsch, F.A.; Nemani, R.R.; Running, S.W. Improvements of the MODIS terrestrial gross and net primary production global data set. Remote Sens. Environ. 2005, 95, 164–176. [Google Scholar] [CrossRef]
- Duan, H.C.; Wang, T.; Xue, X.; Liu, S.L.; Guo, J. Dynamics of aeolian desertification and its driving forces in the Horqin Sandy Land, Northern China. Environ. Monit. Assess. 2014, 186, 6083–6096. [Google Scholar] [CrossRef]
- Wang, T.; Wu, W.; Xue, X.; Sun, Q.W.; Chen, G.T. Study of spatial distribution of sandy desertification in North China in recent 10 years. Sci. China Ser. D-Earth Sci. 2004, 47, 78–88. [Google Scholar] [CrossRef]
- Lieth, H. Evapotranspiration and primary productivity: CW Thornthwaite memorial model. Pub. Climatol. 1972, 25, 37–46. [Google Scholar]
- Qi, J.; Chehbouni, A.; Huete, A.R.; Kerr, Y.H.; Sorooshian, S. A Modified Soil Adjusted Vegetation Index. Remote Sens. Environ. 1994, 48, 119–126. [Google Scholar] [CrossRef]
- Serrano, L.; Ustin, S.L.; Roberts, D.A.; Gamon, J.A.; Penuelas, J. Deriving water content of chaparral vegetation from AVIRIS data. Remote Sens. Environ. 2000, 74, 570–581. [Google Scholar] [CrossRef]
- Gao, B.C. NDWI—A normalized difference water index for remote sensing of vegetation liquid water from space. Remote Sens. Environ. 1996, 58, 257–266. [Google Scholar] [CrossRef]
- Peng, F.; Fan, W.J.; Xu, X.R.; Liu, X.; IEEE. Analysis on temporal-spatial change of vegetation coveraga in hulunbuir steppe (2000–2014). In 2016 IEEE International Geoscience and Remote Sensing Symposium; IEEE: New York, NY, USA, 2016; pp. 4514–4517. [Google Scholar]
- Breiman, L.; Friedman, J.; Stone, C.J.; Olshen, R.A. Classification and Regression Trees; CRC press: Boca Raton, FL, USA, 1984. [Google Scholar]
- Mallet, C.; Bretar, F.; Roux, M.; Soergel, U.; Heipke, C. Relevance assessment of full-waveform lidar data for urban area classification. ISPRS-J. Photogramm. Remote Sens. 2011, 66, S71–S84. [Google Scholar] [CrossRef]
- Breiman, L. Random forests. Mach. Learn. 2001, 45, 5–32. [Google Scholar] [CrossRef] [Green Version]
- Deng, X.F.; Liu, Z.; Zhan, Y.; Ni, K.; Zhang, Y.Z.; Ma, W.Z.; Shao, S.Z.; Lv, X.N.; Yuan, Y.W.; Rogers, K.M. Predictive geographical authentication of green tea with protected designation of origin using a random forest model. Food Control 2020, 107. [Google Scholar] [CrossRef]
- Gromski, P.S.; Correa, E.; Vaughan, A.A.; Wedge, D.C.; Turner, M.L.; Goodacre, R. A comparison of different chemometrics approaches for the robust classification of electronic nose data. Anal. Bioanal. Chem. 2014, 406, 7581–7590. [Google Scholar] [CrossRef] [PubMed]
- Fan, Z.M.; Li, J.; Yue, T.X.; Zhou, X.; Lan, A.J. Scenarios of land cover in Karst area of Southwestern China. Environ. Earth Sci. 2015, 74, 6407–6420. [Google Scholar] [CrossRef]
- Fan, Z.M.; Li, J.; Yue, T.X. Land-cover changes of biome transition zones in Loess Plateau of China. Ecol. Model. 2013, 252, 129–140. [Google Scholar] [CrossRef]
- Running, S.W.; Nemani, R.; Glassy, J.M.; Thornton, P.E. MODIS Daily Photosynthesis (PSN) and Annual Net Primary Production (NPP) Product (MOD17), Algorithm Theoretical Basis Document. University of Montana, SCF At-Launch Algorithm ATBD Documents. 1999. Available online: https://lpdaac.usgs.gov/documents/95/MOD17_ATBD.pdf (accessed on 20 September 2020).
- De Caceres, M.; Martin-StPaul, N.; Turco, M.; Cabon, A.; Granda, V. Estimating daily meteorological data and downscaling climate models over landscapes. Environ. Modell. Softw. 2018, 108, 186–196. [Google Scholar] [CrossRef]
- Saboori, M.; Torahi, A.A.; Bakhtyari, H.R.R. Combining multi-scale textural features from the panchromatic bands of high spatial resolution images with ANN and MLC classification algorithms to extract urban land uses. Int. J. Remote Sens. 2019, 40, 8608–8634. [Google Scholar] [CrossRef]
- Dara, A.; Baumann, M.; Kuemmerle, T.; Pflugmacher, D.; Rabe, A.; Griffiths, P.; Hölzel, N.; Kamp, J.; Freitag, M.; Hostert, P. Mapping the timing of cropland abandonment and recultivation in northern Kazakhstan using annual Landsat time series. Remote Sens. Environ. 2018, 213, 49–60. [Google Scholar] [CrossRef]
- Yu, S.N.; Zhang, X.K.; Zhang, X.L.; Liu, H.J.; Qi, J.G.; Sun, Y.K. Detecting and Assessing Nondominant Farmland Area with Long-Term MODIS Time Series Images. Remote Sens. 2020, 12, 2441. [Google Scholar] [CrossRef]
- Li, Q.; Zhang, C.; Shen, Y.; Jia, W.; Li, J. Quantitative assessment of the relative roles of climate change and human activities in desertification processes on the Qinghai-Tibet Plateau based on net primary productivity. Catena 2016, 147, 789–796. [Google Scholar] [CrossRef]
- Jamsranjav, C.; Fernández-Giménez, M.E.; Reid, R.S.; Adya, B. Opportunities to integrate herders’ indicators into formal rangeland monitoring: An example from Mongolia. Ecol. Appl. 2019, 29, e01899. [Google Scholar] [CrossRef] [PubMed] [Green Version]
- Liu, J.; Zhang, Z.; Xu, X.; Kuang, W.; Zhou, W.; Zhang, S.; Li, R.; Yan, C.; Yu, D.; Wu, S.; et al. Spatial patterns and driving forces of land use change in China during the early 21st century. J. Geogr. Sci. 2010, 20, 483–494. [Google Scholar] [CrossRef]
- Huang, J.P.; Yu, H.P.; Guan, X.D.; Wang, G.Y.; Guo, R.X. Accelerated dryland expansion under climate change. Nat. Clim. Chang. 2016, 6, 166–171. [Google Scholar] [CrossRef]
- Xu, D.Y.; Kang, X.W.; Zhuang, D.F.; Pan, J.J. Multi-scale quantitative assessment of the relative roles of climate change and human activities in desertification—A case study of the Ordos Plateau, China. J. Arid Environ. 2010, 74, 498–507. [Google Scholar] [CrossRef]
Figure 1.
The vegetation distribution (a), location and digital elevation model (DEM) (b) of the China–Mongolia–Russia Economic Corridor (CMREC) area.
Figure 1.
The vegetation distribution (a), location and digital elevation model (DEM) (b) of the China–Mongolia–Russia Economic Corridor (CMREC) area.

Figure 2.
Flowchart of desertification assessment and mechanism analysis.

Figure 3.
Comparison of different desertification pattern products in 2015. Landsat 8 is false color composition in 2015 (RGB: B5, B4, B3). CART, RF, SVM and Albedo-NDVI are products of four kinds of methods, respectively.
Figure 3.
Comparison of different desertification pattern products in 2015. Landsat 8 is false color composition in 2015 (RGB: B5, B4, B3). CART, RF, SVM and Albedo-NDVI are products of four kinds of methods, respectively.

Figure 4.
Spatial distribution of desertification degrees in 2000 (a) and 2015 (b).

Figure 5.
The changes in each desertification degree.

Figure 6.
Sankey plot showing conversions from one desertification status to another between 2000 and 2015. The left and right axes of this plot are the area of the desertification status in 2000 and 2015, respectively. The band width represents the size of the converted area (Unit: 104 km2) from 2000 to 2015.

Figure 7.
The spatial differences between human activities and climate change on desertification reversion (a) and expansion (b).
Figure 7.
The spatial differences between human activities and climate change on desertification reversion (a) and expansion (b).

Figure 8.
Change trends of annual total precipitation (a), average temperature (b), and annual total evapotranspiration (c), and per capita GDP (d) in the CMREC area between 2000 and 2015.
Figure 8.
Change trends of annual total precipitation (a), average temperature (b), and annual total evapotranspiration (c), and per capita GDP (d) in the CMREC area between 2000 and 2015.


Table 1.
Basic datasets.
| Data | Data Sources | Spatial Resolution | Temporal Resolution/Data Acquisition Dates | Data ID 1 |
|---|---|---|---|---|
| Landsat | http://landsat.usgs.gov/ | 30 m | 16 days/2000, 2015 | LANDSAT/LT05/C01/T1_SR; LANDSAT/LE07/C01/T1_SR; LANDSAT/LC08/C01/T1_SR |
| SRTM3 | http://dwtkns.com/srtm30m/ | 30 m | —/— | USGS/SRTMGL1_003 |
| LST | https://lpdaac.usgs.gov/products/mod11a2v006/ | 1000 m | 8 days/2000-2015 | MODIS/006/MOD11A2 |
| ESA LC | http://maps.elie.ucl.ac.be/CCI/viewer/download.php | 300 m | 1 year/2000, 2015 | — |
| MCD12Q1 | https://lpdaac.usgs.gov/products/mcd12q1v006/ | 500 m | 1 year/2000, 2015 | MODIS/006/MCD12Q1 |
| Sentinel-2 | https://earth.esa.int/web/sentinel/user-guides/sentinel-2-msi/product-types/level-1c | 10 m | 5 days/2015 | COPERNICUS/S2 |
| VCF | https://lpdaac.usgs.gov/products/gfcc30tcv003/ | 30 m | —/2000, 2005, 2010, 2015 | GLCF/GLS_TCC |
| Sand Content | https://www.openlandmap.org/ | 250 m | —/— | OpenLandMap/SOL/SOL_SAND-WFRACTION_USDA-3A1A1A_M/v02 |
| Global Flux Tower | https://daac.ornl.gov/ | — | —/2000, 2015 | — |
| NPP | https://lpdaac.usgs.gov/products/mod17a3hv006/ | 500 m | 1 year/2000-2015 | MODIS/006/MOD17A3H; |
| WorldClim Rainfall | http://www.climatologylab.org/terraclimate.html | 2.5 arc minutes | 1 month/2000-2015 | IDAHO_EPSCOR/TERRACLIMATE |
| PML | — | 500 m | 8 days/2000-2015 | projects/pml_evapotranspiration/PML/OUTPUT/PML_V1_8day |
| GDP | http://sedac.ciesin.columbia.edu/data/collection/gpw-v4 | 30 arc-seconds | —/2000, 2005, 2010, 2015 | — |
| GLDAS | http://ldas.gsfc.nasa.gov/gldas/ | 0.25 arc degrees | 3 h/2000–2015 | ASA/GLDAS/V021/NOAH/G025/T3H |
1 Note that the data ID represents data available id online (https://code.earthengine.google.com/).
Table 2.
Criterion of desertification degrees.
| Desertification Status | Visual Interpretation | Land Cover Characteristics | Vegetation Coverage (%) |
|---|---|---|---|
| Non-desertification |  | Forests, cropland, and high coverage rate of grassland | >65 |
| Slight |  | Vegetation degradation; the growth of the original plant species was affected | 50–65 |
| Moderate |  | Degenerated plants, low shrub, and sand mounds | 10–50 |
| High |  | The vegetation land starts to convert into wildland in some areas; the grass is mixed with sandy plants in the grassland area | 1–10 |
| Severe |  | Bare land, sandy land, and the Gobi desert | <1 |
Table 3.
Spectral indices and their formulas.
| Spectral Indices | Equation 1 |
|---|---|
| NDVI | |
| FVC | |
| MSAVI | |
| NDWI | |
| TGSI | |
| Albedo | |
| BSI |
1 In Table 3, Red, NIR, SWIR1, SWIR2 and Bule present the red band, near-infrared, short-wave infrared 1, short-wave infrared 2 and blue band, respectively. Normalized difference vegetation index (NDVI)s and NDVIv represent the NDVI values of bare soil and vegetation, respectively. In order to exclude the noise phenomenon of NDVI in the study area, 5% and 95% NDVI values of the frequency distribution histogram of NDVI are selected as NDVIs and NDVIv values, respectively [53].
Table 4.
Comparison of models’ mechanisms.
| Model’s Name | Model Mechanisms |
|---|---|
| Classification and regression tree (CART) | The target variables (desertification degrees) and the test variables (desertification indicators) of the training sample set can be divided into two groups to form a binary tree model. |
| Support vector machine (SVM) | In the feature space of the training dataset, SVM is based on the kernel function to find the support vector with a large distinguishing function and construct the classifier, so as to maximize the distance of desertification degrees in the sample. |
| Random forest (RF) | Based on the statistical theory, RF uses a bootstrap sampling method to extract multiple sample sets from the original sample set and then adopts a decision tree for each sample set, which can combine multiple decision trees for prediction, and finally obtains the prediction results through voting. |
| Albedo-NDVI | Utilizing the negative correlation between Albedo and NDVI, the normalized NDVI and Albedo values are constructed into the Albedo-NDVI feature space scatter diagram, and then the linear relationship between them is determined to attain the desertification difference index (DDI) 1. |
1 Note that the desertification difference index (DDI) was calculated by the following equation: ; ; .
Table 5.
Eight scenarios of the impact of climate change and human activities on desertification.
| Desertification Status | Scenarios | Sp | SH | Definition |
|---|---|---|---|---|
| reversion | Scenario 1 | >0 | >0 | The driving force of climate change is 100% |
| Scenario 2 | <0 | <0 | The driving force of human activities is 100% | |
| Scenario 3 | >0 | <0 | The driving force of desertification reversion partly results from climate change (i.e., ), while the driving force of human activities is the remaining part of the total. | |
| Scenario 4 | <0 | >0 | The scenario is defined as an “Error” area where the actual vegetation growth is getting better, but the impact of climate change and human activities are causing more land degradation. | |
| Expansion | Scenario 1 | <0 | <0 | The driving force of climate change is 100% |
| Scenario 2 | >0 | >0 | The driving force of human activities is 100% | |
| Scenario 3 | <0 | >0 | The driving force of desertification expansion partly results from climate change (i.e., ), while the driving force of human activities is the remaining part of the total. | |
| Scenario 4 | >0 | <0 | The scenario is defined as an “Error” area where the actual vegetation status is degrading, but the impact of climate change and human activities benefited better vegetation growth. |
Table 6.
Accuracy comparison of the four methods (OA, PA, and UA: %).
| Algorithms | Non-Desertification | Slight | Moderate | High | Severe | OA | Kappa | |||||
|---|---|---|---|---|---|---|---|---|---|---|---|---|
| PA | UA | PA | UA | PA | UA | PA | UA | PA | UA | |||
| CART | 95.7 | 95.5 | 58.6 | 77.5 | 70 | 77.5 | 75 | 37.5 | 83.4 | 85.7 | 85 | 0.754 |
| SVM | 82.2 | 86.3 | 17.1 | 21.2 | 40 | 75 | 75 | 18.1 | 10 | 75 | 58.75 | 0.396 |
| RF | 88.5 | 92 | 34.2 | 39.3 | 50 | 62.5 | 100 | 41.4 | 90 | 100 | 75 | 0.602 |
| Albedo-NDVI | 87.5 | 91.9 | 0 | 0 | 100 | 50 | 100 | 100 | 100 | 100 | 85 | 0.722 |
Table 7.
The changes in desertification degrees from 2000 to 2015 (area: km2; percentage: %).
| Severe | High | Moderate | Slight | Non-Desertification | |||
|---|---|---|---|---|---|---|---|
| Total | 2000 | Area | 538,358 | 441,703 | 168,064 | 719,685 | 4,557,603 |
| Percentage | 8.24 | 6.76 | 2.57 | 11.01 | 69.73 | ||
| 2015 | Area | 465,269 | 398,478 | 154,157 | 947,999 | 4,431,883 | |
| Percentage | 7.12 | 6.10 | 2.36 | 14.50 | 67.81 | ||
| 2000–2015 | Area | −73,089 | −43,225 | −13,907 | 228,314 | −125,720 | |
| Percentage | −13.58% | −9.79% | −8.27% | 31.72% | −2.76% | ||
| China | 2000 | Area | 362,888 | 196,807 | 124,393 | 310,998 | 170,692 |
| Percentage | 13.29 | 7.21 | 4.56 | 11.39 | 62.53 | ||
| 2015 | Area | 272,208 | 193,098 | 95,898 | 401,396 | 172,054 | |
| Percentage | 9.93 | 7.04 | 3.50 | 14.64 | 62.75 | ||
| 2000–2015 | Area | −90,680 | −3709 | −28,495 | 90,398 | 1362 | |
| Percentage | −24.99% | −1.88% | −22.91% | 29.07% | 0.80% | ||
| Mongolia | 2000 | Area | 171,887 | 226,925 | 42,866 | 301,878 | 363,434 |
| Percentage | 15.50 | 20.46 | 3.87 | 27.22 | 32.78 | ||
| 2015 | Area | 190,895 | 190,513 | 54,897 | 400,772 | 269,648 | |
| Percentage | 17.22 | 17.18 | 4.95 | 36.14 | 24.32 | ||
| 2000–2015 | Area | 19,008 | −36,412 | 12,031 | 98,894 | −93,786 | |
| Percentage | 11.06% | −16.05% | 28.07% | 32.76% | −25.81% | ||
| Russia | 2000 | Area | 3583 | 17,971 | 804 | 106,810 | 248.73 |
| Percentage | 0.13 | 0.67 | 0.03 | 3.96 | 92.20 | ||
| 2015 | Area | 2167 | 14,867 | 3363 | 145,831 | 244.17 | |
| Percentage | 0.08 | 0.55 | 0.13 | 5.43 | 90.93 | ||
| 2000–2015 | Area | −1416 | −3104 | 2559 | 39,021 | −5 | |
| Percentage | −39.52% | −17.27% | 318.28% | 36.53% | −1.83% |
Table 8.
The conversions of various desertification degrees from 2000 to 2015 (area: km2; percentage: %).
Table 8.
The conversions of various desertification degrees from 2000 to 2015 (area: km2; percentage: %).
| Significant Expansion | Expansion | No Conversion | Reversion | Significant Reversion | ||
|---|---|---|---|---|---|---|
| Total | Area | 82,143 | 550,516 | 5,288,340 | 393,120 | 221,775 |
| Percentage | 1.26 | 8.42 | 80.91 | 6.01 | 3.39 | |
| China | Area | 40,218 | 194,653 | 2,107,904 | 233,211 | 153,514 |
| Percentage | 1.47 | 7.13 | 77.23 | 8.54 | 5.62 | |
| Mongolia | Area | 36,920 | 281,681 | 603,662 | 126,108 | 60,490 |
| Percentage | 3.33 | 25.40 | 54.44 | 11.37 | 5.46 | |
| Russia | Area | 5005 | 74,182 | 2,576,774 | 33,801 | 7771 |
| Percentage | 0.19 | 2.75 | 95.52 | 1.25 | 0.29 |
Table 9.
The differences in desertification change caused by climate change and human activities (area: km2; percentage: %).
Table 9.
The differences in desertification change caused by climate change and human activities (area: km2; percentage: %).
| Climate Change | Human Activities | Error | |||||
|---|---|---|---|---|---|---|---|
| Reversion | Expansion | Reversion | Expansion | Reversion | Expansion | ||
| Total | Area | 381.16 | 8.29 | 151.60 | 396.65 | 21.24 | 164.32 |
| Percentage | 68.80 | 1.46 | 27.37 | 69.68 | 3.83 | 28.87 | |
| China | Area | 269.88 | 0.58 | 78.09 | 144.91 | 0.36 | 65.62 |
| Percentage | 77.48 | 0.27 | 22.42 | 68.64 | 0.10 | 31.09 | |
| Mongolia | Area | 97.10 | 0.01 | 70.81 | 188.27 | 0.28 | 98.62 |
| Percentage | 57.73 | 0.00 | 42.10 | 65.62 | 0.16 | 34.38 | |
| Russia | Area | 14.18 | 2.90 | 2.69 | 63.47 | 20.60 | 0.08 |
| Percentage | 37.84 | 4.37 | 7.19 | 95.52 | 54.97 | 0.11 | |
© 2020 by the authors. Licensee MDPI, Basel, Switzerland. This article is an open access article distributed under the terms and conditions of the Creative Commons Attribution (CC BY) license (http://creativecommons.org/licenses/by/4.0/).
Share and Cite
MDPI and ACS Style
Fan, Z.; Li, S.; Fang, H. Explicitly Identifying the Desertification Change in CMREC Area Based on Multisource Remote Data. Remote Sens. 2020, 12, 3170. https://0-doi-org.brum.beds.ac.uk/10.3390/rs12193170
AMA Style
Fan Z, Li S, Fang H. Explicitly Identifying the Desertification Change in CMREC Area Based on Multisource Remote Data. Remote Sensing. 2020; 12(19):3170. https://0-doi-org.brum.beds.ac.uk/10.3390/rs12193170
Chicago/Turabian StyleFan, Zemeng, Saibo Li, and Haiyan Fang. 2020. "Explicitly Identifying the Desertification Change in CMREC Area Based on Multisource Remote Data" Remote Sensing 12, no. 19: 3170. https://0-doi-org.brum.beds.ac.uk/10.3390/rs12193170
Note that from the first issue of 2016, this journal uses article numbers instead of page numbers. See further details here.