The Relationship between Surface Displacement and Groundwater Level Change and Its Hydrogeological Implications in an Alluvial Fan: Case Study of the Choshui River, Taiwan


Abstract
:
1. Introduction
2. Background of the Alluvial Fan of the Choshui River
2.1. Geological and Hydrogeological Setting
2.2. Evolution of Land Subsidence
3. Data and Methods
3.1. Data Acquisitions
3.2. Persistent Scatterer SAR Interferometry (PSInSAR)
3.3. Multi-Reference Points for PSInSAR
4. Results
4.1. Spatial Variation of Land Subsidence
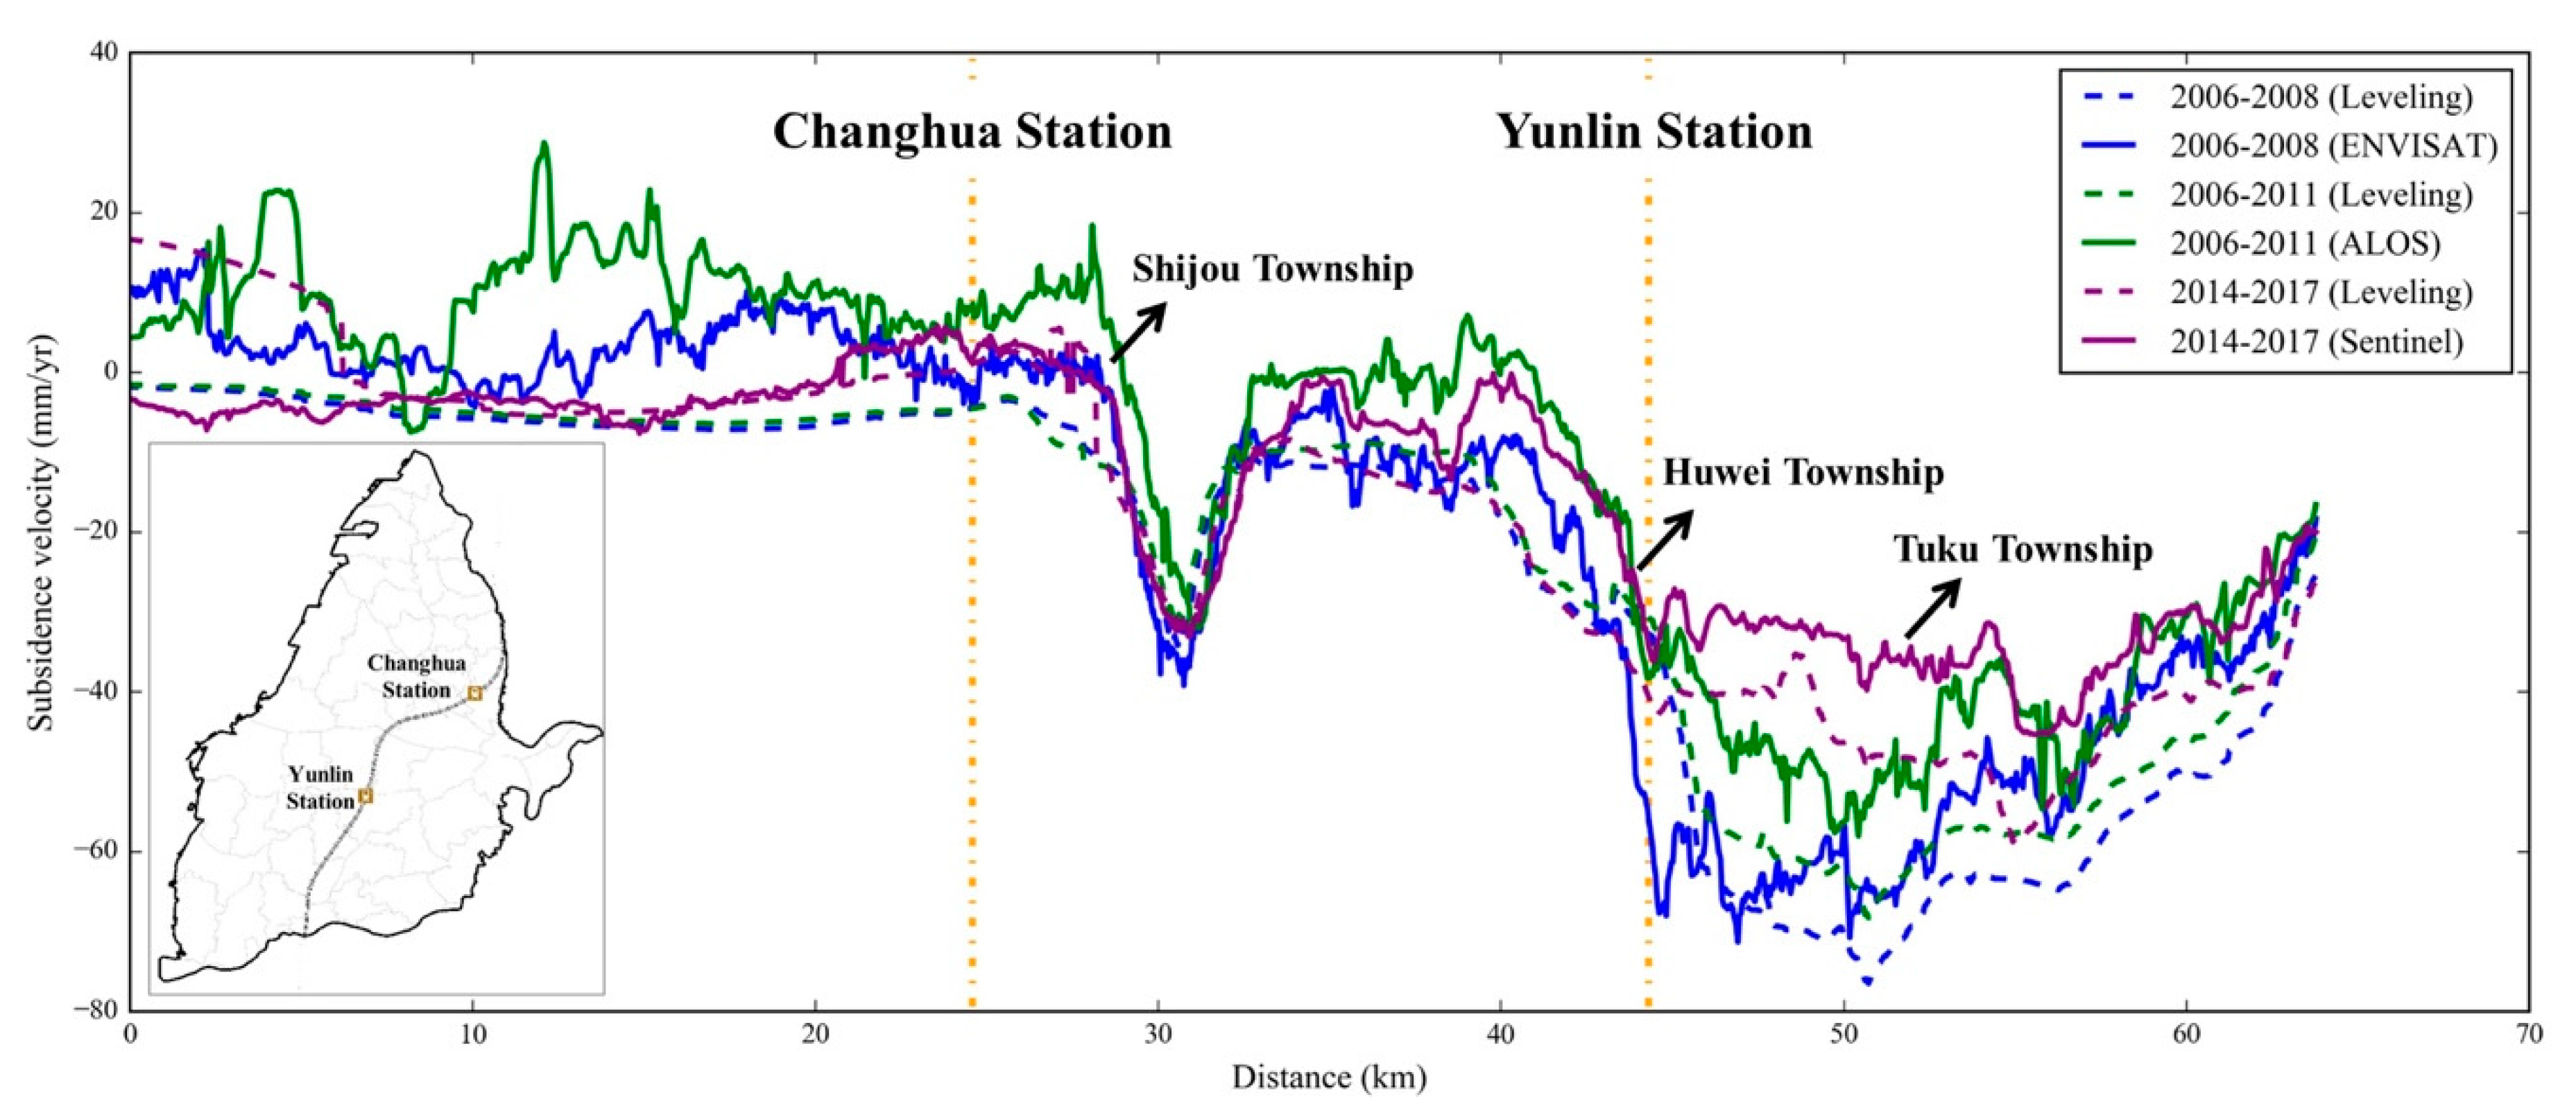
4.2. Subsidence Velocity along the Taiwan High Speed Rail
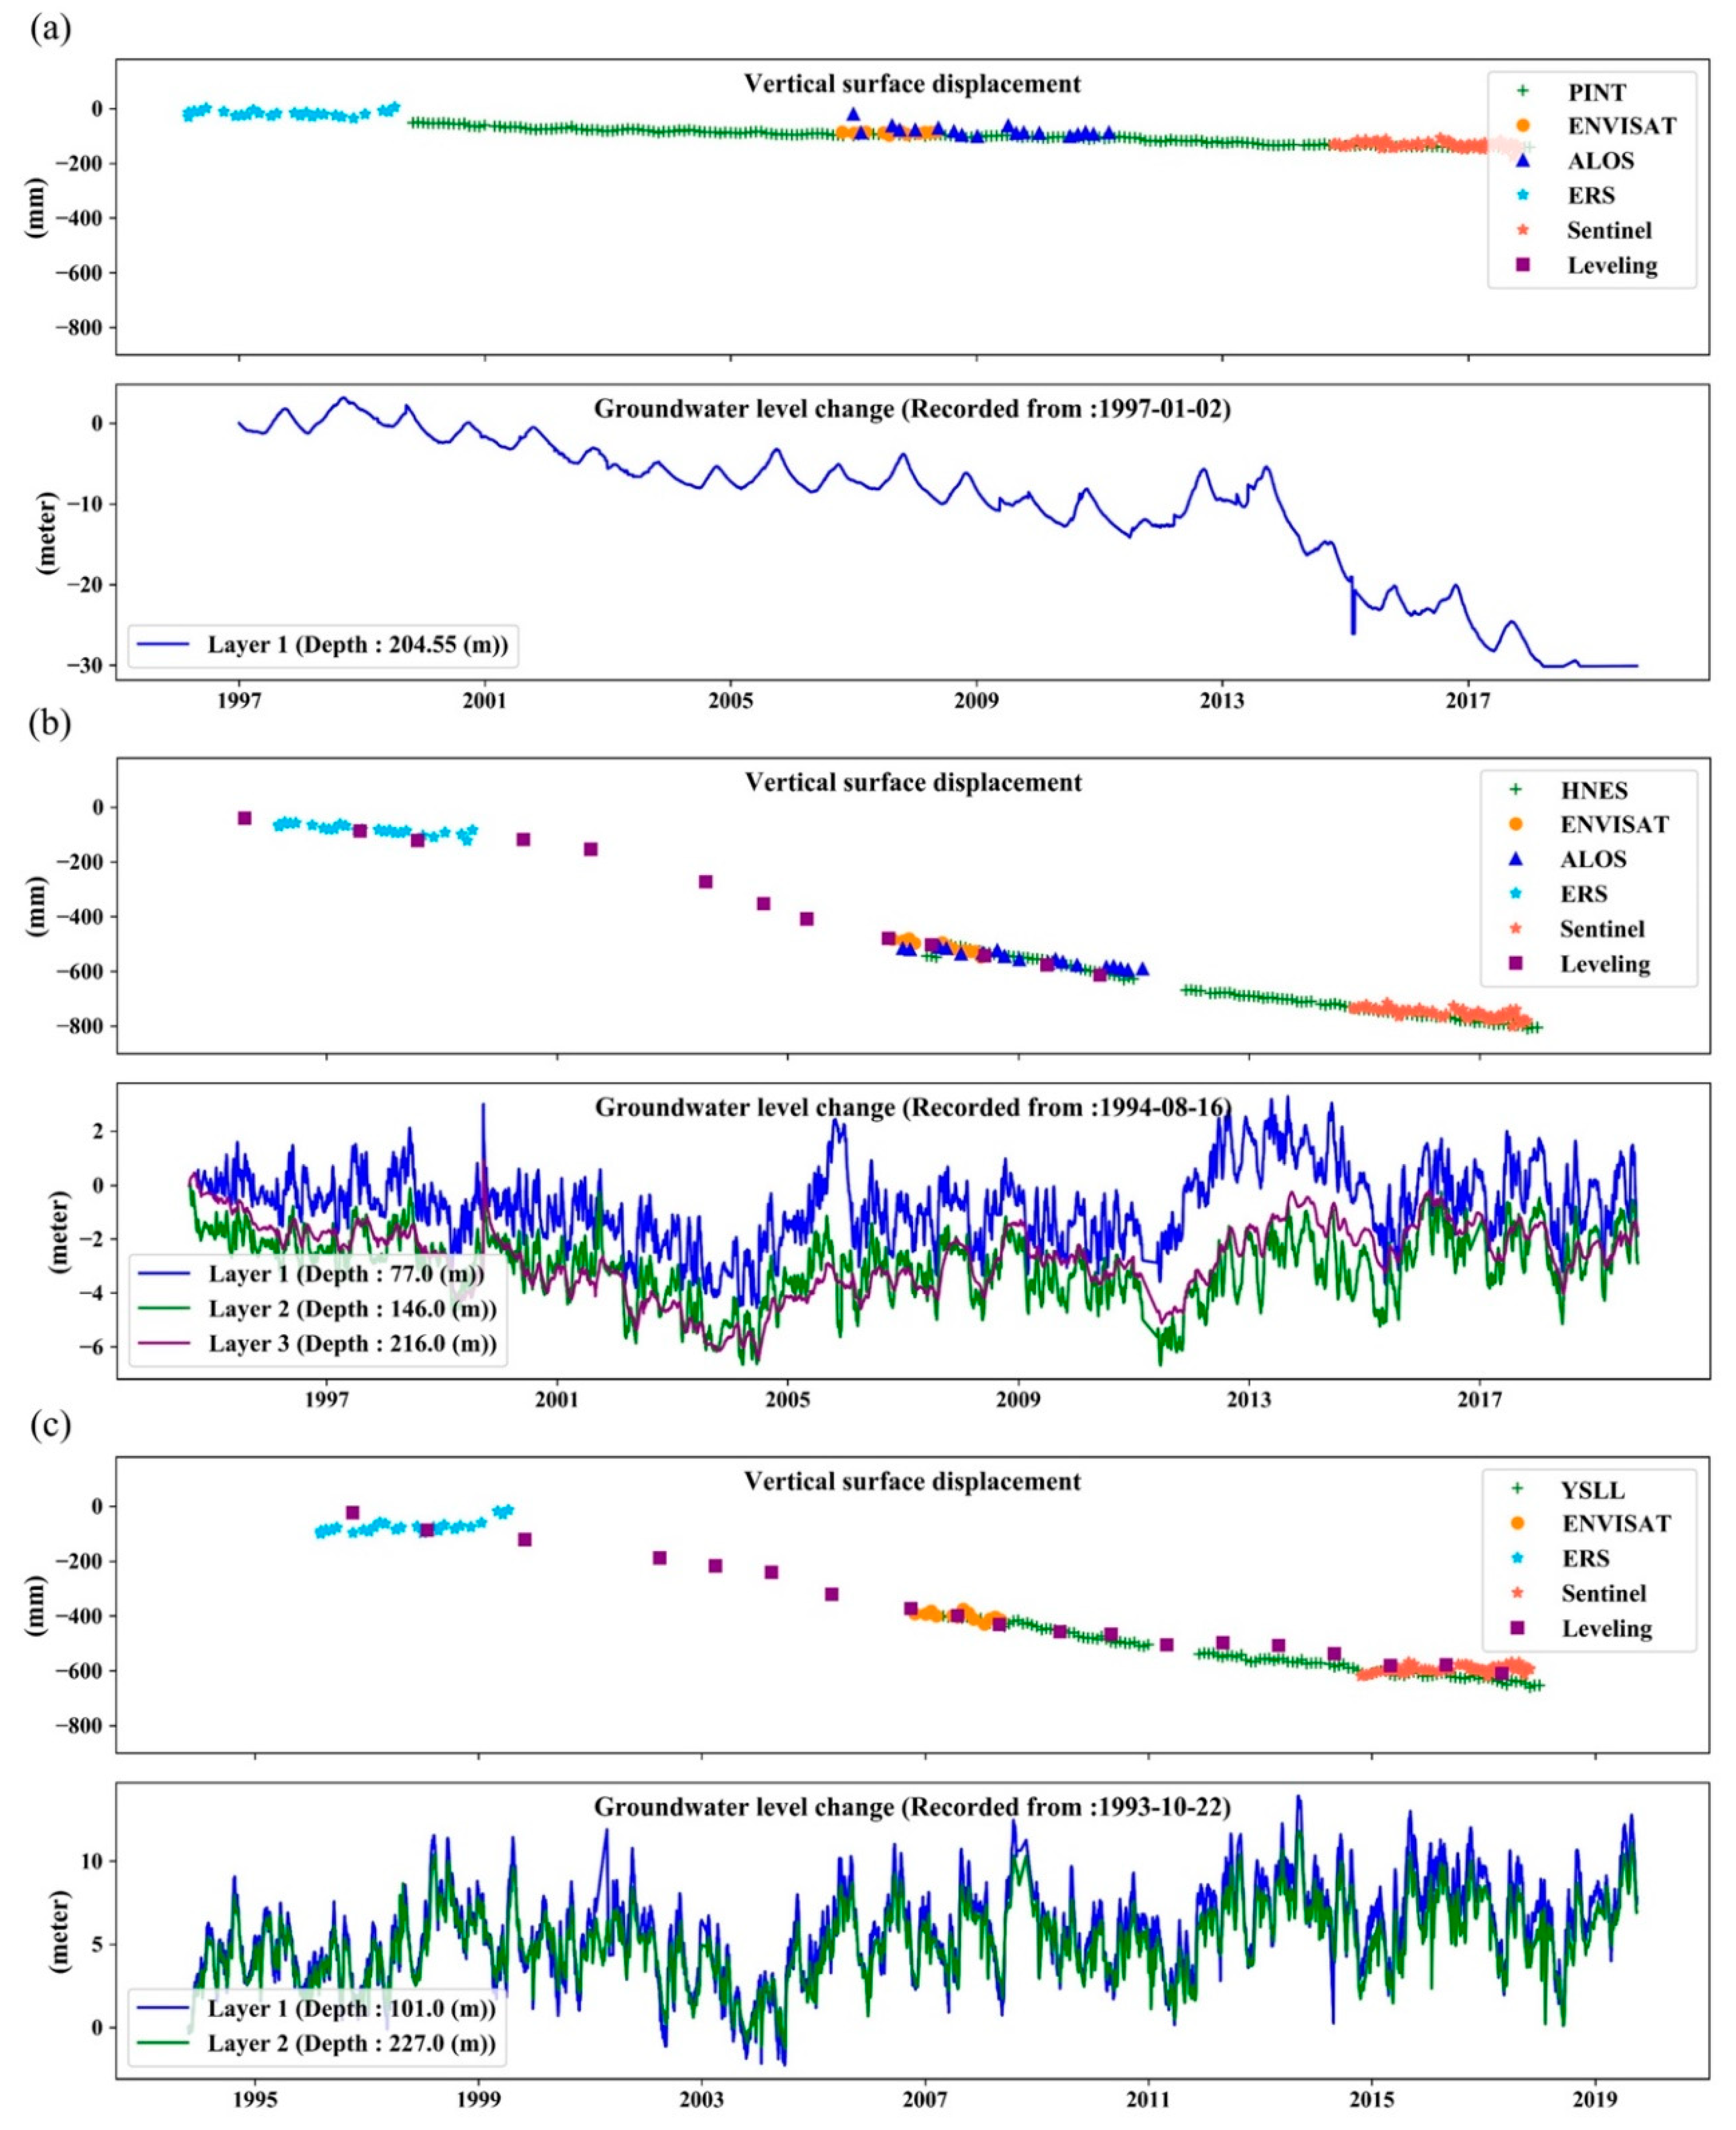
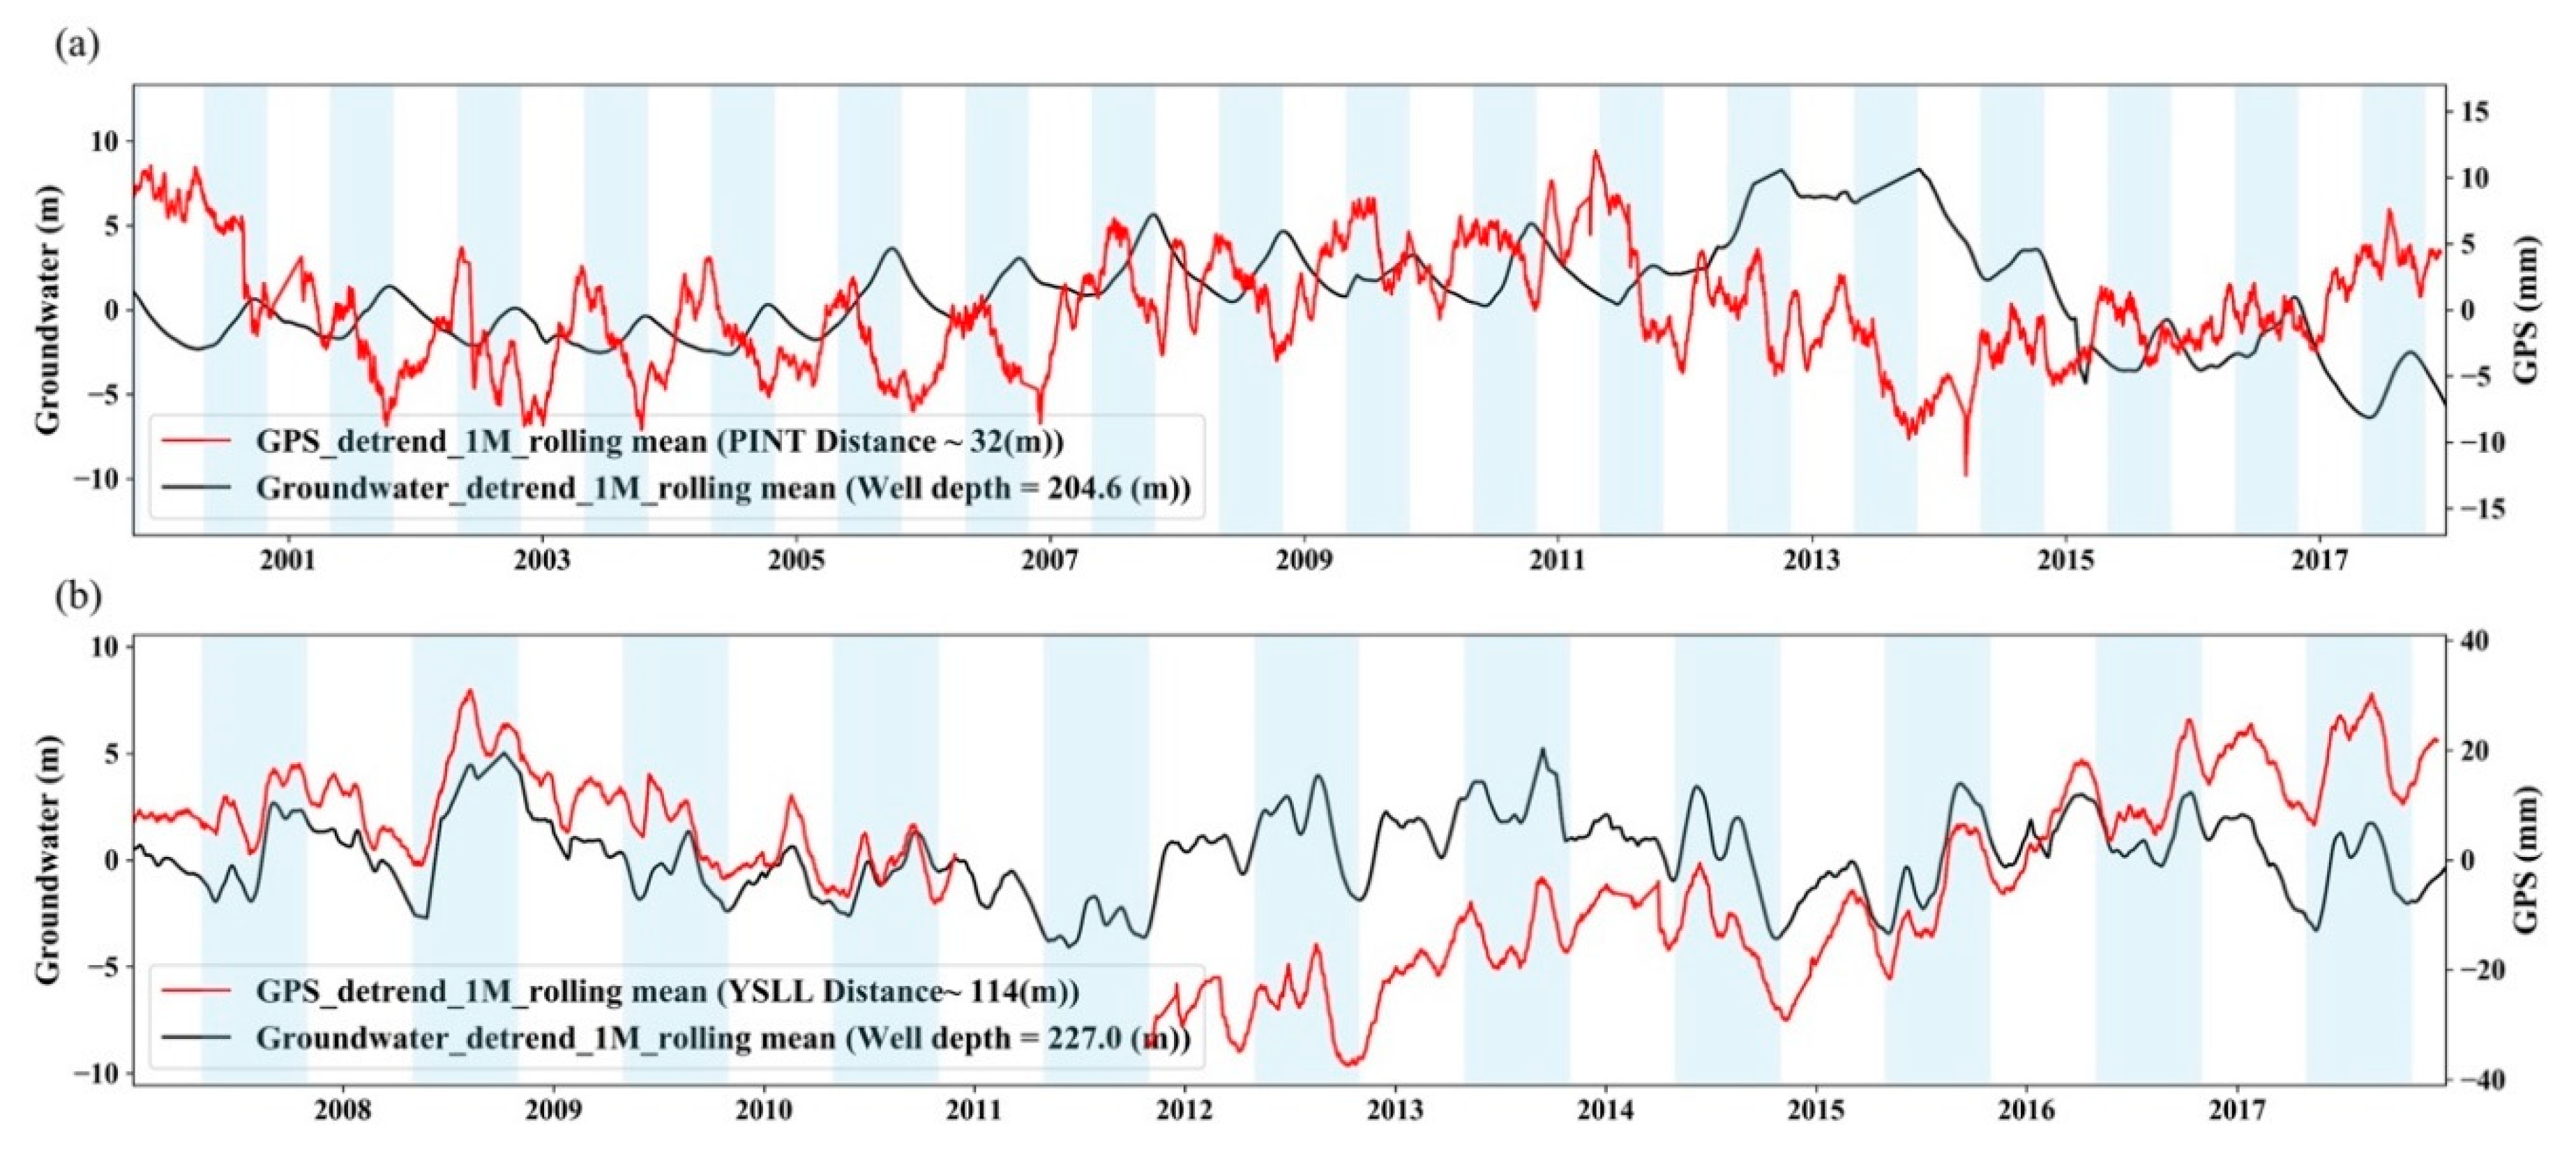
4.3. Time Series of Surface Displacement and Groundwater Level
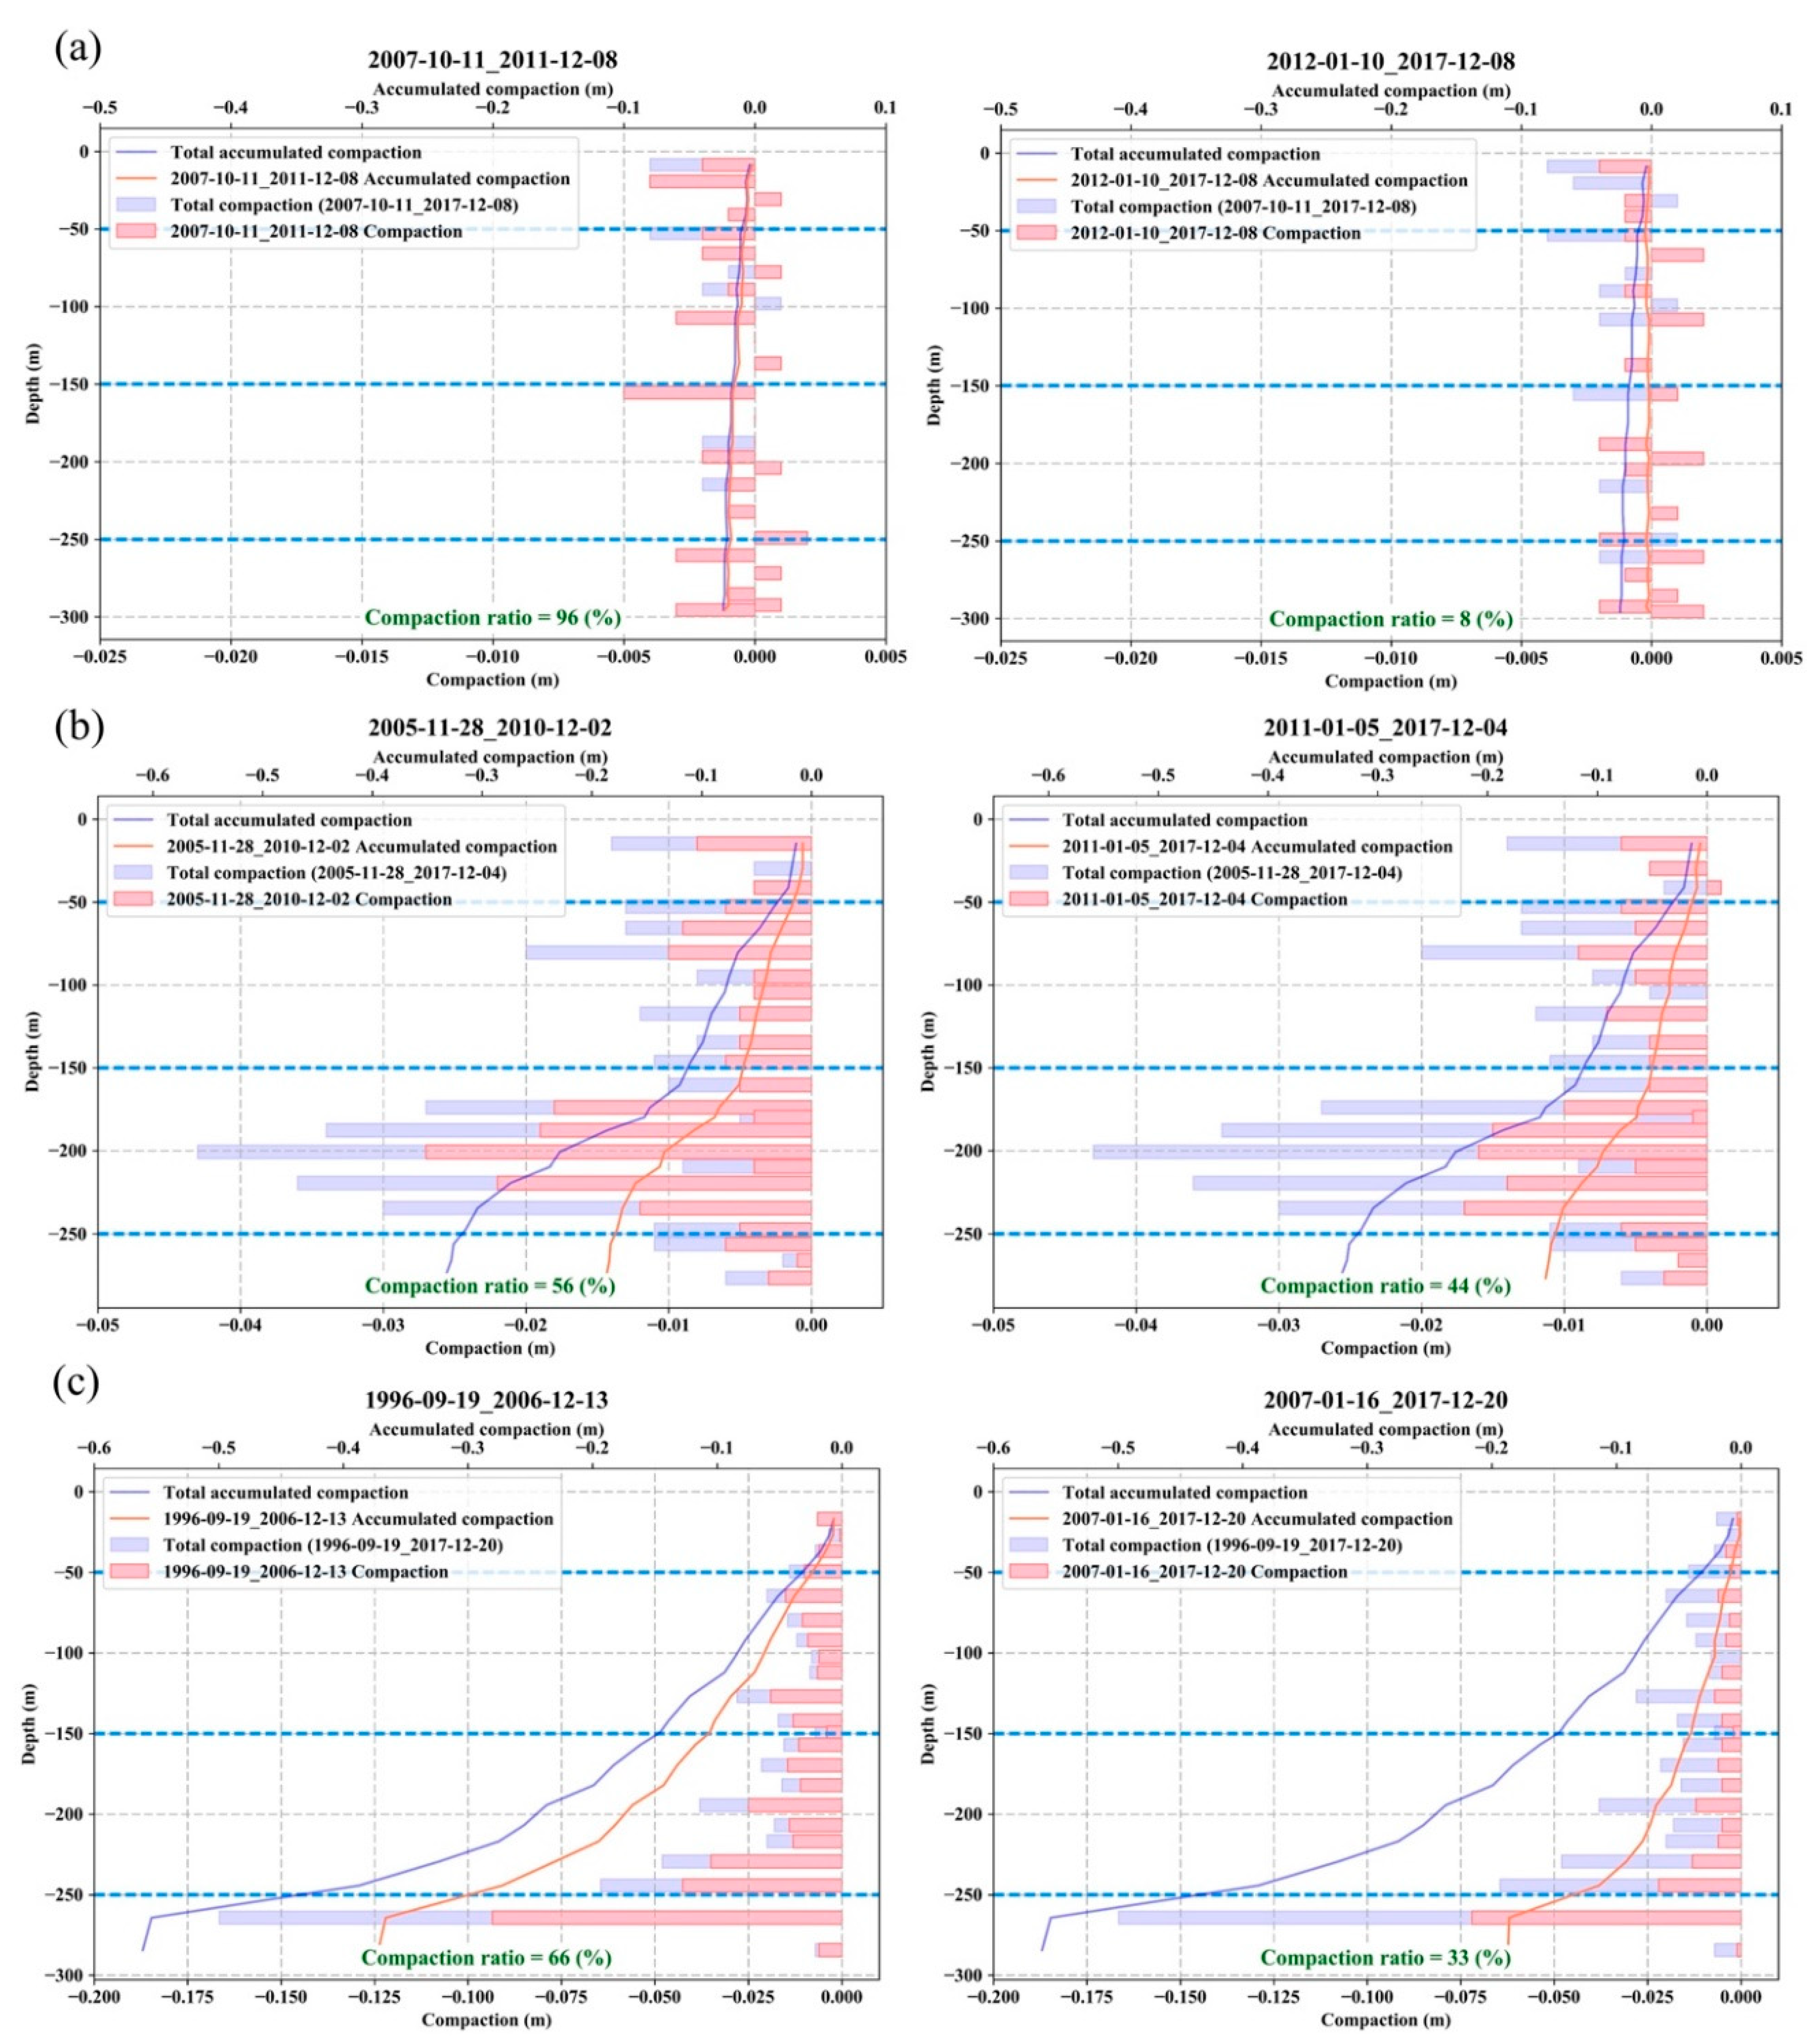
4.4. Calculated Compaction of the Aquifer System
5. Discussion
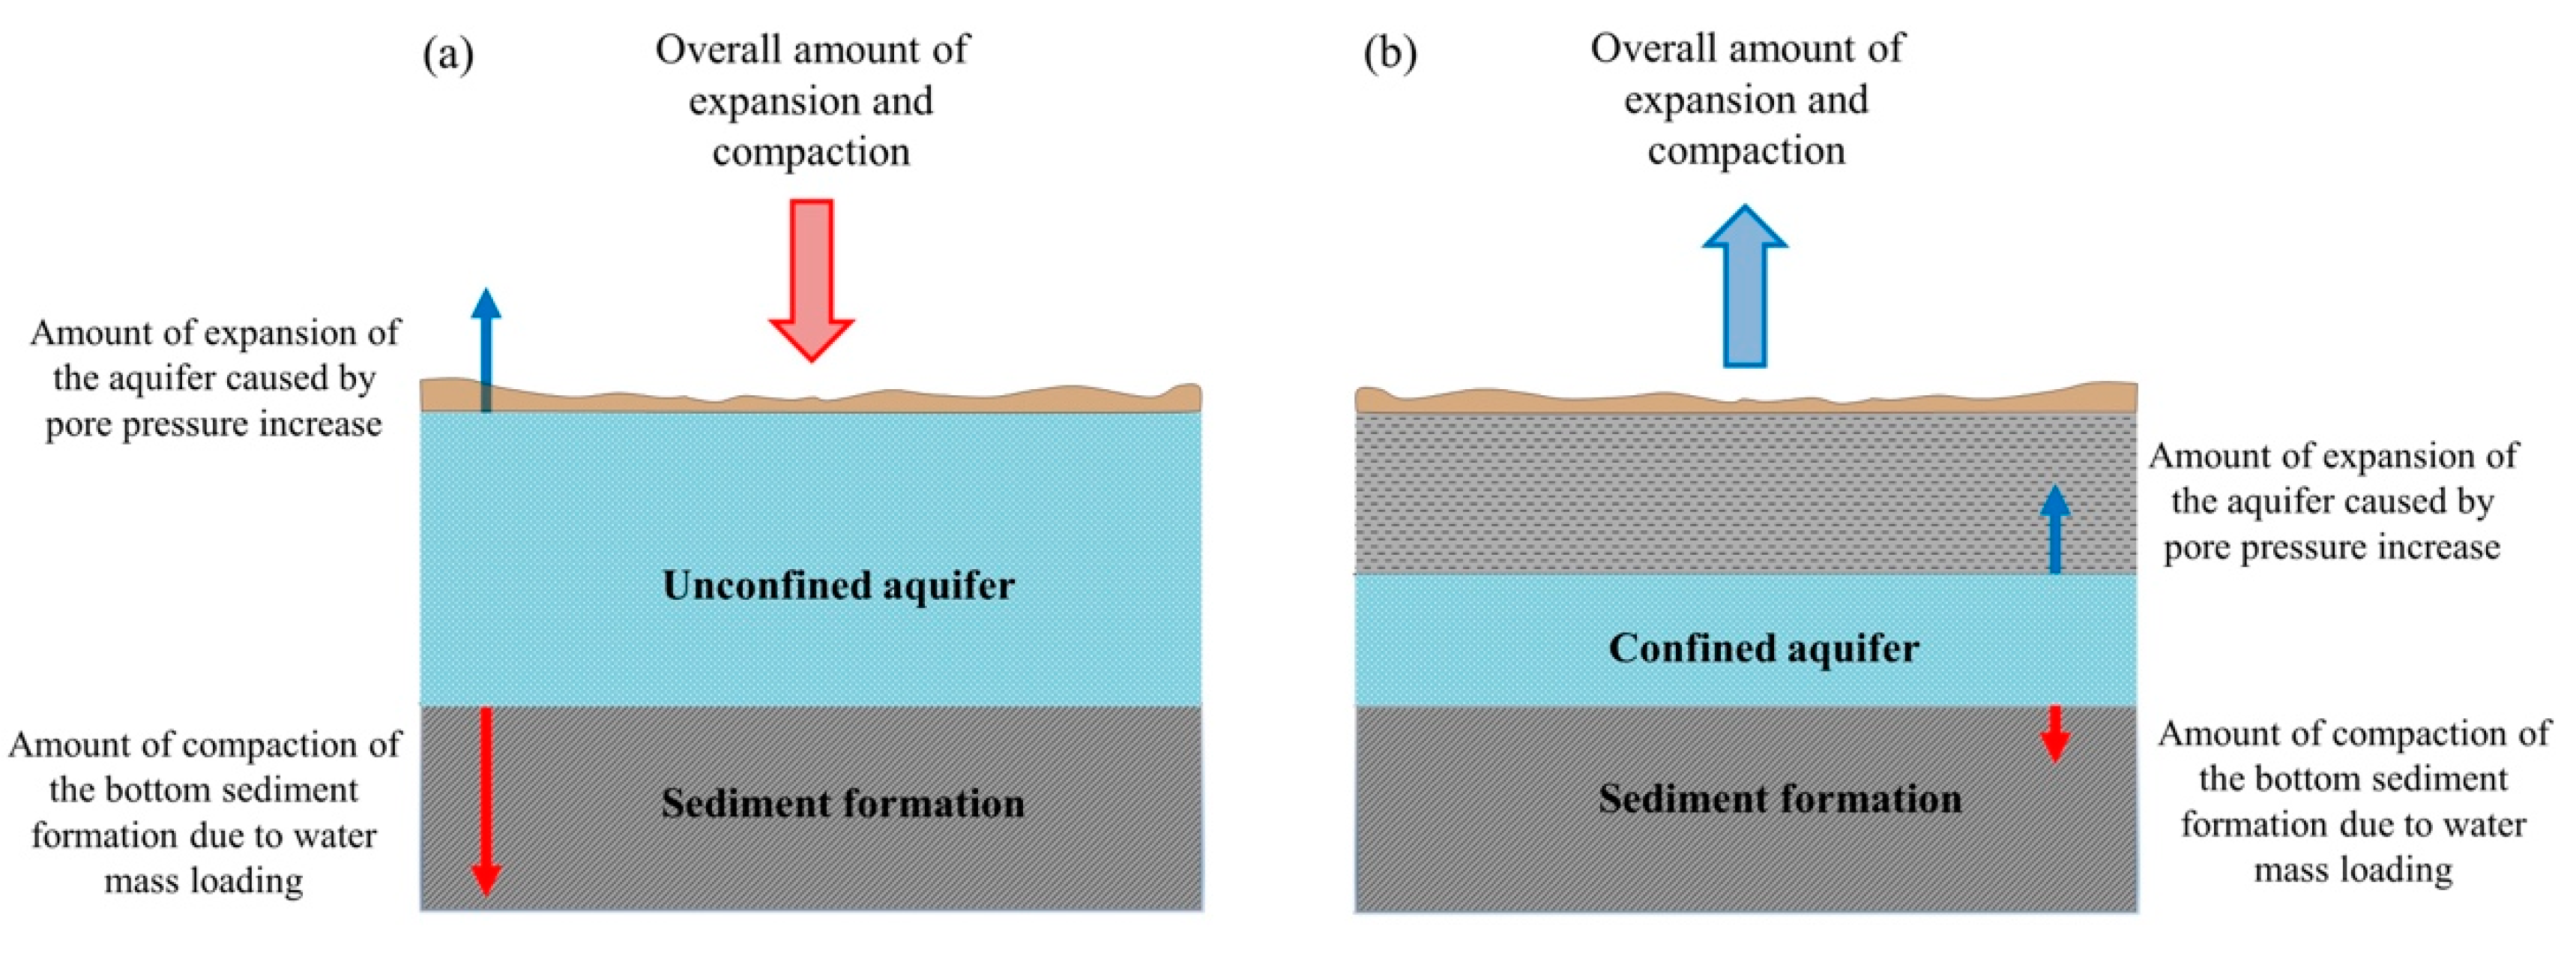
5.1. Model of the Interaction between Vertical Surface Displacement and Groundwater Level Change
5.2. Hydrogeological Implication of the Interaction Model for the Alluvial Fan of the Choshui River
6. Conclusions
Author Contributions
Funding
Acknowledgments
Conflicts of Interest
References
- Hoffmann, J.; Zebker, H.A.; Galloway, D.L.; Amelung, F. Seasonal subsidence and rebound in Las Vegas Valley, Nevada, observed by synthetic aperture radar interferometry. Water Resour. Res. 2001, 37, 1551–1566. [Google Scholar] [CrossRef]
- Liu, C.-H.; Pan, Y.-W.; Liao, J.-J.; Huang, C.-T.; Ouyang, S. Characterization of land subsidence in the Choshui River alluvial fan, Taiwan. Environ. Geol. 2004, 45, 1154–1166. [Google Scholar] [CrossRef]
- Chai, J.-C.; Shen, S.-L.; Zhu, H.-H.; Zhang, X.-L. Land subsidence due to groundwater drawdown in Shanghai. Geotechnique 2004, 54, 143–147. [Google Scholar] [CrossRef]
- Galloway, D.L.; Burbey, T.J. Regional land subsidence accompanying groundwater extraction. Hydrogeol. J. 2011, 19, 1459–1486. [Google Scholar] [CrossRef]
- Bowman, D. Groundwater. In Principles of Alluvial Fan Morphology; Springer: Dordrecht, The Netherlands, 2019; pp. 101–105. [Google Scholar]
- Van Dam, T.; Wahr, J.; Milly, P.; Shmakin, A.; Blewitt, G.; Lavallée, D.; Larson, K. Crustal displacements due to continental water loading. Geophys. Res. Lett. 2001, 28, 651–654. [Google Scholar] [CrossRef] [Green Version]
- Dong, D.; Fang, P.; Bock, Y.; Cheng, M.; Miyazaki, S.I. Anatomy of apparent seasonal variations from GPS-derived site position time series. J. Geophys. Res. Solid Earth 2002, 107, ETG 9-1–ETG 9-16. [Google Scholar] [CrossRef] [Green Version]
- Bettinelli, P.; Avouac, J.-P.; Flouzat, M.; Bollinger, L.; Ramillien, G.; Rajaure, S.; Sapkota, S. Seasonal variations of seismicity and geodetic strain in the Himalaya induced by surface hydrology. Earth Planet. Sci. Lett. 2008, 266, 332–344. [Google Scholar] [CrossRef]
- Nahmani, S.; Bock, O.; Bouin, M.N.; Santamaría-Gómez, A.; Boy, J.P.; Collilieux, X.; Métivier, L.; Panet, I.; Genthon, P.; de Linage, C. Hydrological deformation induced by the West African Monsoon: Comparison of GPS, GRACE and loading models. J. Geophys. Res. Solid Earth 2012, 117. [Google Scholar] [CrossRef] [Green Version]
- Zou, R.; Freymueller, J.T.; Ding, K.; Yang, S.; Wang, Q. Evaluating seasonal loading models and their impact on global and regional reference frame alignment. J. Geophys. Res. Solid Earth 2014, 119, 1337–1358. [Google Scholar] [CrossRef]
- Cavalié, O.; Doin, M.P.; Lasserre, C.; Briole, P. Ground motion measurement in the Lake Mead area, Nevada, by differential synthetic aperture radar interferometry time series analysis: Probing the lithosphere rheological structure. J. Geophys. Res. Solid Earth 2007, 112. [Google Scholar] [CrossRef] [Green Version]
- Gahalaut, V.; Yadav, R.K.; Sreejith, K.; Gahalaut, K.; Bürgmann, R.; Agrawal, R.; Sati, S.; Bansal, A. InSAR and GPS measurements of crustal deformation due to seasonal loading of Tehri reservoir in Garhwal Himalaya, India. Geophys. J. Int. 2017, 209, 425–433. [Google Scholar] [CrossRef]
- Galloway, D.L.; Hoffmann, J. The application of satellite differential SAR interferometry-derived ground displacements in hydrogeology. Hydrogeol. J. 2007, 15, 133–154. [Google Scholar] [CrossRef] [Green Version]
- Bell, J.W.; Amelung, F.; Ferretti, A.; Bianchi, M.; Novali, F. Permanent scatterer InSAR reveals seasonal and long-term aquifer-system response to groundwater pumping and artificial recharge. Water Resour. Res. 2008, 44. [Google Scholar] [CrossRef] [Green Version]
- Ji, K.H.; Herring, T.A. Correlation between changes in groundwater levels and surface deformation from GPS measurements in the San Gabriel Valley, California. Geophys. Res. Lett. 2012, 39. [Google Scholar] [CrossRef]
- Zhu, L.; Gong, H.; Li, X.; Wang, R.; Chen, B.; Dai, Z.; Teatini, P. Land subsidence due to groundwater withdrawal in the northern Beijing plain, China. Eng. Geol. 2015, 193, 243–255. [Google Scholar] [CrossRef]
- Motagh, M.; Shamshiri, R.; Haghighi, M.H.; Wetzel, H.-U.; Akbari, B.; Nahavandchi, H.; Roessner, S.; Arabi, S. Quantifying groundwater exploitation induced subsidence in the Rafsanjan plain, southeastern Iran, using InSAR time-series and in situ measurements. Eng. Geol. 2017, 218, 134–151. [Google Scholar] [CrossRef]
- Galloway, D.L.; Hudnut, K.W.; Ingebritsen, S.; Phillips, S.P.; Peltzer, G.; Rogez, F.; Rosen, P. Detection of aquifer system compaction and land subsidence using interferometric synthetic aperture radar, Antelope Valley, Mojave Desert, California. Water Resour. Res. 1998, 34, 2573–2585. [Google Scholar] [CrossRef]
- Ferretti, A.; Prati, C.; Rocca, F. Permanent scatterers in SAR interferometry. IEEE Trans. Geosci. Remote Sens. 2001, 39, 8–20. [Google Scholar] [CrossRef]
- Hooper, A.; Zebker, H.; Segall, P.; Kampes, B. A new method for measuring deformation on volcanoes and other natural terrains using InSAR persistent scatterers. Geophys. Res. Lett. 2004, 31. [Google Scholar] [CrossRef]
- Berardino, P.; Fornaro, G.; Lanari, R.; Sansosti, E. A new algorithm for surface deformation monitoring based on small baseline differential SAR interferograms. IEEE Trans. Geosci. Remote Sens. 2002, 40, 2375–2383. [Google Scholar] [CrossRef] [Green Version]
- Zhang, L.; Lu, Z.; Ding, X.; Jung, H.-S.; Feng, G.; Lee, C.-W. Mapping ground surface deformation using temporarily coherent point SAR interferometry: Application to Los Angeles Basin. Remote Sens. Environ. 2012, 117, 429–439. [Google Scholar] [CrossRef]
- Hanssen, R.F. Radar interferometry: Data interpretation and error analysis. Springer Sci. Bus. Media 2001, 2, 308. [Google Scholar]
- Wasowski, J.; Bovenga, F. Investigating landslides and unstable slopes with satellite Multi Temporal Interferometry: Current issues and future perspectives. Eng. Geol. 2014, 174, 103–138. [Google Scholar] [CrossRef]
- Ferretti, A.; Savio, G.; Barzaghi, R.; Borghi, A.; Musazzi, S.; Novali, F.; Prati, C.; Rocca, F. Submillimeter accuracy of InSAR time series: Experimental validation. IEEE Trans. Geosci. Remote Sens. 2007, 45, 1142–1153. [Google Scholar] [CrossRef]
- Casu, F.; Manzo, M.; Lanari, R. A quantitative assessment of the SBAS algorithm performance for surface deformation retrieval from DInSAR data. Remote Sens. Environ. 2006, 102, 195–210. [Google Scholar] [CrossRef]
- Colesanti, C.; Ferretti, A.; Novali, F.; Prati, C.; Rocca, F. SAR monitoring of progressive and seasonal ground deformation using the permanent scatterers technique. IEEE Trans. Geosci. Remote Sens. 2003, 41, 1685–1701. [Google Scholar] [CrossRef] [Green Version]
- Tung, H.; Chen, H.-Y.; Hu, J.-C.; Ching, K.-E.; Chen, H.; Yang, K.-H. Transient deformation induced by groundwater change in Taipei metropolitan area revealed by high resolution X-band SAR interferometry. Tectonophysics 2016, 692, 265–277. [Google Scholar] [CrossRef]
- Ilia, I.; Loupasakis, C.; Tsangaratos, P. Land subsidence phenomena investigated by spatiotemporal analysis of groundwater resources, remote sensing techniques, and random forest method: The case of Western Thessaly, Greece. Environ. Monit. Assess. 2018, 190, 623. [Google Scholar] [CrossRef]
- Tung, H.; Hu, J.-C. Assessments of serious anthropogenic land subsidence in Yunlin County of central Taiwan from 1996 to 1999 by Persistent Scatterers InSAR. Tectonophysics 2012, 578, 126–135. [Google Scholar] [CrossRef]
- Castellazzi, P.; Longuevergne, L.; Martel, R.; Rivera, A.; Brouard, C.; Chaussard, E. Quantitative mapping of groundwater depletion at the water management scale using a combined GRACE/InSAR approach. Remote Sens. Environ. 2018, 205, 408–418. [Google Scholar] [CrossRef]
- Solari, L.; del Soldato, M.; Bianchini, S.; Ciampalini, A.; Ezquerro, P.; Montalti, R.; Raspini, F.; Moretti, S. From ERS 1/2 to Sentinel-1: Subsidence monitoring in Italy in the last two decades. Front. Earth Sci. 2018, 6, 149. [Google Scholar] [CrossRef]
- Chen, C.-H.; Wang, C.-H.; Hsu, Y.-J.; Yu, S.-B.; Kuo, L.-C. Correlation between groundwater level and altitude variations in land subsidence area of the Choshuichi Alluvial Fan, Taiwan. Eng. Geol. 2010, 115, 122–131. [Google Scholar] [CrossRef]
- Hsu, W.-C.; Chang, H.-C.; Chang, K.-T.; Lin, E.-K.; Liu, J.-K.; Liou, Y.-A. Observing land subsidence and revealing the factors that influence it using a multi-sensor approach in Yunlin County, Taiwan. Remote Sens. 2015, 7, 8202–8223. [Google Scholar] [CrossRef] [Green Version]
- Hung, W.-C.; Hwang, C.; Chen, Y.-A.; Chang, C.-P.; Yen, J.-Y.; Hooper, A.; Yang, C.-Y. Surface deformation from persistent scatterers SAR interferometry and fusion with leveling data: A case study over the Choushui River Alluvial Fan, Taiwan. Remote Sens. Environ. 2011, 115, 957–967. [Google Scholar] [CrossRef]
- Lu, C.-H.; Ni, C.-F.; Chang, C.-P.; Chen, Y.-A.; Yen, J.-Y. Geostatistical Data Fusion of Multiple Type Observations to Improve Land Subsidence Monitoring Resolution in the Choushui River Fluvial Plain, Taiwan. Terr. Atmos. Ocean Sci. 2016, 27. [Google Scholar] [CrossRef] [Green Version]
- Ge, L.; Ng, A.H.-M.; Du, Z.; Chen, H.-Y.; Li, X. Integrated space geodesy for mapping land deformation over Choushui River Fluvial Plain, Taiwan. Int. J. Remote Sens. 2017, 38, 6319–6345. [Google Scholar] [CrossRef]
- Huang, M.-H.; Bürgmann, R.; Hu, J.-C. Fifteen years of surface deformation in Western Taiwan: Insight from SAR interferometry. Tectonophysics 2016, 692, 252–264. [Google Scholar] [CrossRef] [Green Version]
- Hwang, C.; Yang, Y.; Kao, R.; Han, J.; Shum, C.; Galloway, D.L.; Sneed, M.; Hung, W.-C.; Cheng, Y.-S.; Li, F. Time-varying land subsidence detected by radar altimetry: California, Taiwan and north China. Sci. Rep. 2016, 6, 28160. [Google Scholar] [CrossRef] [Green Version]
- Yu, S.-B.; Chen, H.-Y.; Kuo, L.-C. Velocity field of GPS stations in the Taiwan area. Tectonophysics 1997, 274, 41–59. [Google Scholar] [CrossRef]
- Lin, K.C.; Hu, J.C.; Ching, K.E.; Angelier, J.; Rau, R.J.; Yu, S.B.; Tsai, C.H.; Shin, T.C.; Huang, M.H. GPS crustal deformation, strain rate, and seismic activity after the 1999 Chi-Chi earthquake in Taiwan. J. Geophys. Res. Solid Earth 2010, 115. [Google Scholar] [CrossRef] [Green Version]
- CGS. The Investigation of Hydrogeology in the Choshui River Alluvial Fan, Taiwan; Central Geological Survey of Taiwan: Taipei, Taiwan, 1999. [Google Scholar]
- Liu, C.-W.; Lin, W.-S.; Shang, C.; Liu, S.-H. The effect of clay dehydration on land subsidence in the Yun-Lin coastal area, Taiwan. Environ. Geol. 2001, 40, 518–527. [Google Scholar] [CrossRef]
- Chiang, C.J.; Lin, Y.-C.; Chen, C.-L.; Lai, T.-H. Natural and Man-Induced Land Subsidence in the Choushuichi Groundwater Basin. Spec. Publ. Cent. Geol. Surv. 2014, 27, 1–12. (In Chinese) [Google Scholar]
- Kampes, B.; Usai, S. Doris: The delft object-oriented radar interferometric software. In Proceedings of the 2nd International Symposium on Operationalization of Remote Sensing, Enschede, The Netherlands, 16–20 August 1999. [Google Scholar]
- Serrano-Juan, A.; Pujades, E.; Vázquez-Suñè, E.; Crosetto, M.; Cuevas-González, M. Leveling vs. InSAR in urban underground construction monitoring: Pros and cons. Case of la sagrera railway station (Barcelona, Spain). Eng. Geol. 2017, 218, 1–11. [Google Scholar] [CrossRef]
- Hung, W.-C.; Hwang, C.; Chang, C.-P.; Yen, J.-Y.; Liu, C.-H.; Yang, W.-H. Monitoring severe aquifer-system compaction and land subsidence in Taiwan using multiple sensors: Yunlin, the southern Choushui River Alluvial Fan. Environ. Earth Sci. 2010, 59, 1535–1548. [Google Scholar] [CrossRef]
- Ching, K.E.; Hsieh, M.L.; Johnson, K.M.; Chen, K.H.; Rau, R.J.; Yang, M. Modern vertical deformation rates and mountain building in Taiwan from precise leveling and continuous GPS observations, 2000–2008. J. Geophys. Res. Solid Earth 2011, 116. [Google Scholar] [CrossRef]
- Chen, K.-H.; Yang, M.; Huang, Y.-T.; Ching, K.-E.; Rau, R.-J. Vertical displacement rate field of taiwan from geodetic levelling data 2000–2008. Surv. Rev. 2011, 43, 296–302. [Google Scholar] [CrossRef]
- GPS Lab of Academia Sinica. Available online: http://gps.earth.sinica.edu.tw (accessed on 1 October 2019).
- Webb, F. An Introduction to GIPsy/oasIs-II; JPL D-11088; California Institute of Technology: Pasadena, CA, USA, 1997. [Google Scholar]
- Tung, H.; Chen, H.-Y.; Hsu, Y.-J.; Hu, J.-C.; Chang, Y.-H.; Kuo, Y.-T. Triggered slip on multifaults after the 2018 Mw 6.4 Hualien earthquake by continuous GPS and InSAR measurements. Terr. Atmos. Ocean. Sci. 2019, 30, 1–16. [Google Scholar] [CrossRef] [Green Version]
- Hayal, A.G.; Sanli, D.U. Revisiting the role of observation session duration on precise point positioning accuracy using GIPSY/OASIS II Software. Boletim de Ciências Geodésicas 2016, 22, 405–419. [Google Scholar] [CrossRef] [Green Version]
- Li, X.; Ge, M.; Dai, X.; Ren, X.; Fritsche, M.; Wickert, J.; Schuh, H. Accuracy and reliability of multi-GNSS real-time precise positioning: GPS, GLONASS, BeiDou, and Galileo. J. Geod. 2015, 89, 607–635. [Google Scholar] [CrossRef]
- Gabriel, A.K.; Goldstein, R.M.; Zebker, H.A. Mapping small elevation changes over large areas: Differential radar interferometry. J. Geophys. Res. Solid Earth 1989, 94, 9183–9191. [Google Scholar] [CrossRef]
- Massonnet, D.; Feigl, K.L. Radar interferometry and its application to changes in the Earth’s surface. Rev. Geophys. 1998, 36, 441–500. [Google Scholar] [CrossRef] [Green Version]
- Hilley, G.E.; Bürgmann, R.; Ferretti, A.; Novali, F.; Rocca, F. Dynamics of slow-moving landslides from permanent scatterer analysis. Science 2004, 304, 1952–1955. [Google Scholar] [CrossRef] [PubMed] [Green Version]
- Bovenga, F.; Nutricato, R.; Refice, A.; Wasowski, J. Application of multi-temporal differential interferometry to slope instability detection in urban/peri-urban areas. Eng. Geol. 2006, 88, 218–239. [Google Scholar] [CrossRef]
- Colesanti, C.; Wasowski, J. Investigating landslides with space-borne Synthetic Aperture Radar (SAR) interferometry. Eng. Geol. 2006, 88, 173–199. [Google Scholar] [CrossRef]
- Crosetto, M.; Monserrat, O.; Cuevas-González, M.; Devanthéry, N.; Crippa, B. Persistent scatterer interferometry: A review. ISPRS J. Photogramm. Remote Sens. 2016, 115, 78–89. [Google Scholar] [CrossRef] [Green Version]
- Hooper, A.; Bekaert, D.; Spaans, K.; Arıkan, M. Recent advances in SAR interferometry time series analysis for measuring crustal deformation. Tectonophysics 2012, 514, 1–13. [Google Scholar] [CrossRef]
- Demoulin, A. Slip rate and mode of the Feldbiss normal fault (Roer Valley Graben) after removal of groundwater effects. Earth Planet. Sci. Lett. 2006, 245, 630–641. [Google Scholar] [CrossRef]
- Demoulin, A.; Ducarme, B.; Everaerts, M. Seasonal height change influence in GPS and gravimetric campaign data. J. Geodyn. 2007, 43, 308–319. [Google Scholar] [CrossRef]
- Chiang, C.J.; Lin, Y.-C.; Chen, C.-L. The interaction and application between groundwater level variation and surface elevation change of the alluvial fan of the Choushui River. Ti-Chih 2011, 30, 32–35. (In Chinese) [Google Scholar]


| ERS-1/2 | ENVISAT | ALOS-1 | Sentinel-1A | |
|---|---|---|---|---|
| Data period | 1996/03/06–1999/07/15 | 2006/10/26–2008/05/08 | 2006/12/31–2011/02/26 | 2014/10/22–2017/10/30 |
| Number of images | 27 | 13 | 18 | 65 |
| Master day | 1997/08/14 | 2007/06/28 | 2009/10/08 | 2016/09/29 |
| Band/Wavelength | C-band/5.6 cm | C-band/5.6 cm | L-band/23.6 cm | C-band/5.6 cm |
| Resolution (azimuth*range) | *24 m | *24 m | m | m |
| Repeat cycle (days) | 35 | 35 | 46 | 12 |
| Incident angle (°) | 21–26 | 15–45 | 8–60 | 30–46 |
| Detectable max velocity between neighboring PS | 14.6 cm/year | 14.6 cm/year | 46.8 cm/year | 42.6 cm/year |
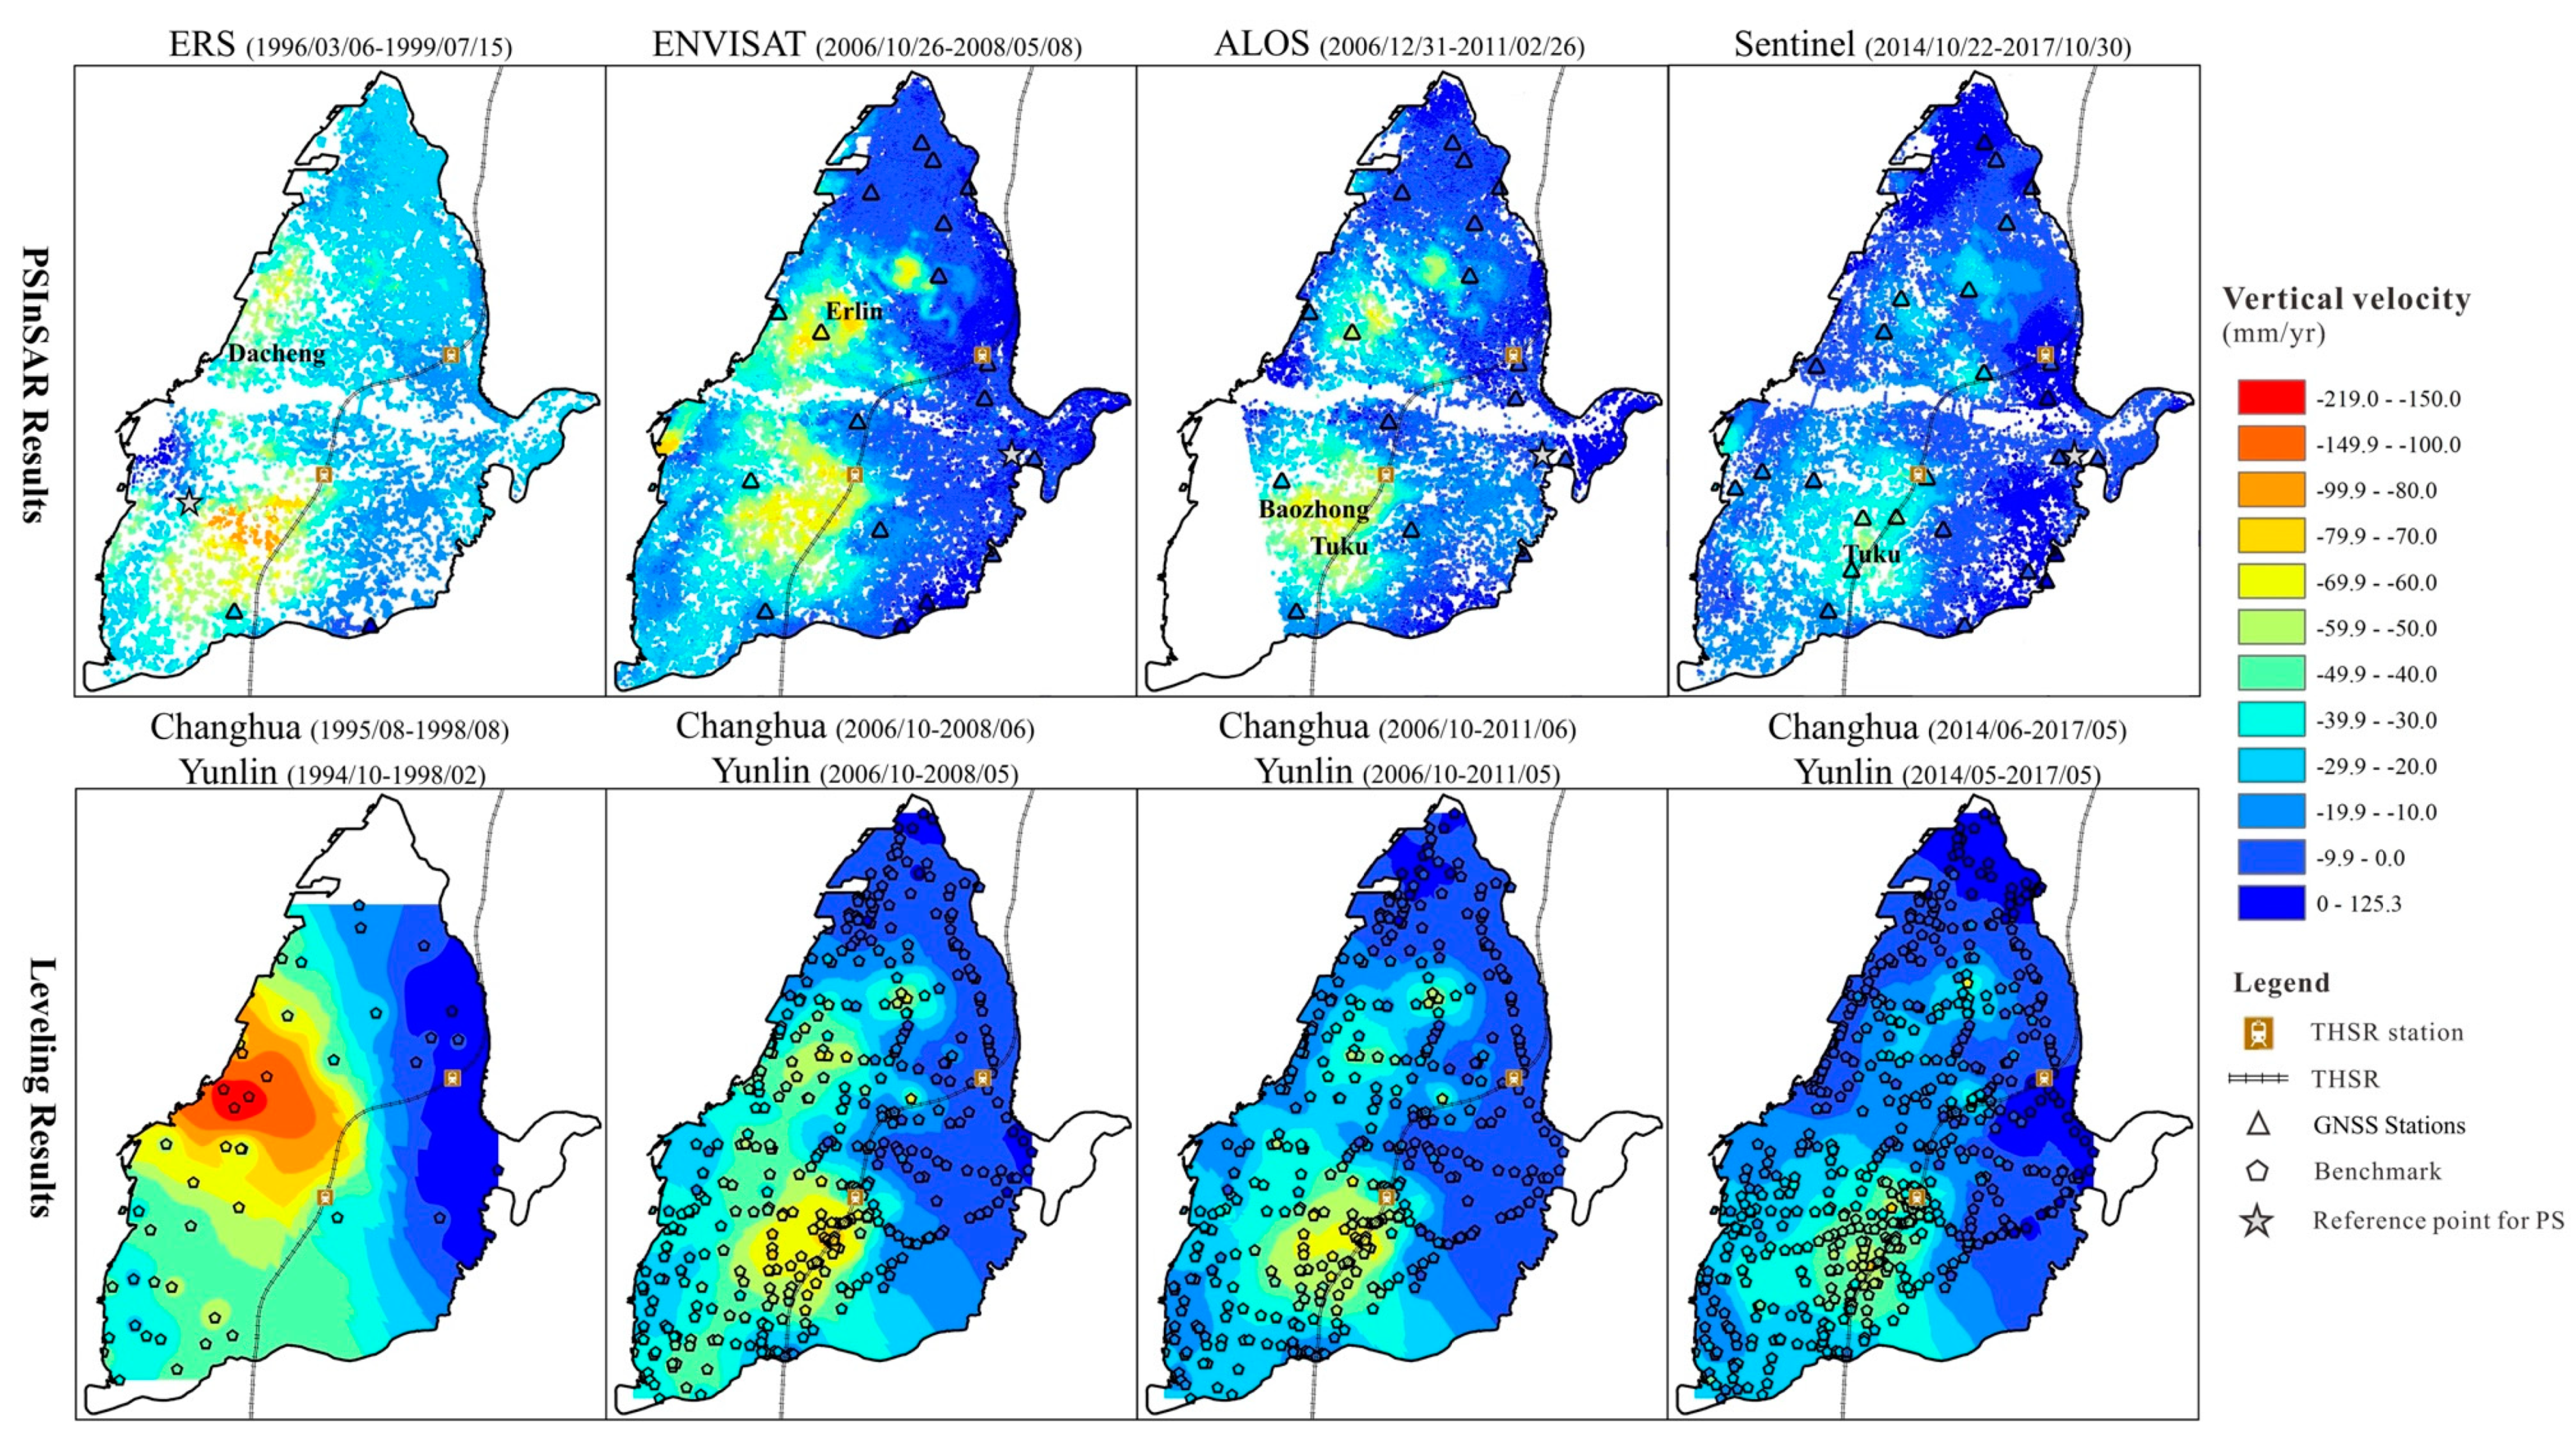
| 1996–1999 ERS1/2 | 2006–2008 ENVISAT | 2006–2011 ALOS | 2014–2017 Sentinel-1A | |
|---|---|---|---|---|
| Average rate derived from PSInSAR | 43 3.6 mm/year | 71 5.4 mm/year | 63 4.1 mm/year | 50 3.4 mm/year |
| Location | coastal area in Dacheng | Erlin | Tuku | Tuku |
| Rate derived from leveling | 200 mm/year | 61 mm/year | 61 mm/year | 57 mm/year |
| Mean difference between PSInSAR and leveling | 45.8 mm/year | 3.7 mm/year | 10.7 mm/year | 5.5 mm/year |
© 2020 by the authors. Licensee MDPI, Basel, Switzerland. This article is an open access article distributed under the terms and conditions of the Creative Commons Attribution (CC BY) license (http://creativecommons.org/licenses/by/4.0/).
Share and Cite
Lu, C.-Y.; Hu, J.-C.; Chan, Y.-C.; Su, Y.-F.; Chang, C.-H. The Relationship between Surface Displacement and Groundwater Level Change and Its Hydrogeological Implications in an Alluvial Fan: Case Study of the Choshui River, Taiwan. Remote Sens. 2020, 12, 3315. https://0-doi-org.brum.beds.ac.uk/10.3390/rs12203315
Lu C-Y, Hu J-C, Chan Y-C, Su Y-F, Chang C-H. The Relationship between Surface Displacement and Groundwater Level Change and Its Hydrogeological Implications in an Alluvial Fan: Case Study of the Choshui River, Taiwan. Remote Sensing. 2020; 12(20):3315. https://0-doi-org.brum.beds.ac.uk/10.3390/rs12203315
Chicago/Turabian StyleLu, Chiao-Yin, Jyr-Ching Hu, Yu-Chang Chan, Yuan-Fong Su, and Chih-Hsin Chang. 2020. "The Relationship between Surface Displacement and Groundwater Level Change and Its Hydrogeological Implications in an Alluvial Fan: Case Study of the Choshui River, Taiwan" Remote Sensing 12, no. 20: 3315. https://0-doi-org.brum.beds.ac.uk/10.3390/rs12203315