Integrated Methodology for Urban Flood Risk Mapping at the Microscale in Ungauged Regions: A Case Study of Hurghada, Egypt

 ,
,  , , , and
Abstract
:
1. Introduction
2. Study Area
3. Materials and Methods
3.1. Data Availability
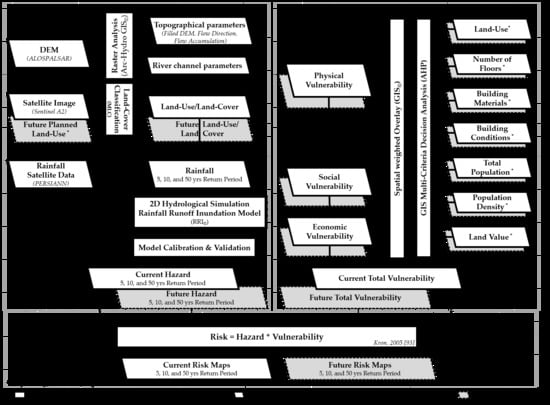
3.2. Proposed Method
- The hazard mapping method was based on rainfall, topographic, and hydrological satellite data for Hurghada during the 1996, 2014, and 2016 events. These events were found to exhibit close to 50, 5, and 10 year REPs, respectively. The RRI model was calibrated based on georeferenced photos taken during the 2014 event. The validation of the model result was conducted using photos of the 2016 event.
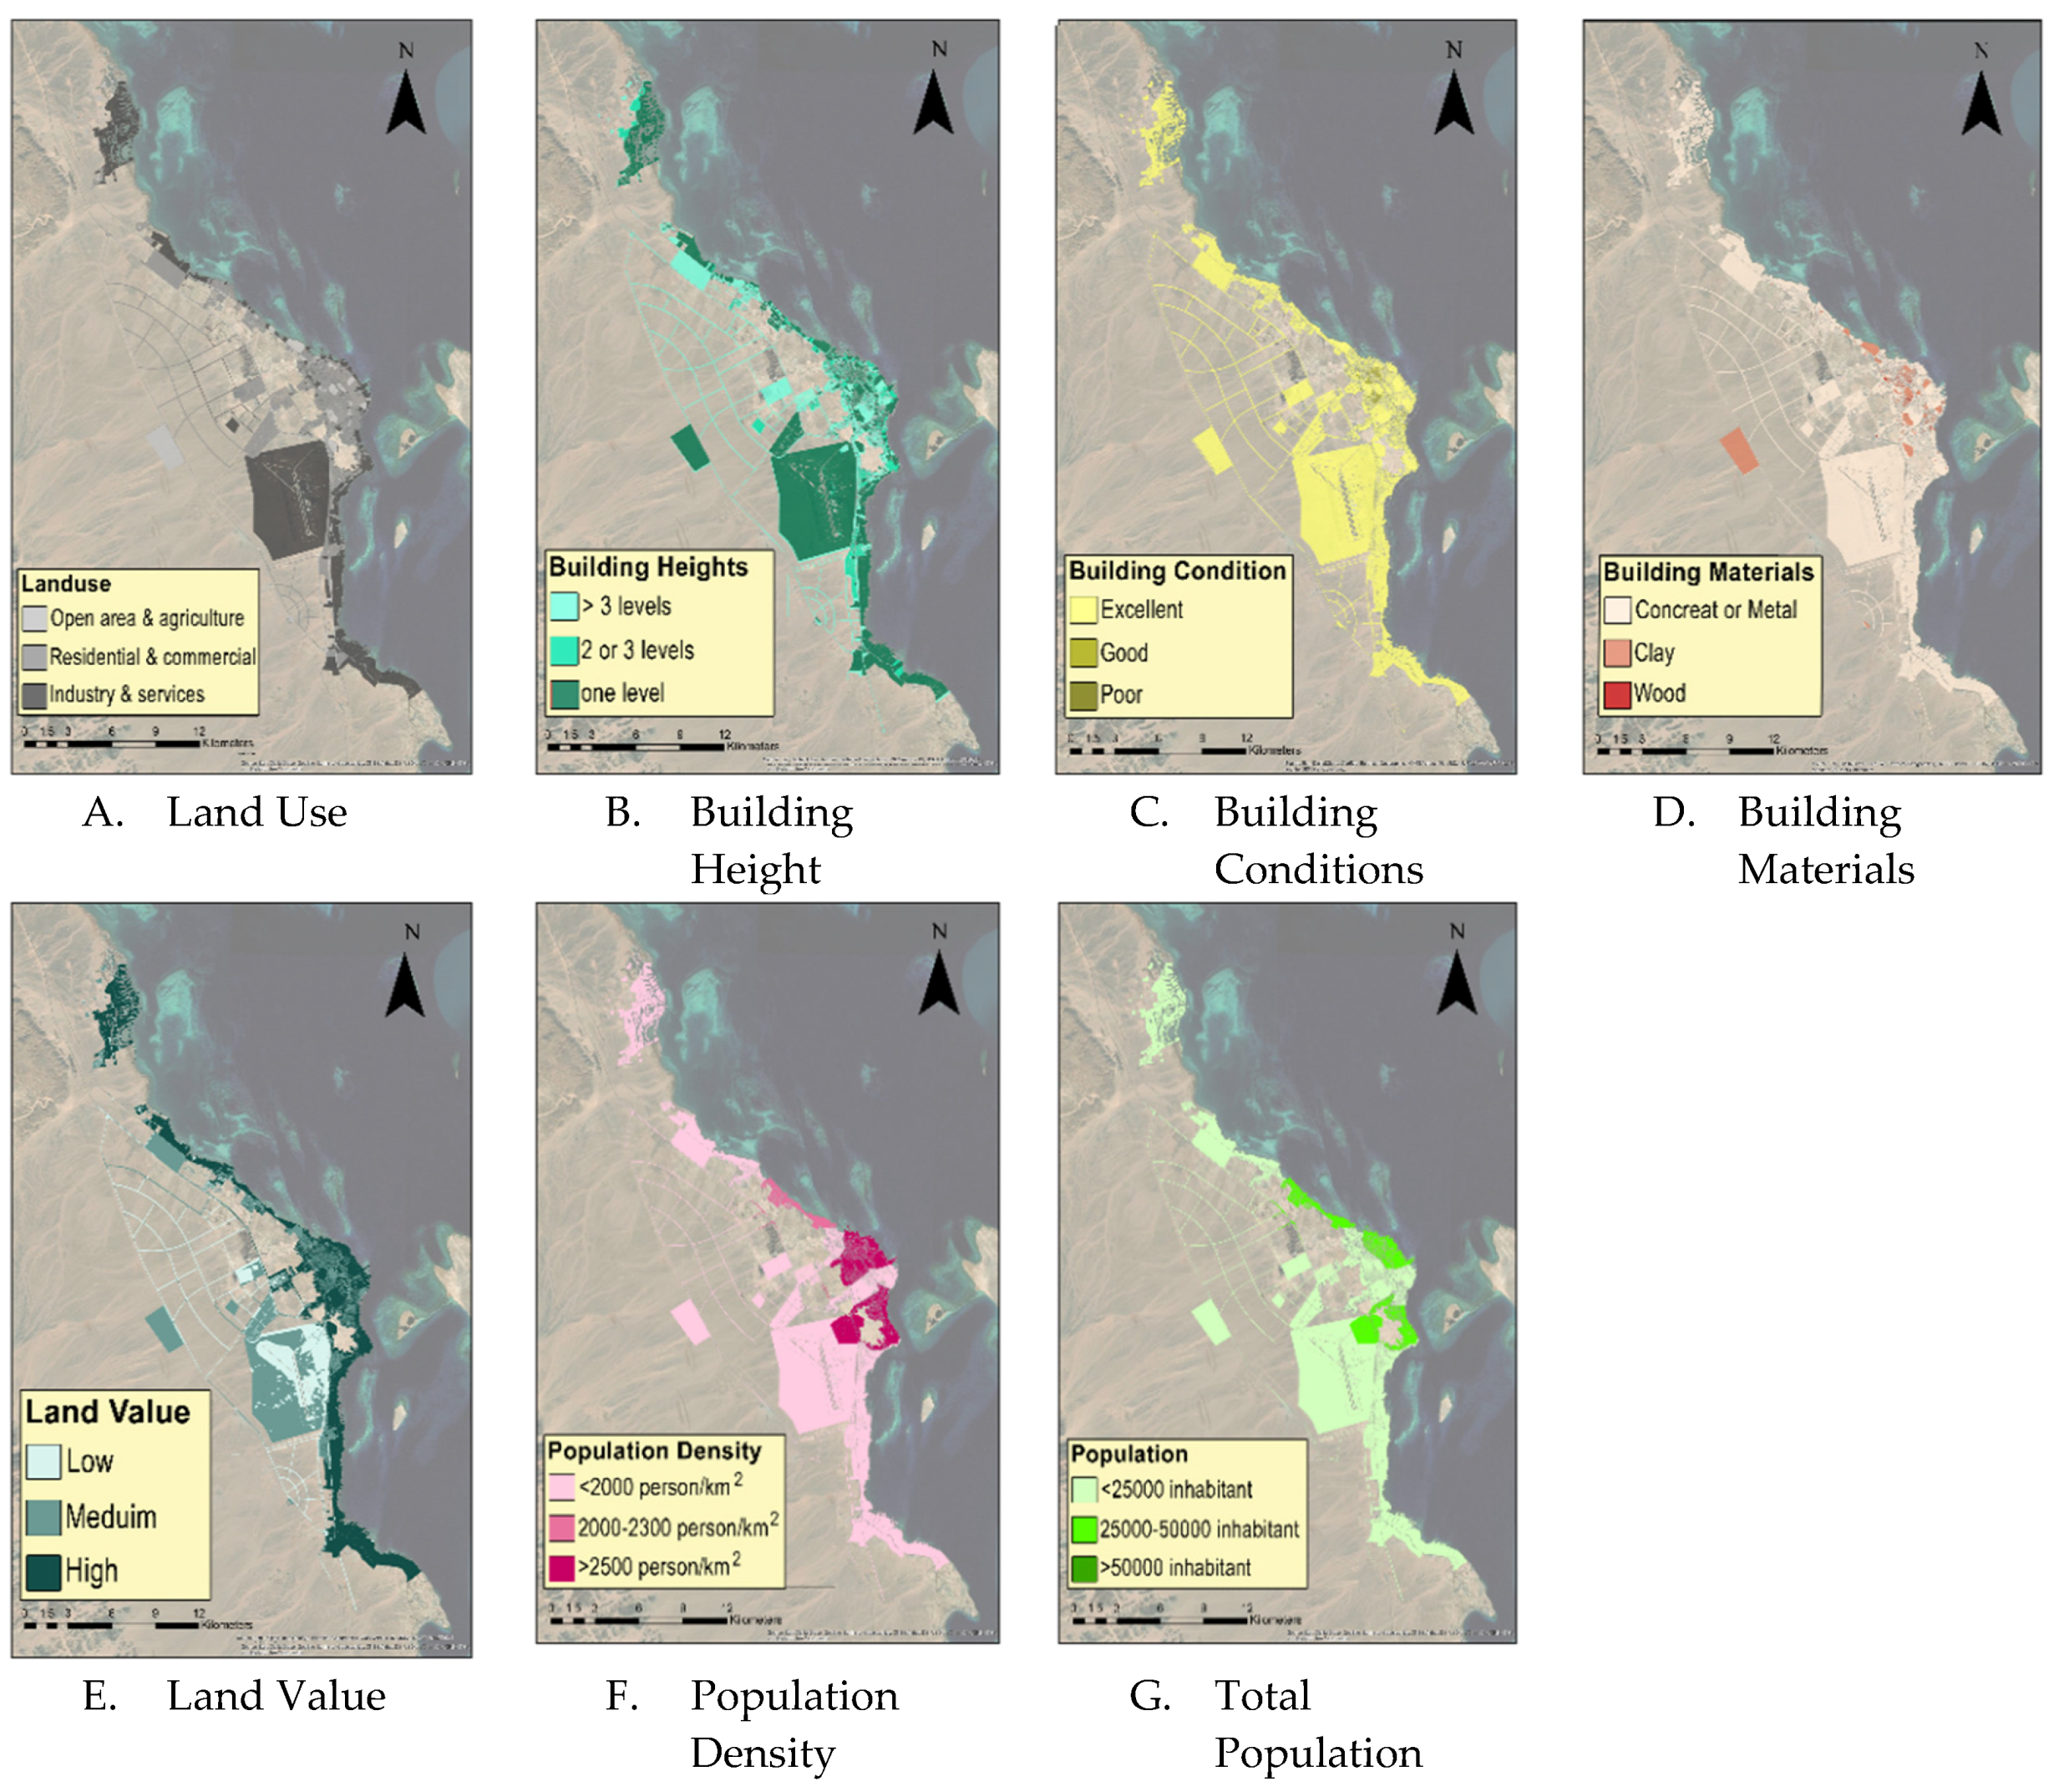
- The vulnerability mapping method was implemented through a combination of multiple physical, economic, and social vulnerability parameters for the current and future situations. The physical vulnerability parameters were land use, building height, building conditions, and building materials. Economic vulnerability had one parameter, land value. The social vulnerability parameters were the total population and population density. Vulnerability maps were generated to present the current and future situations. For the current situation, the CSP data sets obtained from detailed urban surveys were used, while for the future situation, the approved future CSP was used. Then, GIS-based MCDA using the AHP approach was applied to assign the relative weight for each vulnerability parameter and to generate urban flood vulnerability maps. The resulting vulnerability maps were ranked using five equally divided categories: very low, low, moderate, high, and very high. The classification is based on the literature.
- The risk mapping method is based on integrating the final obtained vulnerability and hazard maps. The final risk map is ranked using five equally divided categories from the minimum to maximum risk score as in the literature: very low, low, moderate, high, and very high.
3.2.1. Hazard Mapping Method
- RRI model
- Model calibration and validation
3.2.2. Vulnerability Mapping Method
Current and Future Vulnerability Mapping
Weighting of the Vulnerability Index Using the AHP
- The relative importance of each parameter pair was determined based on the pairwise comparison importance scale; this step is called prioritization (Table 5).
- Pairwise comparison for a matrix of (7 × 7) cells was created for the seven vulnerability parameters (land use, building conditions, building height, building materials, land value, total population, and population density). The elements in row i and column j of the matrix are labeled I and J. The matrix has the property of reciprocity (), as shown (Table A2) in the Appendix A.
- The matrix was standardized using the following mathematical Equation (2):
- The normalized value for each parameter from pairwise comparisons was used with the weighted values in the last column of the standardized matrix to obtain the eigenvector, representing the consistency index (CI) matrix.
- The CI was applied to check the PCM using Equation (3):where CI is the consistency index, n is the number of vulnerability parameters being compared, and λ max is the largest value of the eigenvector matrix.
- The consistency ratio (CR) is the ratio of the CI and the random index (RI) shown in Table 6 and is expressed mathematically using Equation (4):
3.2.3. Risk Mapping Method
4. Results
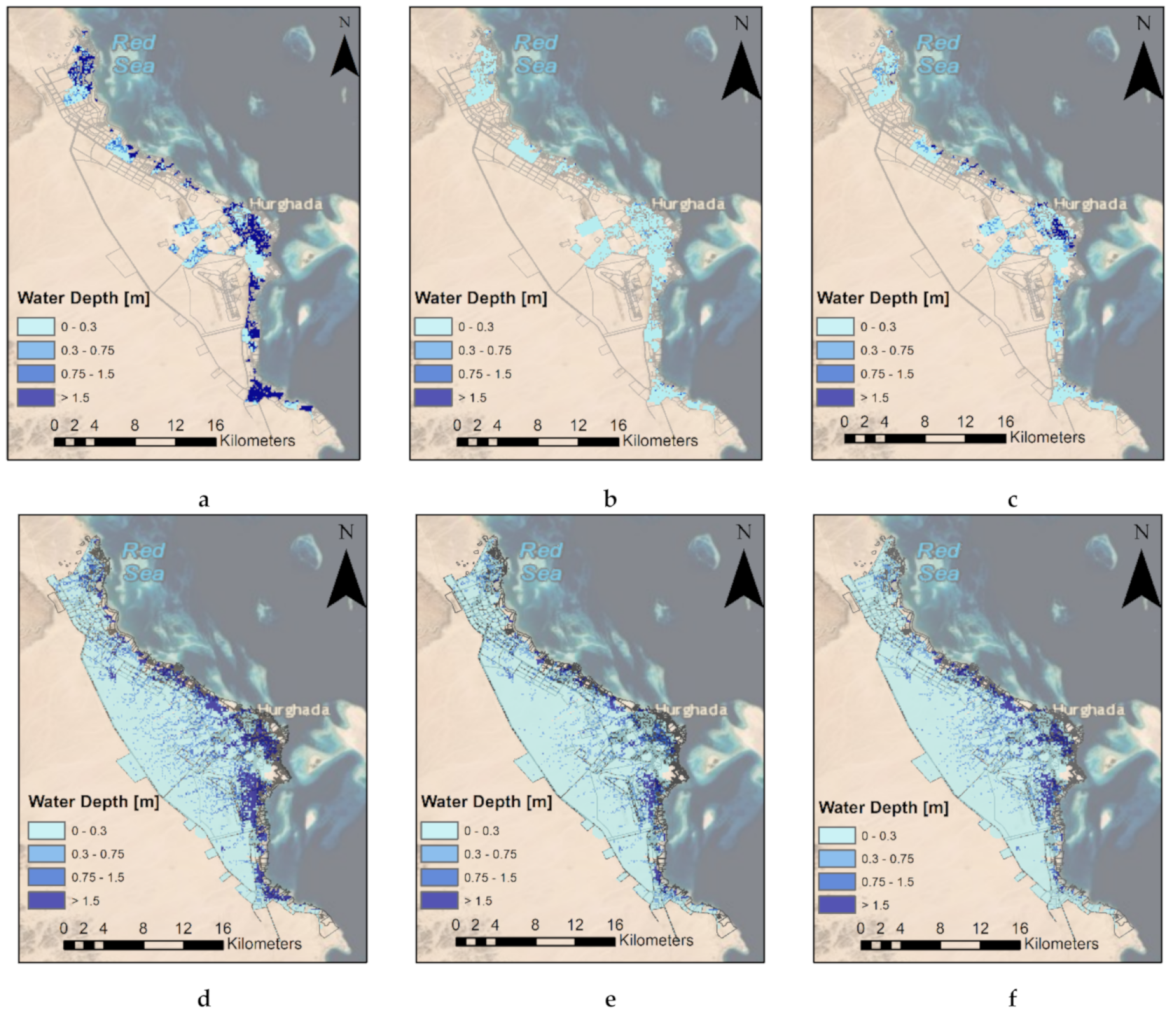
4.1. Hazard Mapping
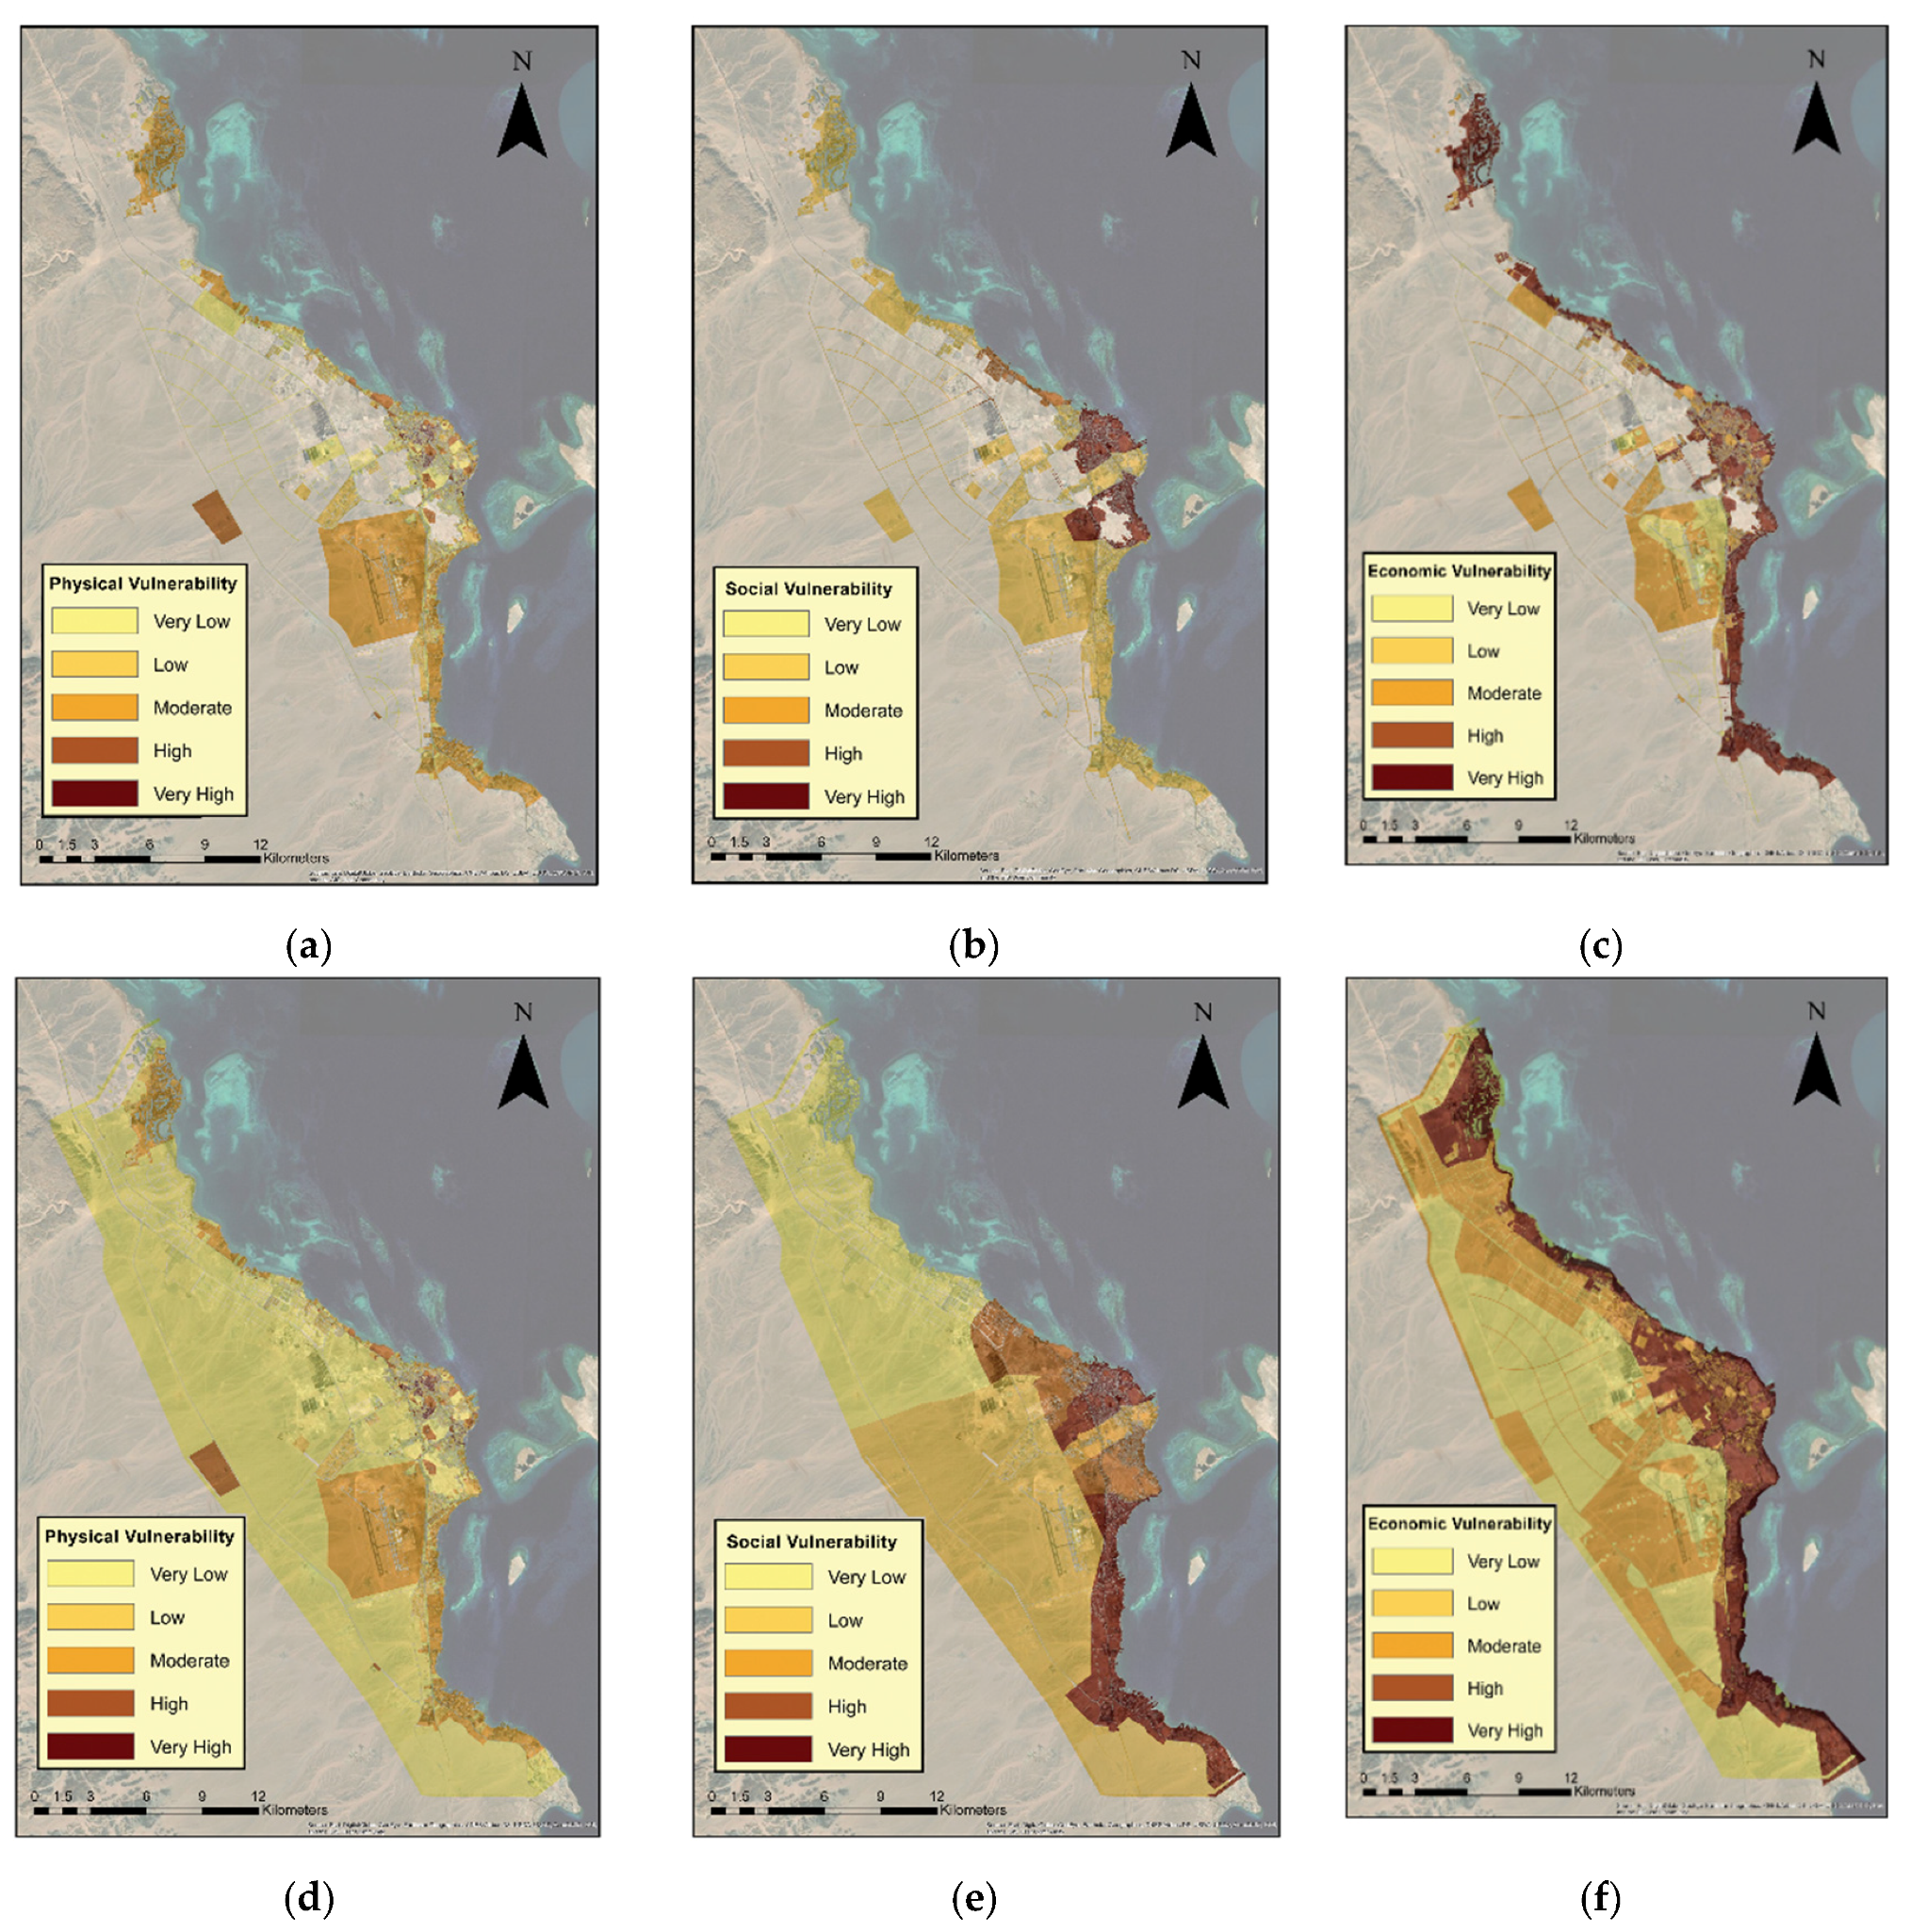
4.2. Current and Future Vulnerability Maps
4.3. Risk Mapping
5. Discussion
5.1. Hazard Mapping Using the RRI Model
5.2. Vulnerability Maps
5.3. Risk Mapping
6. Conclusions
- Hazard maps were produced using remote sensing data combined with a suitable and efficient 2D hydrological RRI simulation model for flood inundation depth calculation. A model was used to simulate flash floods for three extreme events with different REPs (5, 10, and 50 years) in both current and future situations. The model was successfully calibrated and validated, although there were limited rainfall and runoff observational data. The model was capable of simultaneously predicting the distributed runoff and flood inundation depths considering infiltration parameters that enhance the quality of the hazard maps produced. The model showed that high water levels occur along the coast and the city center because they are the lowest parts of the city. With the increase in the intensity and frequency of flash flood events, the existing areas along the coast and in the city center will be at more risk than the other areas in the extension. These areas have most tourism activities, which increases the socioeconomic risks incurred by the city.
- The vulnerability maps produced are of higher quality than those produced by previous studies based on two main aspects: (1) spatial resolution and (2) considering urban planning aspects with seven indicators at the urban microscale in ungauged regions. The vulnerability maps show that physical vulnerability has a higher impact on total vulnerability. Slums are among the areas most affected by floods in Hurghada, since these areas are highly vulnerable to destruction and loss of life. High economic vulnerability is concentrated along the coast and parts of the city center since these areas have the highest land value.
- The urban extension is in the range of low and moderate risk, except for new projects along the coast, which are expected to be at high risk. Therefore, Hurghada’s 2027 CSP needs to be revised based on the risk maps produced, especially for the new projects along the coast.
- The main two intervention points in Hurghada can be highlighted as follows: (1) the coastal areas, which have the most tourism activities, increasing the socioeconomic risks incurred by the city, and (2) slums areas.
Author Contributions
Funding
Acknowledgments
Conflicts of Interest
Appendix A

| Affected Area | Recorded Damages | |
|---|---|---|
| Oct. 2019 | Cairo, Alexandria, meet Ghamr and new Cairo | 12 deaths, road damages |
| Apr. 2018 | Al ain Alshokhna, Fifth settlement “New Cairo” | Road damage, damaged vehicles, 10 million EGP loss |
| Oct. 2016 | Ras Sedr, Sharm El Sheikh, Hurghada and Qena | Road damage, water pipe damage |
| 2015 | Assuit, Sohag, Qena, Luxor and Aswan | Destroyed houses |
| 2015 | Alexandria, Al-bhera and Matrouh Governorates | 35 deaths, 180 destroyed houses, dozens injured, thousands of acres drowned |
| Feb., Oct. 2015 | North and south of Sinai, Red Sea region | Road damages, the loading and unloading area of Hurghada International Airport drowned |
| Mar., May 2014 | Taba, Sohag, Aswan, Kom Ombo | Dam failure at Sohag, road damages |
| 2013 | South Sanai & Sohag and Assuit | 2 deaths, road damage, 750 million EGP loss |
| 2012 | W. Dahab, Catherine area | Dam failure, destroyed houses |
| Jan. 2010 | Aswan, Sinai, and Al Arish | 8 deaths, 1381 damaged houses, roads, and infrastructure |
| 2009 | Along the Red Sea coast, Aswan, Sinai | 12 deaths, damaged houses & roads and 37 injuries |
| Oct. 2004 | W. Watier | Road damage |
| May 1997 | Safaga, El-Qusier | 200 deaths, destroyed roads, demolished houses and damaged vehicles |
| Nov. 1996 | Hurghada, Marsa Alam | |
| Sep. Nov. 1994 | Dhab, Sohage, Qena, Safaga, El-Qusier, Hurghada | |
| Mar. Aug. 1991 | Marsa Alam, W. Aawag | 3200 destroyed houses |
| Oct. 1990 | W. El-Gemal, Marsa Alam | |
| Jan. 1988 | W. Sudr | 5 deaths |
| Oct. 1987 | South Sanai | 1 death, road damage, 27 injuries |
| 1985 | Qena Governorate | 32 deaths, dam failure |
| Feb. 1982 | South Giza | Demolished 180 houses |
| Apr. 1981 | Aswan Governorate | Road damage and demolished houses |
| Feb., Nov., and Dec. 1980 | Aswan Governorate, W. Elarish, Qena And Sohag | Road damage, demolished houses and farms |
| May, Oct. 1979 | Aswan, Kom Ombo, Idfu, Assiut, Marsa Alam, El-Qusier | 5619 deaths, demolished houses |
| 1975 | Minia, Assuit and Sohag | Drowning of 10 villages, 180 houses destroyed, and 1500 citizens displaced |
| Feb. 1975 | W. El-Arish | 17 deaths, road problems and 200 houses destroyed |
| 1972 | Giza | Destroyed houses, roads, and farms |
| 1954 | Qena Governorate | Destroyed 500 houses |
| 1947 | W. Al Arish | Demolished houses, destroyed roads and dam failure |
| Description | 1 | 2 | 3 | 4 | 5 | 6 | 7 |
|---|---|---|---|---|---|---|---|
| Land Use | Building Height | Building Condition | Building Materials | Land Value | Total Pop. | Pop. Density | |
| land use | 1.00 | 0.50 | 0.20 | 0.14 | 3.00 | 4.00 | 2.00 |
| building height | 2.00 | 1.00 | 0.33 | 0.20 | 4.00 | 7.00 | 2.00 |
| building condition | 5.00 | 3.00 | 1.00 | 0.25 | 7.00 | 9.00 | 4.00 |
| building materials | 7.00 | 5.00 | 4.00 | 1.00 | 7.00 | 9.00 | 7.00 |
| land value | 0.33 | 0.25 | 0.14 | 0.14 | 1.00 | 3.00 | 0.50 |
| total pop. | 0.25 | 0.14 | 0.11 | 0.11 | 0.33 | 1.00 | 0.33 |
| pop. density | 0.50 | 0.50 | 0.25 | 0.14 | 2.00 | 3.00 | 1.00 |
| Sum | 16.08 | 10.39 | 6.04 | 1.99 | 24.33 | 36.00 | 16.83 |
References
- Abdel-Fattah, M.; Kantoush, S.; Sumi, T. Integrated Management of Flash Flood in Wadi System of Egypt: Disaster Prevention and Water Harvesting; Disaster Prevention Research Institute Kyoto University: Kyoto, Japan, 2015. [Google Scholar]
- Proag, V. The concept of vulnerability and resilience. Procedia Econ. Financ. 2014, 18, 369–376. [Google Scholar] [CrossRef] [Green Version]
- Mohamed, S.A.; El-Raey, M.E. Vulnerability assessment for flash floods using GIS spatial modeling and remotely sensed data in El-Arish City, North Sinai, Egypt. Nat. Hazards 2019, 1–22. [Google Scholar] [CrossRef]
- Almalah, F. Report on the Arab Region Consultations on the Post-2015 Framework for Disaster Risk Reduction. In Proceedings of the 2nd Arab Conference on Disaster Risk Reduction, Sharm El Sheikh, Egypt, 14–16 September 2014. [Google Scholar]
- Saber, M.; Abdrabo, K.I.; Habiba, O.M.; Kantosh, S.A.; Sumi, T. Impacts of triple factors on flash flood vulnerability in Egypt: Urban growth, extreme climate, and mismanagement. Geosciences 2020, 10, 24. [Google Scholar] [CrossRef] [Green Version]
- Amundrud, Ø.; Aven, T. On how to understand and acknowledge risk. Reliab. Eng. Syst. Saf. 2015, 142, 42–47. [Google Scholar] [CrossRef] [Green Version]
- Psomiadis, E.; Dercas, N.; Dalezios, N.R.; Spyropoulos, N.V. The role of spatial and spectral resolution on the effectiveness of satellite-based vegetation indices. In Proceedings of the Remote Sensing for Agriculture, Ecosystems, and Hydrology XVIII, Edinburgh, UK, 26–29 September 2016. [Google Scholar]
- Fleischhauer, M. The role of spatial planning in strengthening urban resilience. In Resilience of Cities to Terrorist and other Threats; Springer: Berlin, Germany, 2008; pp. 273–298. [Google Scholar]
- Wamsler, C. Cities, Disaster Risk and Adaptation; Routledge: Abingdon, UK, 2014. [Google Scholar]
- Cools, J.; Vanderkimpen, P.; El Afandi, G.; Abdelkhalek, A.; Fockedey, S.; El Sammany, M.; Abdallah, G.; El Bihery, M.; Bauwens, W.; Huygens, M. An early warning system for flash floods in hyper-arid Egypt. Nat. Hazards Earth Syst. Sci. 2012, 12, 443–457. [Google Scholar] [CrossRef]
- Dewan, A. Floods in a Megacity: Geospatial Techniques in Assessing Hazards, Risk and Vulnerability; Springer: Berlin, Germany, 2013. [Google Scholar]
- Papaioannou, G.; Loukas, A.; Vasiliades, L.; Aronica, G. Flood inundation mapping sensitivity to riverine spatial resolution and modelling approach. Nat. Hazards 2016, 83, 117–132. [Google Scholar] [CrossRef]
- Aronica, G.; Bates, P.; Horritt, M. Assessing the uncertainty in distributed model predictions using observed binary pattern information within GLUE. Hydrol. Process. 2002, 16, 2001–2016. [Google Scholar] [CrossRef]
- Horritt, M.; Di Baldassarre, G.; Bates, P.; Brath, A. Comparing the performance of a 2-D finite element and a 2-D finite volume model of floodplain inundation using airborne SAR imagery. Hydrol. Process. Int. J. 2007, 21, 2745–2759. [Google Scholar] [CrossRef]
- Costabile, P.; Macchione, F. Enhancing river model set-up for 2-D dynamic flood modelling. Environ. Model. Softw. 2015, 67, 89–107. [Google Scholar] [CrossRef]
- Papaioannou, G.; Efstratiadis, A.; Vasiliades, L.; Loukas, A.; Papalexiou, S.M.; Koukouvinos, A.; Tsoukalas, I.; Kossieris, P. An operational method for flood directive implementation in ungauged urban areas. Hydrology 2018, 5, 24. [Google Scholar] [CrossRef] [Green Version]
- Bates, P.D.; Wilson, M.D.; Horritt, M.S.; Mason, D.C.; Holden, N.; Currie, A. Reach scale floodplain inundation dynamics observed using airborne synthetic aperture radar imagery: Data analysis and modelling. J. Hydrol. 2006, 328, 306–318. [Google Scholar] [CrossRef]
- Aggett, G.; Wilson, J. Creating and coupling a high-resolution DTM with a 1-D hydraulic model in a GIS for scenario-based assessment of avulsion hazard in a gravel-bed river. Geomorphology 2009, 113, 21–34. [Google Scholar] [CrossRef]
- Deckers, P.; Kellens, W.; Reyns, J.; Vanneuville, W.; De Maeyer, P. A GIS for flood risk management in Flanders. In Geospatial Techniques in Urban Hazard and Disaster Analysis; Showalter, P., Lu, Y., Eds.; Springer: Dordrecht, The Netherlands, 2009; pp. 51–69. [Google Scholar]
- Tate, E.; Muñoz, C.; Suchan, J. Uncertainty and sensitivity analysis of the HAZUS-MH flood model. Nat. Hazards Rev. 2015, 16, 04014030. [Google Scholar] [CrossRef]
- Koks, E.; De Moel, H.; Koomen, E. Comparing extreme rainfall and large-scale flooding induced inundation risk–evidence from a Dutch case-study. Stud. Water Manag. Issues 2012, 26, 3–26. [Google Scholar] [CrossRef] [Green Version]
- Apel, H.; Aronica, G.; Kreibich, H.; Thieken, A. Flood risk analyses—how detailed do we need to be? Nat. Hazards 2009, 49, 79–98. [Google Scholar] [CrossRef]
- Radwan, F.; Alazba, A.; Mossad, A. Flood risk assessment and mapping using AHP in arid and semiarid regions. Acta Geophys. 2019, 67, 215–229. [Google Scholar] [CrossRef]
- Bajabaa, S.; Masoud, M.; Al-Amri, N. Flash flood hazard mapping based on quantitative hydrology, geomorphology and GIS techniques (case study of Wadi Al Lith, Saudi Arabia). Arab. J. Geosci. 2014, 7, 2469–2481. [Google Scholar] [CrossRef]
- Kussul, N.; Shelestov, A.; Skakun, S. Flood monitoring from SAR data. In Use of Satellite and In-Situ Data to Improve Sustainability; Springer: Dordrecht, The Netherlands, 2011; pp. 19–29. [Google Scholar]
- Klemas, V. Remote sensing of floods and flood-prone areas: An overview. J. Coast. Res. 2015, 31, 1005–1013. [Google Scholar] [CrossRef]
- Psomiadis, E. Flash flood area mapping utilising SENTINEL-1 radar data. In Proceedings of the Earth Resources and Environmental Remote Sensing/GIS Applications VII, Edinburgh, UK, 27–29 September 2016; International Society for Optics and Photonics: Bellingham, WA, USA, 2016; p. 100051G. [Google Scholar]
- Sarhadi, A.; Soltani, S.; Modarres, R. Probabilistic flood inundation mapping of ungauged rivers: Linking GIS techniques and frequency analysis. J. Hydrol. 2012, 458, 68–86. [Google Scholar] [CrossRef]
- Domeneghetti, A.; Vorogushyn, S.; Castellarin, A.; Merz, B.; Brath, A. Probabilistic flood hazard mapping: Effects of uncertain boundary conditions. Hydrol. Earth Syst. Sci. 2013, 17, 3127–3140. [Google Scholar] [CrossRef] [Green Version]
- Sayama, T.; Ozawa, G.; Kawakami, T.; Nabesaka, S.; Fukami, K. Rainfall–runoff–inundation analysis of the 2010 Pakistan flood in the Kabul River basin. Hydrol. Sci. J. 2012, 57, 298–312. [Google Scholar] [CrossRef]
- Taylor, J.R.; Lovell, S.T. Mapping public and private spaces of urban agriculture in Chicago through the analysis of high-resolution aerial images in Google Earth. Landsc. Urban Plan. 2012, 108, 57–70. [Google Scholar] [CrossRef]
- Nastiti, K.D.; Kim, Y.; Jung, K.; An, H. The application of rainfall-runoff-inundation (RRI) model for inundation case in upper Citarum watershed, West Java-Indonesia. Procedia Eng. 2015, 125, 166–172. [Google Scholar] [CrossRef] [Green Version]
- Bhagabati, S.S.; Kawasaki, A. Consideration of the rainfall-runoff-inundation (RRI) model for flood mapping in a deltaic area of Myanmar. Hydrol. Res. Lett. 2017, 11, 155–160. [Google Scholar] [CrossRef] [Green Version]
- Abdel-Fattah, M.; Kantoush, S.; Saber, M.; Sumi, T. Hydrological Modelling of Flash Flood at Wadi Samail, Oman; Disaster Prevention Research Institute, Kyoto University: Kyoto, Japan, 2016. [Google Scholar]
- Glas, H.; Deruyter, G.; De Maeyer, P.; Mandal, A.; James-Williamson, S. Analyzing the sensitivity of a flood risk assessment model towards its input data. Nat. Hazards Earth Syst. Sci. 2016, 16, 2529–2542. [Google Scholar] [CrossRef] [Green Version]
- Nasiri, H.; Shahmohammadi-Kalalagh, S. Flood vulnerability index as a knowledge base for flood risk assessment in urban area. J. Nov. Appl. Sci. 2013, 2, 269–272. [Google Scholar]
- Fernandez, P.; Mourato, S.; Moreira, M.; Pereira, L. A new approach for computing a flood vulnerability index using cluster analysis. Phys. Chem. Earth Parts A/B/C 2016, 94, 47–55. [Google Scholar] [CrossRef]
- Mahmoud, S.H.; Gan, T.Y. Multi-criteria approach to develop flood susceptibility maps in arid regions of Middle East. J. Clean. Prod. 2018, 196, 216–229. [Google Scholar] [CrossRef]
- Meyer, V.; Scheuer, S.; Haase, D. A multicriteria approach for flood risk mapping exemplified at the Mulde river, Germany. Nat. Hazards 2009, 48, 17–39. [Google Scholar] [CrossRef]
- Sinha, R.; Bapalu, G.; Singh, L.; Rath, B. Flood risk analysis in the Kosi river basin, north Bihar using multi-parametric approach of analytical hierarchy process (AHP). J. Indian Soc. Remote Sens. 2008, 36, 335–349. [Google Scholar] [CrossRef]
- Meyer, V.; Haase, D.; Scheuer, S. A multicriteria flood risk assessment and mapping approach. Flood Risk Manag. Res. Pract. 2009, 4, 1687–1694. [Google Scholar] [CrossRef]
- Ouma, Y.O.; Tateishi, R. Urban flood vulnerability and risk mapping using integrated multi-parametric AHP and GIS: Methodological overview and case study assessment. Water 2014, 6, 1515–1545. [Google Scholar] [CrossRef]
- Wang, Y.; Li, Z.; Tang, Z.; Zeng, G. A GIS-based spatial multi-criteria approach for flood risk assessment in the Dongting Lake Region, Hunan, Central China. Water Resour. Manag. 2011, 25, 3465–3484. [Google Scholar] [CrossRef]
- El-Rakaiby, M. Drainage basins and flash flood hazard in selected parts of Egypt. Egypt J. Geol. 1989, 33, 309–323. [Google Scholar]
- El Shamy, I.Z. Recent recharge and flash flooding opportunities in the Eastern Desert, Egypt; Possibilités de recharge de nappes et de crues subites dans le Désert Oriental, Egypte. Ann. Geol. Surv. Egypt 1992, 18, 323–334. [Google Scholar]
- Elzawahry, A.; Elgamal, M.; Imam, Y.; Alrahbi, H.; Elshikaly, S. Flash floods-roads interaction: Experience from the Arab region. In Proceedings of the 3rd Gulf Conference on Roads (TGCR06), Muscat, Sultanate of Oman, 6–8 March 2006; pp. 6–8. [Google Scholar]
- Youssef, A.; Pradhan, B.; Gaber, A.; Buchroithner, M. Geomorphological hazard analysis along the Egyptian Red Sea coast between Safaga and Quseir. Nat. Hazards Earth Syst. Sci. 2009, 9, 751–766. [Google Scholar] [CrossRef]
- El-Magd, I.A.; Hermas, E.; El Bastawesy, M. GIS-modelling of the spatial variability of flash flood hazard in Abu Dabbab catchment, Red Sea Region, Egypt. Egypt. J. Remote Sens. Space Sci. 2010, 13, 81–88. [Google Scholar] [CrossRef] [Green Version]
- Moawad, M.B.; Abdel Aziz, A.O.; Mamtimin, B. Flash floods in the Sahara: A case study for the 28 January 2013 flood in Qena, Egypt. Geomat. Nat. Hazards Risk 2016, 7, 215–236. [Google Scholar] [CrossRef] [Green Version]
- Elnazer, A.A.; Salman, S.A.; Asmoay, A.S. Flash flood hazard affected Ras Gharib city, Red Sea, Egypt: A proposed flash flood channel. Nat. Hazards 2017, 89, 1389–1400. [Google Scholar] [CrossRef]
- Ezz, H. The Utilization of GIS in Revealing the Reasons behind Flooding Ras Gharib City, Egypt. Int. J. Eng. Res. Afr. 2017, 31, 135–142. [Google Scholar] [CrossRef]
- Monsef, H.A.E. A mitigation strategy for reducing flood risk to highways in arid regions: A case study of the El-Quseir–Qena highway in Egypt. J. Flood Risk Manag. 2018, 11, S158–S172. [Google Scholar] [CrossRef]
- Elboshy, B.; Kanae, S.; Gamaleldin, M.; Ayad, H.; Osaragi, T.; Elbarki, W. A framework for pluvial flood risk assessment in Alexandria considering the coping capacity. Environ. Syst. Decis. 2019, 39, 77–94. [Google Scholar] [CrossRef]
- Mohamed, S.A. Application of satellite image processing and GIS-Spatial modeling for mapping urban areas prone to flash floods in Qena governorate, Egypt. J. Afr. Earth Sci. 2019, 158, 103507. [Google Scholar] [CrossRef]
- Abuzied, S.; Yuan, M.; Ibrahim, S.; Kaiser, M.; Saleem, T. Geospatial risk assessment of flash floods in Nuweiba area, Egypt. J. Arid Environ. 2016, 133, 54–72. [Google Scholar] [CrossRef]
- De Brito, M.M.; Evers, M.; Höllermann, B. Prioritization of flood vulnerability, coping capacity and exposure indicators through the Delphi technique: A case study in Taquari-Antas basin, Brazil. Int. J. Disaster Risk Reduct. 2017, 24, 119–128. [Google Scholar] [CrossRef]
- Percival, S.; Teeuw, R. A methodology for urban micro-scale coastal flood vulnerability and risk assessment and mapping. Nat. Hazards 2019, 97, 355–377. [Google Scholar] [CrossRef] [Green Version]
- Eckert, S.; Jelinek, R.; Zeug, G.; Krausmann, E. Remote sensing-based assessment of tsunami vulnerability and risk in Alexandria, Egypt. Appl. Geogr. 2012, 32, 714–723. [Google Scholar] [CrossRef]
- Youssef, A.; Abdel Moneim, A.; Abu El-Maged, S. Flood hazard assessment and its associated problems using geographic information systems. In Proceedings of the Fourth International Conference on the Geology of Africa, Assiut, Egypt, 15–16 November 2005; pp. 1–17. [Google Scholar]
- Saidi, S.; Ghattassi, A.; Anselme, B.; Bouri, S. GIS based multi-criteria analysis for flood risk assessment: Case of manouba essijoumi basin, NE Tunisia. In Advances in Remote Sensing and Geo Informatics Applications; CAJG 2018; El-Askary, H., Lee, S., Heggy, E., Pradhan, B., Eds.; Advances in Science, Technology & Innovation (IEREK Interdisciplinary Series for Sustainable Development); Springer: Cham, Switzerland, 2019; pp. 273–279. [Google Scholar]
- Balica, S. Approaches of understanding developments of vulnerability indices for natural disasters. Environ. Eng. Manag. J. 2012, 11, 963–974. [Google Scholar] [CrossRef]
- Park, K.; Lee, M.-H. The Development and Application of the Urban Flood Risk Assessment Model for Reflecting upon Urban Planning Elements. Water 2019, 11, 920. [Google Scholar] [CrossRef] [Green Version]
- Glas, H.; Rocabado, I.; Huysentruyt, S.; Maroy, E.; Salazar Cortez, D.; Coorevits, K.; De Maeyer, P.; Deruyter, G. Flood risk mapping worldwide: A flexible methodology and toolbox. Water 2019, 11, 2371. [Google Scholar] [CrossRef] [Green Version]
- Mustafa, A.; Bruwier, M.; Archambeau, P.; Erpicum, S.; Pirotton, M.; Dewals, B.; Teller, J. Effects of spatial planning on future flood risks in urban environments. J. Environ. Manag. 2018, 225, 193–204. [Google Scholar] [CrossRef] [PubMed]
- Greiving, S. Integrated risk assessment of multi-hazards: A new methodology. Spec. Pap. -Geol. Surv. Finl. 2006, 42, 75. [Google Scholar]
- Greiving, S.; Fleischhauer, M.; Wanczura, S. Management of natural hazards in Europe: The role of spatial planning in selected EU member states. J. Environ. Plan. Manag. 2006, 49, 739–757. [Google Scholar] [CrossRef]
- Grimaldi, S.; Petroselli, A.; Arcangeletti, E.; Nardi, F. Flood mapping in ungauged basins using fully continuous hydrologic–hydraulic modeling. J. Hydrol. 2013, 487, 39–47. [Google Scholar] [CrossRef]
- Khan, S.I.; Hong, Y.; Wang, J.; Yilmaz, K.K.; Gourley, J.J.; Adler, R.F.; Brakenridge, G.R.; Policelli, F.; Habib, S.; Irwin, D. Satellite remote sensing and hydrologic modeling for flood inundation mapping in Lake Victoria basin: Implications for hydrologic prediction in ungauged basins. IEEE Trans. Geosci. Remote Sens. 2010, 49, 85–95. [Google Scholar] [CrossRef] [Green Version]
- Li, W.; Lin, K.; Zhao, T.; Lan, T.; Chen, X.; Du, H.; Chen, H. Risk assessment and sensitivity analysis of flash floods in ungauged basins using coupled hydrologic and hydrodynamic models. J. Hydrol. 2019, 572, 108–120. [Google Scholar] [CrossRef]
- Jafarzadegan, K.; Merwade, V. A DEM-based approach for large-scale floodplain mapping in ungauged watersheds. J. Hydrol. 2017, 550, 650–662. [Google Scholar] [CrossRef]
- Tsanis, I.; Seiradakis, K.; Daliakopoulos, I.; Grillakis, M.; Koutroulis, A. Assessment of GeoEye-1 stereo-pair-generated DEM in flood mapping of an ungauged basin. J. Hydroinform. 2014, 16, 1–18. [Google Scholar] [CrossRef]
- Samela, C.; Manfreda, S.; Paola, F.D.; Giugni, M.; Sole, A.; Fiorentino, M. DEM-based approaches for the delineation of flood-prone areas in an ungauged basin in Africa. J. Hydrol. Eng. 2016, 21, 06015010. [Google Scholar] [CrossRef]
- Mashaly, J.; Ghoneim, E. Flash flood hazard using optical, radar, and stereo-pair derived dem: Eastern desert, Egypt. Remote Sens. 2018, 10, 1204. [Google Scholar] [CrossRef] [Green Version]
- Büchele, B.; Kreibich, H.; Kron, A.; Thieken, A.; Ihringer, J.; Oberle, P.; Merz, B.; Nestmann, F. Flood-risk mapping: Contributions towards an enhanced assessment of extreme events and associated risks. Nat. Hazards Earth Syst. Sci. 2006, 6, 485–503. [Google Scholar] [CrossRef]
- Kappes, M.S.; Papathoma-Koehle, M.; Keiler, M. Assessing physical vulnerability for multi-hazards using an indicator-based methodology. Appl. Geogr. 2012, 32, 577–590. [Google Scholar] [CrossRef]
- Stephenson, V.; D’ayala, D. A new approach to flood vulnerability assessment for historic buildings in England. Nat. Hazards Earth Syst. Sci. 2014, 14, 1035. [Google Scholar] [CrossRef] [Green Version]
- Papathoma-Köhle, M.; Gems, B.; Sturm, M.; Fuchs, S. Matrices, curves and indicators: A review of approaches to assess physical vulnerability to debris flows. Earth-Sci. Rev. 2017, 171, 272–288. [Google Scholar] [CrossRef]
- Ruiter, M.C.d.; Ward, P.J.; Daniell, J.E.; Aerts, J.C. A comparison of flood and earthquake vulnerability assessment indicators. Nat. Hazards Earth Syst. Sci. 2017, 17, 1231–1251. [Google Scholar] [CrossRef] [Green Version]
- General Organization for Physical Planning (GOPP), General Strategic Plan of 2027 for Proposed Future Urbanization Area for the City of Hurghada, Red Sea; General Organization for Physical Planning (GOPP): Cairo, Egypt, 2013.
- Gado, T.A. Statistical characteristics of extreme rainfall events in Egypt. In Proceedings of the Twentieth International Water Technology Conference, IWTC20, Hurghada, Egypt, 18–20 May 2017; pp. 18–20. [Google Scholar]
- Moustafa, M. The People of Hurghada Complain about Electricity, Water cutout and Inundated Streets due to Floods. Available online: https://www.youm7.com/story/2016/10/28/ (accessed on 20 April 2020).
- The People of Hurghada Distress the Officials after the Floods. Available online: https://www.alnaharegypt.com/191578 (accessed on 6 July 2020).
- Adeel, M. Methodology for identifying urban growth potential using land use and population data: A case study of Islamabad Zone IV. Procedia Environ. Sci. 2010, 2, 32–41. [Google Scholar] [CrossRef] [Green Version]
- Adelekan, I.O. Vulnerability of poor urban coastal communities to flooding in Lagos, Nigeria. Environ. Urban. 2010, 22, 433–450. [Google Scholar] [CrossRef] [Green Version]
- Devi, N.N.; Sridharan, B.; Kuiry, S.N. Impact of urban sprawl on future flooding in Chennai city, India. J. Hydrol. 2019, 574, 486–496. [Google Scholar] [CrossRef]
- Available online: https://chrsdata.eng.uci.edu/ (accessed on 12 March 2020).
- Eldeberky, Y.; Hünicke, B. Vulnerability of the Nile delta to recent and future climate change. In Proceedings of the E-proceedings of the 36th IAHR World Congress, The Hague, The Netherlands, 28 June–3 July 2015. [Google Scholar]
- Facility, A.S. The Digital Elevation Model (DEM), ALOS-PALSAR DEM. Available online: https://search.asf.alaska.edu/#/?dataset=ALOS (accessed on 8 May 2020).
- Frazier, T.G.; Thompson, C.M.; Dezzani, R.J. A framework for the development of the SERV model: A Spatially Explicit Resilience-Vulnerability model. Appl. Geogr. 2014, 51, 158–172. [Google Scholar] [CrossRef]
- Aroca-Jimenez, E.; Bodoque, J.M.; Garcia, J.A.; Diez-Herrero, A. Construction of an integrated social vulnerability index in urban areas prone to flash flooding. Nat. Hazards Earth Syst. Sci. 2017, 17, 1541–1557. [Google Scholar] [CrossRef] [Green Version]
- Saaty, T.L. What is the analytic hierarchy process. In Mathematical Models for Decision Support; Springer: Heidelberg/Berlin, Germany, 1988; pp. 109–121. [Google Scholar]
- Proctor, W. Towards sustainable forest management an application of multi-criteria analysis to Australian forest policy. In Proceedings of the Third International Conference of the European Society for Ecological Economics, Vienna, Austria, 3–6 May 2000. [Google Scholar]
- Saaty, T.L. Fundamentals of Decision Making and Priority Theory with the Analytic Hierarchy Process; RWS Publications: Pittsburgh, PA, USA, 2000. [Google Scholar]
- Kron, W. Flood risk= hazard• values• vulnerability. Water Int. 2005, 30, 58–68. [Google Scholar] [CrossRef]
- Pour, S.H.; Abd Wahab, A.K.; Asaduzzaman Shahid, S.; Dewan, A. Low impact development techniques to mitigate the impacts of climate-change-induced urban floods: Current trends, issues and challenges. Sustain. Cities Soc. 2020, 62, 102373. [Google Scholar] [CrossRef]
- Jha, A.K.; Bloch, R.; Lamond, J. Cities and Flooding: A Guide to Integrated Urban Flood Risk Management for the 21st Century; The World Bank: Washington, DC, USA, 2012. [Google Scholar]


| DATE | AFFECTED AREA | RECORDED DAMAGES | RAINFALL (MM/EVENT) | RETURN PERIOD |
|---|---|---|---|---|
| 15–16 October 2019 | Hurghada, Ras Gharib | Road damage | 6.8 | 1 year |
| 27–28 October 2016 | Ras Sedr, Sharm El Sheikh, Hurghada and Qena | Road damage, water pipe damage, demolished houses, damaged vehicles | 47.9 | 10 years |
| 9–10 March 2014 | Hurghada | Road and water pipe damage | 37.8 | 5 years |
| 16–18 November 1996 | Hurghada, Marsa Alam | 200 deaths, damaged roads, houses, and vehicles | 110 | 50 years |
| Data Type | Date | Format | Data Source | Derived Data |
|---|---|---|---|---|
| Census and demographic data | 2017 | ASCII, JPEG | [83] | Total Population, Population Density, Administrative Boundaries |
| ASTER-ALSO-PALSAR (12.5 m spatial resolution) | 2020 | Geotiff | [84] | Topographic and Hydrological Parameters |
| Rainfall (scale 0.04° × 0.04°) (hourly based) | 2020 | PERSIANN-CCS | [85] | Rainfall Distribution during the 2014 and 2016 Events |
| Rainfall (scale 0.25° × 0.25°) (daily based) | PERSIANN-CDR | [86] | Rainfall Distribution during the 1994 Event | |
| Sentinel (2A) (30 m resolution) | 2019 | Geotiff | [87] | Land Cover Types |
| Photos during the event | 2016 2014 | JPEG | [81] | Images Needed for Model Calibration and Validation |
| Current urban database of the city and the approved 2027 plan for Hurghada | 2013 | Geospatial database, JPEG, PDF | [79] | Land Use, Building Height, Building Conditions, Building Materials, Land Value, Total Population and Population Density |
| Parameter | Range | Desert | Urban |
|---|---|---|---|
| River Roughness Coefficient | 0.015–0.04 | 0.022 | |
| Hillslope Roughness Coefficient | 0.15–1 | 0.3 | 0.2 |
| Soil Depth | 0.1–2 | 1 | 1 |
| Soil Porosity | 0.05–0.6 | 0.3 | 0.1 |
| Vertical Sat. Hydraulic Conductivity | 6.54 × 10⁻⁵–1.67 × 10⁻⁷ | 4 × 10⁻⁶ | 0 |
| Suction at the Vertical Wetting Front | 0.0495–0.3163 | 0.3163 | 0 |
| Lateral Sat. Hydraulic Conductivity | 0.01–0.3 | 0 | 0 |
| Unsaturation Eff. Porosity | 0.02–0.4 | 0.1 | 0 |
| Indicators | Vulnerability Score Criteria | ||
|---|---|---|---|
| Low (Score = 1) | Moderate (Score = 2) | High (Score = 3) | |
| Number of floors | <3 floors | 2–3 floors | one floor |
| Land use | Open areas and agriculture | Residential, commercial and services | Industry, tourism, and storage |
| Building materials | Concrete, metal | Clay | Wood |
| Population density | Less than 2000 persons/km2 | 2000–2300 persons/km2 | More than 2500 persons/km2 |
| Total population | Less than 25,000 inhabitants | From 25,000–50,000 inhabitants | More than 50,000 inhabitants |
| Building conditions | Excellent | Good | Poor |
| Land value | Low | Medium | High |
| Scale | Description | Reciprocals * |
|---|---|---|
| 1 | Elements i and j have equal importance | 1 |
| 3 | Element i is slightly more important than element j | 1/3 |
| 5 | Element i is more important than element j | 1/5 |
| 7 | Element i is much more important than element j | 1/7 |
| 9 | Element i is very much more important than element j | 1/9 |
| No. of Indicators | 1 | 2 | 3 | 4 | 5 | 6 | 7 | 8 | 9 | 10 |
|---|---|---|---|---|---|---|---|---|---|---|
| RI | 0 | 0 | 0.58 | 0.9 | 1.12 | 1.24 | 1.32 | 1.41 | 1.45 | 1.49 |
Publisher’s Note: MDPI stays neutral with regard to jurisdictional claims in published maps and institutional affiliations. |
© 2020 by the authors. Licensee MDPI, Basel, Switzerland. This article is an open access article distributed under the terms and conditions of the Creative Commons Attribution (CC BY) license (http://creativecommons.org/licenses/by/4.0/).
Share and Cite
Abdrabo, K.I.; Kantoush, S.A.; Saber, M.; Sumi, T.; Habiba, O.M.; Elleithy, D.; Elboshy, B. Integrated Methodology for Urban Flood Risk Mapping at the Microscale in Ungauged Regions: A Case Study of Hurghada, Egypt. Remote Sens. 2020, 12, 3548. https://0-doi-org.brum.beds.ac.uk/10.3390/rs12213548
Abdrabo KI, Kantoush SA, Saber M, Sumi T, Habiba OM, Elleithy D, Elboshy B. Integrated Methodology for Urban Flood Risk Mapping at the Microscale in Ungauged Regions: A Case Study of Hurghada, Egypt. Remote Sensing. 2020; 12(21):3548. https://0-doi-org.brum.beds.ac.uk/10.3390/rs12213548
Chicago/Turabian StyleAbdrabo, Karim I., Sameh A. Kantoush, Mohamed Saber, Tetsuya Sumi, Omar M. Habiba, Dina Elleithy, and Bahaa Elboshy. 2020. "Integrated Methodology for Urban Flood Risk Mapping at the Microscale in Ungauged Regions: A Case Study of Hurghada, Egypt" Remote Sensing 12, no. 21: 3548. https://0-doi-org.brum.beds.ac.uk/10.3390/rs12213548