Wildfire-Detection Method Using DenseNet and CycleGAN Data Augmentation-Based Remote Camera Imagery


1
School of Civil, Architectural Engineering & Landscape Architecture, Sungkyunkwan University, Suwon 16419, Korea
2
Department of Convergence Engineering for Future City, Sungkyunkwan University, Suwon 16419, Korea
3
Technical Research Center, Smart Inside Co., Ltd., Suwon 16419, Korea
*
Author to whom correspondence should be addressed.
Remote Sens. 2020, 12(22), 3715; https://0-doi-org.brum.beds.ac.uk/10.3390/rs12223715
Submission received: 21 October 2020
/
Revised: 9 November 2020
/
Accepted: 11 November 2020
/
Published: 12 November 2020
(This article belongs to the Special Issue Advanced Deep Learning Strategies for the Analysis of Remote Sensing Images)
Abstract
:To minimize the damage caused by wildfires, a deep learning-based wildfire-detection technology that extracts features and patterns from surveillance camera images was developed. However, many studies related to wildfire-image classification based on deep learning have highlighted the problem of data imbalance between wildfire-image data and forest-image data. This data imbalance causes model performance degradation. In this study, wildfire images were generated using a cycle-consistent generative adversarial network (CycleGAN) to eliminate data imbalances. In addition, a densely-connected-convolutional-networks-based (DenseNet-based) framework was proposed and its performance was compared with pre-trained models. While training with a train set containing an image generated by a GAN in the proposed DenseNet-based model, the best performance result value was realized among the models with an accuracy of 98.27% and an F1 score of 98.16, obtained using the test dataset. Finally, this trained model was applied to high-quality drone images of wildfires. The experimental results showed that the proposed framework demonstrated high wildfire-detection accuracy.
1. Introduction
Wildfires cause significant harm to humans and damage to private and public property; they pose a constant threat to public safety. More than 200,000 wildfires occur globally every year, with a combustion area of 3.5–4.5 million km2 [1]. In addition, climate change is gradually accelerating the effects of these wildfires; there is thus considerable interest in wildfire management [2,3,4]. As wildfires are difficult to control once they spread over a certain area, early detection is the most important factor in minimizing wildfire damage. Traditionally, wildfires were primarily detected by human observers, but a deep learning-based automatic wildfire detection system with real-time surveillance cameras has the advantage of the possibility of constant and accurate monitoring, compared to human observers. The available methods for the early detection of wildfires can be categorized as a sensor-based technology and image-processing-based technology, using a camera. Sensors that detect changes in smoke, pressure, humidity, and temperature are widely used for fire detection. However, this method has several disadvantages, such as high initial cost and high false-alarm rates, as the performance of sensors is significantly affected by the surrounding environment [5,6,7].
With the rapid development of digital-cameras and image-processing technologies, traditional methods are replaced by video- and image-data-based methods [8]. Using these methods, a large area of a forest can be monitored, where fires and smoke can be detected immediately after the outbreak of a wildfire. In addition, owing to intelligent image-analysis technology, image-based methods can be used to address the problem of the inflexibility of sensing technology to new environments [9]. Such early approaches include the use of support vector machines (SVM) [10,11] for classifying wildfire images, and fuzzy c-means clustering [12] for identifying potential fire regions. Recently, convolutional neural networks (CNNs), which provide excellent image classification and object detection by extracting features and patterns from images, made many contributions to the wildfire-detection field [13,14,15,16]. CNN is one of the most popular neural networks and was successfully used in many research and industry applications, such as computer vision and image processing [17,18]. These networks were developed and successfully applied to many challenging image-classification problems, such as for improving a model’s performance [19,20]. Muhammad et al. [21] developed a modified model from GoogleNet Architecture for fire detection, to increase the model’s accuracy, and proposed a framework for fire detection in closed-circuit television surveillance systems. Jung et al. [22] developed a decision support system concept architecture for wildfire management and evaluated CNN-based fire-detection technology from the Fire dataset. As noted by Jain et al. in their review of machine-learning applications in wildfire detection [23], Zhang et al. found that CNN outperforms the SVM-based method [24], and Cao et al. reported a 97.8% accuracy rate for smoke detection, using convolutional layers [25]. Recently, advances in mobile communication technology made it possible to use unmanned aerial vehicles (UAVs), which are more flexible than fixed fire-monitoring towers; images obtained from UAVs are used to learn fire-detection models [26,27].
Despite the contributions of these successful studies, some issues still need to be resolved in order to apply this technology in the field. Mountain-image data are easy to obtain, owing to the availability of various built-up datasets. However, not only is there a dearth of fire or smoke images of wildfires in datasets, but such data are also relatively difficult to obtain because they require the use of installed surveillance cameras or operational drones at the site of the wildfire [28,29]. Therefore, research on damage detection is frequently faced with a data imbalance problem, which causes overfitting; overfitting results in the deterioration of the model performance [30]. In order to solve this data imbalance problem, in a recent study, synthetic images were generated and used to expand the fire/smoke dataset [24,31]. In early studies, the data were increased using indoor artificially generated smoke and flames or artificial images that comprised cut-and-pasted images of flames in their background. However, this requires considerable manpower, and it is difficult to emulate the characteristics of wildfire images using indoor images. Generative adversarial networks (GANs) [32] are models that create new images using two networks—a generator and a discriminator. The generator creates similar data using the training set, and the discriminator distinguishes between the real data and the fake data created by the generator. The image rotation and image cropping data augmentation method can also be used to expand the training dataset; however, GANs can be used to increase dataset diversity as well as to increase the amount of data. They recently exhibited impressive photorealistic-image-creation results [33,34,35,36]. GANs were proven to improve performance when learning the classifier, mainly in areas where it is difficult to obtain damage data [37,38,39]. However, there are relatively few related studies in the field of wildfire detection. Namozov et al. used GANs to create fire photographs with winter and evening backgrounds in the original photographs, and added a variety of seasons and times [28]. However, it is difficult to provide various types of fire scenarios in various places as the resultant image retains not only the background of the original photo, but also the shape of the flame and smoke. To apply the early wildfire detection model to the field, it is necessary to learn various types of wildfire images using new backgrounds, such that wildfire detection can be actively performed even in a new environment.
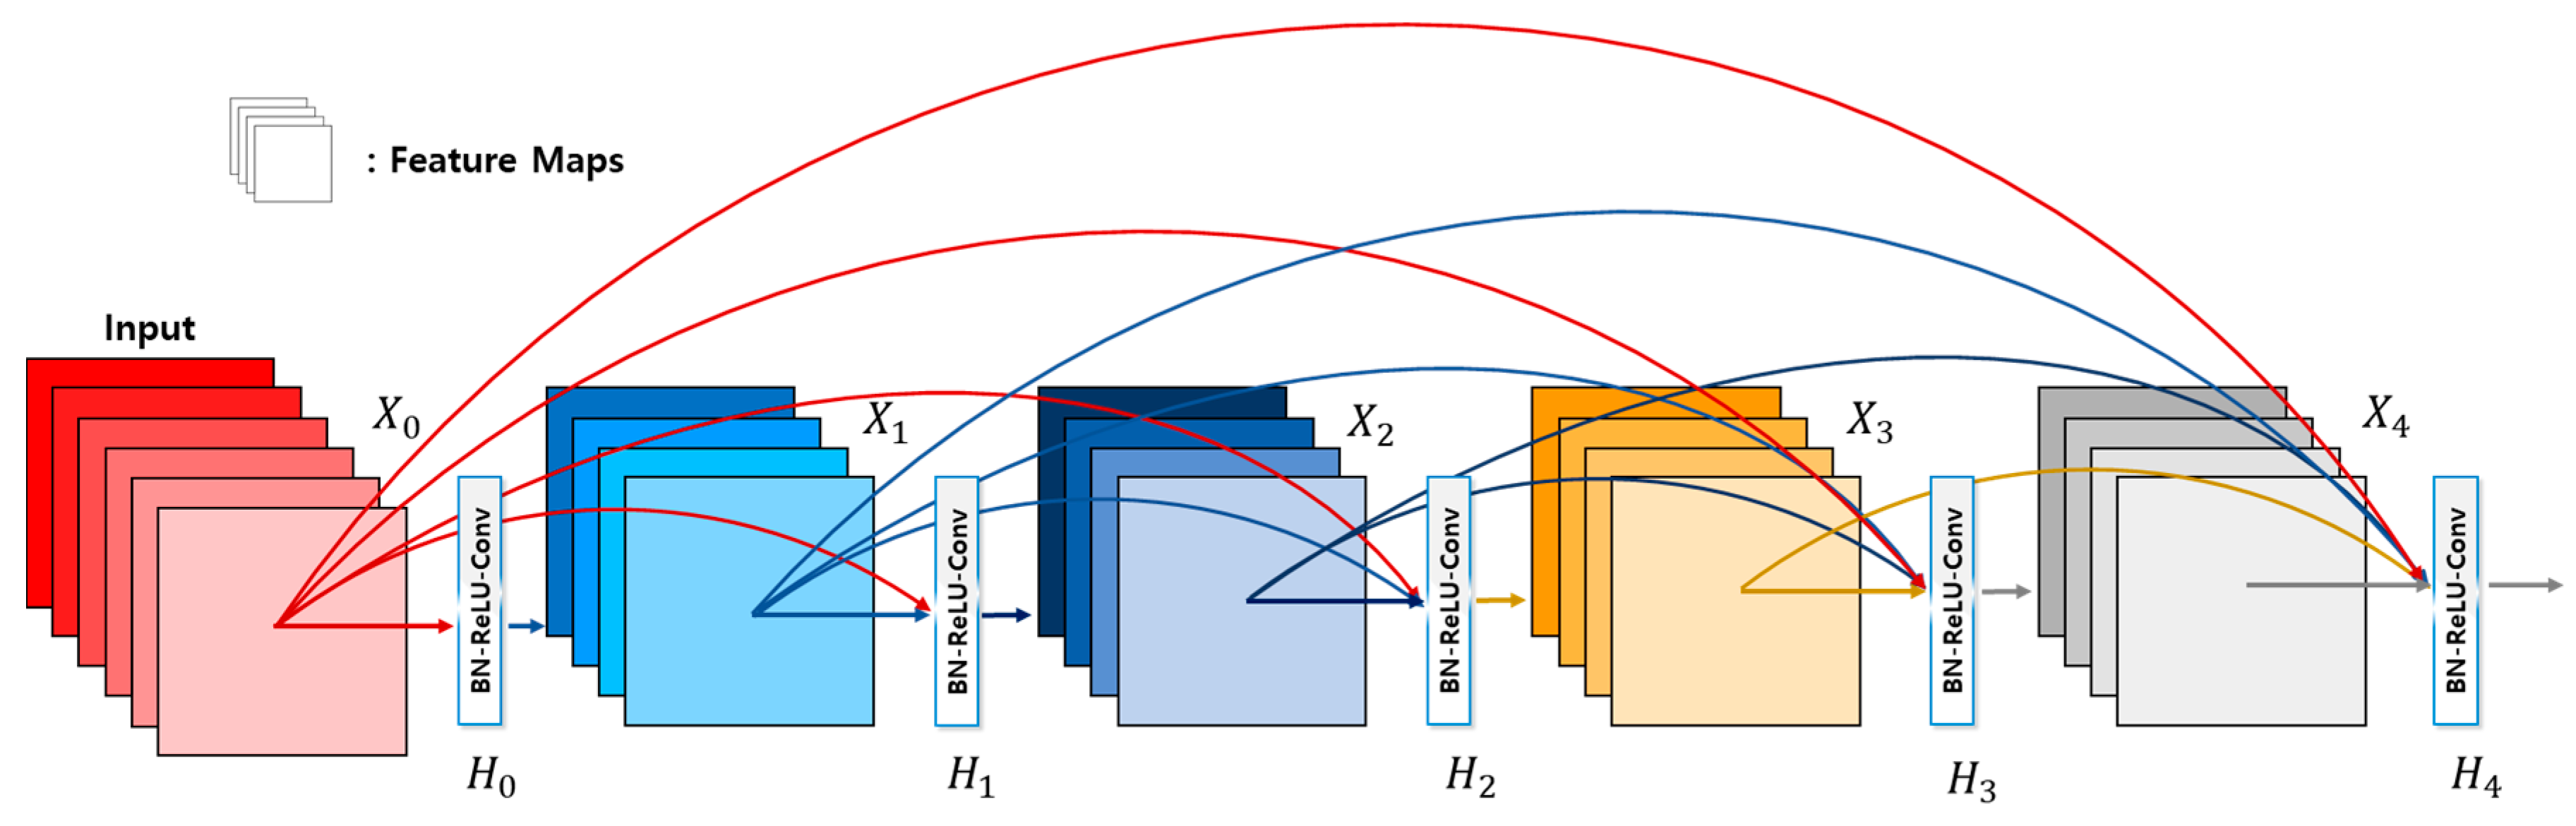
With the development of the CNN model and the deepening of neural networks, problems such as vanishing gradients arise, which causes overfitting and deterioration of the model performance. An algorithm constructed using the latest neural network architecture of DenseNet [40] could be used to address this issue. DenseNet improves the performance of a model by connecting the feature maps of the previous layers to the inputs of the next layer using concatenation to maximize the information flow between layers.
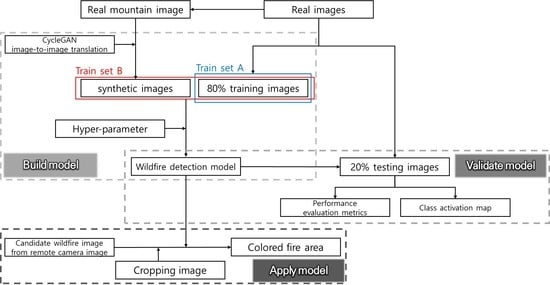
Inspired by recent works, we generated synthetic wildfire images using GANs to change the image of a fire-free mountain to that of a mountain with a wildfire. The k-folds (k = 5) cross validation scheme was used on the models, and the train set was separated, train sets A and B, consisting of only the original images and of the original and generated images, respectively. Each dataset was divided to obtain the training data and test data, and was used to train a model that was developed based on DenseNet; this facilitated the comparison of the performance with two pre-trained models, VGG-16 [19] and ResNet-50 [20]. This paper is organized as follows. Section 2 describes the architecture of cycle-consistent adversarial networks (CycleGANs) [41], which is one of the main GANs algorithms used for data augmentation, and DenseNet [40], which is used for wildfire-image classification (wildfire detection). The experiment results obtained using both the models and the classification performance comparison with those of the pre-trained models are presented in Section 3. Section 4 presents the conclusion of this study.
2. Materials and Methods
2.1. Data Collection
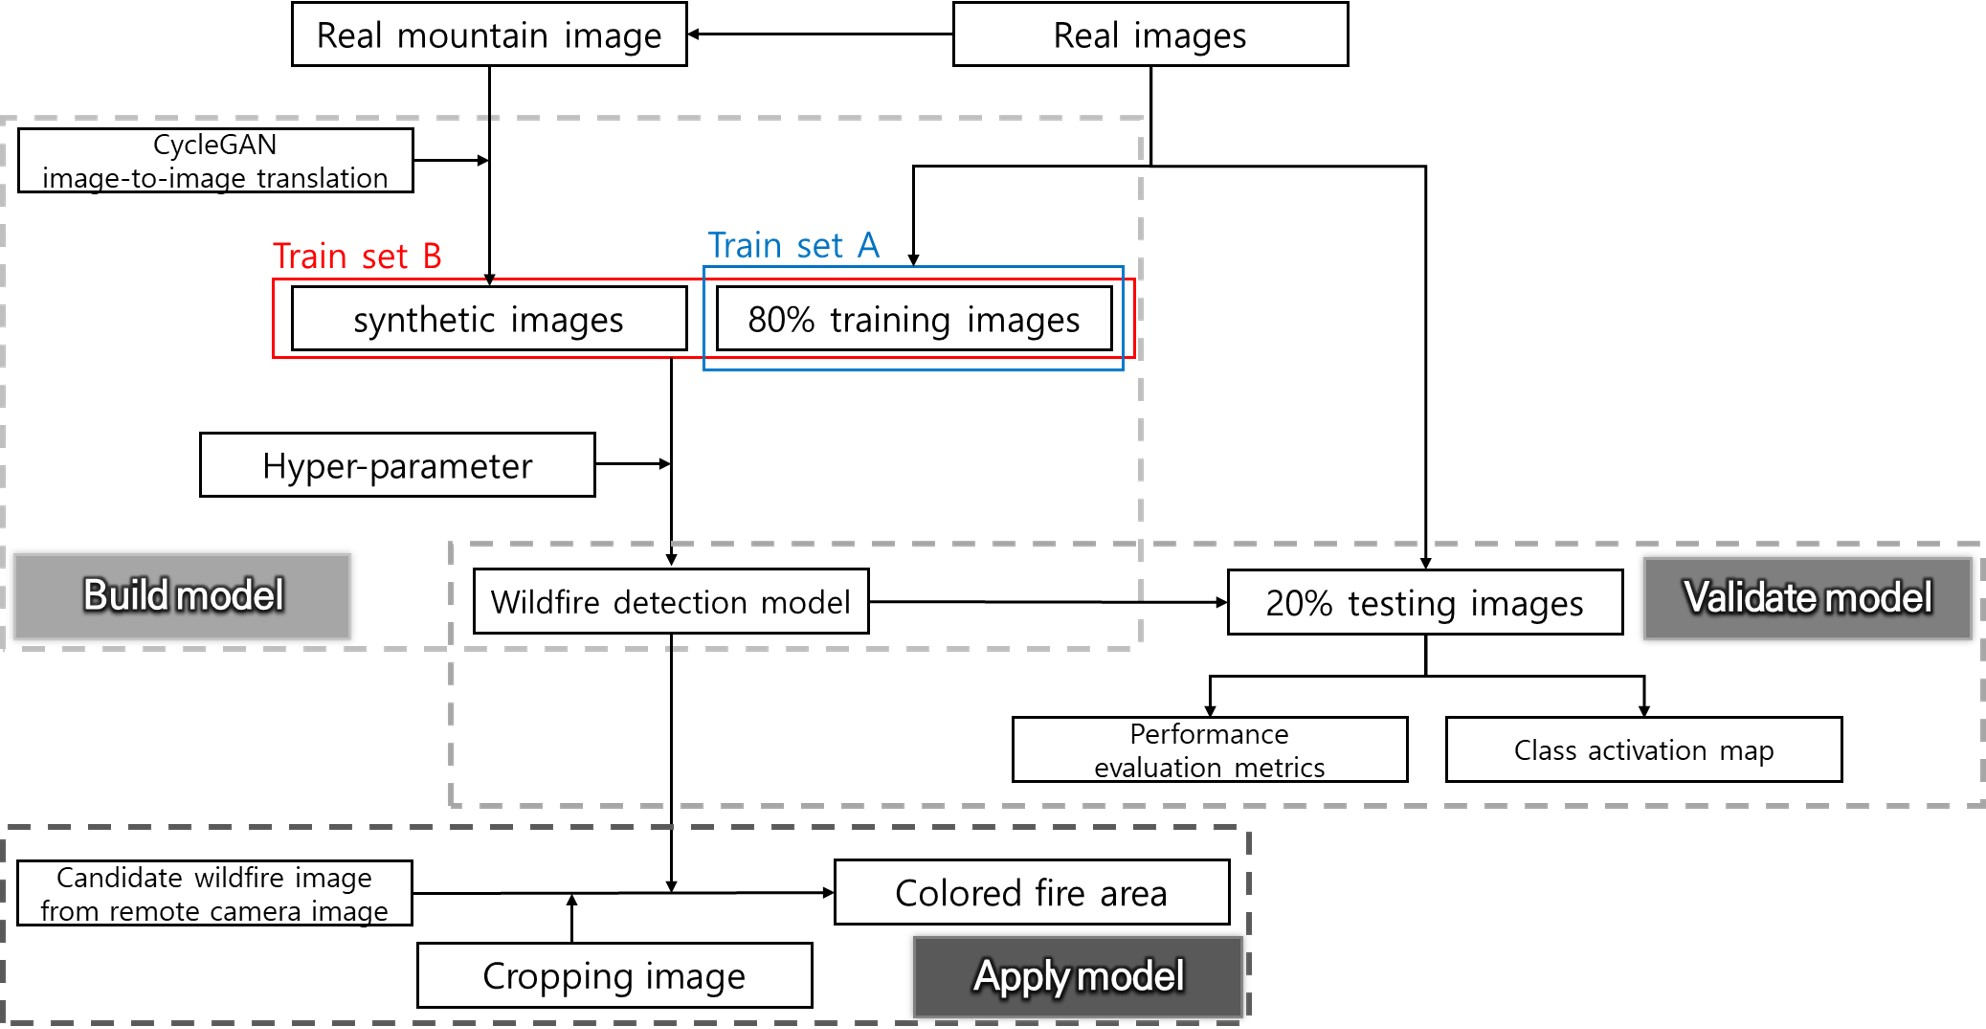
The wildfire and non-fire images that were used for training the GAN model and CNN classification models were collected. The mountain datasets were obtained from eight scene-categories databases [42] and a Korean tourist spot database [43]. However, there is no open data benchmark available for fire or smoke images of wildfires [28]. The collection was, thus, solely obtained using web crawling; this limitation resulted in a data imbalance. Considering that the early fire-detection model is intended for application in drones and surveillance cameras for the purpose of monitoring, both categories of datasets were crawled from images or videos obtained using a drone. The sample of the dataset is presented in Figure 1. A total of 4959 non-wildfire images and 1395 wildfire images were set up in our original dataset and resized to 224 × 224 for the network input.
2.2. CycleGAN Image-to-Image Translation
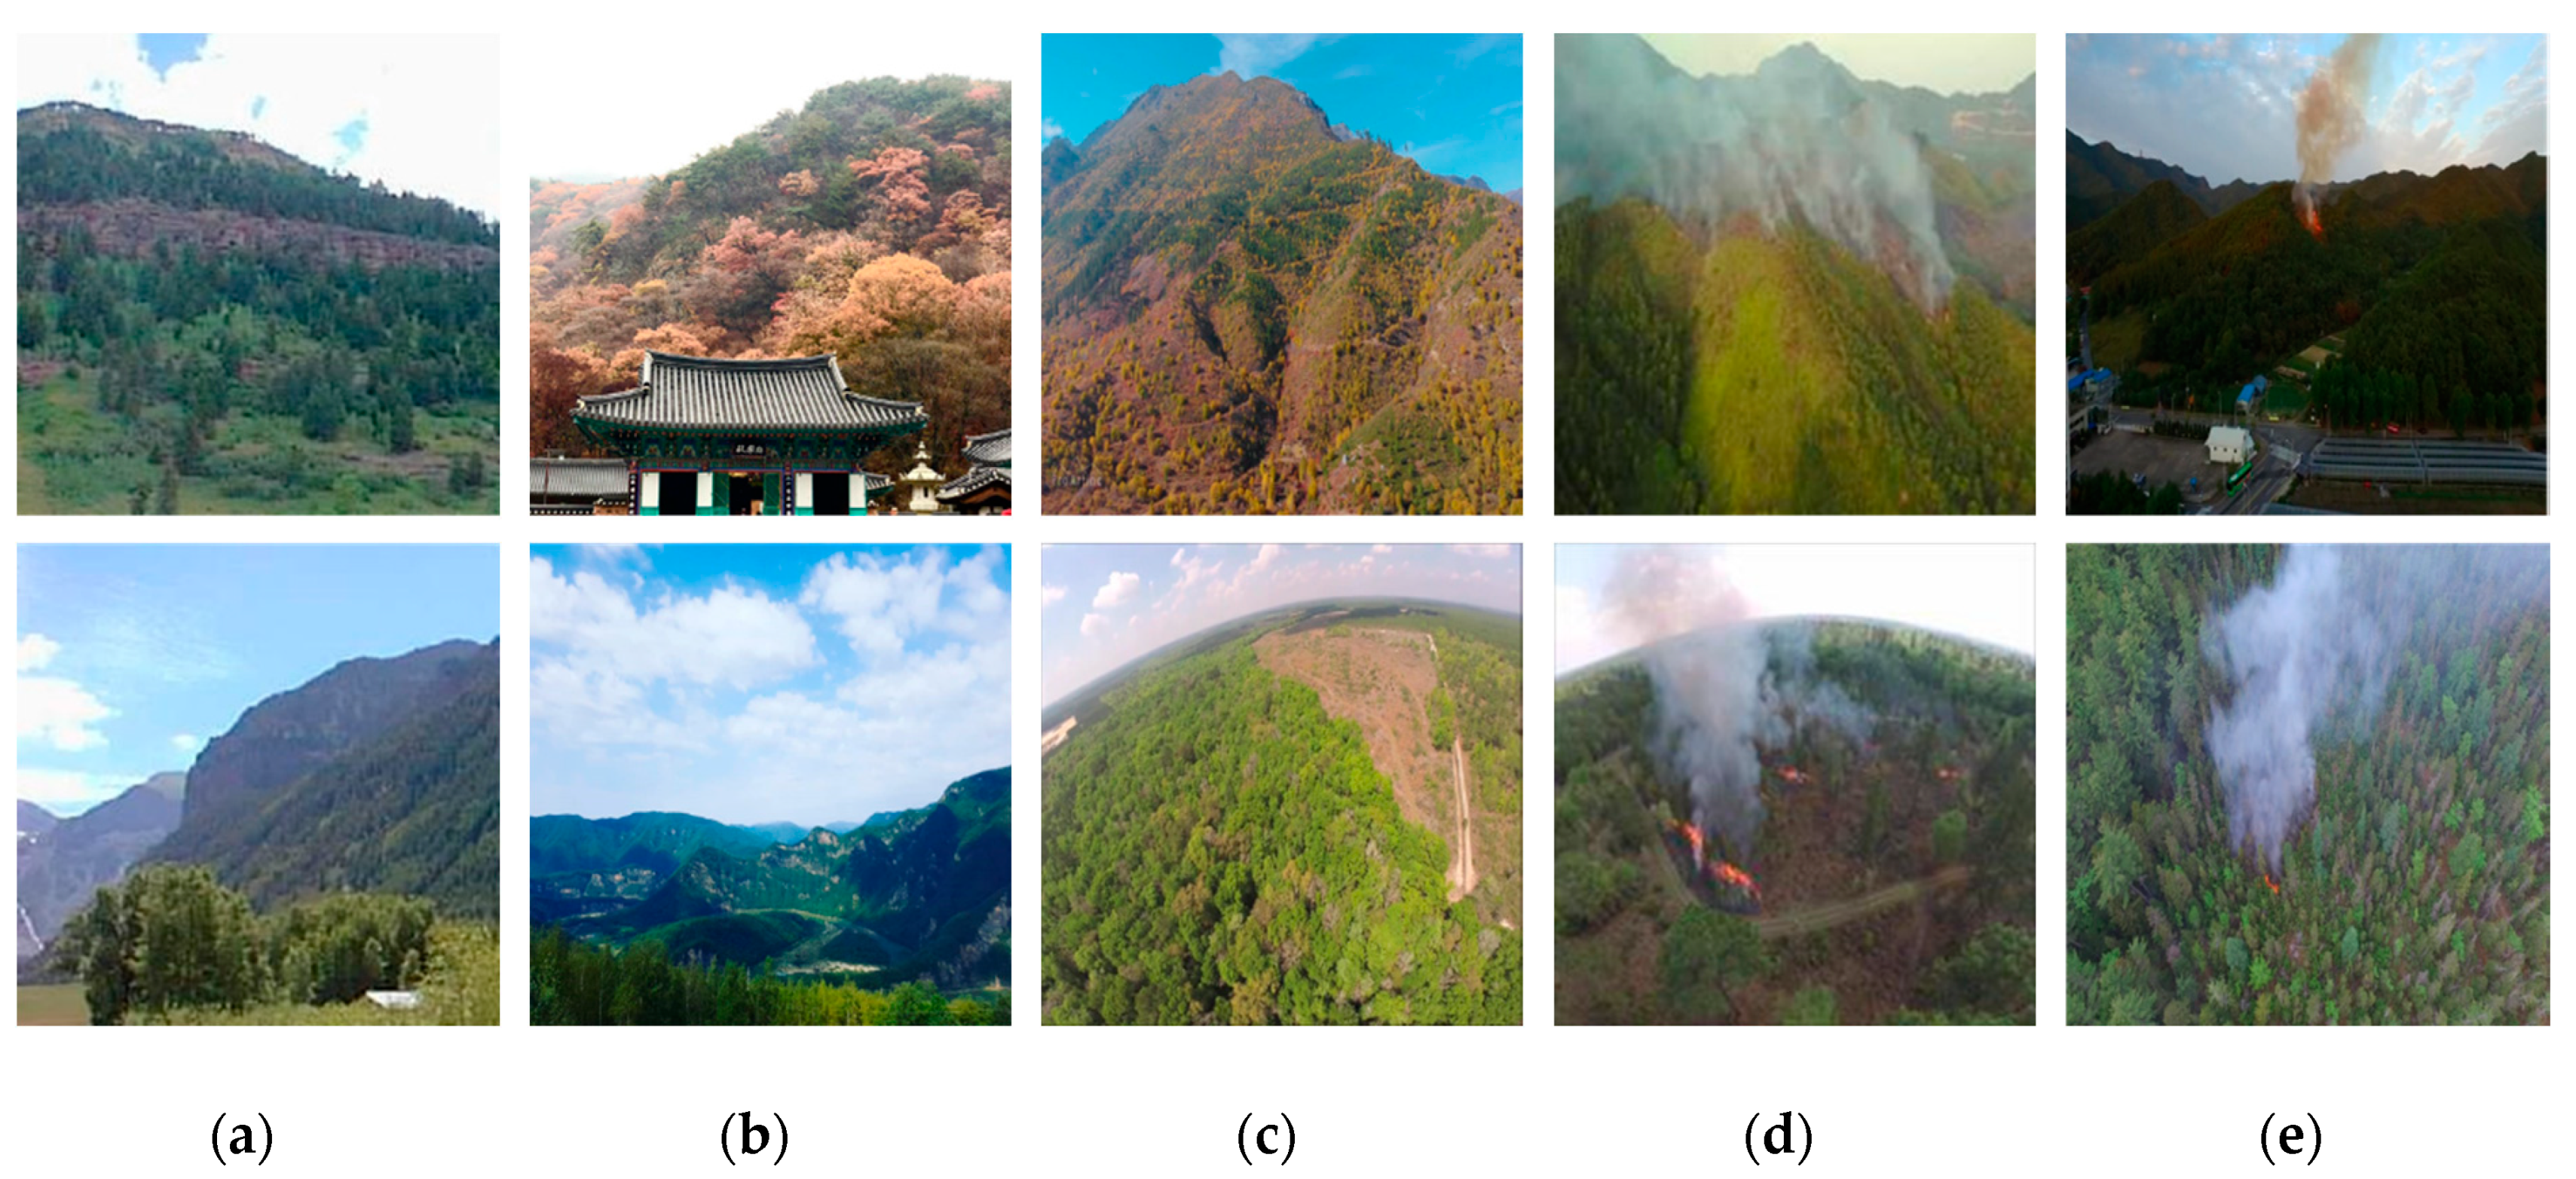
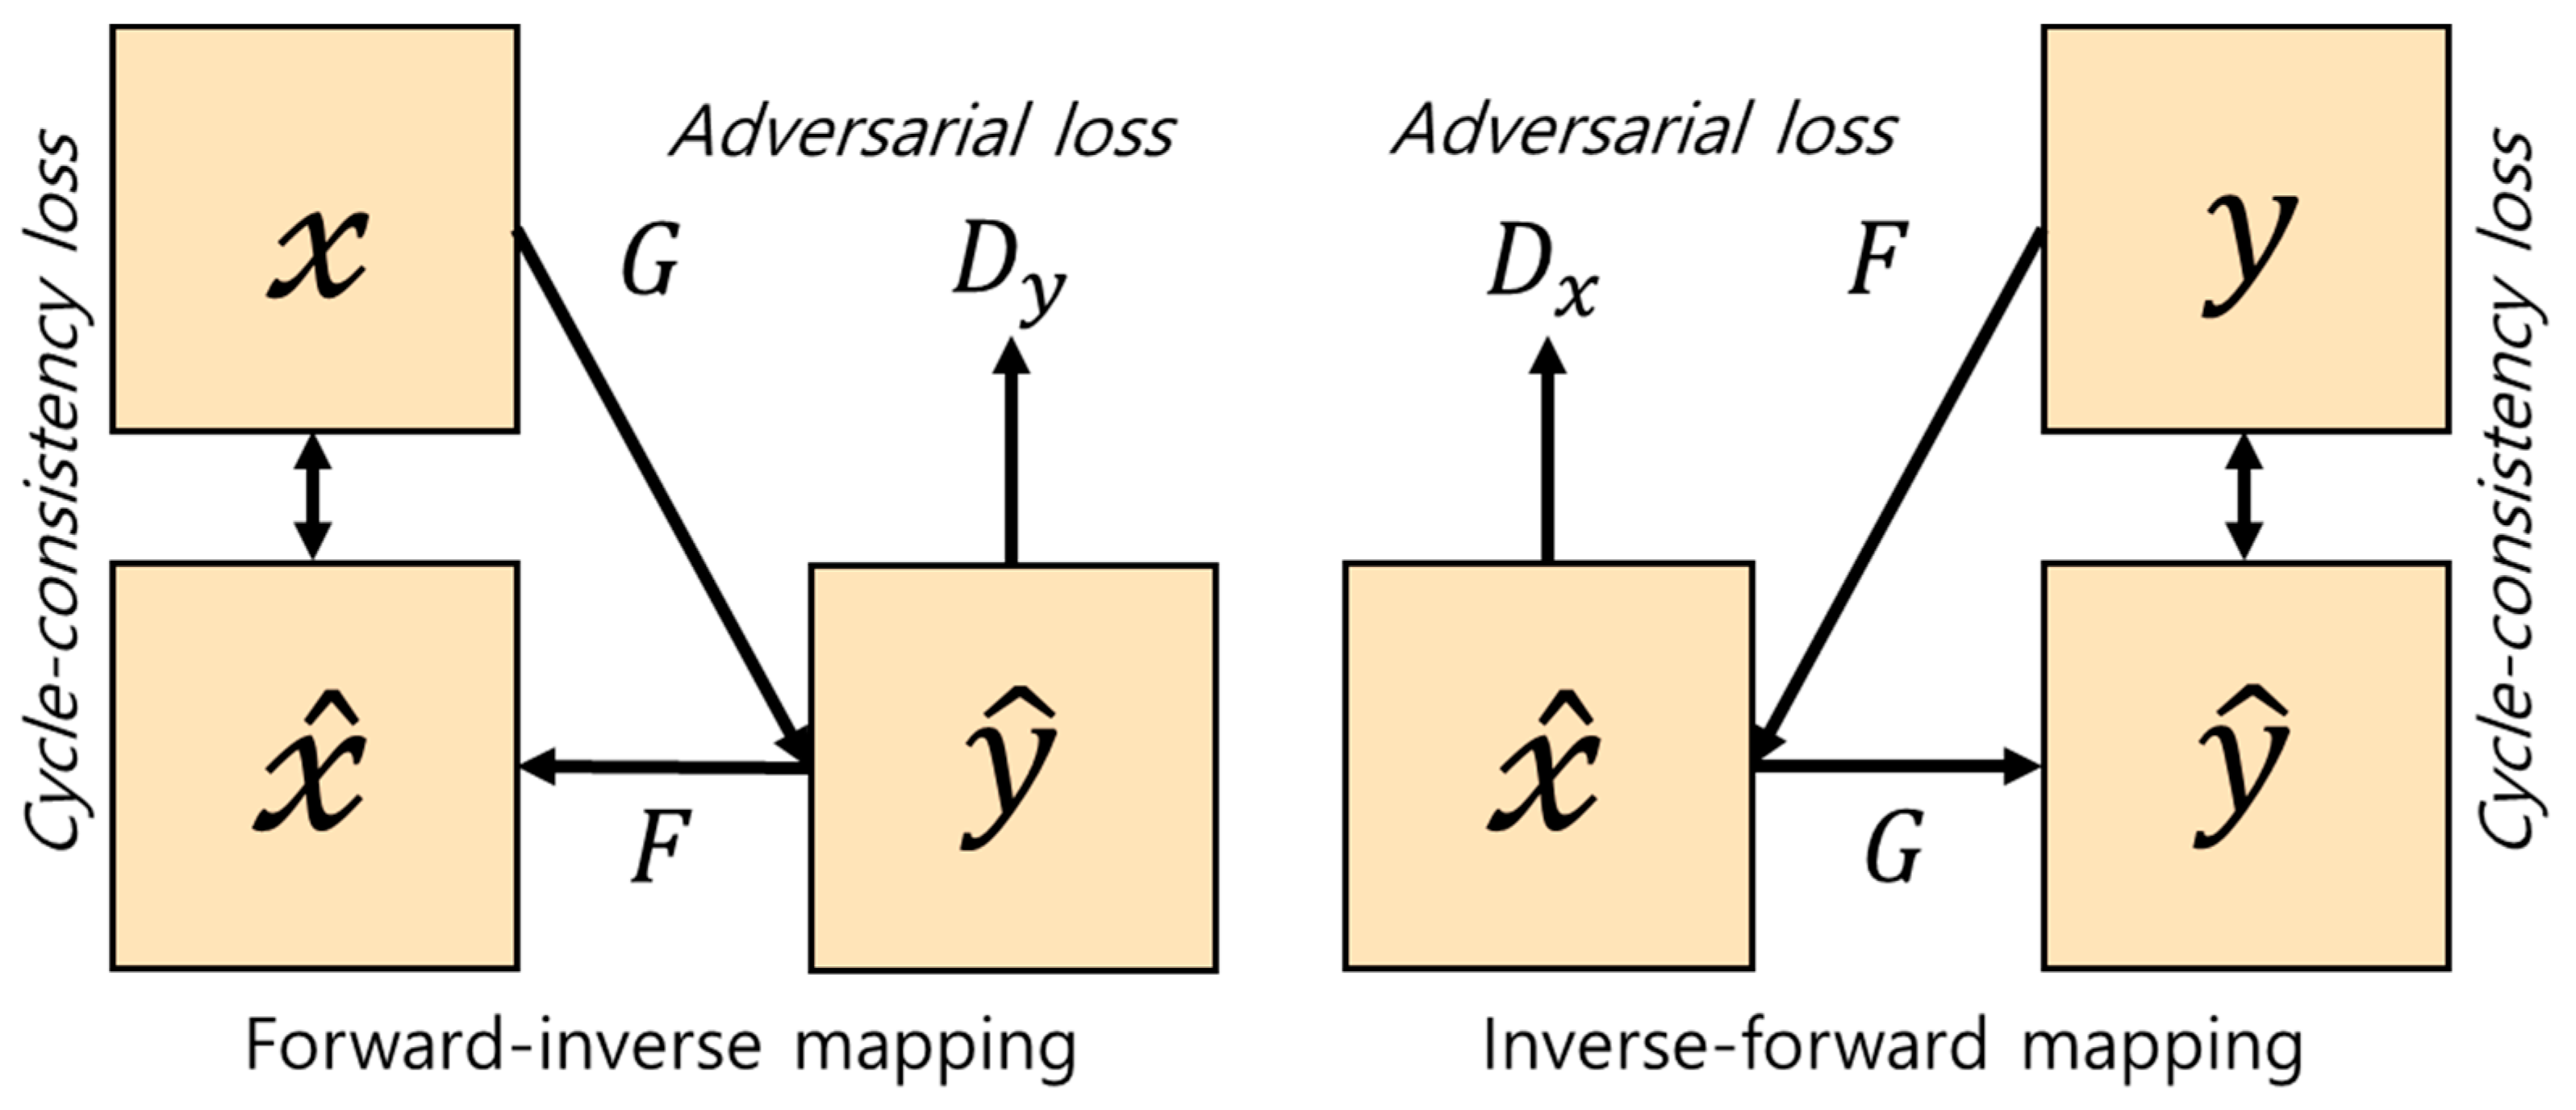
To generate wildfire images, CycleGAN [41] was used, which is a method used for image-to-image translation from the reference image domain (X) to the target image domain (Y), without relying on paired images. As illustrated in Figure 2, in the CycleGAN, two loss functions called the adversary loss [33] and cycle-consistency loss [41] were used.
Our objective was to train such that the discriminator cannot distinguish the image data distribution from and the image data distribution from domain Y. This objective can be written as follows:
However, in a general GAN, the model is not trained over the entire distribution of actual data; it is only trained for reducing the loss. Therefore, a mode collapsing problem occurs in which the optimization fails, as the generator cannot find the entire data distribution, and all input images are mapped to the same output image. To solve this problem, in the CycleGAN, inverse mapping and cycle-consistency loss ( were applied to Equations (1) and (2), respectively, and various outputs were thus produced. The equations of the cycle-consistency loss were as follows:
In addition, by converting the X domain into while adding an identity loss ( that regularized the generator, such that the calculated output was the same as the input, the converted image could be generated, while minimizing the damage to the original image.
The final loss combined with all losses was as follows. Using CycleGAN with this method, it was possible to create various wildfire images, while maintaining the shape and background color of the forest site.
2.3. DenseNet
The early wildfire-detection algorithm was constructed using the state-of-the-art net architecture, DenseNet, which is known to perform well in wildfire detection, while alleviating the vanishing gradient problem and reducing the training time [40]. It is a densely connected CNN structure that has a connection strategy. Figure 3 illustrates the original dense block architecture. The network comprises layers, each of which contain a non-linear transformation, and includes functions such as batch normalization, rectified linear unit (ReLU), and convolution. is a single image, and the network output of the layer after passing through a convolution is . The layer receives the feature maps of all preceding layers as its input (Equation (6)).
2.4. Performance Evaluation Metrics
To compare the performance of the models, five commonly used metrics were calculated—accuracy, precision, sensitivity, specificity, and F1-Score [44,45,46]. Accuracy is the ratio of accurately predicted observations to the total number of observations and is the most intuitive performance measurement. Precision is the ratio of correctly predicted positive observations to the total predicted positive observations. Sensitivity is the ratio of correctly predicted positive observations to the actual true observations. Specificity is the ratio of correctly predicted negative observations to the total number of predicted negative observations. The F1 score is the harmonic average of precision and sensitivity, which is generally useful for determining the performance of a model in terms of accuracy. The expressions for the evaluation metrics are presented as follows.
In the aforementioned equations, the number of true positives that the model predicts, i.e., the number of wildfire images predicted as wildfires and the number of true negatives that model the predicts, i.e., the number of non-fire images identified as non-fire, are denoted by true positive (TP) and true negative (TN), respectively. In addition, the number of false positives that the model predicts, i.e., the non-fire images predicted as wildfires, and the number of false negatives that model predicts, i.e., the wildfire images predicted as non-fire, are denoted as false positive (FP) and false negative (FN), respectively. These four types of data are defined using a confusion matrix in the binary classification. The overall performance-evaluation metrics were evaluated using the wildfire and non-wildfire testing sets.
3. Experimental Results
The following sections present the obtained results of the dataset balancing and wildfire detection models. The experiment environment was CentOS (Community enterprise operating system) Linux release 8.2.2004, which was constructed as an artificial intelligence server. The hardware configuration of the server consists of an Intel(R) Xeon(R) Gold 6240 central processing unit, 2.60 GHz, with an Nvidia Tesla V100 GPU, 32 GB memory. The experiences were conducted using the PyTorch deep learning framework [47] with Python language. The result and the example experiment code is available online at Github repository (https://github.com/pms5343/pms5343-WildfireDetection_by_DenseNet).
3.1. Dataset Augmentation Using GAN
To alleviate the data imbalance of the collected images, new wildfire images were generated using the CycleGAN as a data augmentation strategy. The objective of using the image-generation model is to convert non-wildfire images from a part of the collected data into wildfire images. A total of 1294 wildfire images (Domain A) and 2311 non-wildfire images (Domain B) from our original dataset were used.
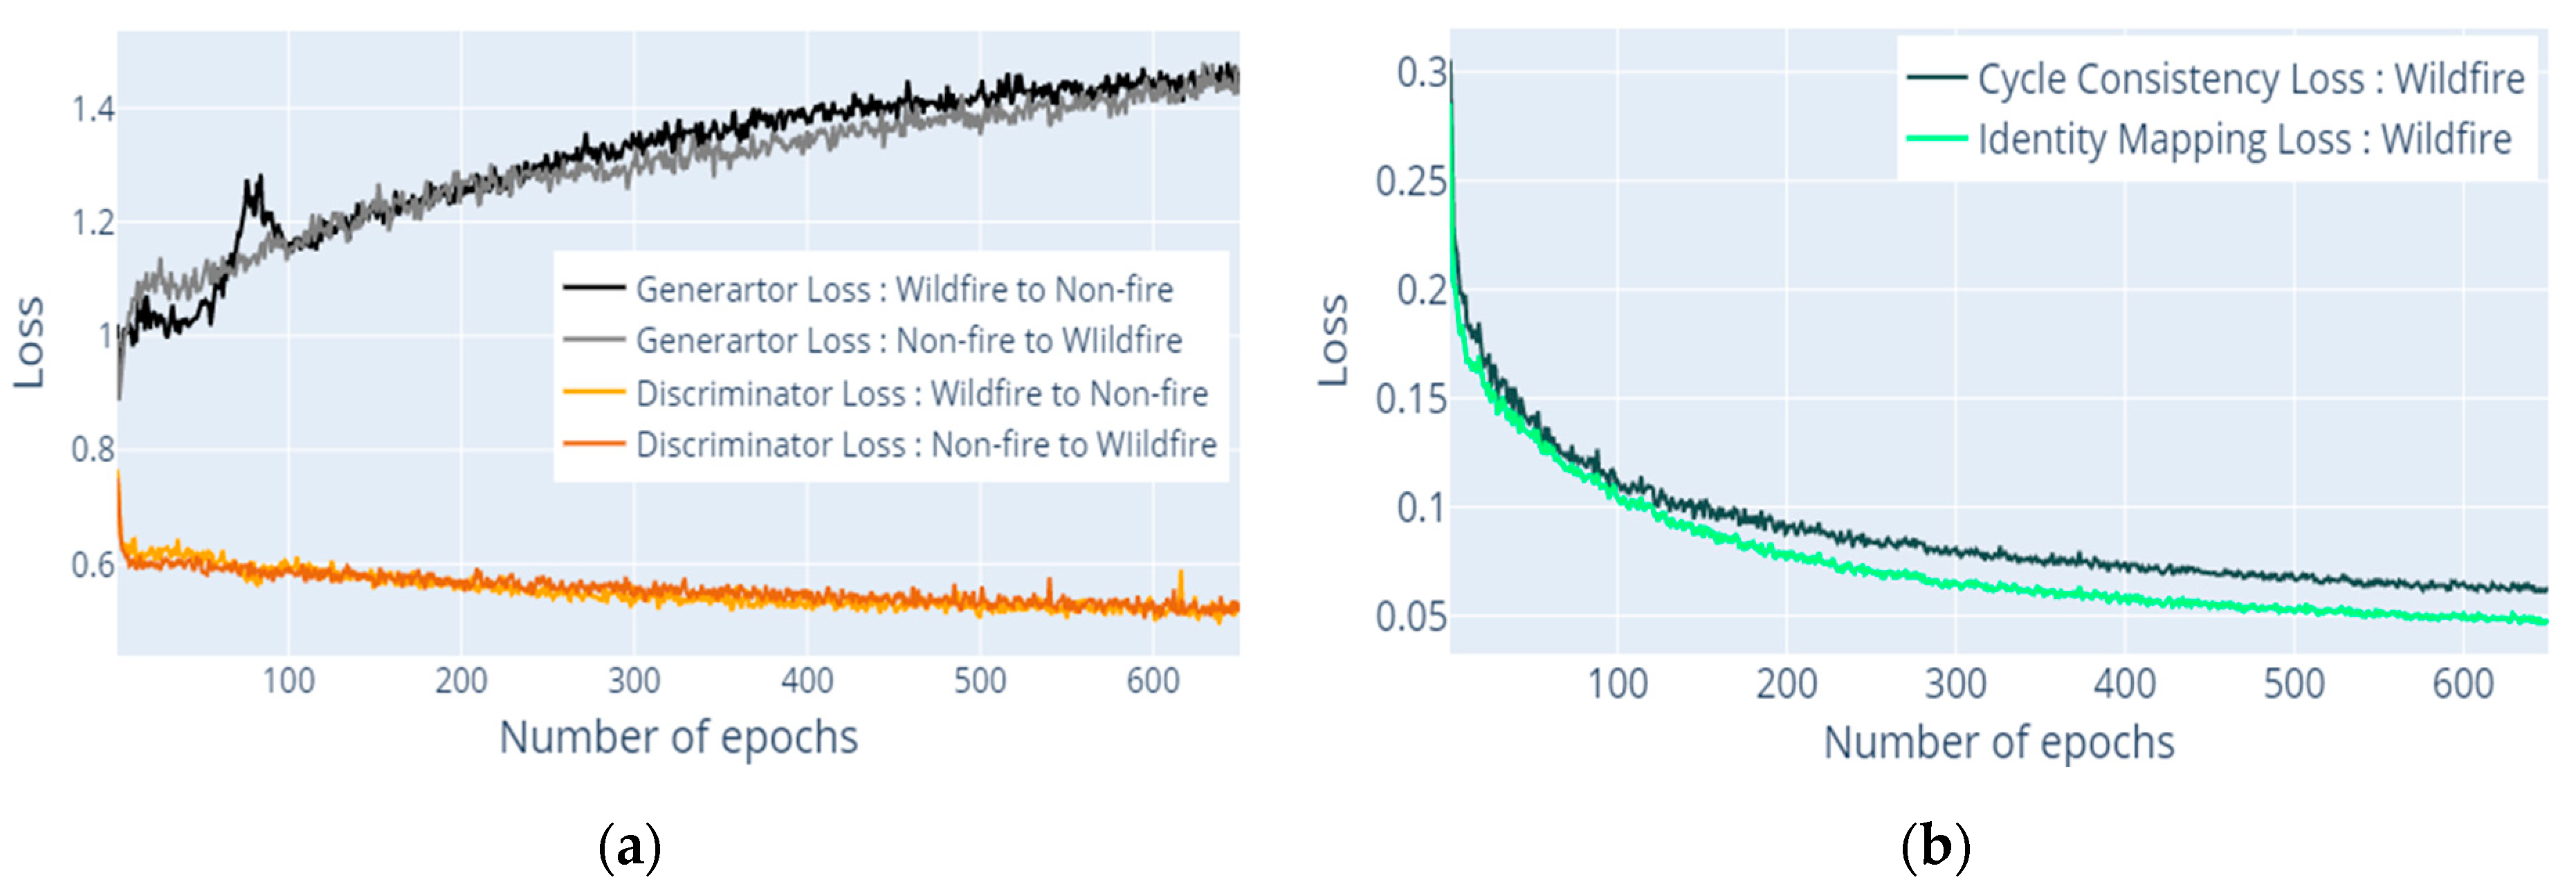
As can be observed from Figure 4, the training was performed by increasing the number of epochs until there was a slight change in each loss, in order to improve the model. The generator loss was learned in the direction of increasing loss as the number of epochs increased because the objective of the generators was to create a fake image such that the discriminator could not determine whether the generated image was real or fake. Conversely, the discriminator losses were trained to reduce the loss, in order to distinguish between the generated and original images. Figure 4b shows that the cycle consistency loss added for the purpose of increasing the diversity of the generated image and the identity mapping loss added for the purpose of minimizing changes in the background of the generated image were also trained in the direction of decreasing exposure. After 650 epochs, there was no significant change in loss, and the training was thus terminated.
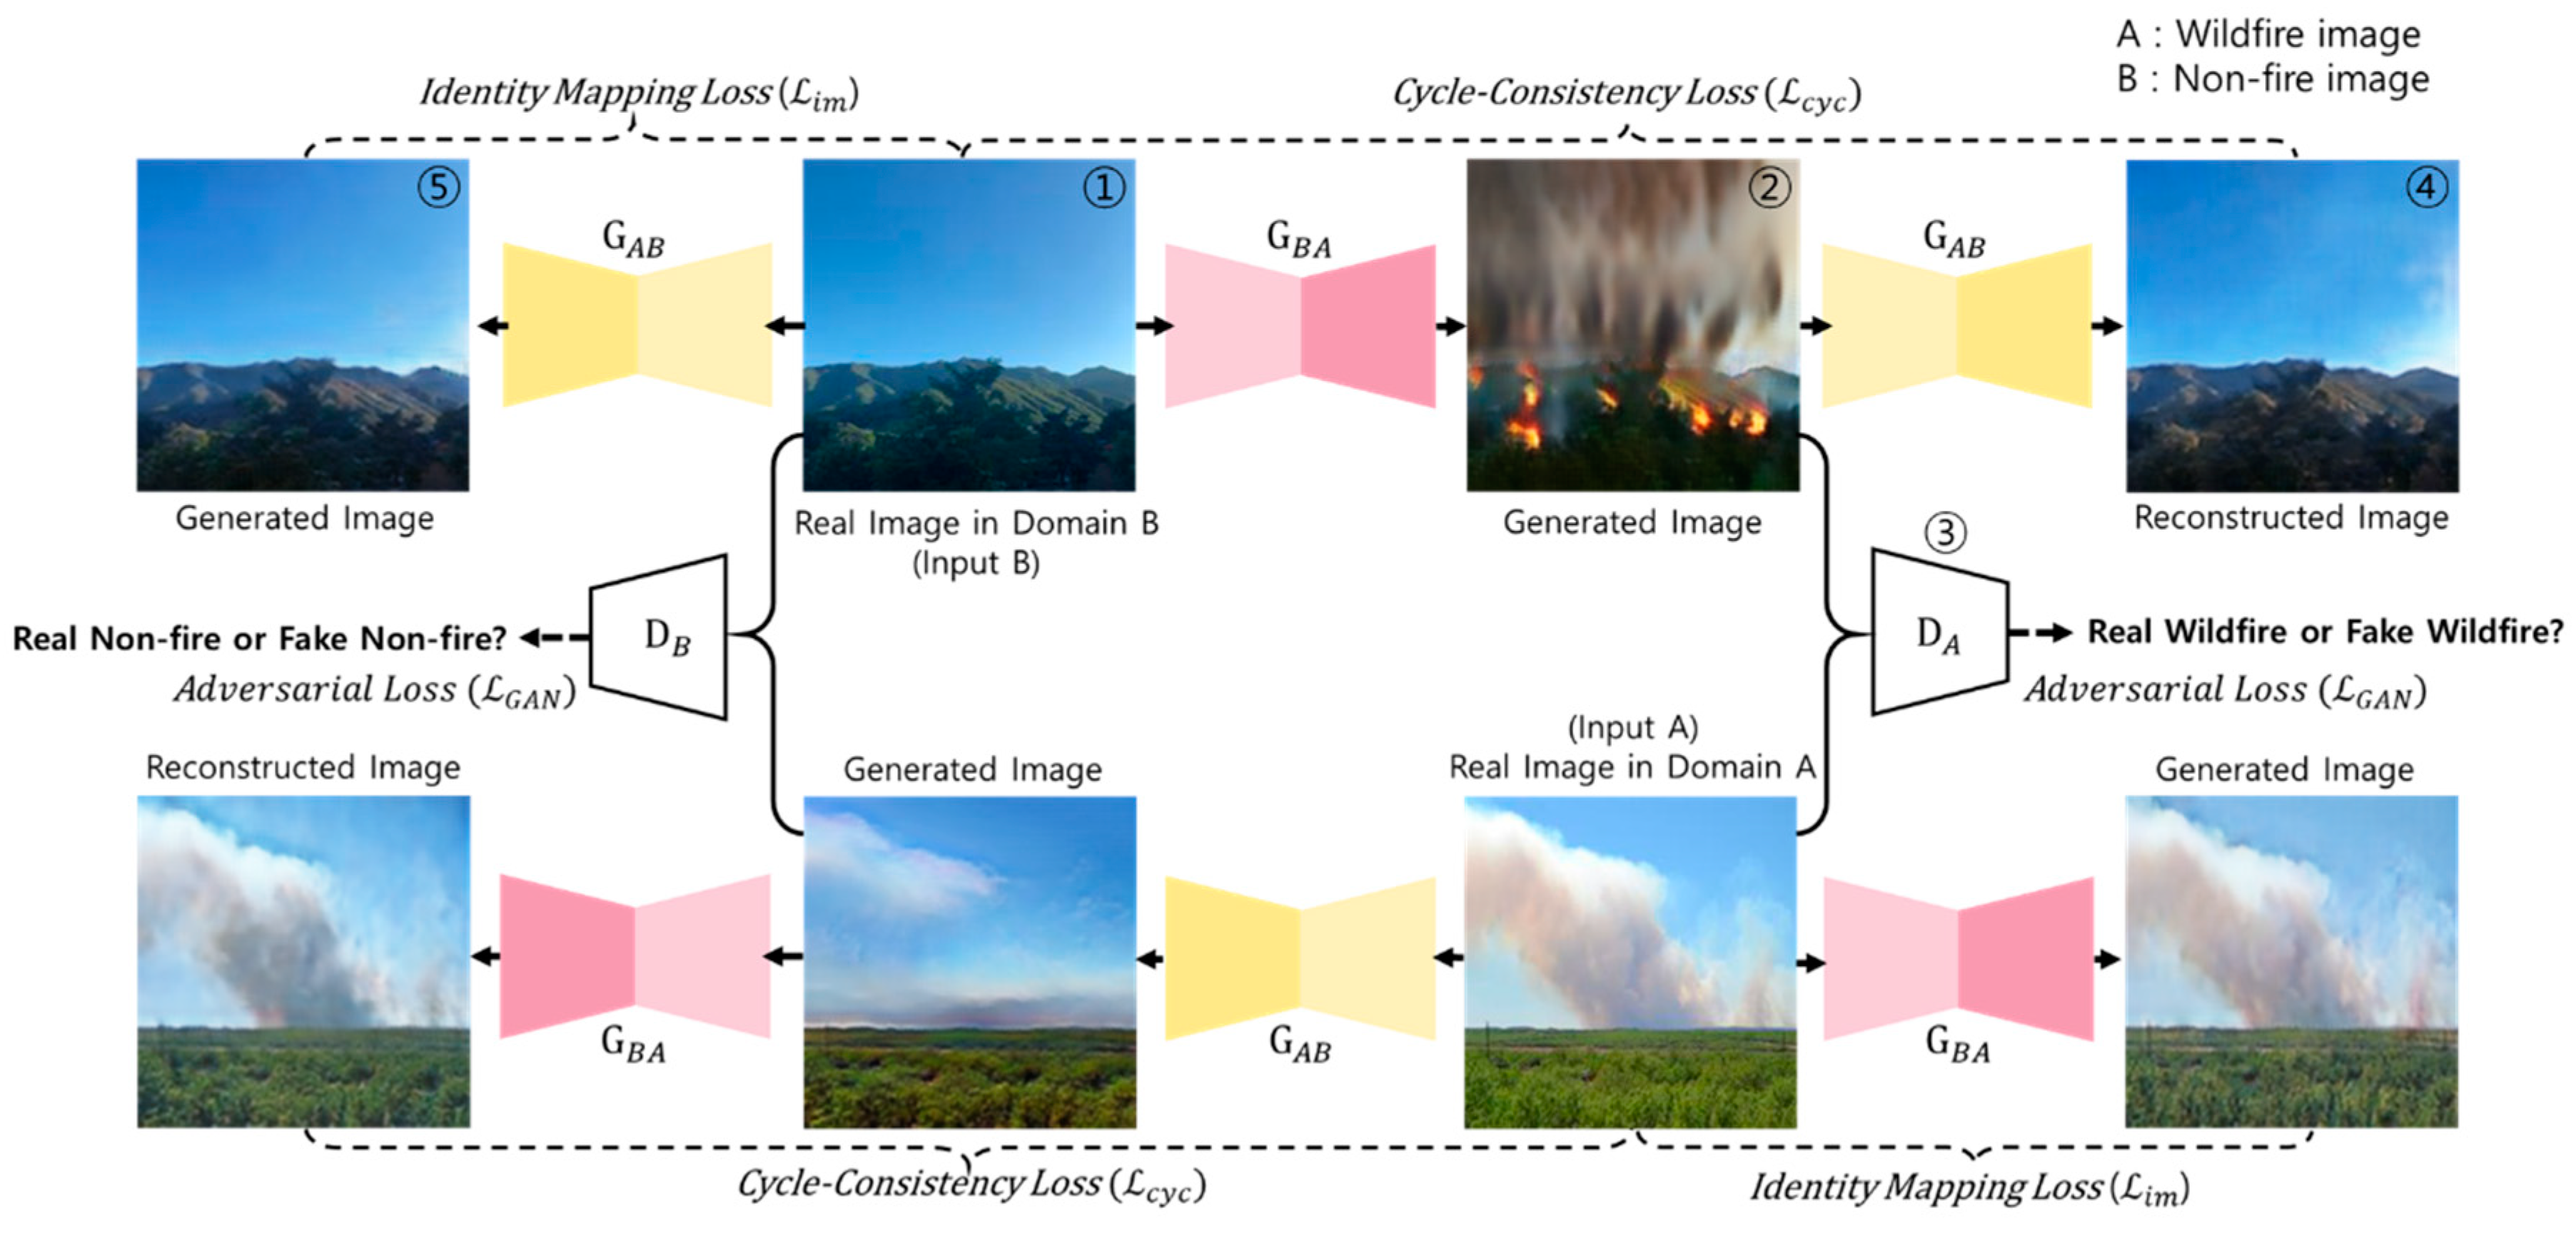
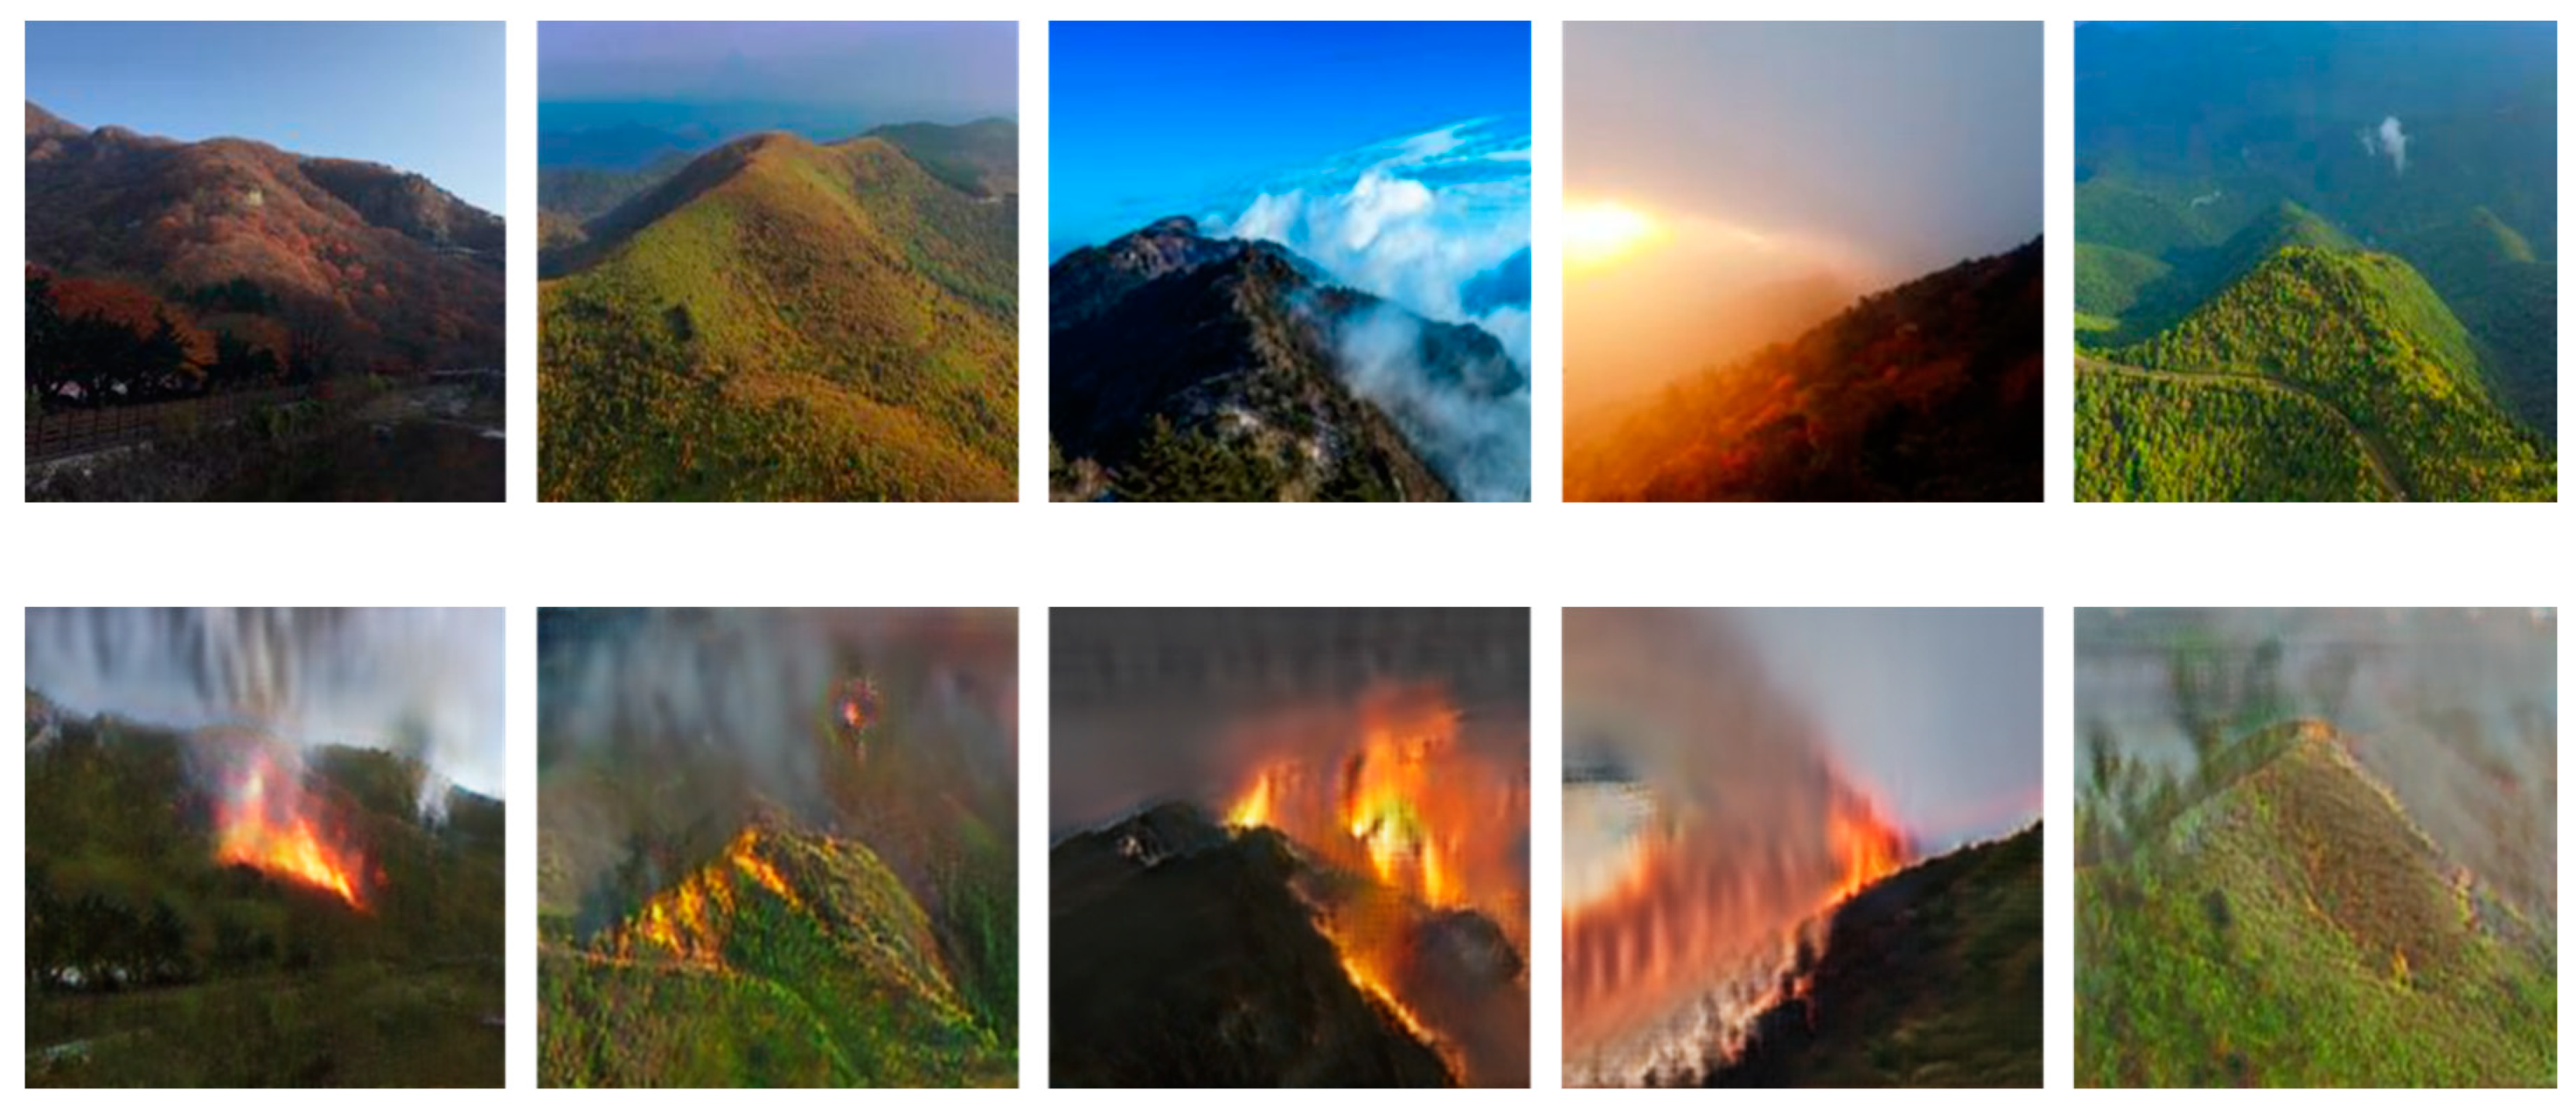
Figure 5 illustrates the overall process of the model and an example of when the images of domains A and B undergo the model-training process. The mountain image without a fire in domain B was converted into a wildfire image through the generator and then compared with the image of domain A (original wildfire image), by discriminator A () (➀→➁→➂ process in Figure 5). The converted image was the image reconstructed by generator , and the result was not significantly different from that of domain B (➀→➁→➃ process in Figure 5). In addition, it was confirmed that there was no difference in the image converted by generator from domain B (➀→➄ process in Figure 5). Conversely, the process was conducted in the same manner, and 1195 new 224 × 224-pixel fire images were created from domain B (Figure 6) and included in the wildfire dataset.
3.2. Wildfire Detection
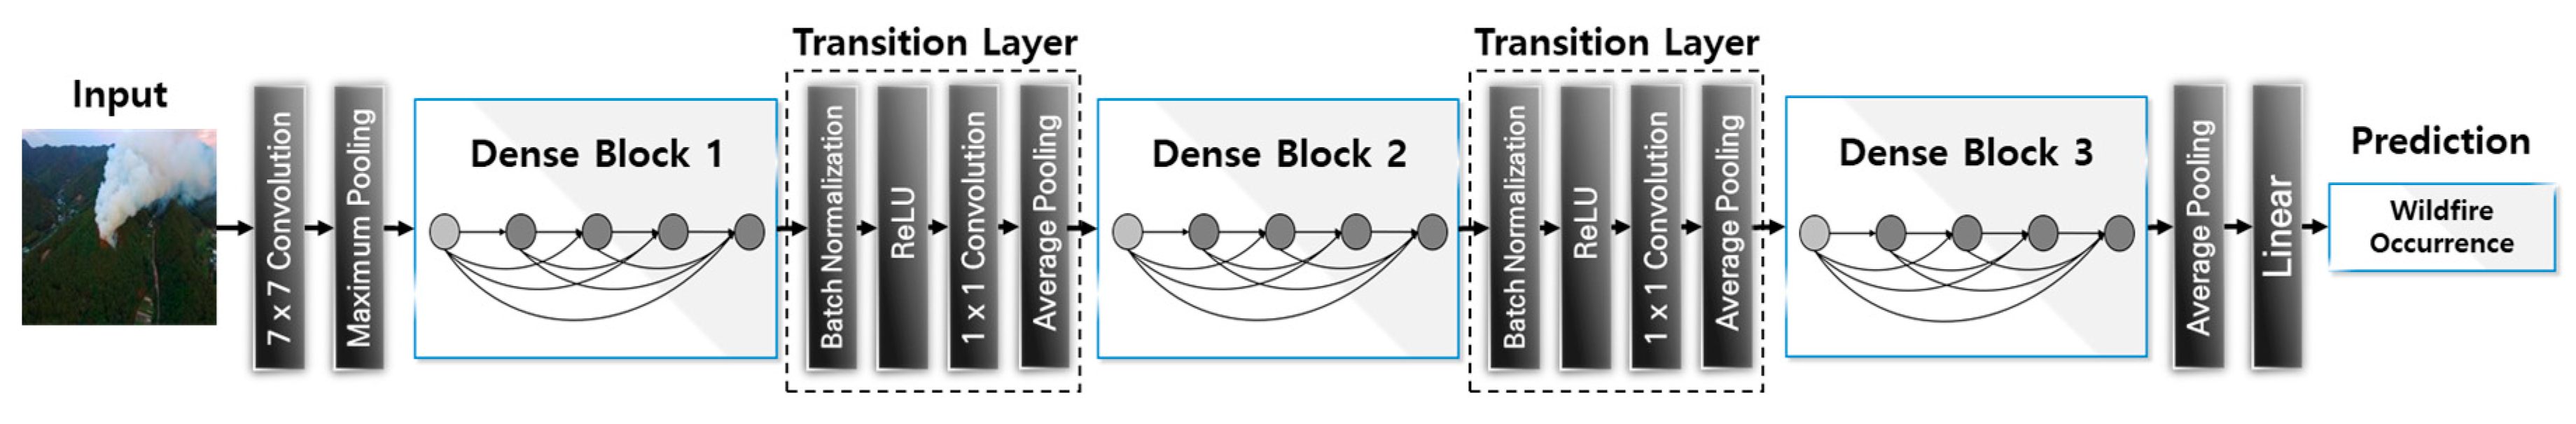
The wildfire detection was realized through the use of a DenseNet-based classification network model consisting of three dense blocks and two transition layers to identify the fire with 224 × 224-pixel-size image inputs. The architecture of the simple network is illustrated in Figure 7.
The dense block included a two-kernel filter. One filter was a 1 × 1 size convolution, which was used to decrease the number of input feature map channels, and the other was a 3 × 3 size convolution. After the dense block, the feature maps passed through a phase layer consisting of batch normalization, ReLU, 1 × 1 convergence, and 2 × 2 average pooling, which reduced the width and length of the feature map and the number of feature maps. Finally, after three dense block sessions, the result was drawn after the linear layer at the end, after passing through the global average pooling and softmax classifier sequentially, as in the case of a traditional CNN.
The following section presents the results of the wildfire-detection performance obtained using the deep learning classification model based on DenseNet, as compared to the pre-trained model. Two results were derived for each model—one for train set A and the other for train set B.
3.2.1. Dataset Partition
The train and test set partition are specified in the following section. From the collected original dataset, several images were used to generate new images. The forest image used as the GAN domain was deleted from the dataset for the classification model; however, the wildfire domain was not eliminated because it was used as a reference; it was thus not deleted from the dataset. A total of horizontal flip and random crop (by 200 pixel) were used to expand the number of samples of the training sets. The train sets were divided into trainset A, consisting only of photographs taken, and trainset B, consisting of wildfire images generated by the GAN. Many precedent research showed that accuracy becomes lower when the number of data points is imbalanced [48]. In order to avoid the disadvantages of already well-known data imbalances, Train set A kept the data ratio between the two classes similar, even if the total number of data is set less than B. The test set only contains the original photograph and not the generated image. Twenty percent of the total collected original image dataset was selected as the test dataset. Partition of the datasets are shown in Table 1.
3.2.2. Model Training and Comparison of the Models
To demonstrate the performance of the proposed method, two train sets were used in the proposed model and well-known pre-trained models, ResNet-16 and VGG-50, for the performance evaluation. To improve the models’ performance of each model, the learning rate and optimizer were tested. Ten values of the initial learning rate between 0.1 and 0.00001 were tested, while changing three representative optimizers—stochastic gradient descent (SGD), Adam [49], and PMSprop [50]. The number of epochs was fixed at 250, and batch size was fixed at 64. The best hyperparameter combination was found based on the average accuracy from the k-folds (k = 5) cross-validation process; presented in Table 2.
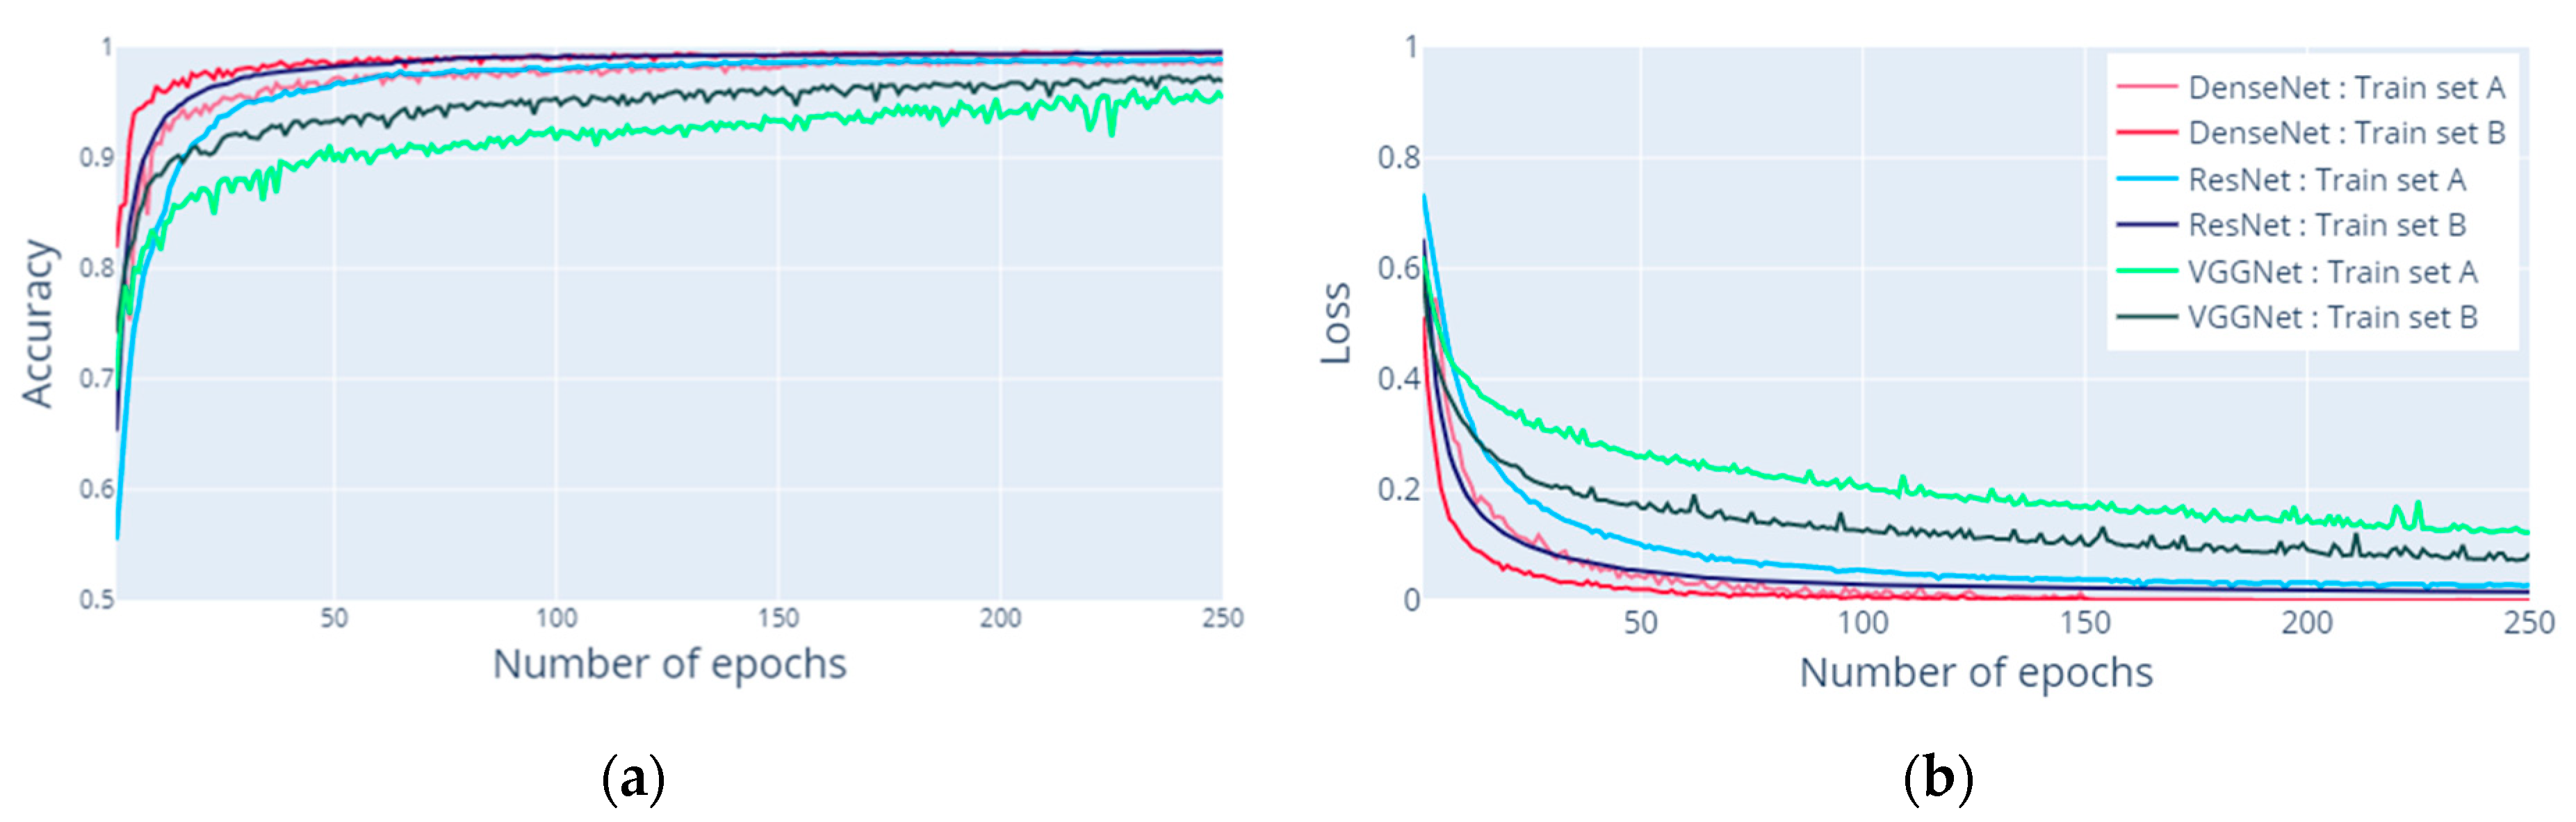
The training process of each model using the selected hyperparameter combination is illustrated in Figure 8. The training accuracy curve obtained as the number of epochs increased is presented in Figure 8a. The accuracy of the six models increased most significantly between epochs 1 and 10 and then increased steadily until epoch 250.
The DenseNet-based proposed model demonstrated the highest training accuracy, with an approximate accuracy of 99% in the final learning approach, followed by ResNet-50 and then VGG-16. In addition, it was demonstrated that the accuracy performance of trainset B, which included generated images, was greater than that of trainset A for all three models. The training loss curve obtained as the number of epochs increased is presented in Figure 8b. The DenseNet and ResNet-16 losses rapidly decreased until epoch 20, whereas the loss of VGG-16 continued to decrease steadily. The training loss also exhibited a better performance for trainset B than that for trainset A in the case of both the initial and final losses.
The classifier models were evaluated based on the performance results, using the five metrics presented in Table 3. DenseNet yielded the best results in terms of all five metrics. Although the VGG-50 model exhibited a slightly lower accuracy, sensitivity, and F1-score, the results obtained on using trainset B were at a similar level as (or better than) those obtained with trainset A. For example, in the case of DenseNet, the accuracy increased from 96.734% to 98.271%, the precision increased from 96.573% to 99.380%, sensitivity increased from 96.573% to 96.976, specificity increased from 96.881% to 99.450%, and the F1-score increased from 96.573 to 98.163. The experimental results showed that a new image created by changing a normal image of a mountain into an image of a mountain on which a fire had occurred could maintain the performance of the CNN and also improve the model performance via the input of various data as training.
3.2.3. Influence of Data Augmentation Methods
In this section, proposed model performance is compared with and without using CycleGAN-based data augmentation, to verify the influence of the proposed method. Horizontal flip, random zoom (200 pixel), rotation (original images were rotated by 10° and 350°), and random brightness (two values were selected arbitrarily from to ) methods were used in this section, as traditional data augmentation without GAN. The F1-score was obtained from a combination of training sets consisting of various augmentation methods.
Based on the experimental results, it could be seen that data augmentation from CycleGAN improved the accuracy of wildfire detection models. As can be seen from Table 4, the F1 score trained from data combination including the GAN method was higher by 1.154, 0.902, and 0.821, respectively, than the model trained from traditional method without GAN.
3.2.4. Visualization of the Contributed Features
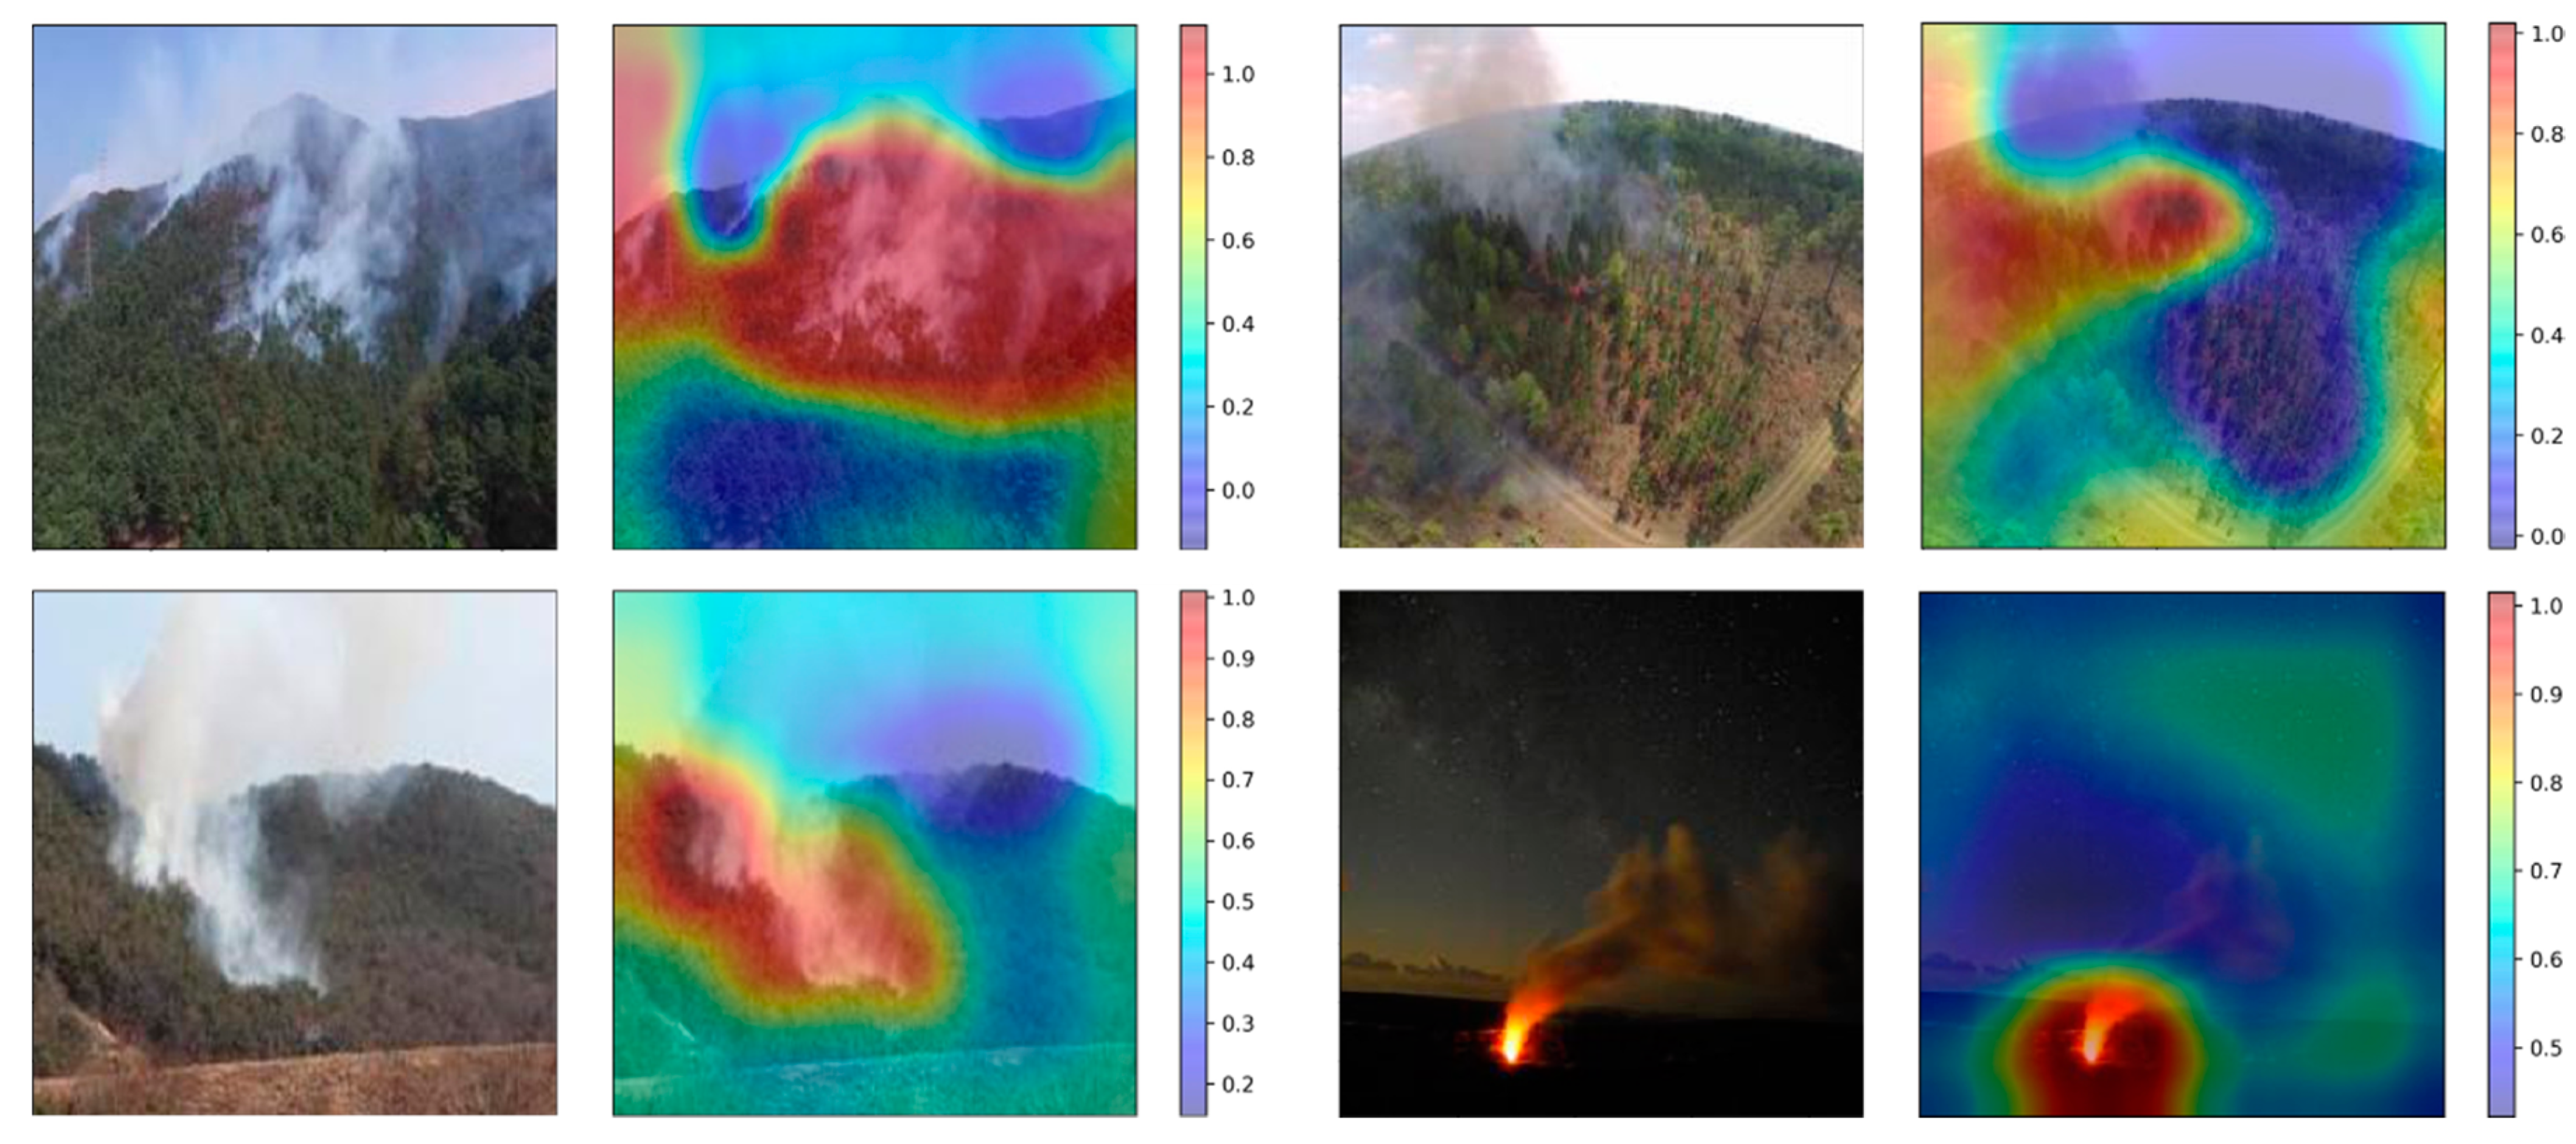
In order to visualize the output result of the model that exhibits the best performance, a class activation map (CAM) [51] was used to determine the features of the image that were extracted to detect the wildfire. As can be observed from the example of the CAM results in Figure 9, the detection was made primarily based on the presence of smoke or flames in the image, and the elements used for the classification as wildfires were found even in the early stages of the fire, with no flame and little smoke.
The smoke in the part of the image that comprises the forest could be detected well, but the smoke in the part that comprises sky was not judged as a factor. It is hypothesized that this occurred because the model confused smoke with clouds or fog, and the smoke near the sky background could thus not be treated as a powerful factor for classifying the features.
3.3. Model Application
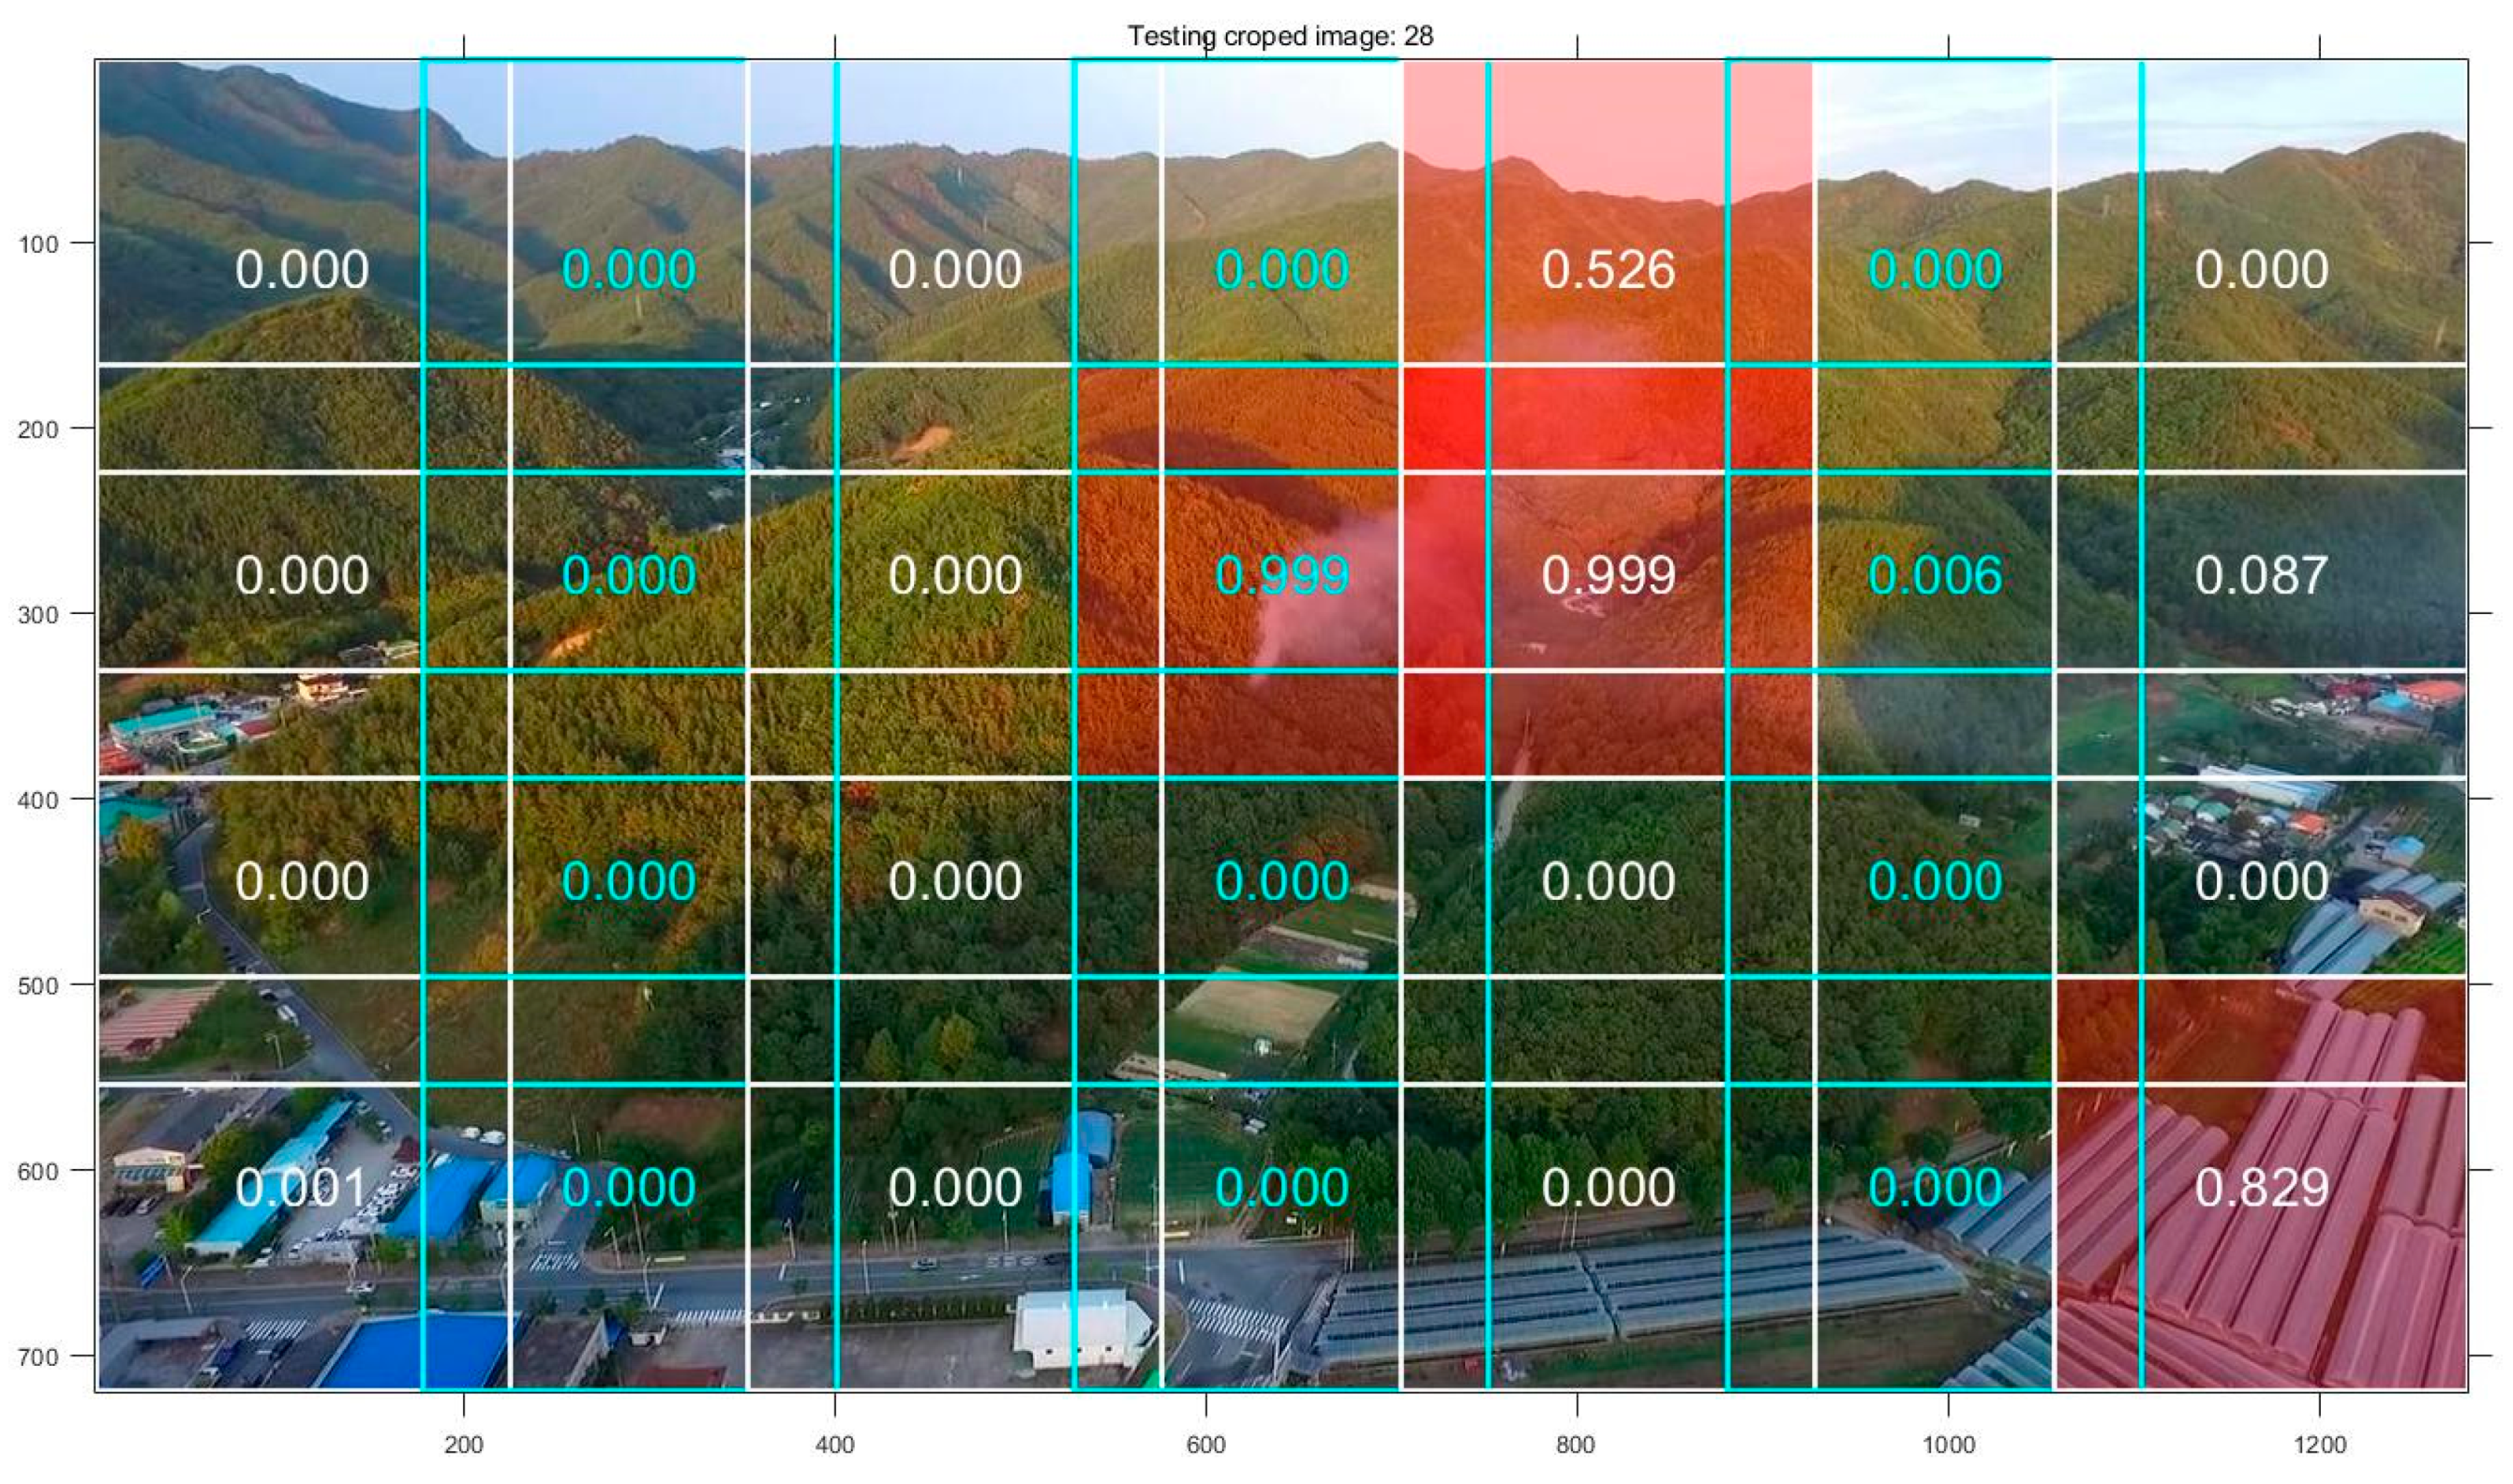
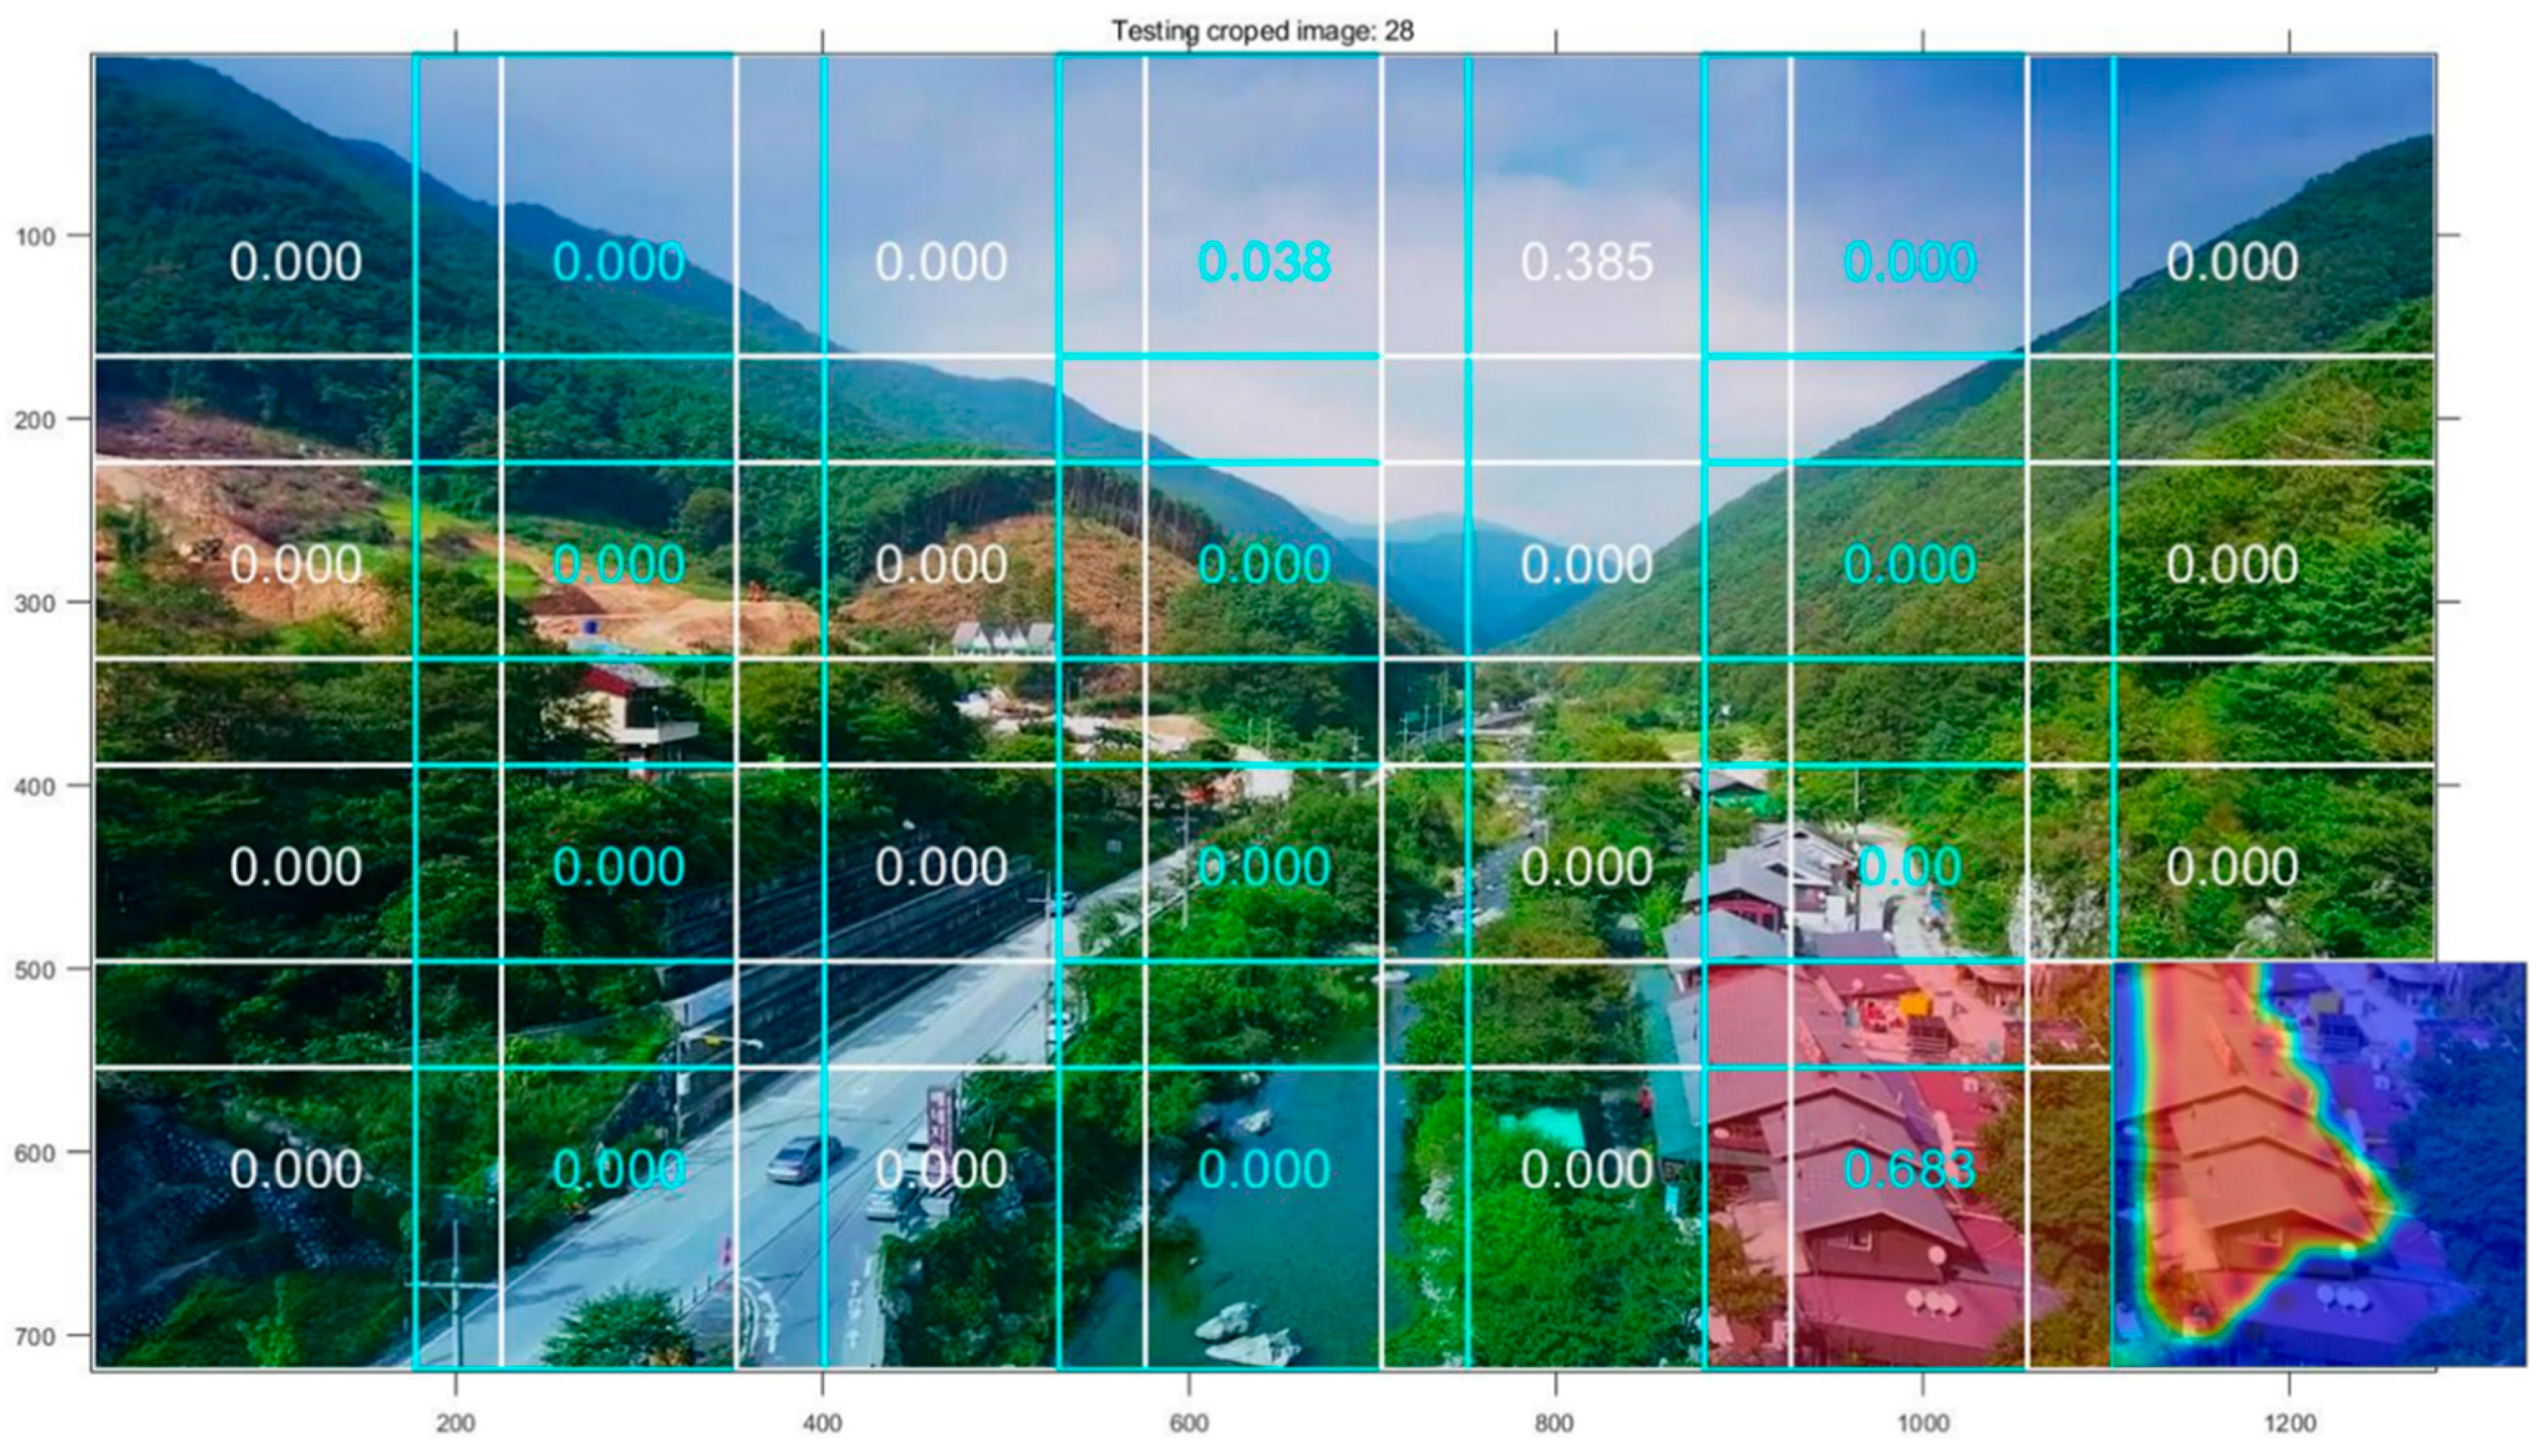
To apply the learned model to on-site drones or surveillance cameras used to monitor forests, a method of application for higher-resolution images than the model input-image size (224 × 224) is required. There is also a method used for resizing a remote camera image to a lower resolution; however, the method proposed in this study comprises cropping high-resolution images at regular intervals—considering that surveillance cameras are generally used to observe large areas—to derive the result values for each image.
Figure 10, Figure 11 and Figure 12 present an example of a model application based on a drone-tested forest video [52]. This is a 1280 × 720-size drone video of a wildfire that occurred in Daejeon, Korea, in 2015. The white and jade green boxes denote the cropped areas of size 224 × 224 and are indicated in alternate colors for visualization convenience. The cropped images were cut to overlap each other at a certain interval, and 28 images per video frame were cut and input to the classification model. The text in the square box indicates the value derived from the softmax layer of the model, which was the final layer of the model (as it was trained using two classes; if the softmax value of the model was greater than 0.5, it was determined that the range comprised a fire, otherwise, it was determined that the range did not comprise a fire.)
Figure 10 presents the result of the application of the model to the image captured approximately 1 min after the wildfire occurred. The photos include not only the forest, but also parts of the nearby villages. The model detected the smoke generated in the forest and determined the location at which the fire had occurred. However, a greenhouse at the bottom right of the photo was falsely detected as a wildfire (0.829). It was suggested that this was a problem caused by the error of not properly taking into consideration specific images like cities, roads, and farmland, when training the initial model. This phenomenon was also found when applied to other sites.
As can be seen from the class activation map in Figure 11, the model mistook the building feature. Although it could not be judged that this was falsely detected by all artifacts, it was confirmed that false positives might occur when more than half of the cropped images were not natural objects. Conversely, there were no false positives caused by natural objects, such as confusion of distinguishing between clouds and smoke.
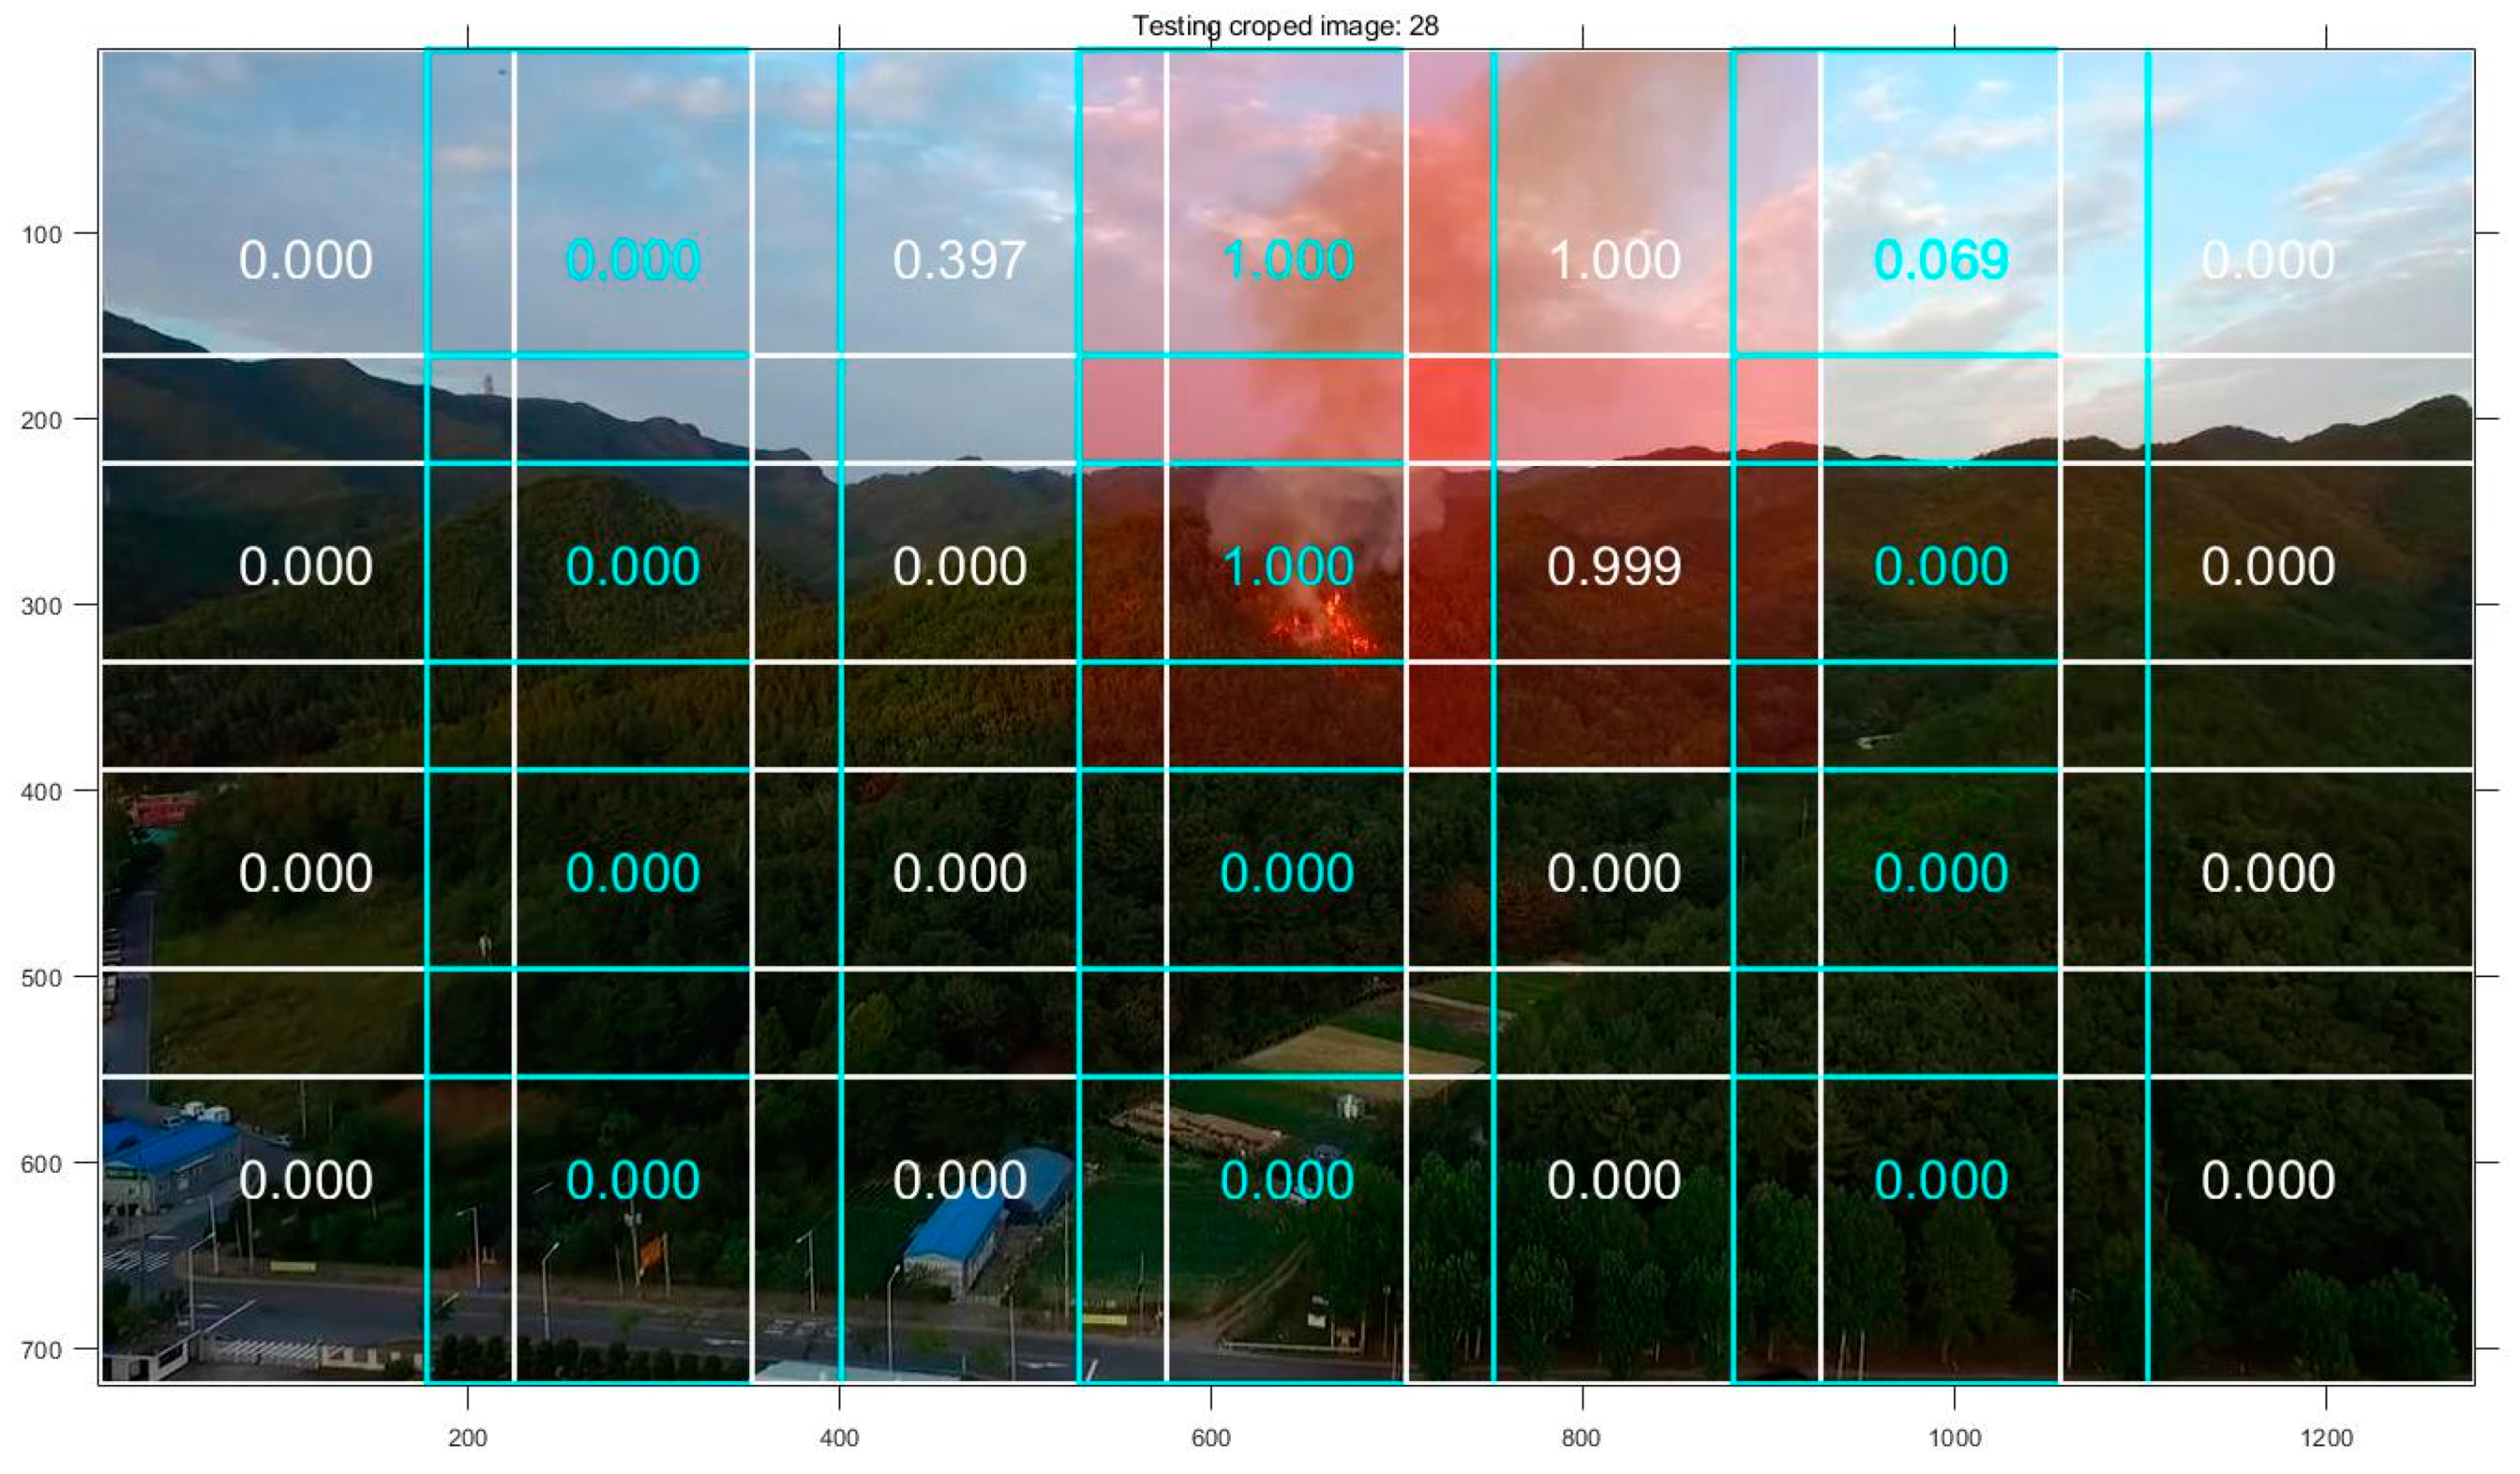
Figure 12 presents the result of the application of the model, approximately 10 min after the wildfire progression. As the fire was accompanied by flames after the fire had grown to some extent, the softmax layer provided a prediction with 100% probability, and the fire could be detected more easily than at the beginning of the fire. After applying the method of cropping without resizing the image, damaging the original image becomes unnecessary. As each cropped image is discriminated individually, the location of the fire can be tracked, while continuously obtaining real-time video footage, using a surveillance camera.
4. Conclusions
With the development of remote camera sensing technology, many researchers attempted to improve existing wildfire-detection systems using CNN-based deep learning. In the damage-detection field, it is difficult to obtain a sufficient amount of the necessary data for training models; data imbalance or overfitting problems have thus caused the deterioration of the models’ performance. To solve these problems, traditional image transformation methods such as image rotation were primarily used. A method of increasing the learning data was also adopted, wherein the flame image was artificially cut and pasted over a forest background. However, these two methods have their respective weaknesses—failure to increase the diversity of images and the necessity of manual labor, while providing unnatural images. The results of this study addressed this issue.
Our study had several advantages. First, a data augmentation method based on the same rules as those of artificial intelligence was used. It could also generate data while requiring minimal manpower. Using adversary, cycle-consistency, and identity losses, the optimized model could be used to produce various flame scenarios. The model could also be pre-trained for various wildfire scenarios in new environments, prior to the management of the forest; higher detection accuracy could, thus, be expected. Second, we improved the detection accuracy by applying a dense block based on DenseNet in the model. The training history and test results showed that the proposed methods facilitated good model performance. Third, it was proposed that the model could be applied to high-resolution images to overcome the limitations that depend primarily on the use of small-sized images, as inputs to the model. This allows us to identify the approximate location of the wildfire from a wide range of photographs.
There were also several limitations to our study. The model training was conducted using a limited forest class. Although during the experiment conducted with drone images the model identified the cloud and wildfire areas well (the upper part of the cropped photos in Figure 11), the smoke in the part of the image comprising the sky was not captured as a feature when the test data was obtained using CAM. This could be adjusted by increasing the class range or by learning additional models using images that are likely to confuse the model. Another potential problem was that the model performance for detection of wildfires in the nighttime was not considered. This temporal variable was excluded from the study because the purpose of this study was to check the efficiency of the data augmentation from artificial intelligence method and the efficiency of dense block in wildfire detection models. However, these details should be considered in further studies because of the different characteristics in the nighttime detection and in the day-time detection.
By improving upon the achievements and limitations of this study, in a future study, we intend to implement a forest-fire detection model in the field, by installing real-time surveillance cameras in Gangwon-do, Korea, which is exposed to the risk of wildfires every year.
In addition, by developing a technology that calculates the location of fires using image processing to measure fire area distance from camera and displays it on a map user interface, we intend to provide disaster-response support information for decision makers to realize a quick response in the event of the occurrence of a wildfire.
Author Contributions
Idea development and original draft writing, M.P.; draft review and editing, D.Q.T.; project administration, D.J.; supervision and funding acquisition, S.P. All authors have read and agreed to the published version of the manuscript.
Funding
This research was supported by a grant [2019-MOIS31-011] from the Fundamental Technology Development Program for Extreme Disaster Response funded by the Ministry of Interior and Safety, Korea.
Conflicts of Interest
The authors declare no conflict of interest.
References
- Meng, Y.; Deng, Y.; Shi, P. Mapping forest wildfire risk of the world. In World Atlas of Natural Disaster Risk; Springer: Berlin/Heidelberg, Germany, 2015; pp. 261–275. [Google Scholar]
- Jolly, W.M.; Cochrane, M.A.; Freeborn, P.H.; Holden, Z.A.; Brown, T.J.; Williamson, G.J.; Bowman, D.M. Climate-induced variations in global wildfire danger from 1979 to 2013. Nat. Commun. 2015, 6, 7537. [Google Scholar] [CrossRef]
- Williams, A.P.; Allen, C.D.; Macalady, A.K.; Griffin, D.; Woodhouse, C.A.; Meko, D.M.; Swetnam, T.W.; Rauscher, S.A.; Seager, R.; Grissino-Mayer, H.D. Temperature as a potent driver of regional forest drought stress and tree mortality. Nat. Clim. Chang. 2012, 2, 1–6. [Google Scholar] [CrossRef]
- Solomon, S.; Matthews, D.; Raphael, M.; Steffen, K. Climate Stabilization Targets: Emissions, Concentrations, and Impacts over Decades to Millennia; National Academies Press: Washington, DC, USA, 2011. [Google Scholar]
- Mahmoud, M.A.I.; Ren, H. Forest Fire Detection Using a Rule-Based Image Processing Algorithm and Temporal Variation. Math. Probl. Eng. 2018, 2018, 1–8. [Google Scholar] [CrossRef] [Green Version]
- Kim, Y.J.; Kim, E.G. Image based fire detection using convolutional neural network. J. Korea Inst. Inf. Commun. Eng. 2016, 20, 1649–1656. [Google Scholar] [CrossRef] [Green Version]
- Celik, T.; Demirel, H. Fire detection in video sequences using a generic color model. Fire Saf. J. 2009, 44, 147–158. [Google Scholar] [CrossRef]
- Wang, Y.; Dang, L.; Ren, J. Forest fire image recognition based on convolutional neural network. J. Algorithms Comput. Technol. 2019, 13. [Google Scholar] [CrossRef] [Green Version]
- Souza, M.; Moutinho, A.; Almeida, M. Wildfire detection using transfer learning on augmented datasets. Expert Syst. Appl. 2020, 142, 112975. [Google Scholar] [CrossRef]
- Ko, B.C.; Cheong, K.H.; Nam, J.Y. Fire detection based on vision sensor and support vector machines. Fire Saf. J. 2009, 44, 322–329. [Google Scholar] [CrossRef]
- Zhao, J.; Zhang, Z.; Han, S.; Qu, C.; Yuan, Z.; Zhang, D. SVM based forest fire detection using static and dynamic features. Comput. Sci. Inf. Syst. 2011, 8, 821–841. [Google Scholar] [CrossRef]
- Tung, T.X.; Kim, J. An effective four-stage smoke-detection algorithm using video image for early fire-alarm systems. Fire Saf. J. 2011, 5, 276–282. [Google Scholar] [CrossRef]
- Gomes, P.; Santana, P.; Barata, J. A Vision-Based Approach to Fire Detection. Int. J. Adv. Robot. Syst. 2014, 11, 149. [Google Scholar] [CrossRef]
- Xu, G.; Zhang, Y.; Zhang, Q.; Lin, G.; Wang, Z.; Jia, Y.; Wang, J. Video Smoke Detection Based on Deep Saliency Network. Fire Saf. J. 2019, 105, 277–285. [Google Scholar] [CrossRef] [Green Version]
- Zhang, Q.; Xu, J.; Xu, L.; Guo, H. Deep convolutional neural networks for forest fire detection. In Proceedings of the 2016 International Forum on Management, Education and Information Technology Application, Guangzhou, China, 30–31 January 2016. [Google Scholar]
- Pan, H.; Diaa, B.; Ahmet, E.C. Computationally efficient wildfire detection method using a deep convolutional network pruned via Fourier analysis. Sensors 2020, 20, 2891. [Google Scholar] [CrossRef]
- Krizhevsky, A.; Sutskever, I.; Hinton, G.E. ImageNet classification with deep convolutional neural networks. Adv. Neural Inf. Process. Syst. 2012, 1, 1097–1105. [Google Scholar] [CrossRef]
- Md, Z.A.; Aspiras, T.; Taha, T.M.; Asari, V.K.; Bowen, T.J.; Billiter, D.; Arkell, S. Advanced deep convolutional neural network approaches for digital pathology image analysis: A comprehensive evaluation with different use cases. arXiv 2019, arXiv:1904.09075. [Google Scholar]
- Simonyan, K.; Zisserman, A. Very deep convolutional networks for large-scale image recognition. arXiv 2014, arXiv:1409.1556. [Google Scholar]
- He, K.; Zhang, X.; Ren, S.; Sun, J. Deep residual learning for image recognition. In Proceedings of the IEEE Conference on Computer Vision and Pattern Recognition, Las Vegas, NV, USA, 27–30 June 2016; pp. 770–778. [Google Scholar]
- Muhammad, K.; Ahmad, J.; Mehmood, I.; Rho, S. Convolutional Neural Networks based Fire Detection in Surveillance Videos. IEEE Access 2018, 6, 18174–18183. [Google Scholar] [CrossRef]
- Jung, D.; Tuan, V.T.; Tran, D.Q.; Park, M.; Park, S. Conceptual Framework of an Intelligent Decision Support System for Smart City Disaster Management. Appl. Sci. 2020, 10, 666. [Google Scholar] [CrossRef] [Green Version]
- Jain, p.; Coogan, S.C.; Subramanian, S.G.; Crowley, M.; Taylor, S.; Flannigan, M.D. A review of machine learning applications in wildfire science and management. arXiv 2020, arXiv:2003.00646v2. [Google Scholar]
- Zhang, Q.X.; Lin, G.H.; Zhang, Y.M.; Xu, G.; Wang, J.J. Wildland forest fire smoke detection based on faster r-cnn using synthetic smoke images. Procedia Eng. 2018, 211, 411–466. [Google Scholar] [CrossRef]
- Cao, Y.; Yang, F.; Tang, Q.; Lu, X. An attention enhanced bidirectional LSTM for early forest fire smoke recognition. IEEE Access 2019, 7, 154732–154742. [Google Scholar] [CrossRef]
- Zhao, Y.; Ma, J.; Li, X.; Zhang, J. Saliency Detection and Deep Learning-Based Wildfire Identification in UAV Imagery. Sensors 2018, 18, 712. [Google Scholar] [CrossRef] [Green Version]
- Alexandrov, D.; Pertseva, E.; Berman, I.; Pantiukhin, I.; Kapitonov, A. Analysis of Machine Learning Methods for Wildfire Security Monitoring with an Unmanned Aerial Vehicles. In Proceedings of the 2019 24th Conference of Open Innovations Association (FRUCT), Moscow, Russia, 8–12 April 2019. [Google Scholar]
- Namozov, A.; Cho, Y.I. An efficient deep learning algorithm for fire and smoke detection with limited data. Adv. Electr. Comput. Eng. 2018, 18, 121–129. [Google Scholar] [CrossRef]
- Zhikai, Y.; Leping, B.; Teng, W.; Tianrui, Z.; Fen, W. Fire Image Generation Based on ACGAN. In Proceedings of the 2019 Chinese Control and Decision Conference (CCDC), Nanchang, China, 3–5 June 2019; pp. 5743–5746. [Google Scholar]
- Li, T.; Zhao, E.; Zhang, J.; Hu, C. Detection of Wildfire Smoke Images Based on a Densely Dilated Convolutional Network. Electronics 2019, 8, 1131. [Google Scholar] [CrossRef] [Green Version]
- Xu, G.; Zhang, Y.; Zhang, Q.; Lin, G.; Wang, J. Domain adaptation from synthesis to reality in single-model detector for video smoke detection. arXiv 2017, arXiv:1709.08142. [Google Scholar]
- Goodfellow, I.; Pouget-Abadie, J.; Mirza, M.; Xu, B.; Warde-Farley, D.; Ozair, S.; Courville, A.; Bengio, Y. Generative adversarial nets. In Advances in Neural Information Processing Systems; ACM: New York, NY, USA, 2014; pp. 2672–2680. [Google Scholar]
- Zheng, K.; Wei, M.; Sun, G.; Anas, B.; Li, Y. Using Vehicle Synthesis Generative Adversarial Networks to Improve Vehicle Detection in Remote Sensing Images. ISPRS Int. J. Geo-Inf. 2019, 8, 390. [Google Scholar] [CrossRef] [Green Version]
- Ledig, C.; Theis, L.; Huszár, F.; Caballero, J.; Cunningham, A.; Acosta, A.; Aitken, A.; Tejani, A.; Totz, J.; Wang, Z.; et al. Photo-realistic single image super-resolution using a generative adversarial network. In Proceedings of the IEEE Conference on Computer Vision and Pattern Recognition, Honolulu, HI, USA, 21–26 July 2017; pp. 105–114. [Google Scholar]
- Isola, P.; Zhu, J.Y.; Zhou, T.; Efros, A.A. Image-To-Image Translation with Conditional Adversarial Networks. In Proceedings of the IEEE Conference on Computer Vision and Pattern Recognition (CVPR), Honolulu, HI, USA, 21–26 July 2017. [Google Scholar]
- Zhang, H.; Xu, T.; Li, H.; Zhang, S.; Wang, X.; Huang, X.; Metaxas, D.N. StackGAN++: Realistic Image Synthesis with Stacked Generative Adversarial Networks. IEEE Trans. Pattern Anal. Mach. Intell. 2019, 41, 1947–1962. [Google Scholar] [CrossRef] [Green Version]
- Sandfort, V.; Yan, K.; Pickhardt, P.J.; Summers, R.M. Data augmentation using generative adversarial networks (CycleGAN) to improve generalizability in CT segmentation tasks. Sci. Rep. 2019, 9, 16884. [Google Scholar] [CrossRef]
- Uzunova, H.; Ehrhardt, J.; Jacob, F.; Frydrychowicz, A.; Handels, H. Multi-scale GANs for memory-efficient generation of high resolution medical images. In Proceedings of the International Conference on Medical Image Computing and Computer-Assisted Intervention (MICCAI), Shenzhen, China, 13–17 October 2019; pp. 112–120. [Google Scholar]
- Hu, Q.; Wu, C.; Wu, Y.; Xiong, N. UAV Image High Fidelity Compression Algorithm Based on Generative Adversarial Networks Under Complex Disaster Conditions. IEEE Access 2019, 7, 91980–91991. [Google Scholar] [CrossRef]
- Huang, G.; Liu, Z.; Van der Maaten, L.; Weinberger, K.Q. Densely connected convolutional networks. In Proceedings of the IEEE Conference on Pattern Recognition and Computer Vision 2017, Honolulu, HI, USA, 21–26 July 2017; pp. 4700–4708. [Google Scholar]
- Zhu, J.Y.; Park, T.; Isola, P.; Efros, A.A. Unpaired Image-to-Image Translation using Cycle-Consistent Adversarial Networks. In Proceedings of the 2017 IEEE International Conference on Computer Vision (ICCV), Venice, Italy, 22–29 October 2017; pp. 2242–2251. [Google Scholar]
- Oliva, A.; Torralba, A. Modeling the shape of the scene: A holistic representation of the spatial envelope. Int. J. Comput. Vis. 2001, 42, 145–175. [Google Scholar] [CrossRef]
- Jeong, C.; Jang, S.-E.; Na, S.; Kim, J. Korean Tourist Spot Multi-Modal Dataset for Deep Learning Applications. Data 2019, 4, 139. [Google Scholar] [CrossRef] [Green Version]
- Sokolova, M.; Japkowicz, N.; Szpakowicz, S. Beyond accuracy, F-Score and ROC: A family of discriminant measures for performance evaluation. In AI 2006: Advances in Artificial Intelligence; Springer: Berlin/Heidelberg, Germany, 2006; pp. 1015–1021. [Google Scholar]
- Powers, D.M.W. Evaluation: From precision, recall and F-measure to ROC, informedness, markedness and correlation. J. Mach. Learn. Technol. 2011, 2, 37–63. [Google Scholar]
- Tharwat, A. Classification assessment methods. Appl. Comput. Inform. 2018, 13. [Google Scholar] [CrossRef]
- Paszke, A.; Gross, S.; Massa, F.; Lerer, A.; Bradbury, J.; Chanan, G.; Killeen, T.; Lin, Z.; Gimelshein, N.; Antiga, L. PyTorch: An imperative style, high-performance deep learning library. In Proceedings of the Advances in Neural Information Processing Systems, Vancouver, BC, Canada, 8–14 December 2019; pp. 8024–8035. [Google Scholar]
- Johnson, J.M.; Khoshgoftaar, T.M. Survey on deep learning with class imbalance. J. Big Data 2019, 6, 27. [Google Scholar] [CrossRef]
- Kingma, D.; Ba, J. Adam: A method for Stochastic Optimization. In Proceedings of the 3rd International Conference for Learning Representations, San Diego, CA, USA, 7–9 May 2015. [Google Scholar]
- Hinton, G.; Srivastava, N.; Swersky, K. Neural networks for machine learning lecture 6a overview of mini-batch gradient descent. Cited 2012, 14, 1–31. [Google Scholar]
- Zhou, B.; Khosla, A.; Lapedriza, A.; Oliva, A.; Torralba, A. Learning deep features for discriminative localization. In Proceedings of the IEEE Conference on Computer Vision and Pattern Recognition, Las Vegas, NV, USA, 27–30 June 2016; pp. 2921–2929. [Google Scholar]
- Drone Center. Wildfire Video of Nangwol-dong. December 2015. Available online: http://www.dronecenter.kr/bbs/s5_4/3266 (accessed on 13 October 2020).
Figure 1.
Sample mountain and wildfire images from conducted data collection. (a) Mountain images from eight scene categories database. (b) Mountain images from Korean tourist spot database. (c) Drone-captured mountain images obtained via web image crawling. (d) Drone-captured wildfire images obtained via web image crawling. (e) Drone-captured wildfire images obtained via web video crawling.

Figure 2.
Architecture of CycleGAN; mapping between two image domains x and y. The model training is performed as the forward and inverse mappings are learned simultaneously using the adversarial loss and cycle-consistency loss.
Figure 2.
Architecture of CycleGAN; mapping between two image domains x and y. The model training is performed as the forward and inverse mappings are learned simultaneously using the adversarial loss and cycle-consistency loss.

Figure 3.
Architecture of five-layer densely connected convolution networks.

Figure 4.
Training loss curve of CycleGAN-based non-fire–wildfire image converter. (a) Adversarial loss curve for generator and discriminator by the number of epochs. (b) Cycle-consistency and identity mapping loss curve by the number of epochs.
Figure 4.
Training loss curve of CycleGAN-based non-fire–wildfire image converter. (a) Adversarial loss curve for generator and discriminator by the number of epochs. (b) Cycle-consistency and identity mapping loss curve by the number of epochs.

Figure 5.
CycleGAN-based wildfire-image-generation architecture.

Figure 6.
Sample of the wildfire images converted from non-fire mountain images.

Figure 7.
DenseNet-based wildfire-detection architecture.

Figure 8.
Learning curve of training process over epochs. (a) Accuracy curve. Final accuracy: VGG-16, trainset A (0.954); VGG-16, trainset B (0.969); ResNet-50, trainset A (0.989); ResNet-50, trainset B (0.995); DenseNet trainset A (0.985); and DenseNet trainset B (0.995). (b) Loss curve. Final loss: VGG-16, trainset A (0.123); VGG-16 trainset B (0.085); ResNet-50, trainset A (0.028); ResNet-50, trainset B (0.016); DenseNet, trainset A (0.0003; SGD); and DenseNet, trainset B (0.00006; SGD).

Figure 9.
Sample of CAM results of the wildfire images.

Figure 10.
Example of model application with softmax result for early wildfire (with error).

Figure 11.
Example of model application with softmax result for non-wildfire (with error).

Figure 12.
Example of model application with softmax result after 10-min wildfire progress.


Table 1.
Image datasets for wildfire-detection model.
| Original Non-Fire Images | Original Wildfire Images | Generated Wildfire Images | |
|---|---|---|---|
| Train set A [Real database] | 3165 | 2427 | |
| Train set B [Real + synthetic database] | 6309 | 2427 | 3585 |
| Test set | 545 | 486 |
Table 2.
Selected hyperparameters for CNN architectures.
| VGG-16 | ResNet-50 | DenseNet | |
|---|---|---|---|
| Batch Size | 60 | 60 | 60 |
| Initial Learning Rate | 0.0002 | 0.0002 | 0.01 |
| Number of Training Epochs | 250 | 250 | 250 |
| Optimizer | Adam | Adam | SGD |
Table 3.
Comparisons of performance evaluation.
| VGG-16 | ResNet-50 | Proposed Method | ||||
|---|---|---|---|---|---|---|
| Train Set A | Train Set B | Train Set A | Train Set B | Train Set A | Train Set B | |
| Accuracy (%) | 93.756 | 93.276 | 96.734 | 96.926 | 96.734 | 98.271 |
| Precision (%) | 93.890 | 97.973 | 97.727 | 97.934 | 96.573 | 99.380 |
| Sensitivity (%) | 92.944 | 87.702 | 95.363 | 95.565 | 96.573 | 96.976 |
| Specificity (%) | 94.495 | 98.349 | 97.982 | 98.165 | 96.881 | 99.450 |
| F1-Score | 93.414 | 92.553 | 96.531 | 96.735 | 96.573 | 98.163 |
The bold is the best result among other methods.
Table 4.
F1-scores for model trained by various combination sets.
| Data Augmentation Method | Training Images | F1-Score |
|---|---|---|
| Original + GAN + Horizontal flip + Zoom (200) | 6312 | 98.163 |
| Original + GAN + Rotation (10 and 350) | 6312 | 97.911 |
| Original + GAN + Random brightness (from to ) | 6312 | 97.830 |
| Original + Traditional augmentation (Without GAN) | 6363 | 97.009 |
Publisher’s Note: MDPI stays neutral with regard to jurisdictional claims in published maps and institutional affiliations. |
© 2020 by the authors. Licensee MDPI, Basel, Switzerland. This article is an open access article distributed under the terms and conditions of the Creative Commons Attribution (CC BY) license (http://creativecommons.org/licenses/by/4.0/).
Share and Cite
MDPI and ACS Style
Park, M.; Tran, D.Q.; Jung, D.; Park, S. Wildfire-Detection Method Using DenseNet and CycleGAN Data Augmentation-Based Remote Camera Imagery. Remote Sens. 2020, 12, 3715. https://0-doi-org.brum.beds.ac.uk/10.3390/rs12223715
AMA Style
Park M, Tran DQ, Jung D, Park S. Wildfire-Detection Method Using DenseNet and CycleGAN Data Augmentation-Based Remote Camera Imagery. Remote Sensing. 2020; 12(22):3715. https://0-doi-org.brum.beds.ac.uk/10.3390/rs12223715
Chicago/Turabian StylePark, Minsoo, Dai Quoc Tran, Daekyo Jung, and Seunghee Park. 2020. "Wildfire-Detection Method Using DenseNet and CycleGAN Data Augmentation-Based Remote Camera Imagery" Remote Sensing 12, no. 22: 3715. https://0-doi-org.brum.beds.ac.uk/10.3390/rs12223715
Note that from the first issue of 2016, this journal uses article numbers instead of page numbers. See further details here.