Quantifying the Influences of Natural Factors and Human Activities on NDVI Changes in the Hanjiang River Basin, China


1
State Key Laboratory of Water Resources and Hydropower Engineering Science, Wuhan University, Wuhan 430072, China
2
Key Laboratory of Cycle and Related Land Surface Processes, Institute of Geographic Sciences and Natural Resources Research, Chinese Academy of Sciences, Beijing 100101, China
*
Author to whom correspondence should be addressed.
Remote Sens. 2020, 12(22), 3780; https://0-doi-org.brum.beds.ac.uk/10.3390/rs12223780
Submission received: 28 September 2020
/
Revised: 6 November 2020
/
Accepted: 13 November 2020
/
Published: 18 November 2020
Abstract
:The Hanjiang River Basin (HJRB) is an important source area for drinking water in Hubei Province, China, and the vegetation coverage there is important to the ecological system. Due to the spatial heterogeneity and synergistic effect of various factors, it is very difficult to identify the main factors affecting vegetation growth in the HJRB. With the normalized difference vegetation index (NDVI) data from 2001 to 2018 in the HJRB, the spatiotemporal patterns of NDVI and the influences of natural factors and human activities on NDVI were investigated and quantified based on the Mann-Kendall (M-K) test, partial correlation analysis, and Geographical Detector. The individual factors and their interactions and the range/type of factor attributes suitable for vegetation growth were also examined. NDVI in the HJRB increased from 2001 to 2018, and the variation rate was 0.0046 year−1. NDVI was increasing in 81.17% of the area (p < 0.05). Elevation and slope can effectively explain the vegetation distribution. The interactions of factors on NDVI were significant, and the interactions of the elevation and precipitation can maximize the impact among all factors. The range of available landforms is thought to be highly conducive to vegetation growth. The rates of the annual precipitation and annual mean temperature changed from 2001 to 2018, which were 3.665 mm/year and 0.017 °C/year, and the regions where NDVI positively correlated with them were over 85%. Contrary to the general trend, NDVI has obviously decreased in urban areas since 2010. The quantitative findings of this study can help us better understand the effects of various factors on vegetation growth and provide appropriate suggestions for vegetation protection and restoration in the HJRB.
1. Introduction
Ground vegetation is important to terrestrial ecosystems, and it serves to regulate the ecological balance, water and biogeochemical cycles, and climatic changes [1,2,3,4]. Moreover, ground vegetation coverage is closely related to natural and human factors, and thus can respond to changes of the surrounding environment over a short time [5,6,7,8,9]. In recent years, with climate warming and intensified human activities, the ground vegetation ecosystem has experienced unprecedented destruction [10,11]. Therefore, investigations of the spatiotemporal changes in vegetation at various scales are of great significance to understanding the interactions between various factors and terrestrial ecosystems [12].
How climate change and human activities affect vegetation growth has become a hot topic to study. With the benefit of the technology of remote sensing, it has become easier to study the factors that drive vegetation change. The normalized difference vegetation index (NDVI), one of the most used indexes, has a close positive correlation with vegetation productivity and vegetation coverage [13,14,15,16,17]. Moreover, the time series of NDVI can accurately and intuitively reflect the growth of vegetation and is widely used to study vegetation trends [18]. Additionally, based on a continuous long series of remotely sensed meteorological data, studies of the relationship between climate conditions and vegetation change have been conducted around the word [19]. Among various climate factors, temperature and precipitation are recommended as the two most important factors [20]. Ma et al. [21] used NDVI to study the impact of asymmetric daytime and nighttime warming on the vegetation in the Yellow River Basin from 1982 to 2015 and suggested that daytime warming might increase the growth and coverage of vegetation in arid and semiarid areas. Liu et al. [22] studied the relationships among NDVI, climate conditions, and soil moisture conditions in the Weihe River Basin (WRB) by using the cross-wavelet technique and found that the effects of temperature and soil moisture on the increase in vegetation coverage in the WRB were stronger than that of precipitation.
Moreover, the impact of human activities on vegetation cover has been widely researched. Zhang et al. [23] studied the spatiotemporal variations in NDVI and the climatic factors (CFs) associated with a large dam–reservoir–river system by using trend analysis and correlation analysis methods; they identified the effects of the development of cascade hydropower stations on vegetation coverage. Fang et al. [24] used the bivariate probability framework to compare the Standardized Precipitation Index (SPI) and NDVI to test the vegetation vulnerability on the Loess Plateau; they found that reasonable irrigation measures and vegetation restoration measures were conducive to reducing vegetation vulnerability.
However, some studies have shown that drivers of vegetation changes are complex, and the joint actions of various factors shape the vegetation form and regional trends [25,26,27]. For example, Liu et al. [28] found that variations in NDVI were greatly associated with topographic factors in the karst mountainous areas in southwest China based on a linear regression method. Rojo et al. [29] divided the study area into 10 vegetation units according to NDVI characteristics and considered the vegetation diversity correlated with terrain and soil type in the Pozuelos Biosphere Reserve. Leroux et al. [30] calculated pixelwise NDVI temporal trends and considered that the changes of vegetation cover were attributed to multiple factors.
Previous studies preferred to use trend analysis or regression analysis to reflect the influence of factors on NDVI as mentioned above. These methods mainly considered the influence of temporal change of variables. However, they ignored the effect of spatial heterogeneity of factors, which plays an important role in the spatial distribution of NDVI. At the same time, previous studies took factors as separate variables [31,32]. In fact, due to the synergistic effect of various factors on vegetation growth, it is not rigorous enough to study the relationships between vegetation change and individual factors separately. Therefore, it is necessary to comprehensively consider the influences of temporal variation and spatial heterogeneity of factors on NDVI and also the synergistic effect of multiple factors [20].
The Hanjiang River Basin (HJRB) is an important source area for drinking water in Hubei Province and the source area for some water diversion projects in China, and the vegetation coverage in this basin is of great significance to the local ecosystem [32]. Although some researchers have studied the vegetation cover in the HJRB, they usually pay more attention to the impact of climate change [33,34]. However, the factors that affect NDVI in the HJRB vary, and they include the climate, terrain, vegetation type, soil type, and human activities [35]. Therefore, we used a spatial statistical method called Geographical Detector [36,37] to conduct a comprehensive study of the various factors that influence NDVI and determine the appropriate range or type of each factor in the HJRB. Spatial heterogeneity was considered in the Geographical Detector to determine the explanatory power of single factors and the synergistic effects of multiple variables from the aspect of spatial heterogeneity [38,39]. Therefore, this study will mainly solve the following problems: (1) investigating the spatiotemporal variations in NDVI in the HJRB, (2) identifying the main factors that influence the NDVI distribution and determining whether they are independent or dependent, (3) identifying the interactions among factors and determining the ranges or types of factors that are suitable for vegetation growth, and (4) explaining the cause of NDVI changes. And the research process of this paper is shown as Figure S1.
2. Materials and Methods
2.1. Study Area
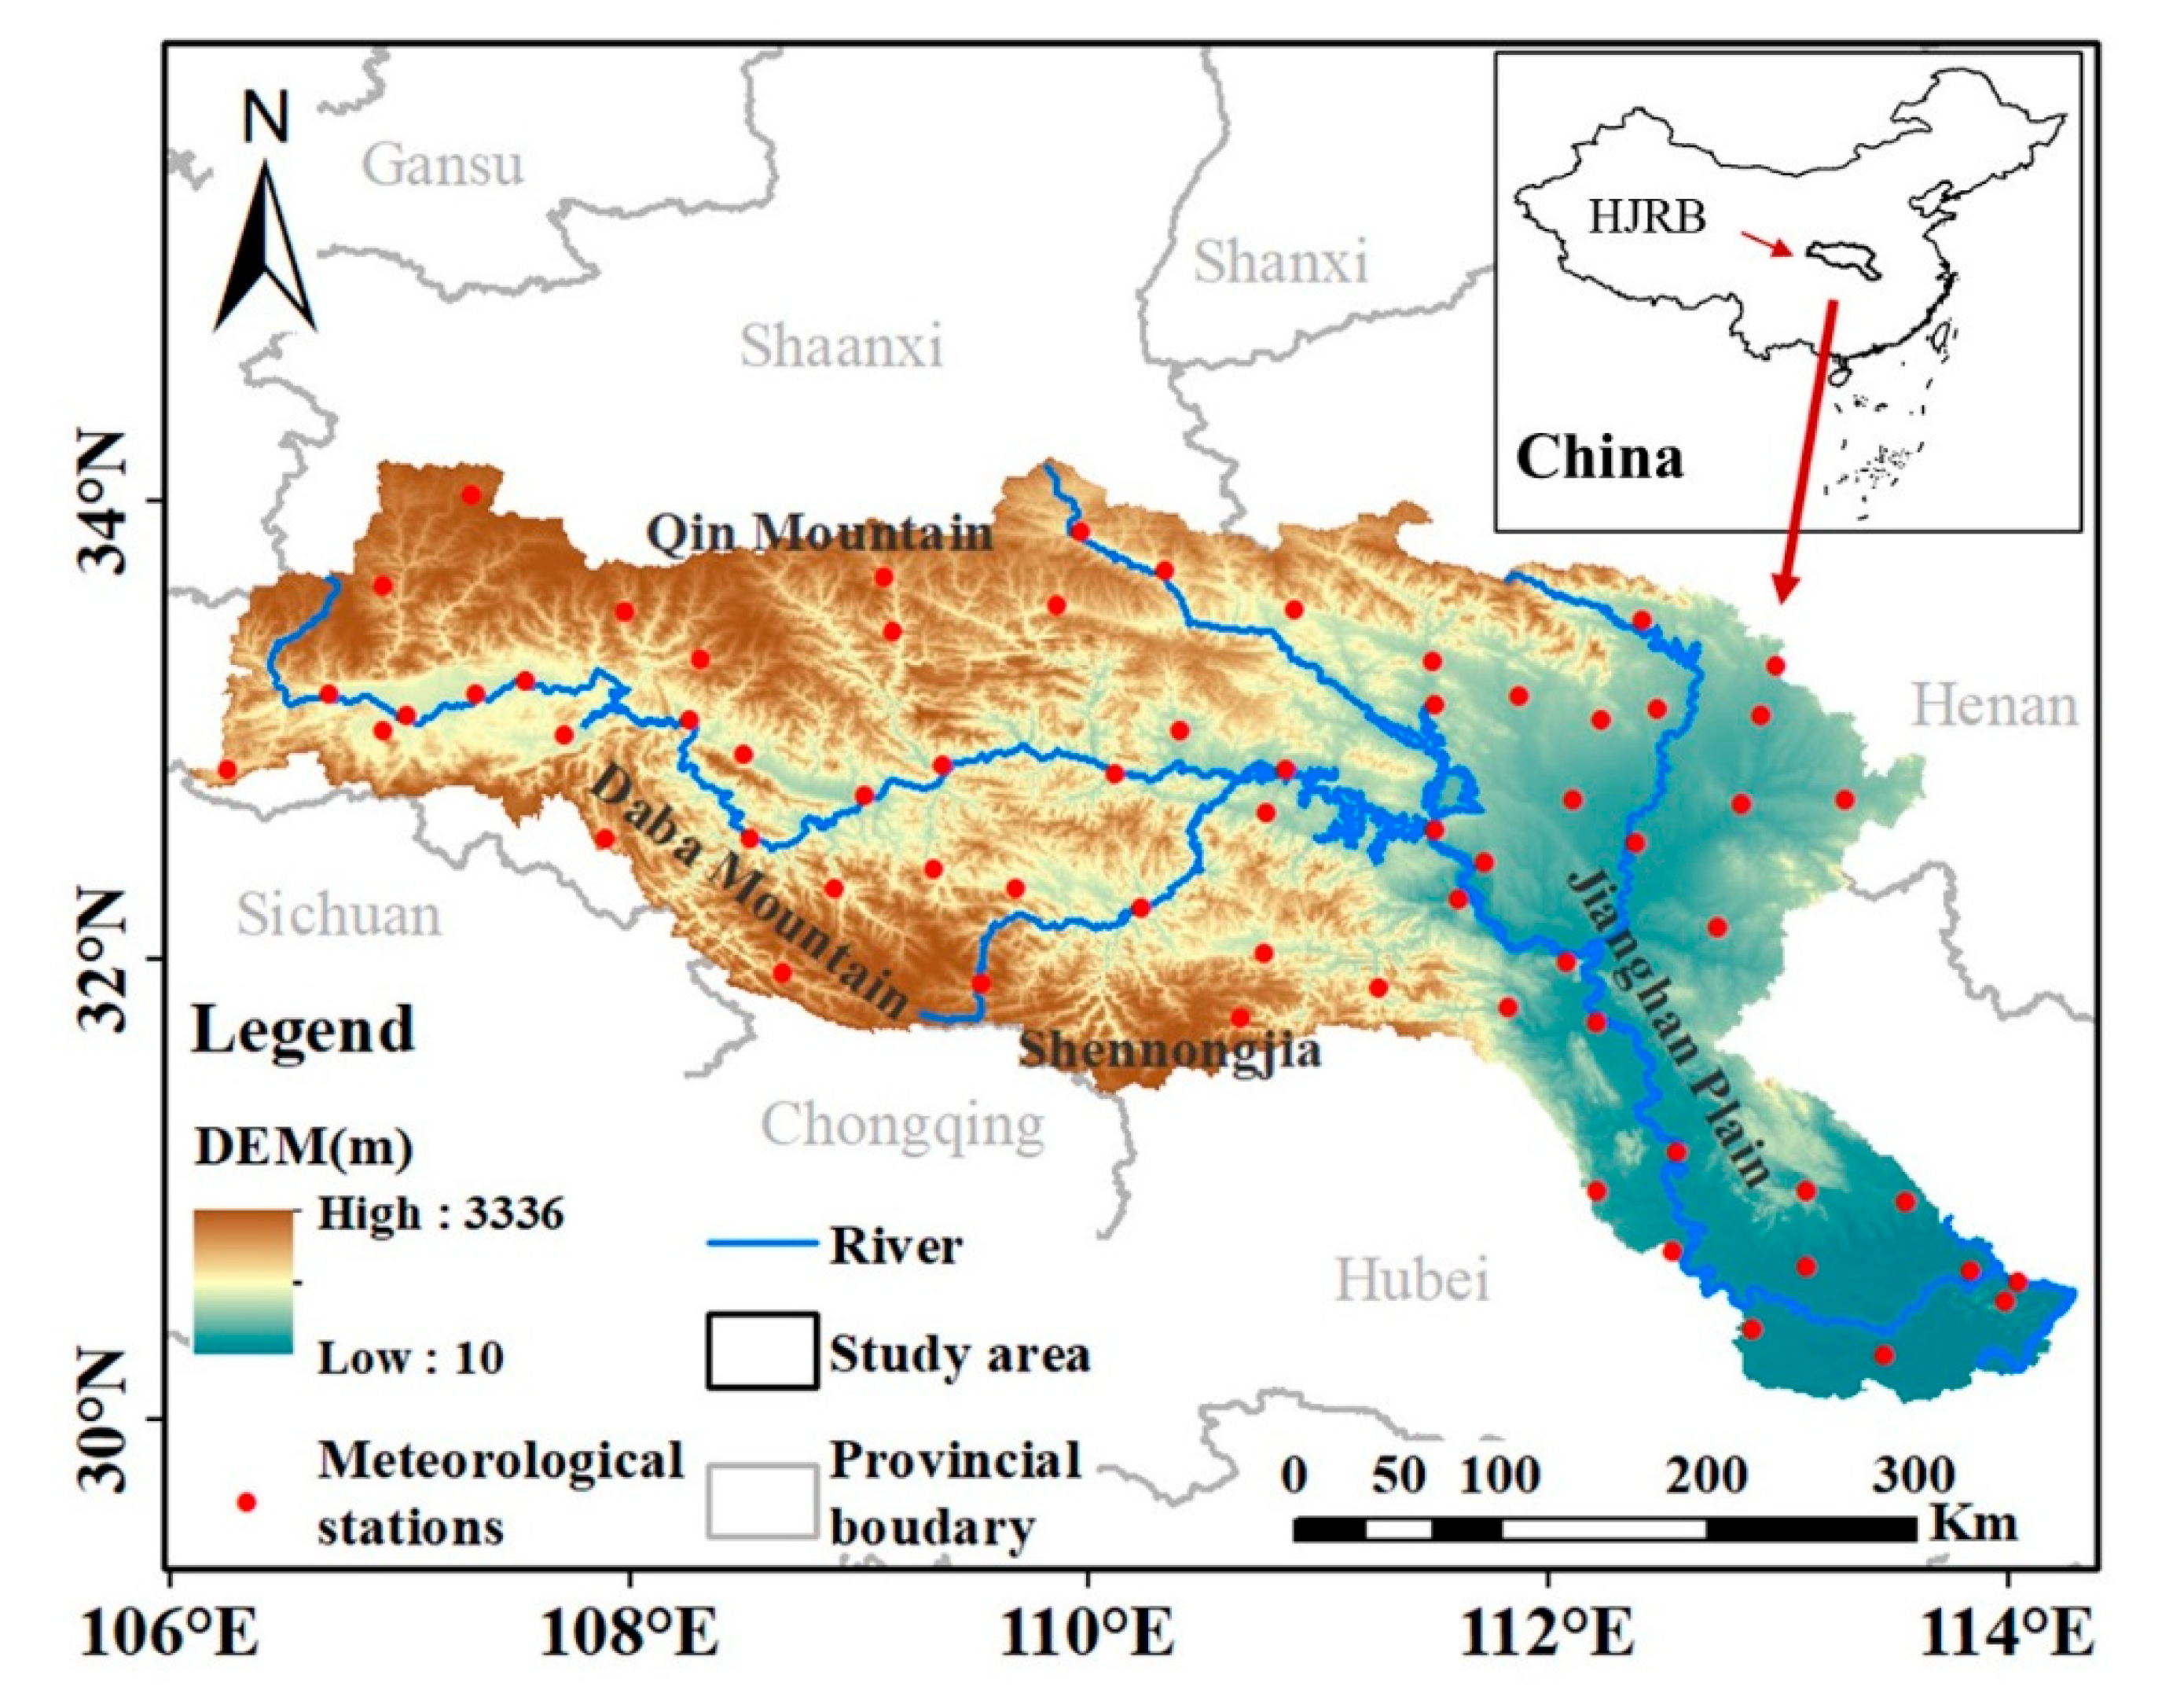
The Hanjiang River, the longest tributary of the Yangtze River, covers an area of approximately 159,000 km2, and it flows through Hubei, Shaanxi, Sichuan, Chongqing, Gansu, and other places. The HJRB is high in the west and low in the east, with an elevation of only approximately 10 m at the bottom and over 3300 m at the top (Figure 1). The HJRB is divided into upper, middle, and lower sub-basins by the Huangjiagang and Huangzhuang hydrological stations. The upper and middle basins are mostly mountainous areas, and the lower basin is the Jianghan Plain. The HJRB is located in a subtropical monsoon region, and the climate here is mild and humid. The annual precipitation totals 873 mm, but it is heterogeneous in space [40]. The main vegetation type in this area is broad-leaved forest, and the main soil type is leached soil [32]. Due to human activities, most of the land in the HJRB is used for cultivation, and the main crops are rice and wheat [41].
2.2. Data Sources
SPOT/VEGETATION NDVI data were obtained from the Resources and Environment Data Cloud Platform of the Chinese Academy of Sciences [42] for the period of 2001–2018. The dataset started on 1 April 1998, with a spatial resolution of 1 km and a temporal resolution of 10 days. The 10-day NDVI data were processed with the maximum value composites (MVC) method; that is, each pixel in the image was characterized by the maximum value that appeared within 10 days [43]. This method can effectively reduce the influence of cloud cover, aerosol, solar altitude, and so forth in the atmosphere. Similarly, monthly data were obtained by synthesizing the 10-day maximum. To fully reflect the characteristics of the vegetation cover, the average NDVI in the growing season (April to September), which was synthesized by Raster Calculator in GIS, was used to replace the annual NDVI [33,44]. A 3 arc-second (90 m) digital elevation model (DEM) was downloaded from the Shuttle Radar Topography Mission (SRTM) Digital Elevation Database of the USGS/NASA [45], and the elevation, slope, and aspect were calculated based on it.
Climatic datasets from 66 national meteorological stations in the HJRB were obtained from the National Meteorological Information Center (NMIC) of the China Meteorological Administration (CMA) [46]. The datasets covered the period of 2001–2018 and included daily values of temperature (maximum, minimum, and mean), relative humidity, precipitation, evaporation, wind speed, and sunshine duration. Radiation data were calculated from the daily climatic data based on the assessment method for solar energy [47].
The soil type, vegetation type, and land-use data were obtained from the Resources and Environment Data Cloud Platform of the Chinese Academy of Sciences [42], and they were resampled to a 1 km resolution. The classification standards for the soil type, vegetation type, and land-use type were referenced from the 1:1,000,000 Soil Map of the People’s Republic of China, 1:1,000,000 China Vegetation Atlas, and Multiperiod China Land Use and Land Cover Change Remote Sensing Monitoring Data Set (CNLUCC) [48], respectively.
2.3. Methods
2.3.1. NDVI Grades
To reflect the variations, the value of NDVI was equally divided into five levels at 0.2 intervals. These levels were low (0–0.2), low to moderate (0.2–0.4), moderate (0.4–0.6), moderate to high (0.6–0.8), and high (0.8–1.0), respectively [49].
2.3.2. Linear Regression and Mann-Kendall Test
The linear regression and the Mann-Kendall (M-K) test were used to determine the trends of multiple factors in this study. Linear regression is a statistical method that determines the trend associated with dependent variables and independent variables based on observation data. This approach is mainly used to determine the correlation between two variables [50]. The corresponding formula is
where n is the number of years (in this study, n = 18), Ci is the annual meteorological data for each pixel point in year i, and Tslope is the slope of the linear regression equation of the interannual change in meteorological data at each pixel point in the research area from 2001 to 2018, that is, the rate of change, which reflects the overall trend of meteorological data during the research period. Tslope > 0 indicates that the overall change in NDVI is increasing and vice versa [51].
The M-K test is often used to analyze whether the trend associated with various factors is significant, and the t-test is used to evaluate the result [52,53]. The corresponding formulas are
where S is the Kendall sum statistic, and xi and xj are parameter values at time j and k, respectively, in the time series x1, x2, …, xk, …, xj, …, xn. The M-K ZMK value indicates the trend of a variable. When the ZMK trend has a significance level greater than 5% (p < 0.05, ZMK ≥ |±1.64|), the trend is considered significant [54].
2.3.3. Partial Correlation Analysis
The partial correlation analysis is used to calculate the correlation between two factors on the basis of the linear correlation analysis by excluding the interference of other influential factors [55,56]. This metric can truly reflect the correlation between the two factors. The corresponding formula is
where x, y, and z represent three factors. Rxy,z represents the correlation between factor x and factor y after the interference associated with factor z is excluded. Rxy reflects the linear correlation coefficient between factor x and factor y, and Rxz and Ryz have similar meanings.
2.3.4. Geographical Detector
Geographical Detector is a tool that encompasses a series of spatial statistical methods and is used to determine the heterogeneity of factors and define main influencing factors based on the relevant variables, interactions, risks, and ecology [36,57].
- 1.
- Detection of the explanatory power of factors
This module is used to detect the heterogeneity of dependent variables and analyze the explanatory power of dependent variables by independent variables. It includes three steps: (a) independent variables are classified, (b) spatial overlay is analyzed for the dependent variable layer and independent variables represented by category attributes, and (c) the f-test is used to detect the relative importance of the mean values of independent variables. The corresponding formulas are
where PD explains the influences of independent variables for the dependent variable; h = 1, …, L reflects the layer of variables, that is, classification or partitioning. Nh and N are the numbers of units in h and the whole region, respectively, and σh2 and σ2 are the variance of the dependent variable, correspondingly. SSW means within sum of squares, and SST means total sum of squares. The value of PD is from 0 to 1; the closer the value is to 1, the stronger is the explanatory power of the independent variable for the dependent variable. When the PD value is equal to 1, it means that the spatial distribution of the dependent variable is absolutely controlled by the independent variable. On the contrary, when the PD value is 0, the distribution of the dependent variable has nothing to do with the independent variable.
- 2.
- Detection of factor interactions
This module is used to determine whether the two independent variables will increase or decrease the explanatory power when they work together. First, the PD values of the two independent variables are calculated as (PD(a1) and PD(a2)). Then, the PD values that reflect the interactions between the two independent variables are calculated as (PD(a1∩a2) and compared with PD(a1) and PD(a2).
- 3.
- Detection of the optimal range/type of factors
Risk detection is used to determine whether the average values of the dependent variables corresponding to the respective subzones of independent variables are significantly different, and it is used to find the range or type of independent variables in favor of the dependent variable. Risk detection is based on the t-statistic. The calculation steps are as follows:
First, calculate the average values of NDVI corresponding to different ranges/types of a factor. Next, determine whether there is a significant difference between each two values based on t-test. Finally, find out the range/type corresponding to the maximum value. If it is significantly different from other values, it means that this range/type is the most suitable. Otherwise, find the second largest value and compare whether it is significantly different from values other than the maximum value. If it is true, there are two most suitable ranges/types. Otherwise, repeat this step until the conditions are met.
- 4.
- Detection of differences between factors
Ecological detection is used to determine whether the effects of two independent variables (a1 and a2) on the distribution of one dependent variable are significantly different (i.e., whether a1 will have an impact on the distribution of the dependent variable more significantly than will a2). The F statistic is used to examine the difference between SSWa1 and SSWa2, which represents the sum of the intralayer variance for two independent variables.
2.3.5. Index Selection and Classification
To explore the factors that influence NDVI in the HJRB, 11 factors were chosen based on the information from previous studies and local conditions in the study area (Table 1). According to the corresponding properties, the factors were classified into five categories, namely, climate, topography, vegetation, soil, and human activities. At the same time, the first four among them were considered as the natural factors.
For the convenience of the study, we set up sampling points in the basin area [19]. The 8648 sampling points were the center points of the fishnet, which was generated by the Create Fishnet function in GIS according to the 4 × 4 km resolution. Year-by-year property sheets were generated by extracting values from the raster (NDVI and factors) according to the location of the sampling points using the Extract Multi Values to Points function in GIS.
According to the requirements of the research, the factors were classified as follows: the climate factors and slope direction were graded according to professional knowledge; the elevation and slope were graded according to the natural breakpoint method; and the vegetation types, soil types, and land-use types were graded according to the existing specifications (Table 2).
3. Results
3.1. Spatiotemporal Variations in NDVI in the HJRB
3.1.1. Variations in the Average NDVI in the HJRB
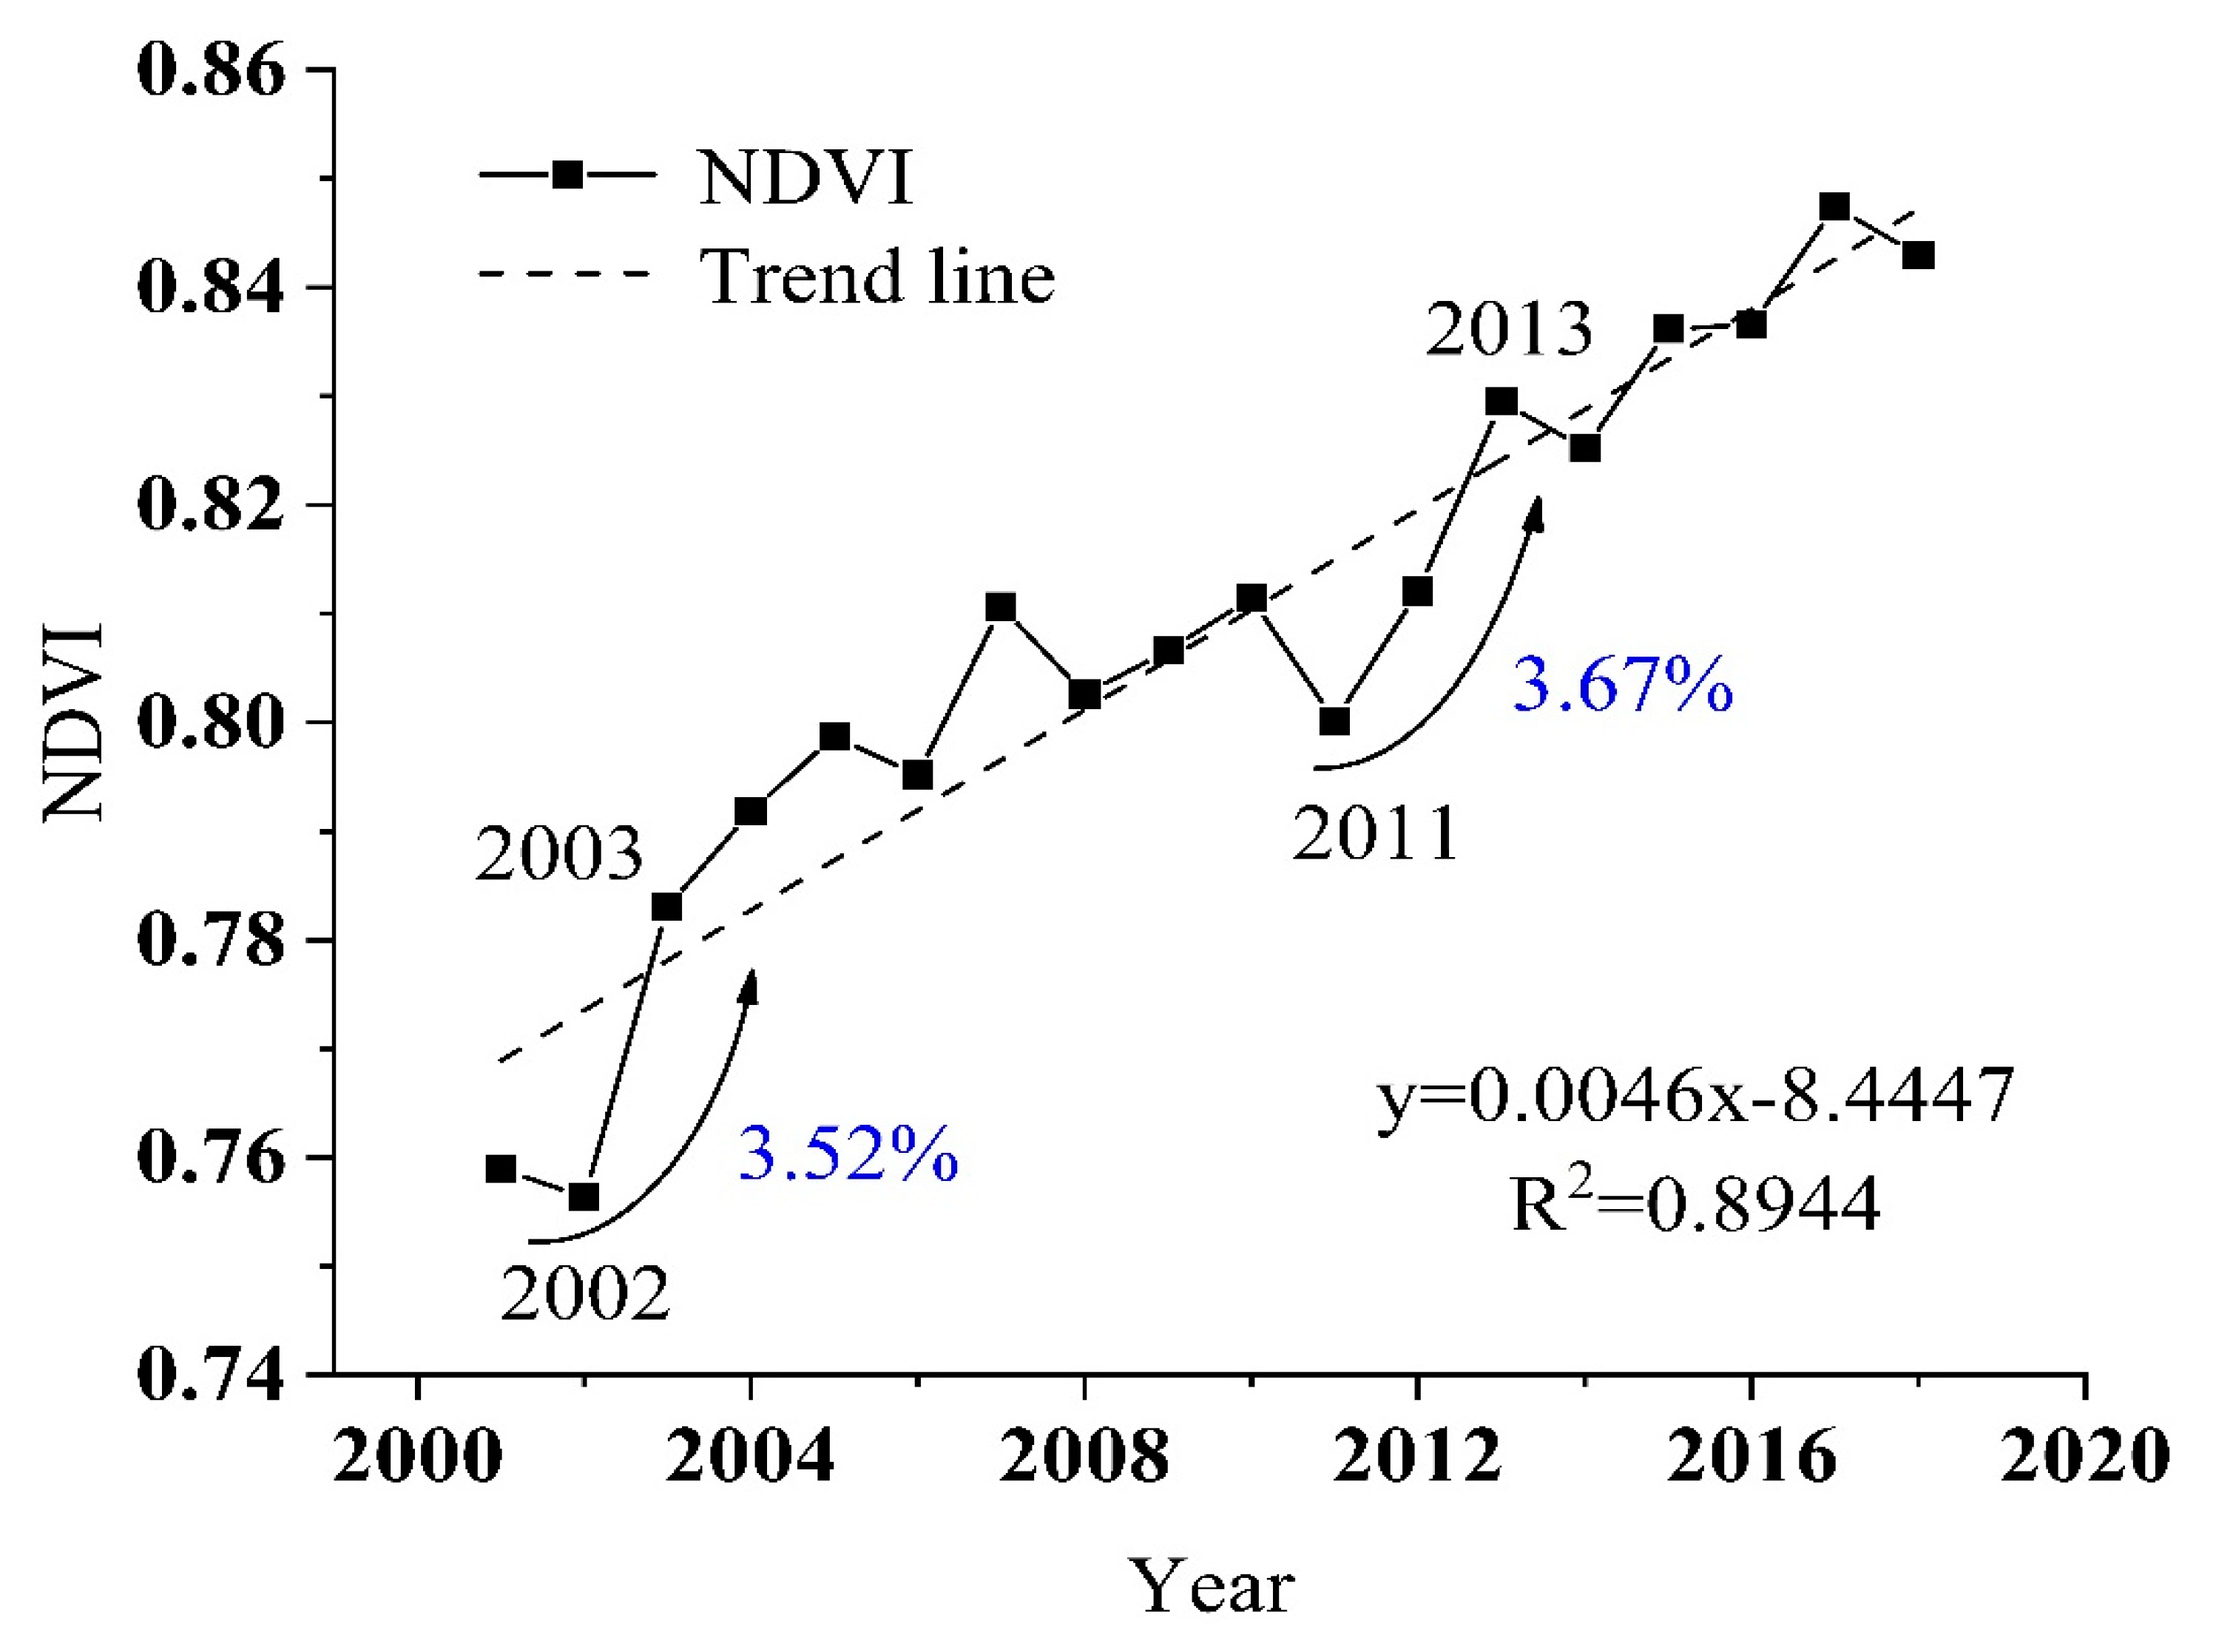
From 2001 to 2018, the annual increasing rate of NDVI in the HJRB was 0.0046 year−1 (Figure 2). The interannual variation in NDVI revealed two periods of acceleration from 2001 to 2018: they were 2001–2002 and 2011–2013, and the increasing rates were 3.52% and 3.67%, respectively. During the period from 2001 to 2018, NDVI declined in some years, but the decline was not obvious. These results suggest that the vegetation cover in this area showed a recovery trend.
Areas with low NDVI accounted for 0.069%, 0%, 0.069%, 0.058%, and 0.058% of the total area in 2001, 2005, 2010, 2015, and 2018, respectively (Table 3). The proportion of areas with low NDVI was generally small and barely changed. Areas with moderate to low NDVI also accounted for a small percentage of the total area, at 0.208%, 0.301%, 0.208%, 0.405%, and 0.532% in the years listed above; thus, overall, a slightly increasing trend occurred. The ratios of moderate NDVI regions from 2001 to 2018 were approximately 0.786–2.637%. The proportion of areas with NDVI values exceeding 0.6 in all years exceeded 95%, but the proportion of moderate to high NDVI and high NDVI regions varied greatly from year to year. In 2001, areas of moderate to high NDVI accounted for 63.960%, and the proportion of high NDVI regions was 33.125%; these values reached 38.607% and 60.051% in 2005, respectively. The variations in the moderate to high NDVI regions were related to those for the high NDVI regions. Notably, approximately 25% of the area turned from moderate to high NDVI regions to high NDVI regions from 2001 to 2005. From 2005 to 2010, approximately 8% of areas turned from moderate to high NDVI regions to high NDVI regions. The ratios from 2010 to 2015 and 2015 to 2018 were approximately 10% and 3%, respectively. From 2001 to 2018, the total conversion area ratio was approximately 46%. It can be concluded that one of the main reasons for the increase in NDVI in the HJRB was that an increasing number of moderate to high NDVI regions were converted to high NDVI regions. These areas were converted most rapidly from 2001 to 2005, and the proportion of high NDVI regions increased by approximately 81.3% during this time. The proportion generally declined over time and was 14.7%, 12.1%, and 4.2% from 2005 to 2010, 2010 to 2015, and 2015 to 2018, respectively. Therefore, it can be assumed that the growth of NDVI tended to slow.
3.1.2. Spatial Patterns of NDVI in the HJRB
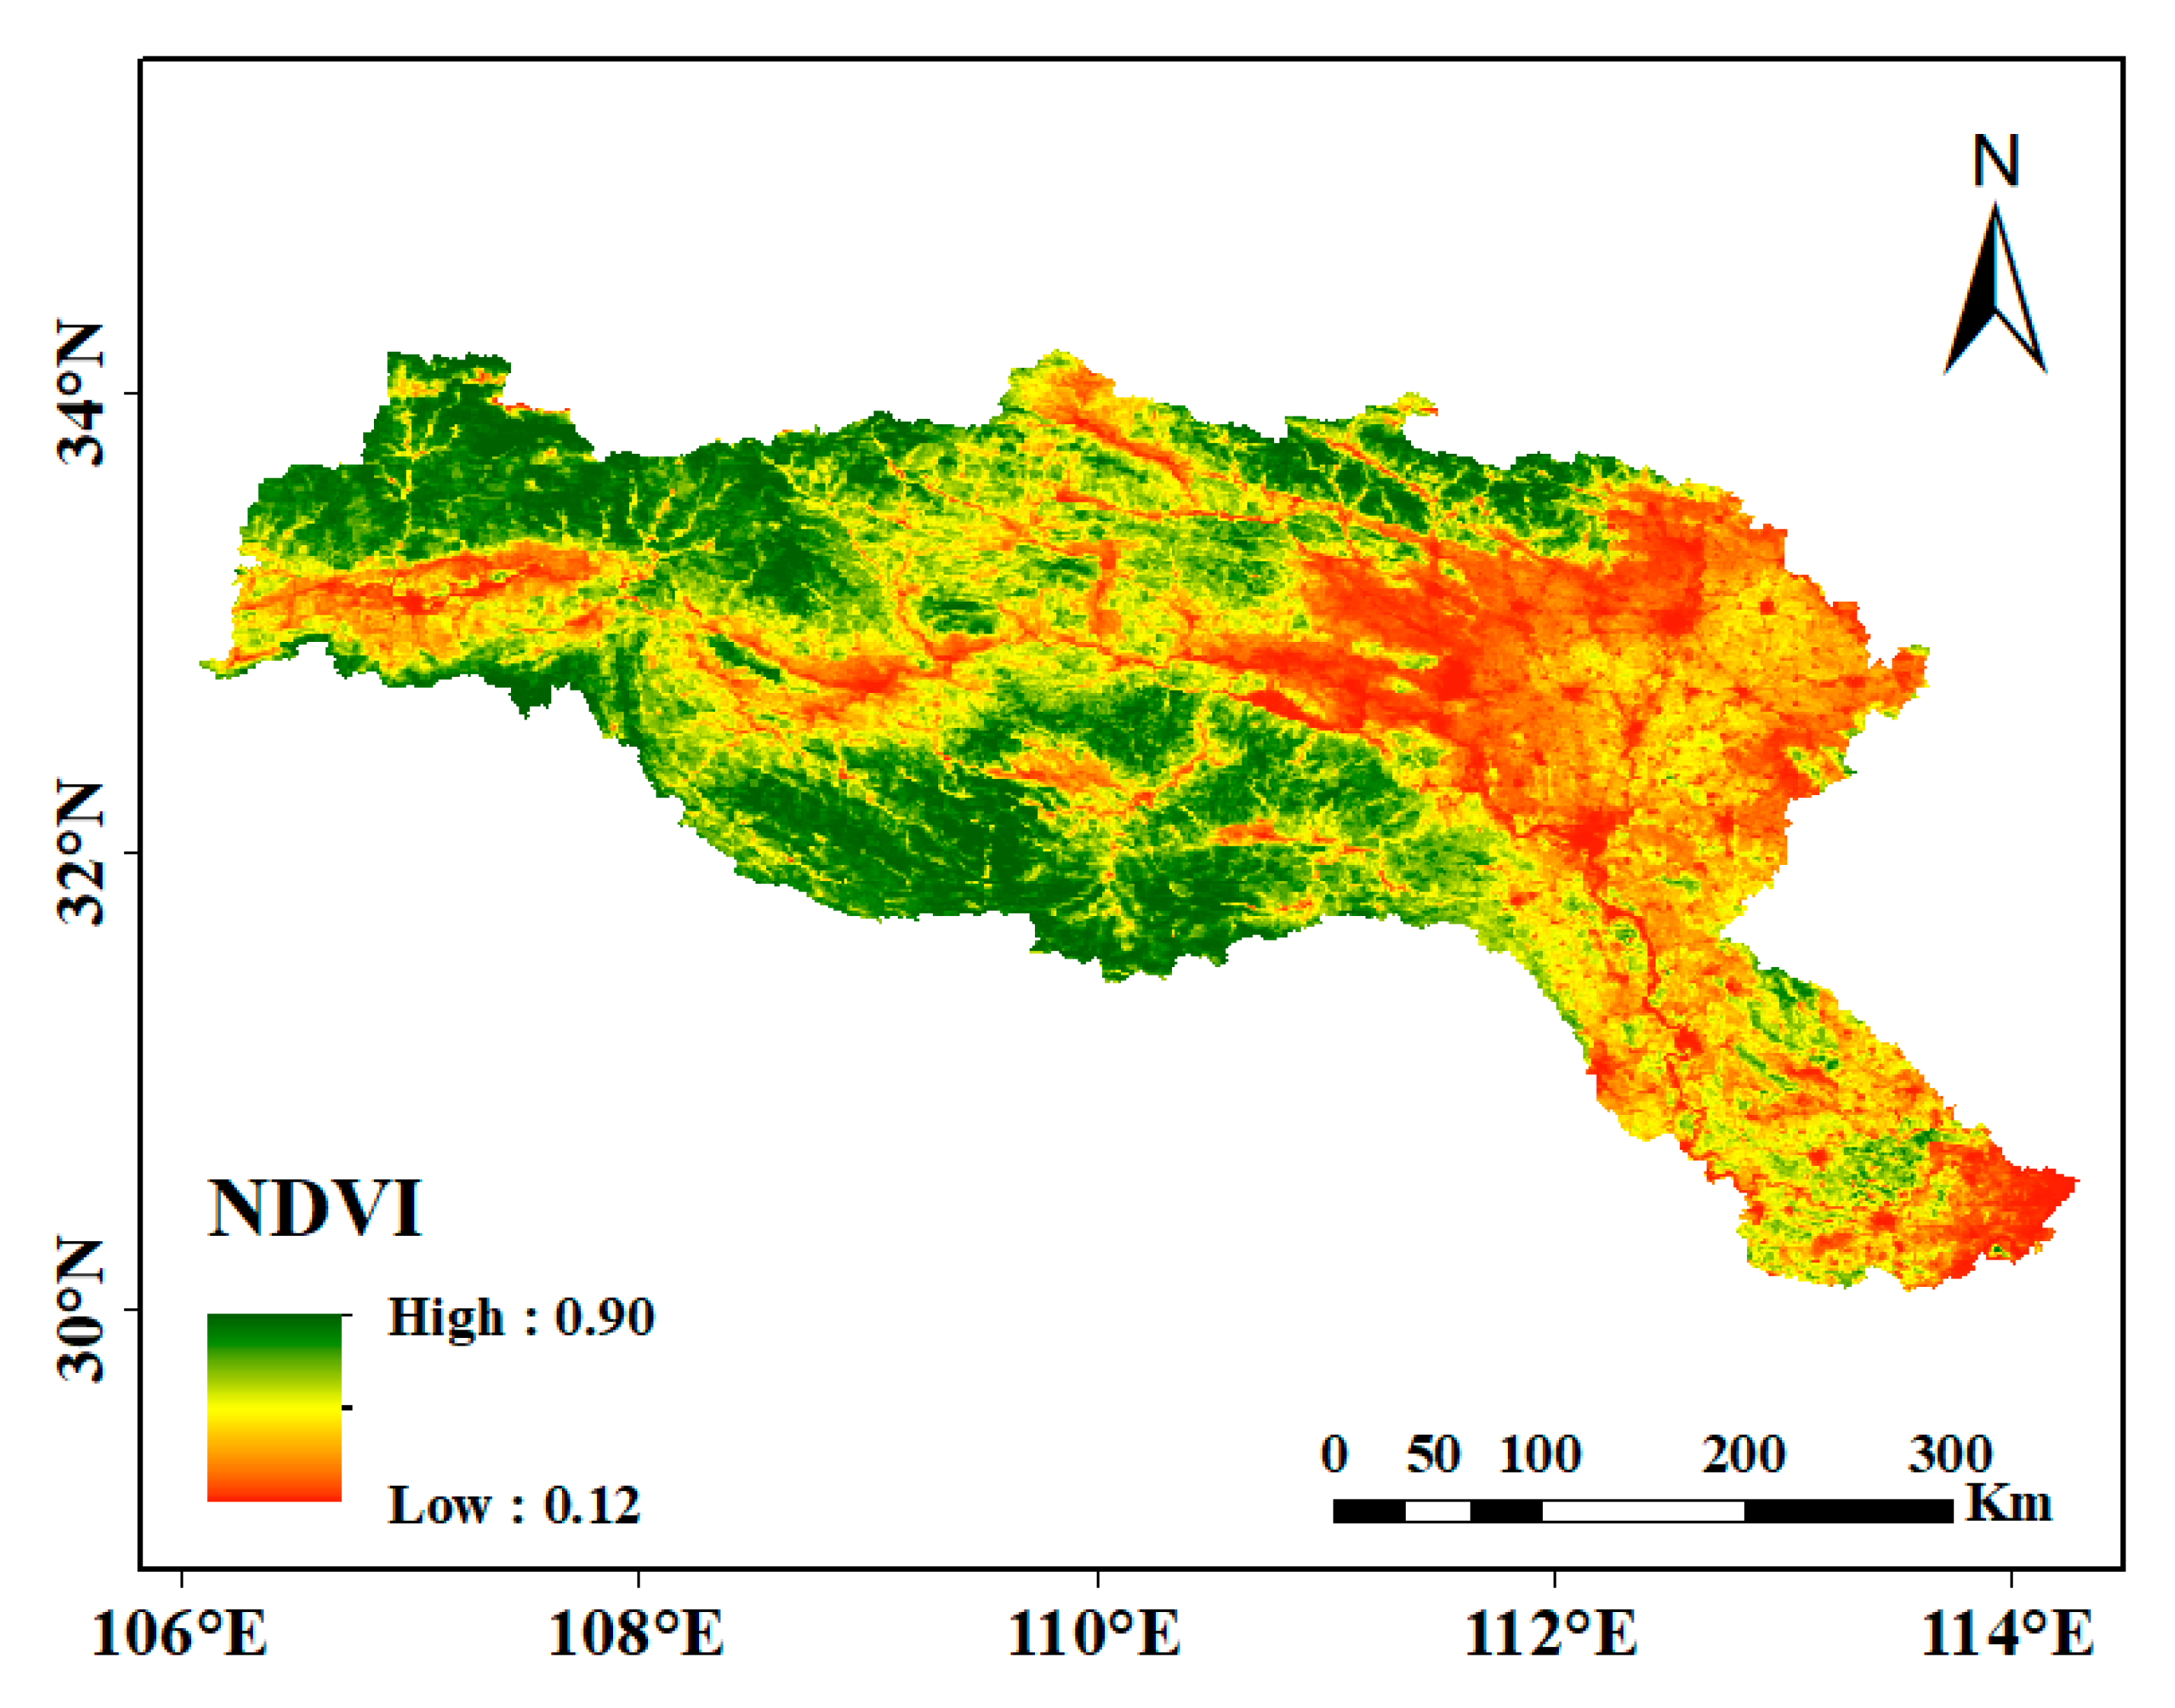
NDVI in the HJRB showed obvious spatial heterogeneity (Figure 3). The NDVI value was from 0.12 to 0.90, and the average was 0.80. NDVI was higher in the upstream area than in the downstream area. The distribution of NDVI values was generally consistent with the terrain distribution in the HJRB; there was a clear dividing line in NDVI values from upstream to downstream, and this divide was roughly consistent with a contour of 100 m (based on Figure 1). Overall, NDVI was high in the Qinba Mountains upstream of the HJRB but low in urban agglomeration regions on the Jianghan Plain.
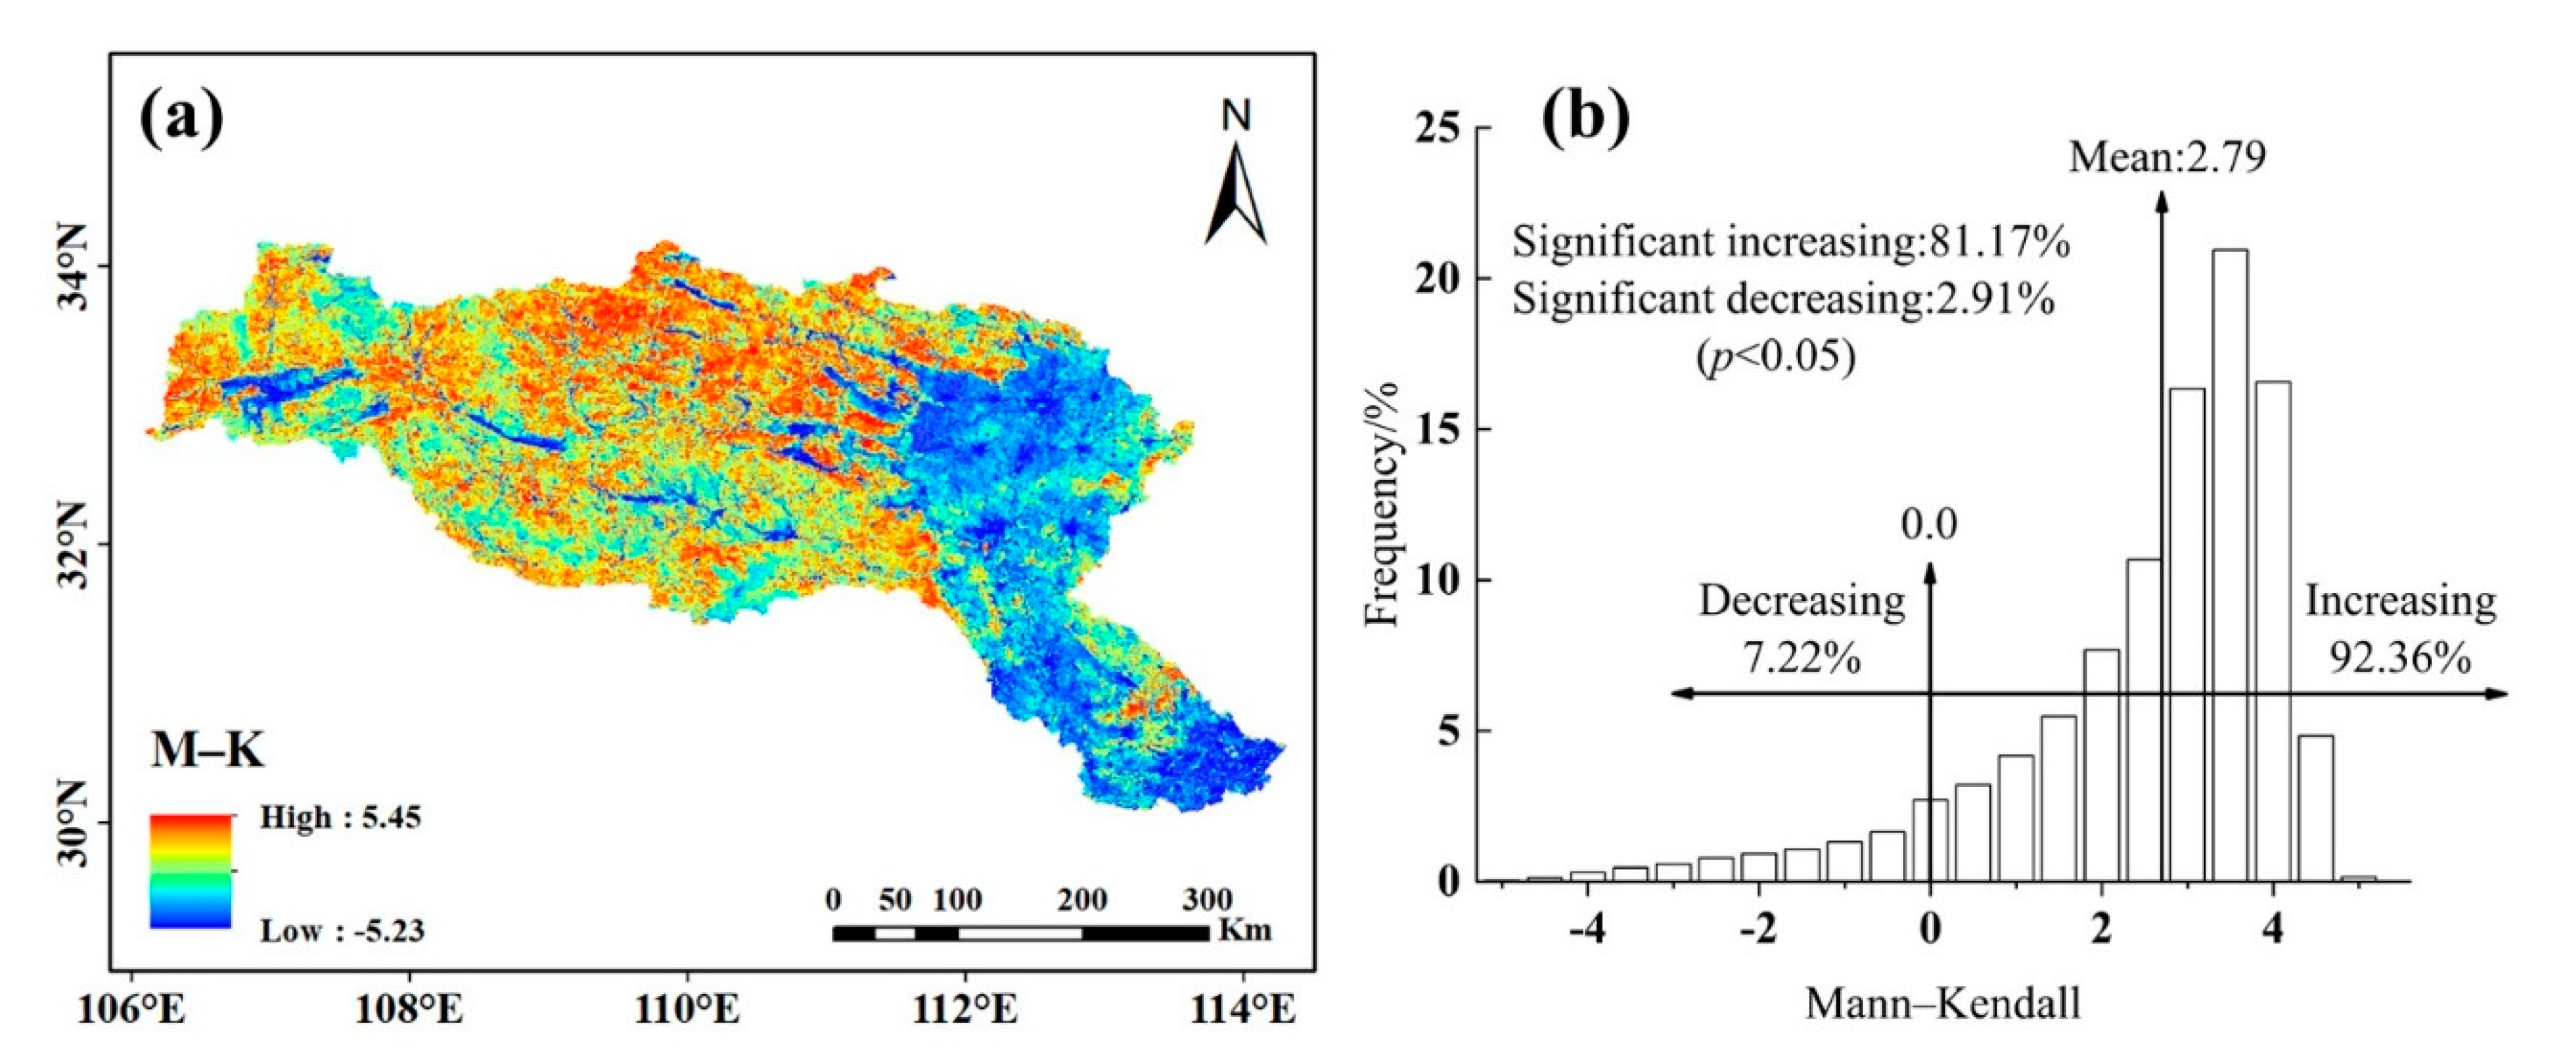
The temporal trends of NDVI in the HJRB from 2001 to 2018 were not evenly distributed in space (Figure 4a). Generally, the growth trend in the upper reach was greater than that in the lower reach. Regions with significant decreases in NDVI were mainly distributed in six cities or regions on the Jianghan Plain downstream of the HJRB, including Xiangfan, Jingmen, Xiaogan, Wuhan and the jurisdiction region in Hubei Province, and Nanyang in Henan Province. Such areas were also distributed in small parts of Hanzhong and Ankang in Shaanxi Province, Shangluo in Shaanxi Province, and Shiyan in Hubei Province. NDVI in the other regions mainly displayed significant growth. The distribution of the M-K results in the HJRB was consistent with that of NDVI (Figure 3 and Figure 4a). In the whole basin, the proportion of area with decreased NDVI was only 7.22%, and the proportion of area with increased NDVI was 92.36% (Figure 4b). In addition, the proportions that passed the significant increase and decrease tests were 2.91% and 81.17%, respectively (p < 0.05).
3.2. Influences of Different Factors on NDVI
Using the four modules of Geographical Detector, we analyzed the influence of a single factor, different factor ranges/types, the interaction influence of factors, and the difference of factors on NDVI, respectively.
3.2.1. Impacts of Single Factors
The influence of each factor was compared by calculating the PD values (Table 4). From 2001 to 2018, the order of the influence of a single factor on NDVI is follows: elevation > slope > vegetation type > land-use type > temperature > soil type > precipitation > sunshine duration > relative humidity > radiation > aspect.
As shown in Table 4, the value of the elevation was the largest (0.3889), which meant that the elevation factor accounted for an effect of more than 38% on the distribution of NDVI. Therefore, the most important factor that influenced the spatial distribution of vegetation cover was the elevation. Meanwhile, the corresponding values of the slope, vegetation type, and land-use type were 0.2734, 0.2475, and 0.2273, respectively, indicating that they all accounted for effects of more than 20% on the distribution of NDVI. It can be assumed that the slope, vegetation type, and land-use type also controlled the vegetation cover to some extent. The values of the temperature and soil type were 0.1653 and 0.1317, respectively, and their effects on the distribution of the vegetation cannot be ignored. The precipitation, sunshine duration, relative humidity, radiation, and aspect had little impact on the distribution of vegetation cover. However, the value only reflected the individual effect of each factor on the distribution of vegetation cover, and factors might have significant effects when combined with other factors.
3.2.2. Analysis of the Factor Ranges/Types Suitable for Vegetation Growth
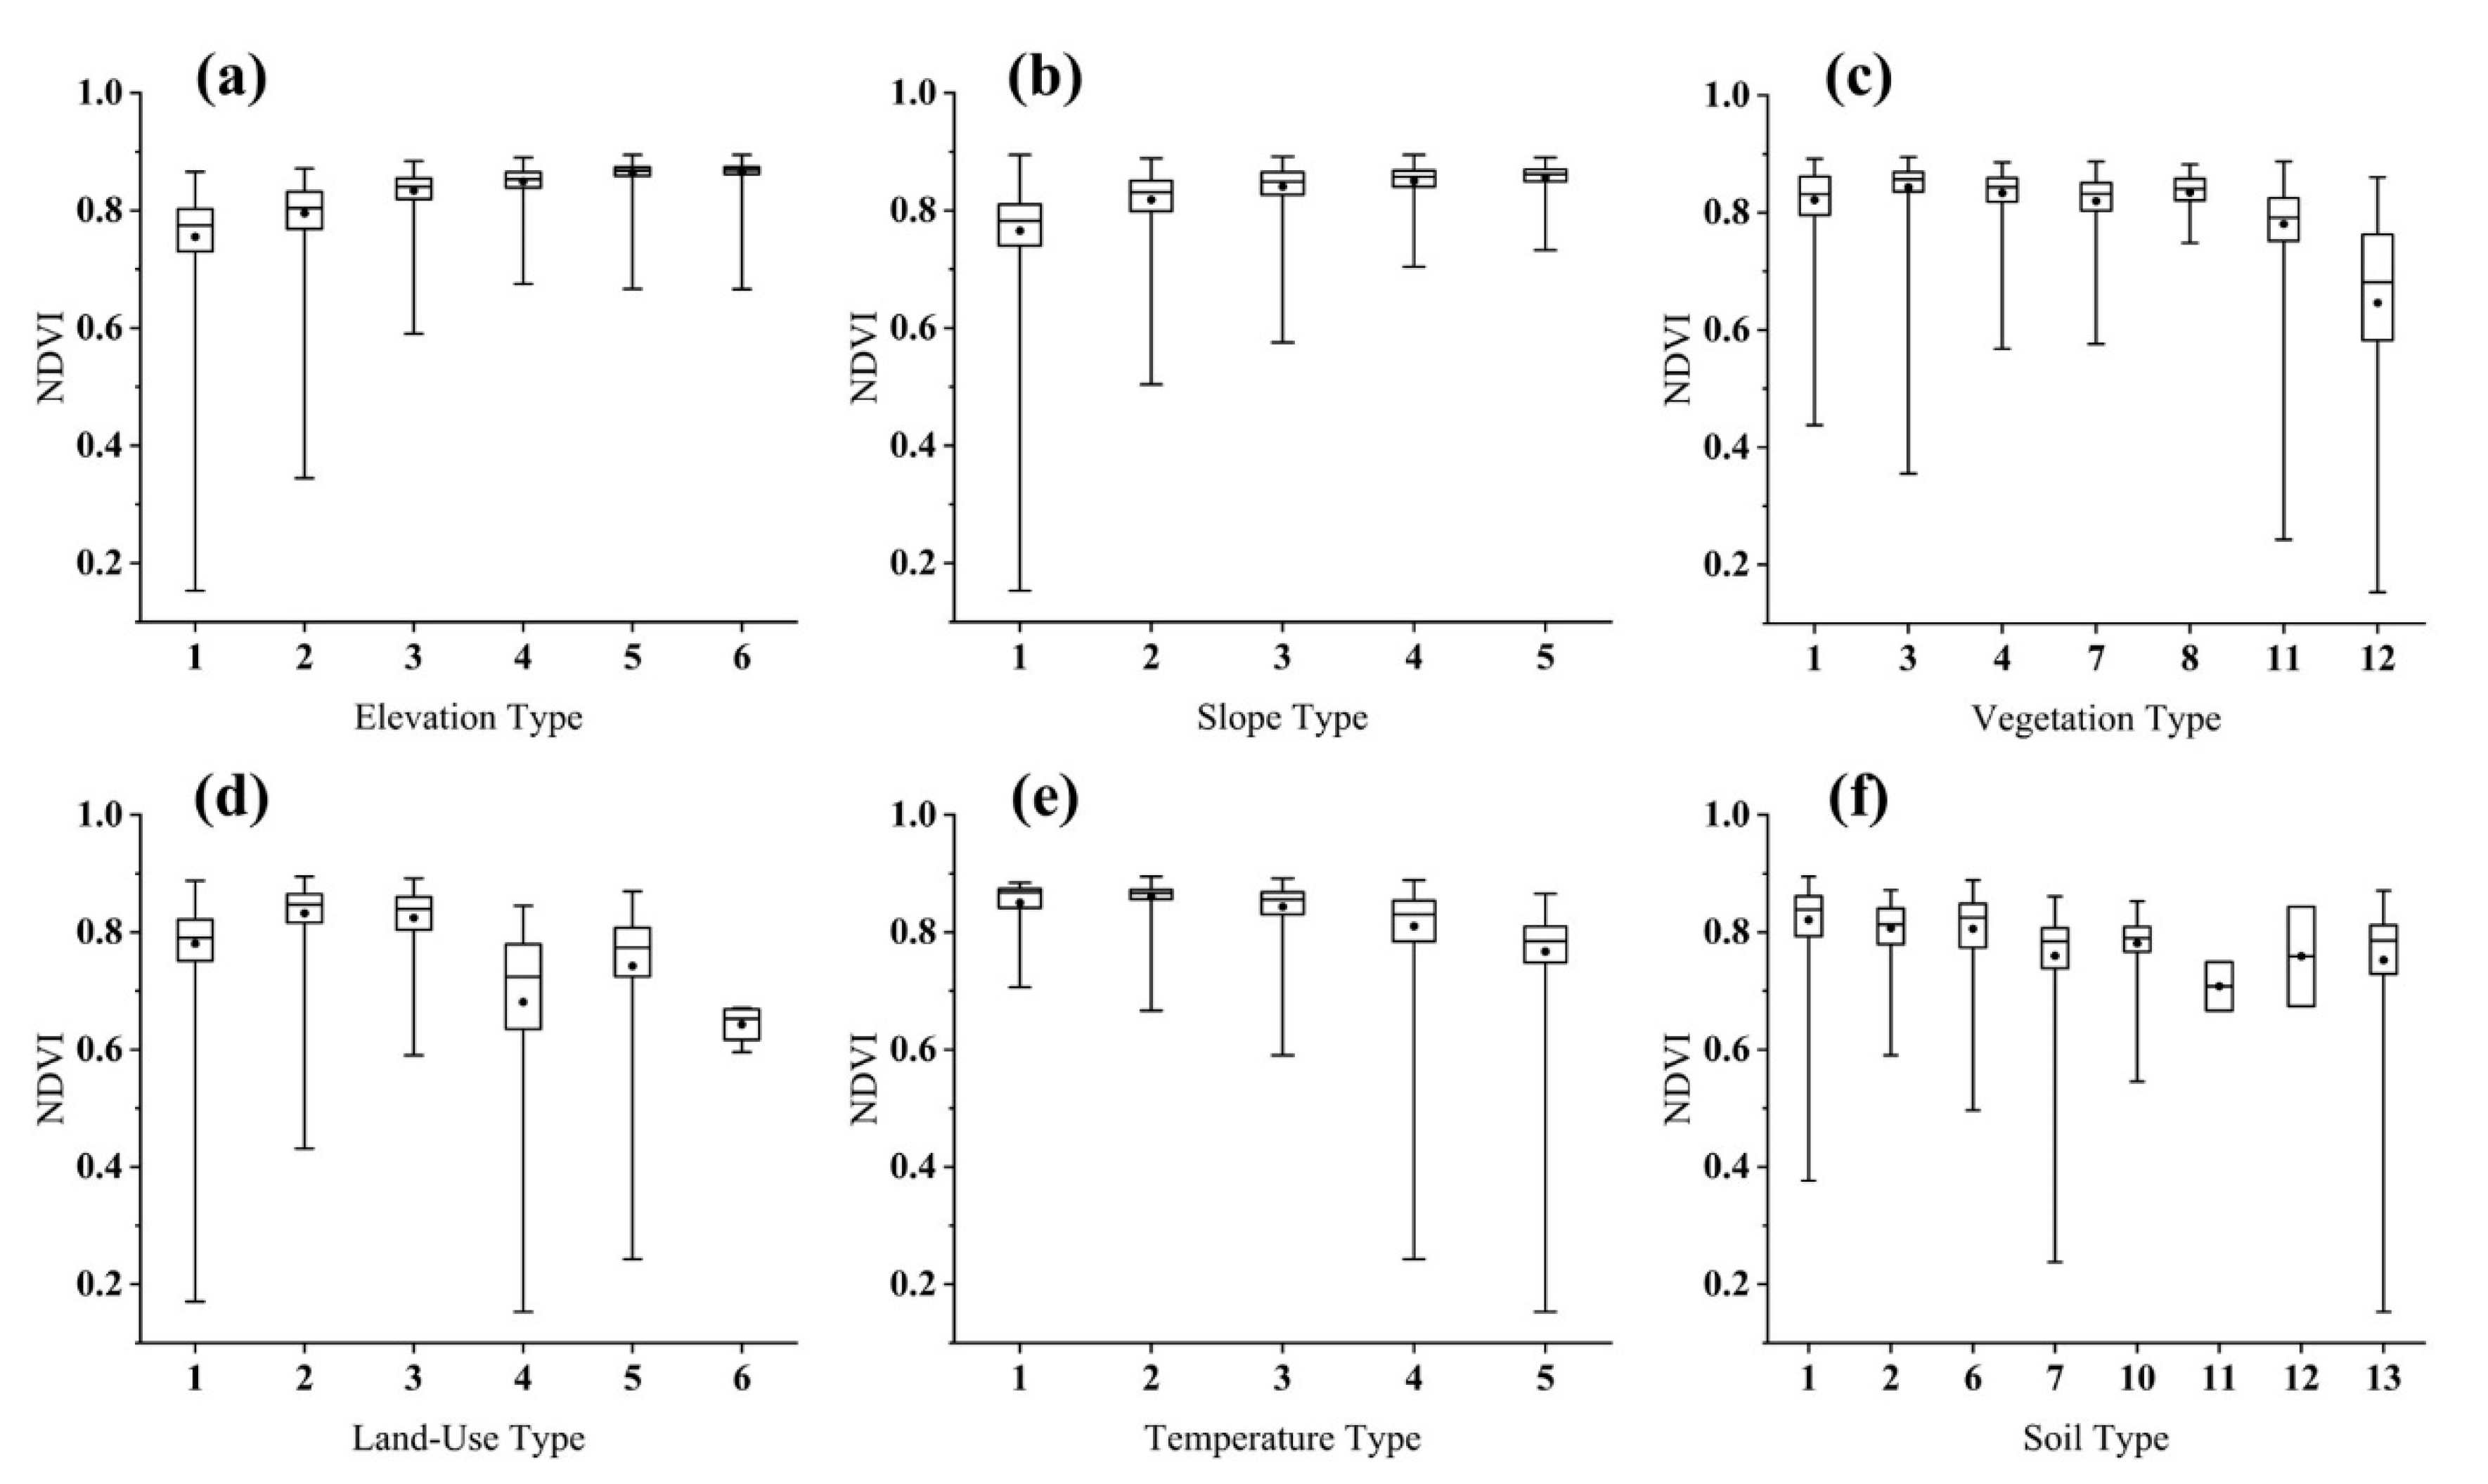
Based on the risk zone analysis of Geographic Detectors, the ranges/types of factors that were favorable or unfavorable for vegetation growth were analyzed. The larger the NDVI values corresponding to different ranges were, the more beneficial the factor ranges were to vegetation growth. The mean NDVI values corresponding to different factors and different ranges/types were significantly different. The factor ranges and types suitable for vegetation growth were examined based on a t-test at a 95% confidence level (Table 5). Additionally, we performed a specific analysis of factors with high influence (Figure 5 and Figure 6).
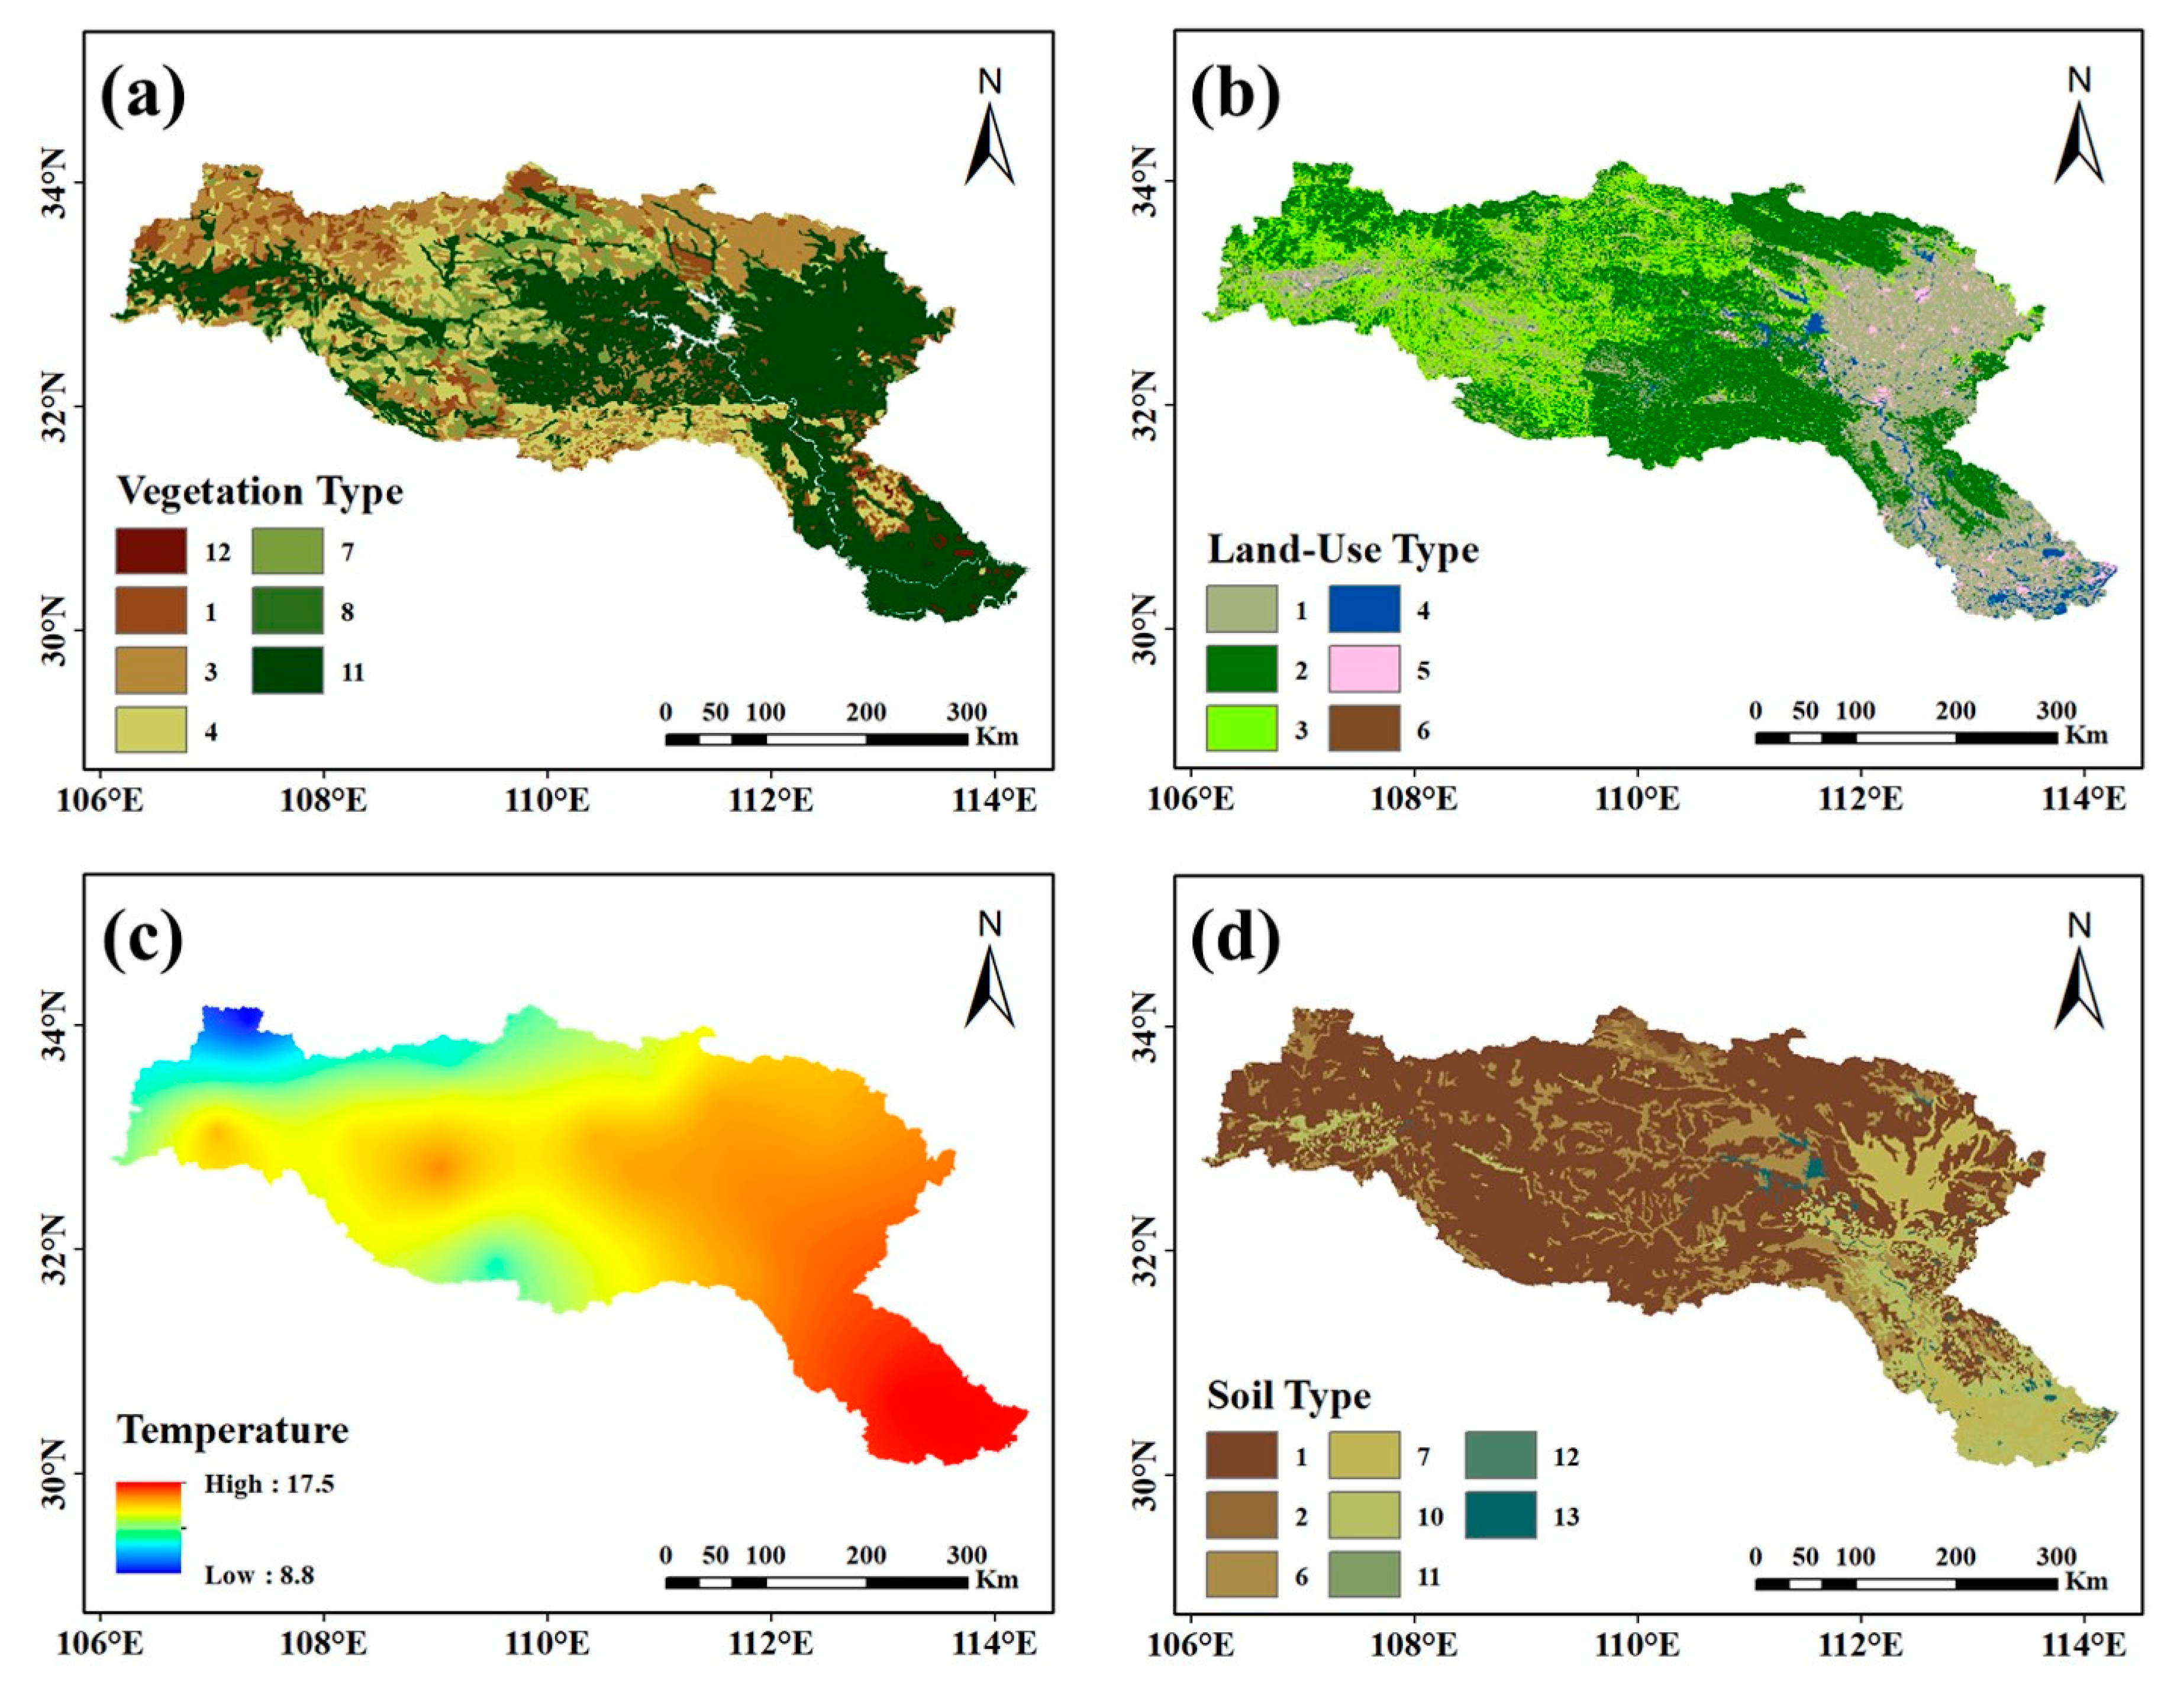
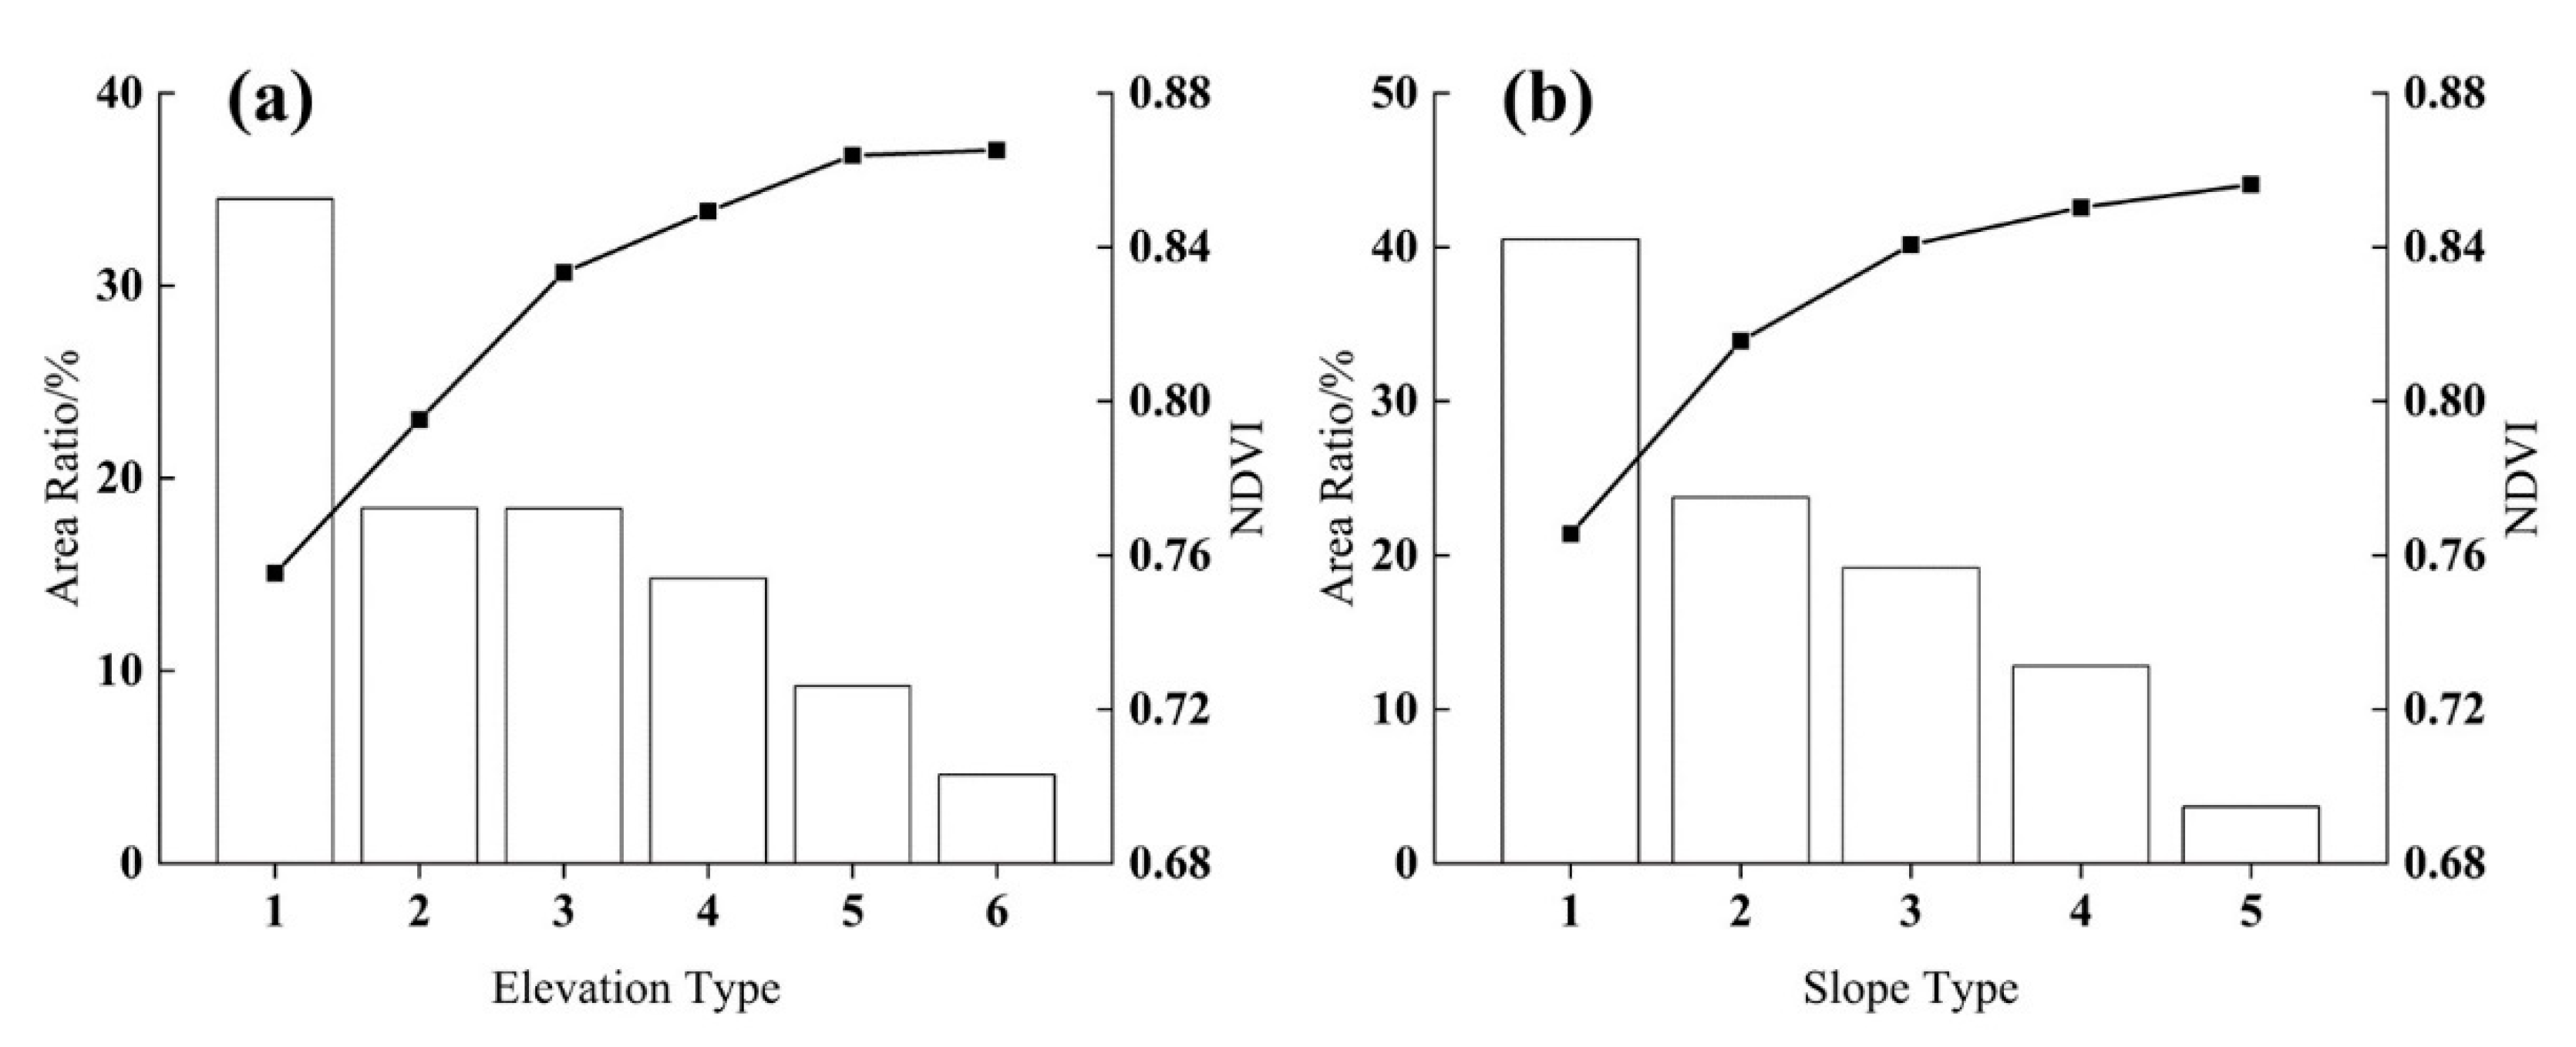
The average NDVI increased with increasing elevation and slope; the most suitable elevation range for vegetation growth was >1379 m, and the slope range most suitable for vegetation growth was >15.19° (Figure 5 and Figure 6). It can be assumed that mountains with high elevations and steep terrain are conducive to vegetation growth. Vegetation types with the highest NDVI were the broad-leaved forest and meadow. The broad-leaved forest mainly grew in the upper and northern parts of the middle reaches, and the meadow mainly grew in the middle reach. Among all land-use types, the NDVI value of the forest was the largest, reaching 0.83. The forests covered most areas above the middle reaches of the HJRB. The most suitable annual mean temperature for vegetation growth was approximately 10~12 °C. The NDVI value within this temperature range was over 0.8, and the maximum was approximately 0.9. Among the soil types in the HJRB, the proportion and the NDVI value of the leached soil were the largest.
3.2.3. Analysis of the Interactions among Factors
The interactions among factors that influence NDVI were assessed (Table 6), and the results were used to determine whether these interactions were strong or weak.
According to Table 6, the PD values became greater after interactions, indicating that vegetation growth was related to the synergistic interactions of multiple factors. The interaction of any factor and the elevation maximized the PD value, indicating that the elevation played the most important role on vegetation growth in the HJRB; this was consistent with the conclusion in Section 3.2.1. The PD value of the interaction between the elevation and precipitation was the largest at 0.4644, suggesting that the corresponding explanatory power for NDVI could reach more than 46% for this interaction. Although the precipitation had only about 7% explanatory power for NDVI, the PD value associated with the interaction between the precipitation and elevation exceeded the arithmetic sum of their respective PD values and was far greater than those interactions between any other two factors. Thus, it was concluded that precipitation also had a notable impact on NDVI, as mainly reflected in the interactions with other factors.
To determine the interactions among the factors, the PD value after the interaction was compared with the arithmetic sum of two individual PD values (Table 7). We used “>” to indicate that the interaction value was greater than the arithmetic sum and “<” to indicate the opposite.
There were two main interactions among the factors. One was called mutual enhancement; that is, the interaction was greater than the arithmetic sum. In contrast, the other was called nonlinear enhancement. The interactive effects between the precipitation, humidity, and aspect with most of the other factors were mutually enhanced; the interaction effects between the elevation and slope and most of other factors were nonlinearly enhanced; and the interaction effects between the remaining factors were variable. Among all the factors, only the total radiation displayed a mutual enhancement relationship when interacting with the other factors. This result indicated that total radiation also had an important effect on vegetation growth, and this effect was manifested in the interactions with the other factors.
3.2.4. Analysis of Different Effects among Factors on NDVI
Table 8 shows the results of ecological detection. We used “Y” and “N” to denote whether there was a significant difference between the effects of two factors on NDVI.
According to Table 8, except for the precipitation and temperature, there was little difference between the other climate factors on the impacts of NDVI. Except for the slope, there were significant differences between most variables and climate factors. The differences between the elevation and the other factors were consistent with those for the slope. The slope was only significantly different from the vegetation type, soil type, and land-use type. Meanwhile, the difference between the vegetation type and soil type or between the vegetation type and land-use type was not significant. However, there was a significant difference between the soil type and land-use type on NDVI.
3.3. Factors Leading to NDVI Changes
3.3.1. Effects of Climate Change on NDVI
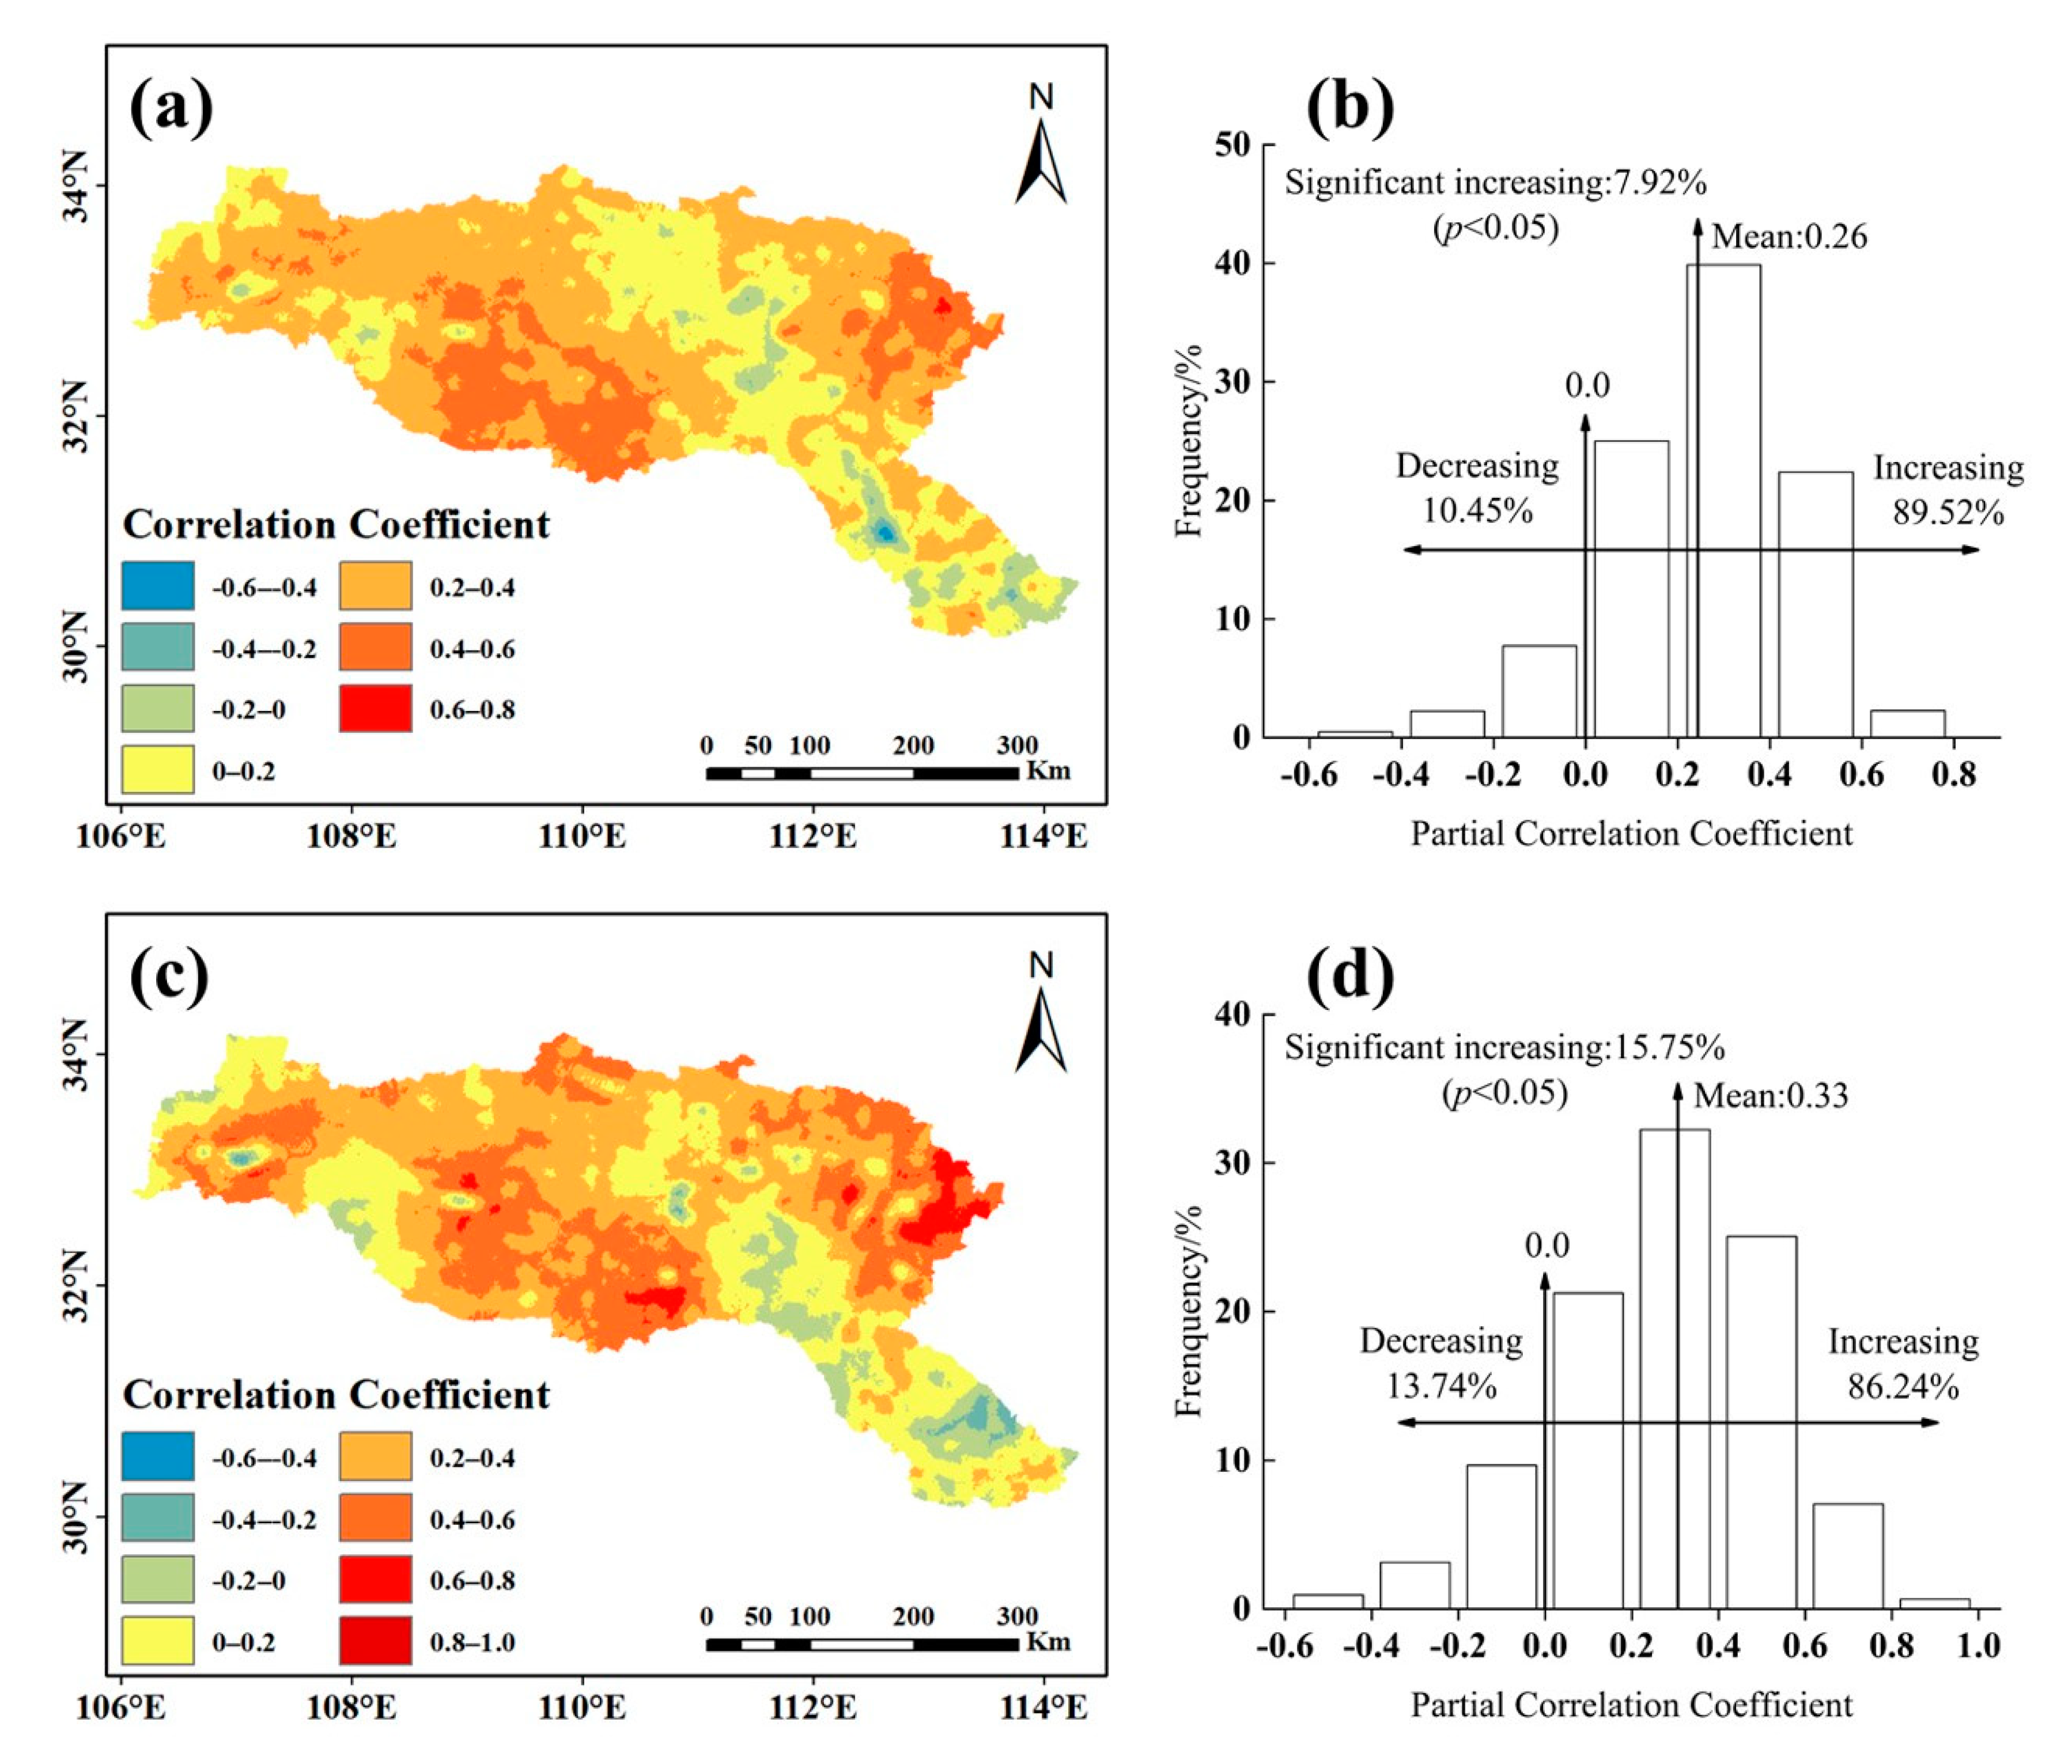
In this paper, the precipitation and temperature were selected as the main impact factors to reflect the influence of climate change on NDVI. Using partial correlation analysis, the relationships between NDVI and the precipitation and temperature in the HJRB were analyzed (Figure 7). The partial correlation coefficients between NDVI and the precipitation were between −0.50 and 0.64, with an average value of 0.26 from 2001 to 2018. The proportion of the area that passed the 95% significant increase test was 7.92%. The partial correlation coefficients between NDVI and the temperature were between −0.41 and 0.81, with an average value of 0.33. The proportion of the area that passed the 95% significant increase test was 15.75%. In general, NDVI was positively correlated with the precipitation and temperature in the HJRB. The regions where NDVI negatively correlated with the precipitation and temperature were distributed in the middle and lower reaches, but they failed to pass the significance test at 95%. Therefore, it could be assumed that NDVI in these regions had nothing to do with climate change and might be affected by other factors.
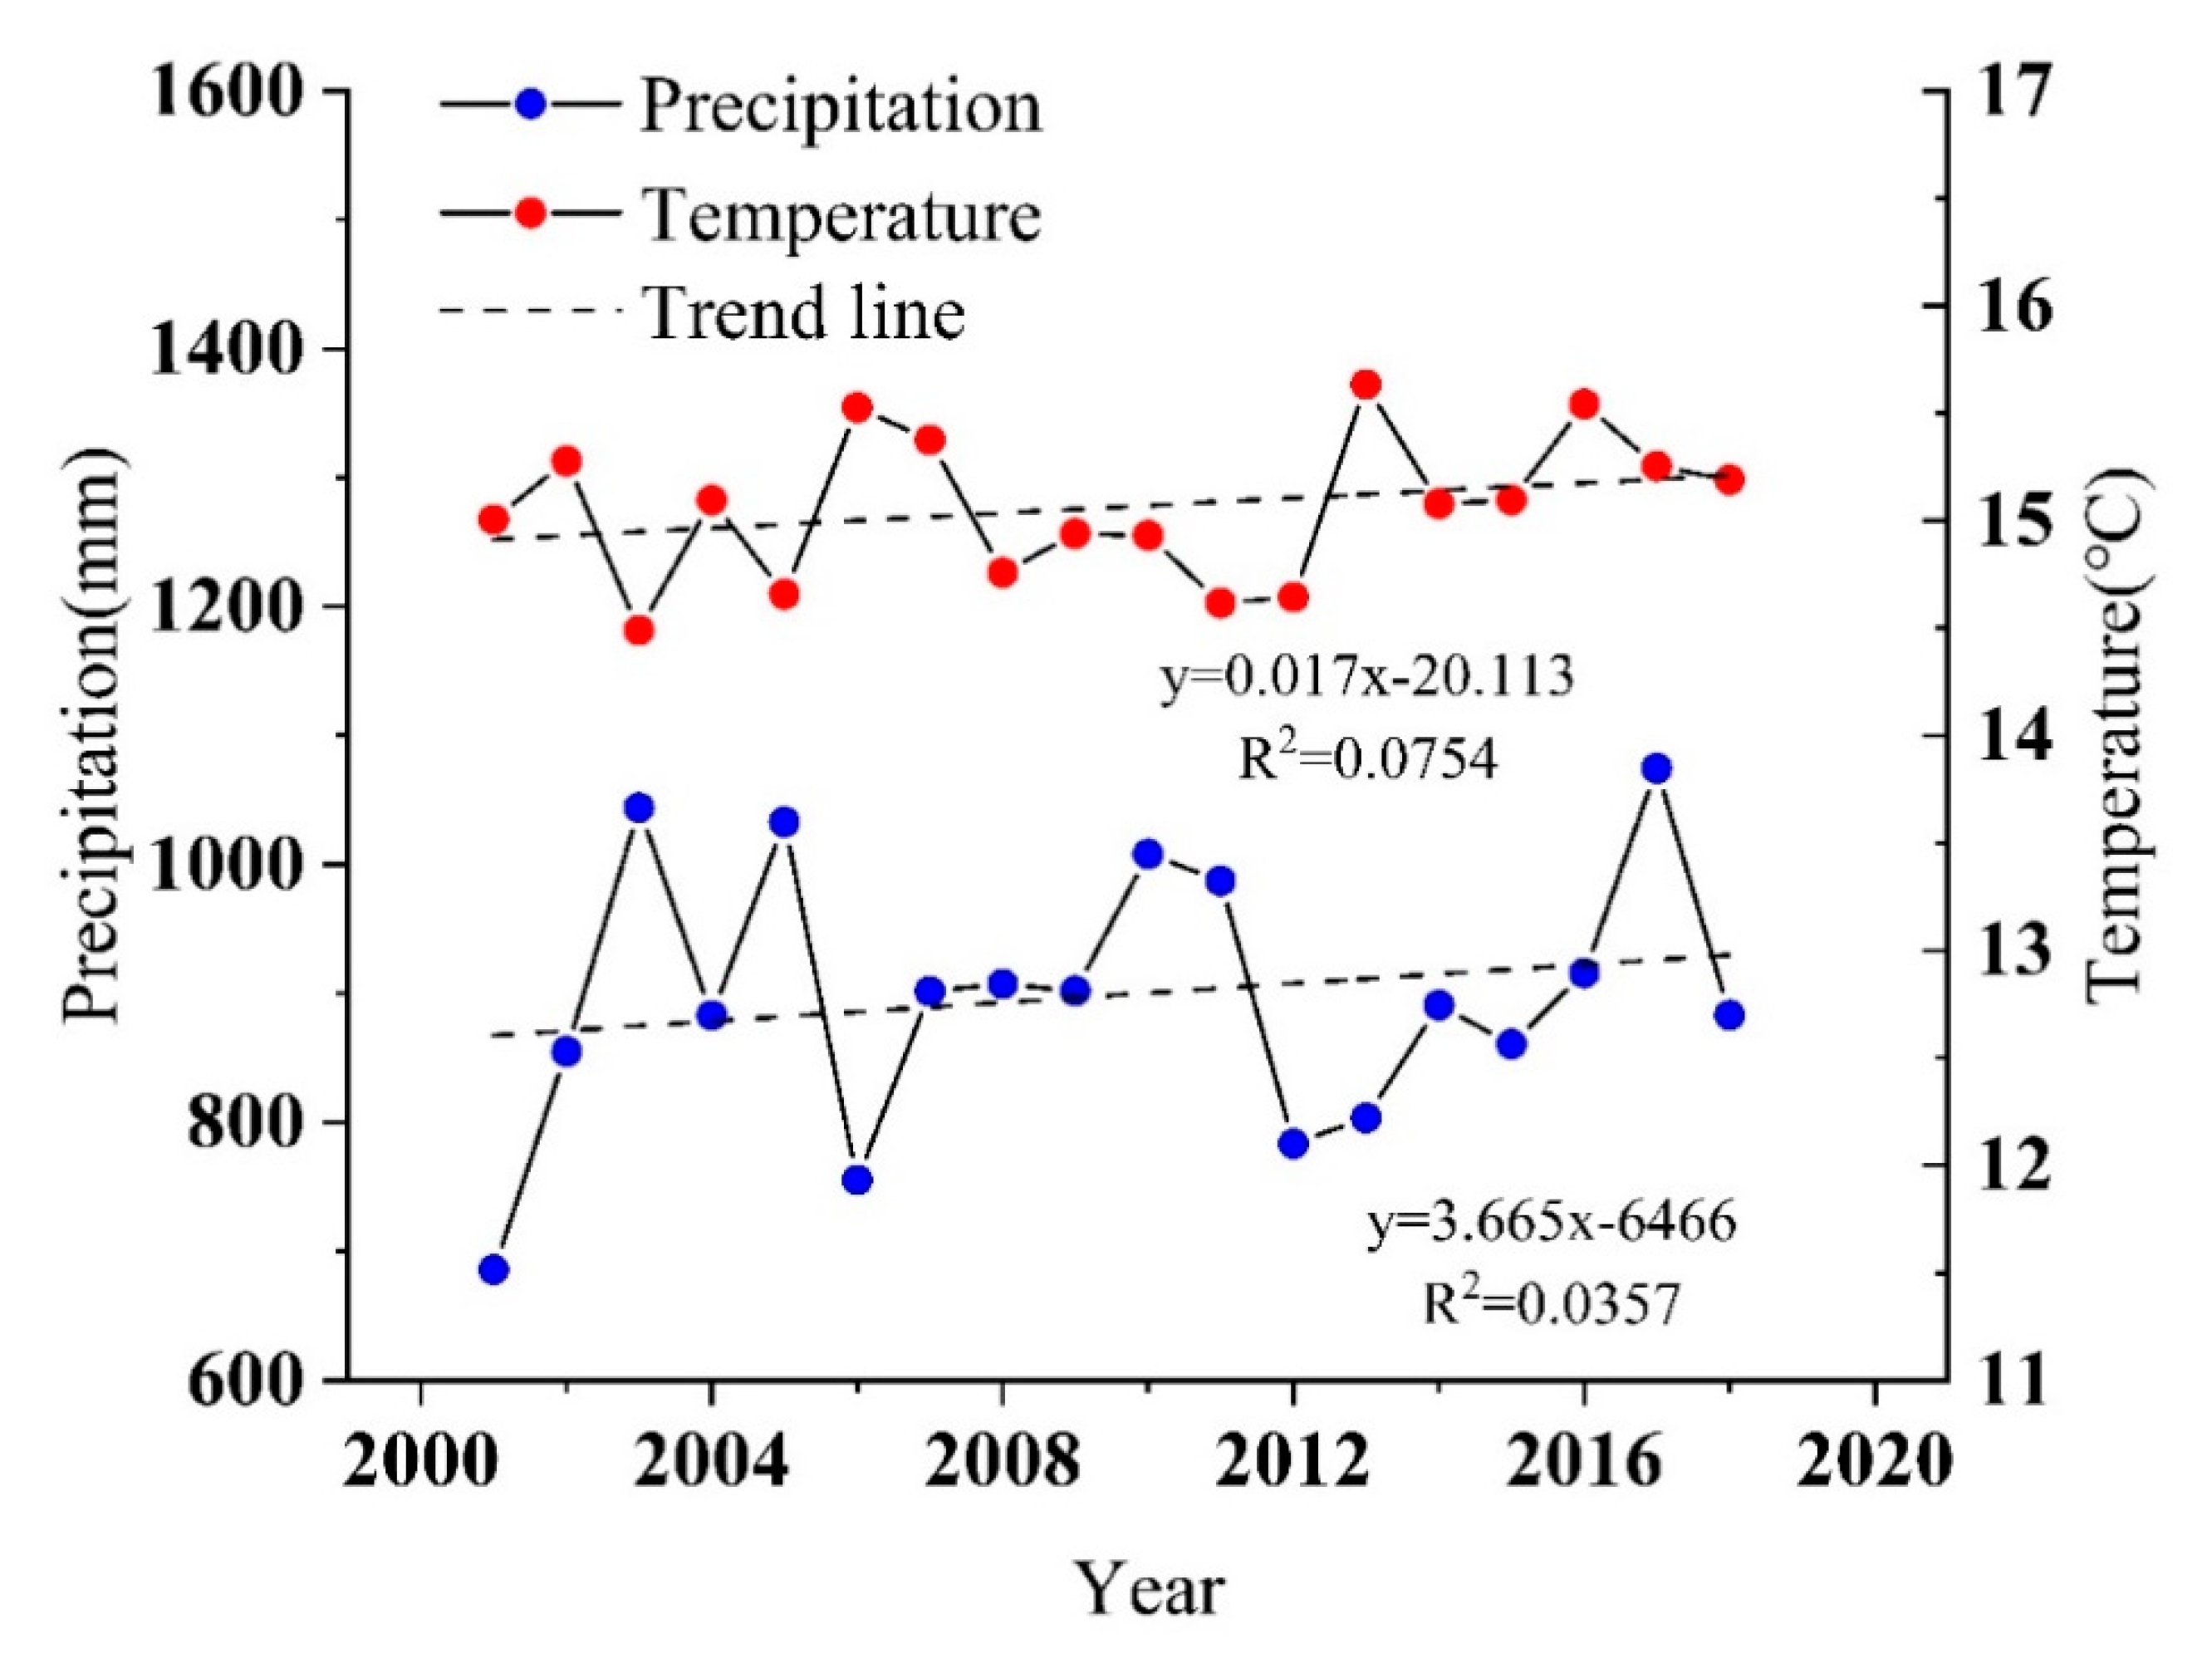
By analyzing the trends of the precipitation and temperature from 2001 to 2018 (Figure 8), it was found that both the precipitation and temperature in the HJRB exhibited an increasing trend, and the change rates of the precipitation and temperature were 3.665 mm/year and 0.017 °C/year, respectively. Therefore, the climatic trends in the HJRB were warming and wetting. Combined with the results of Geographical Detector, the temperature had a greater impact on NDVI compared with the precipitation. Although the precipitation had a certain impact on the change in NDVI, climate warming was the main reason driving the growth of vegetation.
3.3.2. Effects of Human Activities on NDVI
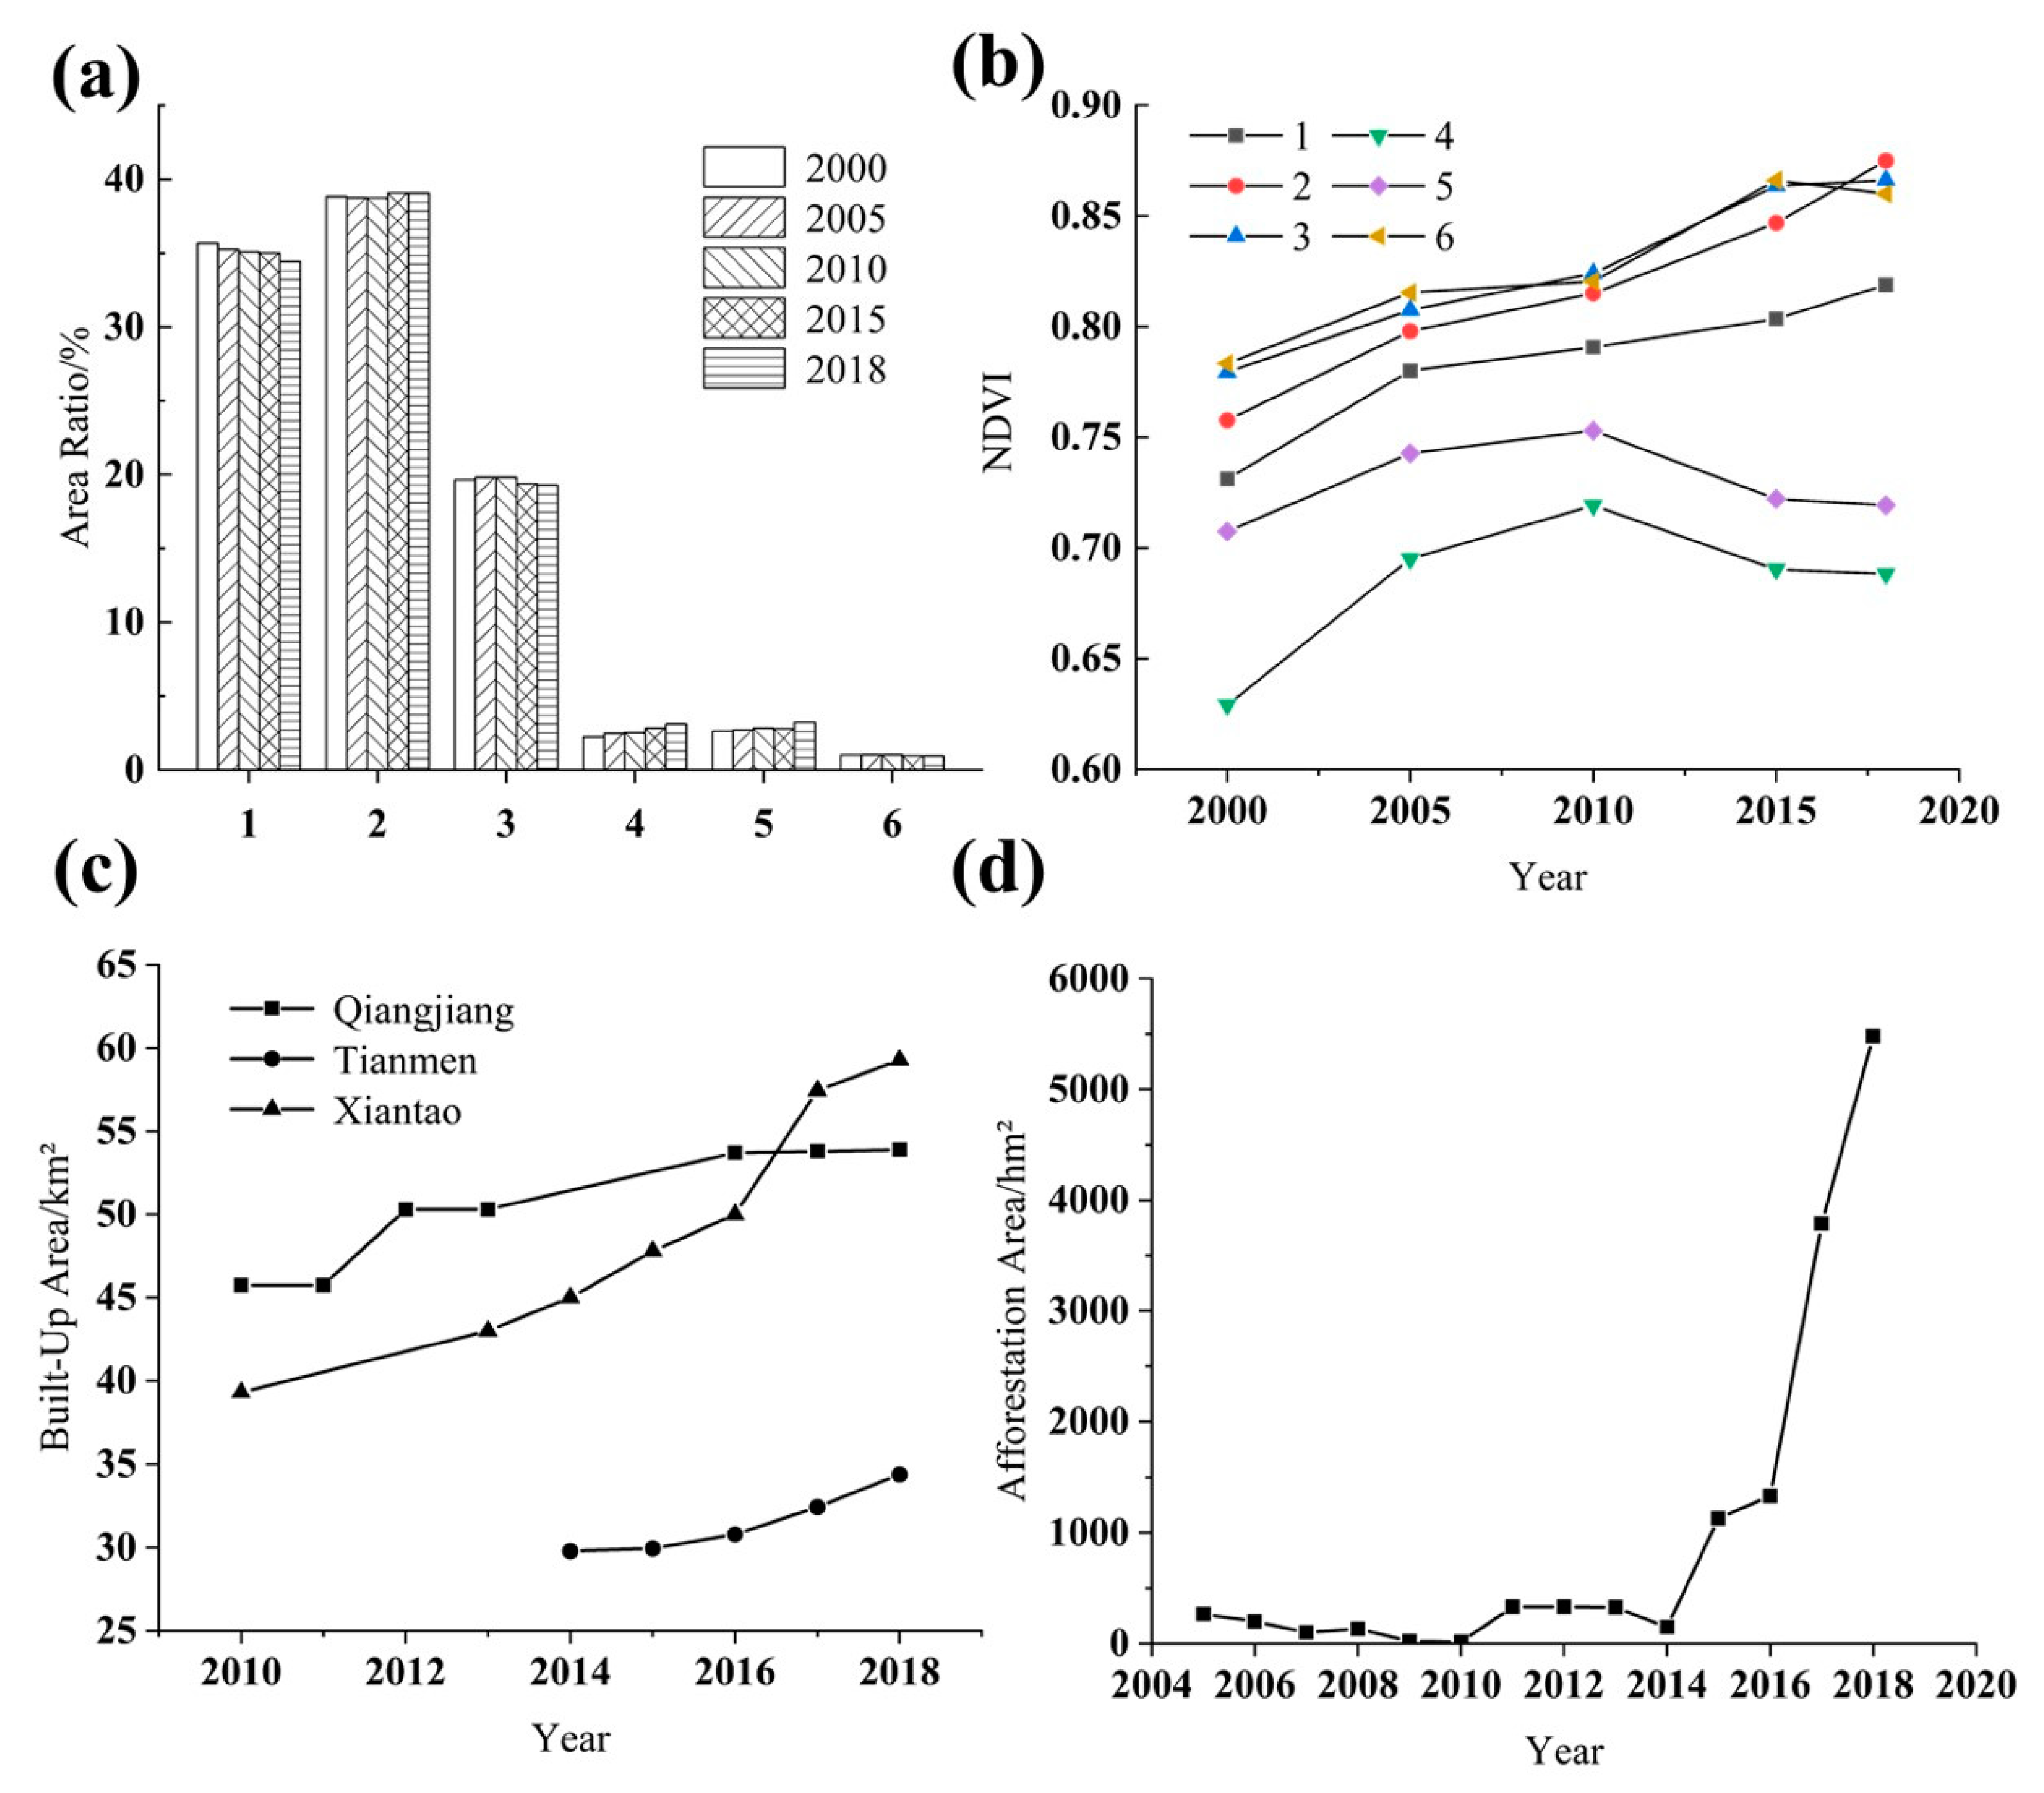
There were some changes in land use in the HJRB from 2000 to 2018 (Figure 9). The cultivated land area reduced by about 4.5%; the forest area, water area, urban area, and industrial land area increased to certain extents, and the grassland area slightly decreased. In general, the land-use types in the HJRB did not change much. According to Figure 9b, the NDVI values of the cultivated land, forest, grassland, and unused land all increased, but the NDVI values of the water area and the urban and industrial land areas had decreased since 2010. The lower reaches of the HJRB are mainly urban areas, and the main cities are Qianjiang, Tianmen, and Xiantao. The built-up area of cities generally increased since 2010 (Figure 9c). This indicates that the urban expansion leads to the decrease of NDVI. As key ecological protection areas, national and local governments have implemented various ecological restoration projects in upstream of the HJRB. Taking the Shennongjia Region as an example (Figure 9d), under the leadership of the local government, projects such as afforestation and returning farmland to forest were actively implemented. Since 2005, the cumulative area of afforestation has reached 130 km2. Moreover, the area of afforestation has accelerated since 2014, and by 2018, the area of afforestation in the area reached 1333 hectares. In combination with Figure 4, NDVI growth was obvious in some areas of Shennongjia. This indicates that afforestation has a positive effect on NDVI. It can be concluded that human activities will affect vegetation cover in two directions: destruction and restoration.
4. Discussion
Using Geographical Detector, we analyzed the most suitable ranges/types of factors for vegetation growth. This is significant to the local vegetation restoration. Among the factors, the effect of topography on NDVI seemed to be to be slightly counterintuitive. Therefore, it is necessary to discuss the reasons for this phenomenon. At the same time, we also discussed how to restore vegetation cover and put forward some suggestions.
4.1. The Impact of Topography on NDVI
According to our research, the elevation and slope had very important influences on the distribution of NDVI in the HJRB. NDVI increased obviously with the increase of elevation and slope (Figure 10).
Although the mountainous areas with high terrain and large slopes were not abundant in the entire area, the corresponding NDVI values were the largest. By combining these results with those in Figure 6a, we found that the vegetation types in the upstream mountainous areas were relatively abundant. The vegetation types in the downstream plain were simple and mainly cultivated plants. According to previous studies, cultivated plants in the lower reaches of the HJRB mainly mature in May–June and September–October [32,58]. Harvesting of cultivated plants can cause a sudden drop in NDVI. As the elevation and slope increase, the amount of cultivated plants gradually decreases. NDVI will increase accordingly. Changes of NDVI in Guizhou Region [28] and Poyang Lake Basin [59] with topography are similar to those in the HJRB. However this is not a universal rule in China. According to the study of Meng [20], the terrain does not have a positive effect on NDVI in Mongolia because of the cold climate. Fu’s [60] study indicated that NDVI increased with elevation when elevation was less than 3700 m, and NDVI decreased when elevation exceeded 4700 m. It can be seen that the impact of topography on vegetation cover is often related to climatic conditions and human activities. The hydrothermal conditions are sufficient in the HJRB [33], and the altitude here is not enough to make the climatic conditions at the top of the mountain differ greatly from those in the downstream. The downstream human activities have a more significant impact on vegetation cover. Therefore, the less human activity, the higher NDVI upstream.
4.2. Suggestions for Vegetation Restoration
Urban expansion will destroy vegetation cover in urban areas [61,62]. Therefore, it is urgent to balance urban development and vegetation cover. Zhang et al. [63] suggested that the government should delineate the boundaries of urban expansion. Song et al. [64] found that new city urban spaces, such as forest parks, city parks, and community parks, may greatly improve vegetation coverage in Shenzhen, and this can be referenced by other cities.
Afforestation seems to be one of the most common measures for watershed vegetation restoration. However, it is worth noting that excessive afforestation will also have negative effects [65]. Many studies have found that afforestation may cause the decay of water storage [66,67,68]. The impact of vegetation on water resources deserves more research. It should consider not only vegetation coverage or greening rate when restoring vegetation, but also local comprehensive benefits.
5. Conclusions
In this study, 11 factors that influence the distribution of NDVI changes were classified into five categories (climate, topography, vegetation, soil, and human activities). Using Geographical Detector, the individual and interactive influences of factors were quantified, and the ranges/types of factors suitable for NDVI were analyzed based on SPOT/VEGETATION NDVI data from 2001 to 2018 in the HJRB. In addition, this research studied the main causes leading to NDVI change and discussed how topography, climate change, and human activities affect the spatiotemporal changes in vegetation coverage.
NDVI in the HJRB increased with a rate of 0.0046 year−1 from 2001 to 2018, and increased rapidly from 2001 to 2002 and from 2011 to 2013, with a growth rate of more than 3%. Regions with significant increases in NDVI accounted for 81.17% (p < 0.05). Regions with significant decreases in NDVI were mainly distributed in the downstream portion of the HJRB.
NDVI in the HJRB was not uniformly distributed in space. Vegetation types were rich in middle and upper reaches of the HJRB and poor in lower reaches. The main natural factors that influenced the spatial distribution of NDVI were the elevation and slope. The precipitation, humidity, and aspect were more likely to cause mutual enhancement, and the elevation and slope were more likely to cause nonlinear enhancement when interacting with other the factors. For the HJRB, the ranges of the elevation, slope, and temperature suitable for vegetation growth were >1379 km, >15.19°, and 10 to 12 °C. The vegetation type, land-use type, and soil type with the largest NDVI value were the broad-leaved forest and meadow, forest, and leached soil, respectively.
Climate change and human activities were the main factors that influenced temporal variations in NDVI in the HJRB. Precipitation and temperature changed with rates of 3.665 mm/year and 0.017 °C/year from 2001 to 2018. Precipitation and temperature were positively correlated with NDVI in most regions. This suggests that NDVI will increase under the warming and wetting climate. Through the investigation of land-use type changes in the HJRB, we found that NDVI increased in most regions but decreased in urban areas. This finding suggests that human activities can destroy vegetation cover to some extent.
Finally, this research discussed the impacts of topography in detail. The higher NDVI values in the upstream region were due to favorable climatic conditions and less human activities. At the same time, some suggestions of vegetation restoration were put forward.
In this research, the influences of natural and human factors on the spatiotemporal variations in NDVI were quantitatively analyzed to provide reasonable support for vegetation restoration according to local conditions in the future. However, this paper considered only the land use to represent the impact of human activities on NDVI and did not specifically consider the impact of urbanization. This issue requires further research in the future. Moreover, the influence of vegetation changes on local climate cannot be ignored, and research on this factor in the HJRB remains to be performed.
Supplementary Materials
The following are available online at https://0-www-mdpi-com.brum.beds.ac.uk/2072-4292/12/22/3780/s1, Figure S1: Flow chart of the methodology implemented in the study.
Author Contributions
The authors’ contributions to this article are as follows: conceptualization, T.C. and L.Z.; methodology, L.Z.; software, T.C.; validation, T.C., L.Z., and S.H.; formal analysis, S.H.; investigation, T.C.; resources, J.X.; data curation, T.C.; writing—original draft preparation, T.C.; writing—review and editing, L.Z.; visualization, T.C.; supervision, J.X.; project administration, J.X.; funding acquisition, J.X. All authors have read and agreed to the published version of the manuscript.
Funding
This research was funded by the National Natural Science Foundation of China (No. 41890822) and the Strategic Priority Research Program of the Chinese Academy of Sciences (Grant No. XDA23040304) and the Geology and Mineral Resources Survey Project: Ecological Configuration and Global Strategy of China Water Resources (DD20190652).
Acknowledgments
The authors gratefully acknowledge Wuhan University and the Institute of Geographic Sciences and Natural Resources Research, CAS, for the support provided.
Conflicts of Interest
The authors declare no conflict of interest.
References
- Gong, Z.; Zhao, S.; Gu, J. Correlation analysis between vegetation coverage and climate drought conditions in North China during 2001–2013. J. Geogr. Sci. 2017, 27, 143–160. [Google Scholar] [CrossRef]
- Zhao, J.; Du, Z.; Wu, Z.; Zhang, H.; Guo, N.; Ma, Z.; Liu, X. Seasonal variations of day- and nighttime warming and their effects on vegetation dynamics in China’s temperate zone. Acta Geogr. Sin. 2018, 73, 395–404. [Google Scholar]
- Godinez-Alvarez, H.; Herrick, J.E.; Mattocks, M.; Toledo, D.; Van Zee, J. Comparison of three vegetation monitoring methods: Their relative utility for ecological assessment and monitoring. Ecol. Indic. 2009, 9, 1001–1008. [Google Scholar] [CrossRef]
- Hu, Y.; Dao, R.; Hu, Y. Vegetation Change and Driving Factors: Contribution Analysis in the Loess Plateau of China during 2000–2015. Sustainability 2019, 11, 1320. [Google Scholar] [CrossRef] [Green Version]
- Parmesan, C.; Yohe, G. A globally coherent fingerprint of climate change impacts across natural systems. Nature 2003, 421, 37–42. [Google Scholar] [CrossRef]
- De Keersmaecker, W.; Lhermitte, S.; Hill, M.J.; Tits, L.; Coppin, P.; Somers, B. Assessment of Regional Vegetation Response to Climate Anomalies: A Case Study for Australia Using GIMMS NDVI Time Series between 1982 and 2006. Remote Sens. 2017, 9, 34. [Google Scholar] [CrossRef] [Green Version]
- Liu, L.; Jing, X.; Wang, J.; Zhao, C. Analysis of the changes of vegetation coverage of western Beijing mountainous areas using remote sensing and GIS. Environ. Monit. Assess. 2009, 153, 339–349. [Google Scholar] [CrossRef]
- Peng, J.; Liu, Y.; Shen, H.; Han, Y.; Pan, Y. Vegetation coverage change and associated driving forces in mountain areas of Northwestern Yunnan, China using RS and GIS. Environ. Monit. Assess. 2012, 184, 4787–4798. [Google Scholar] [CrossRef]
- Adepoju, K.; Adelabu, S.; Fashae, O. Vegetation Response to Recent Trends in Climate and Landuse Dynamics in a Typical Humid and Dry Tropical Region under Global Change. Adv. Meteorol. 2019, 2019, 1–15. [Google Scholar] [CrossRef] [Green Version]
- de Jong, R.; de Bruin, S.; de Wit, A.; Schaepman, M.E.; Dent, D.L. Analysis of monotonic greening and browning trends from global NDVI time-series. Remote Sens. Environ. 2011, 115, 692–702. [Google Scholar] [CrossRef] [Green Version]
- Piao, S.; Nan, H.; Huntingford, C.; Ciais, P.; Friedlingstein, P.; Sitch, S.; Peng, S.; Ahlstrom, A.; Canadell, J.G.; Cong, N.; et al. Evidence for a weakening relationship between interannual temperature variability and northern vegetation activity. Nat. Commun. 2014, 5. [Google Scholar] [CrossRef] [Green Version]
- He, B.; Chen, A.; Jiang, W.; Chen, Z. The response of vegetation growth to shifts in trend of temperature in China. J. Geogr. Sci. 2017, 27, 801–816. [Google Scholar] [CrossRef]
- Pettorelli, N.; Vik, J.O.; Mysterud, A.; Gaillard, J.M.; Tucker, C.J.; Stenseth, N.C. Using the satellite-derived NDVI to assess ecological responses to environmental change. Trends Ecol. Evol. 2005, 20, 503–510. [Google Scholar] [CrossRef] [PubMed]
- Wang, J.; Wan, H.; Yao, S. Spatial and temporal response of vegetation cover to climate change in different zones of Sichuan-Shannxi area during growing seaon. Acta Ecol. Sin. 2019, 39, 5218–5231. [Google Scholar]
- Begue, A.; Vintrou, E.; Ruelland, D.; Claden, M.; Dessay, N. Can a 25-year trend in Soudano-Sahelian vegetation dynamics be interpreted in terms of land use change? A remote sensing approach. Glob. Environ. Chang. Human Policy 2011, 21, 413–420. [Google Scholar] [CrossRef]
- Bao, G.; Bao, Y.; Sanjjava, A.; Qin, Z.; Zhou, Y.; Xu, G. NDVI-indicated long-term vegetation dynamics in Mongolia and their response to climate change at biome scale. Int. J. Climatol. 2015, 35, 4293–4306. [Google Scholar] [CrossRef]
- Wen, Z.; Wu, S.; Chen, J.; Lu, M. NDVI indicated long-term interannual changes in vegetation activities and their responses to climatic and anthropogenic factors in the Three Gorges Reservoir Region, China. Sci. Total Environ. 2017, 574, 947–959. [Google Scholar] [CrossRef]
- Wan, H.; Wang, J. Study of dynamic pattern evolution of drought and its correlation with vegetation cover in Baoji area on multi-scale. Acta Ecol. Sin. 2018, 38, 6941–6952. [Google Scholar]
- Peng, W.; Kuang, T.; Tao, S. Quantifying influences of natural factors on vegetation NDVI changes based on geographical detector in Sichuan, western China. J. Clean. Prod. 2019, 233, 353–367. [Google Scholar] [CrossRef]
- Meng, X.; Gao, X.; Li, S.; Lei, J. Spatial and Temporal Characteristics of Vegetation NDVI Changes and the Driving Forces in Mongolia during 1982–2015. Remote Sens. 2020, 12, 603. [Google Scholar] [CrossRef] [Green Version]
- Ma, L.; Xia, H.; Meng, Q. Spatiotemporal Variability of Asymmetric Daytime and Night-Time Warming and Its Effects on Vegetation in the Yellow River Basin from 1982 to 2015. Sensors 2019, 19, 1832. [Google Scholar] [CrossRef] [Green Version]
- Liu, S.; Huang, S.; Xie, Y.; Wang, H.; Huang, Q.; Leng, G.; Li, P.; Wang, L. Spatial-temporal changes in vegetation cover in a typical semi-humid and semi-arid region in China: Changing patterns, causes and implications. Ecol. Indic. 2019, 98, 462–475. [Google Scholar] [CrossRef]
- Zhang, P.; Cai, Y.; Yang, W.; Yi, Y.; Yang, Z.; Fu, Q. Multiple spatio-temporal patterns of vegetation coverage and its relationship with climatic factors in a large dam-reservoir-river system. Ecol. Eng. 2019, 138, 188–199. [Google Scholar] [CrossRef]
- Fang, W.; Huang, S.; Huang, Q.; Huang, G.; Wang, H.; Leng, G.; Wang, L.; Guo, Y. Probabilistic assessment of remote sensing-based terrestrial vegetation vulnerability to drought stress of the Loess Plateau in China. Remote Sens. Environ. 2019, 232. [Google Scholar] [CrossRef]
- Chen, J.; Luo, Y.; Xia, J.; Shi, Z.; Jiang, L.; Niu, S.; Zhou, X.; Cao, J. Differential responses of ecosystem respiration components to experimental warming in a meadow grassland on the Tibetan Plateau. Agric. For. Meteorol. 2016, 220, 21–29. [Google Scholar] [CrossRef] [Green Version]
- Wessels, K.J.; Prince, S.D.; Malherbe, J.; Small, J.; Frost, P.E.; VanZyl, D. Can human-induced land degradation be distinguished from the effects of rainfall variability? A case study in South Africa. J. Arid Environ. 2007, 68, 271–297. [Google Scholar] [CrossRef]
- Boschetti, M.; Nutini, F.; Brivio, P.A.; Bartholome, E.; Stroppiana, D.; Hoscilo, A. Identification of environmental anomaly hot spots in West Africa from time series of NDVI and rainfall. ISPRS J. Photogramm. Remote Sens. 2013, 78, 26–40. [Google Scholar] [CrossRef]
- Liu, L.; Zhan, C.; Hu, S.; Dong, Y. Vegetation change and its topographic effects in the karst mountainous areas of Guizhou and Guangxi. Geogr. Res. 2018, 37, 2433–2446. [Google Scholar] [CrossRef]
- Rojo, V.; Arzamendia, Y.; Perez, C.; Baldo, J.; Vila, B.L. Spatial and temporal variation of the vegetation of the semiarid Puna in a pastoral system in the Pozuelos Biosphere Reserve. Environ. Monit. Assess. 2019, 191, 635. [Google Scholar] [CrossRef]
- Leroux, L.; Bégué, A.; Lo Seen, D.; Jolivot, A.; Kayitakire, F. Driving forces of recent vegetation changes in the Sahel: Lessons learned from regional and local level analyses. Remote Sens. Environ. 2017, 191, 38–54. [Google Scholar] [CrossRef] [Green Version]
- Tai, X.; Epstein, H.E.; Li, B. Elevation and Climate Effects on Vegetation Greenness in an Arid Mountain-Basin System of Central Asia. Remote Sens. 2020, 12, 1665. [Google Scholar] [CrossRef]
- Liu, H.; Zheng, L.; Yin, S. Multi-perspective analysis of vegetation cover changes and driving factors of long time series based on climate and terrain data in Hanjiang River Basin, China. Arab. J. Geosci. 2018, 11. [Google Scholar] [CrossRef] [Green Version]
- Li, X.; Ren, Z.; Zhang, C. The correlation analysis and space-time changes of NDVI and hydro-thermal index in Hanjiang basin. Geogr. Res. 2013, 32, 1623–1633. [Google Scholar] [CrossRef]
- Fensholt, R.; Proud, S.R. Evaluation of Earth Observation based global long term vegetation trends—Comparing GIMMS and MODIS global NDVI time series. Remote Sens. Environ. 2012, 119, 131–147. [Google Scholar] [CrossRef]
- Zoungrana, B.J.B.; Conrad, C.; Thiel, M.; Amekudzi, L.K.; Da, E.D. MODIS NDVI trends and fractional land cover change for improved assessments of vegetation degradation in Burkina Faso, West Africa. J. Arid Environ. 2018, 153, 66–75. [Google Scholar] [CrossRef]
- Wang, J.; Li, X.; Christakos, G.; Liao, Y.; Zhang, T.; Gu, X.; Zheng, X. Geographical Detectors-Based Health Risk Assessment and its Application in the Neural Tube Defects Study of the Heshun Region, China. Int. J. Geogr. Inf. Sci. 2010, 24, 107–127. [Google Scholar] [CrossRef]
- Wang, J.; Xu, C. Geodetector: Principle and prospective. Acta Geogr. Sin. 2017, 72, 116–134. [Google Scholar] [CrossRef]
- Song, Y.; Wang, J.; Ge, Y.; Xu, C. An optimal parameters-based geographical detector model enhances geographic characteristics of explanatory variables for spatial heterogeneity analysis: Cases with different types of spatial data. GISci. Remote Sens. 2020, 57, 593–610. [Google Scholar] [CrossRef]
- Zhu, L.; Meng, J.; Zhu, L. Applying Geodetector to disentangle the contributions of natural and anthropogenic factors to NDVI variations in the middle reaches of the Heihe River Basin. Ecol. Indic. 2020, 117. [Google Scholar] [CrossRef]
- Wang, P.; Zhang, L.; Li, Y.; Jiao, L.; Wang, H.; Yan, J.; Lu, Y.; Fu, B. Spatio-temporal characteristics of the trade-off and synergy relationships among multiple ecosystem services in the Upper Reaches of Hanjiang River Basin. Acta Geogr. Sin. 2017, 72, 2064–2078. [Google Scholar]
- Yu, Q.; Tu, Z.; Yu, G.; Xu, L.; Yang, D.; Yang, Y. Modelling the crop water-satisfied degree on the grid scale: A CropWRA model and the case study of Hanjiang River Basin, China. Agric. For. Meteorol. 2018, 262, 215–226. [Google Scholar] [CrossRef]
- Resources and Environment Data Cloud Platform of the Chinese Academy of Sciences. Available online: http://www.resdc.cn/ (accessed on 1 September 2020).
- Xu, X. Spatial Distribution Data Set of China Monthly Vegetation Index (NDVI). Data Registration and Publication System of Chinese Academy of Sciences. 2018. Available online: http://www.resdc.cn/ (accessed on 15 November 2020).
- Li, X. Time-dalayed correlation analysis between vegetation cover changes and climatic factors in Hanjiang River Basin. Bull. Soil Water Conserv. 2013, 33, 268–270. [Google Scholar] [CrossRef]
- Shuttle Radar Topography Mission (SRTM) Digital Elevation Database of the USGS/NASA. Available online: http://srtm.csi.cgiar.org/ (accessed on 1 April 2020).
- National Meteorological Information Center (NMIC) of the China Meteorological Administration (CMA). Available online: http://cdc.cma.gov.cn/ (accessed on 1 April 2020).
- China Meteorological Administration. Assessment Method for Solar Energy; China Meteorological Administration: Beijing, China, 2019; Volume QX/T 89-2019.
- Xu, X.; Liu, J.; Zhang, S.; Li, R.; Yan, C.; Wu, S. Remote Sensing Monitoring Data Set of Land Use and Land Cover in China in Multiple Periods (CNLUCC). Data Registration and Publication System of CHINESE Academy of Sciences. 2018. Available online: http://www.resdc.cn/DOI/ (accessed on 15 November 2020).
- Peng, W.; Wang, G.; Zhou, J.; Xu, X.; Luo, H.; Zhao, J.; Yang, C. Dynamic monitoring of fractional vegetation cover along Minjiang River from Wenchuan County to Dujiangyan City using multi-temporal landsat 5 and 8 images. Acta Ecol. Sin. 2016, 36, 1975–1988. [Google Scholar]
- Chen, T.; Xia, J.; Zou, L. The response of the upstream hydrological cycle process to climate change in the upper Hanjiang River Basin. China Rural Water Hydropower 2019, 9, 1–7. [Google Scholar]
- Wang, Q.; Zhang, T.; Yi, G.; Chen, T.; Bie, X.; He, Y. Tempo-spatial variations and driving factors analysis of net primary productivity in the Hengduan mountain area from 2004 to 2014. Acta Ecol. Sin. 2017, 37, 3084–3095. [Google Scholar]
- Kamali, A.; Khosravi, M.; Hamidianpour, M. Spatial-temporal analysis of net primary production (NPP) and its relationship with climatic factors in Iran. Environ. Monit. Assess. 2020, 192, 718. [Google Scholar] [CrossRef]
- Güçlü, Y.S. Improved visualization for trend analysis by comparing with classical Mann-Kendall test and ITA. J. Hydrol. 2020, 584. [Google Scholar] [CrossRef]
- Hamed, K.H. Exact distribution of the Mann-Kendall trend test statistic for persistent data. J. Hydrol. 2009, 365, 86–94. [Google Scholar] [CrossRef]
- Ye, H.; Zhang, T.; Yi, G.; Li, J.; Bie, X.; Liu, D.; Luo, L. Spatio-temporal characteristics of evapotranspiration and its relationship with climate factors in the source region of the Yellow River from 2000 to 2014. Acta Geogr. Sin. 2018, 73, 2117–2134. [Google Scholar] [CrossRef]
- Huang, Y.; Jiang, N.; Shen, M.; Guo, L. Effect of preseason diurnal temperature range on the start of vegetation growing season in the Northern Hemisphere. Ecol. Indic. 2020, 112. [Google Scholar] [CrossRef]
- Wang, J.; Zhang, T.; Fu, B. A measure of spatial stratified heterogeneity. Ecol. Indic. 2016, 67, 250–256. [Google Scholar] [CrossRef]
- Zhang, J.; Ren, Z. Spatiotemporal pattern of net primary productivity in the Hanjiang River Basin. Acta Ecol. Sin. 2016, 36, 7667–7677. [Google Scholar]
- Liu, H.; Zheng, L.; Liao, M. Dynamics of Vegetation Change and Its Relationship with Nature and Human Activities—A Case Study of Poyang Lake Basin, China. J. Sustain. For. 2020, 1–21. [Google Scholar] [CrossRef]
- Fu, J.; Cao, G.; Guo, W. Changes of growing season NDVI at different elevations, slope, slope aspect and its relationship with meteorological factors in the southern slope of Qilian Mountains, China from 1998–2017. Chin. J. Appl. Ecol. 2020, 31, 1203–1212. [Google Scholar]
- Wang, X.; Du, P.; Chen, D.; Lin, C.; Zheng, H.; Guo, S. Characterizing urbanization-induced land surface phenology change from time-series remotely sensed images at fine spatio-temporal scale: A case study in Nanjing, China (2001–2018). J. Clean. Prod. 2020, 274. [Google Scholar] [CrossRef]
- Feng, D.; Yang, C.; Fu, M.; Wang, J.; Zhang, M.; Sun, Y.; Bao, W. Do anthropogenic factors affect the improvement of vegetation cover in resource-based region? J. Clean. Prod. 2020, 271. [Google Scholar] [CrossRef]
- Zhang, X.; Wang, K.; Yue, Y.; Tong, X.; Liao, C.; Zhang, M.; Jiang, Y. Factors impacting on vegetation dynamics and spatial non-stationary relationships in karst regions of southwest China. Acta Ecol. Sin. 2017, 37, 4008–4018. [Google Scholar]
- Song, Y.; Aryal, J.; Tan, L.; Jin, L.; Gao, Z.; Wang, Y. Comparison of changes in vegetation and land cover types between Shenzhen and Bangkok. Land Degrad. Dev. 2020. [Google Scholar] [CrossRef]
- Ning, T.; Liu, W.; Li, Z.; Feng, Q. Modelling and attributing evapotranspiration changes on China’s Loess Plateau with Budyko framework considering vegetation dynamics and climate seasonality. Stoch. Environ. Res. Risk Assess. 2020, 34, 1217–1230. [Google Scholar] [CrossRef]
- Zeng, Z.; Peng, L.; Piao, S. Response of terrestrial evapotranspiration to Earth’s greening. Curr. Opin. Environ. Sustain. 2018, 33, 9–25. [Google Scholar] [CrossRef]
- Liu, Q.; McVicar, T.R.; Yang, Z.; Donohue, R.J.; Liang, L.; Yang, Y. The hydrological effects of varying vegetation characteristics in a temperate water-limited basin: Development of the dynamic Budyko-Choudhury-Porporato (dBCP) model. J. Hydrol. 2016, 543, 595–611. [Google Scholar] [CrossRef]
- Li, C.; Zhang, Y.; Shen, Y.; Yu, Q. Decadal water storage decrease driven by vegetation changes in the Yellow River Basin. Sci. Bull. 2020, 65, 1859–1861. [Google Scholar] [CrossRef]
Figure 1.
The study area.

Figure 2.
Variations of NDVI in the HJRB from 2001 to 2018.

Figure 3.
The distribution of NDVI in the HJRB.

Figure 4.
NDVI trends and their distribution in the HJRB: (a) M-K values in the HJRB from 2001 to 2008; (b) the distribution of M-K values from 2001 to 2018.
Figure 4.
NDVI trends and their distribution in the HJRB: (a) M-K values in the HJRB from 2001 to 2008; (b) the distribution of M-K values from 2001 to 2018.

Figure 5.
Statistic of the main influencing factors of NDVI: (a) elevation, (b) slope, (c) vegetation type, (d) land-use type, (e) temperature, (f) soil type.
Figure 5.
Statistic of the main influencing factors of NDVI: (a) elevation, (b) slope, (c) vegetation type, (d) land-use type, (e) temperature, (f) soil type.

Figure 6.
Distribution of the main influencing factors of NDVI: (a) vegetation type, (b) land-use type, (c) temperature, (d) soil type.
Figure 6.
Distribution of the main influencing factors of NDVI: (a) vegetation type, (b) land-use type, (c) temperature, (d) soil type.

Figure 7.
Relationships between NDVI and climate factors: (a) the relationship between NDVI and the precipitation, (b) the distribution of partial correlation coefficient between NDVI and the precipitation, (c) the relationship between NDVI and the temperature, (d) the distribution of partial correlation coefficient between NDVI and the temperature.

Figure 8.
The trends of the precipitation and temperature.

Figure 9.
The effects of human activities on NDVI: (a) the trend of the land use change, (b) the trend of NDVI change corresponding to different land-use types, (c) the built-up area in the downstream, (d) the afforestation area in the Shennongjia Region.
Figure 9.
The effects of human activities on NDVI: (a) the trend of the land use change, (b) the trend of NDVI change corresponding to different land-use types, (c) the built-up area in the downstream, (d) the afforestation area in the Shennongjia Region.

Figure 10.
NDVI values of different elevation and slope ranges: (a) elevation; (b) slope.


Table 1.
The name and introduction of index.
| Category | Code | Index | Unit |
|---|---|---|---|
| Climate | Pre | Annual precipitation | mm |
| Tem | Annual mean temperature | °C | |
| Sun | Annual sunshine duration | hours | |
| Hum | Annual mean relative humidity | % | |
| Rad | Annual total radiation | MJ/m2 | |
| Topography | Ele | Elevation | m |
| Slp | Slope | ° | |
| Asp | Aspect | ° | |
| Vegetation | Veg | Vegetation type | - |
| Soil | Sol | Soil type | - |
| Human activities | Land | Land-use type | - |
Table 2.
The classification of index.
| Factors | Class | Description | Factors | Class | Description | Factors | Class | Description |
|---|---|---|---|---|---|---|---|---|
| Annual precipitation (mm) | 1 | <800 | Elevation (m) | 1 | <325 | Vegetation Type | 1 | Coniferous forest |
| 2 | 800~1000 | 2 | 325~690 | 3 | Broad-leaved forest | |||
| 3 | 1000~1200 | 3 | 690~1020 | 4 | Bushwood | |||
| 4 | >1200 | 4 | 1020~1379 | 7 | Grass | |||
| Annual mean temperature (°C) | 1 | <10 | 5 | 1379~1831 | 8 | Meadow | ||
| 2 | 10~12 | 6 | >1831 | 11 | Cultivated plant | |||
| 3 | 12~14 | 12 | Others | |||||
| 4 | 14~16 | Slope (°) | 1 | <2.5 | Soil Type | 1 | Leached soil | |
| 5 | >16 | 2 | 2.5~6 | 2 | Semileached soil | |||
| Annual sunshine duration (hours) | 3 | 6~9.92 | 6 | Primary soil | ||||
| 1 | <1600 | 4 | 9.92~15.19 | 7 | Hydromorphic soil | |||
| 2 | 1600~1900 | 5 | >15.19 | 10 | Artificial soil | |||
| 3 | >1900 | 11 | Alpine soil | |||||
| Aspect (°) | 1 | 337.5~22.5 | 12 | Ferralsol | ||||
| Annual mean relative humidity (%) | 1 | <70 | 2 | 22.5~67.5 | 13 | Others | ||
| 2 | 70~75 | 3 | 67.5~112.5 | Land-use type | 1 | Cultivated land | ||
| 3 | >75 | 4 | 112.5~157.5 | 2 | Forest | |||
| 5 | 157.5~202.5 | 3 | Grass | |||||
| Annual total radiation (MJ/m2) | 1 | <3600 | 6 | 202.5~247.5 | 4 | Water area | ||
| 2 | 3600~3960 | 7 | 247.5~292.5 | 5 | Urban and industrial area | |||
| 3 | >3960 | 8 | 292.5~337.5 | 6 | Unused land |
Table 3.
Area ratio of different NDVI levels (%).
| 2001 | 2005 | 2010 | 2015 | 2018 | 2001–2018 | |
|---|---|---|---|---|---|---|
| 0–0.2 | 0.069 | 0.000 | 0.069 | 0.058 | 0.058 | 0.046 |
| 0.2–0.4 | 0.208 | 0.301 | 0.208 | 0.405 | 0.532 | 0.231 |
| 0.4–0.6 | 2.637 | 1.041 | 0.786 | 1.943 | 1.966 | 1.180 |
| 0.6–0.8 | 63.960 | 38.607 | 30.083 | 20.402 | 17.048 | 35.068 |
| 0.8–1.0 | 33.125 | 60.051 | 68.853 | 77.192 | 80.396 | 63.474 |
Table 4.
The PD values of each factor.
| Factors | Pre | Tem | Sun | Hum | Rad | Ele | Slp | Asp | Veg | Sol | Land |
|---|---|---|---|---|---|---|---|---|---|---|---|
| PD value | 0.0738 | 0.1653 | 0.0294 | 0.0170 | 0.0092 | 0.3889 | 0.2734 | 0.0094 | 0.2475 | 0.1317 | 0.2273 |
Table 5.
The factor range/type suitable for vegetation growth.
| Factors | Appropriate Range/Type | The Average NDVI |
|---|---|---|
| Pre | 600~800 mm, 1000~1200 mm | 0.82 |
| Tem | 10~12 °C | 0.86 |
| Sun | <1600 h, 1900~2200 h | 0.81 |
| Hum | 75~80% | 0.82 |
| Rad | <3600 MJ/m2 | 0.85 |
| Ele | >1379 m | 0.86 |
| Slp | >15.19° | 0.86 |
| Asp | 0~67.5°, 292.5°~337.5° | 0.81 |
| Veg | Broad-leaved forest, meadow | 0.84 |
| Sol | Leached soil | 0.82 |
| Land | Forest | 0.83 |
Table 6.
The interaction between factors.
| Pre | Tem | Sun | Hum | Rad | Ele | Slp | Asp | Veg | Sol | Land | |
|---|---|---|---|---|---|---|---|---|---|---|---|
| Pre | 0.0738 | ||||||||||
| Tem | 0.2480 | 0.1653 | |||||||||
| Sun | 0.1254 | 0.1757 | 0.0294 | ||||||||
| Hum | 0.1135 | 0.1958 | 0.0740 | 0.017 | |||||||
| Rad | 0.1021 | 0.2286 | 0.0928 | 0.0483 | 0.0092 | ||||||
| Ele | 0.4644 | 0.4187 | 0.4151 | 0.4034 | 0.4404 | 0.3889 | |||||
| Slp | 0.3410 | 0.2938 | 0.2813 | 0.2793 | 0.2857 | 0.3988 | 0.2734 | ||||
| Asp | 0.0913 | 0.1774 | 0.0433 | 0.027 | 0.0196 | 0.3930 | 0.2787 | 0.0094 | |||
| Veg | 0.3119 | 0.2958 | 0.2595 | 0.2847 | 0.2646 | 0.4548 | 0.3699 | 0.2657 | 0.2475 | ||
| Sol | 0.2069 | 0.2263 | 0.1468 | 0.1533 | 0.1837 | 0.4036 | 0.2900 | 0.1495 | 0.2911 | 0.1317 | |
| Land | 0.3048 | 0.2958 | 0.2546 | 0.2514 | 0.2557 | 0.4467 | 0.3457 | 0.2385 | 0.3361 | 0.2663 | 0.2273 |
Table 7.
Comparison of factor interactions.
| Pre | Tem | Sun | Hum | Rad | Ele | Slp | Asp | Veg | Sol | |
|---|---|---|---|---|---|---|---|---|---|---|
| Tem | > | |||||||||
| Sun | > | < | ||||||||
| Hum | > | > | > | |||||||
| Rad | > | > | > | > | ||||||
| Ele | > | < | < | < | > | |||||
| Slp | < | < | < | < | > | < | ||||
| Asp | > | > | > | > | > | < | < | |||
| Veg | < | < | < | > | > | < | < | > | ||
| Sol | < | < | < | > | > | < | < | > | < | |
| Land | > | < | < | > | > | < | < | > | < | < |
Table 8.
The difference between factors.
| Pre | Tem | Sun | Hum | Rad | Ele | Slp | Asp | Veg | Sol | |
|---|---|---|---|---|---|---|---|---|---|---|
| Tem | Y | |||||||||
| Sun | N | N | ||||||||
| Hum | N | N | N | |||||||
| Rad | N | N | N | N | ||||||
| Ele | Y | Y | Y | Y | Y | |||||
| Slp | Y | Y | Y | Y | Y | N | ||||
| Asp | N | N | N | N | N | N | N | |||
| Veg | Y | Y | Y | Y | Y | N | N | Y | ||
| Sol | Y | N | Y | Y | Y | N | N | Y | N | |
| Land | Y | Y | Y | Y | Y | N | N | Y | N | Y |
Publisher’s Note: MDPI stays neutral with regard to jurisdictional claims in published maps and institutional affiliations. |
© 2020 by the authors. Licensee MDPI, Basel, Switzerland. This article is an open access article distributed under the terms and conditions of the Creative Commons Attribution (CC BY) license (http://creativecommons.org/licenses/by/4.0/).
Share and Cite
MDPI and ACS Style
Chen, T.; Xia, J.; Zou, L.; Hong, S. Quantifying the Influences of Natural Factors and Human Activities on NDVI Changes in the Hanjiang River Basin, China. Remote Sens. 2020, 12, 3780. https://0-doi-org.brum.beds.ac.uk/10.3390/rs12223780
AMA Style
Chen T, Xia J, Zou L, Hong S. Quantifying the Influences of Natural Factors and Human Activities on NDVI Changes in the Hanjiang River Basin, China. Remote Sensing. 2020; 12(22):3780. https://0-doi-org.brum.beds.ac.uk/10.3390/rs12223780
Chicago/Turabian StyleChen, Ting, Jun Xia, Lei Zou, and Si Hong. 2020. "Quantifying the Influences of Natural Factors and Human Activities on NDVI Changes in the Hanjiang River Basin, China" Remote Sensing 12, no. 22: 3780. https://0-doi-org.brum.beds.ac.uk/10.3390/rs12223780
Note that from the first issue of 2016, this journal uses article numbers instead of page numbers. See further details here.