Article

Spatio-Temporal Dynamics of Algae and Macrophyte Cover in Urban Lakes: A Remote Sensing Analysis of Bellandur and Varthur Wetlands in Bengaluru, India

1
Institute of Geography, Department of Physical Geography, Georg-August-Universität Göttingen, Goldschmidtstr. 5, 37077 Göttingen, Germany
2
Organic Plant Production and Agroecosystems Research in the Tropics and Subtropics (OPATS), Universität Kassel, Steinstrasse 19, 37213 Witzenhausen, Germany
*
Author to whom correspondence should be addressed.
Remote Sens. 2020, 12(22), 3843; https://0-doi-org.brum.beds.ac.uk/10.3390/rs12223843
Submission received: 28 September 2020 / Revised: 8 November 2020 / Accepted: 18 November 2020 / Published: 23 November 2020
(This article belongs to the Section Urban Remote Sensing)

Abstract

:
Rapid urbanization processes and indiscriminate disposal of urban wastewaters are major causes for anthropogenic lake-sediment deposition and eutrophication. However, information about the spatial and temporal variation of macrophyte and phytoplankton distribution as indicators for water contamination is limited. To gain insights into the dynamics, we analyzed lake-cover changes of Bellandur and Varthur Lake in the S-Indian megacity of Bengaluru for the post-rainy seasons of the years 2002–2019. Supervised maximum likelihood classifications were conducted on 62 freely available, true-color satellite images in order to distinguish between macrophytes, algae, and free water surface. The image-derived results were verified by supervised classification and manual mapping of two simultaneously recorded multispectral satellite images (Sentinel-2 and WorldView-2). Seasonal interrelations between macrophytes and algae distribution were similar for both lakes. The increase in macrophyte cover during post-rainy season negatively correlated with algal abundance. Macrophyte expansion progressively suppressed algae development at both lakes, reflective of increasing eutrophication caused by on-going wastewater input. Seasonal variation in precipitation, wind direction, and temperature seemed to trigger intra-annual shifts of macrophytes and algae while similar macrophyte spread intensities during the post-monsoon season indicated independence of nutrient loads in the lake water.

Graphical Abstract

1. Introduction

Urban lakes and associated wetlands are threatened by landfills following sprawling settlements and by discharge of urban waste water and pollutants [1,2,3], which is critically diminishing ecosystem functions for large parts of the local population. This is a frequent occurrence in India, where many people rely on both direct and indirect ecosystem services conferred by regional aquatic systems [4,5]. In urban contexts, benefits of intact lakes with their associated margins include freshwater supply [4], improvement of urban microclimate [6], lower climate change induced vulnerability [7], increased groundwater recharge [8], enlarged nutrient sink function [9], seasonal protection against monsoon floods [10], and provision of habitats for rare flora and fauna [11]. In stark contrast to the economic and ecosystem service value of intact wetland systems in Bengaluru (estimated at US$ 130 to US$ 230 ha−1 day−1), this value is negligible for degraded wetlands [12,13].
The southern Indian megacity of Bengaluru is home to an elaborate 16th century reservoir and lake system that collects rainwater during the monsoon season, originally for meeting direct and indirect off-season human and livestock water needs [8,14]. Many of these ancient lakes are still in place. However, intensive urbanization, entailing typical “megacity problems” such as high demands for land and poor urban planning [15], caused 79% of waterbodies to vanish within 40 years and 90% of those remaining to suffer from sprawling construction and continuous inflow of sewage [9,16]. Degradation was caused in part by a shift of urban lake management from local communities towards a multiplicity of uncoordinated authorities [8,16]. The few, but expensive, governmental rejuvenation programs focused on the lakes’ recreational purposes rather than on their ecological functions, severely hampering the traditional public uses of these lakes [4,10,17] and excluding previous local users [15].
Although Bengaluru’s water demand rose at exorbitant rates, its multitude of water bodies have not been integrated in a water supply and water reuse system [18]. However, private borewells have been drilled down to 400 m and a 100 km long trench was built to extract the contested water resources of the Cauvery–Arkavathy river system to fulfill the water demands of the city [9,16]. If misused as urban dumpsters, vulnerable urban water commons become part of the public health problems due to severe surface and ground-water contamination [15]. With the daily inflow of ~500 million liters of untreated and partially treated mostly domestic sewage, Bellandur Lake and downstream Varthur Lake, Bengaluru’s two biggest wetlands, receive a high portion of the city’s overall waste water [19,20]. Their state of ecological degradation is reflected in the indiscriminate spread of invasive nitrophilous macrophyte species [13,21,22]. Methane producing organic pollutants have caused Bellandur Lake to catch fire on at least two occasions, resulting in international infamy for flagrant failures of environmental management and pollution control [8,23,24]. Despite their reputation as being heavily degraded, both lakes still contribute to the livelihoods of local people who traditionally collect aquatic wetland grasses as cattle fodder and use the contaminated water to irrigate their fields [25,26,27]. Through these practices, toxic substances such as heavy metals or organic pollutants can enter the food chain. Farmers who are dependent on the water for irrigation, reportedly suffer from the accumulation of toxins in the soil, reduced yields, health problems, and difficult marketing of local products [27,28].
By plant uptake and sedimentation, unquantified amounts of organic and mineral nitrogen, phosphorous, carbon, and contaminants are retained within the two lakes during the seasonally fluctuating water residence time of ~15 days at Bellandur and ~5 days at Varthur. However, depending on the water’s prevailing biochemical and physical conditions (seasonal rainfall, temperature changes and oxygen level), these elements can be released back into the water [29,30]. As the upstream sewage treatment plants are constantly overloaded or dysfunctional, the bioremediation function of the lake systems is crucial for (temporary) prevention of downstream water pollution [13,30,31].
Aquatic macrophytes can be mayor indicators of water quality [32], fulfill many critical ecological services of wetlands [33], sequester organic loads and nutrients, and stabilize sediments and shorelines [34]. Ramachandra et al. [9] reported that 25 of Bengaluru’s 105 remaining lakes are already fully covered by macrophytes. This often happens through quickly propagating exotic invasive species indicating lake degradation [35]. Depending on the season, Bellandur and Varthur Lakes in Bengaluru are partly covered by the floating invasive macrophyte water hyacinth (Eichhornia crassipes (Mart.) Solms) and rooted macrophytes such as alligator weed (Alternanthera philoxeroides (Mart.) Griseb.), nut grass (Cyperus rotundus L.), and narrowleaf cattail (Typha angustifolia L.), as well as Chlorella algae and bacterial populations comprising Cyanophycea [13,21,22] (Figure 1).
E. crassipes can expand very quickly on the lake surface and form large floating islands that drift across the lake and seasonally cover vast parts of the waterbodies, altering the wetlands’ water purification capacities [30,36]. The water hyacinth communities regrow massively after each monsoon season, but quickly decline during the pre-monsoon and monsoon seasons due to decay and to being flushed over the spillways of the lakes [13,22,37]. The sprawling growth of E. crassipes also restricts other species which are harvested as fodder [27,30] and its mats may exhaust the oxygen concentrations of the covered areas [22,30,36]. During the decomposition of the dead plant material, the biological oxygen demand (BOD) of the water increases and causes partly anaerobic conditions. When the E. crassipes decays, the floating islands provide ground for emergent plants such as Cyperus sp. and the equally invasive A. philoxroides, which is the second dominant colonizer of the two wetlands [13,21,36].
Bacterial–algal communities of phytoplankton, threatened by macrophyte expansion [36], also play an important role in these lake ecosystems and their large biomass production greatly contributes to water purification [22,38,39,40]. With seasonally varying spatial propagation of macrophyte cover, the algal activity can be lowered drastically leading to higher oxygen demand of the ecosystem [13,22]. Recent data show that the total nutrient-uptake rates of the lake system are low in the pre-monsoon season (April to May) when the vital vegetation of the wetland system is lowest due to widespread decay of water hyacinth populations as they become infested by insects [22,41,42].
Although previous research on Bengaluru’s lakes addressed their ecological status, dynamics, and water treatment capacities, it rather focused on water quality analysis by in situ measurements of physico-chemical parameters [9,22,29,30]. The effective and comparatively cheap method to analyze changes in wetland size and vegetation cover using time-series of aerial or satellite images is an alternative approach which can be combined with water quality analysis [43,44]. Successful application of remote sensing methods depends on spatial, temporal, and spectral resolution of data of which access may be limited by high costs for image products [43,44]. Thus, usage of freely available long-term time series of true-color Google EarthTM (GE) imagery with high spatial and temporal resolution might offer an alternative for analysis of lake cover variations, when compared to common commercial or lower resolution multispectral image products [44,45,46]. For Bangalore’s wetlands, published remote sensing research mainly focused on wetland degradation, including the spatial reduction, encroachment, and disappearance of wetlands [47]. Using supervised classification approaches to assess surface water dynamics in Bengaluru, Gautam et al. [48] found evidence for a rampant decline of water bodies and wetland areas due to uncontrolled urbanization.
In view of the above this study aimed at investigating the seasonal and long-time dynamics of macrophytes and phytoplankton cover of Bellandur and Varthur lakes. The two wetlands have been selected as they feature a highly variable pattern of lake surface cover and nutrient loads which may impair ecosystem services [18,20,22]. We employed remote sensing analysis of high resolution true-color satellite images provided by GE for the years 2002 to 2019. Macrophyte and algae communities are understood as proxies for the lakes’ and associated wetlands’ capacity to respond to and interact with waste water input. We hypothesized that GE satellite data allow to (i) reliably detect cumulative macrophyte and algae cover across years, (ii) quantify the seasonally repetitive negative correlation between both, and (iii) detect a postulated seasonal and long-term rise in macrophyte cover in both lakes characterized by a different water influx.

2. Materials and Methods
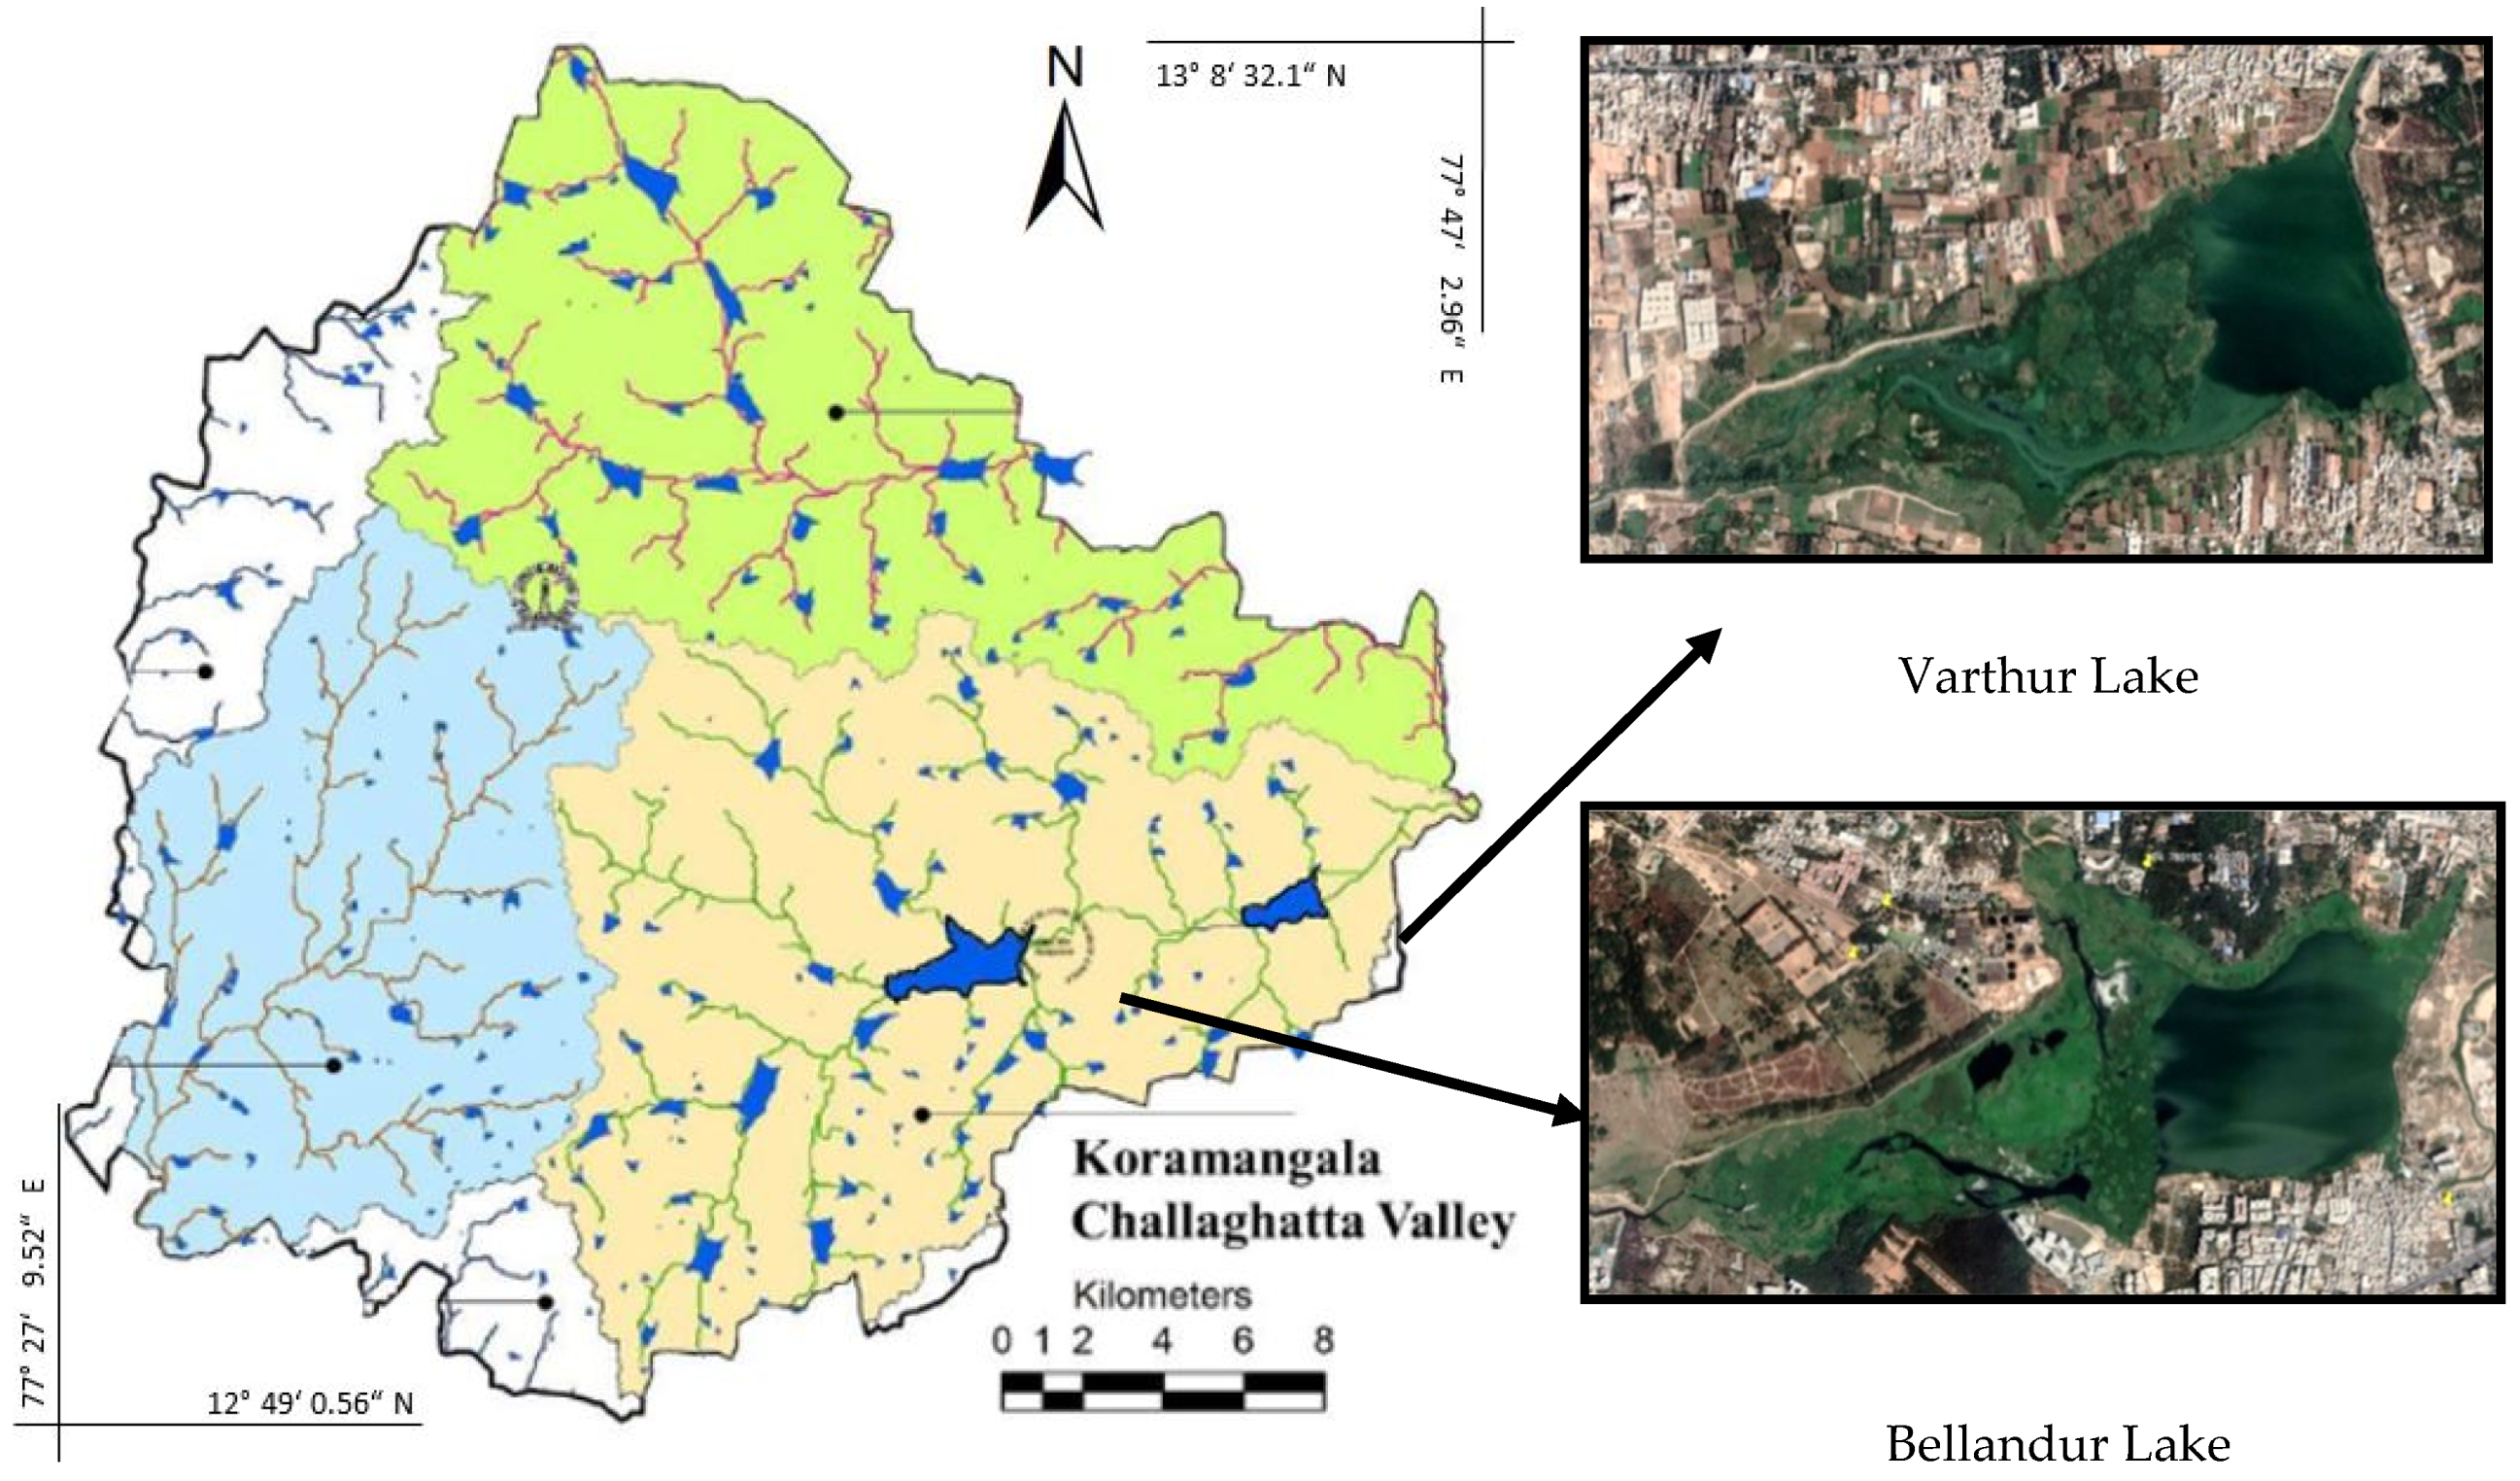
2.1. Study Area

Bengaluru, the capital of Karnataka State, South India, is one of Asia’s fastest growing megacities. With a population increase of almost 50% since 2001, it reached 8.5 Mio inhabitants in 2011 [49] and 13.9 Mio in 2019. The city is located in the southern part of the Deccan Plateau which is geologically formed of dissected granite at an average elevation of 920 m a.s.l. Bengaluru has a mild climate with temperatures ranging from 18 °C to 38 °C in summer and 12 °C to 25 °C in winter at a mean annual precipitation of 900 mm [50]. More than half of the highly variable annual precipitation occurs during the main monsoon period (south-west monsoon) between June and September [30,51].
With its economic stronghold on science and technology, in particular the IT sector, the former “City of Lakes” [48] is now known as the “Silicon Valley of India” with the country’s highest per capita income [10] and a growing number of retirees from all over India. Thus, Bengaluru is a prime example for neoliberal urbanization and for rapid development of globally integrated economic driving forces [15]. During the rural–urban transformation process, the planning authorities and infrastructure have not kept pace with the ten-fold expansion of the urban area since 1951 [13]. Consequently, the transition of a formerly mainly rural landscape into an urban metropolis drastically reduced open spaces and green cover leading to heavily stressed environments and a rapidly shrinking number of pond and lake-connected wetlands [9,52].

2.2. The Bellandur–Varthur Lake System

Within the hilly area around the city, three major drainage systems exist (Figure 2). Channels and partly interconnected lake systems also drain untreated sewage water [52,53]. The Koramangala–Challaghatta Valley system that is located in the south-east, drains an area of 255 km2 towards the South Pennar River [53]. It is home to the interconnected twin Bellandur (upstream) and Varthur (5 km downstream) lakes, which form the two largest wetlands in the city area [22]. At least 40% of Bengaluru’s only partially treated sewage successively traverses these lakes [29,30] causing vigorous proliferation of invasive macrophytes [37]. As a consequence, large-scale algal blooms, anoxic conditions, heavy metal accumulation frothing due to phosphorus (P) enrichment, odor from H2S, high fish mortality, and occasional fires were reported [23,24,28,54].
The Bellandur wetland (12°56′38.10″N–12°55′40.65″N and 77°38′18.04″E–77°40′48.60″E, 921 m a.s.l.) has a monsoon-dependent maximum length of 3.6 km and 1.4 km width, while Varthur (12°57′24.06″N–12°56′29.40″N and 77°44′43.36″E–77°43′40.98″E, 919 m a.s.l.) expands 2 km × 1.1 km. Bellandur’s catchment area comprises around 148 km2 and Varthur’s 166 km2. As a consequence of rapid sedimentation by high waste water influx, the lakes’ mean depth of 1.8–2.1 m (Bellandur) and 1.1 m (Varthur) are decreasing [22,29,55]. However, unlike many other lakes in Bengaluru under such strong human influence, the outlines of both lakes did not change significantly during the last decades [13].

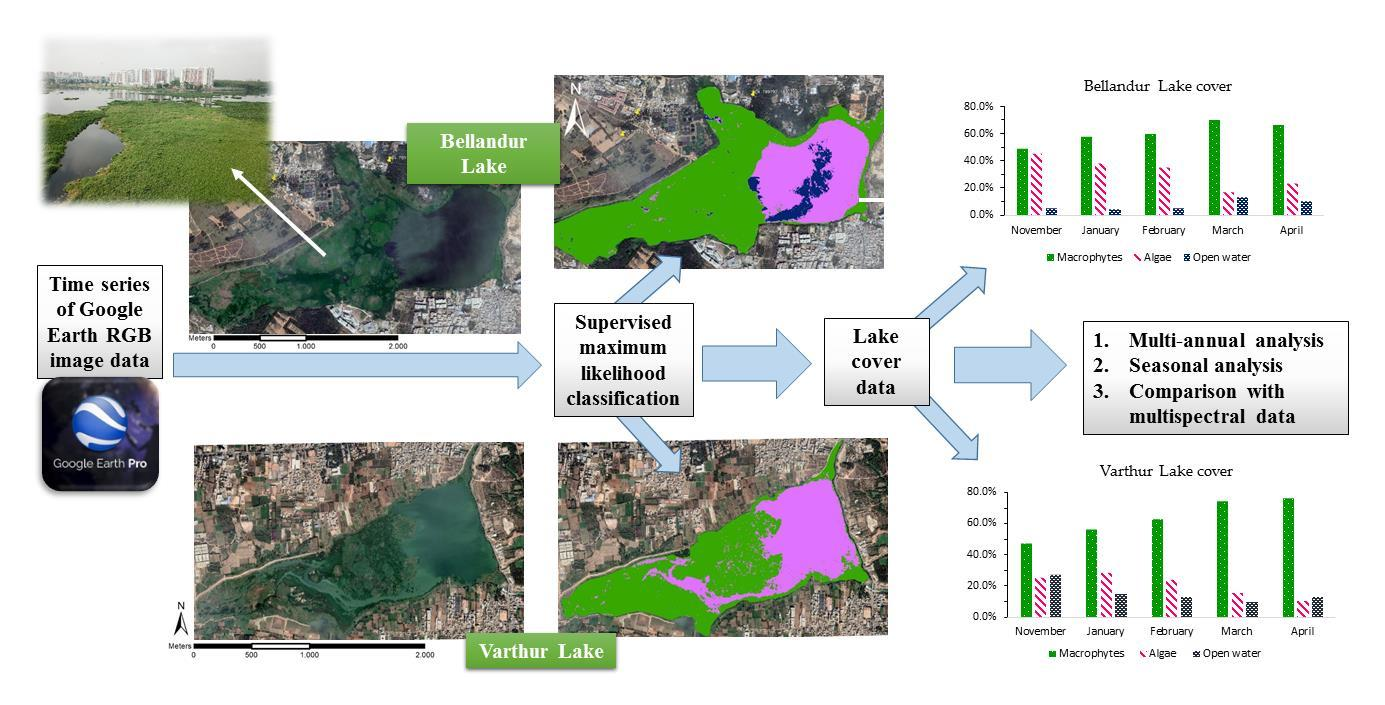
2.3. Data Acquisition and Pre-Processing

For the analysis of seasonal and inter-annual lake-cover changes between 2002 and 2019, 62 true-color (RGB) satellite images, 31 for each lake (Table A1), with an image size of 4800 × 2363 pixels were downloaded via GE Pro Desktop 7.3.2 using the “Historical images” feature. We postulated that the RGB spectrum was sufficient to distinguish between the classes of macrophytes, algae, and open water by supervised classification. Image selection depended on the availability of sufficiently cloud-free data available for both lakes at the same date. Over the years, these criteria were met only for the months from September to April (mainly post- and pre-monsoon season). For the years 2002 to 2004, 2008 to 2011, and 2014, there was one image per year available and for 2012, 2013, and 2015, two images each. Suitable for intra-annual analysis were the years 2016 to 2019 with four to five images each. All GE images had a resolution of 1 × 1 m per pixel when downloaded. Using ArcGIS® ArcMapTM 10.6.1 (ESRI Inc., Redlands, CA, USA), each image was georeferenced using 4 to 6 fixed ground control points such as distinctive road intersections and building edges that persisted over the analyzed timespan taken from recent GE images applying the “WGS 1984/UTM Zone 43N” coordinate system. This yielded a spatial accuracy <2 m. To assure consistent wetland boundaries across time, a detailed polygon of each lake’s boundaries was digitized on-screen as a shapefile using a GE image from 07-01-2019. Both lake polygons were used to extract the wetland areas which comprised 323.7 ha for Bellandur and 158.4 ha for Varthur which is notably smaller than the 365 and 220 ha mentioned by Mahapatra et al. [22].
To verify RGB classification results, we conducted supervised classifications of multispectral satellite images for each lake. We used a commercial high-resolution WordView-2 (WV02) scene from Maxar® (ortho ready standard 2A image) with a spatial resolution of 2.8 m per pixel and a Sentinel-2 image (cloud-free Level 1C ToA reflectance product from https://earthexplorer.usgs.gov) with a spatial resolution of 10 m. We further hand-digitized the GE scenes from the same date as the Sentinel-2 images for comparison. Image dates were selected according to availability of cloud-free data and presence of adequate shares of all lake cover classes.

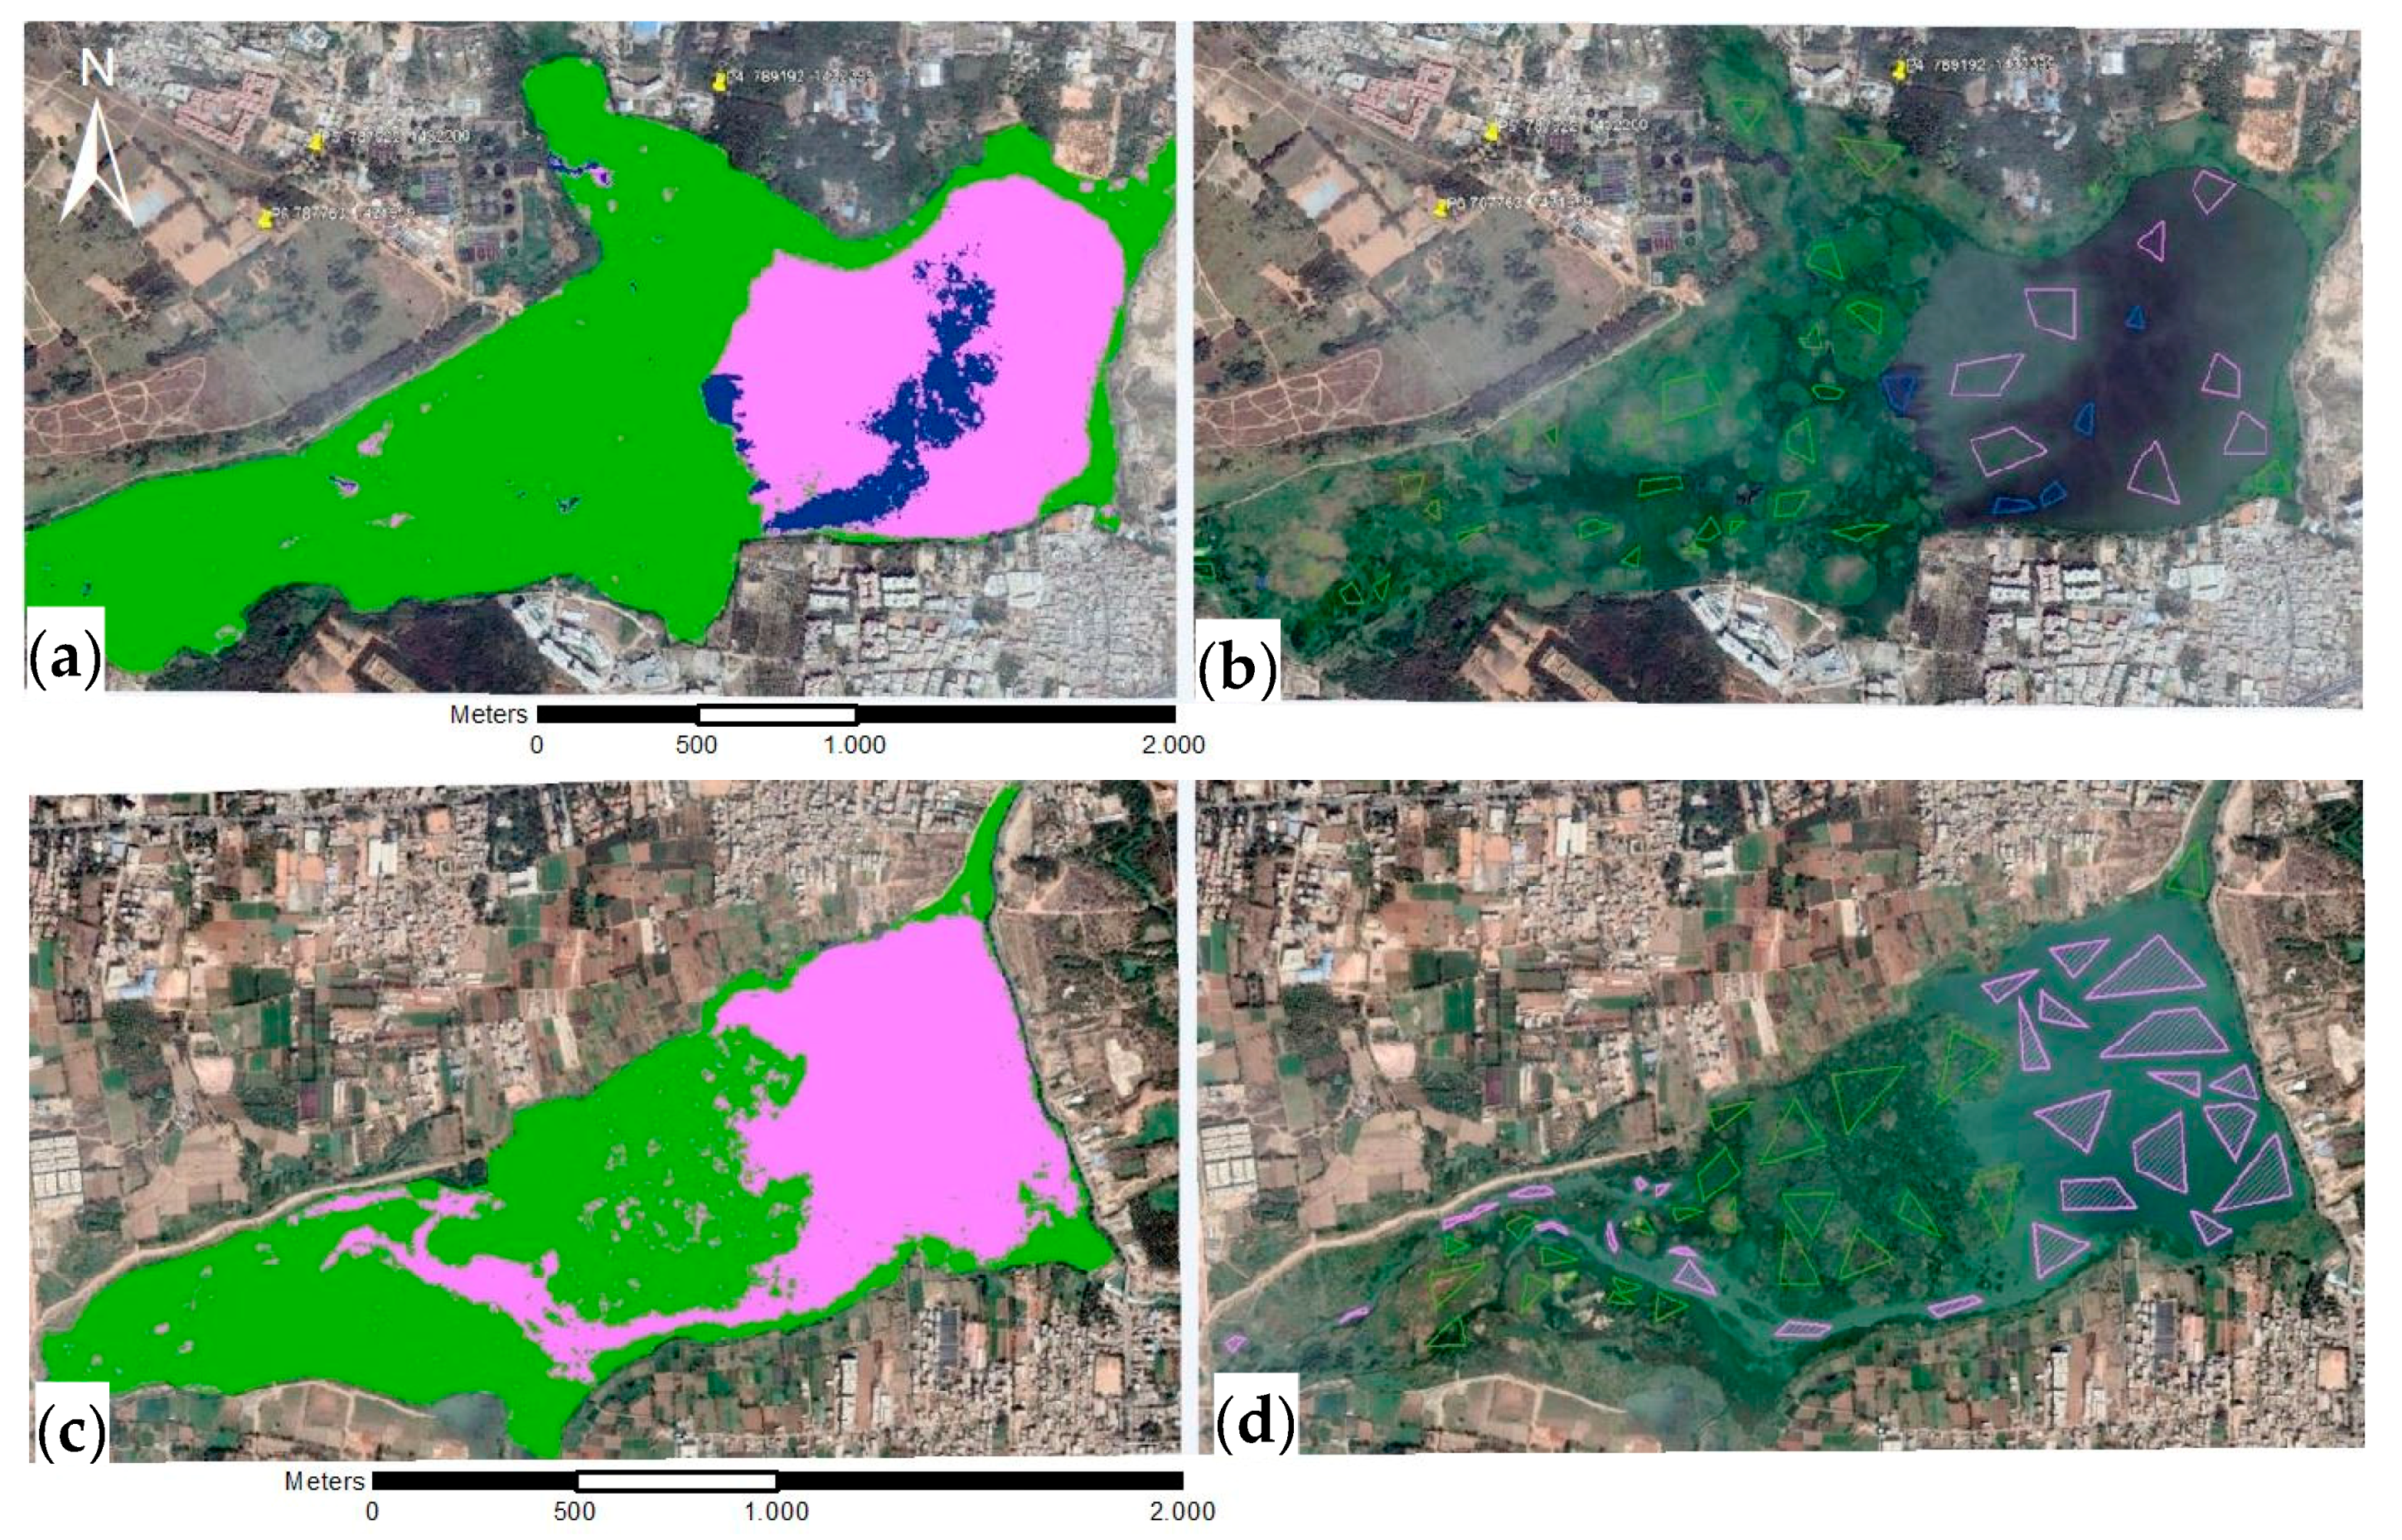
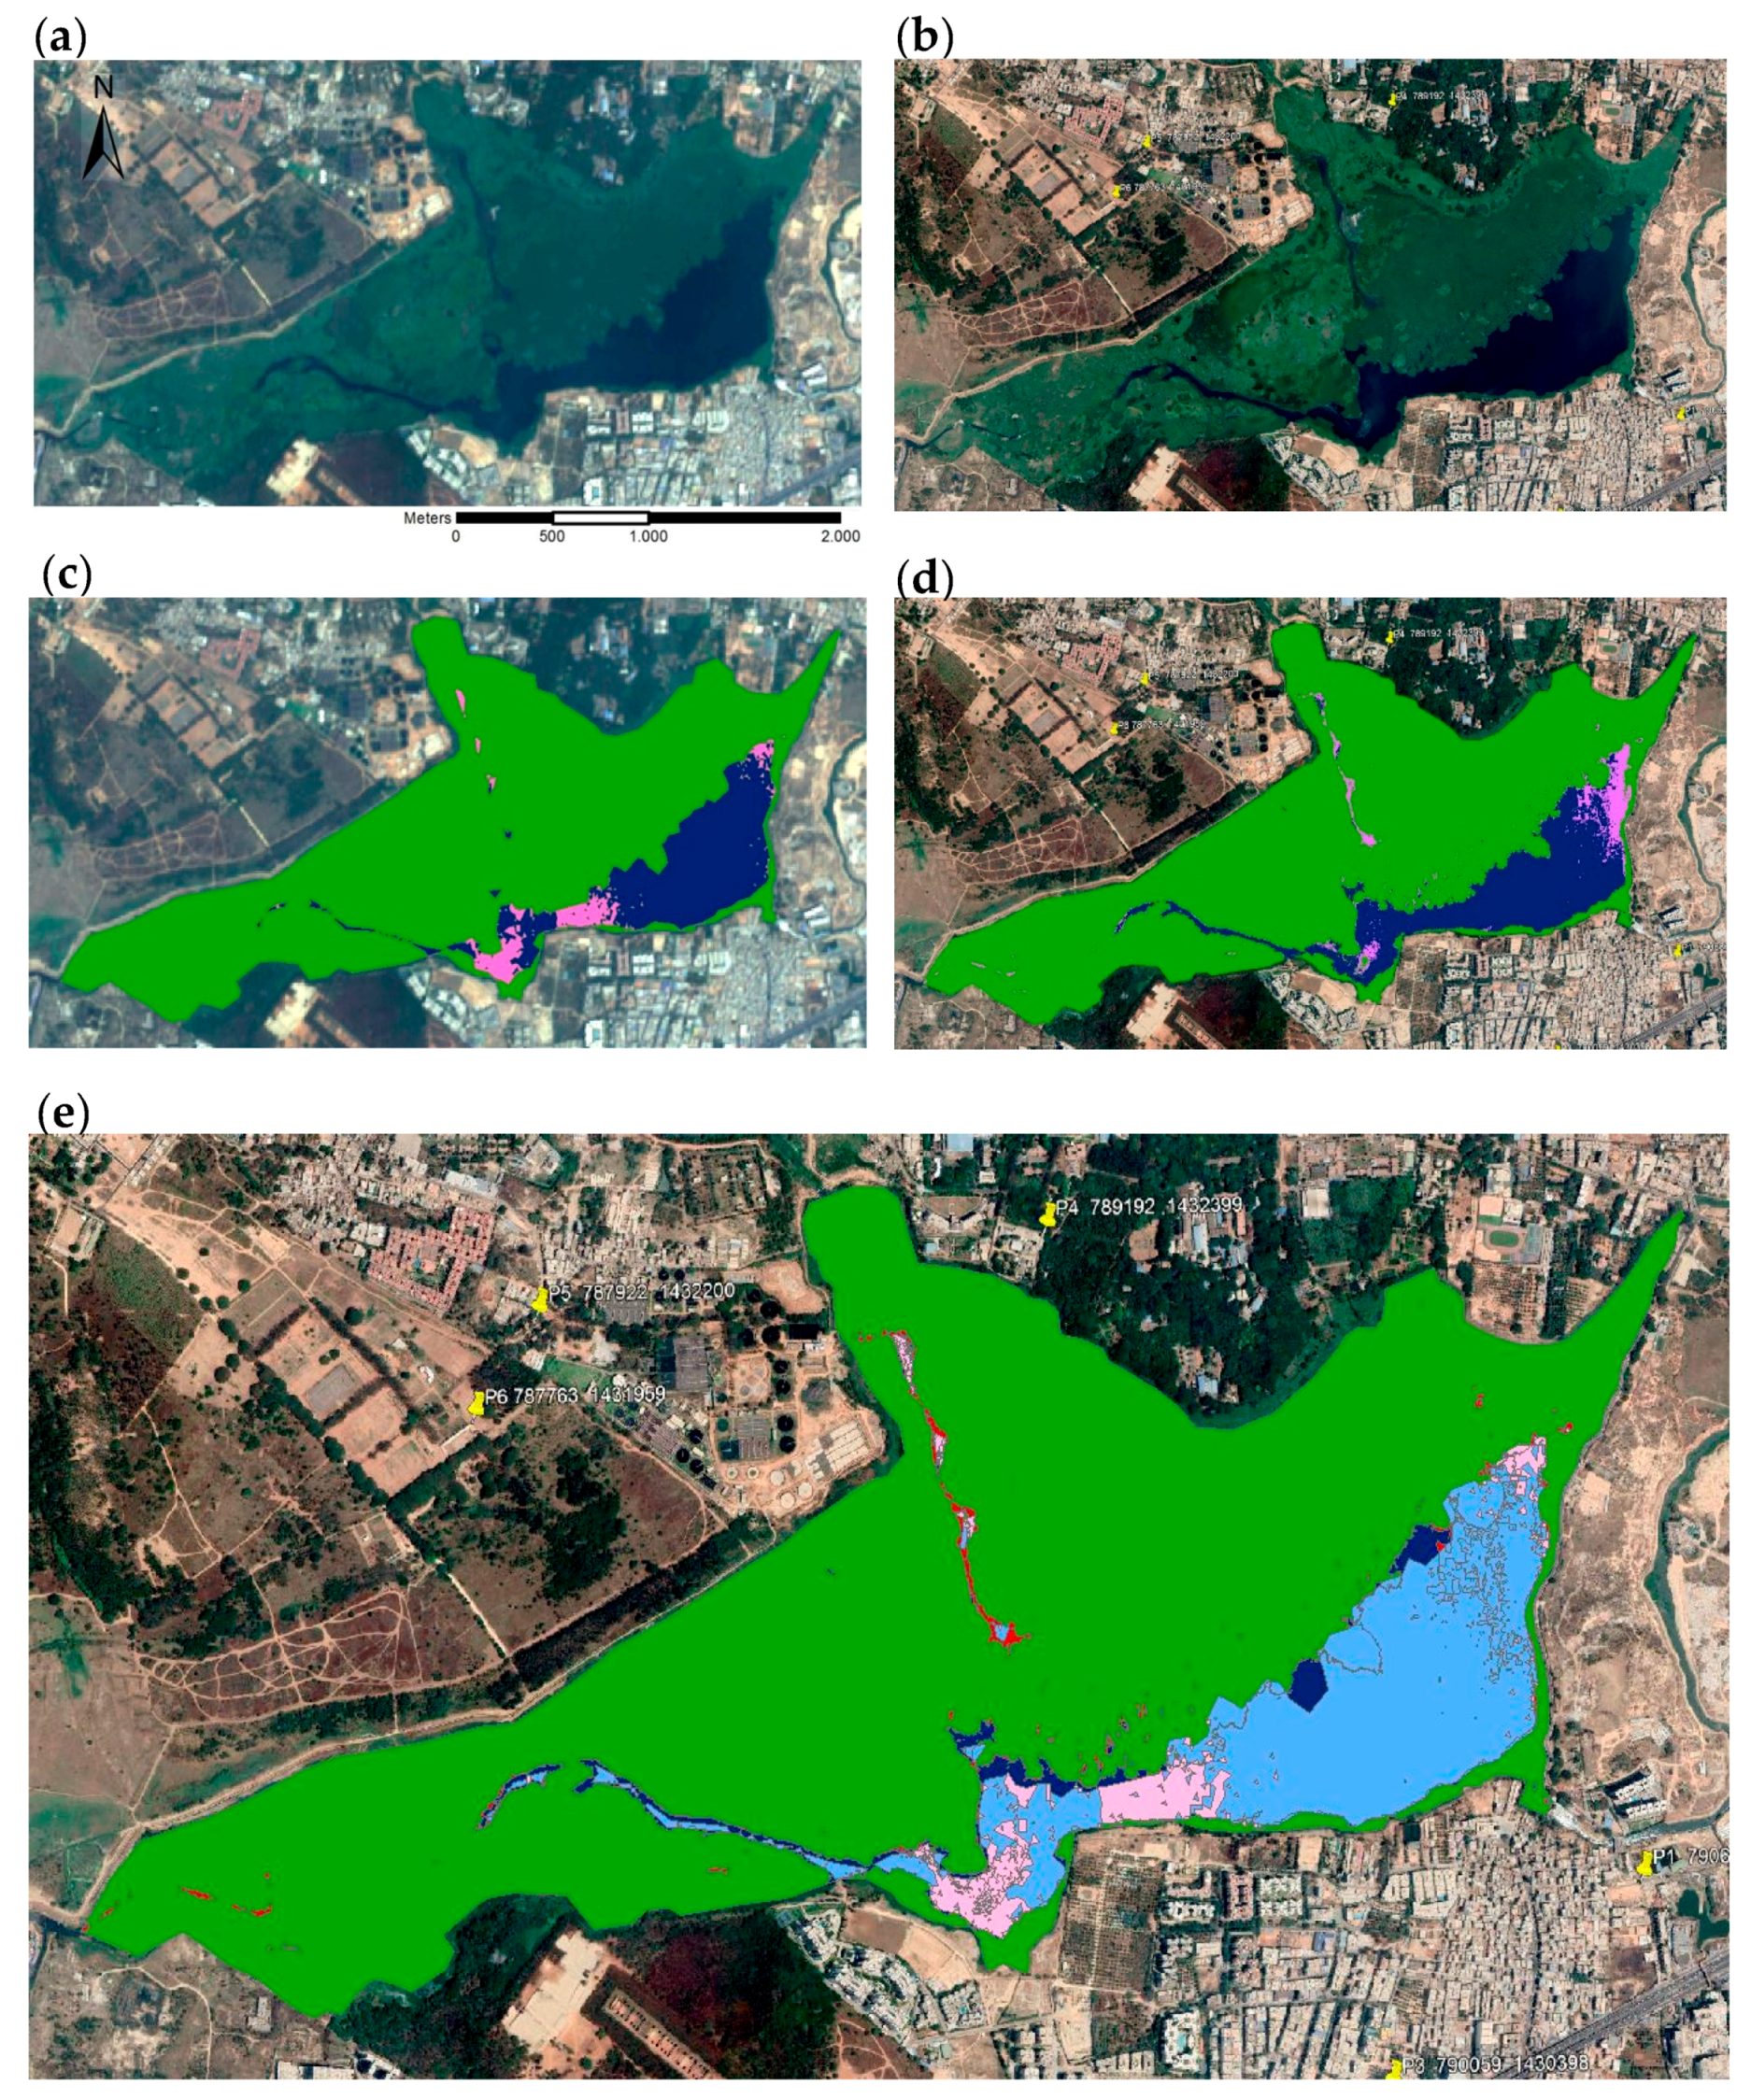
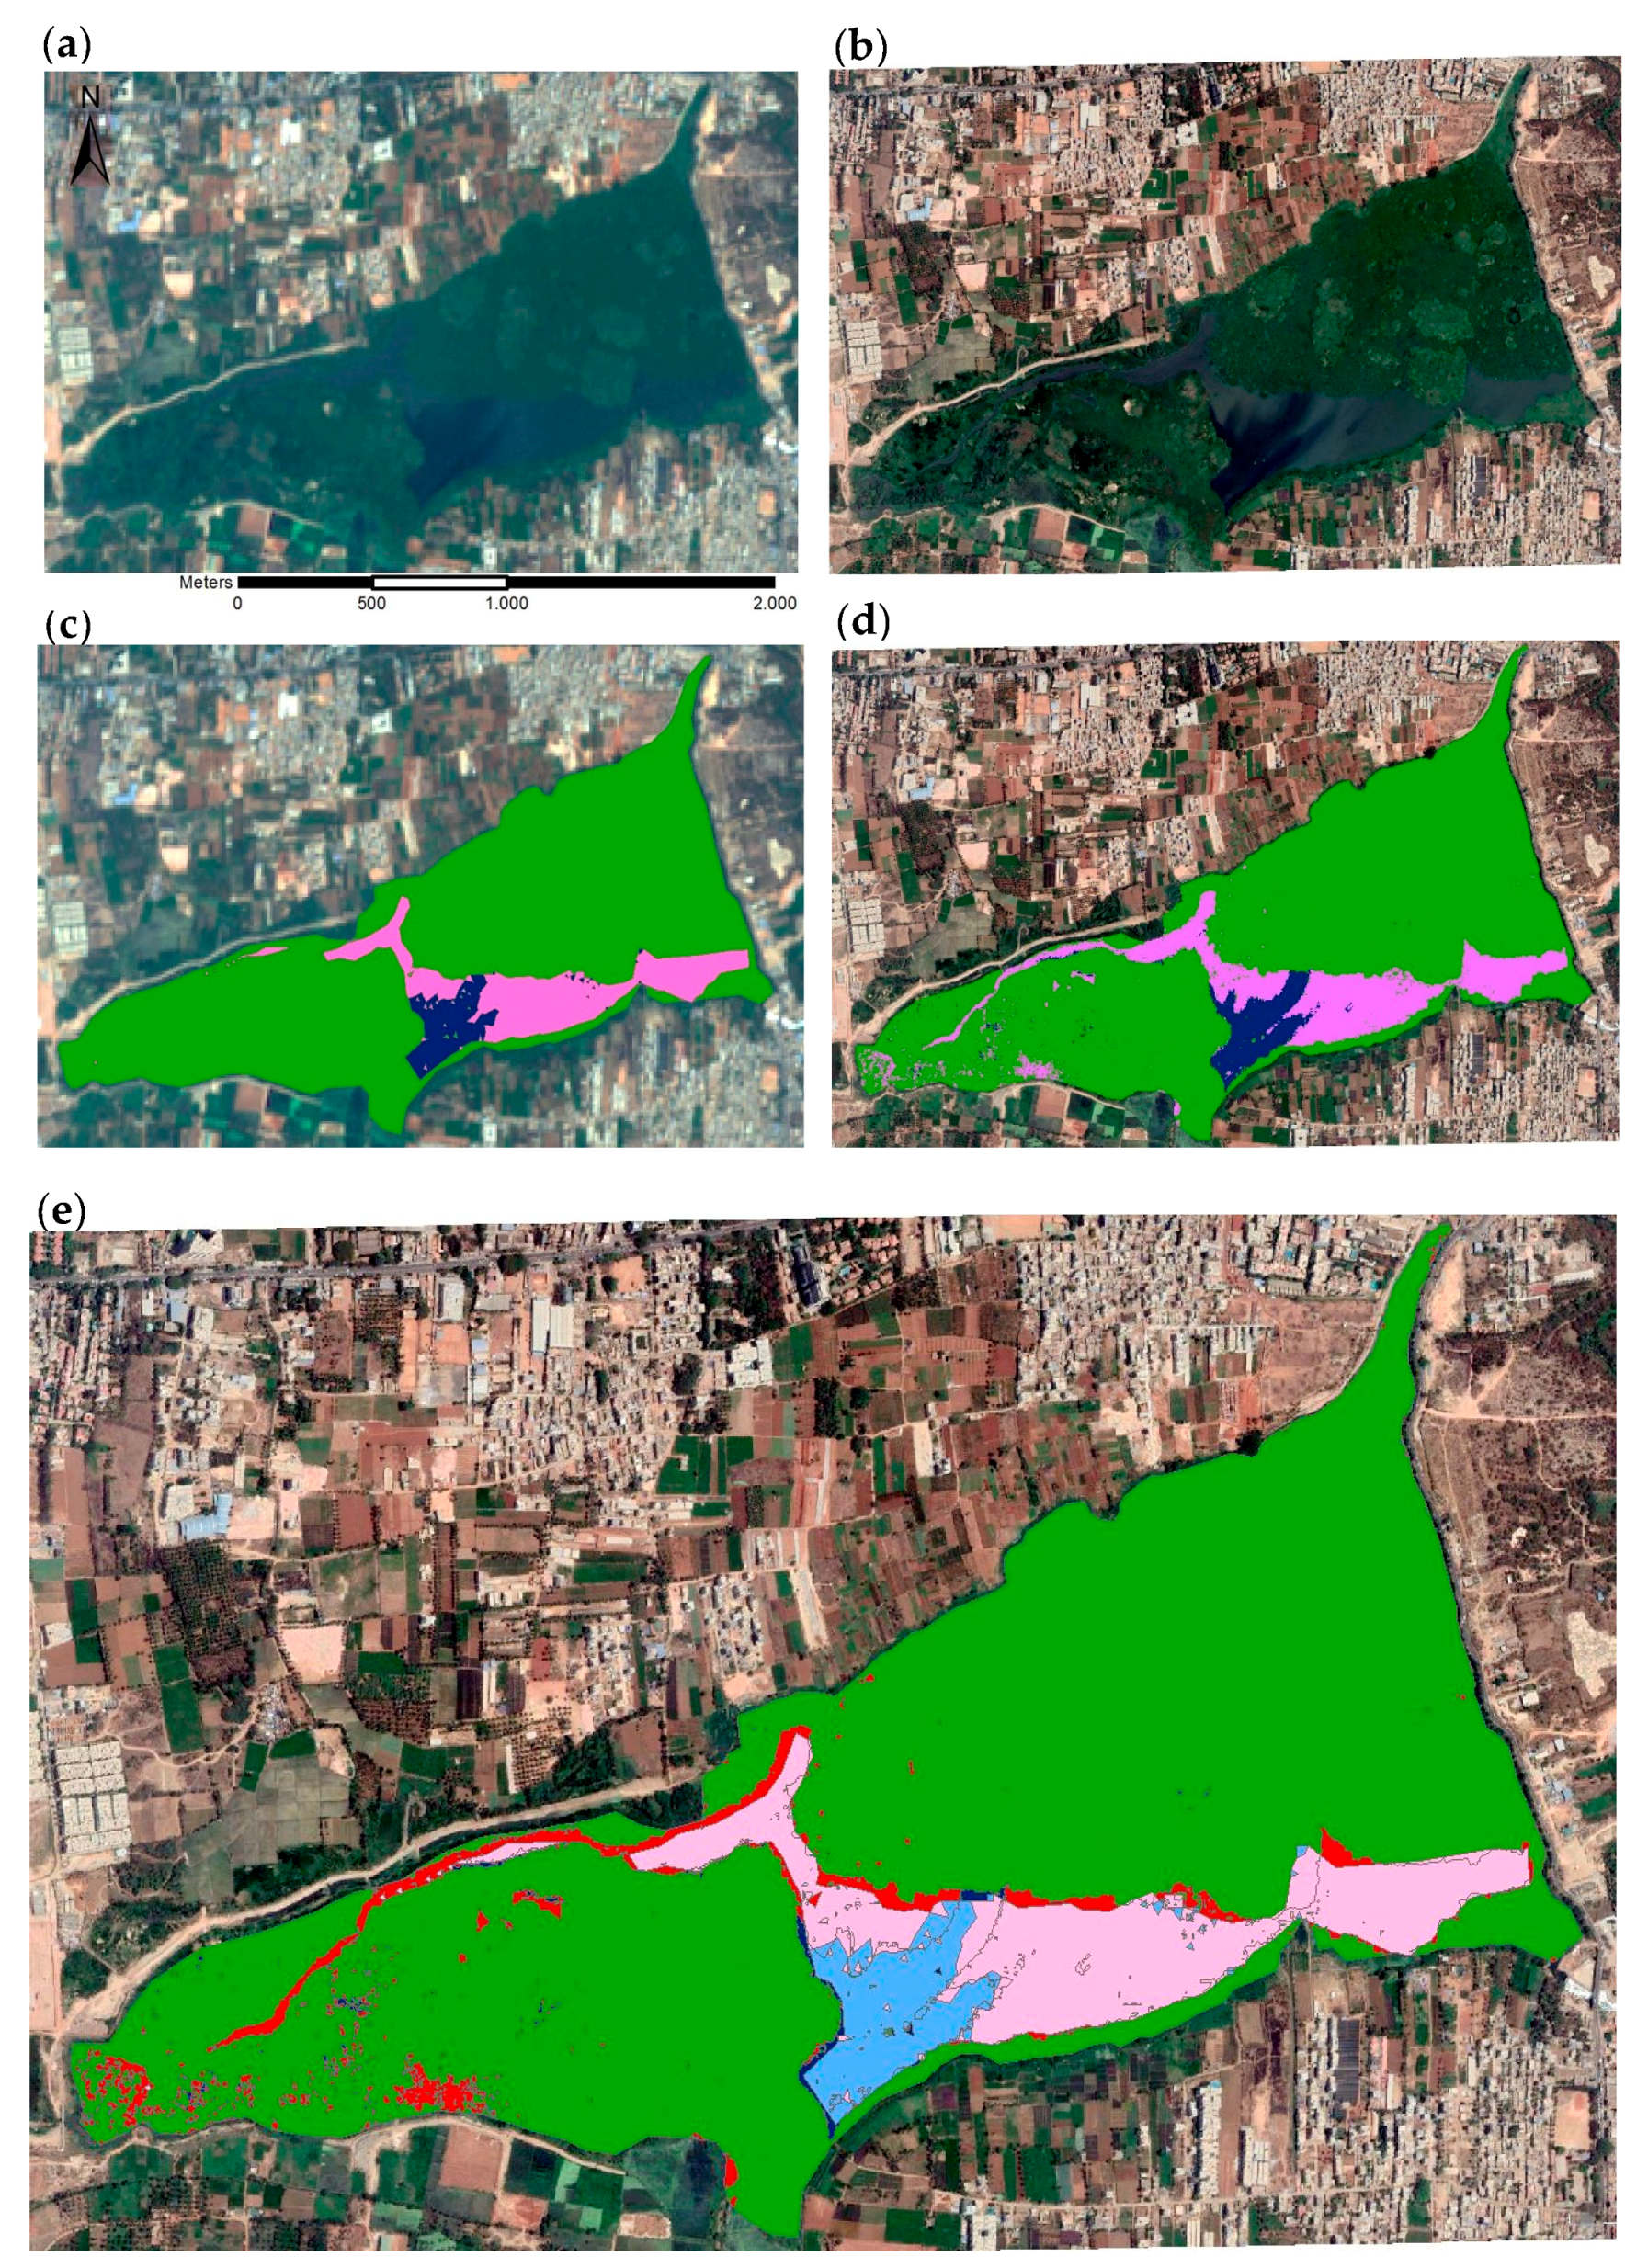
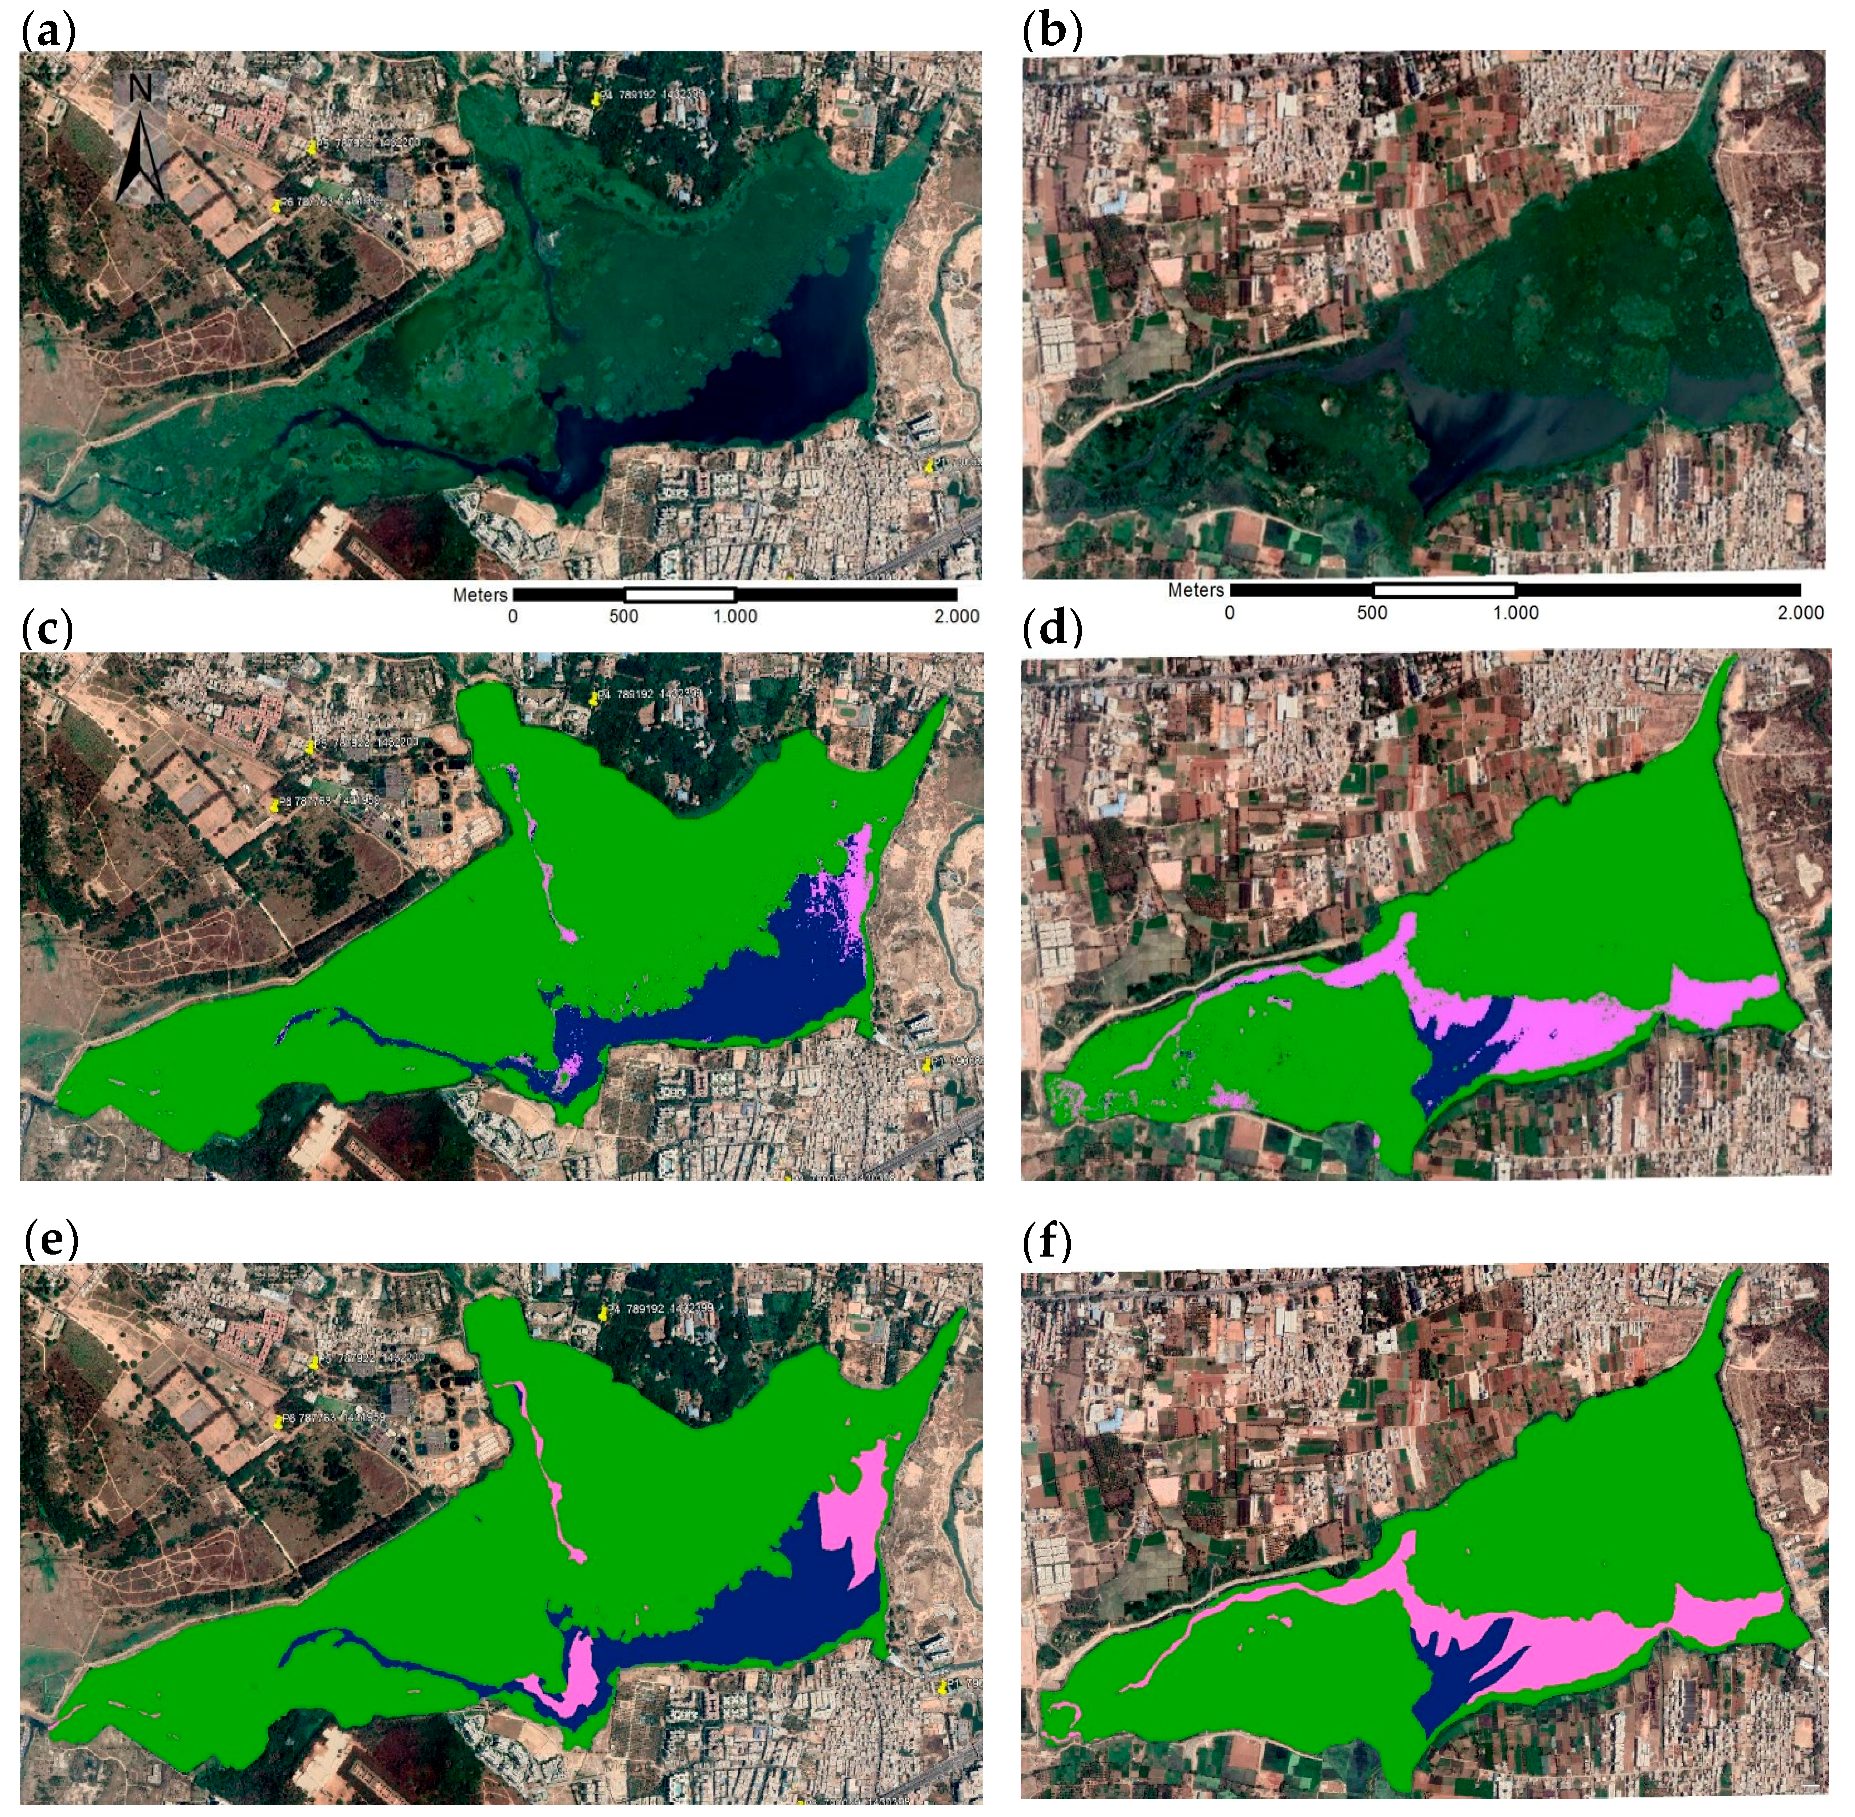
2.4. Classification of Wetland Cover

For the supervised classification process, individual training areas were digitized. Wetland surface classes were defined as follows:
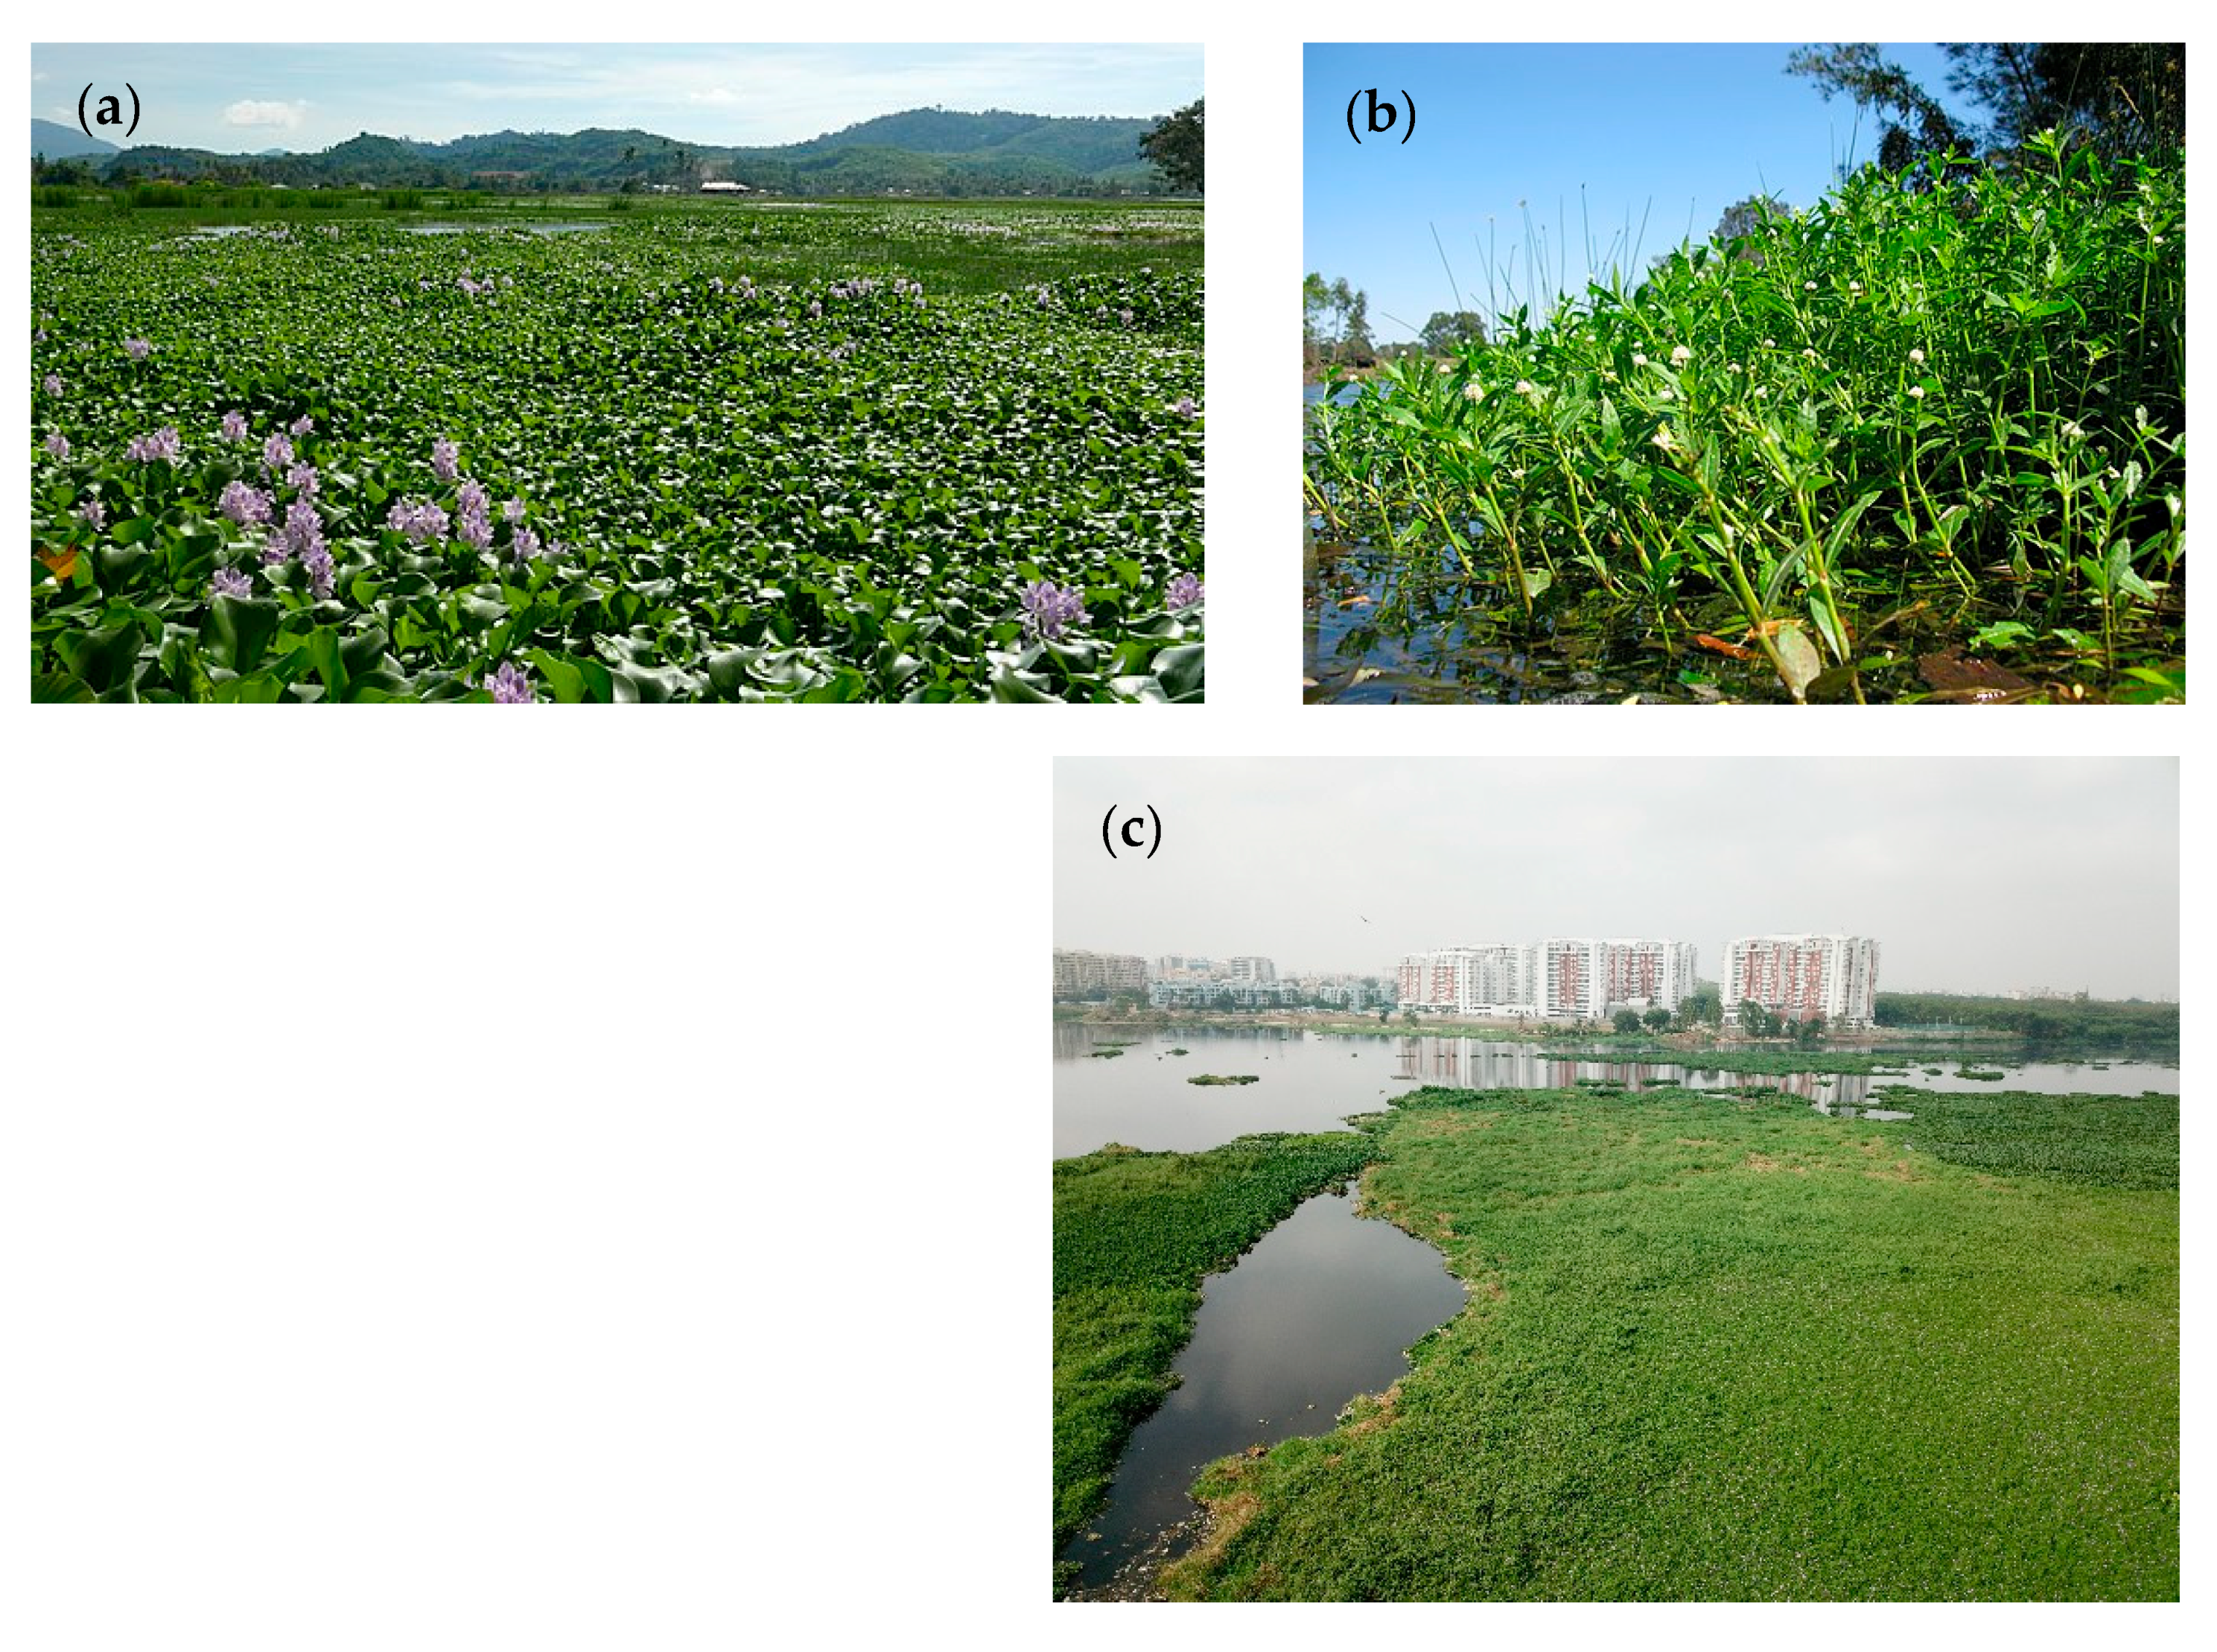
  • (i) Macrophytes: Water surface areas within the defined lake boundaries covered with visible floating-leaf and emergent macrophytes, including plants in a state of decay. This may also include small shares of either foam-covered surfaces or undefined materials.
  • (ii) Algae: Phytoplankton of various greenish shades that was visually definable and possible to distinguish from differently colored open water. This likely included microorganisms of the classes Bacillariophyceae, Chlorophyceae, Euglenophyceae and Cyanophyceae, and blooms of blue–green algae (cyanobacteria; Mahapatra et al., 2018).
  • (iii) Open water: Water surface without any cover and without clear visual signs of phytoplankton propagation.
The spectral signatures within the macrophyte class varied widely across seasons and years, and between both lakes for the same date, likely reflecting different shading or light exposure. This required close supervision of the classification process using the maximum likelihood classification technique [56,57] and the choice of approximately 5 to 30 representative training samples for each cover class. After each classification process a visual comparison between the classification results and the original image was undertaken. If inaccuracies were detected on-screen, further training sites were added to the signature file before re-classification (Figure 3 and Figure 4). As the RGB data were optically checked during and after the closely monitored classification process, the conventional confusion matrix calculation [58] was not expedient for the classification and no further accuracy assessment was performed. For the multispectral Sentinel-2 and WV02 scenes, we applied the same maximum likelihood classification process, but used near infrared bands (band 8 from Sentinel-2 and band 4 from WV02) as the base scene to detect macrophyte class pixel and band 2 (Sentinel-2 and WV02) to detect algae pixel.

2.5. Post-Processing and Space-Time Analysis

For area extraction after supervised classification, all images were further processed and subjected to statistical analysis. Image availability restricted the analysis mainly to the post- and pre-monsoon seasons, the periods of high macrophyte expansion with likely effects on algal propagation [22,37].

2.5.1. Seasonal Analysis

To detect repeated spatio-temporal changes of macrophyte and algae cover for each lake across the period of analysis, a seasonal segmentation was conducted through images from the end of the south-west monsoon (September) to the pre-monsoon season (April). This comprised a time series from 2015 to 2016 (4 images, September–April), 2016 to 2017 (5 images, November–March), and 2018 to 2019 (7 images, October–March). To identify monthly changes in lake cover, the mean shares of all years from 2008 to 2019 for the months of November and January to April (months with minimum four images available) were calculated. Data from 2002 to 2004 were not included in this seasonal analysis, as only one image per year, each from a different month, was available which could lead to deviations from the mean data for respective months compared to the other months. In addition, algal occurrence was less distinct among these older images.

2.5.2. Multi-Annual Analysis

For long-term cover analysis, all 31 images per lake were compared across the 2002–2019 study period (“long term time series”). As February, March, and April months offered the highest quantity and continuity of images, a time series solely comprising these 15 scenes for the same time span was studied as well (“post-monsoon long term time series”). Long-term cover change for months with highest counts of individual images across multiple years was also evaluated. This included January 2010–2019 (6 images), February 2004–2019 (5 images), March 2002–2019 (6 images), and November 2012–2018 (4 images).

3. Results

3.1. Wetland Cover

Maximum likelihood classification of GE true-color and same time Sentinel-2 and WV02 images as well as hand-digitizing of surface cover shares yielded comparable results (Figure 5, Figure A1, Figure A2 and Figure A3). High-resolution multispectral WV02 data allowed a more precise cover class distinction than GE images of which some macrophyte pixels were incorrectly classified as algae due to their similar spectral RGB-composition. Multispectral Sentinel-2 image classification suffered from a slight inaccuracy through misclassification of border areas between macrophyte and algae due to lower spatial resolution compared to GE-imagery (Figure 5, Figure A2).
At both lakes and across almost all GE images, macrophytes were the dominant cover class ranging from 30% to 86% at Bellandur and from 29% to 97.5% at Varthur, mostly depending on the month and season (Table A1). All cover classes showed highly dynamic spatio-temporal variability within analyzed timespans, both in short- and long-term analysis. The macrophytes class was the only one that temporally persisted because it never fell below 29% of wetland cover. A consistent antagonistic effect of macrophytes and algae occurred (Figure 6). The cover portion of the algae class varied from 2% to 65.5% at Bellandur and from 1.5% to 44% at Varthur. Open water occupied 1% to 23% at Bellandur and 0% to 48% at Varthur, usually declining with algal increment at Bellandur. This did not occur at Varthur, where the open water area was more prevalent (average <20% at Varthur compared to <10% at Bellandur) and more variable. Seasonal expansion and reduction trends were similar for both lakes within the same cover class (Figure A4, Figure A5 and Figure A6), although absolute shares often differed.
Across the whole 17-year study period at Bellandur, macrophytes expanded strongly while reciprocally algal distribution shrunk, but altered differently, annually and inter-annually. Across time, average macrophyte cover was similar at both lakes (Bellandur 58% and Varthur 59%), but data differed for algae (35% Bellandur and 24% Varthur) and consequently for the share of open water (8% at Bellandur and 17% at Varthur).

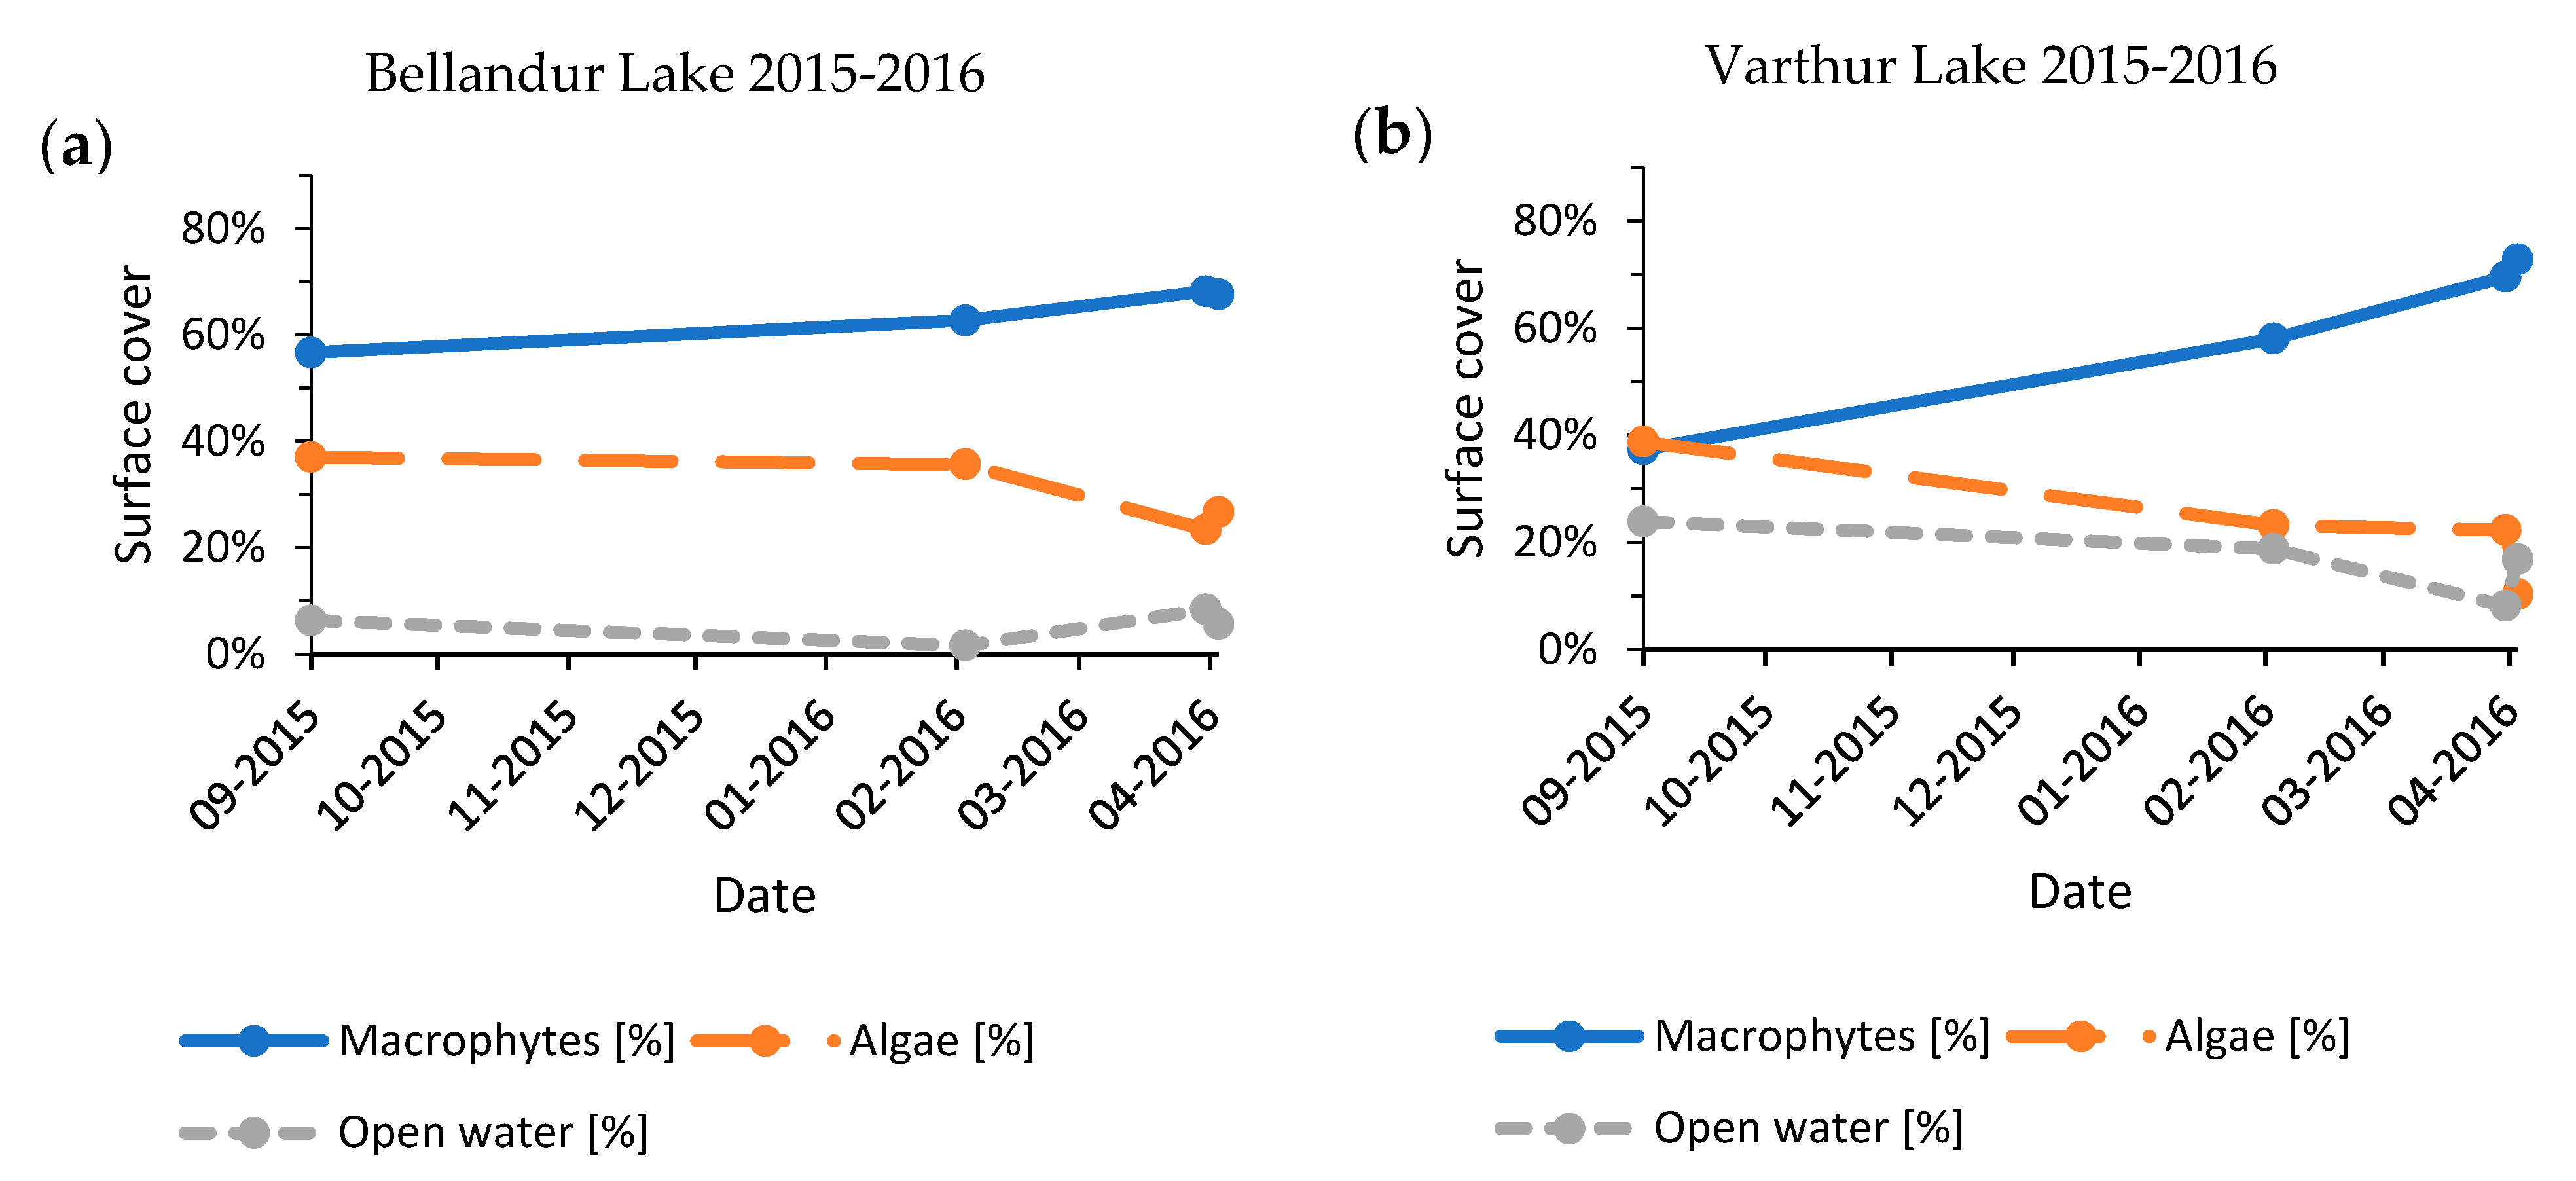
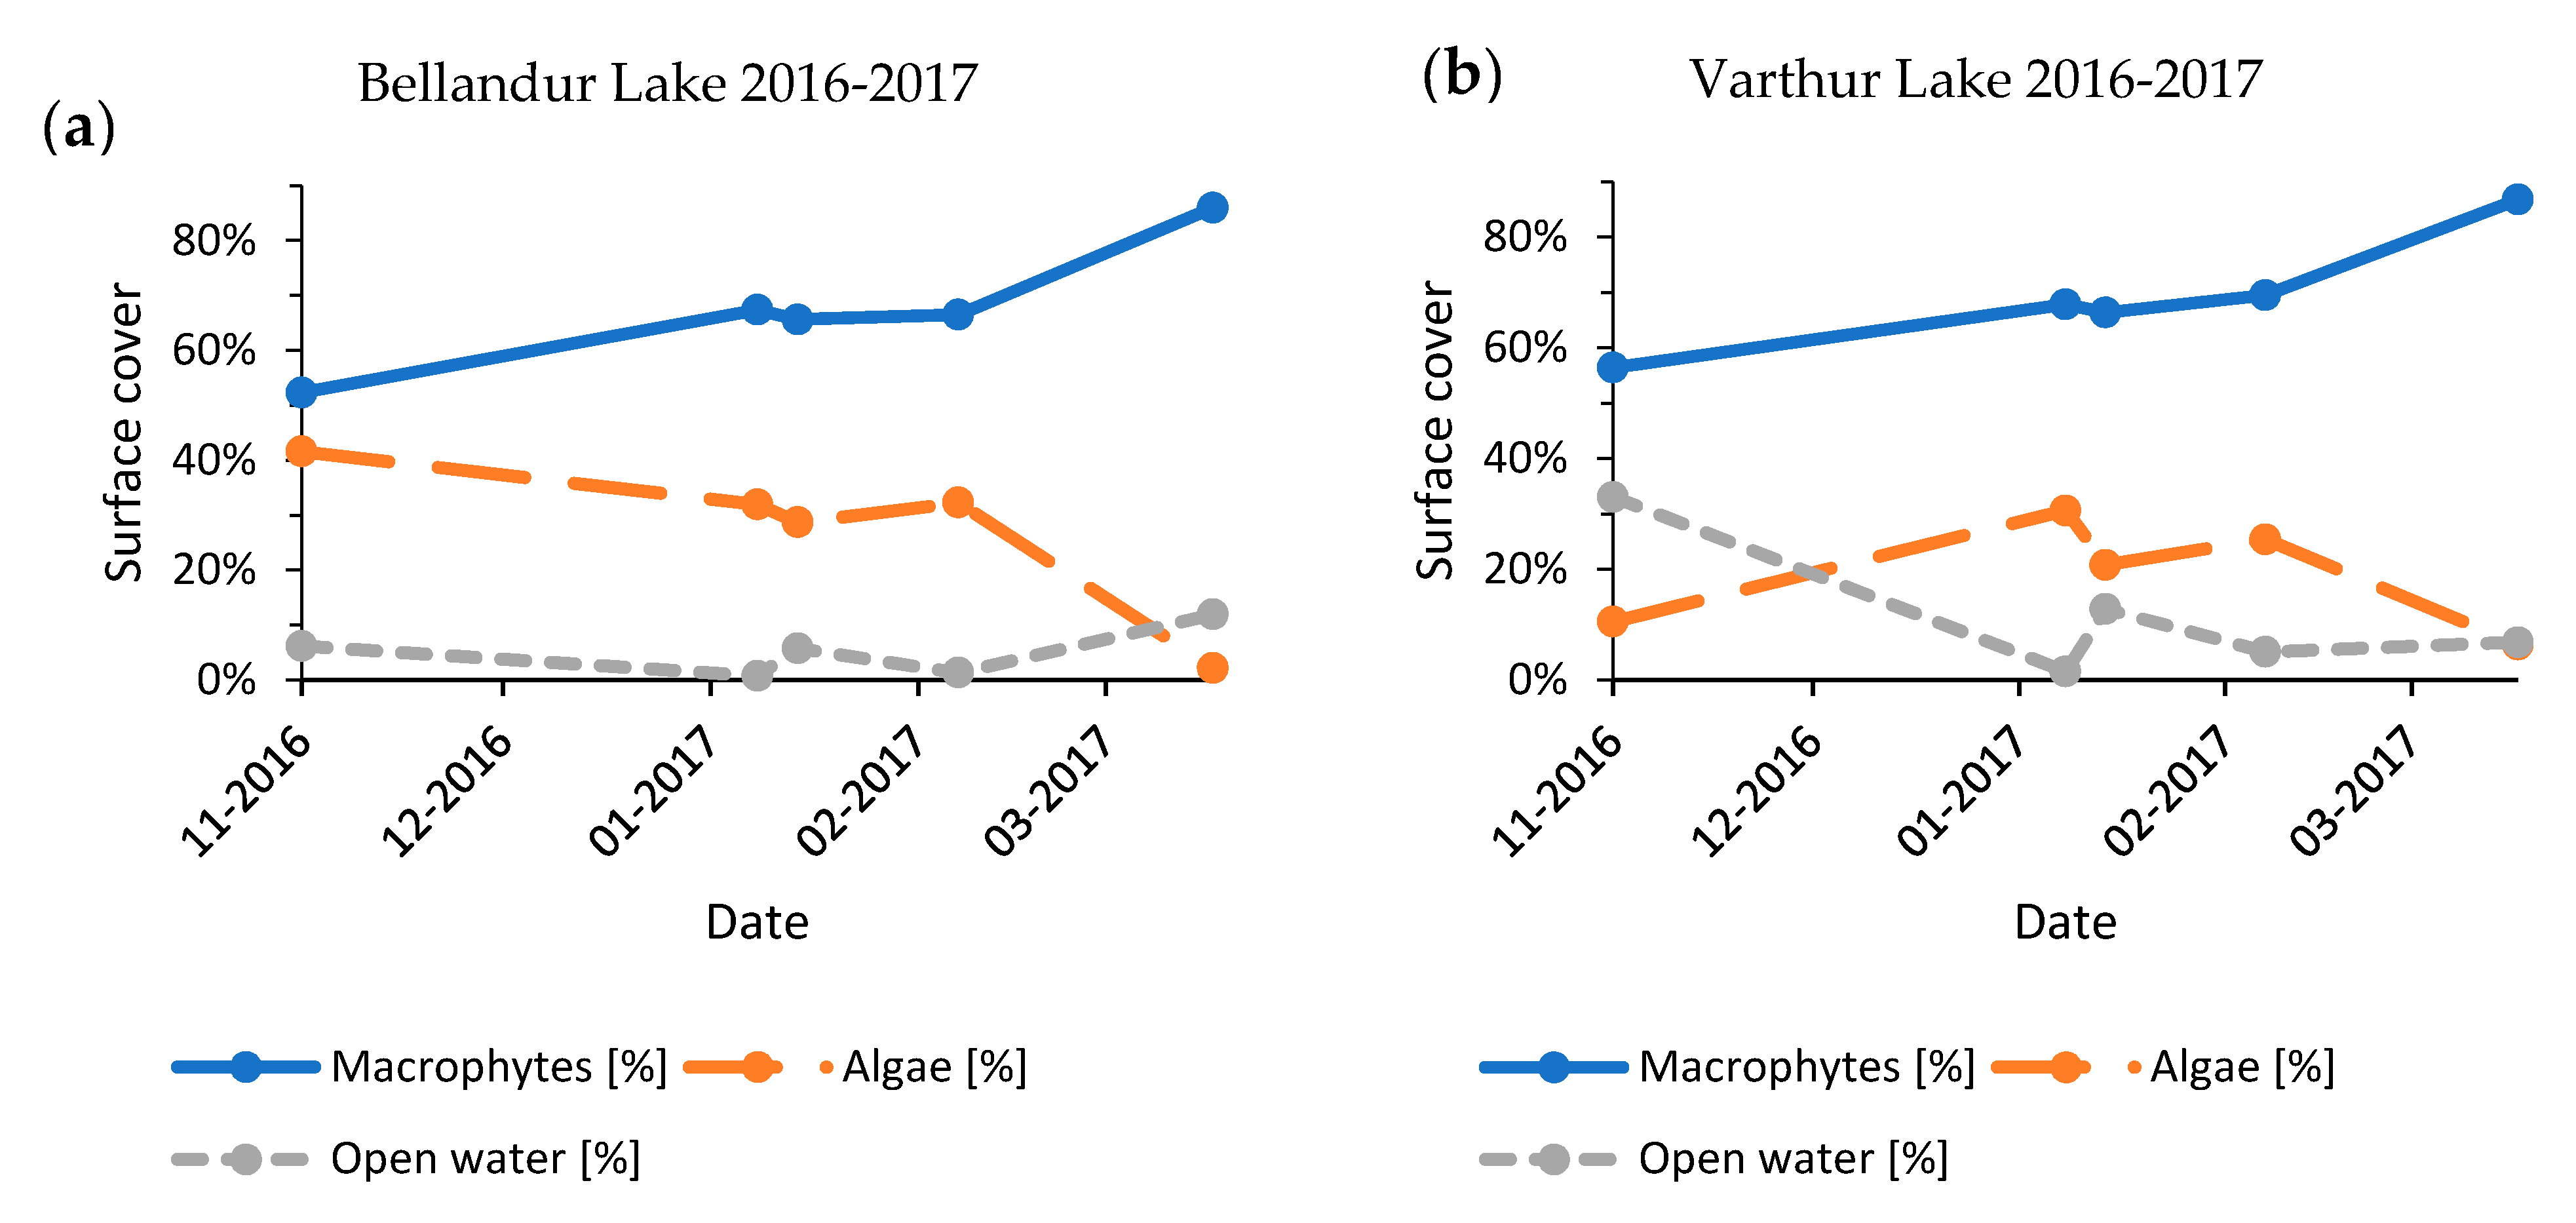
3.2. Seasonal Dynamics

The long-term data from both lakes indicated a complex pattern of a seasonally repetitive increase in macrophytes and decrease in algae after the south-west monsoon (October/November) and until April (Figure 6 and Figure 7). This trend starts new each year from a lower coverage of macrophyte and a higher one of algae than before the monsoon period (Figure A4, Figure A5 and Figure A6). Shares within the classes differed usually between different years even for the same months, but the overall negative correlation between macrophytes and algae was consistent, and more pronounced at Bellandur than at Varthur (Figure 7). Precipitation data plotted against average monthly cover percentages indicated an annual rise of macrophytes and shrinking of algal shares alongside waning rainfall after the monsoon period and until rains restart in April.

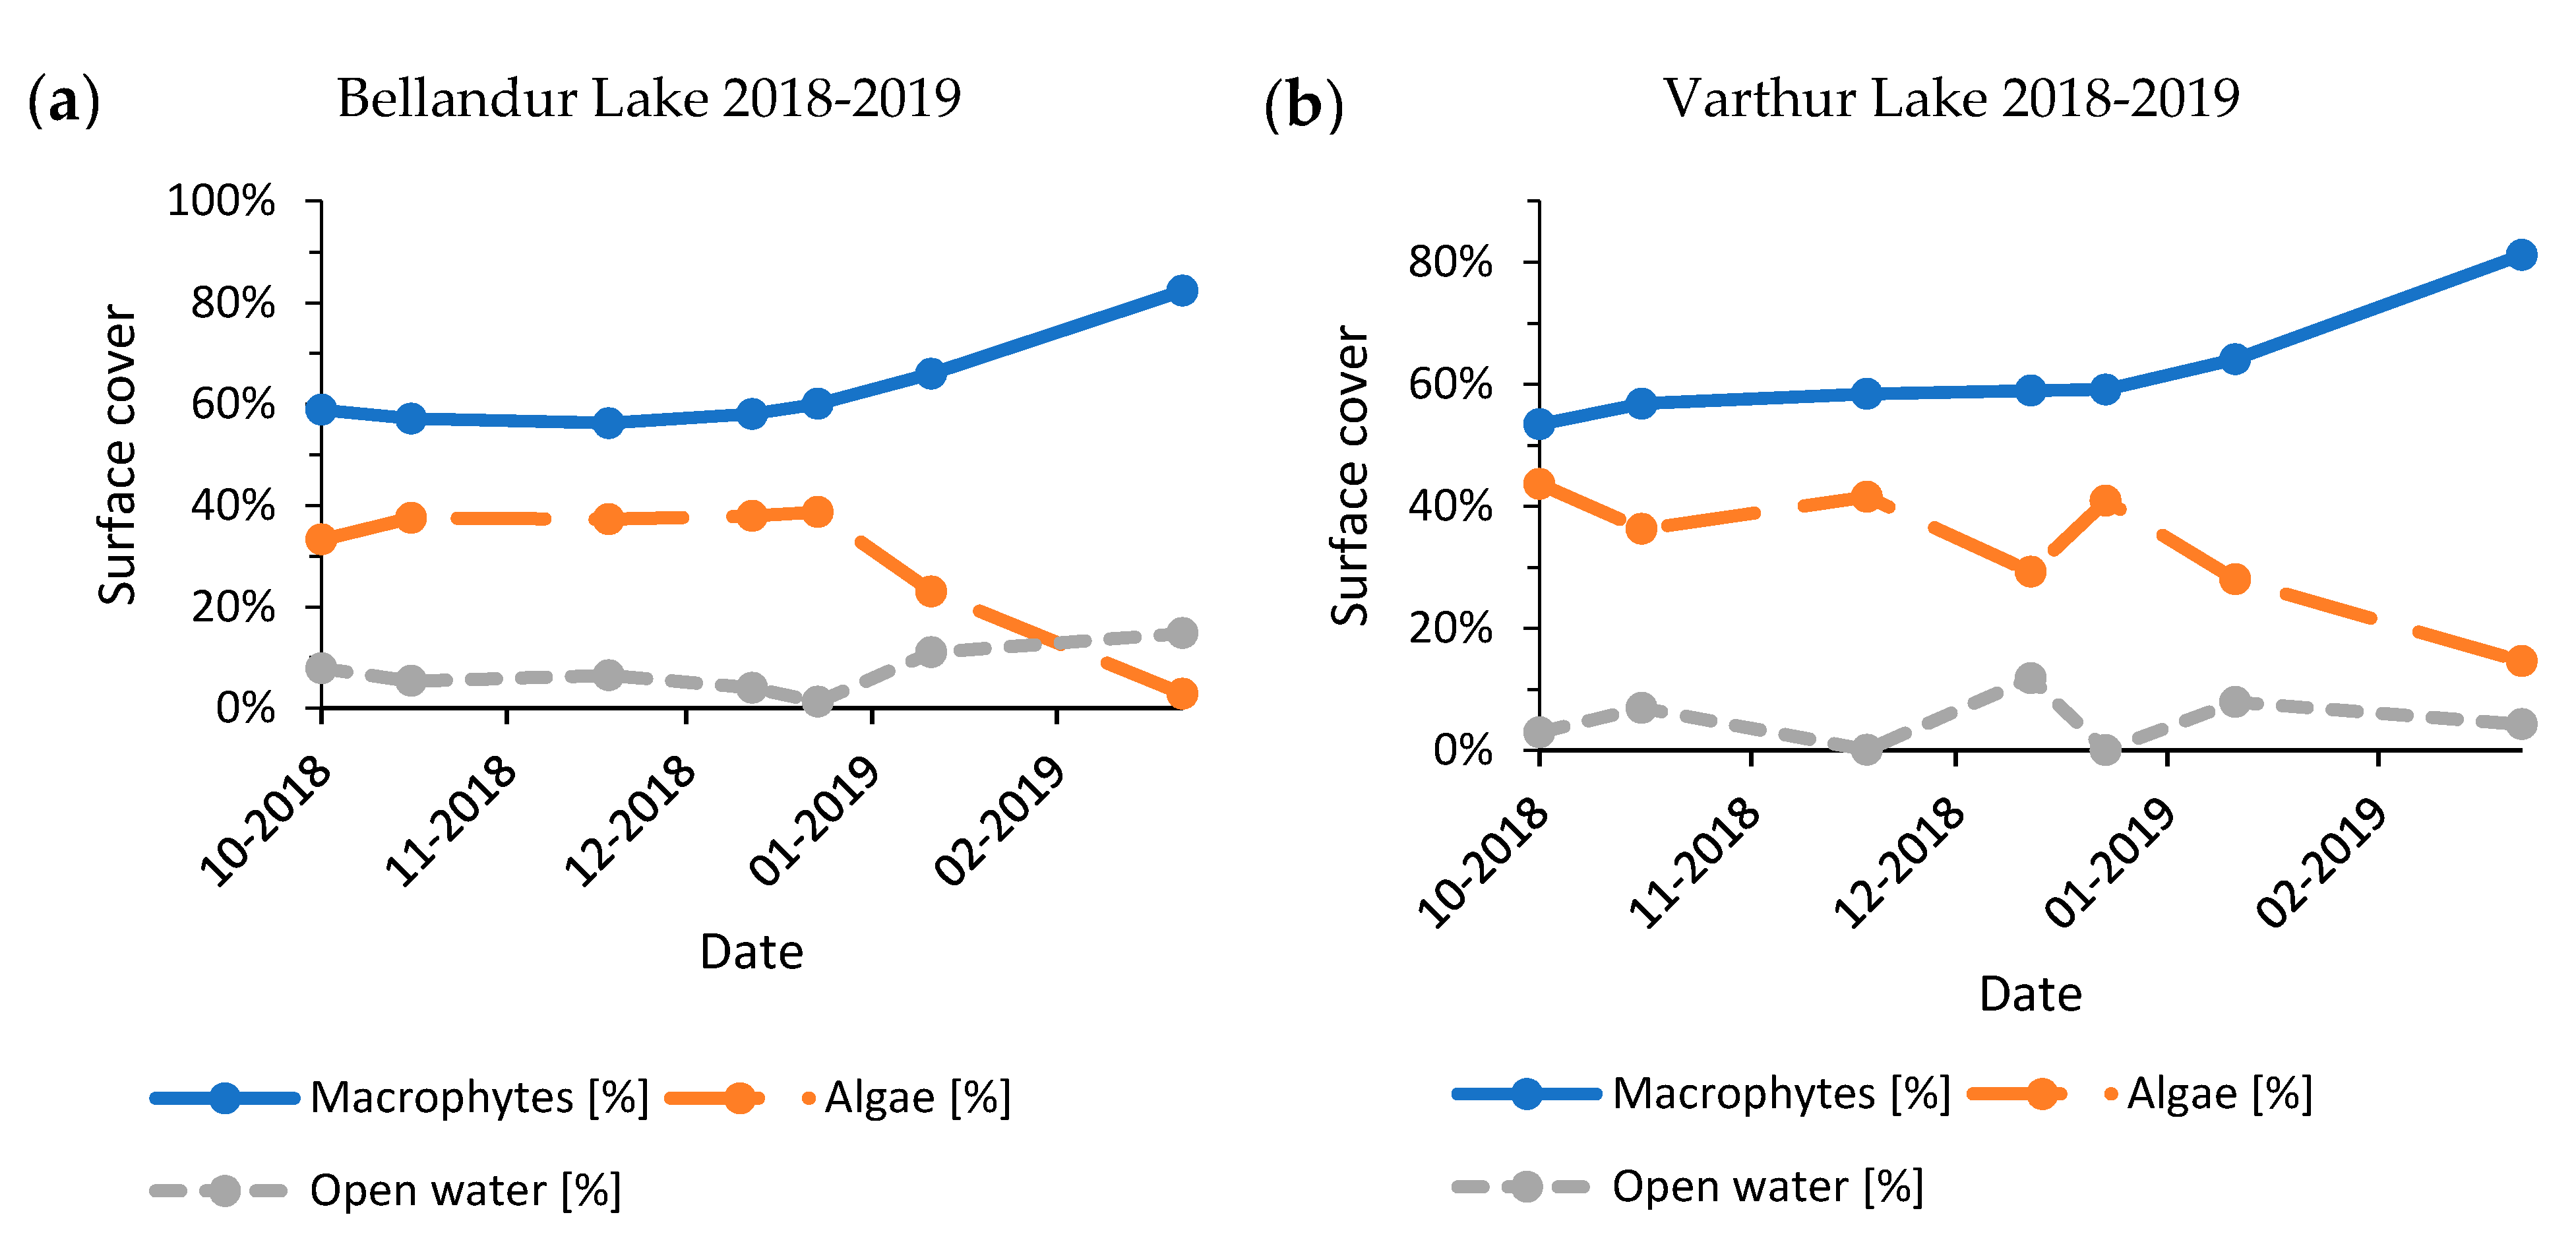
3.2.1. Inter-Annual Seasonal Trends

The seasonal time series from years with most post-monsoon images (2015–2016, 2016–2017, and 2018–2019) revealed a consistent pattern of slightly increasing macrophyte cover until January–February, followed by a strong increase until March–April (Figure A4, Figure A5 and Figure A6). Results for Bellandur and Varthur showed a dependency (2015–2016: p < 0.01, n = 4; 2016–2017: p < 0.01, n = 5; 2018–2019: p < 0.01, n = 7). Reverse mirrored algal expansion also responded to the available open water, whereby very low percentages of open water (<4%) were always followed by a decline of the algal fraction. Propagation of algae appeared to be more volatile than of macrophytes.

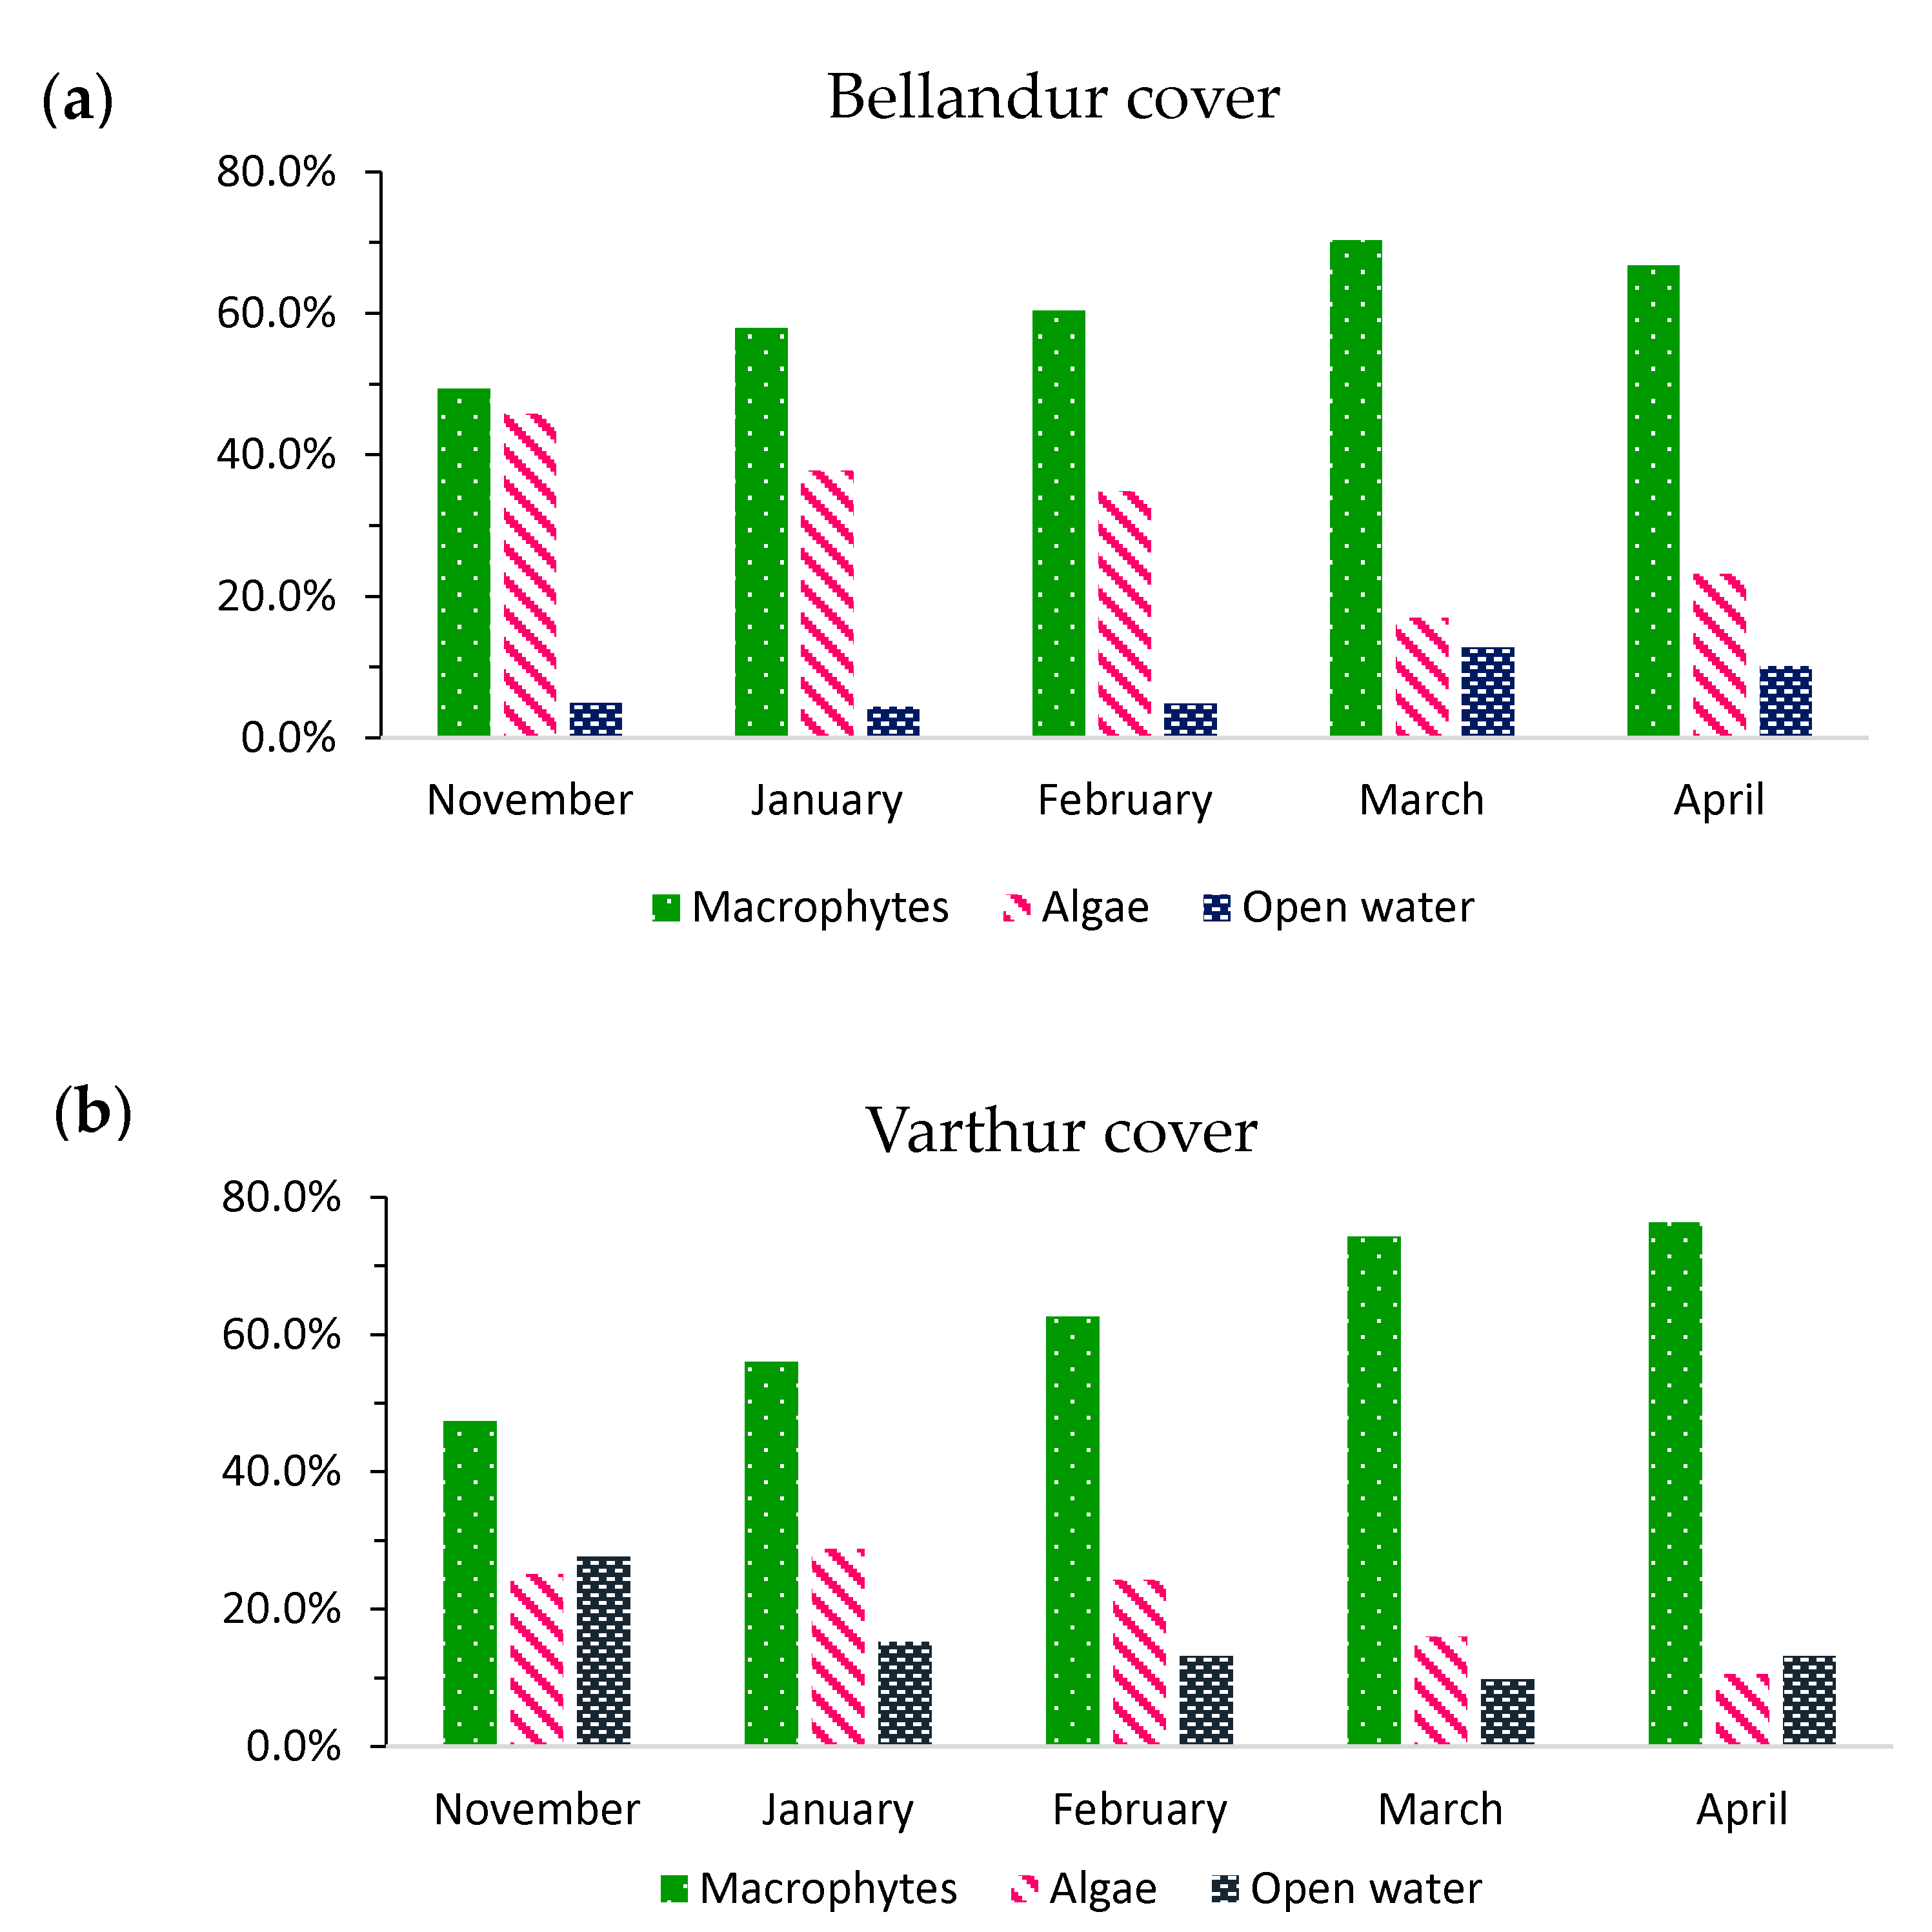
3.2.2. Average Seasonal Cover

Category averages for November, January, February, March, and April (2008–2019) revealed a consistent increase in macrophyte spread and a decrease in algae until March (Figure 8). At Varthur, with generally more open water, the much smaller algae cover declined slower, and macrophytes would still increase in April to a maximum of 76% (minimum November 47%), whereas Bellandur had its maximum of 70% in March (minimum November 49%) which declined slightly in April to 67%. Meanwhile, algal propagation declined from a maximum of 25% in November to 11% in April at Varthur and from 46% in November to 17% in March at Bellandur. The 2008–2019 average cover of macrophytes for the analyzed period of November and January to April altogether was around two thirds and similar at both lakes, whereas algae cover differed between the lakes with ~20% at Varthur versus ~30% at Bellandur.

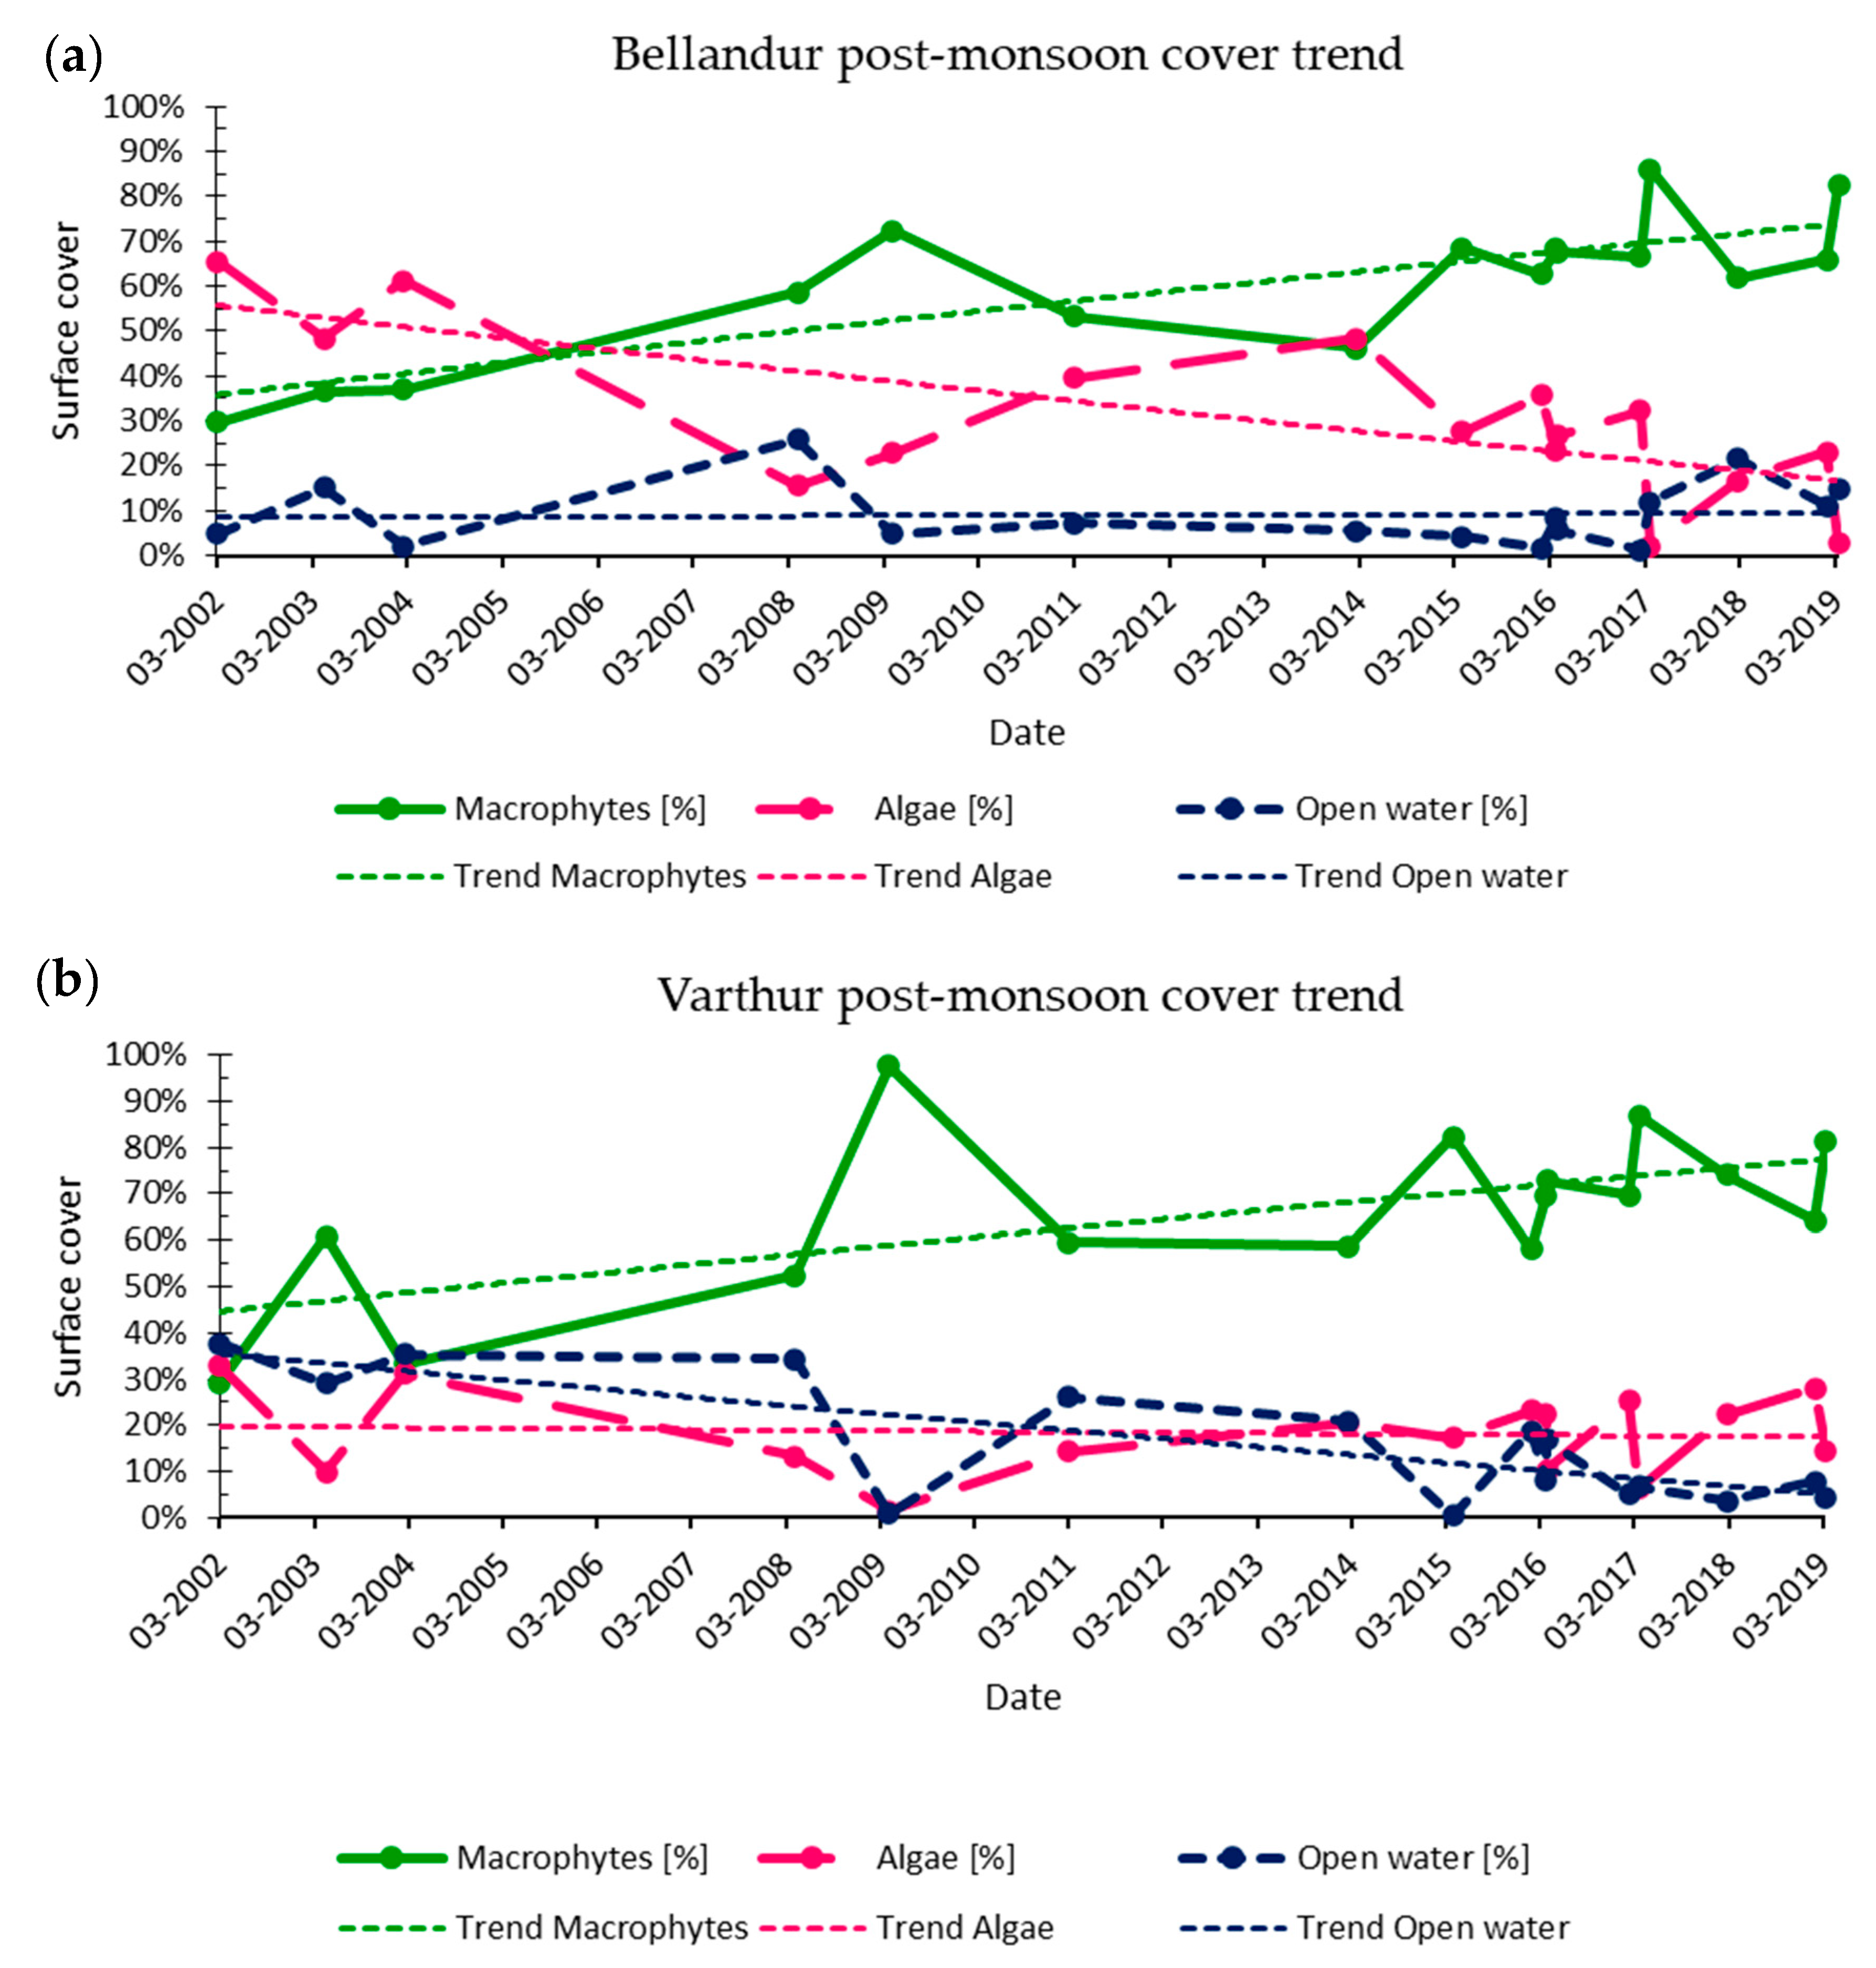
3.3. Long-Term Dynamics

For the February, March, and April data of the 2002 to 2019 time series (Figure 6), the analysis revealed for both lakes a similar rise in macrophytes cover from 2002 (~30% cover) until 2009, then a decline (2011 and 2014), and subsequently again a rise until 2019 (~81–82% cover). Across all years there was a significant increase in the logarithmical trend line (p < 0.05 for both lakes), both for the “long term time series” (all images) and the “post-monsoon long term time series” (Figure 6). Changes in macrophyte area ratios appeared to be similar for both lakes and the patterns of macrophyte expansion were accompanied by a reverse cover distribution of algae, whose long-term decline was strong at Bellandur, but for Varthur only discernible in the “post-monsoon long term time series”. Thereby, the trend line started with a ~10% higher macrophyte cover at Varthur but reached a similar 75% cover at both lakes. The share of open water was generally higher at Varthur, where it varied between 20% and 40% until 2013 and remained afterwards between 0% and 20% when macrophytes were more abundant. Bellandur, instead, had an overall lower portion of open water which usually amounted to <10% of the entire wetland cover. Thus, less surface space remained for algae during the strong post-monsoon growth of macrophytes, as compared to Varthur.

4. Discussion

Apart from insights into the Bellandur and Varthur lake-cover dynamics, our results provide new information about the suitability of time-series of high resolution-RGB GE imagess for the classification and detection of macrophyte and algal distribution within wetlands.
The lake cover dynamics of the Bellandur–Varthur lake system depend on many factors, which reshape constantly as part of the rural–urban transformation environment. Important determinants for macrophytes and algae are lake and air temperature, light intensity, precipitation, seasonal winds, pest-infestation intensity, human de-weeding and fodder harvesting, influx and outflux of volatile waste and storm water loads, water residence time, lake depth, and alterations of water passage through the sediments and macrophytes [20,36,38,60,61]. These multi-causal interactions restrict comprehensive ecological statements [62]. Nevertheless, some general conclusions about obvious relationships between environmental impact and lake cover development can be drawn.

4.1. Classification and Identification Process

Comparative classification results of multispectral Sentinel-2 and multispectral WV02 images, as well as visual comparisons suggest a coherent accuracy of the derived data (Table A1, Figure A1, Figure A2 and Figure A3). Macrophyte cover could be delineated adequately, especially when compared to traditional classification of satellite images with lower spatial resolution [35,43,44]. This was also noted when comparing GE to the 10 m-resolution Sentinel-2 images, where border region pixels between cover classes were erroneously identified as macrophytes (Figure A2) [63]. Misclassified pixels could easily be detected on-screen, as solely three classes of wetland cover formed largely coherent shapes and clusters. Although it was not possible to easily correct misclassified pixels through adjusted training data, the spatial–temporal changes within the lake cover were consistent.
Particularly macrophytes could be reliably classified through an appropriate selection of training areas. Due to varying RGB-color intensities, light exposure of surfaces or recording sensors used [43], algal boundary identification was challenging when selecting training samples and classification output depended on visual interpretation. This may have led to an underestimation of algal propagation and overestimation of open water within some images of lower macrophyte cover. For example, within a few days, two Varthur Lake images depicted a macrophyte increase that was accompanied by a three times higher decrease in algae. This could have been due to the mentioned classification difficulties or to true physico-chemical changes in the lake. A subdivision of algal occurrence into classes of different intensity or chlorophyll content could replace individual boundary interpretation but would require multispectral data or reduce adjustment options and direct comparison with other cover classes [64,65].
The more rapid and volatile life cycle of the phytoplankton communities and varying shares of open-water algae reflecting changing classification precision may explain the volatile algae cover in our analysis, compared to the steadier patterns of macrophyte proliferation [37]. The ambiguities in classification accuracy only have minor effects on the seasonal results. In the long-term analysis, the above-mentioned Varthur images with lower algae cover did not play a major role in shaping the trend. Higher algae shares would rather strengthen our trend observations in this case. They depicted higher volatility than the other valuesand inversely reflected the major trends of macrophyte changes both at Bellandur and at Varthur. Another factor affecting our results were turbid water and suspended sediments, especially within narrow passage streams through macrophytes [43].
Proper image selection is the crucial factor for suitability of the GE image analysis [66]. Apparently, some of the images we used had different light spectra which affected the colors and therefore the intensity of the algal class. Therefore, the use of unprocessed GE image series for algae quantification is discouraged, but errors depend on the spectral properties of each individual RGB data set.
Combinations of multi-spectral data from different bands allow a wide range of vegetation analysis [64,67]. Our Sentinel-2 and WV02 scenes revealed the advantage of classifying macrophyte areas free from algae pixel by stringent segmentation of water surfaces (including algae) and macrophytes through the NIR bands. Supervised GE-image classification on the contrary could not prevent mixing of the pixels between different classes; algae pixels especially were mixed into macrophyte plots. Nevertheless, the visual revision of each GE image, as well as comparable classification results of multi-band and only RGB-image classifications, highlighted the suitability of GE data for our spatio-temporal analysis of lake cover changes. The misclassified pixel had only a minor, but ultimately controllable, influence on overall cover shares. The high GE image resolution instead enabled sharper delineation of cover class boundaries compared to lower resolution Sentinel-2 scenes.
Although our approach using RGB images from the GE platform yielded satisfactory results, other methods should also be considered. As indicated by the results of the WV02 image classification, high multispectral resolution could help in a more accurate or automated classification allowing usage of the same spectral bands for all analyzed images [67]. Successful efforts with an Object Based Classification approach have been reported by Laba et al. [68] as well as by Chabot et al. [69] and Visser and Wallis [70] using an unmanned aerial vehicle (UAV). This also allows more temporal flexibility in image collection compared to reliance on discontinuous GE data. The use of spectral or hyperspectral data combined with in situ sampling of reference-plant populations would allow to distinguish between different plant species and between emergent and floating-leaved plants [71,72]. This could help to clarify whether emergent plants or floating islands are responsible for the observed long-term increase in macrophyte cover.

4.2. Lake Surface Dynamics

The seasonal and inter-annual patterns of macrophyte and algal growth dynamics were similar at both lakes. They likely reflect physio-chemical processes that characterize the ecological regimes of urban wetlands [22,37]. The seasonal cover dynamics found in our study confirm observations described by other scholars that focused on macrophyte, algae or water load patterns of Bellandur and Varthur [13,22,30].

4.2.1. Seasonal Dynamics

The data consistently showed the seasonal inverse relationship between increasing cover of macrophytes and algae, particularly during the post-monsoon season until March–April. Thereby, the spread velocity and extension may vary annually, monthly and even within shorter periods, but the general extension and shrinkage patterns of wetland cover as a function of the seasonal monsoon-climate conditions [37] were similar every year at both lakes. Our data for Varthur also indicated that the patterns of algae cover can deviate from this trend, once there is enough free space (“open water”) available for propagation [30].
The analysis of Bellandur’s post-monsoon cover (Figure 8) showed declining macrophytes with increasing algae cover from March to April, which contradicted the usual trend. This anomaly may be explained by the long-term increase in macrophyte coverage: the image dates reveal that March included images from 2019 and 2017 with very few algae and many macrophytes. The April data instead included 2008 and 2009 images with much less macrophytes and more algae in the same month, resulting in the discrepancy.

4.2.2. Inter-Annual Dynamics

The analyzed images of both lakes yielded a perennial average of almost 60% macrophyte cover and approximately half of that was under algae, which was significantly higher at Bellandur and lower at Varthur. As these averages relied largely on data from post-monsoon images, they did not represent true annual means. The highly variable data show a non-linear rise in macrophyte propagation throughout the study period. This occurred at the expense of algal abundance at Bellandur but in the case of Varthur, this long-time reduction was not continuously detectable as open water portion shrunk instead of algae. The negative correlation of rising macrophytes and declining algae observed at Bellandur occurred mainly in the absence of large open water fractions (mostly < 10%) consequently leading to a lower algae cover.
A monsoon-related inter-annual discrepancy between Bellandur and Varthur became evident in the algae cover of November images. As November belongs to the north-east monsoon period and high amounts of precipitation were measured within the 30 days before the dates of all four images, which usually comes along with monsoon-specific winds [51,73], different reactions in both lakes’ cover classes are feasible. Such anomalies, however, were not observed for Bellandur with its smaller fraction of “open water” compared to Varthur.

4.2.3. Wetland Comparison with Regard to Nutrient Loads

Through various inlets, Bellandur and Varthur lakes receive large quantities of treated and untreated sewage. On their way through the connected wetlands, these waters are charged, re-enriched, altered, and filtered which affects their nutrient loads and biochemical properties [13,22]. Although the biological and chemical processes typically depend on the different loads within wetlands [30,37], the presented results show strong analogies in spatio-temporal variations of macrophyte and algal distribution patterns for both lakes. Over the seasons, the inflow, water residence time, and nutrient contents vary, mostly due to precipitation in the catchment area [22,53]. Although much data have been published about the nutrient loads of the lakes, few of them address both wetlands at the same time. Mahapatra et al. [22] reported seasonal nutrient loads of both lakes and found much higher values at inlets than at outlets. These authors also reported 50% higher loads of total P and N at Bellandur during post-monsoon season. BOD and chemical oxygen demand (COD) showed the same differences and indicated a high pollution of both lakes through untreated sewage. Due to the fact that most sewage entering Varthur had passed Bellandur before, where uptake and remediation processes lower the loads, Varthur generally receives water of lower nutrient concentration in the post-monsoon season [22]. Turbidity values, a proxy for wastewater pollution, were also found to be much higher in Bellandur [13].
The 2002–2019 rise in macrophyte cover (Figure 6) was, to some degree, more pronounced at Bellandur than at Varthur. However, when excluding the three images before the year 2008 or only considering the data after the year 2011, when more images were available, the dynamics were similar for both lakes. Therefore, we have no evidence that the different nutrient concentrations in sewage fluxes between the lakes determined macrophyte-proliferation dynamics. The seasonal time series (Figure 7) indicates that the seasonal growth dynamics are caused by factors other than nutrient fluxes [22]. At the end of every year, however, the share of macrophytes may strongly differ due to the amounts of floating biomass that has been flushed out of the lake by strong winds and heavy rainfall during monsoon period [13,30].
Due to the shrinking open water portion at Varthur, algal propagation depicted more seasonal variability and did not decline as strongly as it did at Bellandur in the long run, where open water area remained considerably smaller. Since 2002, at both lakes macrophyte cover in February rose around 30% and in March around 50% to recently 70% (Table A1). Both months underwent the highest long-term rise, which seasonally restricted algal spread massively [37]. This induces further implications on waste-water-treatment capacity of the whole system, as algae have important nutrient uptake and water-purification capabilities that differ from macrophytes. In addition, seasonal decay of macrophytes lowers the dissolved oxygen (DO) concentrations which decreases water quality [30,37].

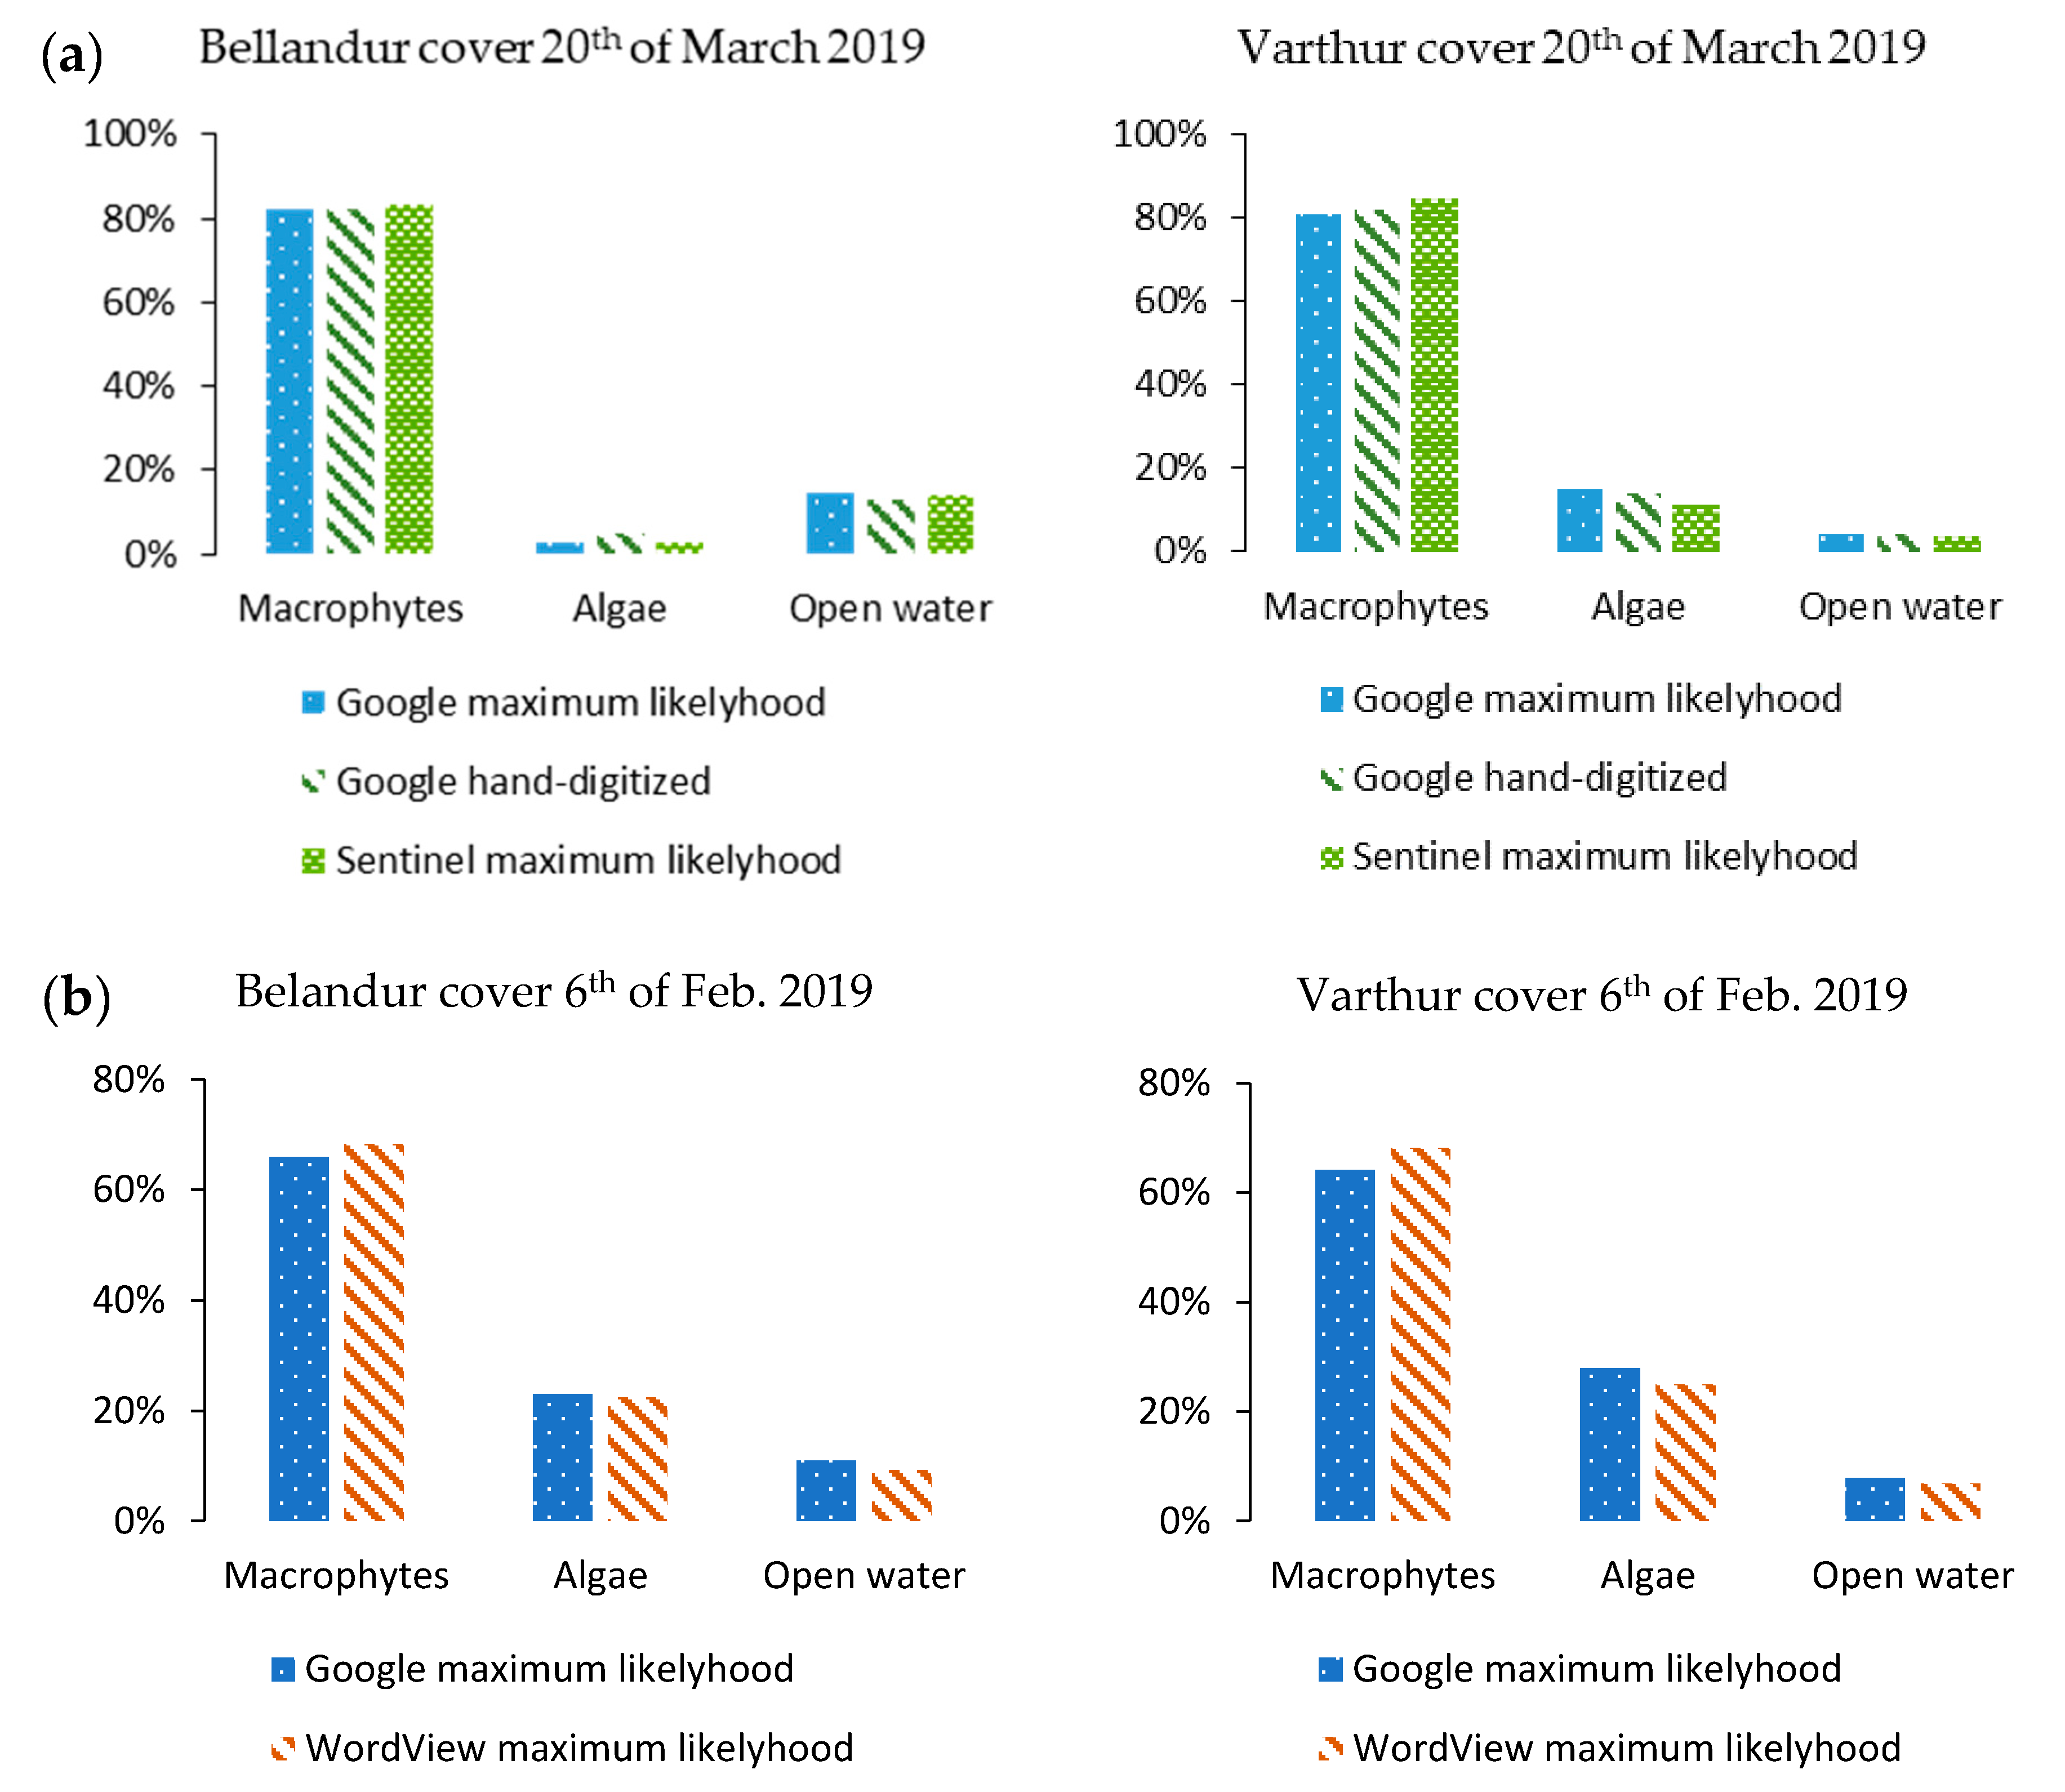
4.3. Differences in Cover Analysis

Remote sensing approaches of classifying wetland cover are commonly based on satellite images with high multi-spectral or hyper-spectral resolution, but lower spatial and temporal resolution than used in our study. Higher spectral resolution allows complex classification techniques based on a more elaborate image pre- and post-processing [35,57,65]. Due to technical difficulties in spectral differentiation of phytoplankton and macrophytes, comparable classification that includes both algal spread and macrophyte cover at the same time is rare [67]. Studies about their interrelations in eutrophic lakes are even less frequent.
In contrast, many studies on the dynamics of invasive macrophytes as a consequence of eutrophication of urban lakes exist [2,57,74,75]. In contrast to most urban lake systems, the water flow rate passing through the Bellandur–Varthur system is relatively high year-round, which could explain the predominance of some macrophyte species such as water hyacinth compared to the typically stronger microorganisms and algal blooms [76].
For Varthur, Mahapatra et al. [30] also conducted spatial analyses and described seasonal variations in macrophyte spread for 2009. They reported an average cover of one third of the lake lasting from the end of the monsoon period until January and further expanding to two-thirds in the post-monsoon season until June. As Mahapatra et al. [30] used the broader administrative boundary lines to determine lake features and Landsat and IRS LISS satellite imagery with medium spatial resolution, their results had a lower spatial precision than ours and did not include algae cover.
Ramachandra et al. [13] also conducted a seasonal macrophyte cover analysis for Bellandur. As there are many more GE images available for this single lake than for our study of both lakes, they could generate monthly data for pre- and post-monsoon seasons of the years 2015 and 2016. They derived seasonal trends, whereby growth of macrophytes was highest between February and April. This was in line with our multiple-year data, although given their wider lake boundaries their values of 55% cover for the post-monsoon season were lower than ours.

4.4. Macrophyte Ecology

For Bellandur and Varthur lakes, increasing eutrophication led to massive expansion of the two invasive exotic macrophyte species E. crassipes and A. philoxeroides (Mart.) Griseb. at the expense of the other eight macrophyte species found in 2009 at Varthur [36]. E. crassipes suppresses other species through its thick floating-plant cover that shades water and creates locally anaerobic conditions. Its existence inhibits photosynthesis and other essentials while creating a self-stabilizing ecosystem on its own that can prevail throughout environmental alternations [77]. This impact and the shading by algal communities [78] may have contributed to the very limited diversity of submerged plants in Bellandur and Varthur lakes [21].
E. crassipes responds to high nutrients and temperatures with excessive growth, which is reflected in our results from February onwards. Its seasonal growth stagnation and deterioration after the post-monsoon season likely reflect annual infestation by weevils (Neochetina eichhorniae and Neochetina bruchi) [36,42]. Other macrophytes such as A. philoxeroides partly overgrow the decaying floating islands and lake beds [13]. As our seasonal data ended in April, it was not possible to further examine the spatial effects on macrophyte distribution by weevil activities. However, they certainly play a major role in seasonal decline of macrophyte shares during the monsoon season [42]. The high productivity of E. crassipes (11 to 120 tons of dry biomass per hectare and year) is described as an important part of the system’s overall sewage purification potential because it removes abundant amounts of nutrients from water [13]. Together with A. philoxeroides, E. crassipes is reportedly a dominant accumulator of nitrogen and its distribution pattern has a direct effect on the remaining nutrient contents of the water leaving Bellandur and entering Varthur [36]. Still, water purification through algae is reduced by continuing expansion of macrophytes causing shaded conditions and silting up after decay, which may reduce the nutrient retention of the system [30,79].

4.5. Wetland Morphology

Considering the large horizontal extension of both shallow wetlands, any morphology change can strongly affect the distribution and growth patterns of vegetation within the lake ecosystems [75]. A high population of floating-leaved macrophytes can lead to higher sediment accumulation at their decay [80]. According to historical maps and field surveys both lakes have lost over 60% of their original depth through the accumulation of sediments. More than half of the lake area has a depth <1.5 m at Bellandur and <1 m at Varthur, while maximum depths barely exceed 3 m at Bellandur and 2 m at Varthur [13]. Due to the lack of GE images for the monsoon seasons, during which macrophyte cover is lowest, it was not possible to accurately compare annual cover.
Visual comparison of the images cover patterns and dynamics indicates that in recent years increasingly more macrophyte sections remain stationary through the seasons within the shallow zones of both lakes. This may indicate a localized shift from floating to emergent macrophyte population. Although this should be further analyzed, it is plausible that the prolonged existence of macrophyte islands on the lakes contributed to the long-term increase in macrophyte cover. Increasing sediment accumulation provides another reason for macrophyte accumulation when linking it to impacts on Neochetina eichhorniae and Neochetina bruchi, the natural antagonists of the free-floating water hyacinth populations present in Bellandur and Varthur lakes. Although these weevils are at least partly responsible for the seasonal decay of E. crassipes, a study of Ganga Visalakshy and Jayanth [81] found that the insects’ reproduction is thwarted if sediments partly cover roots of their host plants. Considering the historically decreasing depth of the lakes, the plants could survive better the seasonal infestations when staying in shallow areas with roots covered by sludge or sediments. Such areas may increase through the years due to the organic loads and sediment accumulation [13]. Although we did not study the local distribution of the increasing macrophyte cover within the waterbodies, the images of our analysis suggest that perennial plant accumulation happened (apart from the mayor growing events from February to March) mainly in the shallower western areas of the wetlands.

5. Conclusions

This study demonstrates the advantages and limits of using freely available time series of high-resolution GE-images, as compared to multiple lower resolution datasets or single time multi-spectral data for lake cover analyses of macrophytes and algae. The large set of cloud-free RGB images allowed consistent identification of major trends and patterns in lake cover. Cover dynamics seemed to be more driven by seasonal monsoon-related factors than by differences in waste-water-related nutrient loads deposited in the lakes. Our results suggest a high dynamic of macrophyte cover spread, both seasonally and long-term, and concomitant major competition effects on algal communities. This may trigger negative effects on the important ecological functions of the phytoplankton, such as total nutrient uptake from the system, and alteration of the physico-chemical parameters of Bellandur and Varthur lakes. Long-term increase in macrophyte cover likely leads to further ecological degradation of the Bellandur–Varthur lake system which urgently requires public attention and effective implementation of remediation policies.

Author Contributions

Conceptualization, A.B. and M.K.; methodology, M.K. and M.B.; software, M.B.; validation, M.B.; formal analysis, M.B.; investigation, M.B.; resources, M.K. and A.B.; data curation, M.B.; writing—original draft preparation, M.B.; writing—review and editing, A.B. and M.K.; visualization, M.B.; supervision, M.K. and A.B.; project administration, A.B.; funding acquisition, A.B. All authors contributed significantly to the research. All authors have read and agreed to the published version of the manuscript.

Funding

Part of this work was funded by the German Science Foundation (DFG project number: 279374797).

Acknowledgments

This work greatly benefitted from collaboration with and insights gained in the Indo-German Research Unit (FOR2432) “Social-Ecological Systems in the Indian Rural-Urban Interface: Functions, Scales, and Dynamics of Transition”, based at the University of Agricultural Sciences, Bangalore (UASB, GKVK Campus) and jointly funded by the German Science Foundation (DFG, project number: 279374797) and the Department of Biotechnology, Government of India.

Conflicts of Interest

The authors declare no conflict of interest.

Appendix A

Table A1. Bellandur and Varthur lake cover shares (Bengaluru, India) listed by image date. Classification methods are Red-Green-Blue maximum likelihood classification (RGB MLM), multispectral maximum likelihood classification (MS MLM) and Red-Green-Blue hand digitized (RGB HD).
Macrophytes [%]Algae [%]Open Water [%]
Image DateBellandurVarthurBellandurVarthurBellandurVarthurSatellite or ProviderSensor Resolution/Classified ResolutionMethod
10-Mar-200229.6%29.4%65.5%32.9%4.9%37.7%QB022.4 m/1 mRGB MLM
26-Apr-200336.5%60.9%48.4%10.0%15.0%29.1%QB022.4 m/1 mRGB MLM
21-Feb-200436.9%33.3%61.1%31.3%2.0%35.5%QB022.4 m/1 mRGB MLM
13-Apr-200858.7%52.4%15.5%13.2%25.8%34.4%QB022.4 m/1 mRGB MLM
13-Apr-200972.3%97.5%22.8%1.5%4.8%1.0%GE011.65 m/1 mRGB MLM
23-Jan-201045.3%41.1%53.2%22.6%1.4%36.3%WV021.85 m/1 mRGB MLM
11-Mar-201153.4%59.6%39.5%14.4%7.1%26.1%WV021.85 m/1 mRGB MLM
5-Oct-201247.1%43.4%46.1%9.1%6.9%47.5%GE011.65 m/1 mRGB MLM
18-Nov-201239.5%41.9%54.8%35.1%5.7%23.1%MaxarNARGB MLM
11-Jan-201350.9%42.7%36.0%28.2%13.1%29.1%WV021.85 m/1 mRGB MLM
19-Nov-201348.3%34.3%49.1%18.3%2.6%47.4%WV021.85 m/1 mRGB MLM
26-Feb-201446.3%58.7%48.3%20.4%5.4%20.9%Pléiades2.8 m/1 mRGB MLM
6-Apr-201568.4%82.3%27.5%17.3%4.1%0.5%GE011.65 m/1 mRGB MLM
1-Sep-201556.7%37.3%37.0%38.8%6.3%23.9%WV021.85 m/1 mRGB MLM
3-Feb-201662.7%58.0%35.7%23.2%1.6%18.7%WV021.85 m/1 mRGB MLM
31-Mar-201668.2%69.6%23.4%22.3%8.4%8.1%WV021.85 m/1 mRGB MLM
3-Apr-201667.7%72.9%26.7%10.3%5.6%16.8%WV031.24 m/1 mRGB MLM
10-Nov-201652.3%56.4%41.6%10.5%6.1%33.1%Pléiades2.8 m/1 mRGB MLM
17-Jan-201767.4%67.9%31.9%30.6%0.7%1.5%WV021.85 m/1 mRGB MLM
23-Jan-201765.6%66.4%28.7%20.8%5.7%12.8%WV021.85 m/1 mRGB MLM
16-Feb-201766.5%69.5%32.3%25.4%1.3%5.1%WV021.85 m/1 mRGB MLM
26-Mar-201786.0%86.8%2.1%6.4%11.9%6.8%WV021.85 m/1 mRGB MLM
10-Dec-201756.4%58.6%21.1%39.3%22.5%2.1%WV031.24 m/1 mRGB MLM
1-Mar-201861.7%74.0%16.7%22.4%21.6%3.6%WV031.24 m/1 mRGB MLM
27-Oct-201858.8%53.4%33.3%43.7%7.9%2.9%WV031.24 m/1 mRGB MLM
11-Nov-201857.1%56.8%37.5%36.3%5.4%6.9%WV021.85 m/1 mRGB MLM
14-Dec-201856.2%58.4%37.3%41.5%6.5%0.1%WV021.85 m/1 mRGB MLM
7-Jan-201958.0%58.9%37.9%29.3%4.0%11.8%WV021.85 m/1 mRGB MLM
18-Jan-201960.0%59.1%38.7%40.9%1.3%0.0%WV021.85 m/1 mRGB MLM
6-Feb-201966.0%64.1%23.0%28.0%11.0%7.9%WV021.85 m/1 mRGB MLM
6-Feb-201968.3%68.1%22.4%25.0%9.3%6.9%WV022 m/2.8 mMS MLM
20-Mar-201982.3%81.2%2.9%14.6%14.8%4.2%WV031.24 m/1 mRGB MLM
20-Mar-201983.3%84.9%2.7%11.4%14.0%3.7%Sentinel-210 m/10 mMS MLM
20-Mar-201982.0%82.0%5.0%14.1%13.1%3.9%WV031.24 m/1 mRGB HD

Appendix B

Figure A1. Sentinel-2 (a,b) and Google EarthTM (ce) images of Bellandur Lake (Bengaluru, India) of 20 March 2019 with corresponding lake surface cover classification results for multispectral Sentinel image (b) and RGB Google image (d). Cover classes include macrophytes (green), algae (pink), and open water (blue). The image below (e) illustrates missing algae (red) and missing or shifted open water (dark blue) areas of the Sentinel-2 image classification.
Remotesensing 12 03843 g0a1
Figure A2. Sentinel-2 (a,b) and Google EarthTM (ce) images of Varthur Lake (Bengaluru, India) of 20 March 2019 with corresponding lake surface cover classification results for multispectral Sentinel image (b) and RGB Google image (d). Cover classes include macrophytes (green), algae (pink), and open water (blue). The image below (e) illustrates missing algae (red) and missing or shifted open water (dark blue) areas of the Sentinel-2 image classification.
Remotesensing 12 03843 g0a2
Figure A3. Comparison of lake cover in Google EarthTM Bellandur (left) and Varthur (right) images of 20 March 2019. Source images (a,d), RGB maximum likelihood classification results (b,e) and RGB hand digitized results (c,f). Cover classes include macrophytes (green), algae (pink), and open water (blue).
Remotesensing 12 03843 g0a3

Appendix C

Figure A4. Development of seasonal lake cover shares for Bellandur Lake (a) and Varthur Lake (b) 2015–2016.
Remotesensing 12 03843 g0a4
Figure A5. Development of seasonal lake cover shares for Bellandur Lake (a) and Varthur Lake (b), Bengaluru (India) 2016–2017.
Remotesensing 12 03843 g0a5
Figure A6. Development of seasonal lake cover shares for Bellandur Lake (a) and Varthur Lake (b), Bengaluru (India) 2018–2019.
Remotesensing 12 03843 g0a6

References

  1. Martínez-Arroyo, A.; Jáuregui, E. On the environmental role of urban lakes in Mexico City. Urban Ecosyst. 2000, 4, 145–166. [Google Scholar] [CrossRef]
  2. Naselli-Flores, L. Urban lakes: Ecosystems at risk, worthy of the best care. In Proceedings of the Taal2007: The 12th World Lake Conference, Jaipur, Rajasthan, India, 28 October–2 November 2007; Ministry of Environment, Government of India: New Delhi, India, 2008; Volume 1333, p. 1337. [Google Scholar]
  3. He, C.; Tian, J.; Shi, P.; Hu, D. Simulation of the spatial stress due to urban expansion on the wetlands in Beijing, China using a GIS-based assessment model. Landsc. Urban Plan. 2011, 101, 269–277. [Google Scholar] [CrossRef]
  4. McDonald, R.I.; Green, P.; Balk, D.; Fekete, B.M.; Revenga, C.; Todd, M.; Montgomery, M. Urban growth, climate change, and freshwater availability. Proc. Natl. Acad. Sci. USA 2011, 108, 6312–6317. [Google Scholar] [CrossRef] [Green Version]
  5. Nagendra, H.; Sudhira, H.; Katti, M.; Schewenius, M. Sub-regional assessment of India: Effects of urbanization on land use, biodiversity and ecosystem services. In Urbanization, Biodiversity and Ecosystem Services: Challenges and Opportunities; Springer: Dordrecht, The Netherlands, 2013; pp. 65–74. [Google Scholar]
  6. Nagendra, H. Nature in the City: Bengaluru in the Past, Present, and Future; Oxford University Press: New Delhi, India, 2016; ISBN 0-19-908968-X. [Google Scholar]
  7. Parikh, J.; Sandal, G.; Jindal, P. Climate resilient cities: Vulnerability profiling of twenty Indian cities. In Development in India; Springer: New Delhi, India, 2016; pp. 351–365. [Google Scholar]
  8. Sudhira, H.; Nagendra, H. Local assessment of Bangalore: Graying and greening in Bangalore–impacts of urbanization on ecosystems, ecosystem services and biodiversity. In Urbanization, Biodiversity and Ecosystem Services: Challenges and Opportunities; Springer: Dordrecht, The Netherlands, 2013; pp. 75–91. [Google Scholar]
  9. Ramachandra, T.; Vinay, S.; Mahapatra, D.; Varghese, S.; Aithal, B. Water Situation in Bengaluru; ENVIS Technical Report 114; Environmental Information System, CES, Indian Institute of Science: Bangalore, India, 2016. [Google Scholar]
  10. Dittrich, C. Bangalore: Globalisation and fragmentation in India’s hightech-capital. Asien 2007, 103, 45–58. [Google Scholar]
  11. Hettiarachchi, M.; Morrison, T.H.; Wickramsinghe, D.; Mapa, R.; De Alwis, A.; McAlpine, C.A. The eco-social transformation of urban wetlands: A case study of Colombo, Sri Lanka. Landsc. Urban Plan. 2014, 132, 55–68. [Google Scholar] [CrossRef]
  12. Ramachandra, T.; Rajinikanth, R.; Ranjini, V. Economic valuation of wetlands. J. Environ. Biol. 2005, 26, 439. [Google Scholar]
  13. Ramachandra, T.; Mahapatra, D.M.; Vinay, S.; Varghese, S.; Asulabha, K.; Bhat, S.; Aithal, B.H. Bellandur and Varthur Lakes Rejuvenation Blueprint; ENVIS Technical Report 116; Environmental Information System, CES, Indian Institute of Science: Bangalore, India, 2017. [Google Scholar]
  14. Narayana, R. Kempe Gowdas of Bengalooru (Bangalore). Available online: http://www.myvpa.org/about2.htm (accessed on 20 September 2019).
  15. Goldman, M. Speculating on the next world city. Worlding Cities Asian Exp. Art Being Glob. 2011, 31, 229–258. [Google Scholar] [CrossRef]
  16. Ramachandra, T.; Aithal, B.H. Bengaluru’s reality: Towards unlivable status with unplanned urban trajectory. Curr. Sci. 2016, 110, 2207–2208. [Google Scholar]
  17. Unnikrishnan, H.; Mundoli, S.; Nagendra, H. Down the drain: The tragedy of the disappearing urban commons of Bengaluru. South Asian Water Stud. 2016, 5, 7–11. [Google Scholar]
  18. Unnikrishnana, H.; Mundoli, S.; Nagendra, H. Making water flow in Bengaluru: Planning for the resilience of water supply in a semi-arid city. J. Sustain. Urban. Plan. Prog. 2017, 2, 68–78. [Google Scholar]
  19. Ramachandra, T.; Asulabha, K.; Sincy, V.; Vinay, S.; Aithal, B.; Bhat, S.; Mahapatra, D. Pathetic Status of Wetlands in Bangalore: Epitome of Inefficient and Uncoordinated Governance; Centre for Ecological Sciences, Indian Institute of Science: Bangalore, India, 2015. [Google Scholar]
  20. Lele, S.; Sengupta, M.B. From lakes as urban commons to integrated lake-water governance: The case of Bengaluru’s urban water bodies. SAWAS South Asian Water Stud. 2018, 8, 5–26. [Google Scholar]
  21. Bhat, S.; Ramachandra, T.; Mahesh, M. Macrophytes of Bangalore Wetlands; ENVIS Technical Report 126; Energy & Wetlands Research Group, CES, Indian Institute of Science: Bangalore, India, 2017. [Google Scholar]
  22. Mahapatra, D.M.; Joshi, N.; Ramachandra, T. Insights to bioprocess and treatment competence of urban wetlands. J. Environ. Manag. 2018, 206, 1179–1191. [Google Scholar] [CrossRef]
  23. Visser, N. India’s Bellandur Lake Is So Polluted It Caught Fire. Available online: http://www.huffingtonpost.com/2015/05/19/indialake-pollution-fire_n_7315038.html (accessed on 20 November 2019).
  24. Swamy, R. Bengaluru’s Bellandur Lake Catches Fire Again, Toxic Smoke over IT City’s Suburb. Available online: http://indiatoday.intoday.in/story/bengaluru-bellandurlake-fire-pollution/1/884948.html (accessed on 20 November 2019).
  25. Ramachandra, T. Spatial analysis and characterisation of lentic ecosystems: A Case Study of Varthur Lake, Bangalore. Int. J. Ecol. Dev. Winter 2008, 9, 39–56. [Google Scholar]
  26. Chandrashekar, J.; Nagaraja, B.; Somashekar, R. Socio-economic status and environmental perception of inhabitants of bellandur lake area, bangalore: A case study. Electron. J. Environ. Sci. 2011, 4, 143–148. [Google Scholar]
  27. Bharath, J.; Umesch, Y. Why Bellandur Lake Clean-Up Exercise Could Snap Many Human Linkages. Available online: https://economictimes.indiatimes.com/news/politics-and-nation/why-bellandur-lake-clean-up-exercise-could-snap-many-human-linkages/articleshow/58411010.cms (accessed on 20 November 2019).
  28. Varalakshmi, L.; Ganeshamurthy, A. Heavy Metal Contamination of Water Bodies, Soils and Vegetables in Peri Urban Areas of Bangalore City of India. In Proceedings of the 19th World Congress of Soil Science: Soil Solutions for a Changing World, Brisbane, Australia, 1–6 August 2010; Symposium 4.2. 2 Soil and Water-Global Change. International Union of Soil Sciences (IUSS), c/o Institut für Bodenforschung, Universität für Bodenkultur: Vienna, Austria, 2010; pp. 37–40. [Google Scholar]
  29. Chanakya, H.; Karthick, P.; Ramachandra, T. Nitrogen and carbon flows through Bellandur Lake–Role of Bellandur lake as a natural wetland treating Bangalore wastewater. In Environmental Education for Ecosystem Conservation; Centre for Ecological Sciences, Indian Institute of Science: Bangalore, India, 2008; pp. 25–32. ISBN 81-85589-69-0. [Google Scholar]
  30. Mahapatra, D.M.; Chanakya, H.; Ramachandra, T. Assessment of treatment capabilities of Varthur lake, Bangalore, India. Int. J. Environ. Technol. Manag. 2011, 14, 84–102. [Google Scholar] [CrossRef] [Green Version]
  31. Vishwanath, S. Cities Must Respect River Basins. Available online: http://www.thehindu.com/life-and-style/homes-andgardens/cities-must-respect-riverbasins/article19232543.ece (accessed on 20 November 2019).
  32. Brucet, S.; Poikane, S.; Lyche-Solheim, A.; Birk, S. Biological assessment of European lakes: Ecological rationale and human impacts. Freshw. Biol. 2013, 58, 1106–1115. [Google Scholar] [CrossRef]
  33. Carpenter, S.R.; Lodge, D.M. Effects of submersed macrophytes on ecosystem processes. Aquat. Bot. 1986, 26, 341–370. [Google Scholar] [CrossRef]
  34. Søndergaard, M.; Johansson, L.S.; Lauridsen, T.L.; Jørgensen, T.B.; Liboriussen, L.; Jeppesen, E. Submerged macrophytes as indicators of the ecological quality of lakes. Freshw. Biol. 2010, 55, 893–908. [Google Scholar] [CrossRef]
  35. Verma, R.; Singh, S.; Raj, K.G. Assessment of changes in water-hyacinth coverage of water bodies in northern part of Bangalore city using temporal remote sensing data. Curr. Sci. 2003, 84, 795–804. [Google Scholar]
  36. Mahapatra, D.M.; Chanakya, H.; Ramachandra, T. Varthur Lake: Past, Present and Future. In Proceedings of the Lake 2010: Wetlands, Biodiversity and Climate Change, Bangalore, India, 22–24 December 2010. [Google Scholar]
  37. Mahapatra, D.M.; Chanakya, H.; Ramachandra, T. Role of macrophytes in sewage fed urban lake. Inst. Integr. Omics Appl. Biotechnol. 2011, 2, 1–9. [Google Scholar]
  38. Ramachandra, T.; Ahalya, N.; Payne, M. Status of Varthur Lake: Opportunities for Restoration and Sustainable Management; Technical Report 102; Centre for Ecological Sciences, Indian Institute of Science: Bangalore, India, 2003. [Google Scholar]
  39. Ramachandra, T.; Mahapatra, D.M.; Bhat, S.P.; Asulabha, K.; Varghese, S.; Aithal, B.H. Integrated Wetlands Ecosystem: Sustainable Model to Mitigate Water Crisis in Bangalore; ENVIS Technical Report 76; Environmental Information System, CES, Indian Institute of Science: Bangalore, India, 2014. [Google Scholar]
  40. Ramachandra, T.; Sincy, V.; Asulabha, K.; Mahapatra, D.M.; Bhat, S.P.; Aithal, B.H. Optimal Treatment of Domestic Wastewater through Constructed Wetlands. J. Biodivers. 2018, 9, 81–102. [Google Scholar]
  41. Jayanth, K. Biological control of water hyacinth in India by release of the exotic weevil Neochetina bruchi. Curr. Sci. 1988, 57, 968–970. [Google Scholar]
  42. Venugopal, G. Monitoring the effects of biological control of water hyacinths using remotely sensed data: A case study of Bangalore, India. Singap. J. Trop. Geogr. 1998, 19, 91–105. [Google Scholar] [CrossRef]
  43. Ritchie, J.C.; Zimba, P.V.; Everitt, J.H. Remote sensing techniques to assess water quality. Photogramm. Eng. Remote Sens. 2003, 69, 695–704. [Google Scholar] [CrossRef] [Green Version]
  44. Malthus, T.J. Bio-optical modeling and remote sensing of aquatic macrophytes. In Bio-Optical Modeling and Remote Sensing of Inland Waters; Elsevier: Amsterdam, The Netherlands, 2017; pp. 263–308. [Google Scholar] [CrossRef]
  45. Sowmya, D.; Hegde, V.S.; Suhas, J.; Hegdekatte, R.V.; Shenoy, P.D.; Venugopal, K. Land Use/Land Cover Classification of Google Earth Imagery. In Proceedings of the 2017 IEEE International WIE Conference on Electrical and Computer Engineering (WIECON-ECE), Dehradun, India, 18–19 December 2017; pp. 10–13. [Google Scholar] [CrossRef]
  46. Li, W.; Jiang, Q.; Xing, Y.; Wu, S.; Yin, Y.; Liu, S.; Cui, C. Automatic classification method of ETM+ remote sensing images based on Google Earth. Acta Agric. Jiangxi 2012, 24, 158–163. [Google Scholar]
  47. Ramachandra, T.; Kumar, U. Wetlands of greater Bangalore, India: Automatic delineation through pattern classifiers. Electron. Green J. 2008. [Google Scholar] [CrossRef]
  48. Gautam, V.K.; Gaurav, P.K.; Murugan, P.; Annadurai, M. Assessment of surface water Dynamicsin Bangalore using WRI, NDWI, MNDWI, supervised classification and KT transformation. Aquat. Procedia 2015, 4, 739–746. [Google Scholar] [CrossRef]
  49. Chandramouli, C. Census of India 2011: Rural Urban Distribution of Population; Registrar General and Census Commissioner, Ministry of Home Affairs: New Delhi, India, 2011.
  50. Ramachandra, T.; Aithal, B.H. Bangalore. In The Wiley Blackwell Encyclopedia of Urban and Regional Studies; John Wiley & Sons: Hoboken, NJ, USA, 2019; pp. 1–21. [Google Scholar] [CrossRef]
  51. Ravindrababu, B.; Rajegowda, M.; Janardhanagowda, N.; Girish, J. Weekly, monthly and seasonal rainfall at Bengaluru in Karnataka. J. Agrometeorol. 2010, 12, 263–265. [Google Scholar]
  52. Sudhira, H.; Ramachandra, T.; Subrahmanya, M.B. Bangalore. Cities 2007, 24, 379–390. [Google Scholar] [CrossRef]
  53. Ramachandra, T.; Asulabha, K.; Sincy, V.; Bhat, S.; Aithal, B. Wetlands: Treasure of Bangalore; ENVIS Technical Report 101; Energy & Wetlands Research Group, CES, Indian Institute of Science: Bangalore, India, 2016. [Google Scholar]
  54. Ramachandra, T.; Mahapatra, D.M.; Asulabha, K.; Varghese, S. Foaming or algal bloom in water bodies of India: Remedial measures–restrict phosphate (P) based detergents. Energy 2017. [Google Scholar] [CrossRef]
  55. Mahapatra, D.M.; Chanakya, H.; Ramachandra, T. C: N ratio of Sediments in a sewage fed Urban Lake. Int. J. Geol. 2011, 5, 86–92. [Google Scholar]
  56. Foody, G.M.; Campbell, N.; Trodd, N.; Wood, T. Derivation and applications of probabilistic measures of class membership from the maximum-likelihood classification. Photogramm. Eng. Remote Sens. 1992, 58, 1335–1341. [Google Scholar]
  57. Dube, T.; Gumindoga, W.; Chawira, M. Detection of land cover changes around Lake Mutirikwi, Zimbabwe, based on traditional remote sensing image classification techniques. Afr. J. Aquat. Sci. 2014, 39, 89–95. [Google Scholar] [CrossRef]
  58. Foody, G.M. Status of land cover classification accuracy assessment. Remote Sens. Environ. 2002, 80, 185–201. [Google Scholar] [CrossRef]
  59. Bengaluru Climate. Available online: https://en.climate-data.org/asia/india/karnataka/bengaluru-4562/ (accessed on 1 March 2020).
  60. Ramachandra, T.; Solanki, M. Ecological assessment of lentic water bodies of Bangalore. Minist. Sci. Technol. 2007, 25, 96. [Google Scholar]
  61. Valk, V. Valorization of Water Hyacinth as a Renewable Source of Animal Feed and Biogas: A Business Case for Lake Victoria, Kenya; Section for Resource Engineering and Centre for Crops Systems Analysis, Wageningen University: Wageningen, The Netherlands, 2015. [Google Scholar]
  62. Ehrenfeld, J.G. Exotic invasive species in urban wetlands: Environmental correlates and implications for wetland management. J. Appl. Ecol. 2008, 45, 1160–1169. [Google Scholar] [CrossRef]
  63. Becker, B.L.; Lusch, D.P.; Qi, J. A classification-based assessment of the optimal spectral and spatial resolutions for Great Lakes coastal wetland imagery. Remote Sens. Environ. 2007, 108, 111–120. [Google Scholar]
  64. Bolpagni, R.; Bresciani, M.; Laini, A.; Pinardi, M.; Matta, E.; Ampe, E.M.; Giardino, C.; Viaroli, P.; Bartoli, M. Remote sensing of phytoplankton-macrophyte coexistence in shallow hypereutrophic fluvial lakes. Hydrobiologia 2014, 737, 67–76. [Google Scholar] [CrossRef]
  65. Murugan, P.; Sivakumar, R.; Pandiyan, R.; Annadurai, M. Comparison of in-situ hyperspectral and Landsat ETM+ data for chlorophyll-a mapping in case-II water (Krishnarajapuram Lake, Bangalore). J. Indian Soc. Remote Sens. 2016, 44, 949–957. [Google Scholar] [CrossRef]
  66. Luo, J.; Li, X.; Ma, R.; Li, F.; Duan, H.; Hu, W.; Qin, B.; Huang, W. Applying remote sensing techniques to monitoring seasonal and interannual changes of aquatic vegetation in Taihu Lake, China. Ecol. Indic. 2016, 60, 503–513. [Google Scholar] [CrossRef]
  67. Liang, Q.; Zhang, Y.; Ma, R.; Loiselle, S.; Li, J.; Hu, M. A MODIS-based novel method to distinguish surface cyanobacterial scums and aquatic macrophytes in Lake Taihu. Remote Sens. 2017, 9, 133. [Google Scholar] [CrossRef] [Green Version]
  68. Laba, M.; Blair, B.; Downs, R.; Monger, B.; Philpot, W.; Smith, S.; Sullivan, P.; Baveye, P.C. Use of textural measurements to map invasive wetland plants in the Hudson River National Estuarine Research Reserve with IKONOS satellite imagery. Remote Sens. Environ. 2010, 114, 876–886. [Google Scholar] [CrossRef]
  69. Chabot, D.; Dillon, C.; Shemrock, A.; Weissflog, N.; Sager, E.P. An object-based image analysis workflow for monitoring shallow-water aquatic vegetation in multispectral drone imagery. ISPRS Int. J. Geo-Inf. 2018, 7, 294. [Google Scholar]
  70. Visser, F.; Wallis, C. Object-based Analysis and Multispectral Low-altitude Remote Sensing for Low-cost Mapping of Chalk Stream Macrophytes. Int. Arch. Photogramm. Remote Sens. Spat. Inf. Sci. 2010, 37, I-4/C7. [Google Scholar]
  71. Heblinski, J.; Schmieder, K.; Heege, T.; Agyemang, T.K.; Sayadyan, H.; Vardanyan, L. High-resolution satellite remote sensing of littoral vegetation of Lake Sevan (Armenia) as a basis for monitoring and assessment. Hydrobiologia 2011, 661, 97–111. [Google Scholar] [CrossRef]
  72. Zhao, D.; Lv, M.; Jiang, H.; Cai, Y.; Xu, D.; An, S. Spatio-temporal variability of aquatic vegetation in Taihu Lake over the past 30 years. PLoS ONE 2013, 8, e66365. [Google Scholar] [CrossRef] [Green Version]
  73. University of Agricultural Sciences Bangalore Weather Data. Weather Report for Individual Month. Available online: https://uasbangalore.edu.in/index.php/research/agromoterology (accessed on 15 September 2019).
  74. Sorensen, H.A. Managing urban lakes: An integrating experience. Int. J. Water Resour. Dev. 1996, 12, 437–446. [Google Scholar] [CrossRef]
  75. Zhang, Y.; Liu, X.; Qin, B.; Shi, K.; Deng, J.; Zhou, Y. Aquatic vegetation in response to increased eutrophication and degraded light climate in Eastern Lake Taihu: Implications for lake ecological restoration. Sci. Rep. 2016, 6, 23867. [Google Scholar] [CrossRef]
  76. Gersberg, R.M.; Elkins, B.; Lyon, S.R.; Goldman, C.R. Role of aquatic plants in wastewater treatment by artificial wetlands. Water Res. 1986, 20, 363–368. [Google Scholar] [CrossRef]
  77. Scheffer, M.; Szabo, S.; Gragnani, A.; Van Nes, E.H.; Rinaldi, S.; Kautsky, N.; Norberg, J.; Roijackers, R.M.; Franken, R.J. Floating plant dominance as a stable state. Proc. Natl. Acad. Sci. USA 2003, 100, 4040–4045. [Google Scholar] [CrossRef] [Green Version]
  78. Sand-Jensen, K.; Riis, T.; Vestergaard, O.; Larsen, S.E. Macrophyte decline in Danish lakes and streams over the past 100 years. J. Ecol. 2000, 88, 1030–1040. [Google Scholar] [CrossRef]
  79. Qingxin, Y. Ecological functions of aquatic vegetation in East Taihu Lake and its reasonable regulation. J. Lake Sci. 1998, 10, 67–72. [Google Scholar]
  80. Vereecken, H.; Baetens, J.; Viaene, P.; Mostaert, F.; Meire, P. Ecological management of aquatic plants: Effects in lowland streams. Hydrobiologia 2006, 570, 205–210. [Google Scholar] [CrossRef]
  81. Visalakshy, P.G.; Jayanth, K. Effect of Silt Coverage of Water Hyacinth Roots on Pupation of Neochetina eichhorniae Warner and N. bruchi Hustache (Coleoptera: Curculionidae). Biocontrol Sci. Technol. 1996, 6, 11–14. [Google Scholar] [CrossRef]
Figure 1. (a) Free floating Eichhornia crassipes (water hyacinth), (b) emergent Alternanthera philoxeroides (alligator weed) and (c) floating macrophyte cover at Bellandur Lake in May 2018. Source (a,b): Wikimedia.
Remotesensing 12 03843 g001
Figure 2. Map of Greater Bengaluru (left) with its three valley systems (colors blue, green, and beige) and the Koramangala–Challaghatta Valley drainage system (beige) with Bellandur and Varthur lakes in the South-East (right). Modified from [9] and Google EarthTM images of 7 January 2019.
Remotesensing 12 03843 g002
Figure 3. Workflow for Google Earth image acquisition, classification and analysis of Bellandur and Varthur lakes in Bengaluru, S-India.
Remotesensing 12 03843 g003
Figure 4. Processed Bellandur Lake Google EarthTM images of 23rd of January 2017 (a,b) and Varthur Lake images 18th of January 2019 (c,d) at Bengaluru (S-India) with classification results (a,c) of the three cover classes macrophytes (green), algae (pink), and open water (dark blue) and respective training samples collected (b,d).
Remotesensing 12 03843 g004
Figure 5. Shares for macrophytes, algae, and open water cover classes of three different classification approaches and image sources at Bellandur and Varthur lakes in Bengaluru (S-India). Lake cover of 20th March 2019 (a) with results of Google Earth true-color maximum likelihood classification (dotted), Google Earth true-color hand-digitized cover shares (striped) and multispectral Sentinel-2 maximum-likelihood classification results (meshed). Lake cover of 6 February 2019 (b) comparing Google Earth true-color maximum likelihood classification (dotted) and multispectral WorldView-2 maximum-likelihood classification results (striped).
Remotesensing 12 03843 g005
Figure 6. Long-term (2002–2019) development of lake cover classes for Bellandur Lake (a) and Varthur Lake (b) in Bengaluru (S-India) for the post-monsoon season (February, March, and April scenes).
Remotesensing 12 03843 g006
Figure 7. Average monthly precipitation means of the years 1982–2012 in Bengaluru (S-India) plotted against lake cover of macrophytes and algae for Bellandur and Varthur lakes during September (n = 1), October (n = 2), November (n = 4), December (n = 2), January (n = 6), February (n = 4), March (n = 5) and April (n = 4). Data are means of classified images per month during 2008 to 2019. Precipitation data from [59].
Remotesensing 12 03843 g007
Figure 8. Average lake cover classes (macrophytes, algae, and open water) for Bellandur (a) and Varthur (b) lakes in Bengaluru (S-India) during November (n = 4), January (n = 6), February (n = 4), March (n = 5) and April (n = 4). Data are means of classified images per month during 2008 to 2019.
Remotesensing 12 03843 g008
Publisher’s Note: MDPI stays neutral with regard to jurisdictional claims in published maps and institutional affiliations.

