Article

Evaluating the Impact of the 2020 Iowa Derecho on Corn and Soybean Fields Using Synthetic Aperture Radar

1
NASA-Harvest, Department of Geographical Sciences, University of Maryland, College Park, MD 20740, USA
2
Food and Agricultural Policy Research Institute, University of Missouri, Columbia, MO 65211, USA
*
Author to whom correspondence should be addressed.
Remote Sens. 2020, 12(23), 3878; https://0-doi-org.brum.beds.ac.uk/10.3390/rs12233878
Submission received: 27 October 2020 / Revised: 10 November 2020 / Accepted: 25 November 2020 / Published: 26 November 2020

Abstract

:
On 10 August 2020, a series of intense and fast-moving windstorms known as a derecho caused widespread damage across Iowa’s (the top US corn-producing state) agricultural regions. This severe weather event bent and flattened crops over approximately one-third of the state. Immediate evaluation of the disaster’s impact on agricultural lands, including maps of crop damage, was critical to enabling a rapid response by government agencies, insurance companies, and the agricultural supply chain. Given the very large area impacted by the disaster, satellite imagery stands out as the most efficient means of estimating the disaster impact. In this study, we used time-series of Sentinel-1 data to detect the impacted fields. We developed an in-season crop type map using Harmonized Landsat and Sentinel-2 data to assess the impact on important commodity crops. We intersected a SAR-based damage map with an in-season crop type map to create damaged area maps for corn and soybean fields. In total, we identified 2.59 million acres as damaged by the derecho, consisting of 1.99 million acres of corn and 0.6 million acres of soybean fields. Also, we categorized the impacted fields to three classes of mild impacts, medium impacts and high impacts. In total, 1.087 million acres of corn and 0.206 million acres of soybean were categorized as high impacted fields.

Graphical Abstract

1. Introduction

Iowa is the biggest producer of corn and the second-largest producer of soybeans in the United States. In 2019, about 13.5 million acres of corn and 9.2 million acres of soybeans were planted in Iowa according to the United States Department of Agriculture’s National Agricultural Statistics Service (USDA-NASS) [1]. This amounted to roughly one-sixth of the total corn production and one-seventh of soybean production nationwide (USDA-NASS) [1]. USDA and Iowa Department of Agriculture and Land Stewardship collaborated to estimate the impacts of the derecho over Iowa agricultural fields. Their initial official numbers were huge as they crossed the storm track with counties and the area planted in each. They estimated that 8.2 million acres of corn and 5.6 million acres of soybeans may have been impacted by the storm and from these 3.57 million acres of corn and 2.5 million acres of soybeans were hardest hit by the derecho (https://iowaagriculture.gov/news/updated-derecho-impact-estimates-08142020). Although, as it is discussed further in this paper, these numbers were significantly reduced in the USDA report 2-3 months after the storm. In this study, it is demonstrated that using Synthetic Aperture Radar (SAR) satellite data, we were able to give a much more detailed analysis and estimate in a short period of time (about 2 weeks) after the storm that the satellite data were available for the whole region. One of the missions of the NASA-Harvest consortium at the University of Maryland is to rapidly assess the satellite data after the natural hazards such as the derecho happen and provide information to the government, insurance companies and farmers for the rapid response actions.
The European Space Agency Sentinel-1A and 1B satellites are C-band SAR satellites which provide cloud-free observations of the Earth’s surface since radar waves penetrate clouds. In the Interferometric Wide (IW) swath mode, Sentinel-1A and 1B have a swath width of 250 km and spatial resolution of 5 m by 20 m [2]. This wide swath width is important for monitoring crop lands over large areas. Each of these satellites has a revisit time of 12 days, and together the Sentinel-1 satellites can have a revisit rate as frequent as 6 days. SAR signals are highly sensitive to the geometry and structure of crops. This sensitivity combined with the cloud-free nature of SAR made Sentinel-1 an ideal source of data for assessing crop damage resulting from the Iowa derecho.
Thanks to the increasing number of SAR-equipped satellites and the open license of Sentinel-1 data, SAR data have been widely used in recent years for agricultural applications including crop monitoring. For example, Alonso-González et al., 2015 used time-series of polarimetric SAR data for crop growth monitoring [3]. They used elements of Pauli decomposition and demonstrated that using those elements it is possible to detect the changes on types of backscatter between different acquisitions and use them for crop growth monitoring. Lopez-Sanchez et al., 2012 [4] used polarimetric interferometric SAR (PolInSAR) data to study crop height variations. They used airborne L-band SAR data and demonstrated that even this low frequency SAR data could be used to derive crop height for winter rape and corn. Kontgis et al., 2017 [5] used time-series of Sentinel-1 VV and VH intensities to map rice paddy extent. They demonstrated that using those time-series and machine learning algorithms, it is feasible to map rice paddy extent with overall accuracy of 96.3%. Velso et al., 2017 [6] used integration of Sentinel-1 and 2 to study crop growth monitoring of five globally important crops including wheat, rapeseed, corn, soybean and sunflower. They demonstrated the high potential of SAR data with or without optical data for crop growth monitoring. RADARSAT-2 C-band data and RapidEye optical data have been used and compared by Hosseini et al., 2019 for estimation of corn biomass, with similar accuracies from both satellites for dry biomass estimation [7]. They also demonstrated that while optical satellite data outperformed SAR data in the early to mid-growing season, SAR provided more accurate estimates in the late growing season when optical signals are saturated. Mandal et al., 2019 [8] used both Sentinel-1 and RADARSAT-2 data for corn leaf area index (LAI) estimation in Canada and Poland, and showed that machine learning algorithms could be used to predict corn LAI from SAR with high accuracy (R2 of ~0.8 and mean absolute error of 0.5). Hosseini et al., 2015 [9] showed similar results for corn and soybean LAI estimates using a semi-empirical water cloud model. Bell et al., 2019 [10] studied the potential of using Sentinel-1 and Moderate Resolution Imaging Spectroradiometer (MODIS) data for monitoring vegetation damage resulting from hail in June 2016 in Iowa. Their work showed that both Normalized Difference Vegetation Index (NDVI) derived from MODIS and the VV and VH intensities from SAR are changed significantly for damaged fields compared to unaffected fields. Surek and Nador, 2015 [11] used polarimetric RADARSAT-2 data for monitoring damage to sunflower and corn fields from drought and storms in Hungary, observing that the SAR signals dropped by 1.5–2.5 dB after a drought and that NDVI decreased between 5–20 percent after a storm. Finally, Chauhan et al., 2020 [12] showed that VH backscatter, NIR and red-edge are highly sensitive to lodging in Wheat in a study conducted in Italy.
Optical satellite data have also been used widely for crop damage monitoring. For example, Silleos et al., 2002 [13] used NDVI derived from SPOT images for damage monitoring over agricultural fields. They applied Maximum Likelihood classification using NDVI to detect the damaged crop area at the field level, and correctly detected 73% of the total damaged crop area. In another study, Young et al., 2004 [14] used NDVI and Modified Soil Adjusted Vegetation Index (MSAVI) from Landsat-TM images for crop hail damage monitoring. They detected 90–95% of the damaged sites using NDVI and 83–89% using MSAVI. The previous studies showed high potential of optical satellite data for crop damage monitoring. However, in rapid response situations, access to data in a short time-frame before and after an event is critical. In many situations, including the 2020 Iowa derecho, cloud cover limits the available optical data.
In this study, we used only SAR data for crop damage assessment due to cloudy weather conditions before and after the derecho. The main objective of this work was to assess the damage caused by the 2020 Iowa derecho using remote sensing data. We have evaluated the potential of using SAR data for rapidly assessing crop damage resulting from the 2020 Iowa derecho when little to no in-situ data are available. We produced damaged area and damage severity maps based on SAR data before and after the derecho and estimated the damaged area of corn and soybean crops. Our results demonstrate that SAR time-series change monitoring is a promising means for rapidly detecting changes over crop fields that are related to derecho or other storm impacts.

2. Data

2.1. Study Area

Our study area is the state of Iowa, United States, which was hit hardest by the derecho. We generated damage statistics for the whole state as well as for each county separately. Figure 1 shows all 99 counties of Iowa.

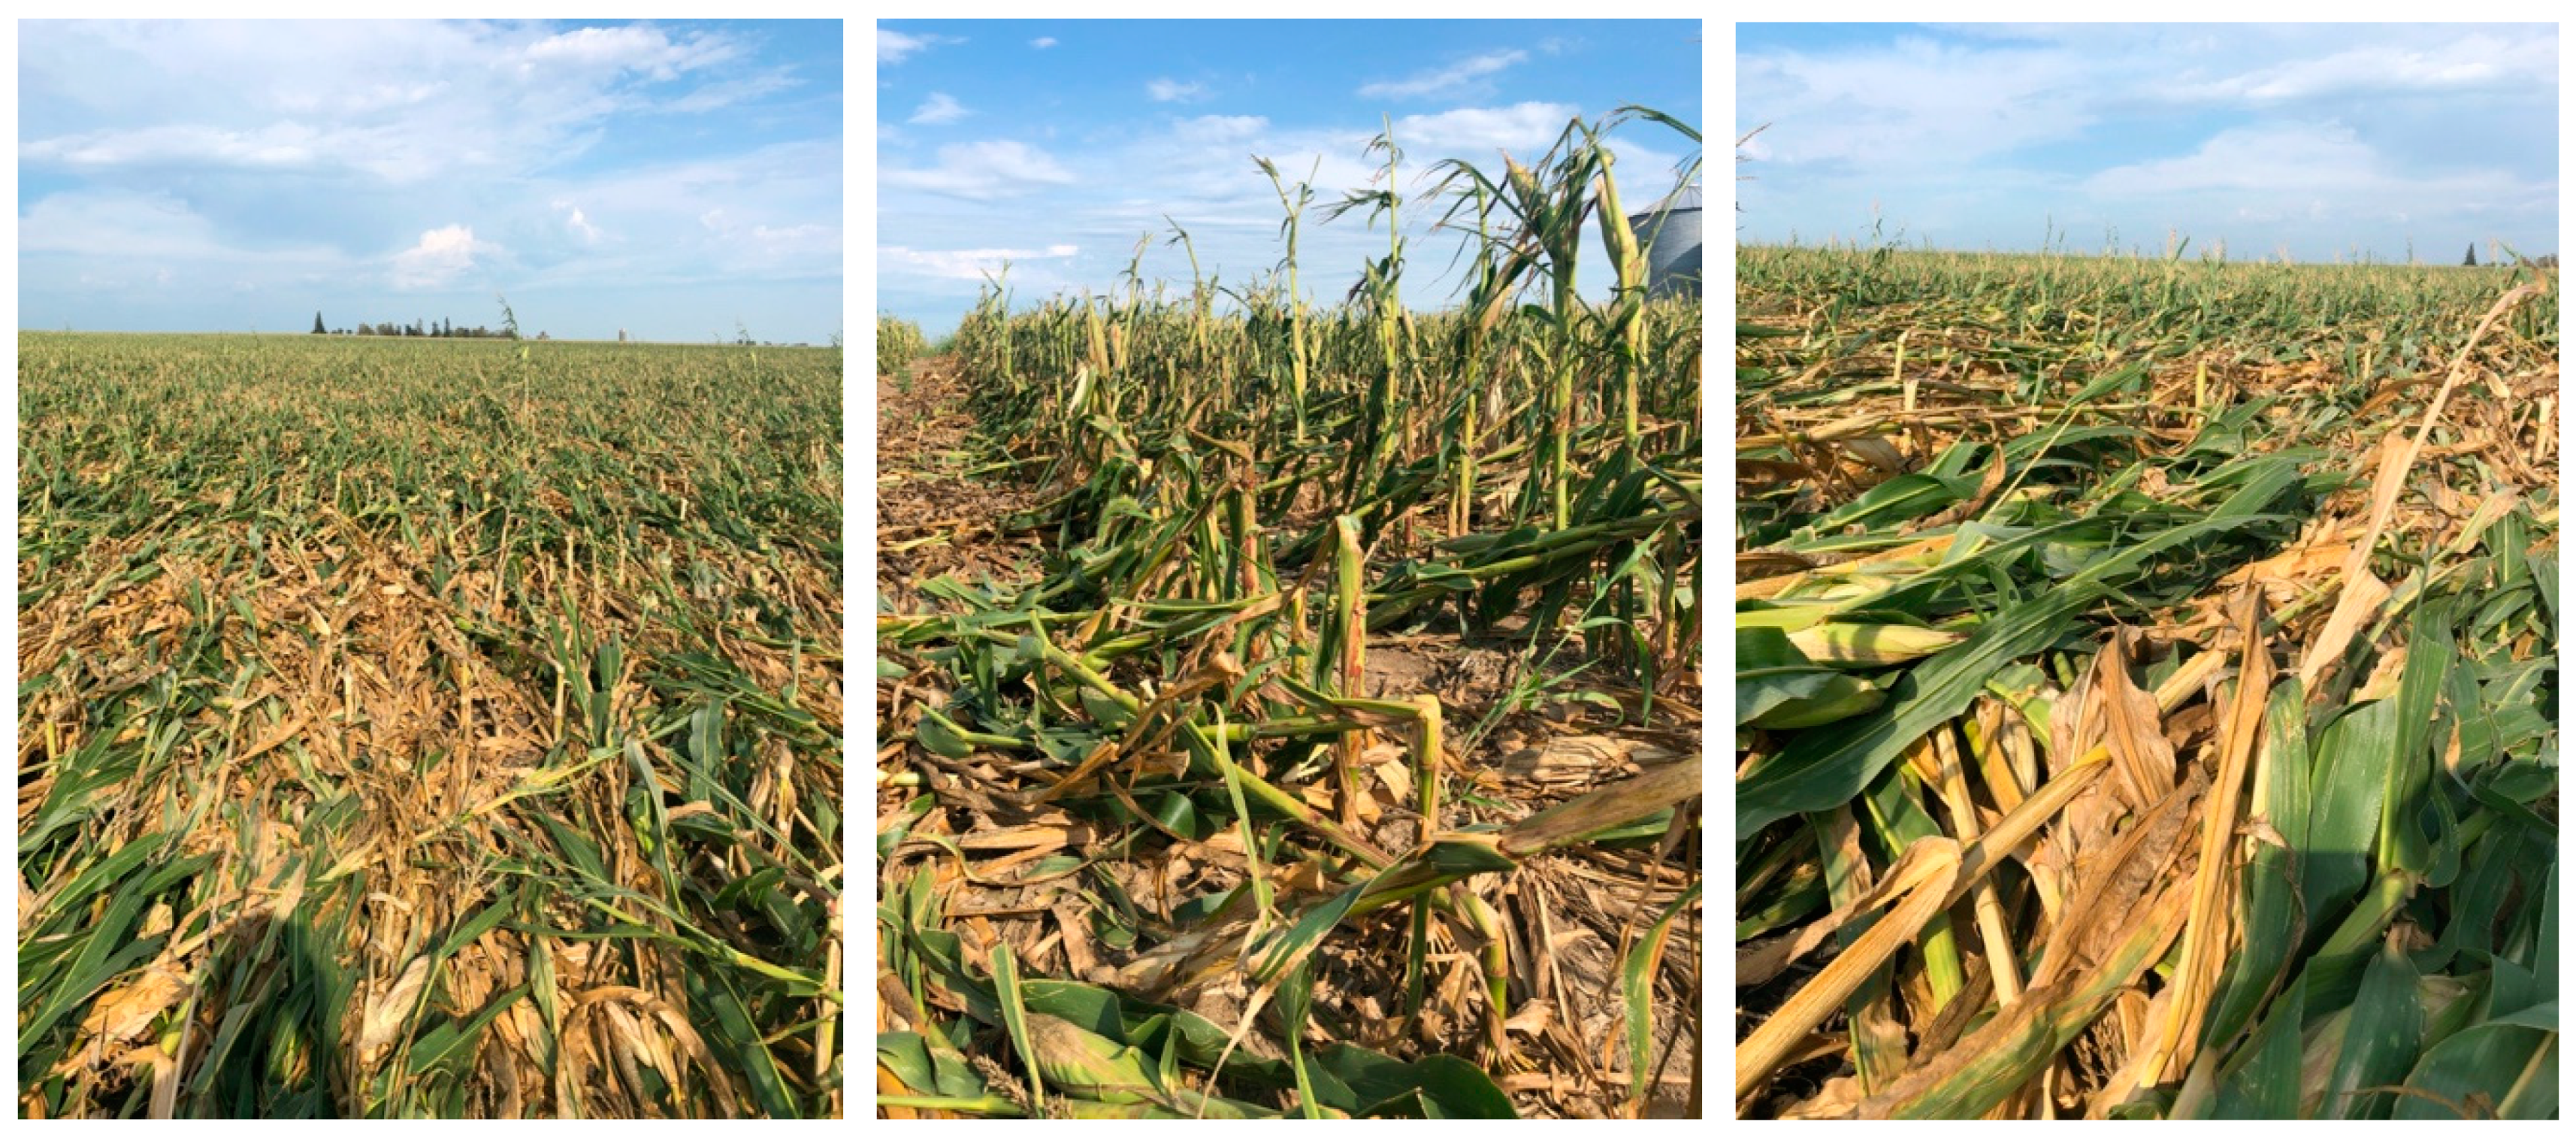
2.2. Ground Truth Data

We obtained a limited number of ground truth observations of crop type and derecho damage intensity from geo-tagged images provided by Iowa farmers. These 14 fields are distributed in Boone county (5 fields), Marshall county (7 fields), and Hardin county (2 fields) (Figure 1). For each image, we extracted the location (latitude and longitude) and heading information from the image metadata. Since most images of fields were taken from the road or edge of the field, we moved points ~60 m in the heading direction to ensure points would lie inside the field. Figure 2 shows the catastrophic impacts of the derecho on three corn fields.

2.3. Satellite Data

We used dual polarization Sentinel-1 ground range detected (GRD) products in this study. To generate change maps, we processed 10 scenes from 29 July 2020 to 22 August 2020 to cover the whole study area before and after the storm. We processed all data using the European Space Agency (ESA) Sentinel-1 Toolbox (SNAP). First, we used the orbital file to update the geometry information of the satellite in the image header. We applied the radiometric conversion to convert the pixel values to backscatter coefficients in the decibel unit. Next, we applied a 5   ×   5 Gamma Map speckle filter to minimize the effects of speckle noise. Finally, we performed terrain correction using the Range-Doppler Terrain Correction algorithm available in SNAP. We used the Shuttle Radar Topography Mission (SRTM) digital elevation model (DEM) with 1 arc-second resolution with bilinear interpolation for ortho-rectification and resampled the spatial resolution to 30 m.
We also used and compared the time-series of Sentinel-1 images from 10 July to 27 August for both 2019 and 2020. As explained in the methodology section, the objective of this analysis was to find the sensitivity of each Sentinel-1 polarization band to derecho impacts on crops and to find the threshold for applying the change detection algorithm. In addition to the SAR observations processed using SNAP, we used the Sentinel-1 Radiometric Terrain Corrected (RTC) Data on Amazon Web Services (AWS), which was released by Indigo Ag during our study (https://sentinel-s1-rtc-indigo-docs.s3-us-west-2.amazonaws.com/index.html). These data are corrected from speckle noise and the data are re-tiled to Sentinel-2 tile grid. To avoid the time-consuming preprocessing of Sentinel-1 data, we used this freely accessible AWS dataset to extract time-series of VV and VH intensities of Sentinel-1 for July and August of 2019 and 2020 over the study area.
In addition to SAR data from Sentinel-1, we used optical observations from the Harmonized Landsat and Sentinel-2 (HLS) dataset [15] as inputs for the in-season crop type classification method. The HLS dataset provides both Landsat-8 and Sentinel-2 observations at 30 m resolution and aligned band-passes, re-gridded to the Military Gridded Reference System (MGRS) used by Sentinel-2. We used the cloud mask provided by HLS to remove pixels with clouds and filled in missing data using linear interpolation.

3. Methodology

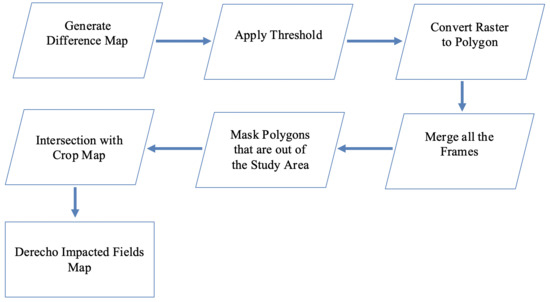
3.1. Damaged Area Detection

The damaged area was detected based on a threshold value on Sentinel-1 cross-polarization (VH) intensity variations between images of before the storm and after the storm. We found that VH intensity was more sensitive than VV to the derecho damage by analysing time-series of both polarization bands. For each Sentinel-1 path and frame, the first available images before and after the storm were used for change detection. Pixels that had higher variations than the threshold value were detected as impacted pixels. In the next step, the impacted pixels were intersected with an in-season crop type map to determine the damage estimates for corn and soybean. We explain each of these steps in the following sections.

3.2. Threshold Estimation

Prior work demonstrated that cross-polarization has higher sensitivity to crops than the co-polarizations [16,17,18]. In this study, both co- and cross-polarizations were analyzed to further verify their sensitivities to storm impacts on crops. To find the right thresholds to capture changes in VV and VH intensities caused by the derecho, we studied the time series of both polarization bands for 2019 and 2020. We randomly selected 50 corn fields and 50 soybean fields over the affected region, then selected 3 sites in different parts of each field (resulting in 150 corn and 150 soybean sites total). Our observation demonstrated that using more fields and sites, does not change the time-series of VV and VH intensities significantly. The 50 corn fields and the 50 soybean fields were distributed from East-Iowa to the West-Iowa to have good spatial distributions. Also, we made sure that none of the fields that we had in-situ data for included in those 100 fields. We extracted the VV and VH intensities at each site using an average 5 by 5 window. We used the in-season 2020 crop type map that was generated in this study and the 2019 Cropland Data Layer (CDL) produced by the USDA [19] to identify locations of corn and soybean fields. While finding a robust threshold for detecting impacted fields would require a high number of in-situ reference points, we determined approximate thresholds for each polarization based on analysis of the time series.

3.3. In-Season Crop Type Mapping

Since the derecho happened in August 2020, an in-season crop type map was needed to estimate the extent of the derecho damage on corn and soybeans. The Cropland Data Layers (CDL) produced by the USDA each year [19] are not available until the year following the map year, so the 2020 CDL will not be available until 2021. We used the method described in [20] to produce an in-season crop type map using satellite observations available between January and August 2020. This method uses satellite observations from the Harmonized Sentinel-2 and Landsat (HLS) and Sentinel-1 datasets and normalizes inputs by growth stage to minimize inter-annual domain shift. Inter-annual domain shift occurs when the distribution of values in the satellite inputs to the model is shifted significantly in the test data compared to the training data, e.g., due to delayed planting and crop growth. We used satellite inputs from the greenup and peak growth stages with a random forest classifier to produce mid-season predictions of corn, soybean, or other for each 30 m pixel. Satellite data for 2017–2019 were used for the training of the algorithm. The reported accuracy in [20] for mid-season (between July and September) crop type classification using the growth stage-normalized random forest was 76.5% for 2019 in a study area in Illinois. The other class encompasses other crops, urban areas, forests, water, and any other land cover class that is not corn or soybean. The mid-season crop type maps used in this study can be accessed through the NASA Harvest Data Portal at https://data.harvestportal.org/dataset/iowa-in-season-crop-type-map-2020.

3.4. Derecho Impact on Crops

The process was done using ESRI’s ArcGIS software. Figure 3 shows a flowchart of the analysis. First, we generated a difference map using the images of before and after the storm. Then, we filtered out pixels that have change values lower than the threshold as non-impacted pixels. Next, we converted the change raster map to vector polygon format and it was reprojected to the crop type map coordinate system. It is assumed that the impacted area by the storm cannot be a very small island polygon (i.e., a signal polygon that is not connected with any other polygon and with an area less than 10 pixels). Therefore, those small island polygons were removed from the analysis. The study area was covered by five Sentinel-1 images. We generated the change map for all five images and then merged them. We masked out changes that were outside of the study area. Finally, we intersected the crop damage map with the in-season crop type map to produce the damage map for each crop type.

4. Results

4.1. In-Season Crop Type Map

Figure 4 shows the in-season crop type map produced using HLS observations available between January and August 2020 using the method described in Kerner et al., 2020 [20]. Ten of the 14 ground reference points were correctly classified as corn, though we emphasize that this sample size is too small to provide a representative assessment of the crop type classification accuracy across the entire map of Iowa. In future work, we plan to develop crowd-sourcing capabilities to increase the number of ground reference points we can collect for evaluating in-season crop type classification products, and will evaluate the map accuracy compared to the 2020 Cropland Data Layer (CDL) when it is released in 2021. To provide additional insights about the in-season crop type map accuracy, we compared the pixel-wise classifications to the 2018 CDL. Of the pixels classified as “other” in our in-season 2020 map, 30% were classified as grassland/pasture in the 2018 CDL, 17% as forest, 15% as corn, 14% as developed, 11% as soybean, 4% as wetlands, 4% as hay, 3% as water, and 2% as alfalfa (rounding to nearest percent; classes constituting < 1% of “other” pixels not discussed). Since the total planted area of corn and soybeans was approximately the same in 2018 and 2020 [21,22], this analysis suggests that ~26% of pixels classified as “other” in our in-season 2020 map should have been classified as either corn or soybeans. Of the pixels classified as corn or soybean in our in-season 2020 map, only < 0.13% were classified as something other than corn or soybean in the 2018 CDL.

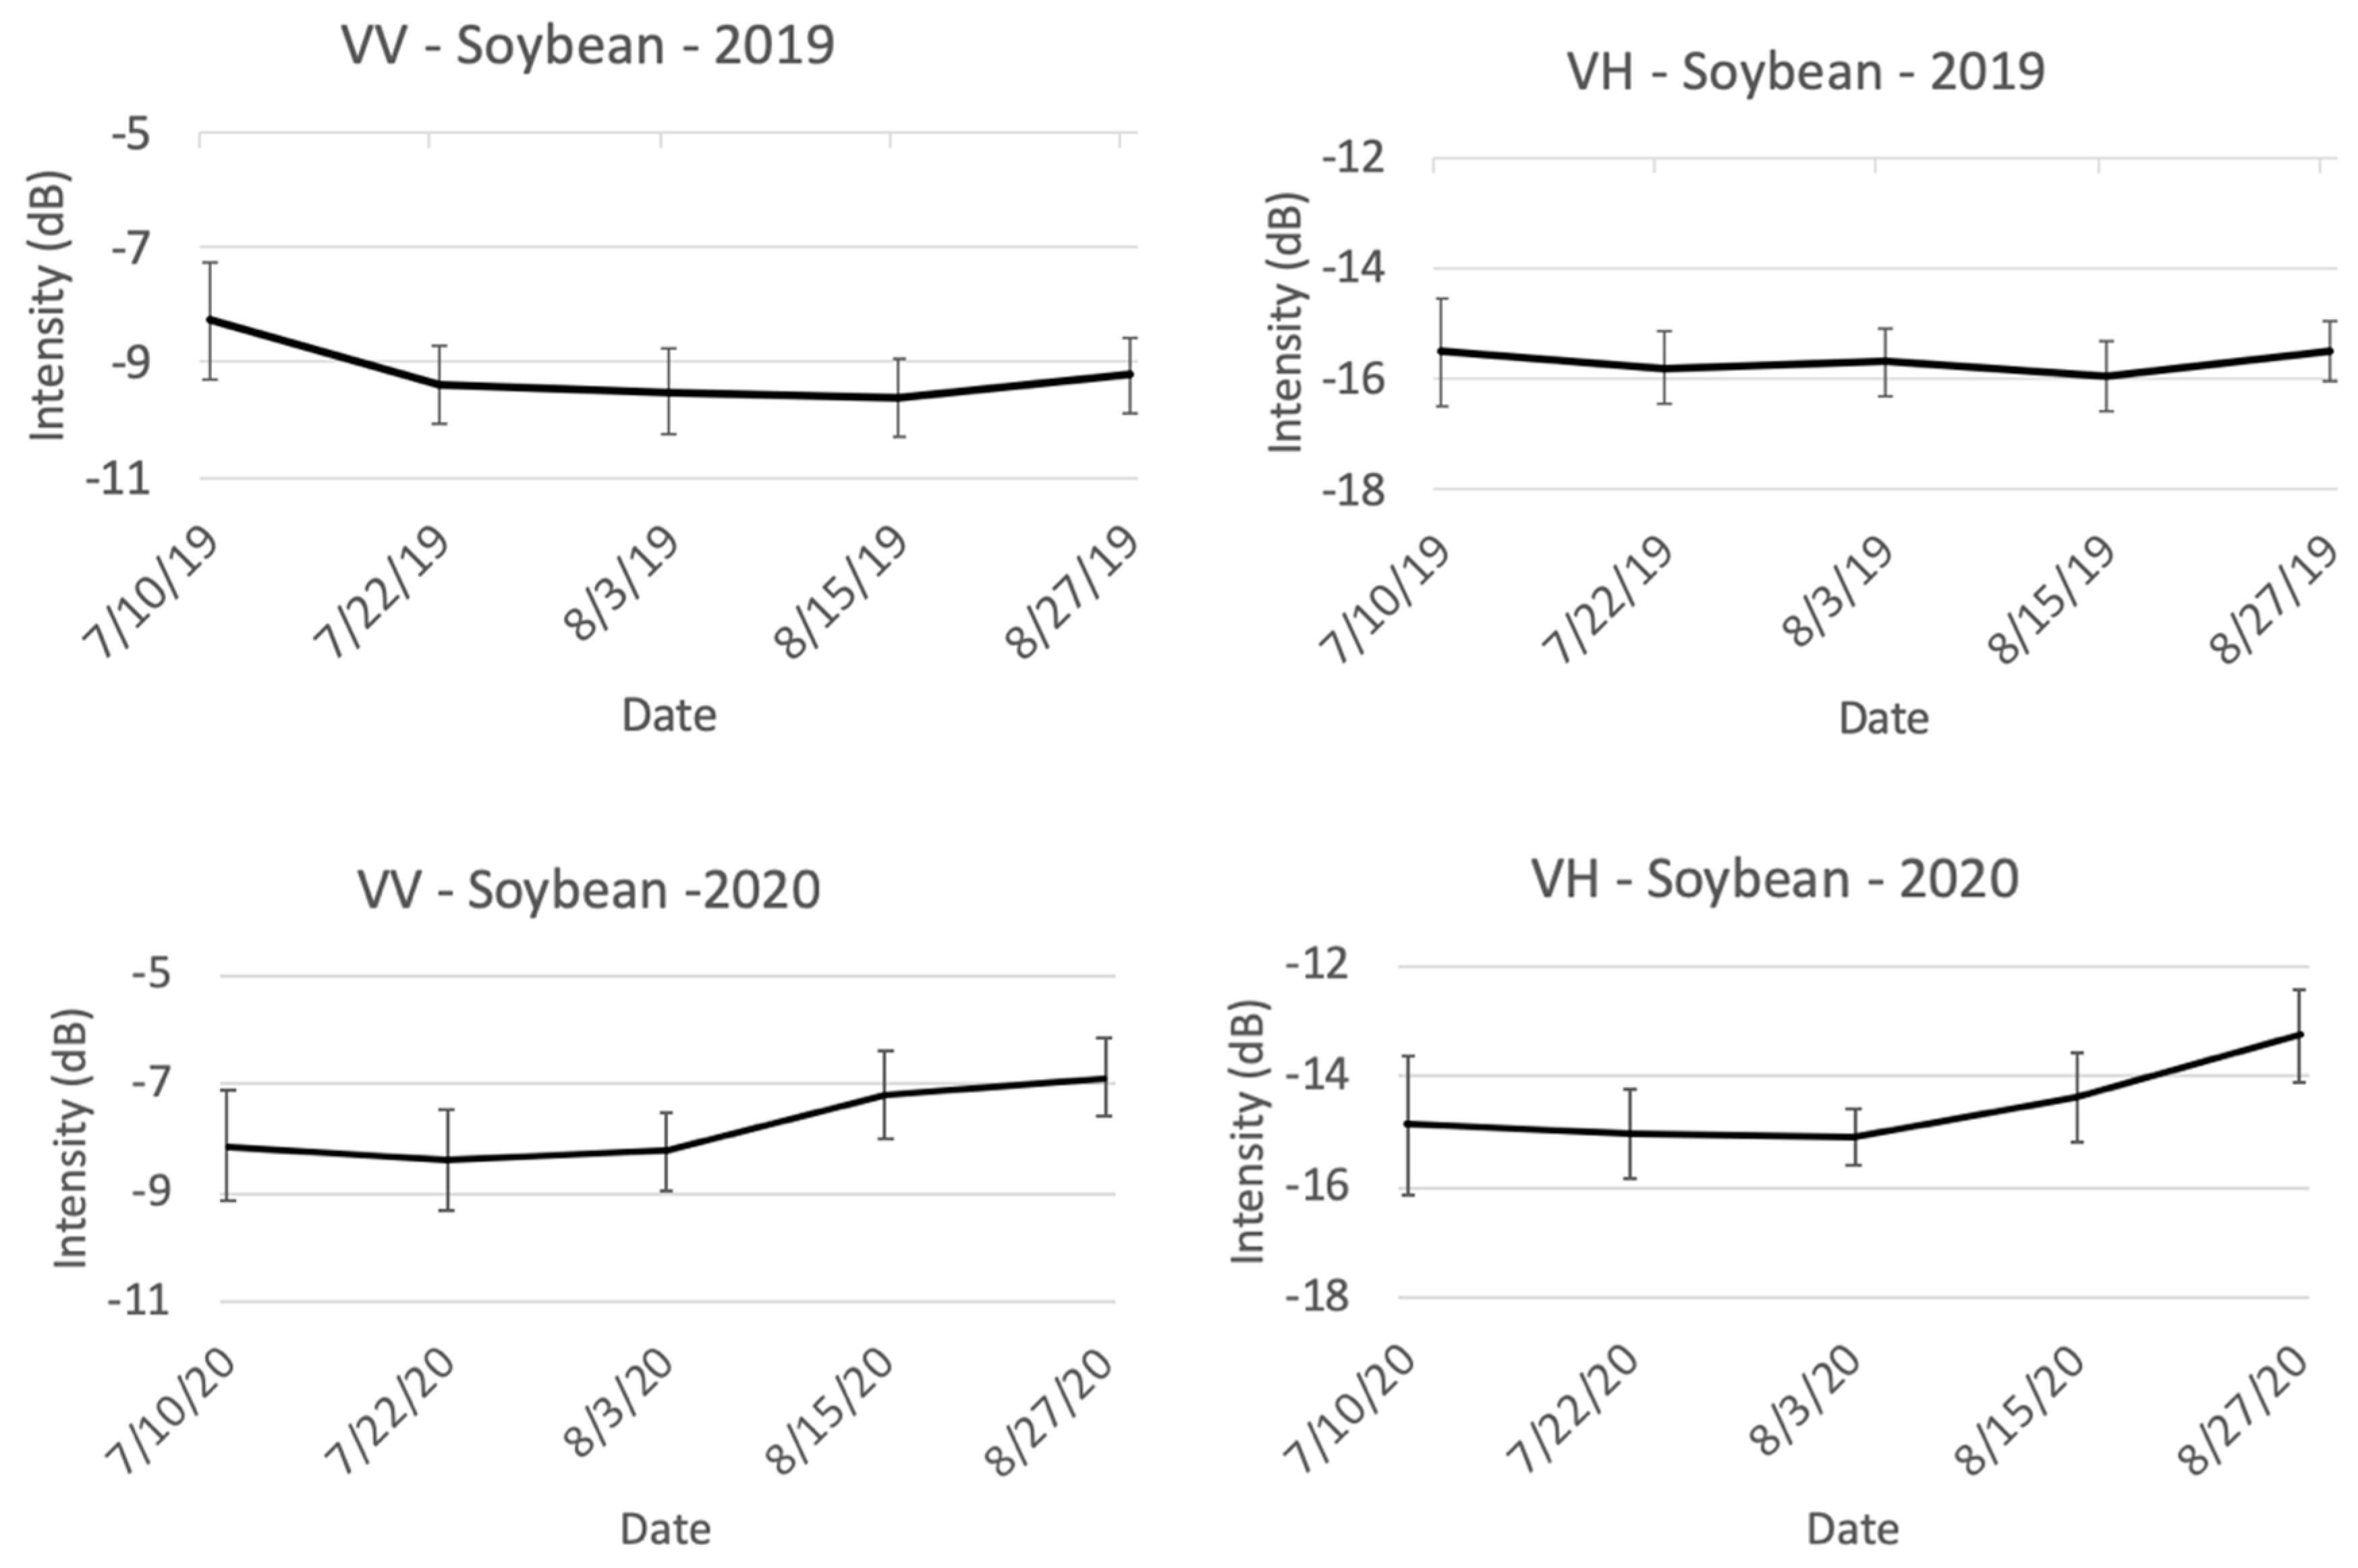
4.2. Time-Series Analysis

As discussed in the Methodology section, we assessed the sensitivity of VV and VH time series to crop damage impacts from the storm. We plotted the mean intensities for 150 corn sites and the 150 soybean sites from 10 July 2020 to 27 August 2020 for both polarizations and for 2019 and 2020 in Figure 5.
The average intensities were relatively stable in July for both VV and VH for corn in 2019. Then, in August, because of the crop growth, backscatter intensities increased for both polarizations. From 3 August to 15 August 2019, the increase was 0.8 dB for VV and 0.32 dB for VH. The average intensities for corn fields dropped more in mid-July in 2020 compared to 2019, probably due to crop and soil water content variations and/or drought conditions. The decreases were higher for VV than VH (1.48 dB for VV versus 0.84 dB for VH) as this polarization is more sensitive to soil moisture [23]. Then, in late July 2020, the intensities were stable until the storm happened on August 10th which made significant increases for both VV and VH intensities (1.45 dB for VV versus 1.35 dB for VH). If we compare the plots for corn-2020 with those of corn-2019, it demonstrates that the difference in changes between the two years (from 3 August to 15 August) are 0.65 dB for VV and 1.03 dB for VH which shows higher sensitivity of VH polarization compared to VV polarization to the storm impacts on corn crop. The strong derecho winds caused corn stalks to bend and in some cases snap, which caused many corn crops to dry out and/or die in the weeks following the storm. The drier conditions for corn due to the derecho and the ongoing drought were observed in the time series from 15–27 August and show 0.83 dB drop in VV intensity and 0.7 dB drop in VH intensity.
For soybean in 2019, the intensities dropped by 1.13 dB for VV and 0.29 dB for VH from 10 July to 22 July, likely due to variations in soil and crop water content. From 22 July to 15 August, the intensities did not change significantly and then in mid to late August, because of the crop growth, small increases in both VV (0.4 dB) and VH (0.47 dB) intensities were observed. The plots for soybean in 2020 show relatively stable intensities for July. However, like corn, the intensities for soybean increased by 1.02 dB for VV and 0.7 dB for VH after the storm happened. Since soybean has lower biomass compared to corn, the soil has higher contribution to the scattered signal for a soybean field than a corn field, especially at the time of the growing season when corn is more than 1 m tall and the soil effects on the backscattered signal are reduced. This can explain the higher increase in VV than VH after the storm for soybean. Since soybeans have a more flexible structure and grow lower to the ground than corn, most soybean crops affected by the derecho continued to grow from 15–27 August and so the intensities continued to increase (0.34 dB for VV and 1.13 dB for VH).
To further compare VV and VH polarizations for crop damage monitoring, we plotted the VV vs. VH intensity at each timestep for the time series of corn and soybean fields in 2019 and 2020 in Figure 6. The correlation of determination (R2) between VV and VH was higher for corn (0.93) than soybean (0.86) in 2020. This suggests that the choice of polarization for detecting derecho-impacted fields will have a greater effect for soybean fields than corn fields. The correlations for 2019 are much lower for both crops but still the correlation for corn (R2 of 0.57) is higher than the correlation for soybean (R2 of 0.48). The lower correlations for 2019 are because of different crop growth stages. Actually, in 2019, there was a significant delay (~3 weeks) on planting date for much of the crop due to the flood.
Given the higher sensitivity of VH polarization compared to VV polarization to crop structure variations especially for corn (Figure 5), the VH polarization was used for the change detection operation and detecting the impacted fields. Also, the analysis of the time series plots and our visual inspections of the SAR images before and after the storm demonstrated that the VH intensity changes more than 1.5 dB within a 12-day time-frame between the two Sentinel-1 acquisitions before and after the storm are related to the impacts of the storm on crops. Lower threshold values do not effectively suppress changes that are due to natural variations or crop growth, rather than due to storm impacts.

4.3. Impacted Area

We used the 1.5 dB threshold for VH intensity changes to detect regions impacted by the derecho. In total, 2.59 million acres were impacted, including 1.99 million acres of corn and 0.60 million acres of soybean (Figure 7 and Figure 8). All 14 fields for which we had in-situ data were detected in the damage map. We observed that the storm did not have uniform impacts on all fields. Figure 8 shows a zoomed-in inset of the affected region. While many fields in this inset were detected as storm-impacted fields, other fields were not as severely impacted. The severity of the storm impacts is discussed further in the next section.
We compared our results to two other studies published by private companies McKinsey and Company, Inc. (https://www.mckinsey.com/industries/agriculture/our-insights/how-the-iowa-derecho-has-affected-2020-crops#), and Indigo Ag, Inc (https://www.indigoag.com/hubfs/Derecho_Report_vFINAL.pdf?hsCtaTracking=6743af10-1790-4712-8d47-ad2af4fafd70%7Ce2e218a2-bdc5-4fdb-9e0c-f2037f212ef6). Table 1 shows the damaged area estimates from their studies compared to ours. McKinsey and Company Inc. estimated that 3.1–3.8 million total acres were impacted, of which they estimated 10–0% were soybean and 80–90% were corn. This translates to 0.31–0.76 million acres for soybean and 2.48–3.42 million acres for corn. The estimates from the Indigo Ag, Inc. report are 1.4 million acres for soybean and 2.1 million acres for corn (3.5 million acres total). We also compared the forecasted harvested acres reported by the USDA in the August Crop Production Report (https://downloads.usda.library.cornell.edu/usda-esmis/files/tm70mv177/kw52jz21g/00000n572/crop0820.pdf) and the October Crop Production Report (https://downloads.usda.library.cornell.edu/usda-esmis/files/tm70mv177/ng452781q/mk61s709f/crop1020.pdf). The difference in forecasted harvested acres between these reports likely indicates how many acres the USDA estimated to be completely damaged (thus unable to be harvested) by the derecho. The USDA reduced the harvested acres forecast by 0.85 million acres for corn in the October report compared to the August report. However, the forecasted harvested acres for soybean remained constant between these reports.
Overall, our estimates lie in between those reported by USDA, McKinsey, and Indigo. Our estimated 0.6 million soybean acres is within the range reported by McKinsey but 0.8 million acres lower than the 1.4 million acres reported by Indigo. Our estimated 1.99 is close to the Indigo estimate of 2.1 million acres but slightly lower than both the Indigo and McKinsey estimates. Our estimates for corn and soybean acres are both higher than the USDA reductions in forecasted harvested acres, which is expected since our estimates include varying degrees of damage while the USDA acres likely accounts only for completely destroyed (unharvestable) crops. The difference between our estimates and those from Indigo and McKinsey can be attributed to differences in methods, particularly that the Indigo and McKinsey studies used VV polarization for change detection rather than VH, which we used in this study. In Figure 6, we demonstrated that there is a very high correlation between VV and VH intensities for corn and so using either polarization provides similar results for corn. However, the correlation between the two bands was lower for soybean and as such there could be a higher difference between the estimates using VV and VH for soybeans.
We also evaluated the impacted areas at the county level (Figure 9). Story county had the highest damage impacts with 0.174 million acres impacted (0.140 million acres corn and 0.034 million acres soybean), followed by Boone county (0.154 million acres in total, 0.132 million acres corn and 0.022 million acres soybean) and Marshall county (0.150 million acres in total, 0.126 million acres corn and 0.024 million acres soybean).

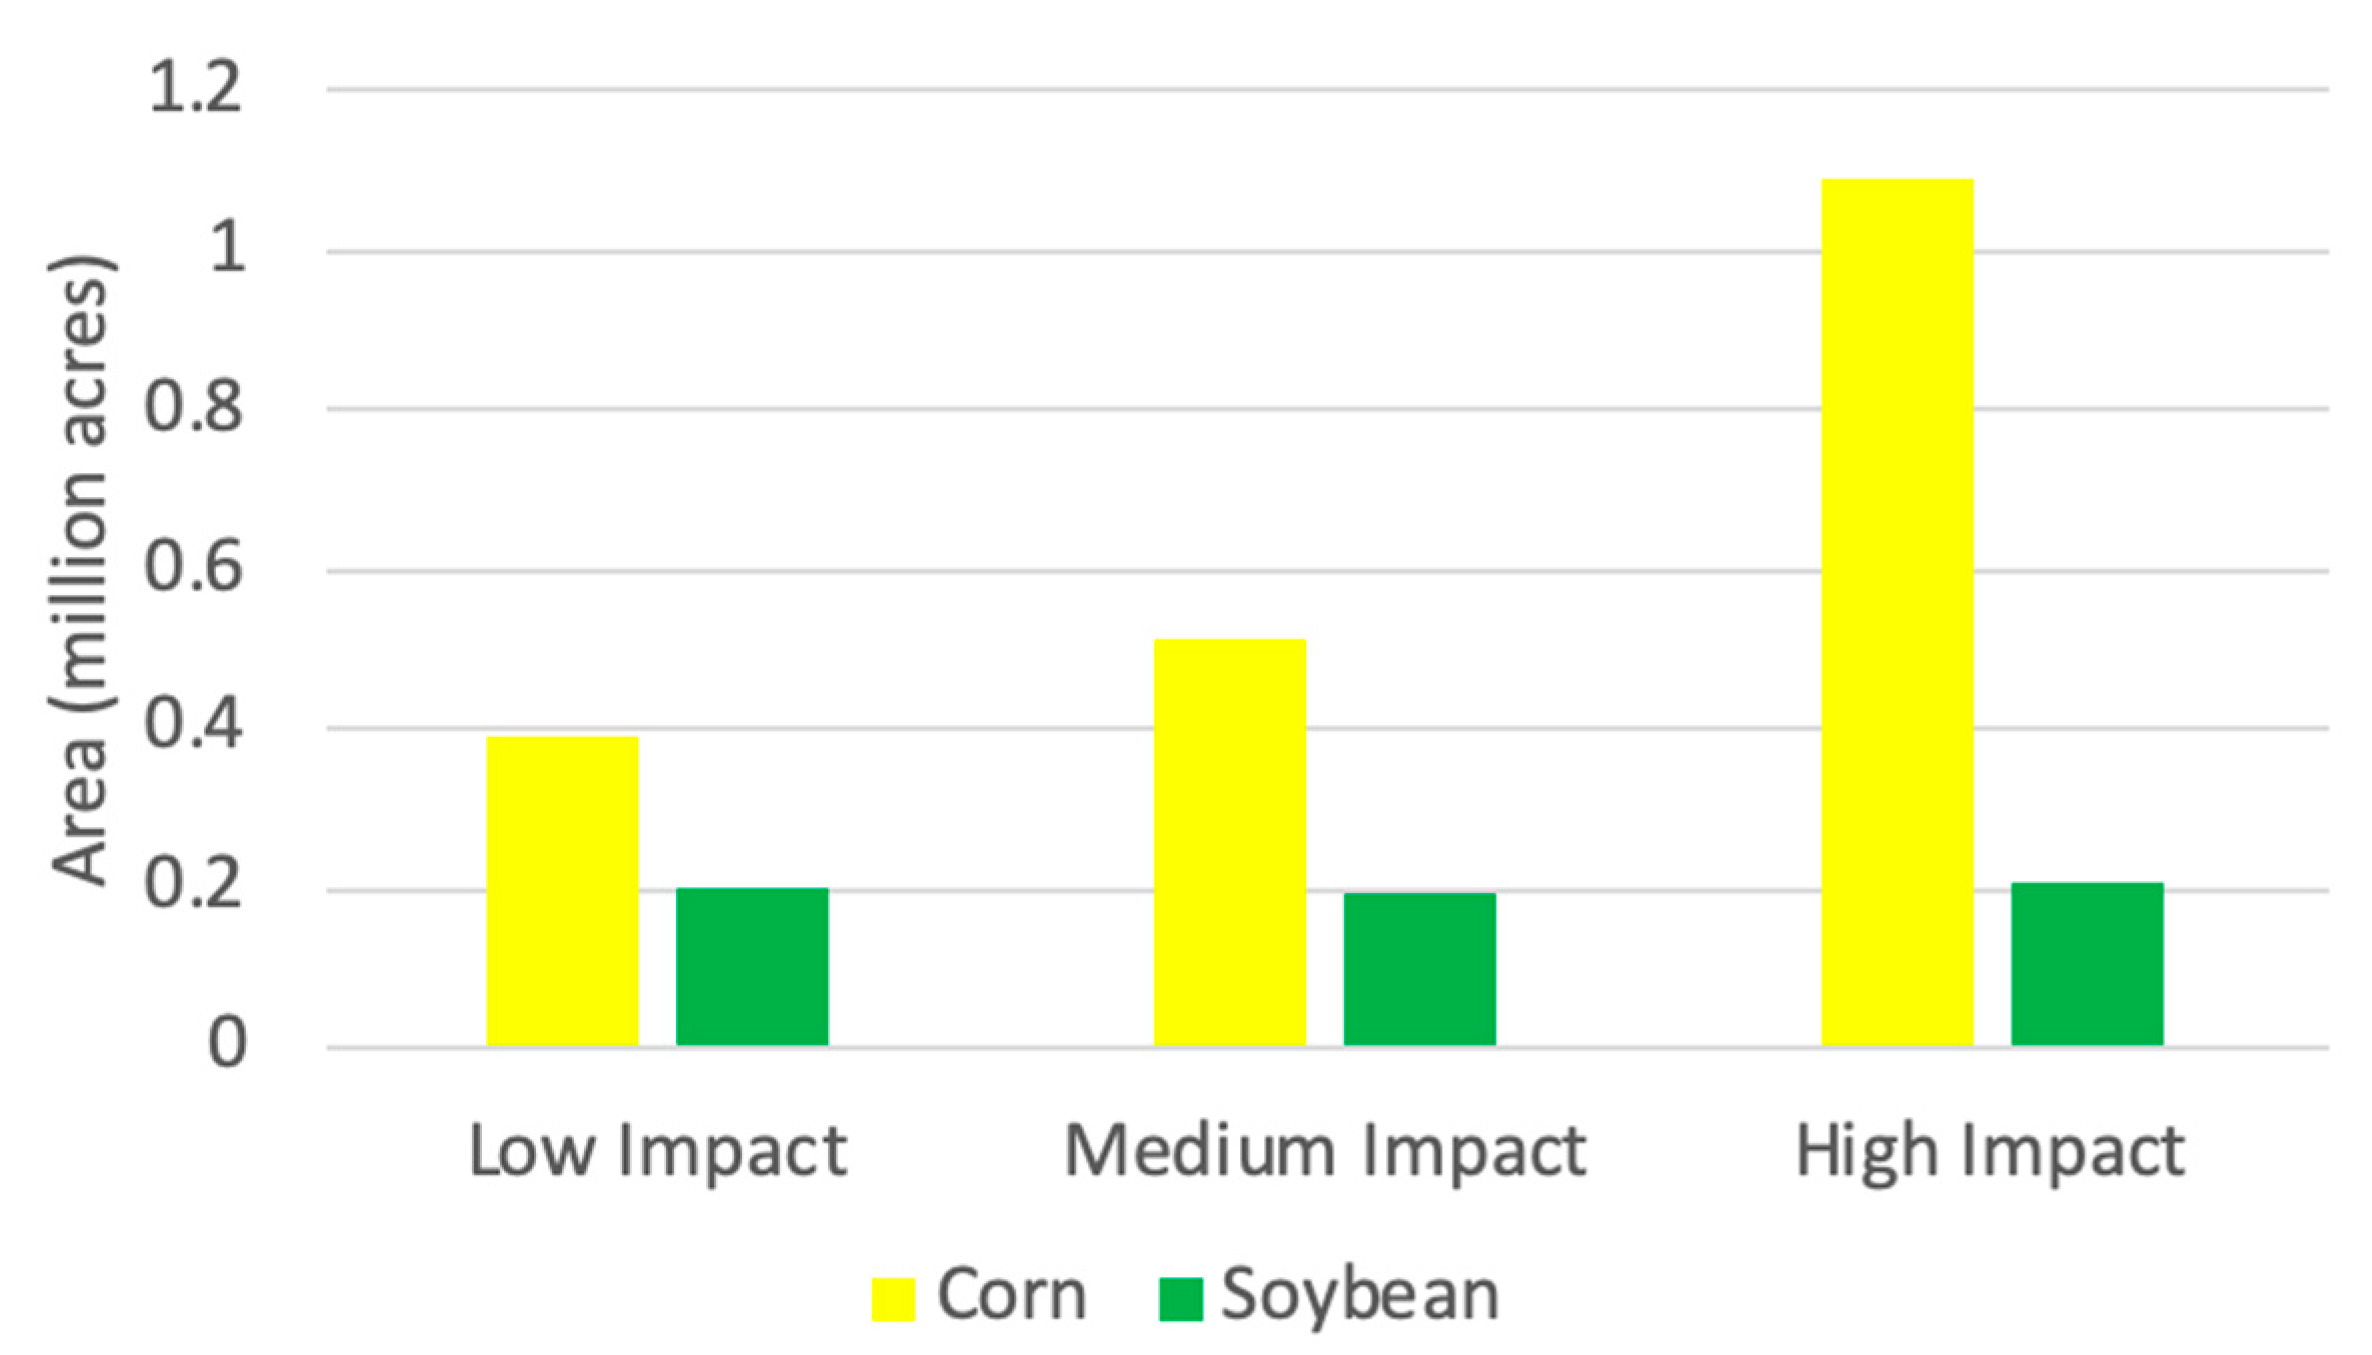
4.4. Damage Severity Estimates

As discussed, the storm did not have similar impacts on all the fields. We categorized the detected damage areas into three classes based on the amount of change observed in the Sentinel-1 VH intensities (Figure 10). The range of VH intensity changes for the low-impact class is 1.5–2.5 dB and it is expected that this class will show mild impacts from the storm. We hypothesize that yields for the fields in this class will not be affected by the derecho, but the harvesting speed and costs may be affected, especially for corn fields. This class includes 0.389 million acres of corn and 0.199 million acres of soybean. The second class is the medium-impacted areas which covers fields for which we anticipate the storm will have negative impacts on yield and includes the signal variations in the range of 2.5–3.5 dB. This class includes 0.514 million acres of corn and 0.195 million acres of soybean. The range of VH intensity changes for the last class includes variations of more than 3.5 dB. This class is considered to include highly impacted areas in which crops were fully damaged or had the largest negative yield impacts. This class includes 1.087 million acres of corn and 0.206 million acres of soybean. This class is close to the USDA reduced area between their August and October reports (i.e., 0.85 million acres for corn) and the difference goes into a reduction in yield but is harvested. Corn and soybean fields that are highly impacted by the storm (>3.5 dB change) are mapped in Figure 11.

5. Summary and Conclusions

In this study, we assessed the sensitivity of Sentinel-1 signals at VV and VH polarizations to the Iowa derecho storm impacts on corn and soybean crops. As is common in many rapid response scenarios, very limited amounts of in-situ data were available for calibrating and validating analyses. To determine an appropriate change detection threshold without in-situ data, we compared the time series of Sentinel-1 data from about 40 days before the storm to 20 days after to the same time period in 2019. Comparing to 2019 provided a baseline to assess the magnitude of change that could be caused by the derecho versus natural variations and growth in the crops. We observed that while both VV and VH polarizations were highly sensitive to the storm impacts, VH polarization was more sensitive to the crop damages, thus we used changes in VH intensity to evaluate the damage extent and severity.
We detected damaged areas using a 1.5 dB threshold on changes in VH intensity before and after the storm. We generated an in-season crop type map using multispectral time series observations from the Harmonized Landsat and Sentinel-2 (HLS) dataset from 2017 to 2020. We intersected the impacted area map with the crop type map to detect damaged area estimates for each crop type. These analyses resulted in damaged area estimates of 1.99 million acres for corn and 0.6 million acres for soybean. The map showed that 42 counties were affected by the storm and 12 counties (Story, Boone, Marshall, Cedar, Jasper, Clinton, Greene, Tama, Poweshiek, Benton, Dallas and Carroll) had each more than 0.1 million acres of impacted fields in total corn and soybean acreages. We further analyzed the severity of the storm impacts by categorizing the impacted areas into three severity categories based on the SAR signal variations before and after the storm. These categories ranged from a low impact class with 0.389 million acres of corn and 0.199 million acres of soybean to a high impact class with 1.087 million acres of corn and 0.206 million acres of soybean.
In this study, we demonstrated the feasibility of using satellite data, especially from SAR satellites, for monitoring the impacts of derechos and other destructive storms on agricultural lands. We showed that when optical satellite images are unsuitable due to high cloud coverage, no signal, or saturated signal, SAR satellites can provide timely, reliable and actionable information for rapid response scenarios.
Given the rapid and easy accessibility to satellite data and their large swath widths and high revisit times, Earth observation is the most efficient way of studying natural disasters and their impacts on agricultural fields and other land cover. As extreme weather events become more frequent and severe due to global climate change, increased capacity for satellite monitoring of natural disasters will be critical to provide the necessary maps and analyses for rapid response actions by governments, insurance companies, and farmers.

Author Contributions

Conceptualization, M.H.; methodology, M.H.; software, M.H., Y.-H.L., A.F.L.; validation, M.H.; formal analysis, M.H.; investigation, M.H.; resources, M.H., H.R.K., R.S., E.P., M.M., S.M., I.B.-R.; data curation, M.H., Y.-H.L., A.F.L., H.R.K., R.S., E.P., M.M., S.M.; writing—original draft preparation, M.H.; writing—review and editing, H.R.K., R.S., M.L.H., S.M., I.B.-R., E.P., M.M.; visualization, M.H., H.R.K., R.S.; supervision, M.H., I.B.-R.; project administration, M.H.; funding acquisition, I.B.-R. All authors have read and agreed to the published version of the manuscript.

Funding

This work was funded by the NASA’s Harvest Consortium on Food Security and Agriculture (Grant #80NSSC18M0039).

Acknowledgments

The authors would like to thank the Iowa farmers who contributed field photos and other valuable information during this study (Julius Schaaf, Arick Baker, Lance Lillibridge, Rod Pierce, and Doug Svendsen) as well as AgriTalk radio for helping reach farmers.

Conflicts of Interest

The authors declare no conflict of interest.

References

  1. USDA-NASS. Iowa Ag News–2019 Crop Production. Available online: https://www.nass.usda.gov/Statistics_by_State/Iowa/Publications/Crop_Report/2020/IA-Crop-Production-Annual-01-20.pdf (accessed on 20 September 2020).
  2. Dingle Robertson, L.; Davidson, A.; McNairn, H.; Hosseini, M.; Mitchell, S.; Abelleyra, D.; Verón, S.; Cosh, M.H. Synthetic Aperture Radar (SAR) Image Processing for Operational Space-Based Agriculture Mapping. Int. J. Remote Sens. 2020, 41, 7112–7144. [Google Scholar] [CrossRef]
  3. Lopez-Sanchez, J.M.; Irena, H.; Ballester-Berman, J.D. First demonstration of agriculture height retrieval with PolInSAR airborne data. IEEE Geosci. Remote Sens. Lett. 2012, 9, 242–246. [Google Scholar] [CrossRef]
  4. Alonso-González, A.; Jagdhuber, T.; Hajnsek, I. Agricultural monitoring with polarimetric SAR time series. In Proceedings of the 8th International Workshop on the Analysis of Multitemporal Remote Sensing Images (Multi-Temp), Annecy, France, 22–24 July 2015; IEEE: Piscataway, NJ, USA, 2015. [Google Scholar]
  5. Kontgis, C.; Warren, M.S.; Skillman, S.W.; Chartrand, R.; Moody, D.I. Leveraging Sentinel-1 time-series data for mapping agricultural land cover and land use in the tropics. In Proceedings of the 9th International Workshop on the Analysis of Multi Temporal Remote Sensing Images (MultiTemp), Brugge, Belgium, 27–29 June 2017. [Google Scholar]
  6. Veloso, A.; Mermoz, S.; Bouvet, A.; Le Toan, T.; Planells, M.; Dejoux, J.-F.; Ceschia, E. Understanding the temporal behavior of crops using Sentinel-1 and Sentinel-2-like data for agricultural applications. Remote Sens. Environ. 2017, 199, 415–426. [Google Scholar] [CrossRef]
  7. Hosseini, M.; McNairn, H.; Mitchell, S.; Davidson, A.; Dingle Robertson, L. Synthetic Aperture Radar and Optical Satellite Data for Estimating the Biomass of Corn. Int. J. Earth Obs. Geoinf. 2019, 83, 101933. [Google Scholar] [CrossRef]
  8. Mandal, D.; Hosseini, M.; McNairn, H.; Kumar, V.; Bhattacharya, A.; Rao, Y.S.; Mitchell, S.; Dingle Robertson, R.; Davidson, A.; Dabrowska-Zielinska, K. An investigation of inversion methodologies to retrieve the Leaf Area Index of corn from C-Band backscatter. Int. J. Earth Obs. Geoinf. 2019, 82, 101893. [Google Scholar] [CrossRef]
  9. Hosseini, M.; McNairn, H.; Merzouki, A.; Pacheco, A. Estimation of Leaf Area Index (LAI) in corn and soybeans using multi-polarization C- and L-band radar data. Remote Sens. Environ. 2015, 170, 77–89. [Google Scholar] [CrossRef]
  10. Bell, J.; Gebremichael, E.; Molthan, A.; Schultz, L.; Meyer, F.; Shrestha, S. Synthetic Aperture Radar and Optical Remote Sensing of Crop Damage Attributed to Severe Weather in the Central United States. In Proceedings of the IGARSS 2019, Yokohama, Japan, 28 July–2 August 2019; pp. 9938–9941. [Google Scholar]
  11. Surek, G.; Nador, G. Monitoring of Damage in Sunflower and Maize Parcels Using Radar and Optical Time Series Data. J. Sens. 2015, 2015. [Google Scholar] [CrossRef] [Green Version]
  12. Chauhan, S.; Darvishzadeh, R.; Lu, Y.; Boschetti, M.; Nelson, A. Understanding wheat lodging using multi-temporal Sentinel-1 and Sentinel-2 data. Remote Sens. Environ. 2020, 243, 111804. [Google Scholar] [CrossRef]
  13. Silleos, N.; Perakis, K.; Petsanis, G. Assessment of crop damage using space remote sensing and GIS. Int. J. Remote Sens. 2002, 23, 417–428. [Google Scholar] [CrossRef]
  14. Young, F.; Chandler, O.; Apan, A. Crop Hail Damage: Insurance Loss Assessment using Remote Sensing. In Proceedings of the Remote Sensing and Photogrammetry Society Conference, Aberdeen, UK, 7–10 September 2004. [Google Scholar]
  15. Claverie, M.; Ju, J.; Masek, J.G.; Dungan, J.L.; Vermote, E.F.; Roger, J.C.; Skakun, S.V.; Justice, C. The Harmonized Landsat and Sentinel-2 surface reflectance data set. Remote Sens. Environ. 2018, 219, 145–161. [Google Scholar] [CrossRef]
  16. McNairn, H.; Hochheim, K.; Rabe, N. Applying polarimetric radar imagery for mapping the productivity of wheat crops. Can. J. Remote Sens. 2004, 30, 517–524. [Google Scholar] [CrossRef]
  17. Jiao, X.; McNairn, H.; Shang, J.; Pattey, E.; Liu, J.; Champagne, C. The sensitivity of RADARSAT-2 polarimetric SAR data to corn and soybean leaf area index. Can. J. Remote Sens. 2009, 37, 69–81. [Google Scholar] [CrossRef]
  18. McNairn, H.; Shang, J. A Review of Multitemporal Synthetic Aperture Radar (SAR) for Crop Monitoring. In Multitemporal Remote Sensing: Methods and Applications; Ban, Y., Ed.; Springer: Berlin/Heidelberg, Germany, 2016; Chapter 15; pp. 317–340. [Google Scholar]
  19. Boryan, C.; Yang, Z.; Mueller, R.; Craig, M. Monitoring US agriculture: The US Department of Agriculture, National Agricultural Statistics Service, Cropland Data Layer program. Geocarto Int. 2011, 26, 341–358. [Google Scholar] [CrossRef]
  20. Kerner, H.; Becker-Reshef, I.; Estefania, I.P.; Barker, B.; Sahajpal, R.; Skakun, S.; Gray, P.; Hosseini, M. Resilient In-Season Crop Type Classification in Multispectral Satellite Observations using Growth Stage Normalization. In Proceedings of the SIGKDD ACM Conference on Knowledge Discovery and Data Mining Workshops, San Diego, CA, USA, 23–27 August 2020. [Google Scholar]
  21. USDA-NASS. Crop Production Report. 11 December 2018. Available online: https://downloads.usda.library.cornell.edu/usda-esmis/files/tm70mv177/r781wm151/vm40xw490/crop1218.pdf (accessed on 20 September 2020).
  22. USDA-NASS. Crop Production Report. 9 October 2020. Available online: https://downloads.usda.library.cornell.edu/usda-esmis/files/tm70mv177/ng452781q/mk61s709f/crop1020.pdf (accessed on 20 September 2020).
  23. Vreugdenhil, M.; Wagner, W.; Bauer-Marschallinger, B.; Pfeil, I.; Teubner, I.; Rudiger, C.; Strauss, P. Sensitivity of Sentinel-1 Backscatter to Vegetation Dynamics: An Austrian Case Study. Remote Sens. 2018, 10, 1396. [Google Scholar] [CrossRef] [Green Version]
Figure 1. The state of Iowa, the sampling field locations, and the counties of Iowa, USA
Remotesensing 12 03878 g001
Figure 2. Derecho impacts on corn fields in Iowa. Photo credit: Lance Lillibridge (Iowa farmer).
Remotesensing 12 03878 g002
Figure 3. Flowchart of the processing steps to generate the derecho impacted fields map.
Remotesensing 12 03878 g003
Figure 4. In-season crop type map produced using HLS observations available in August 2020.
Remotesensing 12 03878 g004
Figure 5. Time-series of VV and VH intensities for corn and soybean.
Remotesensing 12 03878 g005aRemotesensing 12 03878 g005b
Figure 6. Correlations between VV and VH intensities for corn and soybean fields in 2019 and 2020.
Remotesensing 12 03878 g006
Figure 7. Impacted fields by Derecho for (a) corn and (b) soybean fields.
Remotesensing 12 03878 g007
Figure 8. Derecho impact map over corn, soybean and the in-situ fields.
Remotesensing 12 03878 g008
Figure 9. Total impacted areas for each county.
Remotesensing 12 03878 g009
Figure 10. Derecho damage severity estimates.
Remotesensing 12 03878 g010
Figure 11. Corn and soybean fields that are highly impacted by the storm.
Remotesensing 12 03878 g011
Table 1. Estimates from published studies on derecho impacts over Iowa corn and soybean fields compared to our study. All estimates are in million acres.
McKinsey and Company Inc.Indigo Ag Inc.NASA-Harvest (i.e., This Study)
Total3.1–3.83.52.59
Soybean0.31–0.761.40.6
Corn2.48–3.422.11.99
Publisher’s Note: MDPI stays neutral with regard to jurisdictional claims in published maps and institutional affiliations.

