Article

Numerical Simulation Study on the Influence of Branching Structure of Longmen Shan Thrust Belt on the Nucleation of Mw7.9 Wenchuan Earthquake

1
Key Laboratory of Earthquake Dynamics, Institute of Geology, China Earthquake Administration, Beijing 100029, China
2
China Earthquake Networks Center, Beijing 100045, China
*
Author to whom correspondence should be addressed.
Remote Sens. 2020, 12(24), 4031; https://0-doi-org.brum.beds.ac.uk/10.3390/rs12244031
Submission received: 8 November 2020 / Revised: 2 December 2020 / Accepted: 7 December 2020 / Published: 9 December 2020
(This article belongs to the Section Remote Sensing in Geology, Geomorphology and Hydrology)

Abstract

:
On the Longmen Shan thrust belt (LMS) on the eastern margin of Tibet Plateau, the Mw7.9 Wenchuan earthquake occurred in 2008. As for the dynamic cause of the Wenchuan earthquake, many scholars have studied the rheological difference and terrain elevation difference on both sides of the fault. However, previous studies have simplified the LMS as a single listric-reverse fault. In fact, the LMS is composed of four faults with different dip angles in the shallow part, and the faults are Wenchuan-Maoxian fault (WMF), Yingxiu-Beichuan fault (YBF), Guanxian-Jiangyou fault (GJF) and Range Front Thrust (RFT) from west to east. However, the control of the branching structure of these faults on the distribution and accumulation of stress and strain during the seismogenic of the Wenchuan earthquake has not been discussed. In this paper, four viscoelastic finite element models with different fault numbers and combination structures are built to analyze the effect of fault branching structures on the stress distribution and accumulation during the seismogenic of Wenchuan earthquake, and we use geodetic data such as GPS and precise leveling data to constrain our models. At the same time, we also study the influence of the existence of the detachment layer, which is formed by the low-resistivity and low-velocity layer, between the upper and lower crust of the Bayan Har block and the change of its frontal edge position on the stress accumulation and distribution. The results show that the combinations of YBF and GJF is most conducive to the concentration of equivalent stress below the intersection of the two faults, and the accumulated stress on GJF is shallower than that on YBF, which means that more stress is transferred to the surface along GJF; and the existence of a detachment layer can effectively promote the accumulation of stress at the bottom of YBF and GJF, and the closer the frontal edge position of the detachment layer is to the LMS fault, the more favorable the stress accumulation is. Based on the magnitude of stress accumulation at the bottom of the intersection of YBF and GJF, we speculate that the frontal edge position of the detachment layer may cross YBF and expand eastward.

Graphical Abstract

1. Introduction

The Longmen Shan thrust belt (LMS) is the boundary between the eastern margin of Tibet Plateau and the stable Yangtze block (Sichuan Basin). Geological researches reveal that since the Cenozoic era, the LMS is mainly composed of the NE-trending fault such as Wenchuan-Maoxian fault (WMF), Yingxiu-Beichuan fault (YBF), Guanxian-Jiangyou fault (GJF) and Range Front Thrust (RFT) [1,2,3,4,5,6,7,8]. On 12 May 2008, a Mw7.9 earthquake happened and caused the simultaneous rupture of two parallel faults (the red lines in Figure 1a), the investigation after the earthquake showed that the YBF formed a 300 km rupture in the rocks deep in the crust within a minute after the earthquake occurred, of which about 240 km was exposed to the surface, the GJF formed a about 73 km rupture [9,10].
Since the occurrence of the Wenchuan earthquake, the dynamic mechanism of the strong earthquake in LMS, which has low fault activity and weak historical seismicity, has been the focus of scholars at home and abroad. Burchfiel et al. [2] argued that the lower-crustal material flowing outward from the center of the Tibet plateau is buttressed by the old, strong lithosphere that underlies the Sichuan basin, pushing up the crust above and maintaining steep topography through dynamic pressure, and the Wenchuan earthquake was occurred in the process of the uplift by the lower crust. However, Hubbard et al. [5] and Xu et al. [9] (Figure 1b) believed that the upper-crustal deformation, decoupled from the lower crust by a series of detachments, is the main mechanism of Wenchuan earthquake. They thought the accumulated material in the upper crust would exert stronger and stronger forces to the hanging wall of the LMS, once the shear stresses exceed the friction strength, the fault would be unlocked. And a large number of geophysical studies [8,11,12,13,14,15,16,17,18] have shown that there is an extremely thin low-resistivity and low-velocity layer about 20 km deep in the LMS area (Figure 1c, we call it detachment layer in this paper), which may play an important role in the decoupling between the upper crust and lower crust. Based on those disputes, many authors have carried out a large number of numerical simulation models to explain the mechanism of Wenchuan earthquake. By building single fault models with high-angle and listric-reverse structure, Zhu et al. [10,19] explained the role of fault structure in the stress accumulation of Wenchuan earthquake, and the simulation results show that the equivalent stress was more concentrated in the area where the fault translates from low angle (30 degree angle below 15 km) to high angle (70 degree angle above 15 km). Tao et al. [20] and Yao et al. [21] refined the fault structure and took the detachment layer as detachment between the lower crust and upper crust, the simulation results show that the existence of the detachment layer leads to more stress accumulation in LMS and further promotes the occurrence of Wenchuan earthquake.
Although previous studies had partially considered the influence of fault structure and medium rheological difference on both sides of LMS, most of the researches simplified the LMS as one fault. Why the Mw7.9 Wenchuan Earthquake mainly occurred on the YBF instead of the WMF, which has the same listric-reverse structure like the YBF. What are the roles of several major faults in the seismogenic of earthquakes in LMS, especially the influence of the complex structure of multiple faults, which are separated in the shallow part and converging in the deep part, on the earthquake nucleation, and the control effect of the detachment layer and its frontal edge position on the earthquake nucleation has not been discussed either. In this paper, by building different kinds of 2D models with different fault structures, and by taking the detachment layer as the decoupling layer, we analyzed the role of four main faults in the distribution of stress and strain in the LMS, and discuss the effect of the frontal edge position of the detachment layer on stress accumulation. The whole models were simulated by contact analysis and viscoelastic finite element method (FEM), and the geodetic data (such as GPS and precise leveling data), combined with geologic, geophysical analyses were used to constrain geometry of the LMS models.
Figure 1. (a) Tectonic setting of Wenchuan earthquake; Beach ball: Wenchuan mainshock; Blue dots: Aftershocks (≥M4) as of 12 August 2008, including three sizes, 4 M 4.9 , 5 M 5.9 , 6 M 6.9 ; Gray dots: Historical earthquake distribution from 1700 to May 2008, including three sizes, 5 M 5.9 , 6 M 6.9 and M 7.0 ; Orange dots: Historical earthquake on LMS from 1700 to May 2008, including one sizes, M 6.0 ; Red line: Ruptures caused by Wenchuan earthquake; Gray lines: Active faults in the study area; Black arrows: GPS velocity in 1999-2007 relative to the South China Block; Yellow line: The location of the two-dimension model used in this study. (b) three-dimension model of LMS (Xu et al., [9]). (c) a velocity distribution of the Aba-Shuangliu explosion seismic profile across the LMS (Zhu [15]).
Remotesensing 12 04031 g001

2. Constrains on Model’s Geometry, Parameters and Deformation
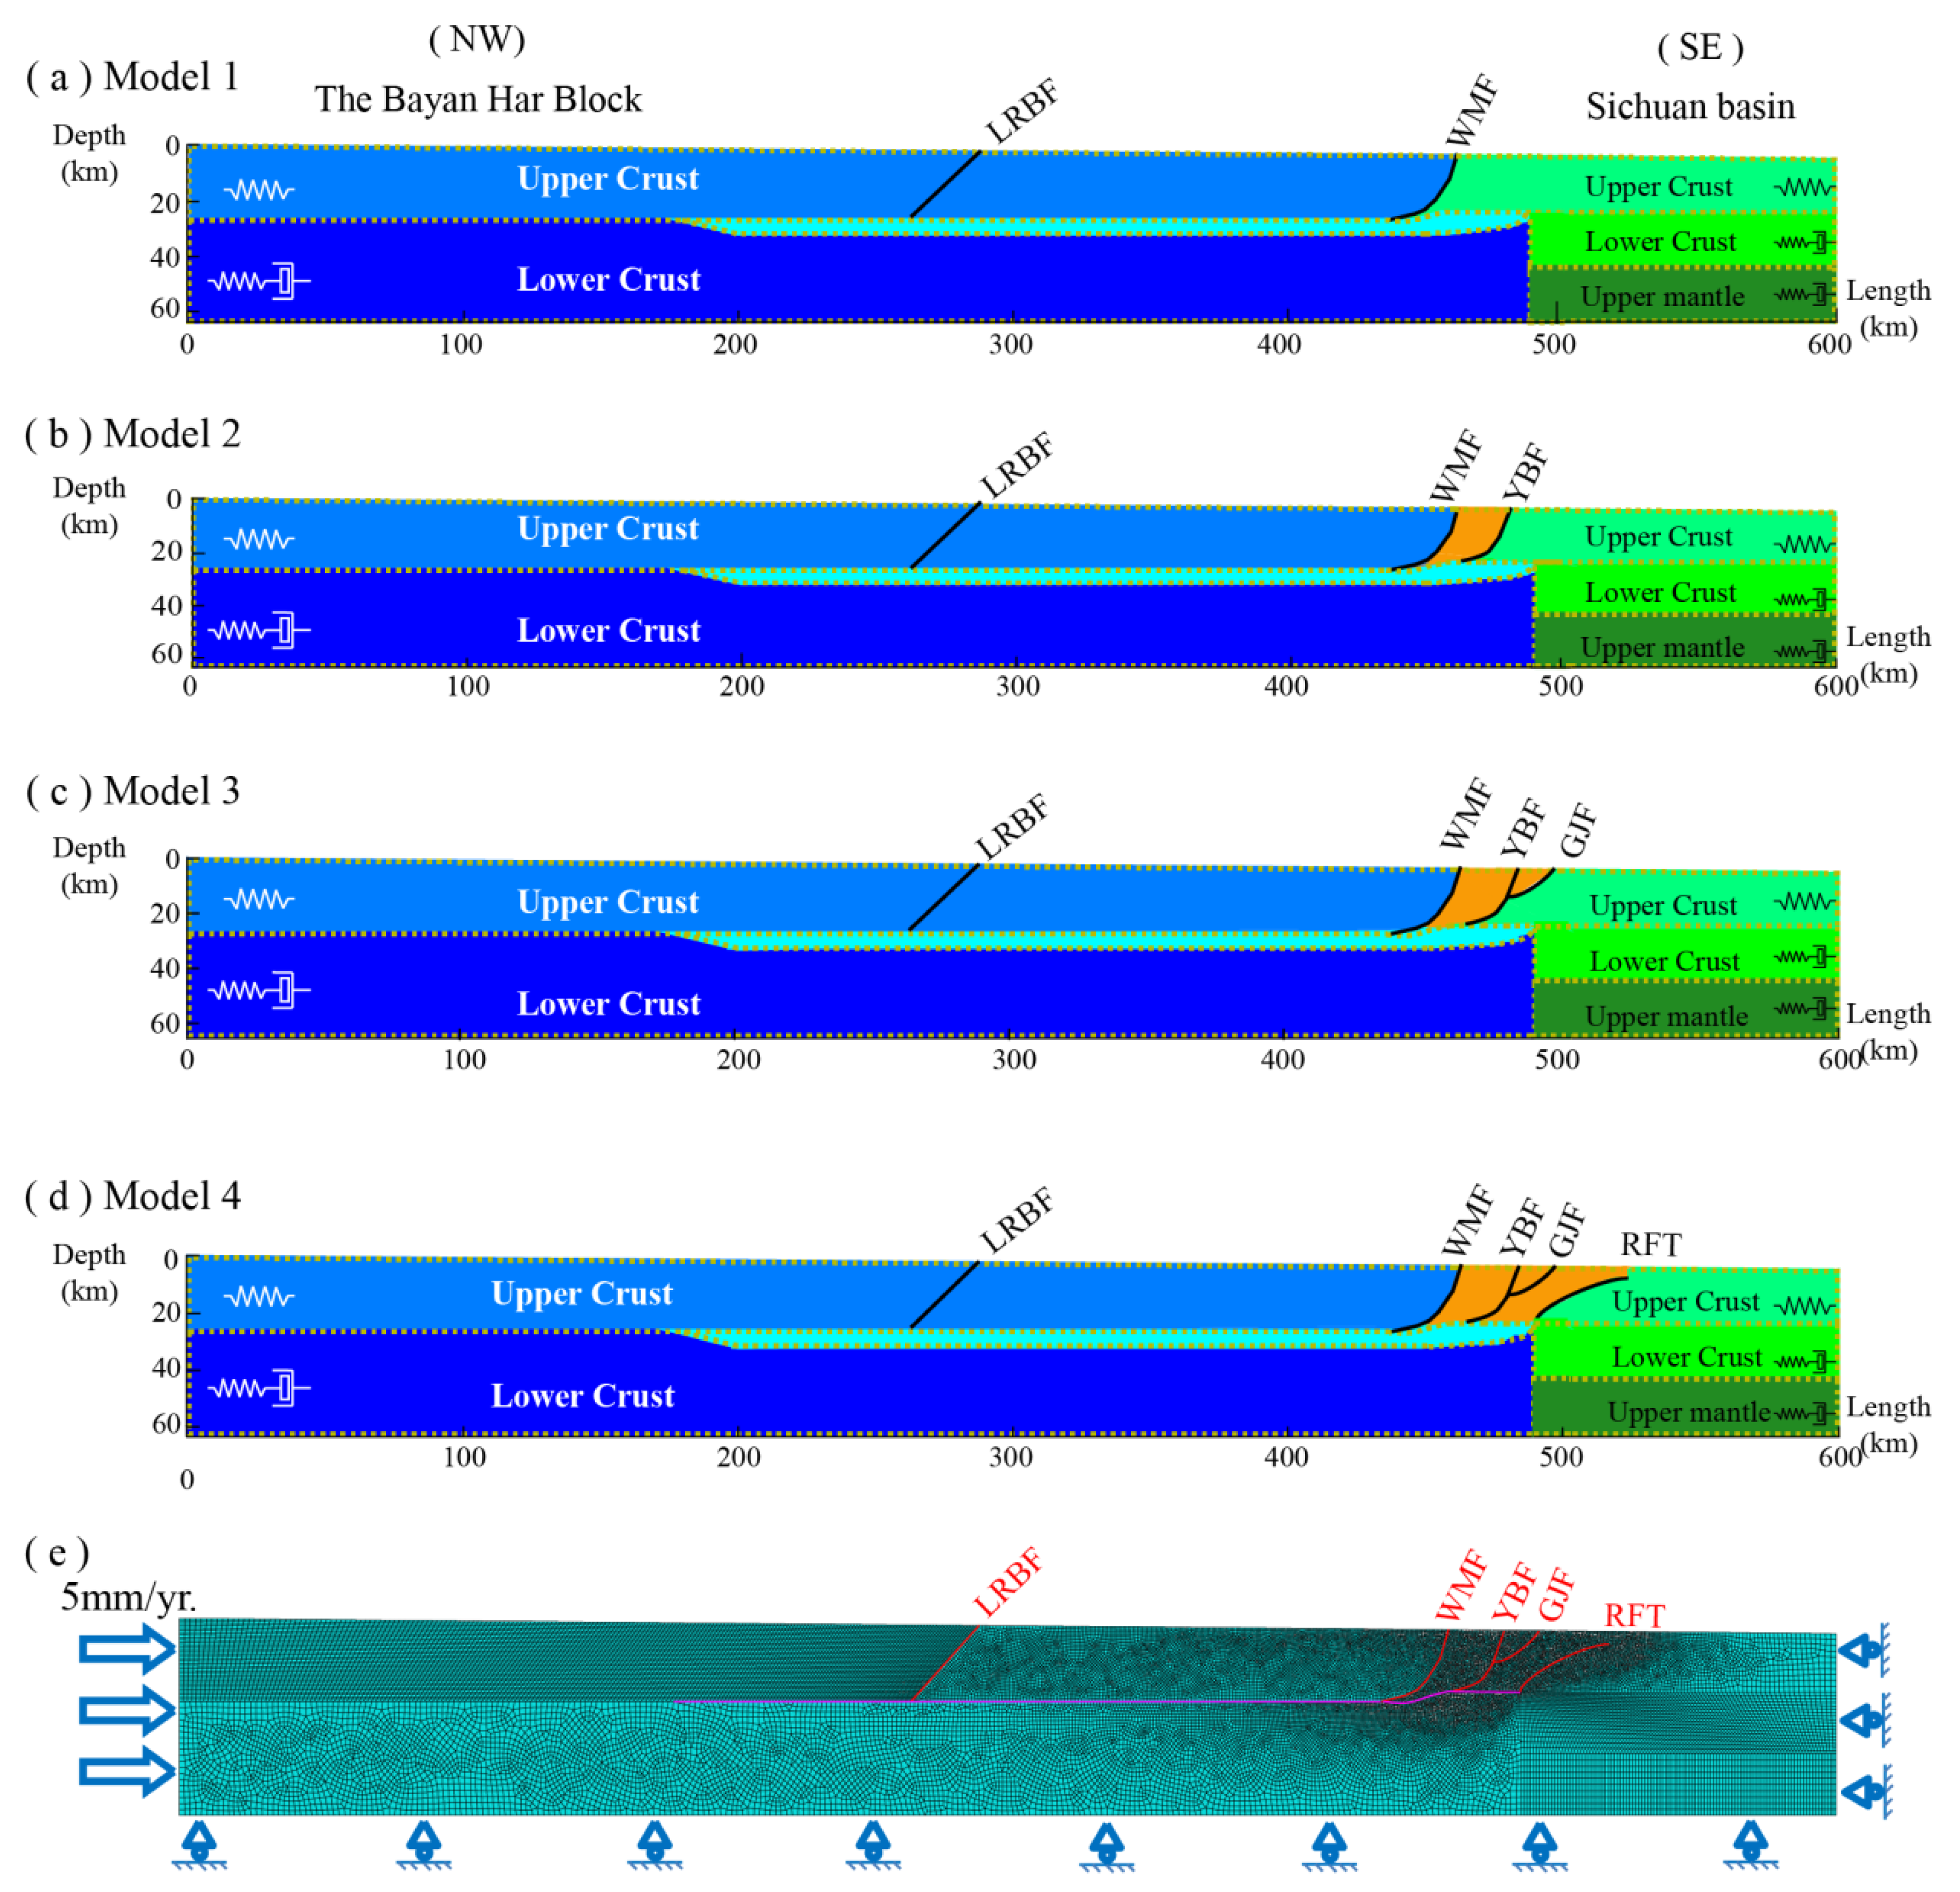
2.1. Geometry

Based on the geological researches [1,2,5,6,7,8], the models mainly considered the four NE-trending faults (the WMF, YBF, GJF and RFT) in LMS. In addition, the NE-trending LRBF in the Bayan Har block is also considered [22,23,24], because the following simulation results show that the absorption of LRBF to horizontal velocity is irreplaceable.
We established four two-dimension profile models with same size of 64 km × 600 km in depth and length across LMS, but with different fault structures and fault numbers (Figure 2). Model 1 is a single-fault model which only includes the WMF. Model 2 is a double-fault model which contains the WMF and YBF. Model 3 is a triple-fault model, including the WMF, YBF, and GJF. Model 4 contains the WMF, YBF, GJF, and the RFT extended to about 6 km from the surface (Hubbard et al., 2010; Li et al., 2010). According to the data of geological observation, relocated aftershocks and geophysics [2,10,19,20,25,26,27], the WMF and YBF are all designed as high-angle listric-reverse fault, which dip 70 degrees above 15 km depth, and become about 30 degrees below 15 km depth [10,19]. We apply the surface outcrop of the faults in LMS to constrain the distance between the faults in LMS. According to the geological researches [1,2,5,6,7,8,9] the horizontal projection distances of the faults (WMF and YBF in LMS) are about 20–23 km. Therefore, the horizontal constraints on the projection distance of the fault and the vertical constraints on the dip angle of the fault can help us build the WMF and YBF in LMS better. The simulation results of the influence of the horizontal projection distance of one high-angle listric-reverse fault like YBF show that when the projection distance is within the range of 15–25 km, the stress accumulation difference at the bottom of the fault is quite small [28]. The explosion seismic profile across the Wenchuan earthquake epicenter (Figure 1c from Zhu [15]) and tomography results [11,12,13,18] show that the thickness of the crust across the LMS has dropped sharply, the thickness of the crust in the eastern Tibet Plateau is about 70 km, after reaching into the Sichuan basin, the crust is thinning to about 40 km. We designed a jump of the thickness of the lower crust under the LMS (Figure 2). There is an extremely thin detachment layer extending to LMS at the depth of about 24 km under the upper crust [11,16,17,18]. We set it to a size of 5 km × 300 km [14] in thickness and length at the depth of 24 km, just between the upper crust and the lower crust of the Bayan Har Block. As we can see in Figure 2 that the WMF depth is deeper than the YBF, which connected with the detachment layer at a depth of about 24 km, while the YBF connects with the detachment layer at a depth of 20 km [6,7,9]. The GJF trace is located about 12 km east of the southern part of the YBF [6]. Based on surface outcrop investigation and detailed research on the Wenchuan earthquake Fault Scientific Drill [29], the GJF dips to NW at surface with an angle of about 40 degree and intersects with YBF at about 10 km deep (Figure 2c,d). In order to consider the impact of topography and gravity, the model depth is designed to be 60 km from the GJF surface to the bottom of the model. The eastern Tibetan plateau is considered to have a higher average altitude, with a maximum depth of 64 km, and the depth of Sichuan basin is 59 km. However, due to the limitation of the resolution of observation data and the complexity of the underground medium, the position of the frontal edge of the detachment layer is difficult to obtain accurately. Therefore, the effect of the difference in the position of the frontal edge of the detachment layer on the accumulation of stress will be discussed in Section 5.1 below.

2.2. Parameters

The Young’s modulus and Poisson ratio of the study area are all calculated by the observation results of artificial deep seismic sounding and natural earthquake [14,15,30], the model parameters in this paper are listed in Table 1. LMS is three Precambrian metamorphosed crystalline massifs, and the whole LMS is distinguished by higher Young’s modulus, higher Density and lower Poisson ratio from other regions. However, the detachment layer uses relatively lower young’s modulus (6.7 × 10¹⁰ Pa). We take the lower crust and upper mantle of Sichuan basin and Bayan Har Block as viscoelastic Maxwell material [31,32] and the upper crust as the linear elastic material. The viscosity was set according to the research results of Shi et al. [33] and Zhu et al. [10,19], the lower crustal viscosity of the Bayan Har Block is smaller than that of the Sichuan basin, and the viscosity of the detachment layer is set to be smallest, which is 1.0 × 10¹⁷ Pa·S.

3. Boundary Condition and Modeling Processes

3.1. Boundary Condition

The eastward movement of the Bayan Har block is blocked by the Sichuan basin. According to the GPS observation from 1999 to 2007, the average GPS velocity in the range of 500 km to the west of LMS is about 3–5 mm/yr. with respect to the fixed South China block [22,34,35]. Therefore, we applied a load of 5 mm/yr. to the west boundary of our models from top to bottom [19,36]. Because of the uncertainty in the quantitative determination of long-term slip rate [37], the recurrence intervals like Wenchuan earthquake in YBF changes greatly. Data from paleoseismic activity indicate that the average recurrence period is around 3000 years [38]; while the results of the viscoelastic finite element model [39] show that the recurrence period of strong earthquakes similar to the Wenchuan earthquake is between 4200 and 6500 years. In this paper, we take a relatively short period of 3000 years to simulate nucleation of Mw7.9 Wenchuan earthquake in LMS, because in this article we mainly focus on the impact of the LMS fault structure on the source location of the Wenchuan earthquake, the period of 3000 years is enough to form the accumulated stress and strain difference between different faults in LMS. The boundary conditions of the other regions were applied as follows: because the Sichuan basin was regarded as stable, the right side of the model was set to zero in the horizontal direction and was free vertically; the bottom of the model was free to move in the horizontal direction and was fixed to zero vertically; and the surface of the model was set to free (shown in Figure 2e).

3.2. Modeling Processes

In this paper, quadrilateral element (CPS4R) was used as the mesh type, in order to study the effect of fault structure on LMS, the fault plane and adjacent areas were densely meshed (as shown in Figure 2e by red solid line), and the interval was 0.5 km. The left, right and bottom boundaries of the model were divided with a maximum interval of 2 km. Take Model 4 as an example; there are 48,813 elements and 50,196 nodes. The contact between faults was realized by defining contact pairs, we defined the primary contact pairs on the fault plane of the footwall of the fault and secondary contact pairs on the fault plane of the hanging wall of the fault, and we got 76 contact pairs between the WMF, 61 contact pairs between the YBF, 38 contact pairs between the GJF, and 95 contact pairs between the RFT (Figure 6). Model 1 to Model 3 are hypothetical models which are used to compare the influence of branching structure on stress accumulation in LMS. In fact, the existing geological research results show that the fault structure in LMS may be closer to Model 4. The friction coefficient of fault will directly affect the slip rate of fault, therefore, we tried to calculate the results of different combinations of friction coefficient from 0.2 to 0.8 in Model 4, so as to ensure that the simulated velocity is equivalent to GPS and precise leveling data in LMS, and at the same time, the hanging wall and the footwall of the locked fault (such as the YBF) does not slide. The friction coefficient and boundary conditions of other hypothetical models are consistent with the settings in Model 4, which was to ensure the other conditions are consistent, except for the fault structure we need to analyze. Combined with the existing GPS velocity and leveling results (Section 4.1), the friction coefficient of faults in LMS is 0.6, and the friction coefficient of LRBF is smaller, which is 0.3 (the effect of the friction on the fault status will be discussed in Section 4). In order to simulate the slow decoupling of the upper crust and the lower crust caused by the detachment layer, we set the upper contact surface of the detachment layer associated with the upper crust as contact interface (the magenta line in Figure 2e) as simplification, and set the friction coefficient to 0.95. The whole calculation process was divided into four steps, we only applied gravity (gravitational acceleration is 9.8 m/s2) in the first step and calculated for up to 100,000 years to ensure that the models reached the stress balance, then the displacement load would be added step by step (each step represents 1000 years). ABAQUS software and 16G memory workstation were used to complete the model establishment, mesh generation and calculation.

4. Model Results

It is well known that the setting of boundary conditions, fault structure, friction coefficient will directly affect the calculation results, therefore, in order to verify the accuracy of simulation results, GPS velocity component perpendicular to the LMS [40] (the red points in Figure 3) and precise leveling data [41] (Figure 4a) were used to constrain the fault movement from horizontal and vertical directions. Both of the GPS velocity and precise leveling data in LMS show a very low velocity level, which prove that the main seismogenic fault may be fully or partially locked before the Wenchuan earthquake. However, the Wenchuan earthquake Fault Scientific Drill [29] results through the GJF (another rupture fault) confirm that the brittle fault rocks display characteristics of pressolution and ductile-like structures, indicating that the GJF is a seismic fault with long-term creeping properties. Therefore, in the actual simulation process, we need to adjust the friction coefficient (from 0.2 to 0.8 in this paper) on the fault to ensure the hanging wall and footwall of the locked fault do not appear accommodating displacement, while the sliding rate of creeping fault should be equivalent to the observed horizontal and vertical velocity.
Because of the special listric-reverse structure of WMF and YBF, when the friction coefficient is only 0.6, the two faults can be nearly locked, and the horizontal and vertical displacement difference between the hanging wall and footwall of the two faults are almost zero (Figure 3a and Figure 4b). However, in the simulation process, we also found that it is difficult to lock the GLF through the increase of friction coefficient. Even if we adjust the friction coefficient on GJF to 0.8 or even more, its creeping characteristics are still very significant (the mechanism affecting the creep characteristics of GJF will be explained in the stress distribution below), and moreover, after adjusting the friction coefficient of GJF, the deformation difference between the hanging wall and footwall of YBF will increase (YBF is unlocked), we find that the variation of the friction coefficient on the fault is closely related to various factors in our whole model system. The final setting of fault friction coefficient is shown in Section 3.2, under such friction coefficient, the horizontal and vertical velocity of Model 4 are in good agreement with the actual results.

4.1. Horizontal and Vertical Velocity across LMS

As is known to all, the dextral strike-slip rate of LRBF can reach to 5.4 ± 2.0 mm/yr. [24]. However, in this paper 2D models were used, so we can only absorb the horizontal motion component through the creeping of LRBF, so as to ensure that the horizontal velocity on the west side of the LMS is equivalent to the actual GPS velocity perpendicular to the LMS. In order to further reveal the role of LRBF, we obtain the surface horizontal velocity results in Model 4 with (black line in Figure 3) or without considering LRBF (green line in Figure 3). By comparing the two horizontal velocity results, we can infer that the absorption of LRBF to horizontal velocity is irreplaceable, which is consistent with the 1–2 mm/yr. reduction of GPS velocity [22,23] across the fault LRBF. The modelling deformation results (black line) is in good agreement with the GPS velocity component, which shows the gradual decrease of GPS horizontal velocity from west to east, further more; it shows a sharp change across the LRBF, the horizontal velocity in the west of LRBF is about 3.5 mm/yr., while it decreases to about 1.5 mm/yr. to the east of LRBF, and across the LMS, the horizontal velocity decreases again to about 0.5 mm/yr.. The simulated results show that there is another velocity reduction across the GJF, which proves that the GJF is in a creeping state in the fault structural system of LMS. We cannot judge the velocity variation of several faults in LMS only by GPS observed velocity component, because of itself low value and within the error range. The Wenchuan earthquake Fault Scientific Drill [28] results through the GJF confirm that the GJF is a seismic fault with long-term creeping properties. The creep state of the GJF reflected by the reduction of horizontal velocity simulated by Model 4 is similar to the actual drilling results. Therefore, the simulation results in Model 4 are consistent with GPS velocity in horizontal deformation field.
Then, in order to verify the vertical velocity results of the model, we collected the precise leveling data observed around the eastern margin of the Tibetan Plateau. The Leveling Networks were used for Seismic Application spanning the major active faults in China and surveyed by the China Earthquake Administration for the period of 1970 to 2009 [40]. The precise leveling data reflect the uplift rate of the Bayan Har block before the Wenchuan earthquake (Figure 4a) and the misclosures are within ±0.5 mm/km. There is a leveling survey route (the red point in Figure 4a) near the north of our two-dimension model, and the vertical deformation rate changes obviously from west to east. The precise leveling results (Figure 4a) show that in the area about 300 km wide in the west of LMS, the vertical deformation presents a convex shape with high value in the middle and low value on both sides. In the vicinity of LRBF, there is a significant vertical uplift deformation with the maximum uplift rate of 3.4 mm/yr.; the vertical velocity is about 2.0 mm/yr. at 100 km from the east and west sides of LRBF; and from LRBF to LMS, the vertical deformation rate decreases rapidly, from 3.4 mm/yr. in the east side of LRBF to −0.1 mm/yr. in the east side of LMS. The black curve with dots in Figure 4b shows the simulated vertical velocity results of Model 4 in the last 1000 years, in which the maximum velocity on the hanging wall of the LRBF reaches 3.0 mm/yr. The vertical velocity on the west side of LMS can reach 1.4 mm/yr., and the closer to LMS, the smaller the velocity value, and when crossing the GJF, the velocity drops to 0.1 mm/yr. and then increases slightly, which we consider it is related to the surface uplift caused by the blind fault-RFT. The vertical velocity in the west side of LRBF and LMS is similar to the precise leveling data, but there is discrepancy near the fault. For LRBF, as we all know that there are two parallel faults in the middle section of LRBF [24], but only one in the south section. Whether there is another blind fault structure like RFT in LRBF is not known. We can infer from the actual precise leveling data (Figure 4a) that there is a prominent uplift area in the eastern part of the southern section of LRBF, which can be explained by the vertical deformation of RFT in LMS across the GJF (Figure 4b). Maybe the depth of the blind fault in LRBF is much shallower, and the vertical velocity is greater than that in LMS. However, these are not the focus of this paper; we mainly focus on the influence of fault structure in LMS. Therefore, it is necessary to ensure that the simulated vertical velocity (about 1.0–1.4 mm/yr.) is equivalent to the actual precise leveling data (about 1.0–2.0 mm/yr.), so as to ensure the accuracy of our simulation results. We simplify the LRBF as one creeping fault in this paper at last. In addition, for the subsidence of Sichuan basin (Figure 4a), the deformation mechanism of these areas was not so clear, so we will not discuss separately in this paper. However, we found that the actual precise leveling data varies greatly at the distance of 400 km; the reduction is about 0.92 mm/yr. If we add this variation back to the original data (blue cross point in Figure 4b), we find that variation trend of the actual precise leveling data is consistent with the simulation result in LMS. This also further verified the accuracy of our simulation result.
The simulated horizontal and vertical velocity of Model 4 is in good agreement with the observed data, which proves that the design of whole model, the parameters, the fault structure, and the boundary condition settings are relatively reasonable. In addition, the simulation results show that there is no significant change in horizontal and vertical velocity across YBF, which may be related to the strong locking state of the fault. And this is consistent with the fact that no significant deformation of the hanging wall and footwall of the fault were observed before the earthquake. The deformation characteristics of the fault are controlled by the special listric-reverse structure in LMS, which will be the focus of our next analysis.

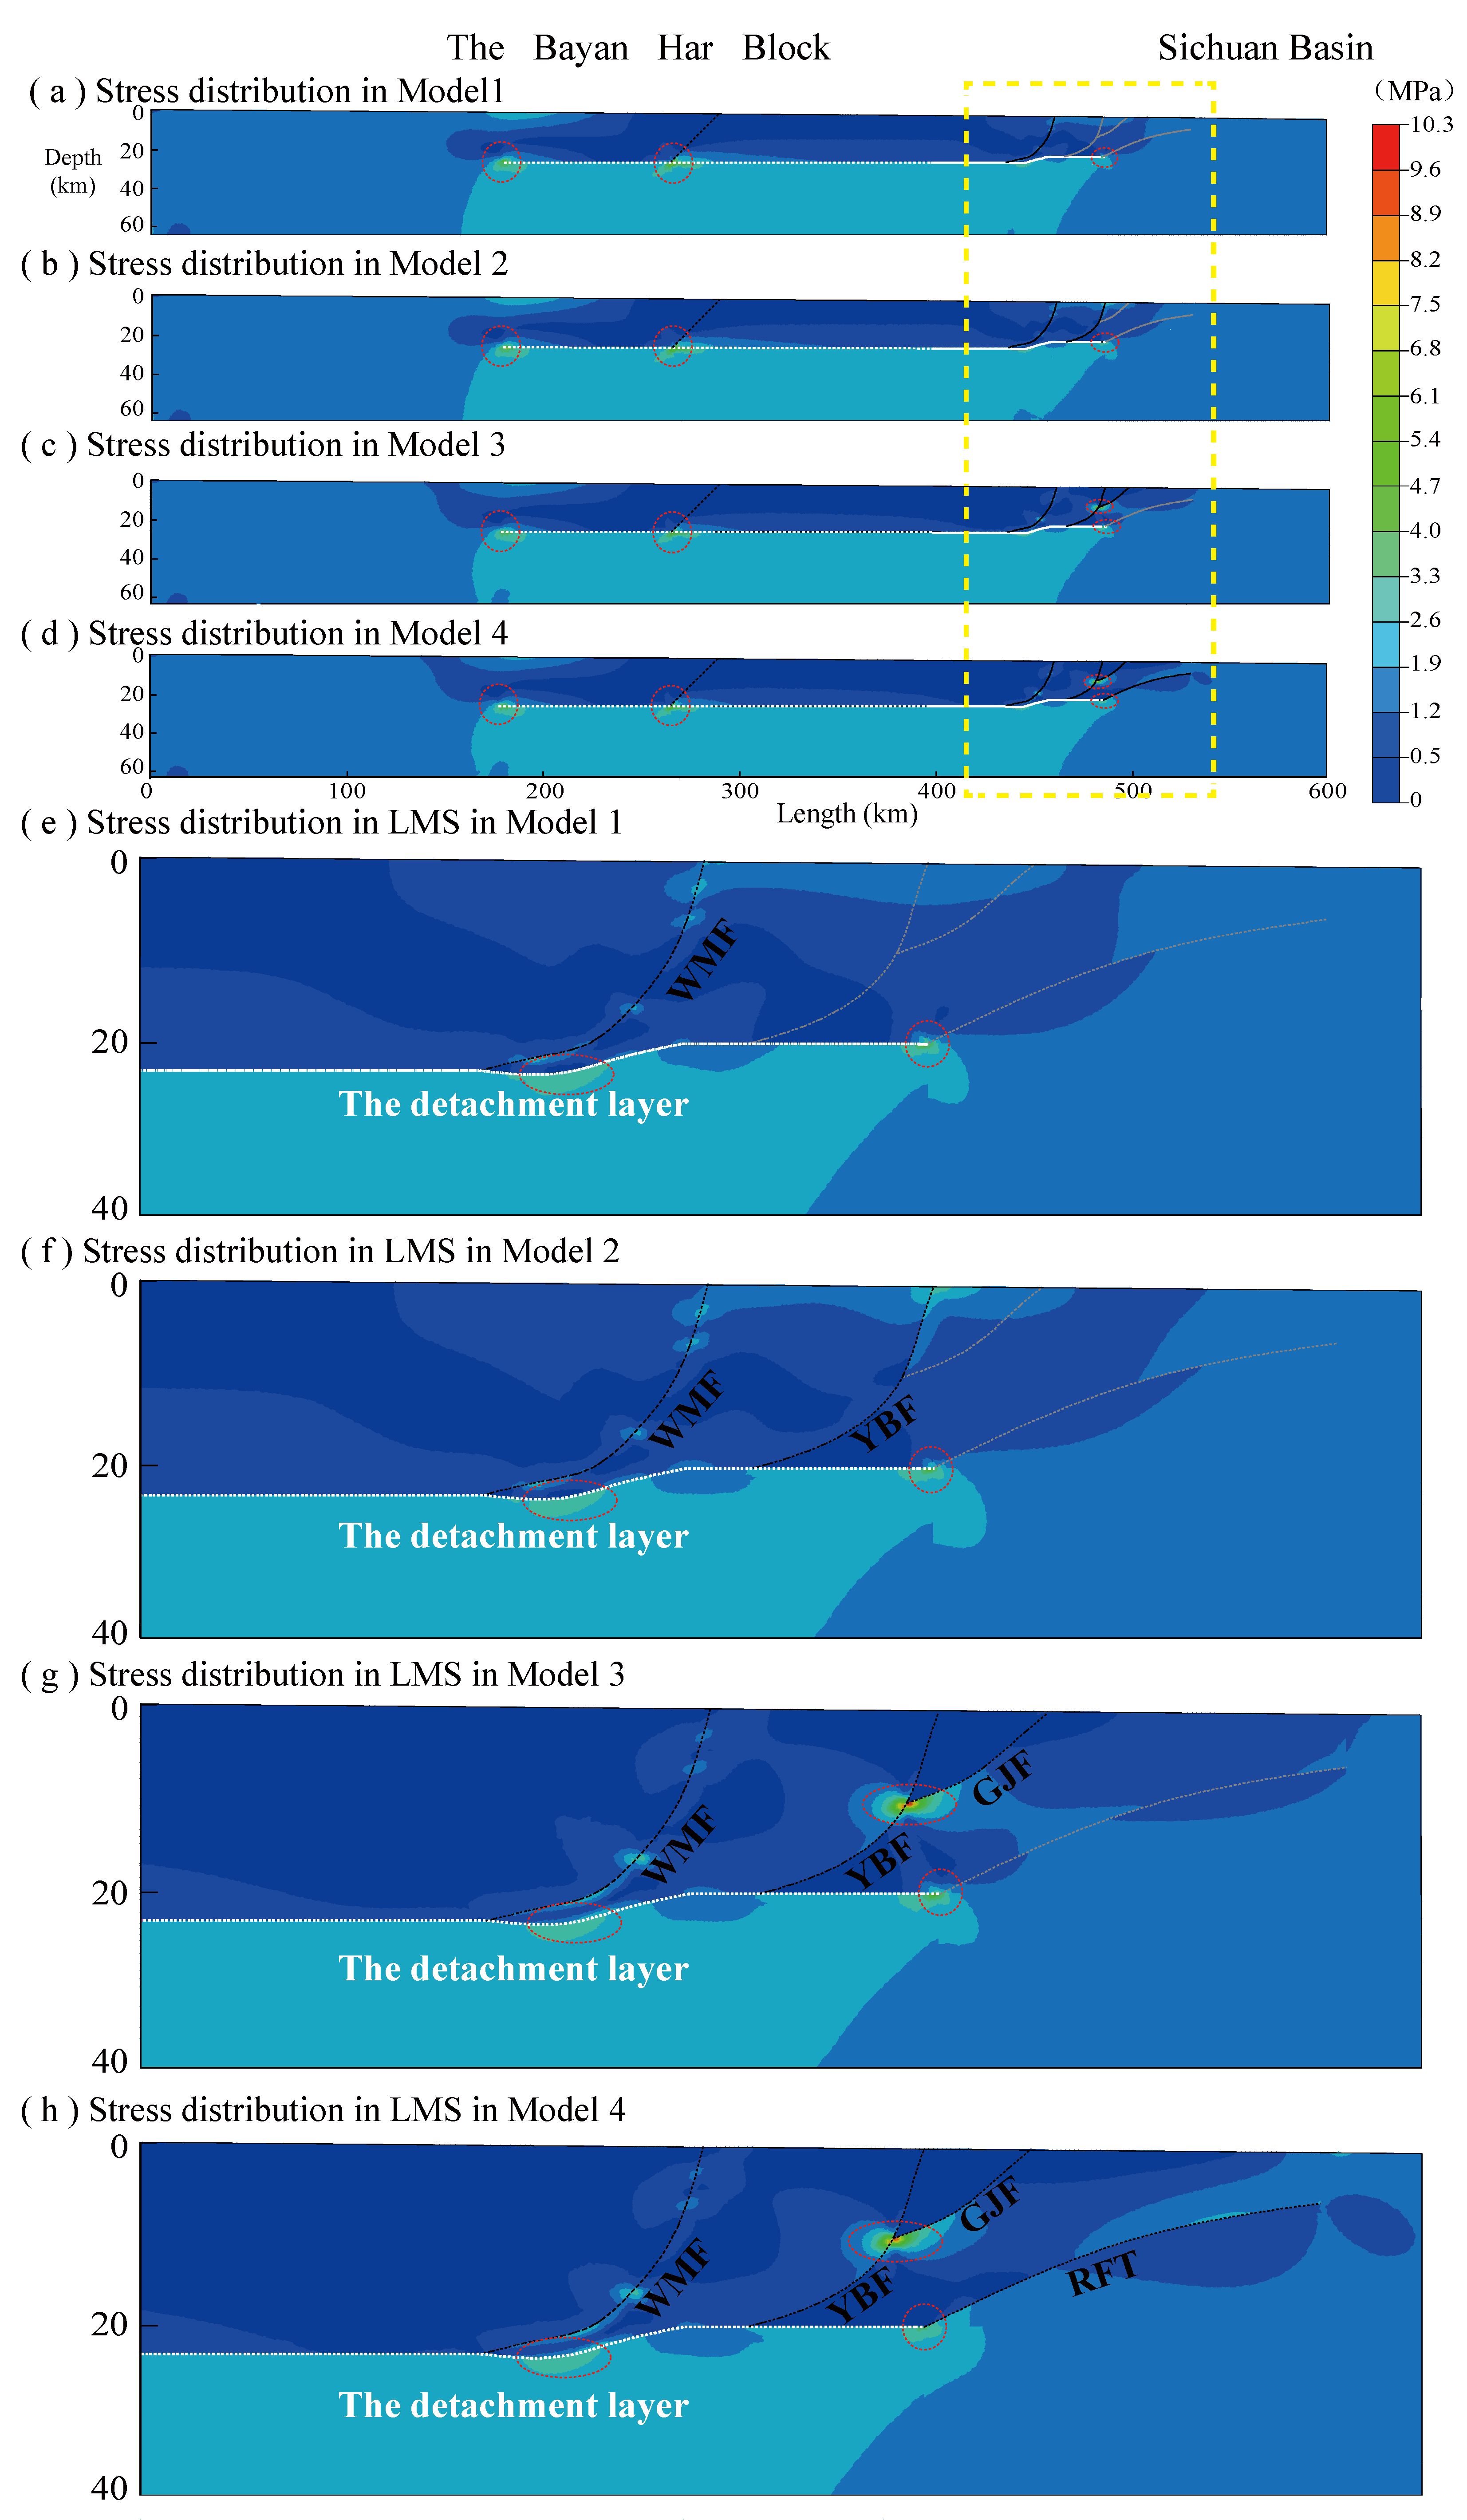
4.2. Equivalent Stress Distribution and Variation

By applying the same velocity load from Model 1 to Model 4, the stress-strain process in an earthquake cycle was obtained, and then the influence of different fault structures on equivalent stress in LMS was analyzed. Equivalent stress is a scalar quantity, a measure of the change in the state of the stress at these points in the model.
σ s = 2 2 ( ( σ 1 σ 2 ) 2 + ( σ 2 σ 3 ) 2 + ( σ 3 σ 1 ) 2 )
where σ 1 , σ 2 and σ 3 are the first, second, and third principal stress, respectively.
In order to show the equivalent stress distribution in the models clearly, we display the entire model results from Model 1 to Model 4 (Figure 6a–d), according to the overall stress distribution of the models, the results of each model are similar. The stress value is relatively high in the lower crust about 300 km west of the LMS, the equivalent stress value is 1.9–2.6 MPa; then to the west, the equivalent stress value decreases to 1.2–1.9 MPa; and the stress level of the whole crust and upper mantle in Sichuan basin east of LMS is relative low. However, the area of local high stress concentration is closely related to the position of fault intersection and detachment layer.
We mainly focus on the influence of LMS fault structure on the equivalent stress distribution in this area, so we enlarge the equivalent stress distribution in LMS (Figure 6e–h), we can see that the local high stress concentration is formed at the bottom of each branch fault in LMS, but its location and magnitude vary with the number and the combination structure of the faults in LMS. The distribution of equivalent stress in Model 1 and Model 2 is similar; the stress is mainly concentrated at the frontal edge of the detachment layer and the transition area of the upper crust from thick to thin (Red dotted area in Figure 6e,f). There is local stress enhancement in small range on the two faults, but the degree of stress accumulation is not significant. It is proved that the listric-reverse structure, especially a nearly vertical angle above 15 km, is not conducive to the transformation of high stress formed in the frontal edge of the detachment layer to the surface of the model along the fault, so it cannot form significant stress accumulation on YBF, and then lead to the Wenchuan earthquake. In Model 3, with the activities of GJF in LMS, the accumulation of the equivalent stress in LMS area has changed greatly (Figure 5g). Because of the small dip angle (about 40 degree) and shallow depth (about 10 km deep) [29] of the GJF, the accumulated stress during the eastward pushing of Bayan Har block finds a better way to transmit to the surface along the fault. The combinations of YBF with a high-angle listric-reverse fault structure and GJF with a low-angle shallow-depth fault structure makes the stress more likely be concentrated in the bottom area where the two faults meet. The maximum equivalent stress accumulation can reach 10 MPa. When the RFT on the LMS began to be active in Model 4, since the RFT has not ruptured to the surface, the stress accumulated in the frontal edge of detachment layer is more likely to transfer to the hanging wall of the RFT. However, the high stress accumulation below the intersection of YBF and GJF is still prominent, which further indicates that the fault structure separated in the shallow part and converging in the deep part formed by YBF and GJF is most conducive to the formation of Wenchuan earthquake.
In addition, we also see that because of the detachment layer between the upper crust and the lower crust, the eastward pushing of Bayan Har block will form stress accumulation in the frontal edge position of the detachment layer, and the drag effect on the tail end will also produce stress accumulation (Red dotted area in Figure 6a–d). In this paper, we mainly focus on the stress variation in LMS, the effect of the specific tail end location of detachment layer will not be discussed here. At the same time, we also observed that the equivalent stress of nearly 8 MPa was accumulated at the bottom of LRBF, which indicates that the LRBF will absorb part of the stress accumulation during the eastward pushing of the Bayan Har block, and the adjustment effect of the LRBF cannot be ignored when studying the stress-strain accumulation of LMS.
In order to further understand the impact of the variation of structure on fault stress accumulation, we got the equivalent stress values of the contact pairs in the same position on the hanging wall and footwall of the same fault. Figure 6a shows the equivalent stress on the WMF from Model 1 to Model 4, the stress on the WMF has the characteristics of segmentation; there are two stress concentration areas above 10 km and below 15 km, but the degree of stress accumulation is not significant, and the maximum value is only 3.1 MPa. Through the comparison of four models, we can find that with the successive activities of GJF and RFT, the stress on the WMF below 15 km increases, which proved that the stress accumulation formed at the frontal edge of the detachment layer gradually spread to the bottom of the WMF. Figure 6b shows the equivalent stress on the YBF from Model 2 to Model 4, different from the segmented feature of stress on WMF, with the activity of GJF, the equivalent stress accumulation appears to concentrate on the YBF at the depth between 10 and 13 km, and the maximum variation of the equivalent stress in Model 3 can reach 10.3 MPa. The activity of RFT in Model 4 decreases the stress concentrated at the bottom of YBF and GJF, but the decreasing range is only about 0.8 MPa. In other words, the special fault structure in LMS, especially the structure separated in the shallow part and converging in the deep part, is easy to accumulate stress at the bottom of the intersection of the two faults during the eastward movement of the Bayan Har block. Figure 6c represents the equivalent stress accumulation on GJF, and the stress concentration depth is shallower, mainly concentrated at the depth between 8 km to 10 km, which is different from the stress accumulation depth between 10 km to 13 km on YBF. The shallower stress concentration depth indicates that more stress is transferred upward to the surface along the GJF. Figure 6d shows the variation trend of the stress accumulation on the RFT, but different from the other three faults, the distribution of stress on the hanging wall and footwall of the fault shows the opposite trend. This is related to the fact that the fault did not rupture to the surface, during the eastward pushing process of the Bayan Har block, the stress accumulation on the hanging wall of RFT is obviously larger than that on the footwall, and this stress accumulation may cause the FBF to rupture to the surface after hundreds of thousands of years.
According to the results of stress accumulation on the four faults on LMS, it can be seen that the equivalent stress is mainly concentrated on YBF and GJF, with the maximum magnitude of 9.5 MPa; the fault combination mode of YBF and GJF makes the stress accumulation in LMS area at the frontal edge of Bayan Har block concentrate towards the area where the two faults intersect.

5. Discussion

5.1. Effect of the Detachment Layer

In order to further explore the effect of the detachment layer, we adjust the properties of the upper contact surface of detachment layer in Model 4 (the magenta line in Figure 2e), so that the detachment layer and the upper crust are bound together without sliding.
By comparing the stress distribution results of the entire models with (Figure 5d) and without detachment layer (Figure 7e), we can see that the stress distribution has changed significantly. When we did not consider the detachment, the stress is mainly concentrated at the bottom of LRBF, WMF, RFT as well as the bottom area where YBF and GJF meet in Figure 7e. We obtained the equivalent stress accumulation results on the hanging wall and footwall of the four faults in LMS with and without detachment layer, as shown in Figure 7a–d. The comparison results display that the model without detachment layer has a great effect on the stress accumulation at the bottom of RFT and WMF, compared with the result of Model 4 with detachment layer (Figure 5d), the maximum increase of stress accumulation on RFT at 20 km depth is 9.1 MPa (Figure 7d), and that of WMF at 22 km depth is 6.5 MPa (Figure 7a). In contrast, the variation of stress accumulation in the intersection of YBF and GJF is small (only about 1.1 MPa reduction), and even the stress accumulation increases at the bottom of YBF (Figure 7d). It can be seen that fault combination mode of YBF and GJF can accumulate a lot of stress no matter whether there is a detachment layer or not, and the existence of the detachment layer will further increase the stress accumulation at the intersection area of the two faults.
When we did not consider the detachment layer in the model, the most significant stress accumulation in LMS is RFT, followed by YBF and GJF. WMF is the smallest, but it is only 0.2 MPa less than YBF, which can be ignored. As we all know that the greater the stress accumulation in this area, the more brittle rupture will occur on the fault. Therefore, in order to further verify the correctness of the simulation results without considering the detachment layer, we obtained the historical earthquake distribution results (M ≥ 5, Figure 1a gray dots) in the study area from 1700 to May 2008, of which the historical earthquake data from 1700 year to 1990 year are mainly from the Department of Seismic Hazard Prevention, CEA [42,43]; and the data from 1990 year are from the earthquake catalogue determined by China Earthquake Networks Center. Uncertainty maybe exist in the location of historical earthquakes, however, the distribution of historical earthquakes show that there are no earthquake events near LRBF. In LMS, only three major M6~7 earthquakes (orange dots in Figure 1a) were recorded in 1941, 1958 and 1970, respectively. We know that the level of seismic monitoring had been improved to a certain extent since 1940; at the same time, the epicenter locations of the three earthquakes mentioned above were finally determined by referring to the surface rupture survey. All of the three earthquakes occurred near YBF and GJF in LMS, but seldom in RFT and WMF, which is not consistent with the high stress accumulation at the bottom of RFT and WMF. The detachment layer makes the stress of the upper crust concentrate on YBF and GJF rather than RFT and WMF during the eastward pushing process of Bayan Har block, which is consistent with the seismogenic faults of Wenchuan earthquake. And the existence of a detachment layer also support the theory that the upper-crustal deformation, decoupled from the lower crust by a series of detachments, is the primary mechanism for generating uplift and the occurrence Wenchuan earthquake [5,9,44].
Due to the steep altitude characteristics of LMS, the existing methods cannot obtain the high-resolution underground structure of this area, so the frontal edge position of the detachment layer has always been the focus of controversy [11,14,15,16,17,18]. The simulation results above show that the detachment layer need to extend eastward beyond the WMF in LMS, only in this way, accumulated stress generated in the pushing process of upper crust be transferred to YBF and the fault on the east side instead of WMF. This paper analyzes the effect of the frontal edge position of the detachment layer, as shown in Figure 8f, four cases are discussed: case (1) the frontal edge of the detachment layer only reaches the position of steep slope, about 7 km west of YBF; case (2) the frontal edge of the detachment layer intersect with YBF; case (3) the frontal edge of the detachment layer lies in the middle of YBF and RFT; case (4) the frontal edge of the detachment layer intersect with RFT (Model 4 in this paper).
By comparing the results of equivalent stress distribution in LMS, the combinations of YBF with a high-angle listric-reverse fault structure and GJF with a low-angle shallow-depth fault structure can always cause stress concentration in the bottom area where the two faults meet, and the frontal edge position of the detachment layer will further affect the magnitude of stress accumulation. We obtained the distribution of equivalent stress on YBF in those four cases (Figure 8e), and the maximum equivalent stress on YBF ranges from 4.7 MPa to 9.5 MPa. When the frontal edge position of the detachment layer extends to the bottom of RFT and YBF, the maximum magnitude can reach 9.5 MPa and 8.4 MPa respectively, followed by Model 4 (about 6.3 MPa) and Model 1 (about 4.7 MPa). Therefore, it is reasonable to speculate that the frontal edge of the detachment layer may have crossed the YBF, so that more stress accumulated at the intersection of YBF and GJF, and finally triggered the Wenchuan earthquake.

5.2. Rupture Depth of YBF and GJF

After the Wenchuan earthquake, there was a constant controversy over the source parameter of the earthquake, especially the depth of the earthquake. We collected the focal depth of Wenchuan earthquake from 7 organizations, the depth range from 10 km to 20 km (Table 2), and most of which are concentrated in 10–14 km (five out of seven). The seismogenic fault and depth of the earthquake can be well explained by the Model 4 in the paper. In order to discuss the rupture mechanism of two faults caused by Wenchuan earthquake, we display the distribution of equivalent stress accumulation along the horizontal and vertical directions in Model 4. Figure 9a shows the stress distribution along the horizontal direction. When the stress is greater than zero, it represents the tension along the horizontal direction; when the stress is less than zero, it represents the pressure along the horizontal direction. Figure 9b shows the stress distribution along the vertical direction, and the direction represented by the stress magnitude is consistent with the horizontal stress. In this paper, we collect three representative focal depths (the focal depth of CSEM, GCMT and USGS, pentagrams in Figure 9a,b) and project them on the YBF, and we also collect the focal mechanism solutions provided by GCMT and USGS and mark them on the side. The stress accumulation is most prominent between the focal depths provided by CSEM and GCMT, Figure 9a shows that in the horizontal direction, the area at the bottom of the intersection of YBF and GJF is mainly compressed in the horizontal direction, with the maximum value of −9.5 MPa; while in the vertical direction (Figure 9b), it is mainly tensile stress, which is distributed on the hanging wall of YBF above 10 km and the footwall of YBF below 10–12 km, with the maximum value of 2.5 MPa. We can infer that the fault combination mode of YBF and GJF is firstly affected by the eastward pushing of Bayan Har block, resulting in a large horizontal compressive stress, while the listric-reverse structure of YBF will produce tension stress on the hanging wall of YBF during the thrusting process of LMS. Once the stress accumulation exceeds the strength of the rock itself, the rock in this area will be weakened. At the same time, the continuous increase of the vertical stress (i.e., shear stress) will lead to the rupture of the weakened rock along the fault direction, which will eventually lead to the Wenchuan earthquake. Once the rupture occurs, the vertical tensile stress will first make the rupture upward along YBF, at the same time, we also notice that the hanging wall of the GJF is mainly a tensile deformation area along the horizontal and vertical direction, and the rupture at the bottom will transfer to GJF easily, which causes the simultaneous rupture of two faults.

5.3. Comparison with Previous Results

Previous research results of many scholars believe that Wenchuan earthquake may occurred near the bottom of YBF at a depth of 20 km [9,10,19,20,21]. But most studies have simplified the complex structure of multiple faults into one seismogenic fault and failed to consider the effect of detachment layer. Therefore, the eastward movement of the Bayan Har block will eventually accumulate the stress in the LMS. However, the listric-reverse structure of YBF itself makes it difficult to transfer the stress along the fault to the surface, which will accumulate a lot of stress in the root area of the fault. Just like Figure 7e, significant stress accumulation will be formed at the root of several faults, which developed from the bottom of the upper crust, especially the RFT in the frontal edge of the Bayan Har block has the highest stress accumulation. However, it has been discussed above that it is not in line with our understanding of historical earthquakes. Therefore, through the refinement of the LMS fault structure, especially analyze the influence of the combination of YBF and GJF, we infer that, compared with the RFT who did not rupture to the surface, the fault combination mode, which is separate in the shallow part and converge in the deep part, is more likely to become the best way to transfer the stress to surface in LMS. Therefore, the fault combination of YBF and GJF makes the stress gradually accumulate in this area during the eastward pushing of Bayan Har block, and the detachment layer extending eastward to the bottom of LMS, which promotes the stress accumulation in this area, and finally leads to the Wenchuan earthquake and the rupture of the two faults.

6. Conclusions

In order to study the role of four major faults in the regional stress distribution, four two-dimension finite element models with different fault structures are built. We simulate the models within a single recurrence interval by means of contact analysis and viscoelastic finite element method.
GPS velocity component and precise leveling data are used to constrain the model deformation from horizontal and vertical directions, and the simulated results fit the observed geodetic data adequately well. The simulated results show that LRBF and GJF are in a creeping state, and the shortening velocity reach to about 2 mm/yr. and 1 mm/yr. respectively; the simulated maximum vertical velocity of hanging wall of LRBF and LMS are about 3.0 mm/yr. and 1.4 mm/yr. respectively, and after crossing the LMS, the velocity drops to 0.1 mm/yr.
The simulation results of the influence of four main faults on the regional stress in the LMS show that the combinations of YBF with a high-angle listric-reverse fault structure and GJF with a low-angle shallow-depth fault structure makes the equivalent stress concentrate to the area below the intersection of the two faults. In Model 4, the maximum stress accumulation in this area reaches 9.5 MPa, which is significantly higher than that of other faults. However, the depth of high stress concentration on GJF is shallower than that on YBF, which indicates that the fault combination separated in the shallow part and converging in the deep part is favorable for transferring from the footwall of YBF and GJF to the surface in LMS.
The existence of detachment layer effectively promotes the deformation of the upper crust of the Bayan Har block and lead to more concentration of stress in LMS. Four cases of different frontal edge position of detachment layer are simulated and analyzed in this paper, the results show that the variation mainly affects the magnitude of stress on YBF, instead of its distribution. We infer that the frontal edge of the detachment layer must have extended to the bottom of the YBF and extended eastward; thus forming a greater stress accumulation at the bottom of the intersection of YBF and GJF, and eventually triggers the Wenchuan earthquake.

Author Contributions

C.Y.: Conceptualization, Writing—original draft, Writing—review & editing. C.Q. and X.S.: Paper Revision. W.Y. and J.Z.: Data curation. H.Y. and W.M.: Software, Methodology. Q.Y.: Visualization. All authors have read and agreed to the published version of the manuscript.

Funding

This work was supported by the National Natural Science Foundation of China (41872229), the Basic Scientific Funding of Institute of Geology, China Earthquake Administration (IGCEA1809), and the Joint Funds of the National Natural Science Foundation of China (U2039205).

Acknowledgments

Thanks to Wang Min and Hao Ming for providing the GPS velocity from 1999 to 2007 and the precise leveling data.

Conflicts of Interest

The authors declare no conflict of interest.

References

  1. Burchfiel, B.C.; Zhiliang, C.; Yupinc, L.; Royden, L.H. Tectonics of the Longmen Shan and Adjacent Regions. Int. Geol. Rev. 1995, 37, 661–735. [Google Scholar] [CrossRef]
  2. Burchfiel, B.C.; Royden, L.H.; van der Hilst, R.D.; Hager, B.H.; Chen, Z.; King, R.W.; Li, C.; Lü, J.; Yao, H.; Kirby, E. A Geological and Geophysical Context for the Wenchuan Earthquake of 12 May 2008, Sichuan, China. GSA Today 2008, 18, 4–11. [Google Scholar] [CrossRef]
  3. Densmore, A.L.; Ellis, M.A.; Li, Y.; Zhou, R.; Hancock, G.S.; Richardson, N. Active Tectonics of the Beichuan and Pengguan Faults at the Eastern Margin of the Tibetan Plateau. Tectonics 2007, 26, TC4005. [Google Scholar] [CrossRef] [Green Version]
  4. Zhang, P.Z.; Xu, X.W.; Wen, X.Z.; Rang, R.K. Slip rates and recurrence intervals of the Longmen Shan active fault zone and tectonic implications for the mechanism of the May 12 Wenchuan earthquake, 2008, Sichuan, China. Chin. J. Geophys. 2008, 51, 1066–1073, (In Chinese with an English abstract). [Google Scholar]
  5. Hubbard, J.; Shaw, J.H. Uplift of the Longmen Shan and Tibetan plateau, and the 2008 Wenchuan (M = 7.9) earthquake. Nature 2009, 458, 194–197. [Google Scholar] [CrossRef]
  6. Hubbard, J.; Shaw, J.H.; Klinger, Y. Structural Setting of the 2008 Mw 7.9 Wenchuan, China, Earthquake. Bull. Seismol. Soc. Am. 2010, 100, 2713–2735. [Google Scholar] [CrossRef] [Green Version]
  7. Li, Y.; Jia, D.; Shaw, J.H.; Hubbard, J.; Lin, A.; Wang, M.; Luo, L.; Li, H.; Wu, L. Structural interpretation of the co-seismic faults of the Wenchuan earthquake: 3D modeling of the Longmen Shan fold-and-thrust belt. J. Geophys. Res. Solid Earth 2010, 115. [Google Scholar] [CrossRef]
  8. Zhang, Z.; Yuan, X.; Chen, Y.; Tian, X.; Kind, R.; Li, X.; Teng, J. Seismic Signature of the Collision Between the East Tibetan Escape Flow and the Sichuan Basin. Earth Planet. Sci. Lett. 2010, 292, 254–264. [Google Scholar] [CrossRef] [Green Version]
  9. Xu, X.; Wen, X.; Yu, G.; Chen, G.; Klinger, Y.; Hubbard, J.; Shaw, J. Coseismic Reverse and Oblique-slip Surface Faulting Generated by the 2008 Mw7.9 Wenchuan Earthquake, China. Geology 2009, 37, 515–518. [Google Scholar] [CrossRef]
  10. Zhu, S.B.; Zhang, P.Z. Numeric Modeling of the Strain Accumulation and Release of the 2008 Wenchuan, Sichuan, China, Earthquake. Bull. Seism. Soc. Am. 2010, 100, 2825–2839. [Google Scholar] [CrossRef]
  11. Huang, J.; Zhao, D. High-resolution mantle tomography of China and surrounding regions. J. Geophys. Res. 2006, 111, B09305. [Google Scholar] [CrossRef]
  12. Yao, H.; Hilst, R.D.V.D.; Hoop, M.V.D. Surface-wave array tomography in SE Tibet from ambient seismic noise and two-station analysis-I. Phase Veloc. Maps 2006, 166, 732–744. [Google Scholar]
  13. Yao, H.; Beghein, C.; Hilst, R.D.V.D. Surface Wave Array Tomography in SE Tibet from Ambient Seismic Noise and two-station Analysis-II. Crustal and Upper-mantle Structure. Geophys. J. Int. 2008, 173, 205–219. [Google Scholar] [CrossRef] [Green Version]
  14. Wang, C.Y.; Han, W.B.; Wu, J.P.; Lou, H.; Chan, W.W. Crustal structure beneath the eastern margin of the Tibetan Plateau and its tectonic implications. J. Geophys. Res. Solid Earth 2007, 112. [Google Scholar] [CrossRef]
  15. Zhu, J.S. The Wenchuan Earthquake Occurrence Background in Deep Structure and Dynamics of Lithosphere. J. CDUT Sci. Technol. Ed. 2008, 4, 348–356, (In Chinese with an English abstract). [Google Scholar]
  16. Bai, D.; Unsworth, M.J.; Meju, M.A.; Ma, X.; Teng, J.; Kong, X.; Sun, Y.; Sun, J.; Wang, L.; Jiang, C.; et al. Crustal deformation of the eastern Tibetan plateau revealed by magnetotelluric imaging. Nat. Geosci. 2010, 3, 358–362. [Google Scholar] [CrossRef]
  17. Liu, Q.Y.; Van der Hilst, R.; Li, Y.; Yao, H.J.; Chen, J.H.; Guo, B.; Qi, S.H.; Wang, J.; Huang, H.; Li, S.C. Eastward expansion of the Tibetan Plateau by crustal flow and strain partitioning across faults. Nat. Geosci. 2014, 7, 361–365. [Google Scholar] [CrossRef]
  18. Xin, H.; Zhang, H.; Kang, M.; He, R.; Gao, L.; Gao, J. High-Resolution Lithospheric Velocity Structure of Continental China by Double-Difference Seismic Travel-Time Tomography. Seismol. Res. Lett. 2018, 90, 229–241. [Google Scholar] [CrossRef]
  19. Zhu, S.B.; Zhang, P.Z. FEM simulation of interseismic and coseismic deformation associated with the 2008 Wenchuan Earthquake. Tectonophysics 2012, 584, 64–80. [Google Scholar] [CrossRef]
  20. Tao, W.; Hu, C.B.; Wan, Y.G.; Shen, Z.K.; Wang, K. Dynamic Modeling of Thrust Earthquake on Listric Fault and its Inference to Study of Wenchuan Earthquake. Chin. J. Geophys. 2011, 54, 1260–1269, (In Chinese with an English abstract). [Google Scholar]
  21. Yao, Q.; Xu, X.W.; Xing, H.L.; Zhang, W.; Gao, X. Deformation Mechanism of the Eastera Tibetan Plateau: Insights from Numerical Models. Chin. J. Geophys. 2012, 55, 863–874, (In Chinese with an English abstract). [Google Scholar]
  22. Shen, Z.K.; Lü, J.; Wang, M.; Burgmann, R. Contemporary Crustal Deformation Around the Southeast Borderland of the Tibetan Plateau. J. Geophys. Res. 2005, 110, B11409. [Google Scholar] [CrossRef] [Green Version]
  23. Gan, W.; Zhang, P.; Shen, Z.K.; Niu, Z.; Wang, M.; Wan, Y.; Zhou, D.; Cheng, J. Cheng Present-day crustal motion within the Tibetan Plateau inferred from GPS measurements. J. Geophys. Res. 2007, 112. [Google Scholar] [CrossRef] [Green Version]
  24. Ren, J.; Xu, X.; Yeats, R.S. Latest Quaternary paleoseismology and slip rates of the Longriba fault zone, eastern Tibet: Implications for fault behavior and strain partitioning. Tectonics 2013, 32, 216–238. [Google Scholar] [CrossRef]
  25. Chen, J.H.; Liu, Q.Y.; Li, S.C.; Guo, B.; Li, Y.; Wang, J.; Qi, S.H. Seismotectonic Study by Relocation of the Wenchuan Ms8.0 Earthquake sequence. Chin. J. Geophys. 2009, 52, 390–397, (In Chinese with English abstract). [Google Scholar]
  26. Chen, Q.F.; Hua, C.; Li, L.; Cheng, J. Viscoelastic Simulation of Deep Tectonic Deformation of the Longmenshan Fault Zone and its Implication for Strong Earthquake. Chin. J. Geophys. 2015, 58, 4129–4137, (In Chinese with English abstract). [Google Scholar]
  27. Jia, D.; Li, Y.; Lin, A.; Wang, M.; Chen, W.; Wu, X.; Ren, Z.; Zhao, Y.; Luo, L. Structural Model of 2008 Mw7.9 Wenchuan Earthquake in the Rejuvenated Longmen Shan Thrust Belt, China. Tectonophysics 2010, 491, 174–184. [Google Scholar] [CrossRef]
  28. Yue, C.; Qu, C.; Yan, W.; Zhao, J.; Su, Q. The Influence of Thrust Fault Structure on Cross-fault Short-leveling Survey. Earthq. Res. China 2019, 33, 489–502. [Google Scholar]
  29. Li, H.B.; Xu, Z.Q.; Wang, H.; Zhang, L.; He, X.L.; Si, J.L.; Sun, Z.M. Fault behavior, physical properties and seismic activity of the Wenchuan earthquake fault zone: Evidence from the Wenchuan earthquake Fault Scientific Drilling project (WFSD). Chin. J. Geophys. 2018, 61, 1680–1697, (In Chinese with English abstract). [Google Scholar] [CrossRef]
  30. Zhu, A.Y.; Zhang, D.N.; Jiang, C.S. Numerical Simulation of the Relationship between the Tectonic Stress Distribution and the Historical Strong Earthquake Activities of the Middle-southern Segment of Eastern Boundary of the Sichuan-Yunnan Block. Acta Seismol. Sin. 2015, 37, 762–773, (In Chinese with an English abstract). [Google Scholar]
  31. Luo, G.; Liu, M. Stress evolution and fault interactions before and after the 2008 Great Wenchuan earthquake. Tectonophysics 2010, 491, 127–140. [Google Scholar] [CrossRef]
  32. Luo, G.; Liu, M. Multi-timescale mechanical coupling between the San Jacinto fault and the San Andreas fault, southern California. Lithosphere 2012, 4, 221–229. [Google Scholar] [CrossRef]
  33. Shi, Y.L.; Cao, J.L. Effective Viscosity of China Continental Lithosphere. Earth Sci. Front. 2008, 3, 82–95, (In Chinese with an English abstract). [Google Scholar] [CrossRef]
  34. Shen, Z.K.; Sun, J.; Zhang, P.; Wan, Y.; Wang, M.; Burgmann, R.; Zeng, Y.; Gan, W.; Liao, H.; Wang, Q. Slip maxima at fault junctions and rupturing of barriers during the 2008 Wenchuan earthquake. Nat. Geosci. 2009, 2, 718–724. [Google Scholar] [CrossRef]
  35. Jiang, Z.S.; Fang, Y.; Wu, Y.Q.; Wang, M.; Du, F.; Ping, J.J. The Dynamic Process of Regional Crustal Movement and Deformation before Wenchuan Ms8.0 Earthquake. Chin. J. Geophys. 2009, 52, 505–518, (In Chinese with an English abstract). [Google Scholar]
  36. Xiao, J.; He, J. 3D Finite-Element Modeling of Earthquake Interaction and Stress Accumulation on Main Active Faults around the Northeastern Tibetan Plateau Edge in the Past ~100 Years. Bull. Seismol. Soc. Am. 2015, 105, 2724–2735. [Google Scholar] [CrossRef]
  37. Chen, Q.F.; Li, L. Deep deformation of the Longmenshan fault zone related to the 2008 Wenchuan earthquake. Sci. China Press 2018, 63, 1917–1933, (In Chinese with English abstract). [Google Scholar] [CrossRef] [Green Version]
  38. Ran, Y.K.; Chen, W.S.; Xu, X.W.; Chen, L.C.; Wang, H.; Yang, C.C.; Dong, S.P. Paleoseismic events and recurrence interval along the Beichuan–Yingxiu fault of Longmenshan fault zone, Yingxiu, Sichuan, China. Tectonophysics 2013, 584, 81–90. [Google Scholar] [CrossRef]
  39. Liu, C.; Dong, P.; Shi, Y. Recurrence interval of the 2008 Mw 7.9 Wenchuan earthquake inferred from geodynamic modelling stress buildup and release. J. Geodyn. 2017, 110, 1–11. [Google Scholar] [CrossRef]
  40. Zhang, P.Z.; Wen, X.Z.; Shen, Z.K.; Chen, J.H. Oblique, High-Angle, Listric-Reverse Faulting and Associated Development of Strain: The Wenchuan Earthquake of May 12, 2008, Sichuan, China. Annu. Rev. Earth Planet. Sci. 2010, 38, 353–382. [Google Scholar] [CrossRef] [Green Version]
  41. Hao, M.; Wang, Q.; Shen, Z.; Cui, D.; Ji, L.; Li, Y.; Qin, S. Present day crustal vertical movement inferred from precise leveling data in eastern margin of Tibetan Plateau. Tectonophysics 2014, 632, 281–292. [Google Scholar] [CrossRef]
  42. The Department of Seismic Hazard Prevention, CEA. China Historical Strong Earthquake Catalogue (23rd Century B.C.-1991 A.D); Seismological Press: Beijing, China, 1995. (In Chinese) [Google Scholar]
  43. The Department of Seismic Hazard Prevention, CEA. Catalog of Modern Earthquake of China (1912 A.D-1990 A.D); Seismological Press: Beijing, China, 1999. (In Chinese) [Google Scholar]
  44. Wang, E.; Kirby, E.; Furlong, K.P.; Van Soest, M.; Xu, G.; Shi, X.; Kamp, P.J.J.; Hodges, K.V. Two-phase growth of high topography in eastern Tibet during the Cenozoic. Nat. Geosci. 2012, 5, 640–645. [Google Scholar] [CrossRef]
Figure 2. Design and parameter settings of the four fault models. (ad) are the two-dimension models with different fault structures; Blue color: The Bayan Har block, including two layers, the upper crust and the lower crust; Cyan color: The detachment layer; Green color: The Sichuan basin, including three layers with nearly the same depth (about 20 km), the upper crust, the lower crust and the upper mantle; Orange color: The LMS; Thick black lines: Faults considered in the models. (e) result of mesh generation and boundary condition setting of Model 4; Red lines: Faults considered in the models; Magenta line: The upper contact surface of detachment layer.
Remotesensing 12 04031 g002
Figure 3. Comparison of simulated horizontal velocity results with GPS velocity component perpendicular to the LMS. Black line: Simulation results with LRBF in Model 4; Green line: Simulation results without LRBF in Model 4; Red points: GPS velocity component (Zhang et al. [39]); Yellow areas: The Longriba fault and the Longmen Shan thrust belt; Grey lines: Faults in the models.
Remotesensing 12 04031 g003
Figure 4. Comparison of observed and simulated vertical velocity. (a) vertical velocity field obtained by interpolation of precise leveling data in the study area; Black dots: Observation stations of precise leveling; Red dots: The observation stations used in Figure 4b; Beach ball: Wenchuan mainshock; Grey line: Isoclines with interval of 0.5 mm/yr.; Black line: The location of two-dimension model used in this study; Red lines: Faults simulated in the Model 4; Magenta line: Active faults in the study area; Black dotted Line: the starting and ending points of precise leveling station used in Figure 4b. (b) comparison of observed and simulated vertical velocity results; Black line with dots: Simulated results in Model 4; Red dots: Observed results of precise leveling projected to the profile of Model 4; Blue cross point: Revised precise leveling data; Yellow areas: The Longriba fault and the Longmen Shan thrust belt; Grey lines: Faults in the models.
Remotesensing 12 04031 g004
Figure 5. Distribution of cumulative equivalent stress. (ad) are the entire model results from Model 1 to Model 4; Black dotted lines: Faults considered in the models; Gray dotted lines: Faults not considered in the models; White dotted line: The upper contact surface of detachment layer; Yellow dotted line: The enlarged area in the model; Red dotted line: High stress concentration area. (eh) are the LMS results from Model 1 to Model 4.
Remotesensing 12 04031 g005
Figure 6. Distribution of cumulative equivalent stress on the hanging wall and footwall of the fault in LMS. (ad) are WMF, YBF, GJF, and RFT from Model 1 to Model 4; Solid line: Equivalent stress on the hanging wall of the fault; Solid line with dots: Equivalent stress on the footwall of the fault; Red dots: Contact pairs on the fault; Cyan color: Results of Model 1; Red color: Results of Model 2; Blue color: Results of Model 3; Green color: Results of Model 4; Model 1 is simplified to “M1”, hanging wall of the fault is simplified to “up” and footwall of the fault is simplified to “down” in the legend; The ordinate represents the magnitude of equivalent stress which unit is MPa (1 × 10⁶ Pa), and the abscissa represents the depth.
Remotesensing 12 04031 g006
Figure 7. Comparison of cumulative equivalent stress distribution under detachment layer and without detachment layer. (ad) the comparison results on WMF, YBF, GJF, and RFT; Solid line: Equivalent stress on the hanging wall of the fault; Solid Line with dots: Equivalent stress on the footwall of the fault; Green color: Results with detachment layer; Blue color: Results without detachment layer, hanging wall of the fault is simplified to “up” and footwall of the fault is simplified to “down” in the legend. (e) is the entire model distribution without the detachment layer; Black line: the faults considered in the model.
Remotesensing 12 04031 g007
Figure 8. Effect the frontal edge position of the detachment layer on the cumulative equivalent stress distribution in LMS. (ad) are the equivalent stress distribution in LMS under four cases. Black dotted lines: Faults considered in the model; White dotted area: The detachment layer; (e) equivalent stress on the YBF; Solid line: Equivalent stress on the hanging wall of the fault; Solid Line with dots: Equivalent stress on the footwall of the fault; Blue color: Results of Model ①; Cyan color: Results of Model ②; Green color: Results of Model ③; Red color: Results of Model ④; Hanging wall of the fault is simplified to “up” and footwall of the fault is simplified to “down” in the legend; (f) is the frontal edge position of the four cases.
Remotesensing 12 04031 g008
Figure 9. Distribution of equivalent stress accumulation along the horizontal and vertical directions in Model 4. (a) is the result in horizontal direction. (b) is the results in vertical direction; Black dotted lines: Faults considered in the model; White dotted area: The detachment layer; Pentagram: Location of Wenchuan earthquake projected on fault plane; Beach ball: Wenchuan mainshock from GCMT and USGS.
Remotesensing 12 04031 g009
Table 1. Parameters in the models.
RegionYoung’s Modulus/PaPoisson RatioDensity kg/m3Viscosity
/Pa·S
Bayan Har BlockUpper Crust7.0 × 10100.282600
Lower Crust6.8 × 10100.3227005.0 × 1017
Detachment layer6.7 × 10100.3227001.0 × 1017
LMS7.3 × 10100.202700
Sichuan basinUpper Crust7.2 × 10100.232650
Lower Crust7.3 × 10100.2830005.0 × 1020
Upper mantle7.5 × 10100.3232005.0 × 1020
Table 2. Focal depth of different Organizations.
NO.OrganizationDepth
(km)
1Centre Sismologique Euro-Mediterraneen10
2Geophysical Survel, Russia Academy of Science, Obninsk, Russia10
3Harvard University12
4Global Centroid Moment Tensor Project12.8
5China Earthquake Networks Center14
6United State Geological Survey19
7British Geological Survey20
Publisher’s Note: MDPI stays neutral with regard to jurisdictional claims in published maps and institutional affiliations.

