Article

Mapping of Post-Wildfire Burned Area Using a Hybrid Algorithm and Satellite Data: The Case of the Camp Fire Wildfire in California, USA

1
Division of Science Education, College of Education # 4-301, Gangwondaehak-gil Chuncheon-si, Kangwon National University, Gangwon-do 24341, Korea
2
Geoscience Platform Division, Korea Institute of Geoscience and Mineral Resources (KIGAM), Gajeong-dong 30, Yuseong-gu, Daejeon 305-350, Korea
*
Author to whom correspondence should be addressed.
Submission received: 5 January 2020 / Revised: 10 February 2020 / Accepted: 11 February 2020 / Published: 13 February 2020

Abstract

:
On November 8, 2018, a devastating wildfire, known as the Camp Fire wildfire, was reported in Butte County, California, USA. Approximately 88 fatalities ensued, and 18,804 structures were damaged by the wildfire. As a response to this destructive wildfire, this study generated a pre- and post-wildfire maps to provide basic data for evacuation and mitigation planning. This study used Landsat-8 and Sentinel-2 imagery to map the pre- and post-wildfire conditions. A support vector machine (SVM) optimized by the imperialist competitive algorithm (ICA) hybrid model was compared with the non-optimized SVM algorithm for classification of the pre- and post-wildfire map. The SVM–ICA produced a better accuracy (overall accuracies of 83.8% and 83.6% for pre- and post-wildfire using Landsat-8 respectively; 90.8% and 91.8% for pre- and post-wildfire using Sentinel-2 respectively), compared to SVM without optimization (overall accuracies of 80.0% and 78.9% for pre- and post-wildfire using Landsat-8 respectively; 83.3% and 84.8% for pre- and post-wildfire using Sentinel-2 respectively. In total, eight pre- and post-wildfire burned area maps were generated; these can be used to assess the area affected by the Camp Fire wildfire as well as for wildfire mitigation planning in the future.

1. Introduction

Wildfire activity in California has increased greatly in recent years [1].On November 8, 2018, at 11:30 PM GMT+9, a wildfire occurred in Butte County, California, USA. The wildfire, named the Camp Fire, which claimed 88 lives [2], burned a total area of 62,052 ha and destroyed 18,804 single, multiple, and mixed commercial structures [2,3]. As a result, it was designated the most destructive and deadly wildfire in California state history [2,4]. The fire reached 100 percent containment after 17 days on November 25, 2018 [5]. According to the final report of the Watershed Emergency Response Team (WERT), the fire occurred due to ongoing dry weather, strong northeast winds, very low live-fuel moisture, and heavy fuel loading [2].
According to Rogan and Franklin (2001) [6], wildfire is a major agent of disturbance in Mediterranean type ecosystems (MTEs) and is considered a serious problem because of its substantial social, environmental, and economic impacts [6,7]. In 2000, 3876 wildfires burned an area of 152 km2, impacting wildlife, hydrology, erosion, smoke emissions, and human populations [6]. In addition, based on the regional fire history, most of the area of the Camp Fire wildfire had experienced cases of wildfire from the 1960s to the recent 2017 fire season, except for the Paradise and Magalia areas (WERT, 2018) [2]. Because wildfire can cause loss of life, environmental damage [8], and affect the economy, it is necessary to map the burned area to evaluate management and policy implications.
Remote sensing is a useful tool [9] that can facilitate the detection of ecosystem changes [10] and land use/land cover mapping [11]. Remote sensing satellite images can be utilized in wildfire management [12] and potentially in mapping burn severity [13,14,15]. Veraverbeke et al. (2010) [13] used Landsat TM images that were corrected for geometric, radiometric, atmospheric, and topographic aspects to assess burn severity in the Peloponnese Peninsula in Greece. Brewer et al. (2005) [15] used multi-temporal Landsat TM data to classify and map fire severity in the northern Rocky Mountains and northern Great Plains during the fire season in 2000–2001. The methods used by those authors involved the application of two temporal images to differentiate and ratio between pre-fire and post-fire images, principal component analysis for pre- and post-fire imagery, and artificial neural networks; all of the methods demonstrated potential value for providing quantitative fire severity maps. The image differencing methods provided a robust and analytical simple approach. Another study by Wu et al. (2015) [14] used Landsat-8 and WorldView-2 satellites to estimate vegetation burn severity from the Creek Fire in San Carlos. The method used by Wu et al. for the Landsat-8 data was the normalized difference vegetation index burn severity, whereas both pixel-based and object-based techniques were used to evaluate before- and after-fire images for the Worldview-2 data.
Aside from wildfires, satellite images have been proven to be effective in the evaluation or prediction of many other hazards or natural disasters, such as cyclones [16], eruptions [17], and floods [18]. Optical image satellites such as the Landsat-8 and Sentinel-2 constitute the latest generation Earth observation missions of the United States Geological Survey and European Space Agency, respectively. Over 40 years, Landsat has provided one of the longest earth-surface remote-sensing records and one of the most valuable datasets for monitoring the Earth from space [19,20]. The Landsat-8 satellite, launched on February 11, 2013, has 11 bands ranging in spatial resolution from 15 m (panchromatic) to 30 m (visible, near infrared, short-wave infrared), and then to 100 m (thermal). Within 16 days’ temporal resolution, Landsat-8 provides 30-m spatial resolution optical imagery on eight spectral bands via the Operational Land Imager sensor, which can be accessed freely [21,22]. Although the 30-m pixel size is not “high resolution,” it is sufficient for mapping fires greater than 100 acres in size [23]. Landsat-8 30-m products can map small and spatially fragmented burned areas in more detail than other satellite sensors, such as the MODIS 500 m [24].
Sentinel-2 enhances the missions of Landsat and Systeme Probatoire d’Observation de la Terre. Sentinel-2, launched on June 23, 2015, consists of two satellites, namely Satellite-2a and Sentinel-2b. It provides global optical imagery with 13 spectral bands, ranging in spatial resolution from 10 m to 60 m [22]. In particular, Sentinel-2 has 10-m and 20-m reflective wavelength bands that are well suited for burned area mapping [25]. The satellite regularly revisits within 10 days and the data are freely accessible; therefore, Sentinel-2 data have great utility for mapping the approximate day of burning [24]. In particular, the Sentinel-2 and Landsat-8 have similar wavelengths and the same geographic coordinate system, thereby providing an opportunity to integrate the resulting datasets. Along with remote sensing, image classification techniques from artificial intelligence and other various approaches have been utilized in many areas of hazard assessment and disaster risk management, especially in the mapping of burned areas [26,27]. For example, fuzzy logic is applied for optical satellite data, such as ResourceSat-1 [28], ASTER [29], and MODIS data [30]. An artificial neural network and a support vector machine (SVM) are applied to Landsat TM data [31] to classify land use and produce the normalized difference vegetation index image [32].
The application of machine learning has attracted the attention of researchers in the field of remote sensing; however, the methods may emphasize irrelevant or redundant features of the dataset, which sometimes causes the results to have unsatisfactory accuracy [33]. A technique for reducing irrelevant or redundant variables is the use of an optimization algorithm, such as the imperialist competitive algorithm (ICA). ICA is useful for identification of the best subset of features; it shows better results when combined with a model, also known as the hybrid algorithm approach [33]. SVM is the most representative example of a machine learning model capable of performing small sample training and data testing [34]. Previous studies that applied a hybrid algorithm for natural disaster evaluation include those by Bui et al. [35] and Le et al. [36], which assessed landslide and forest fire disasters, respectively. Both studies used relevance vector machine (RVM) and ICA optimization for the landslide susceptibility modeling and forest fire danger modeling, respectively. The relevance vector machine–ICA method successfully outperforms the SVM and logistic regression models in landslide susceptibility modeling. It also has higher performance when compared to SVM and random forests models in modeling forest fire danger. Thus, relevance vector machine–ICA is a promising alternative for addressing landslide- and forest fire-prone areas.
Despite the large number of studies that have been published regarding burned area mapping, few have quantitatively used a hybrid algorithm to map pre- and post-wildfire burn occurrence and compare the mapping results of the hybrid algorithm with the results of a non-hybrid model, especially in California. This study aimed to map the pre- and post-wildfire to distinguish the burned area from the Camp Fire event in California, using Landsat-8 and Sentinel-2 imagery. Four pre-wildfire and four post-wildfire maps from the two satellite imageries were generated using the SVM and SVM–ICA classifiers with the goal of improving the effectiveness of fire mitigation, management, and evaluation.

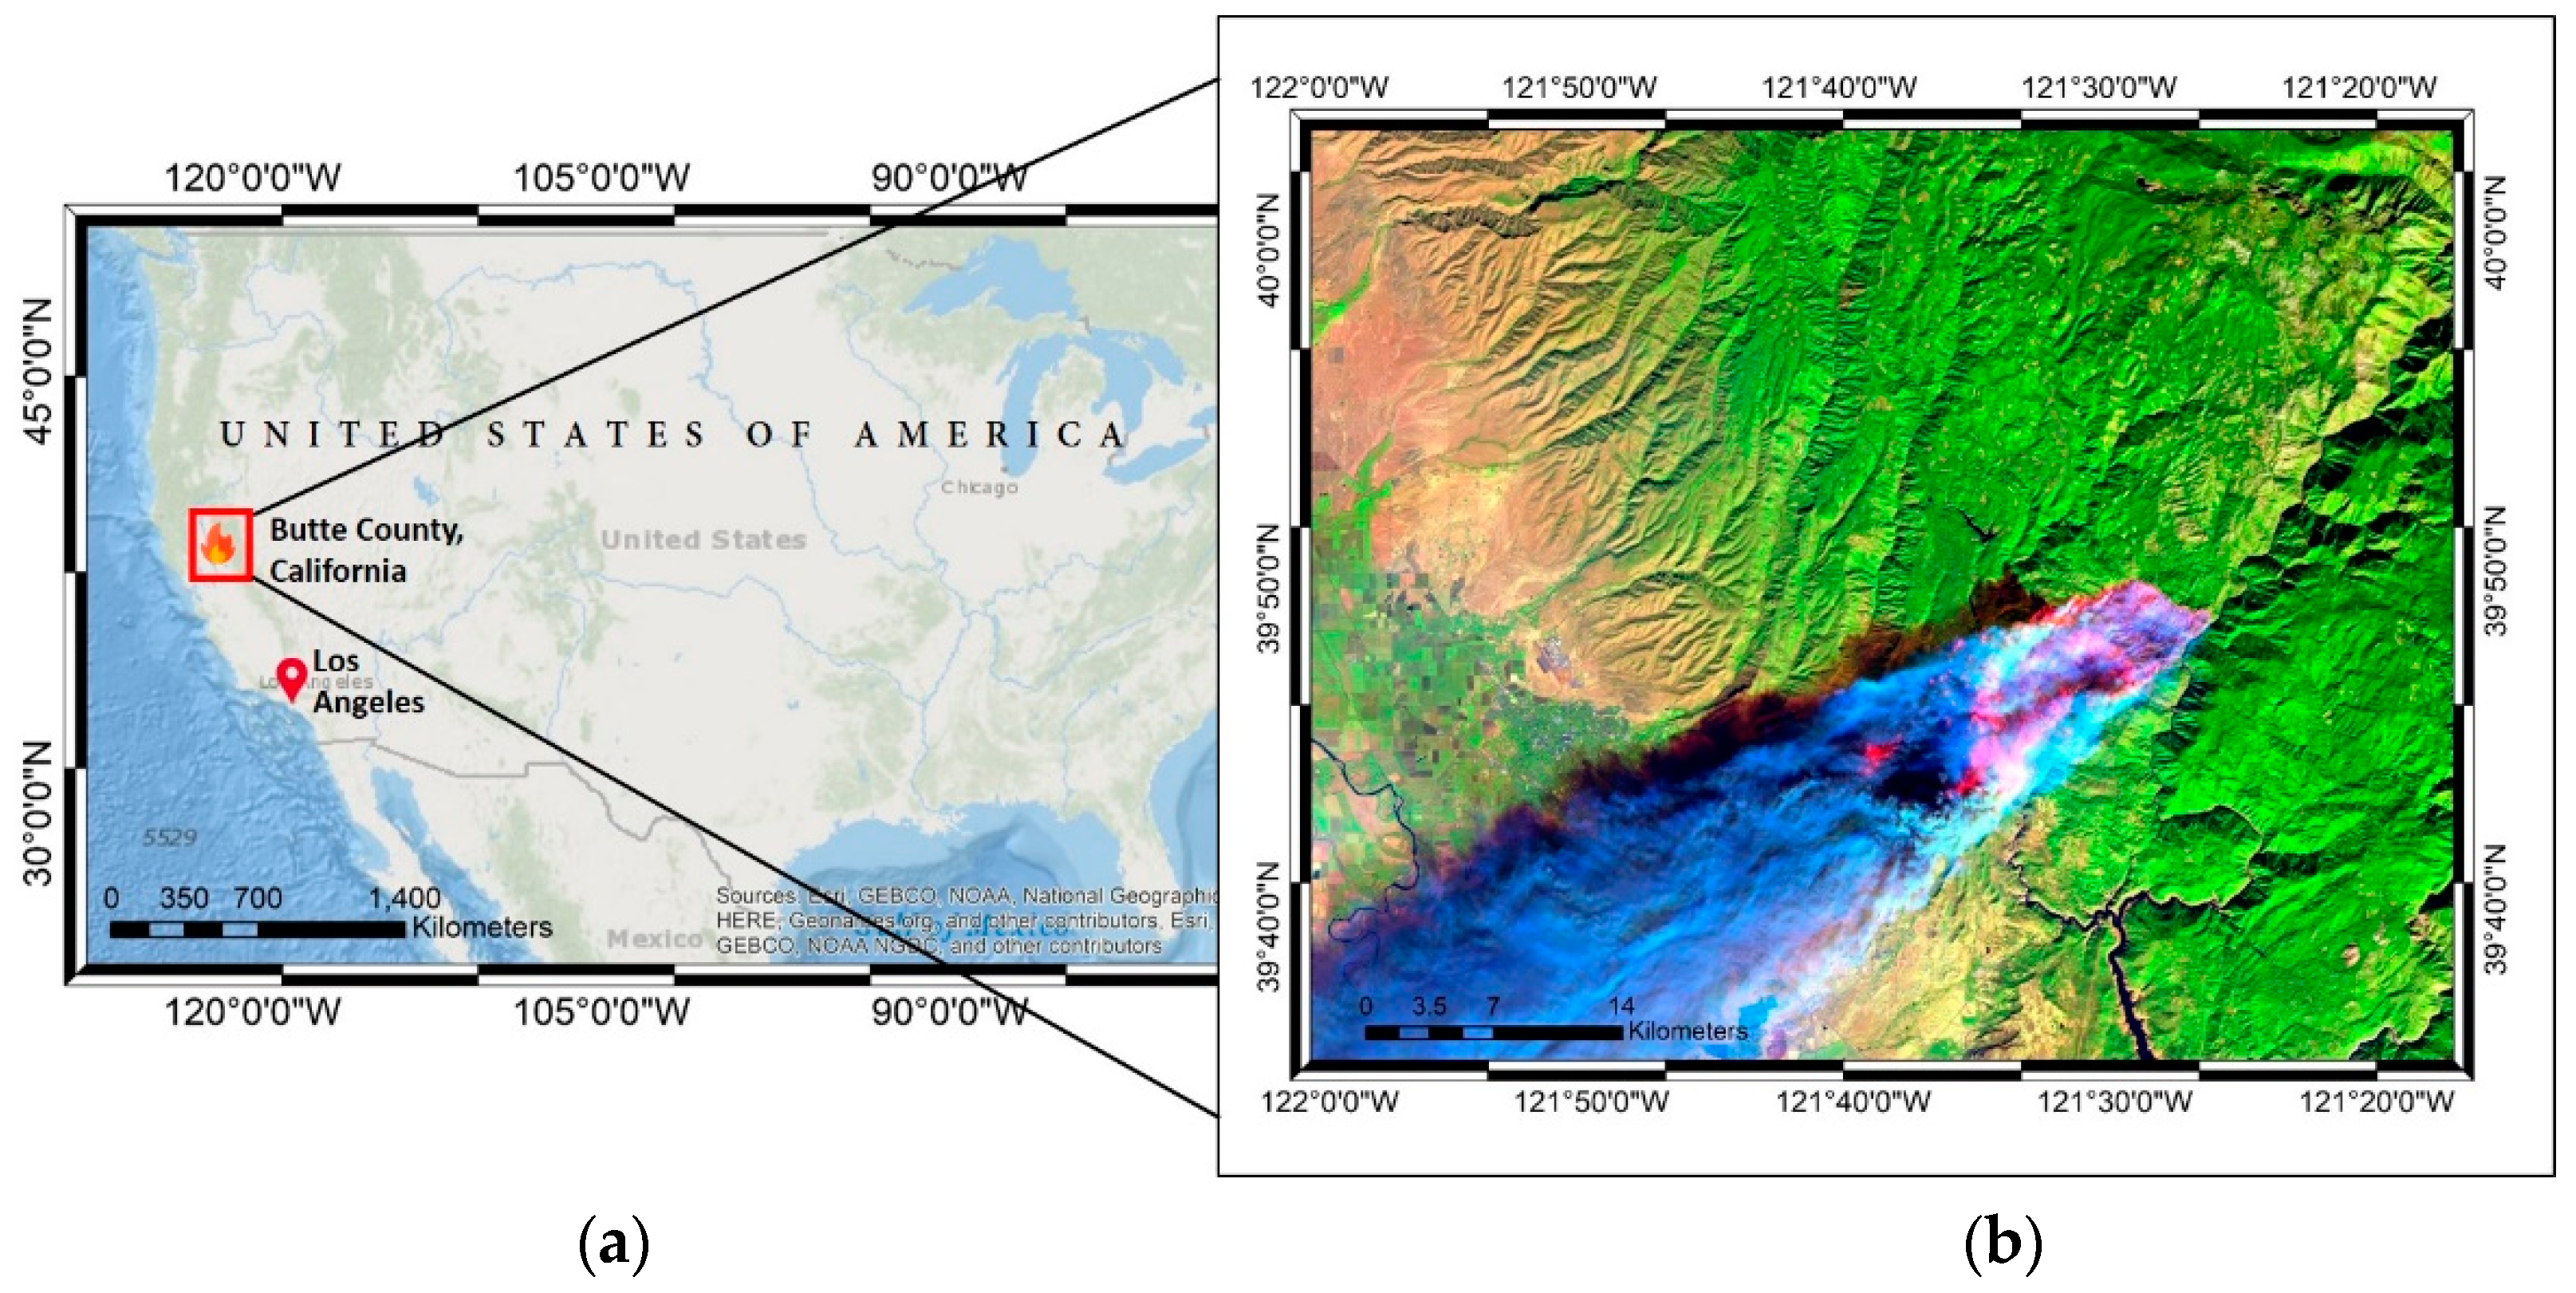
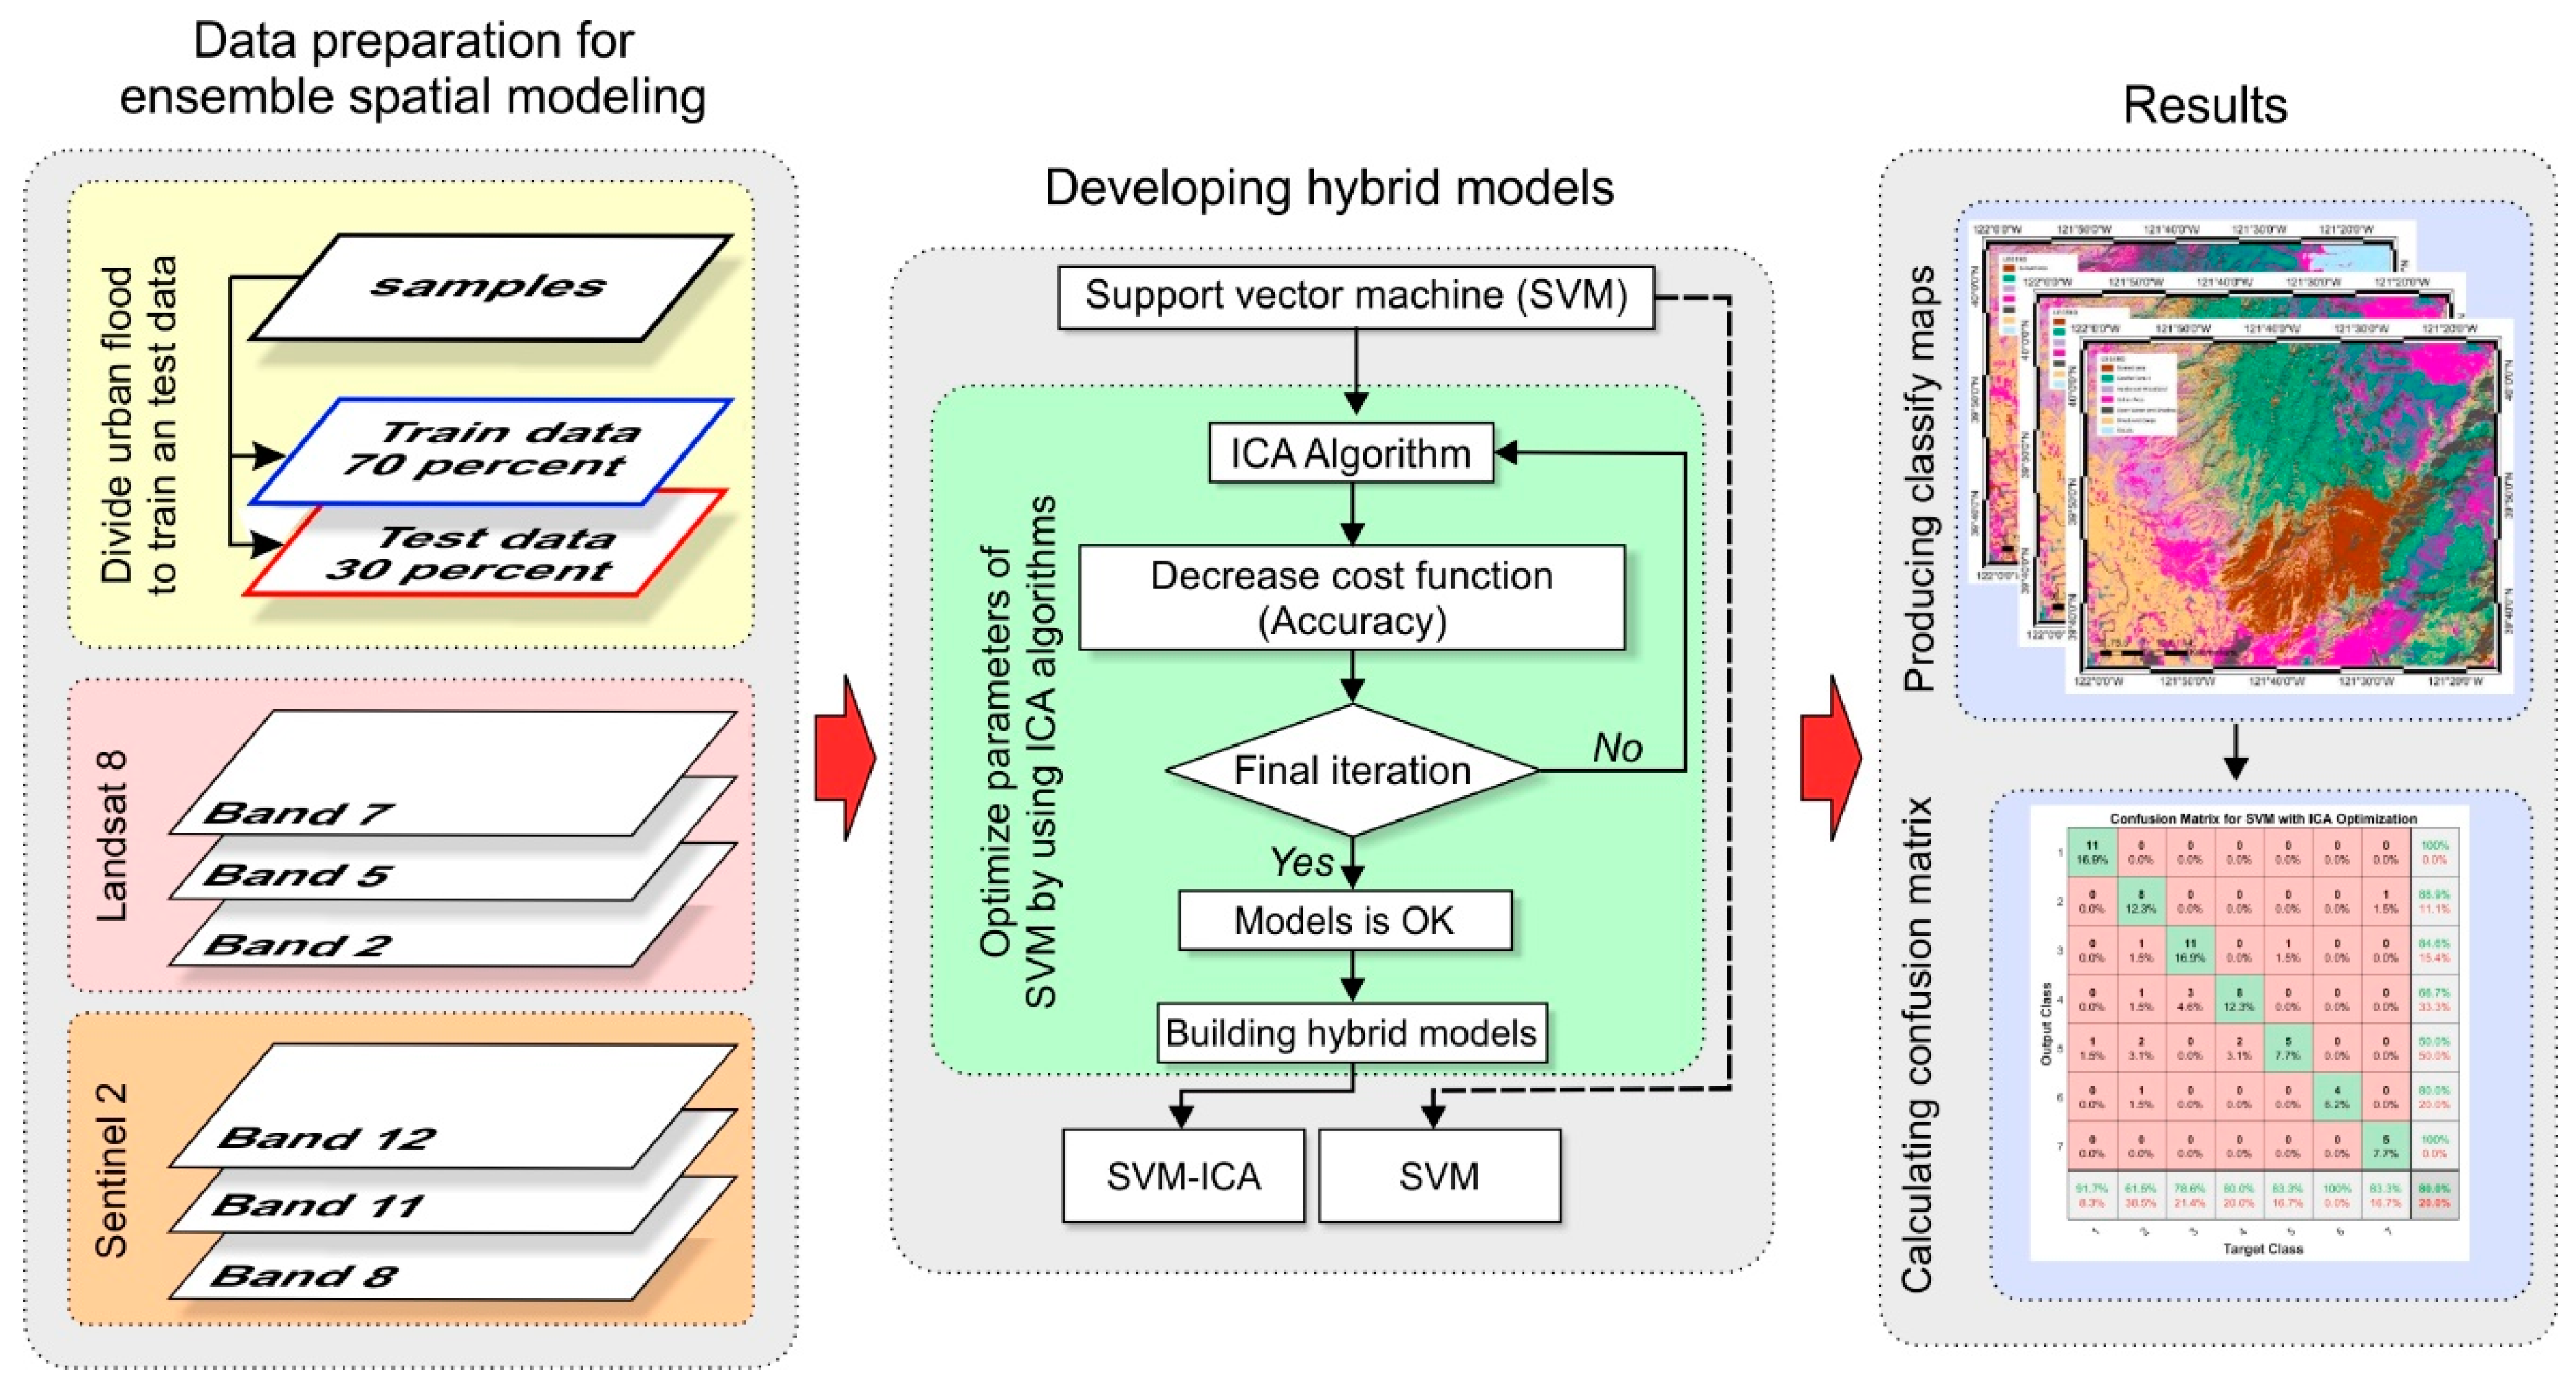
2. Materials and Methods

2.1. Materials

The Camp Fire wildfire occurred in Butte County (226,864 residents [37]) in the northern part of California, USA, and was located at 39°50′51″ N, 121°23′42″ W (Figure 1a,b). Butte County covers an area of 4340 km2 and includes a variety of geological formations and vegetation types. The county is located along the western slope of the Sierra Nevada, making it prime territory for the placement of a hydroelectric power plant. Butte County is underlain by several geologic formations including the Tuscan Formation, Chico Formation, Red Bluff Formation, and Modesto Formation. Among these formations, the area of the Chico Formation was more severely burned by the Camp Fire wildfire than those of the other formations.
The topography of the study area is varied, ranging from gentle to very steep, with an elevation range of approximately 200 to 5100 feet above mean sea level. The precipitation in the burned area is also variable due to orographic effects. The average annual rainfall ranges from 25 inches per year in the lower elevations to 71 inches per year in the upper elevations. In this Mediterranean climate, precipitation occurs nearly entirely as rain, although the area has cool, wet winters [2]. On the day of fire occurrence, the weather was dry with strong northeasterly winds, which led to extreme fire behavior. In this study, two pre-fire and two post-fire images from Landsat-8 and Sentinel-2 were employed.
The Landsat-8 and Sentinel-2 satellites have spectral and spatial similarities, with 16-day and 10-day temporal resolutions, respectively [38,39]. Landsat-8 has nine reflective wavelength bands (0.435 μm to 2.200 μm), while Sentinel-2 has 13 reflective wavelength bands (0.443 μm to 2.190 μm) [40]. In this study, Landsat-8 image pre-fire data (Figure 2a) and post-fire data (Figure 2b) were acquired on September, 21 2018 and December 26, 2018 respectively; Sentinel-2 data pre- and post-fire (Figure 2c,d) were acquired on November 6, 2018 and December 31, 2018 respectively.
After the satellite imagery had been collected, the Landsat-8 bands 7 (2.100–2.300 μm), 5 (0.845–0.885 μm), and 2 (0.450–0.515 μm) were combined to produce a false color view (Figure 2a). This band combination used the short-wave infrared range of the electromagnetic spectrum, which is less susceptible to smoke and haze from burning fire. In contrast, the Sentinel-2 combination utilized the near infrared/short-wave infrared bands 12, 11, and 8 with central wavelengths of 2.220 μm, 1.613 μm, and 0.864 μm, respectively, to distinguish the pre- and post-wildfire classes, especially the burned area and other areas. In addition to combining the three bands for each satellite data, a set of sample data consisting of train and test data was also prepared to generate the maps, as can be seen in the flow chart in Figure 3. In this study, a k-folded cross validation (CV) was used to prevent overfitting during optimization and avoid the data splitting into three sets (training, test, and validation) [41]. By using the k-folded CV, the optimization and model tuning can be done with the training set by folding it k times. In this study, we used 10 times folding, as suggested by Schmedtmann and Campagnolo (2015) [42], where each fold data acts as a training data and some of it evaluate the performance of the model.
In total, 171 data points were used for training and 65 points data were used as test data. The supervised classification methods in this study (SVM) is parametric and require setting of one or more parameters that also known as optimizers [41]. Then, the optimizers combine the parameters systematically and train the model using CV. By using the k-fold CV this study can distinguish the classes and minimize the misclassification issue from the cloudy image used. After that, the SVM and SVM-ICA that used for classifying the maps were evaluated using the confusion matrix or error matrices to assess its accuracy.

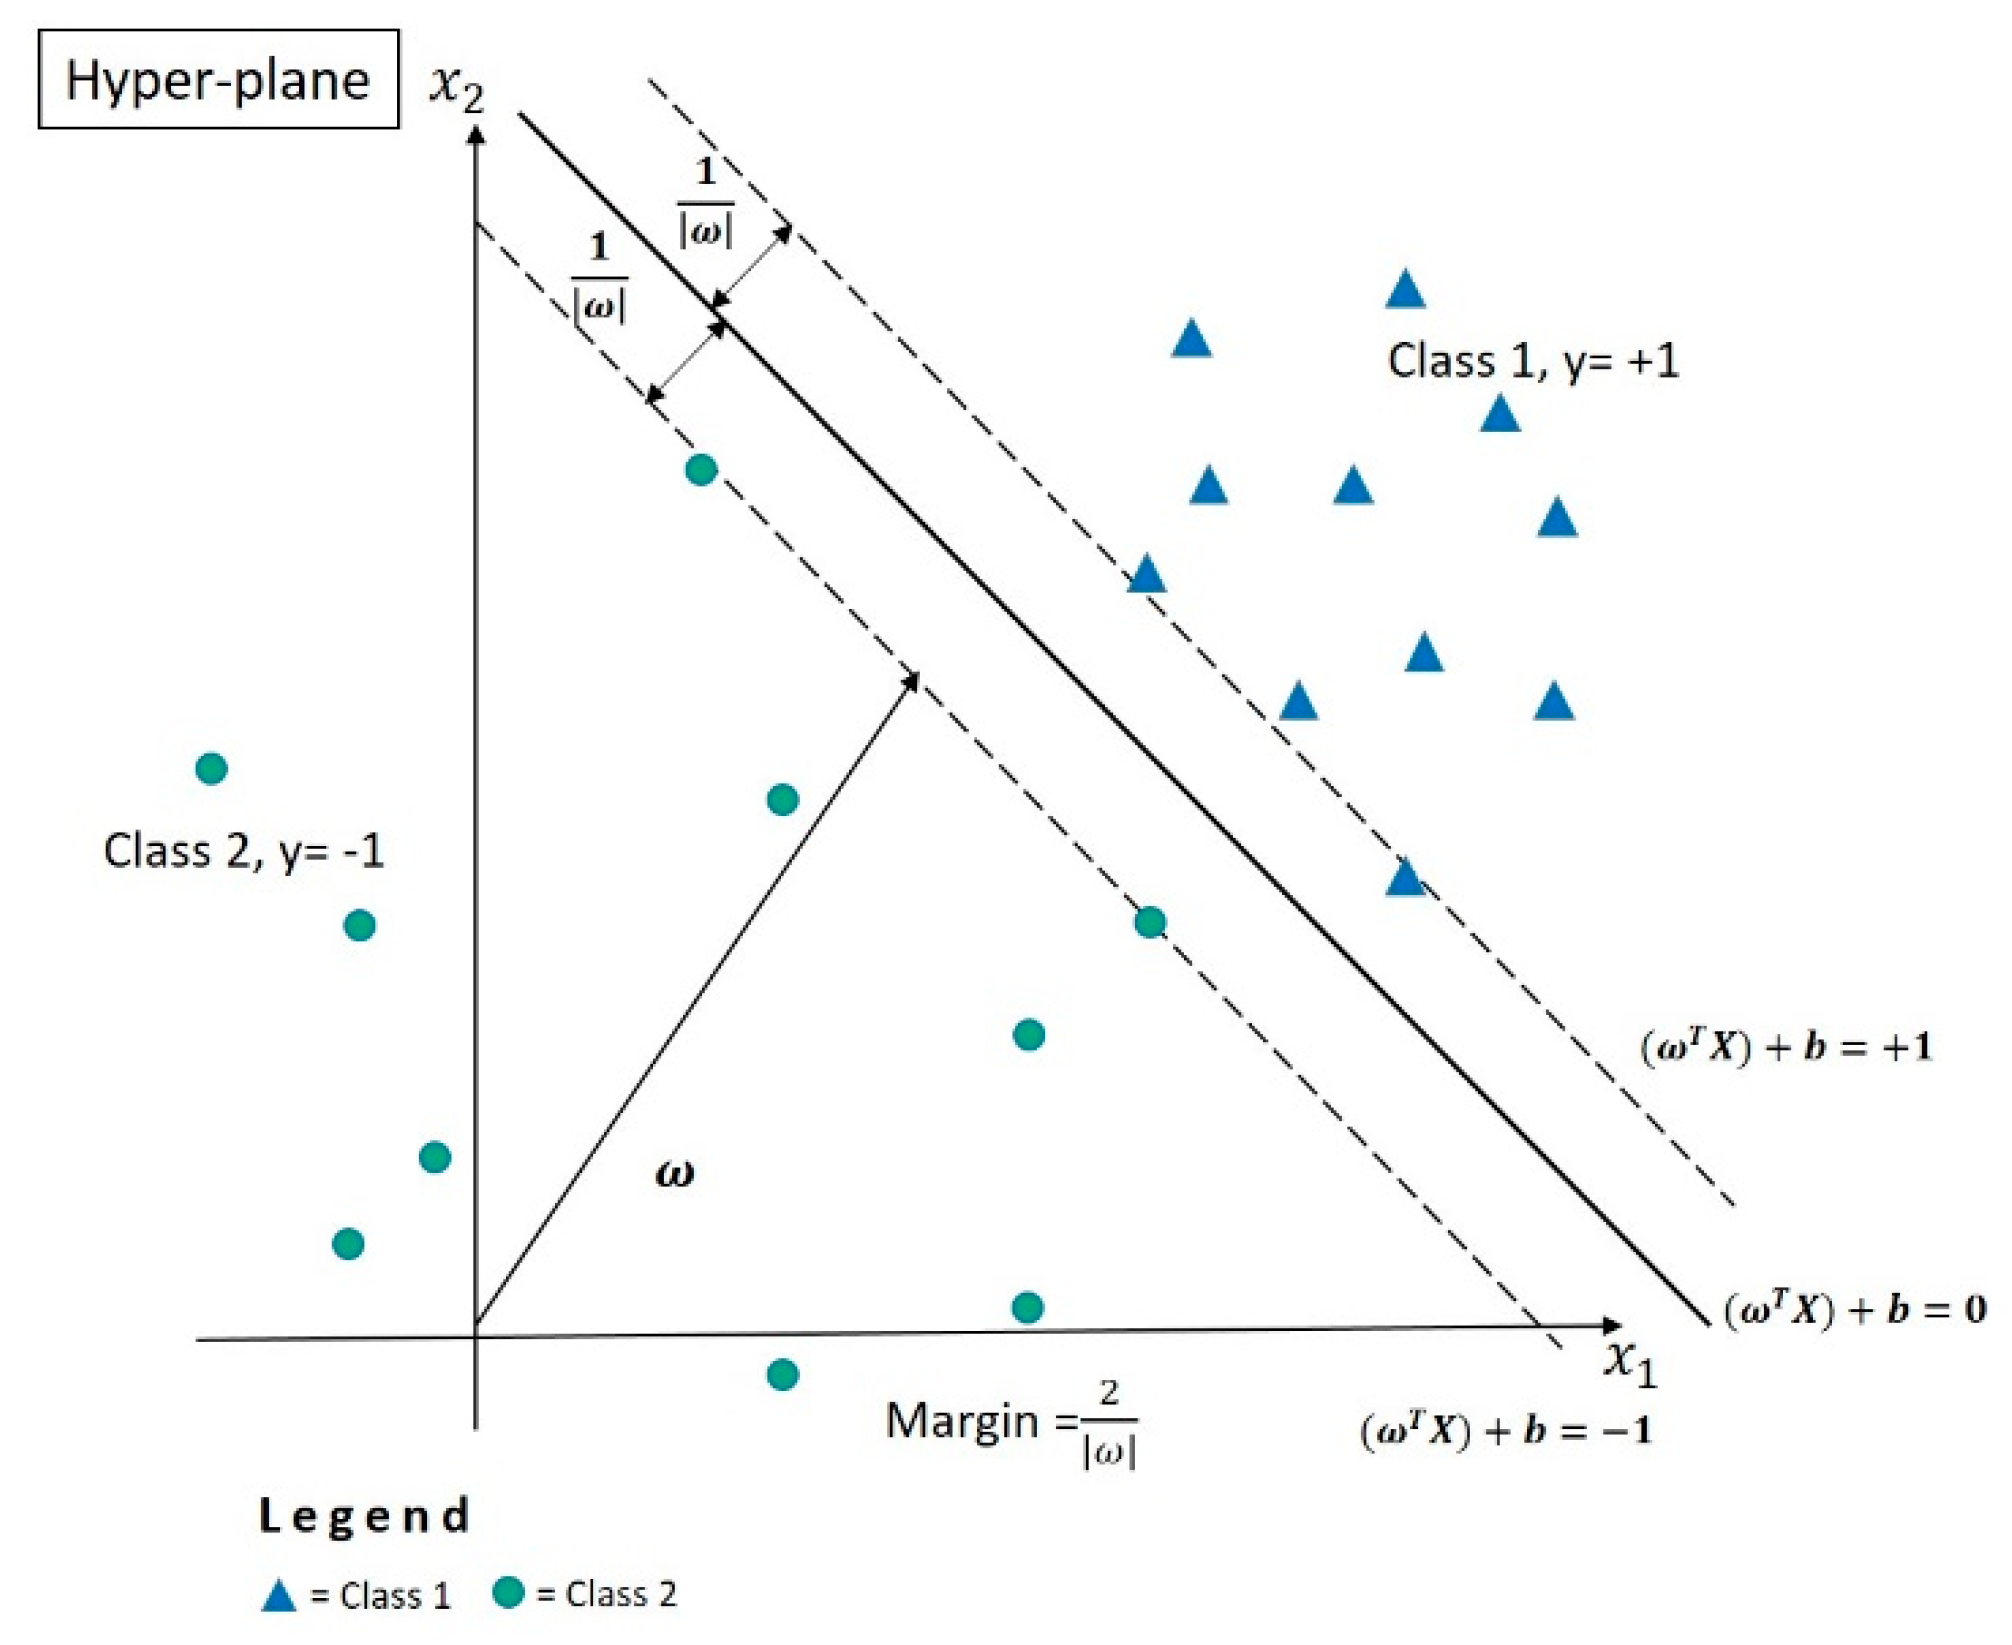
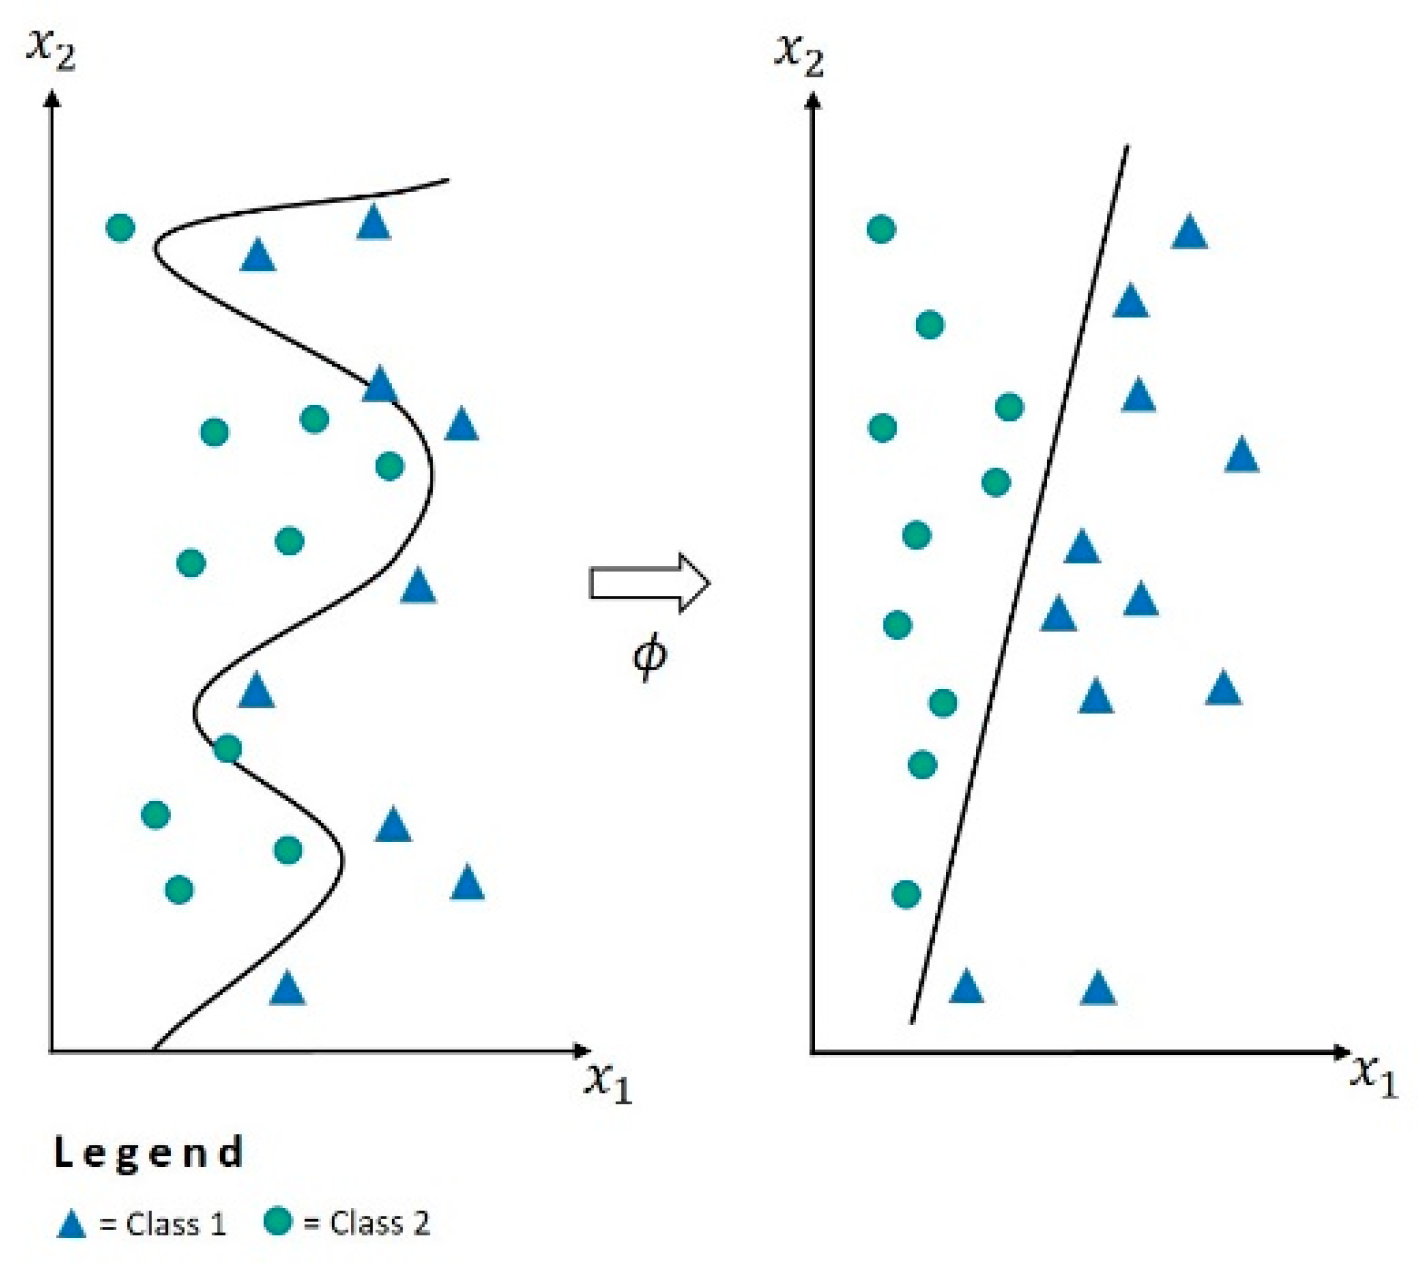
2.2. Support Vector Machine

SVM is a popular machine learning algorithm with a supervised learning binary classifier, which was designed based on the principle of structural risk minimization [43]. SVM was initially proposed by Vapnik [44,45]. The applications of SVM to issues of earth science hazards, including flood [46], landslide [47], wildfire [48], and gully erosion [49], have been increasing over time. As shown in Figure 4, to find an optimal separating hyperplane, SVM analysis maximizes the margin between the data to be separated. The circles and triangles represent two different classes, which can be separated by a different number of linear classifiers (hyperplanes). Nevertheless, only one linear classifier, the optimal separating hyperplane, can achieve maximum separation.
The primary function of SVMs is to clearly identify test samples. Thus, available training samples are used in SVMs to establish an optimal hyperplane in the test space. The hyperplane with the largest margin can separate the series of vectors without any mistakes. When the linear classifier of linearly separable data is at its maximal margin, the objective function can be calculated as follows:
m a x 2 | | ω | |   ,
Equation (1) is then transferred to the following expression:
m i n 1 2 | | ω | | 2   and   submitted   to   y i   ( ω T x i + b ) 1   ,
To solve the problem, a penalty cost, C, and a slack variable, ξ, are introduced when a linear classifier is a soft margin of overlapping classes. The resulting objective function is as follows:
m i n 1 2 | | ω | | 2 + C i = 1 p ζ i   and   subject   to   y i   ( ω T x i + b ) 1 ξ i ,   ξ i 0
As shown in Figure 5, when a classifier is nonlinear, SVM uses a kernel function to map the main problem into a feature space and then change it to a linear separation. Available kernel functions are as follows:
  • Linear kernel: K ( x i . x ) = x i . T . x
  • Polynomial kernel: K ( x i . x ) = ( γ . x i . T . x + r ) d , γ > 0
  • Radial basic function kernel: K ( x i . x ) = exp ( γ | x i x | 2 , γ > 0
  • Sigmoid kernel:   K ( x i . x ) = t a n h ( γ . x i . T . x + r ) d , γ > 0
This study used the sigmoid function as the kernel function, with γ, r, and d as kernel parameters; parameter C was used as a penalty parameter, due to errors in classification for each kernel.
Several recent research studies have optimized these parameters by using metaheuristic algorithms. Consequently, to determine the appropriate and optimized amounts of these parameters, evolutionary algorithms such as the ICA were used in the present study.

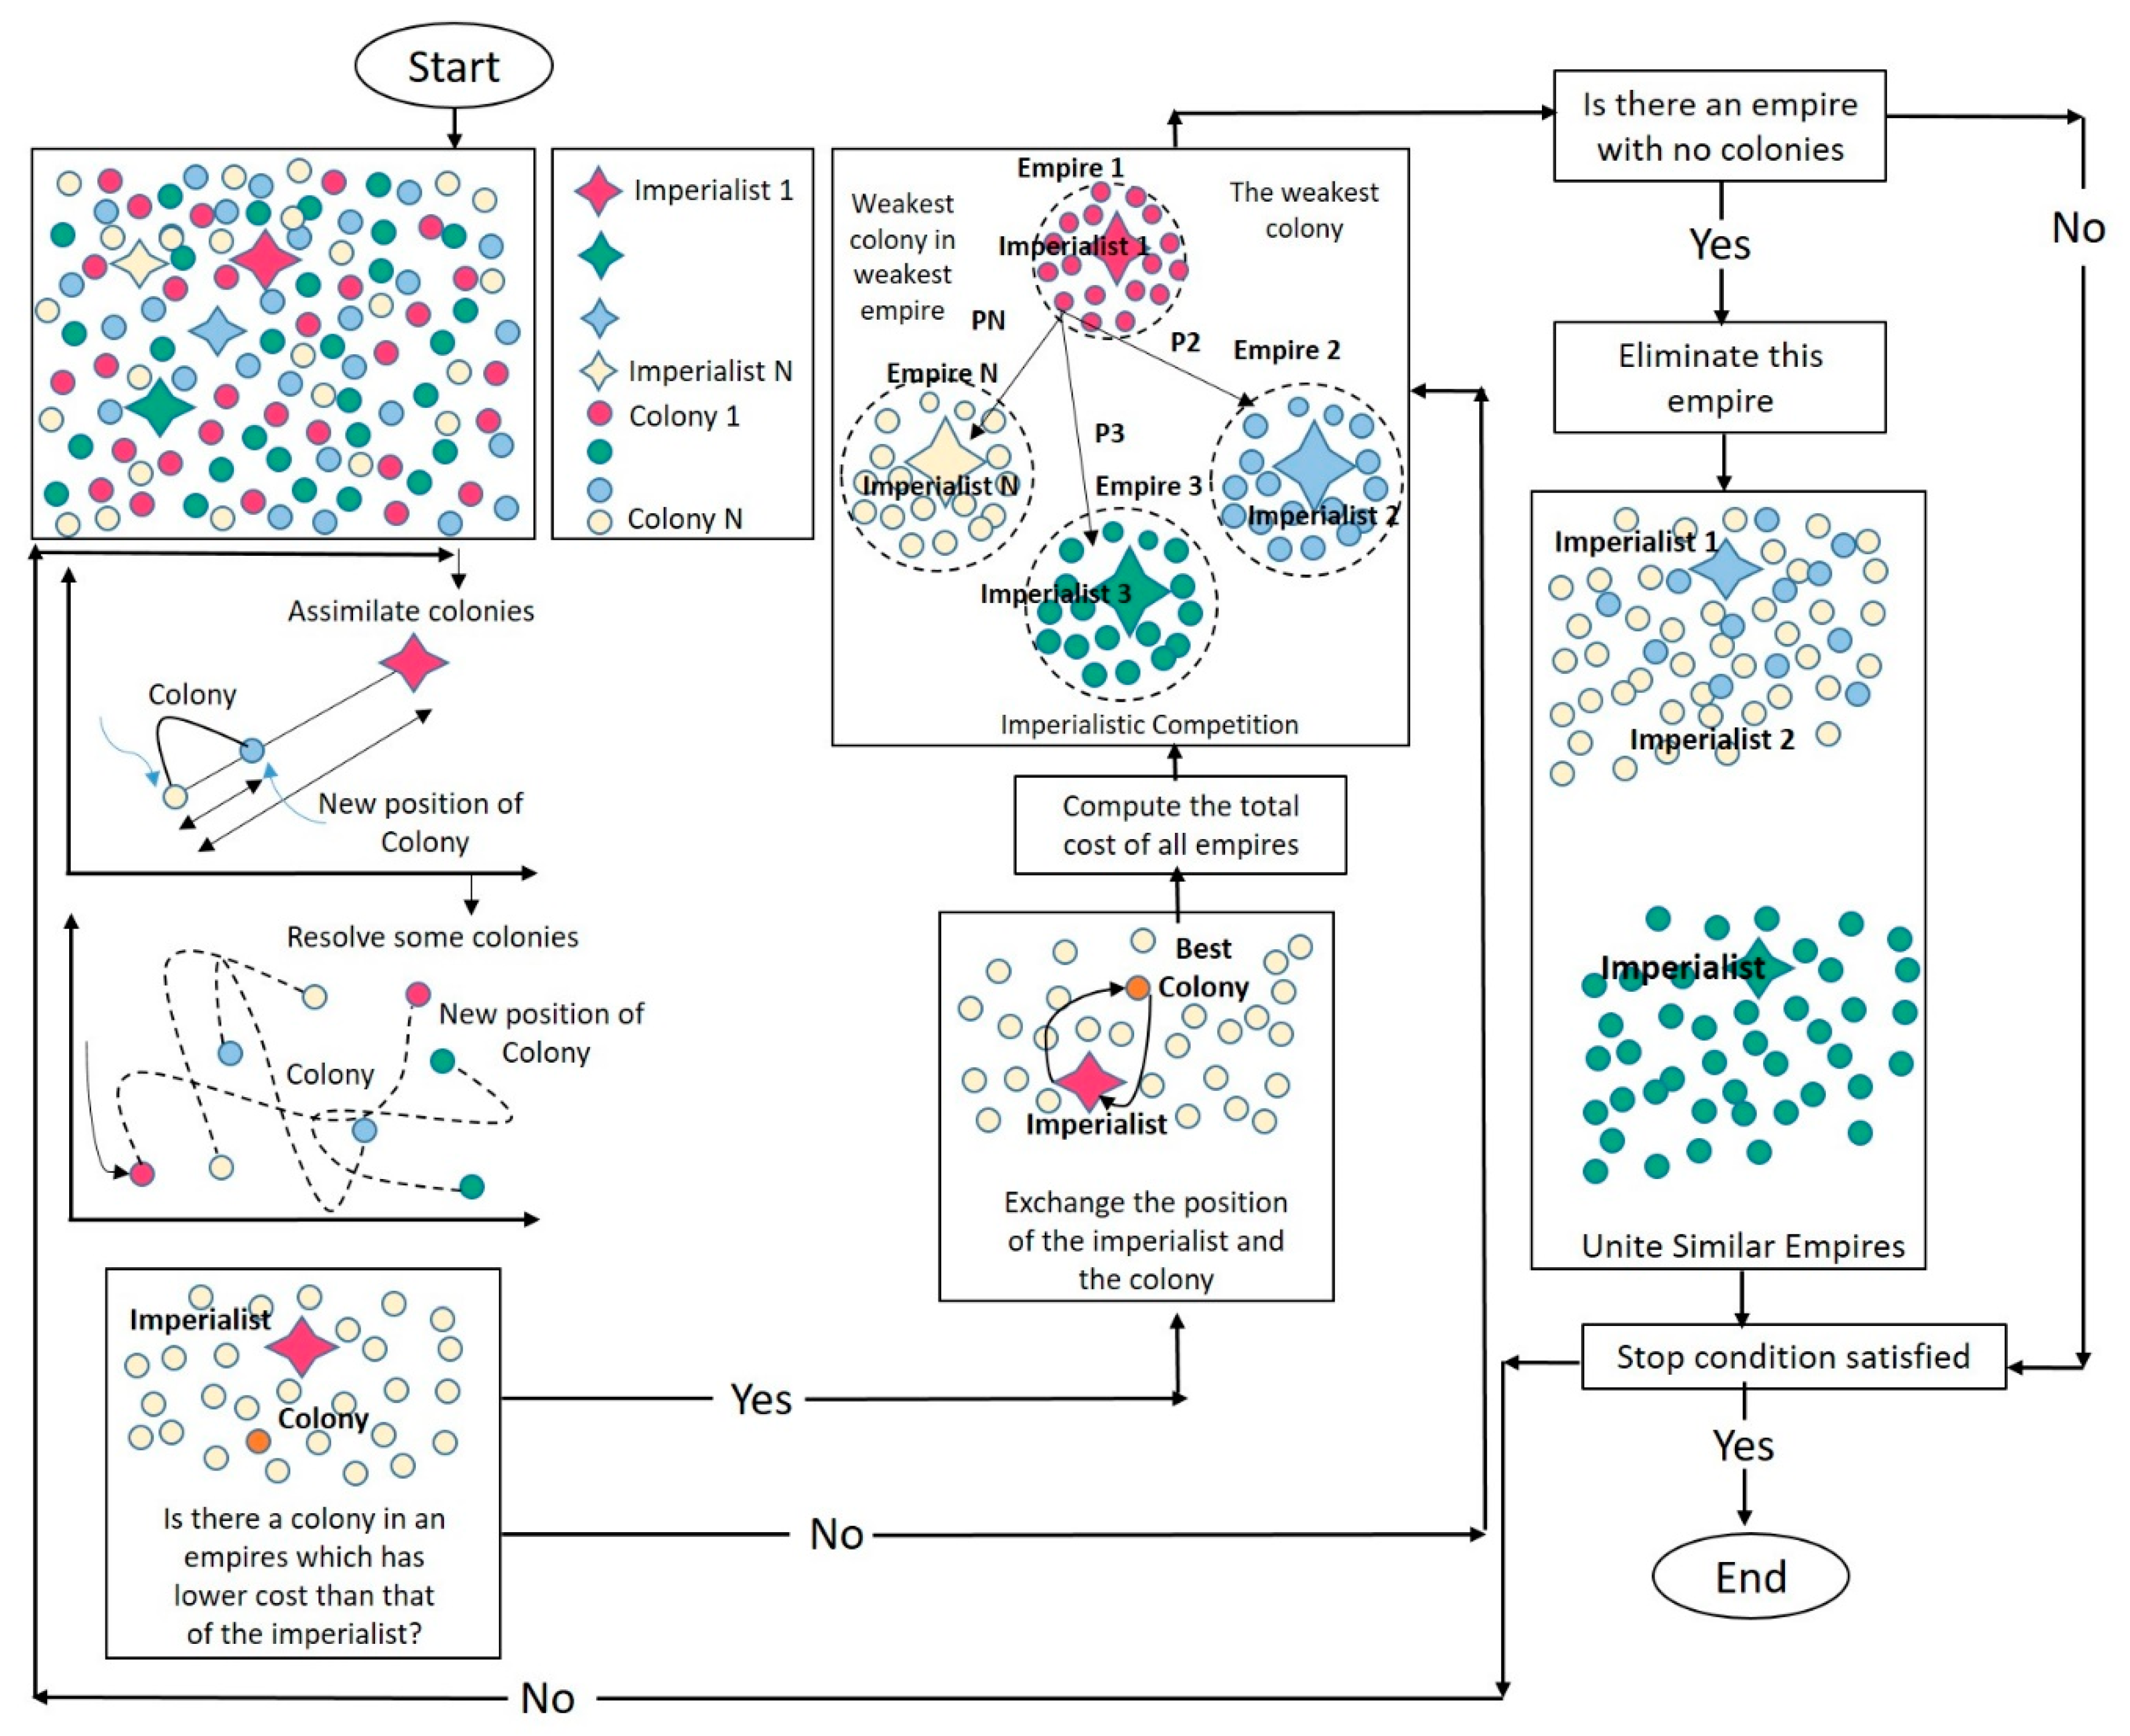
2.3. Imperialist Competitive Algorithm

The ICA is an algorithm proposed by Atashpaz-Gargari and Lucas [51]. This algorithm was inspired by imperialistic competition and can address various optimization problems. When finding an optimal value for the model used, ICA can be classified as an NP-hard problem because it is a metaheuristic algorithm that can solve an optimization problem in polynomial time. ICA is a robust metaheuristic algorithm; it is the most well-known algorithm among researchers and scientists for many optimization issues [52,53]. It was used in this study to aid in the SVM training phase, particularly for selection of the optimal width of the radial basis function.
Some contributions were provided by the ICA for optimizing the SVM model, including determining the amount of the SVM parameter, presenting a new algorithm in mapping the post-wildfire burned area, and establishing a post-wildfire map based on the SVM model, which differs from the results of previous studies. The ICA algorithm procedure includes the seven steps shown in Figure 6.
1. Formation of primary imperialists
Each component of the ICA population is defined as a country, assuming that it includes n variables with the C o u n t r y = [ p 1 ,   p 2 ,   ,   p n ] vector. Regarding the countries’ cost functions, countries with a low cost function are considered to be colonies and those with a high cost function are imperialists. In the bargain, the relationship between the imperialist’s cost function and its power is inverse. Consequently, the number of colonies can be determined based on this issue and by the computing power of each imperialist, which results in the formation of primary imperialists.
2. Assimilation
Imperialists always attempt to increase their power. In ICA, this action is achieved by attracting other colonies. This assimilation is a vector, with a random number, of a uniform distribution toward the emperor (Figure 6); it can be calculated as follows, assuming that x is the attraction (assimilation) value:
x ~ U ( 0 , β × d )
where β > 1 causes the colonies to move toward the imperialists from two sides and is generally regarded as a number larger than 2; d is the distance between colony and imperialist. Moreover, θ is an angle of deflection in relation to the interface of colony and imperialist, which causes the colony to search all available spaces while moving toward the empire. This value is a random number from a uniform distribution and can be defined as follows:
θ ~ U ( γ , + γ )
where γ is a random angle representing movement of the vector of the colony to the line between the colony and imperialist, which is π 4 .
3. Revolution
Revolution is a phenomenon that occurs in the real world due to sudden and rapid changes in social–political parameters in some countries. To launch this phase in ICA, a subset of colonies are randomly selected and their locations are changed randomly; if there is a local minimum, the problem is resolved by implementation of revolution.
4. Colony and empire displacement
The locations of colonies and their imperialists are compared by implementing the three last steps and by using the calculated cost function. If the location of a desired colony is better, the locations of the colony and empire will change and the imperialist will naturally move to the new imperialist.
5. Calculating the power of empires
The greatest power of an empire is dependent on its imperialist. However, it should be considered that the total power of its colonies can affect the total power of the empire. Thus, to calculate the total cost of an empire, the following equation is used:
T . C . C . n = C o s t ( i m p e r i a l i s t n ) + ξ m e a n ( C o s t ( c o l o n i e s   o f   e m p i r e n )
where T . C . n is the total cost of the nth empire and ξ is a coefficient with the interval of 0 and 1 that defines the effect of the colony’s average cost on the empire’s total cost. When this coefficient is high, the impact on the colony’s power is high; when this coefficient is low, the impact is low.
6. Empire competition
For development and enlargement, empires always compete with other empires. This competition is performed in accordance with the power calculation of each empire, such that the most powerful empire occupies the weakest colony of the weakest empire as its own colony. This process continues until the weak empire has no remaining colonies. Consequently, this empire becomes a collapsed empire, and the imperialist becomes a colony of the other empire.
7. Convergence
Repetition of steps 2–6 continues until an empire wins this competition by collapsing all other empires and colonies, after which only one empire remains. Notably, in some optimization problems and based on some circumstances, the convergence condition can be the number of iterations or the error rate.

2.4. Accuracy Assessment

The error matrix was utilized to assess accuracy, which guaranteed the quality of information derived from the remotely sensed data [54]. The error matrix is demonstrated by comparing the results from the remote sensing classification to ground truth data; these data are typically represented by sample points [55,56]. The ground truth data used existing cartography of land cover map that generated from California Department of Forestry and Fire Protection’s Fire and Resource Assessment Program (FRAP) (www.fire.ca.gov) [57]. The total test data collected comprised of 65 points. The error matrix displays a detailed assessment of the agreement between the reference data and classified results, which indicates the occurrence of misclassification [54]. To demonstrate the accuracy evaluation, the overall accuracy and kappa coefficient calculated from the error matrix are used. The overall accuracy is determined by the total number of test data or sample points, and the kappa coefficient is an overall measurement of statistical agreement of the error matrix. The kappa coefficient is regarded as a powerful method for the evaluation of a single error matrix because it indicates the probability of correct classification after removal of the probability of accidental correct classification [58,59].

3. Results

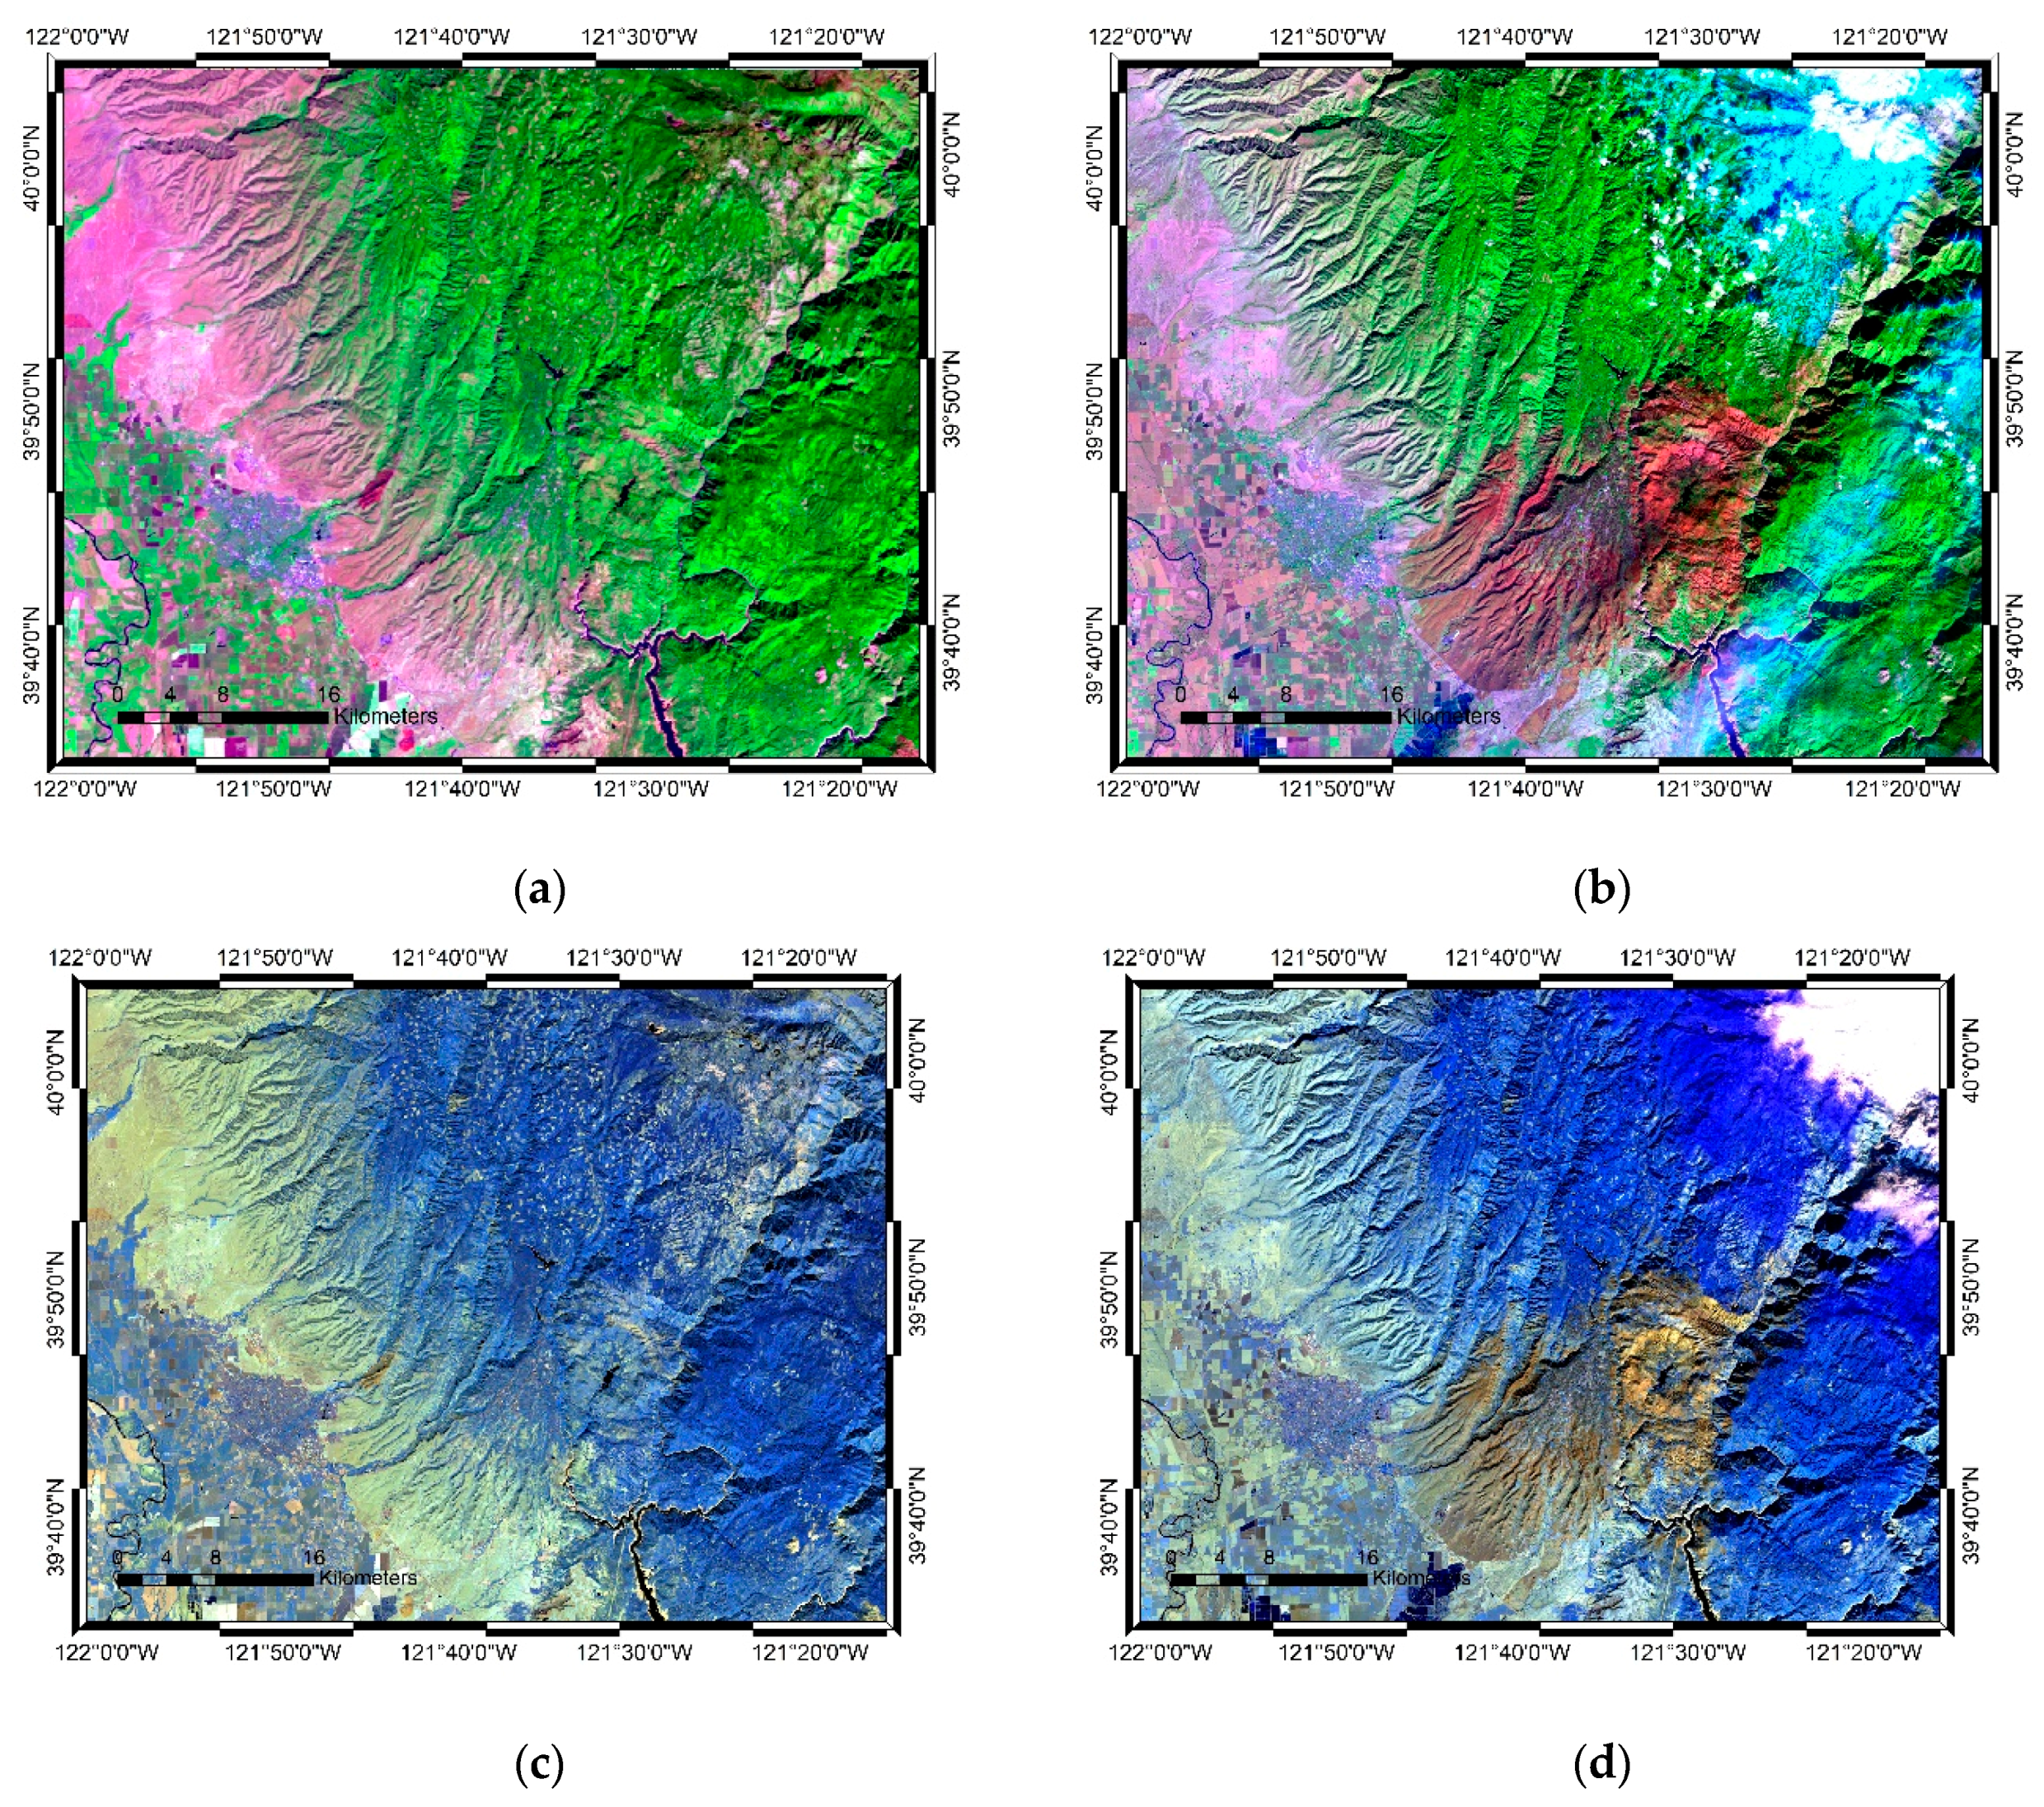
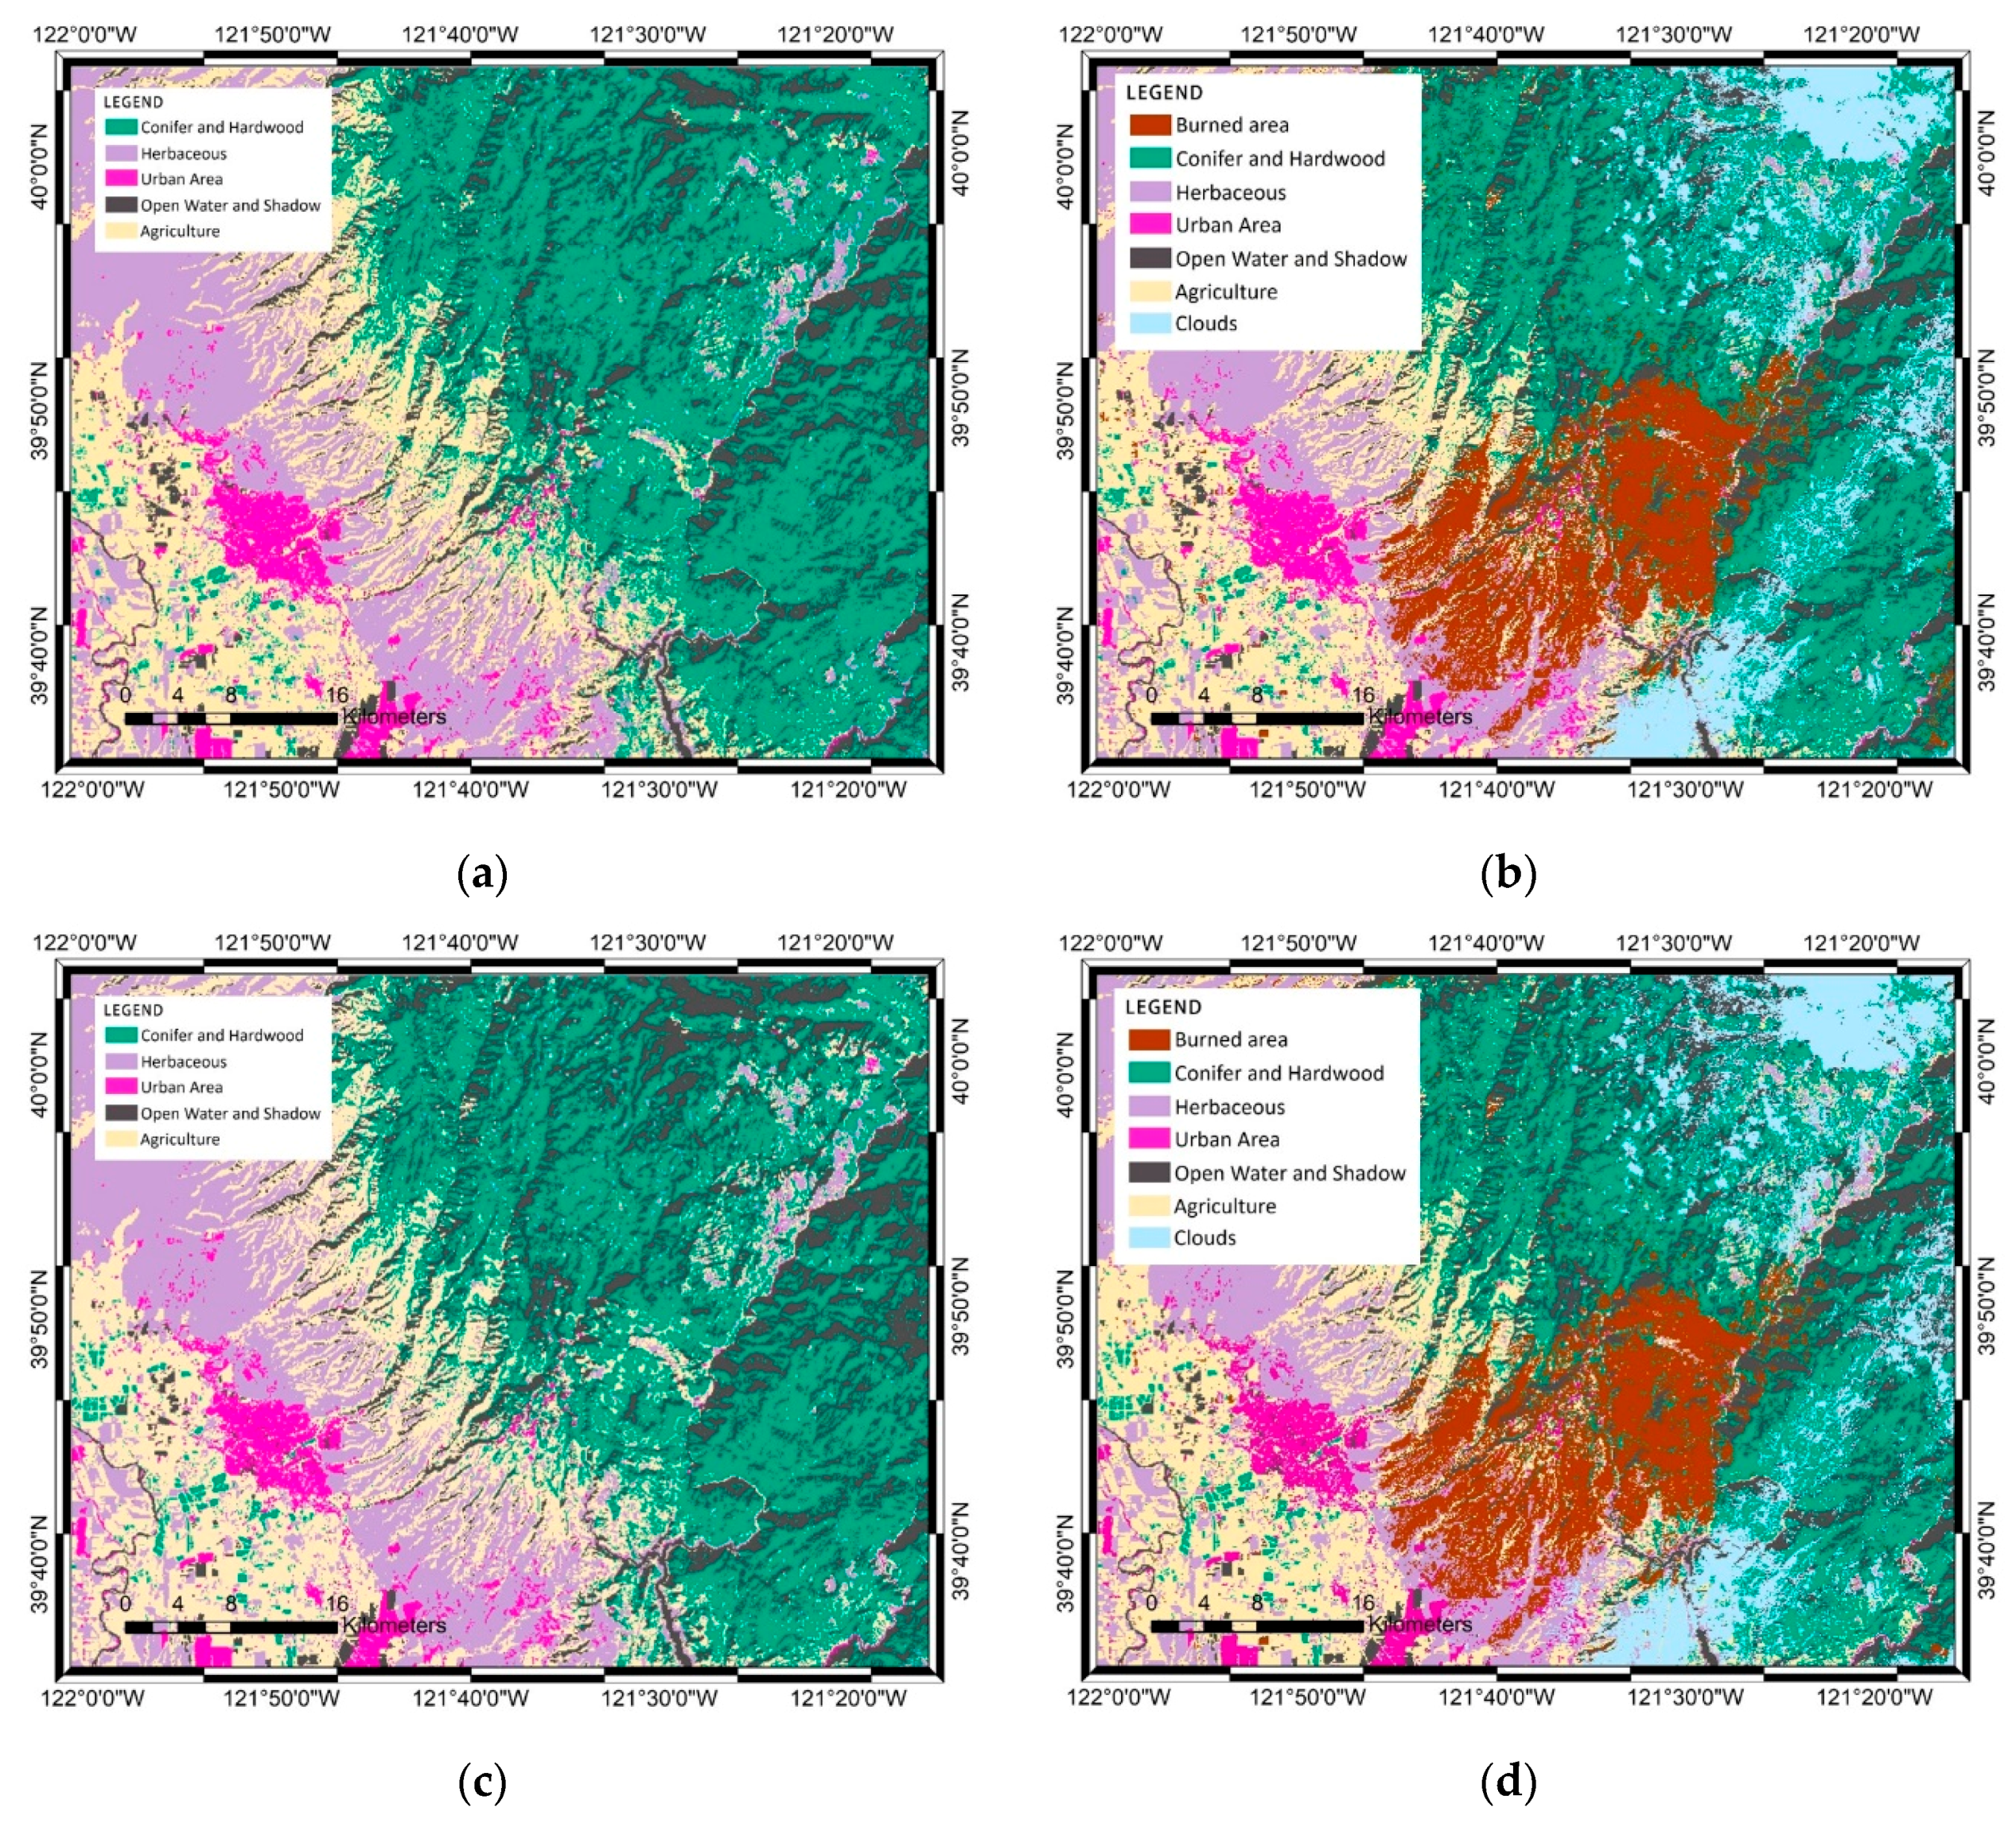
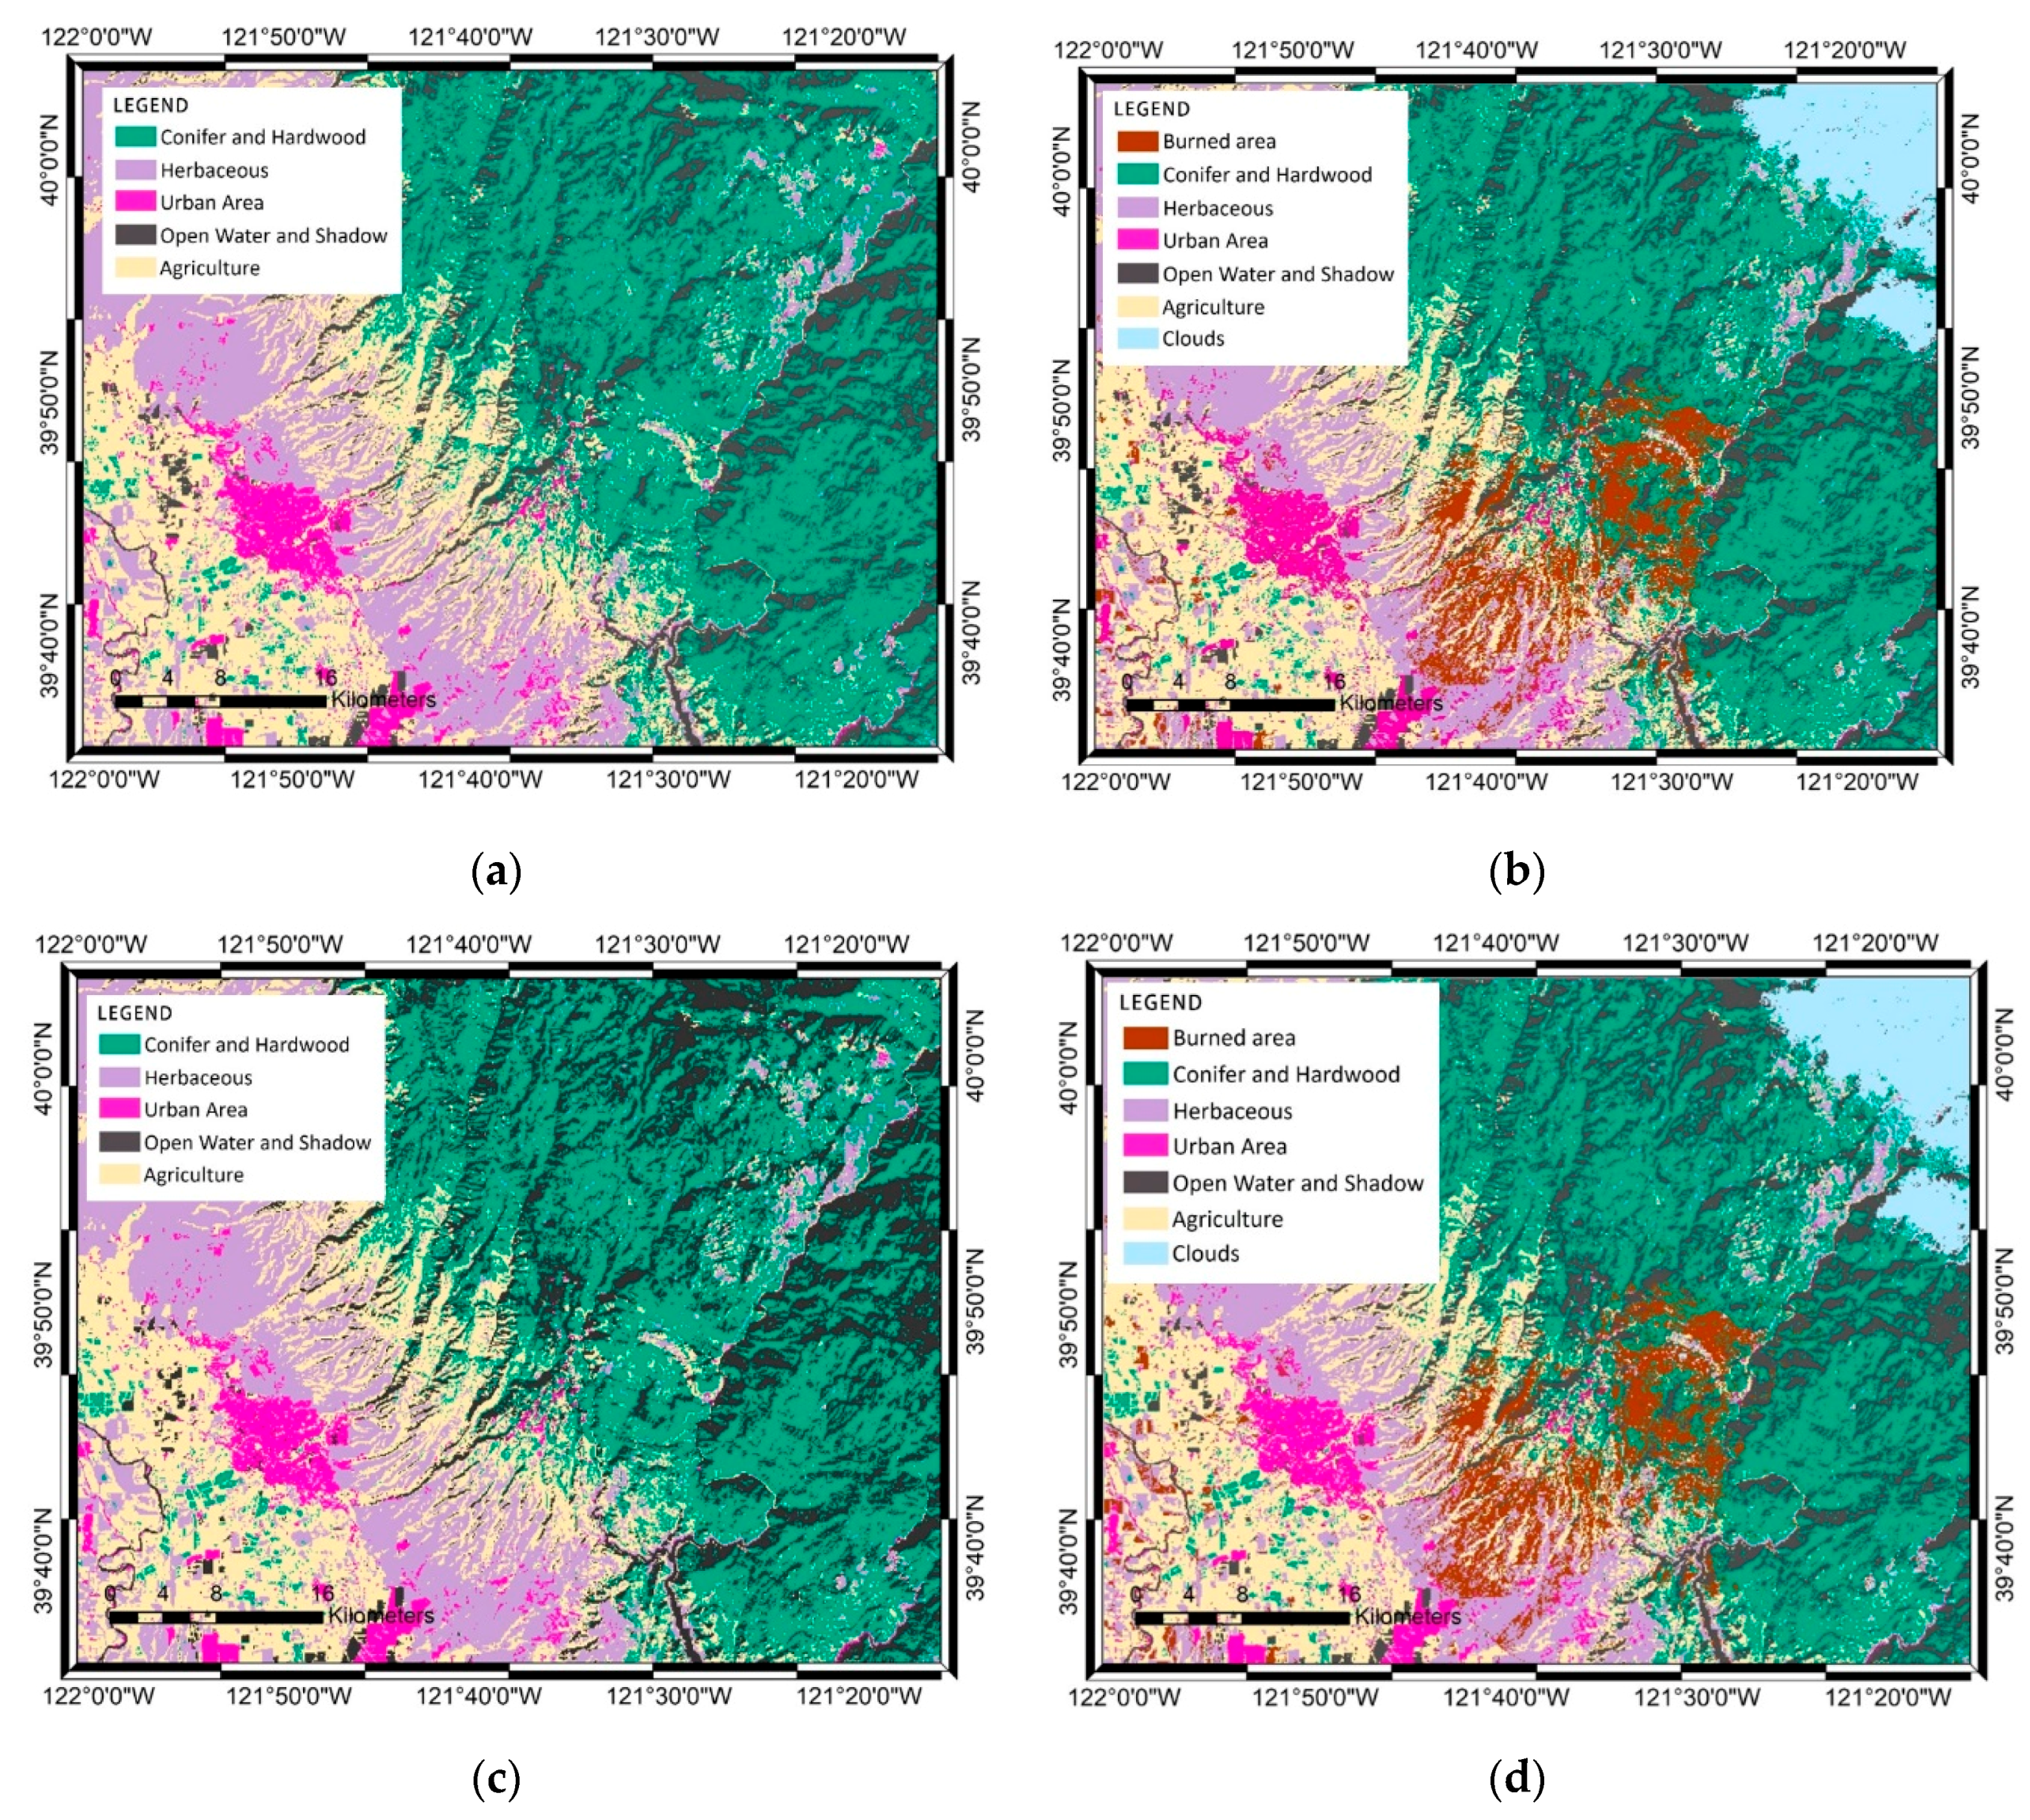
3.1. Landsat Image Classification

Pre- and post-wildfire Landsat-8 image results were successfully produced by the SVM as shown in Figure 7a,b, while by the SVM-ICA shown in Figure 7c,d. Stratified random sampling on a pixel-by-pixel basis was used for classification, which identified five classes for pre-wildfire and seven classes for post-wildfire. There are burned area, conifer and hardwood, herbaceous, urban area, open water and shadow, agriculture, and clouds for post-wildfire classes, while the pre-wildfire classes not including the burned area and clouds classes. In total, 171 data points were used for training and 65 points data were used as test data.
The SVM and SVM–ICA classifiers yielded similar pre- and post-wildfire map results. The pre-wildfire maps results between the SVM and SVM-ICA are well classified. Both SVM and SVM-ICA can classify the five classes assigned from the training data. However, the similarity of the spectral from the satellite image between two classes: conifer and hardwood, and agriculture, resulted to interchangeably-misclassification in some particular parts by both SVM and SVM-ICA. On the other hand, both pre- and post-wildfire classification, the agriculture area especially in the southeastern position where nothing is planted were defined as urban area. Based on the land cover map from California Department of Forestry and Fire Protection’s Fire and Resource Assessment Program (FRAP), this area should be paddy field area. However as can be seen in Figure 2a,b, the spectral between the paddy field area and the urban area was similar, so the paddy field areas detected as urban area (magenta shade). The composite image from Landsat-8 showed complex classes, which then the classification was simplified in terms of the spectral displayed; for example, the shadow and open water classes were merged into one class (gray shade) for both SVM and SVM–ICA. Additionally, crop field, which has a different pattern, mostly showed similar spectral to the edge-parts of hardwood class named coastal oak woodland; accordingly, agriculture and the coastal oak woodland classes were also merged into one class (cream shade).
The post-wildfire maps produced by SVM and SVM–ICA appear similar in many ways, but there are some notable differences in particular areas. For example, the burned area in the SVM classification was wider, as demonstrated by the number of pixels (418,508), than the burned area of the SVM–ICA classification (393,654 pixels). The SVM classification also showed a larger area for the conifer-and-hardwood class which differed by 80,105 pixels from the SVM–ICA classification. These findings indicate that classification of the SVM–ICA model was better than that of the SVM model. Nevertheless, both results were flawed due to misclassification of some areas; an accuracy assessment was therefore performed to address this issue and is described in the following section (Section 3.2). Accuracy assessment can also reveal which model outperformed in mapping the pre- and post-wildfire burned area.

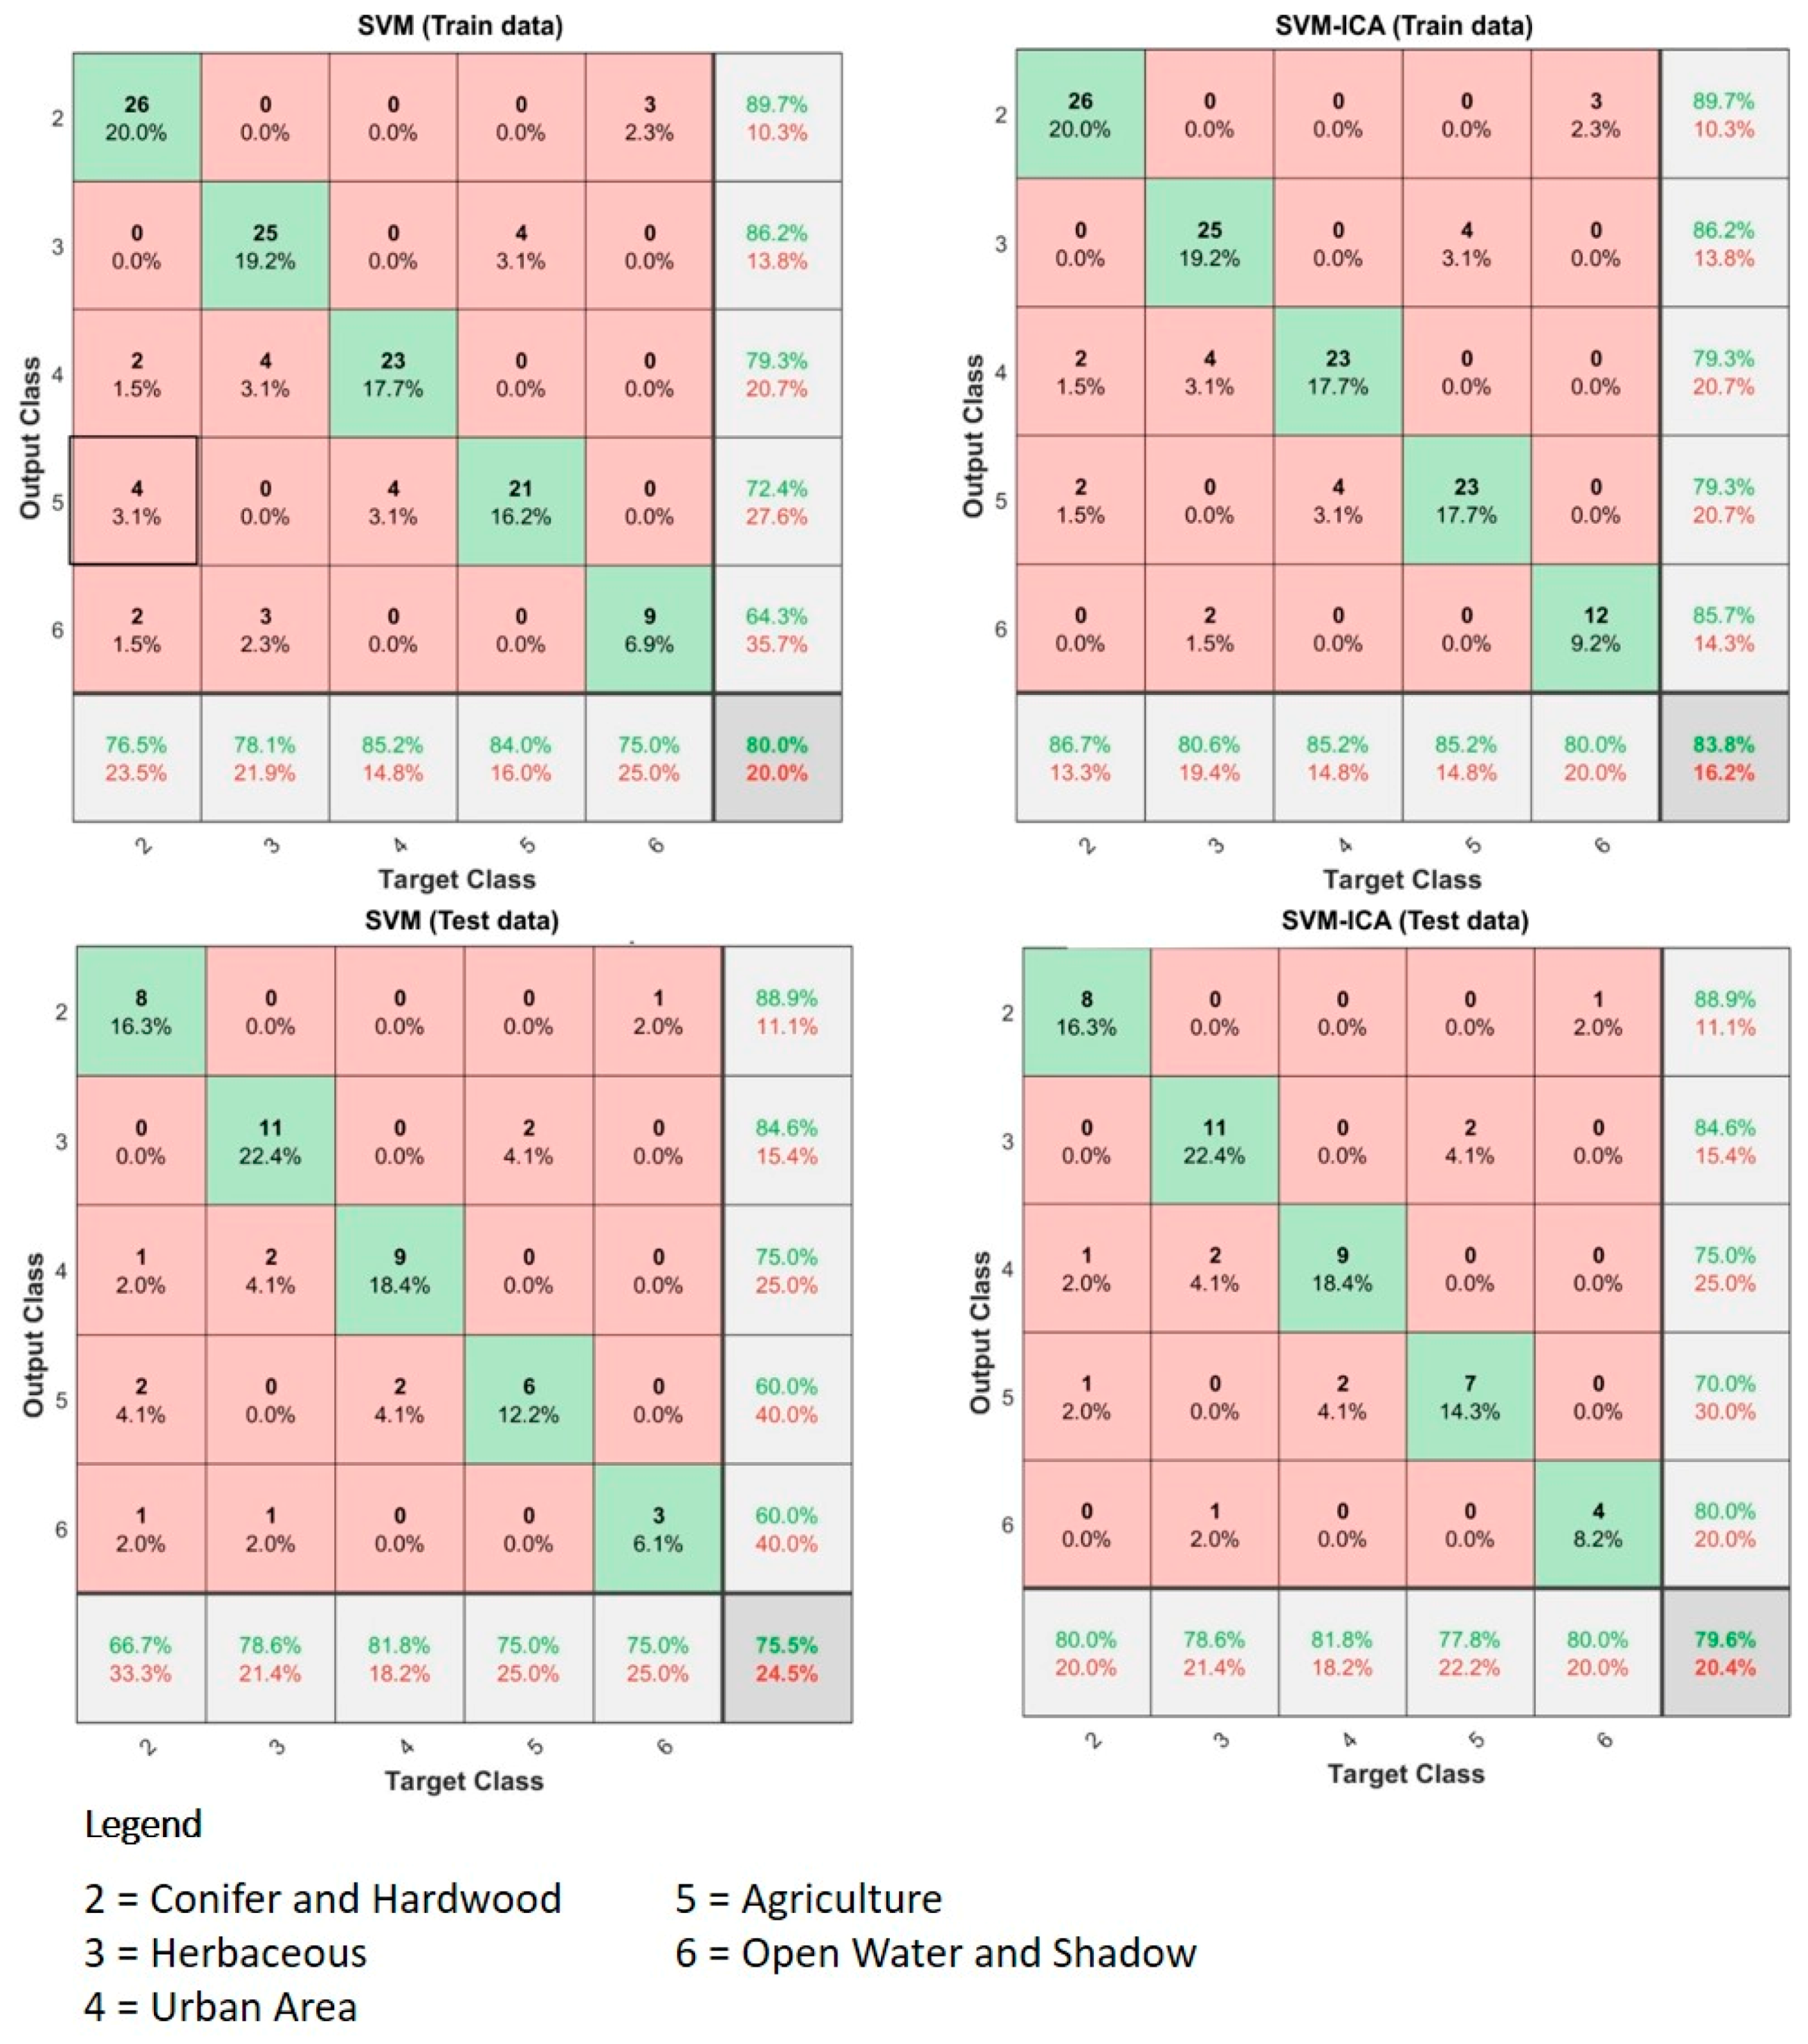
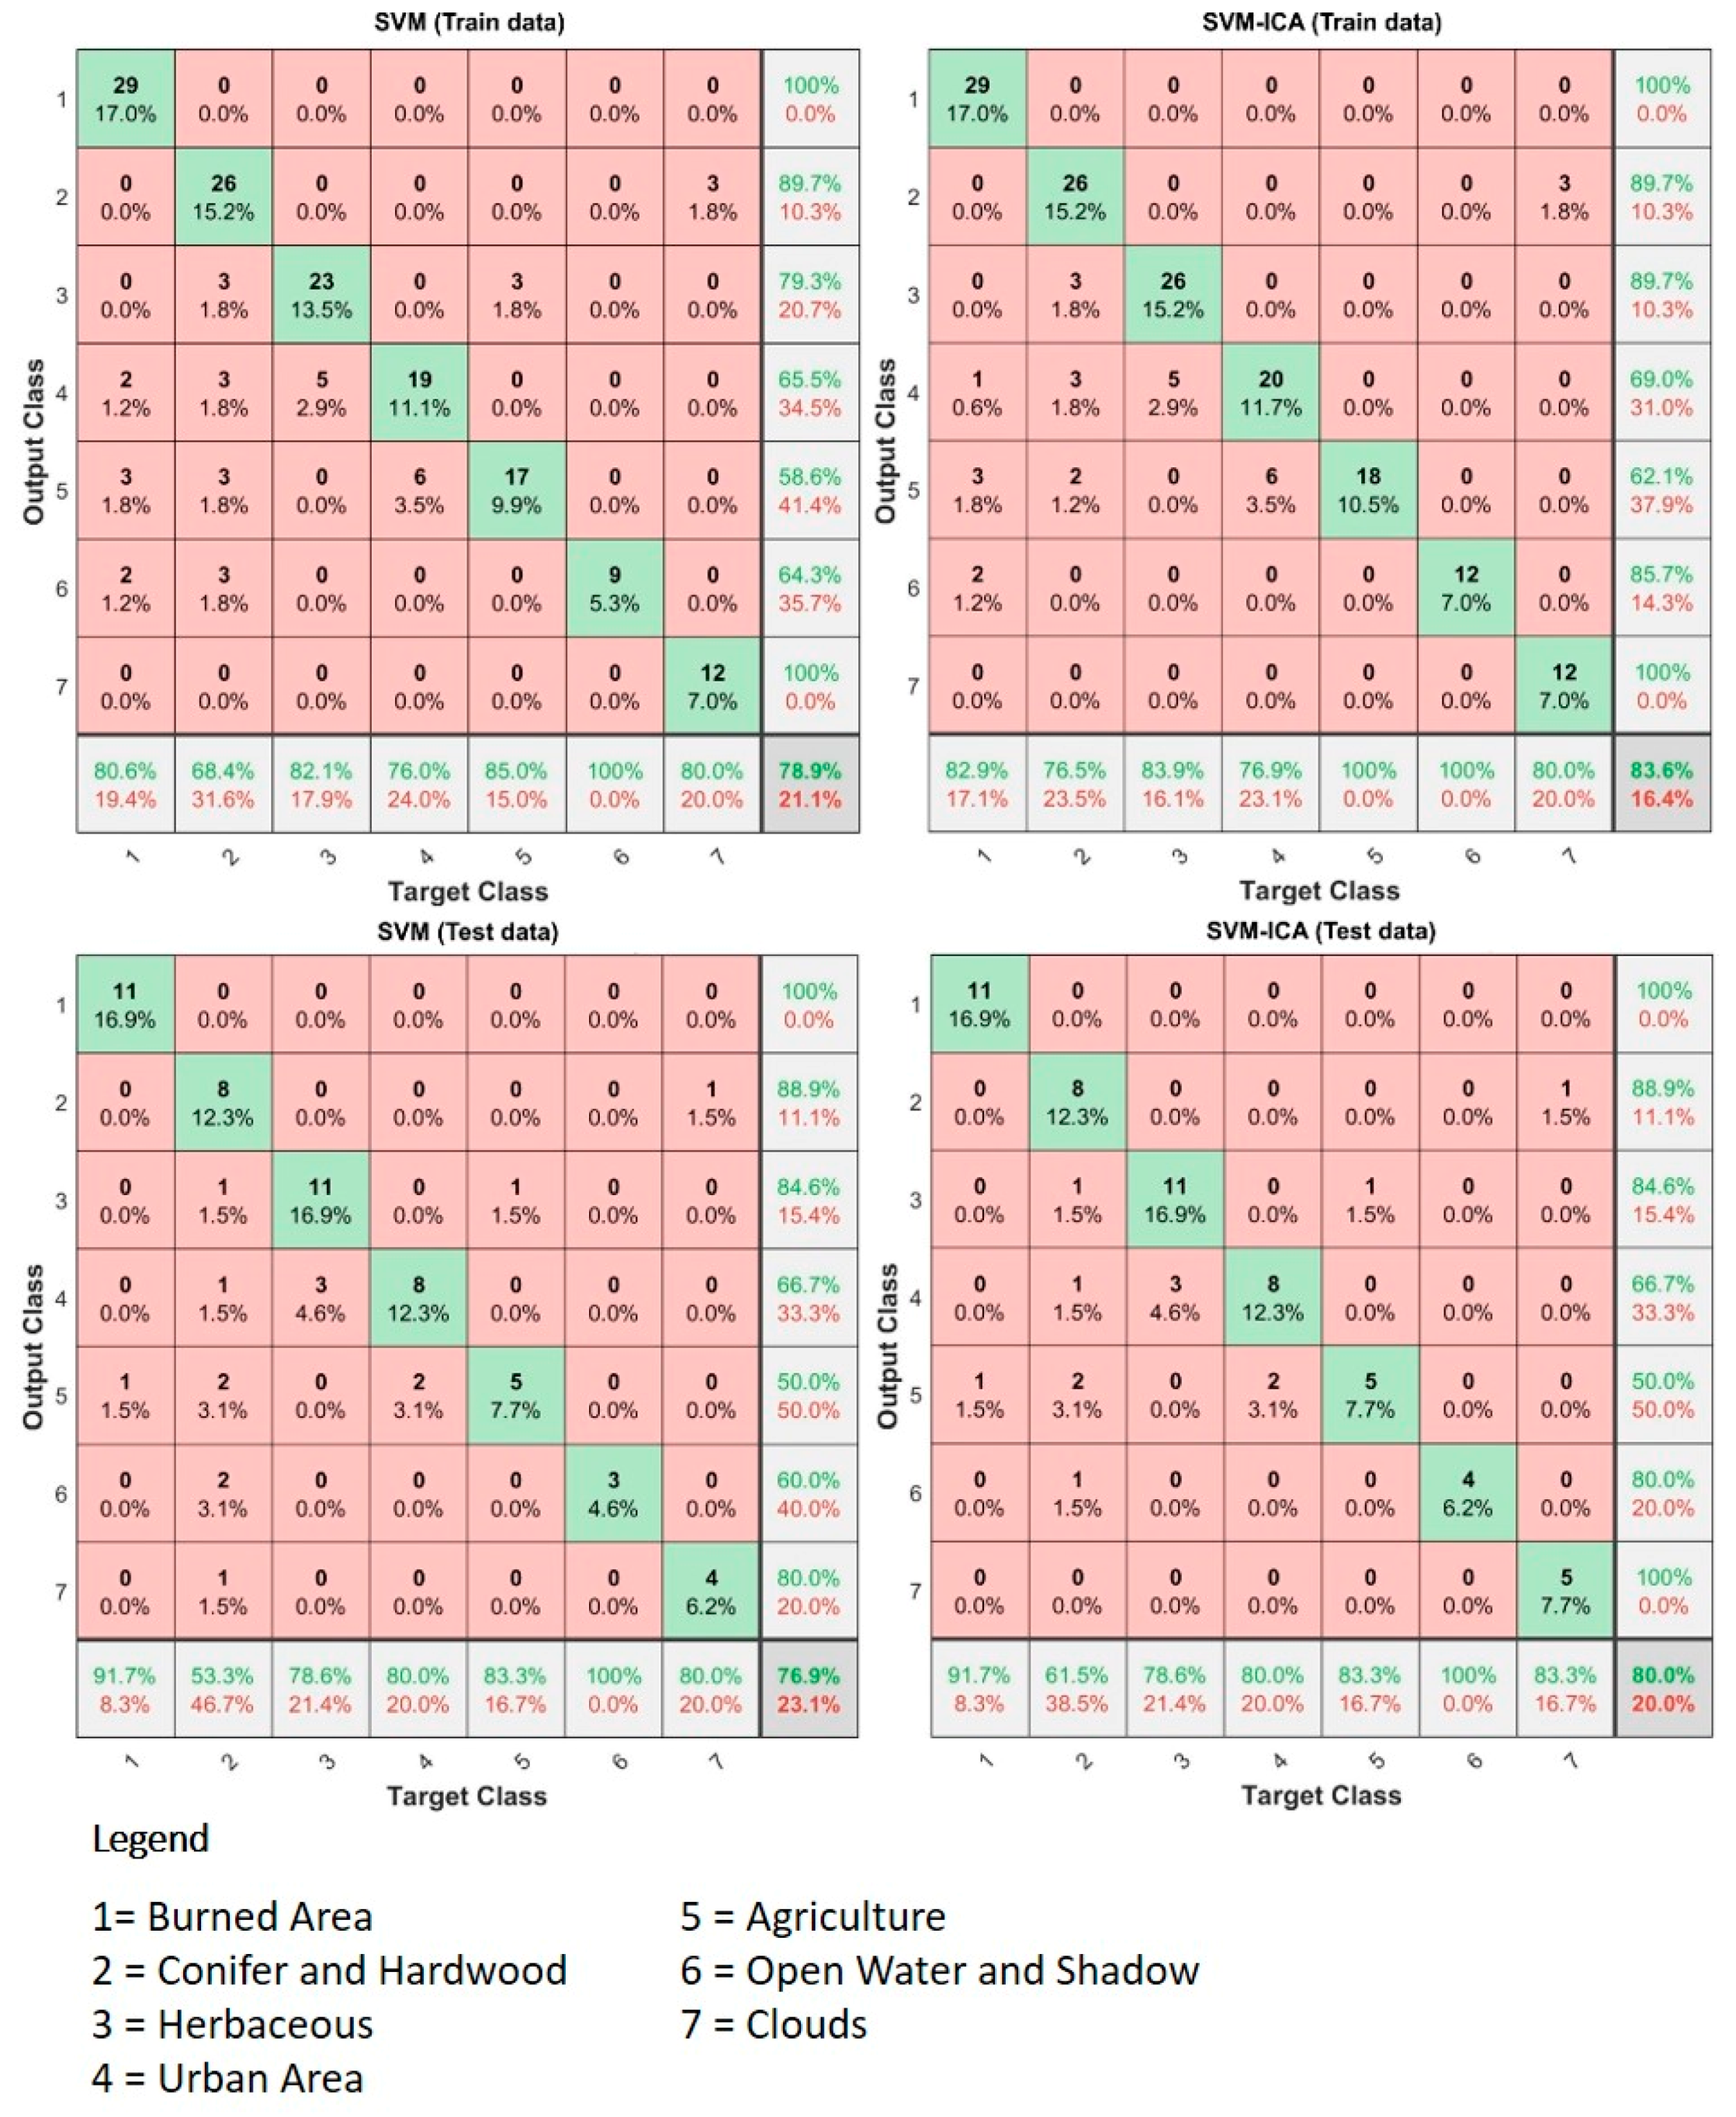
3.2. Accuracy Assessment for Landsat Image Classification

After the training data had been used to classify the Landsat-8 pre- and post-wildfire events, the accuracy of the assessment was measured. Test data (65 pixels) were used to generate the accuracies of SVM and SVM–ICA. The assessment was performed on a pixel-by-pixel basis using the error matrices method. The test data were acquired using the stratified random sampling method for both Landsat and Sentinel data, as suggested by Kadavi and Lee [60] and Topaloğlu et al. [11]. The overall accuracy and Cohen’s kappa coefficient [61,62,63] were acquired from the error matrix of each map, as shown in Figure 8 for the pre-wildfire results and Figure 9 for the post-wildfire results.
From the Landsat-8 satellite imagery, the overall accuracy and kappa coefficient revealed a generally accurate result. Between the two algorithms, SVM–ICA performed better than SVM, as shown by the higher overall accuracy and kappa coefficient. The overall accuracy and kappa coefficient from the SVM algorithm reached values of 80.0% and 0.746 for pre-wildfire, whereas those from the SVM–ICA hybrid algorithm were 83.8% and 0.796, respectively. Along with the pre-wildfire accuracy results, the post-wildfire classification results also indicate that the SVM-ICA better than the SVM which shown by its overall accuracy. The SVM-ICA shows an overall accuracy of 83.6% and kappa coefficient of 0.806, while the SVM shows an overall accuracy of 78.9% and kappa coefficient of 0.750. Thus, SVM–ICA yielded a higher accuracy than SVM. According to the error matrix results, although the results of SVM–ICA were superior to those of SVM, the agriculture class, which was categorized into other classes such as conifer and hardwood class and urban area class for pre-fire occurrence. Moreover, in the post-wildfire event, the agriculture class it is also classified as burned area class. The accuracy assessment outcome depended on the classification outcome. Thus, misclassification of classes on the map would also affect the overall accuracy and kappa coefficient. A discussion of accuracy assessment is presented in the next section (Section 4).

3.3. Sentinel-2 Image Classification

In this study, Sentinel-2 imagery was also used to map the burned area from the Camp Fire wildfire. Similar to Landsat-8 classification, the Sentinel-2 image was classified using the SVM and SVM–ICA models. In total, 171 pixels from the same data used for Landsat-8 were also used for training. Pre- and post-wildfire classification maps (Figure 10) were generated to differentiate the areas affected by the wildfire from the areas unaffected by the wildfire occurrence.
Figure 10a,b show the classifications of the pre- and post-wildfire map from the SVM classifier, while Figure 10c,d show the classification of the pre- and post-wildfire map from SVM–ICA classifier. In contrast to the Landsat-8 classification outcome, the post-wildfire maps from Sentinel-2 showed very similar results. The northeastern parts of both maps were clearly classified as clouds because the Sentinel-2 composite image was very clear. The spectral shown was distinct from other classes. However, the agriculture class was classified as burned area in the south-western part. The area adjacent to the herbaceous area on the southern part of burned-area class was also classified as urban area, whereas it should have been open water or shadow class whether in pre- and post-wildfire maps. The burned area from both maps (marked by brown shade) was detected clearly; thus, the slope and open water area (gray) were also visible in the map. From four maps the differences between SVM and SVM–ICA for Sentinel-2 were also assessed by the error matrices accuracy assessment method; this topic is addressed in the following section (Section 3.4).

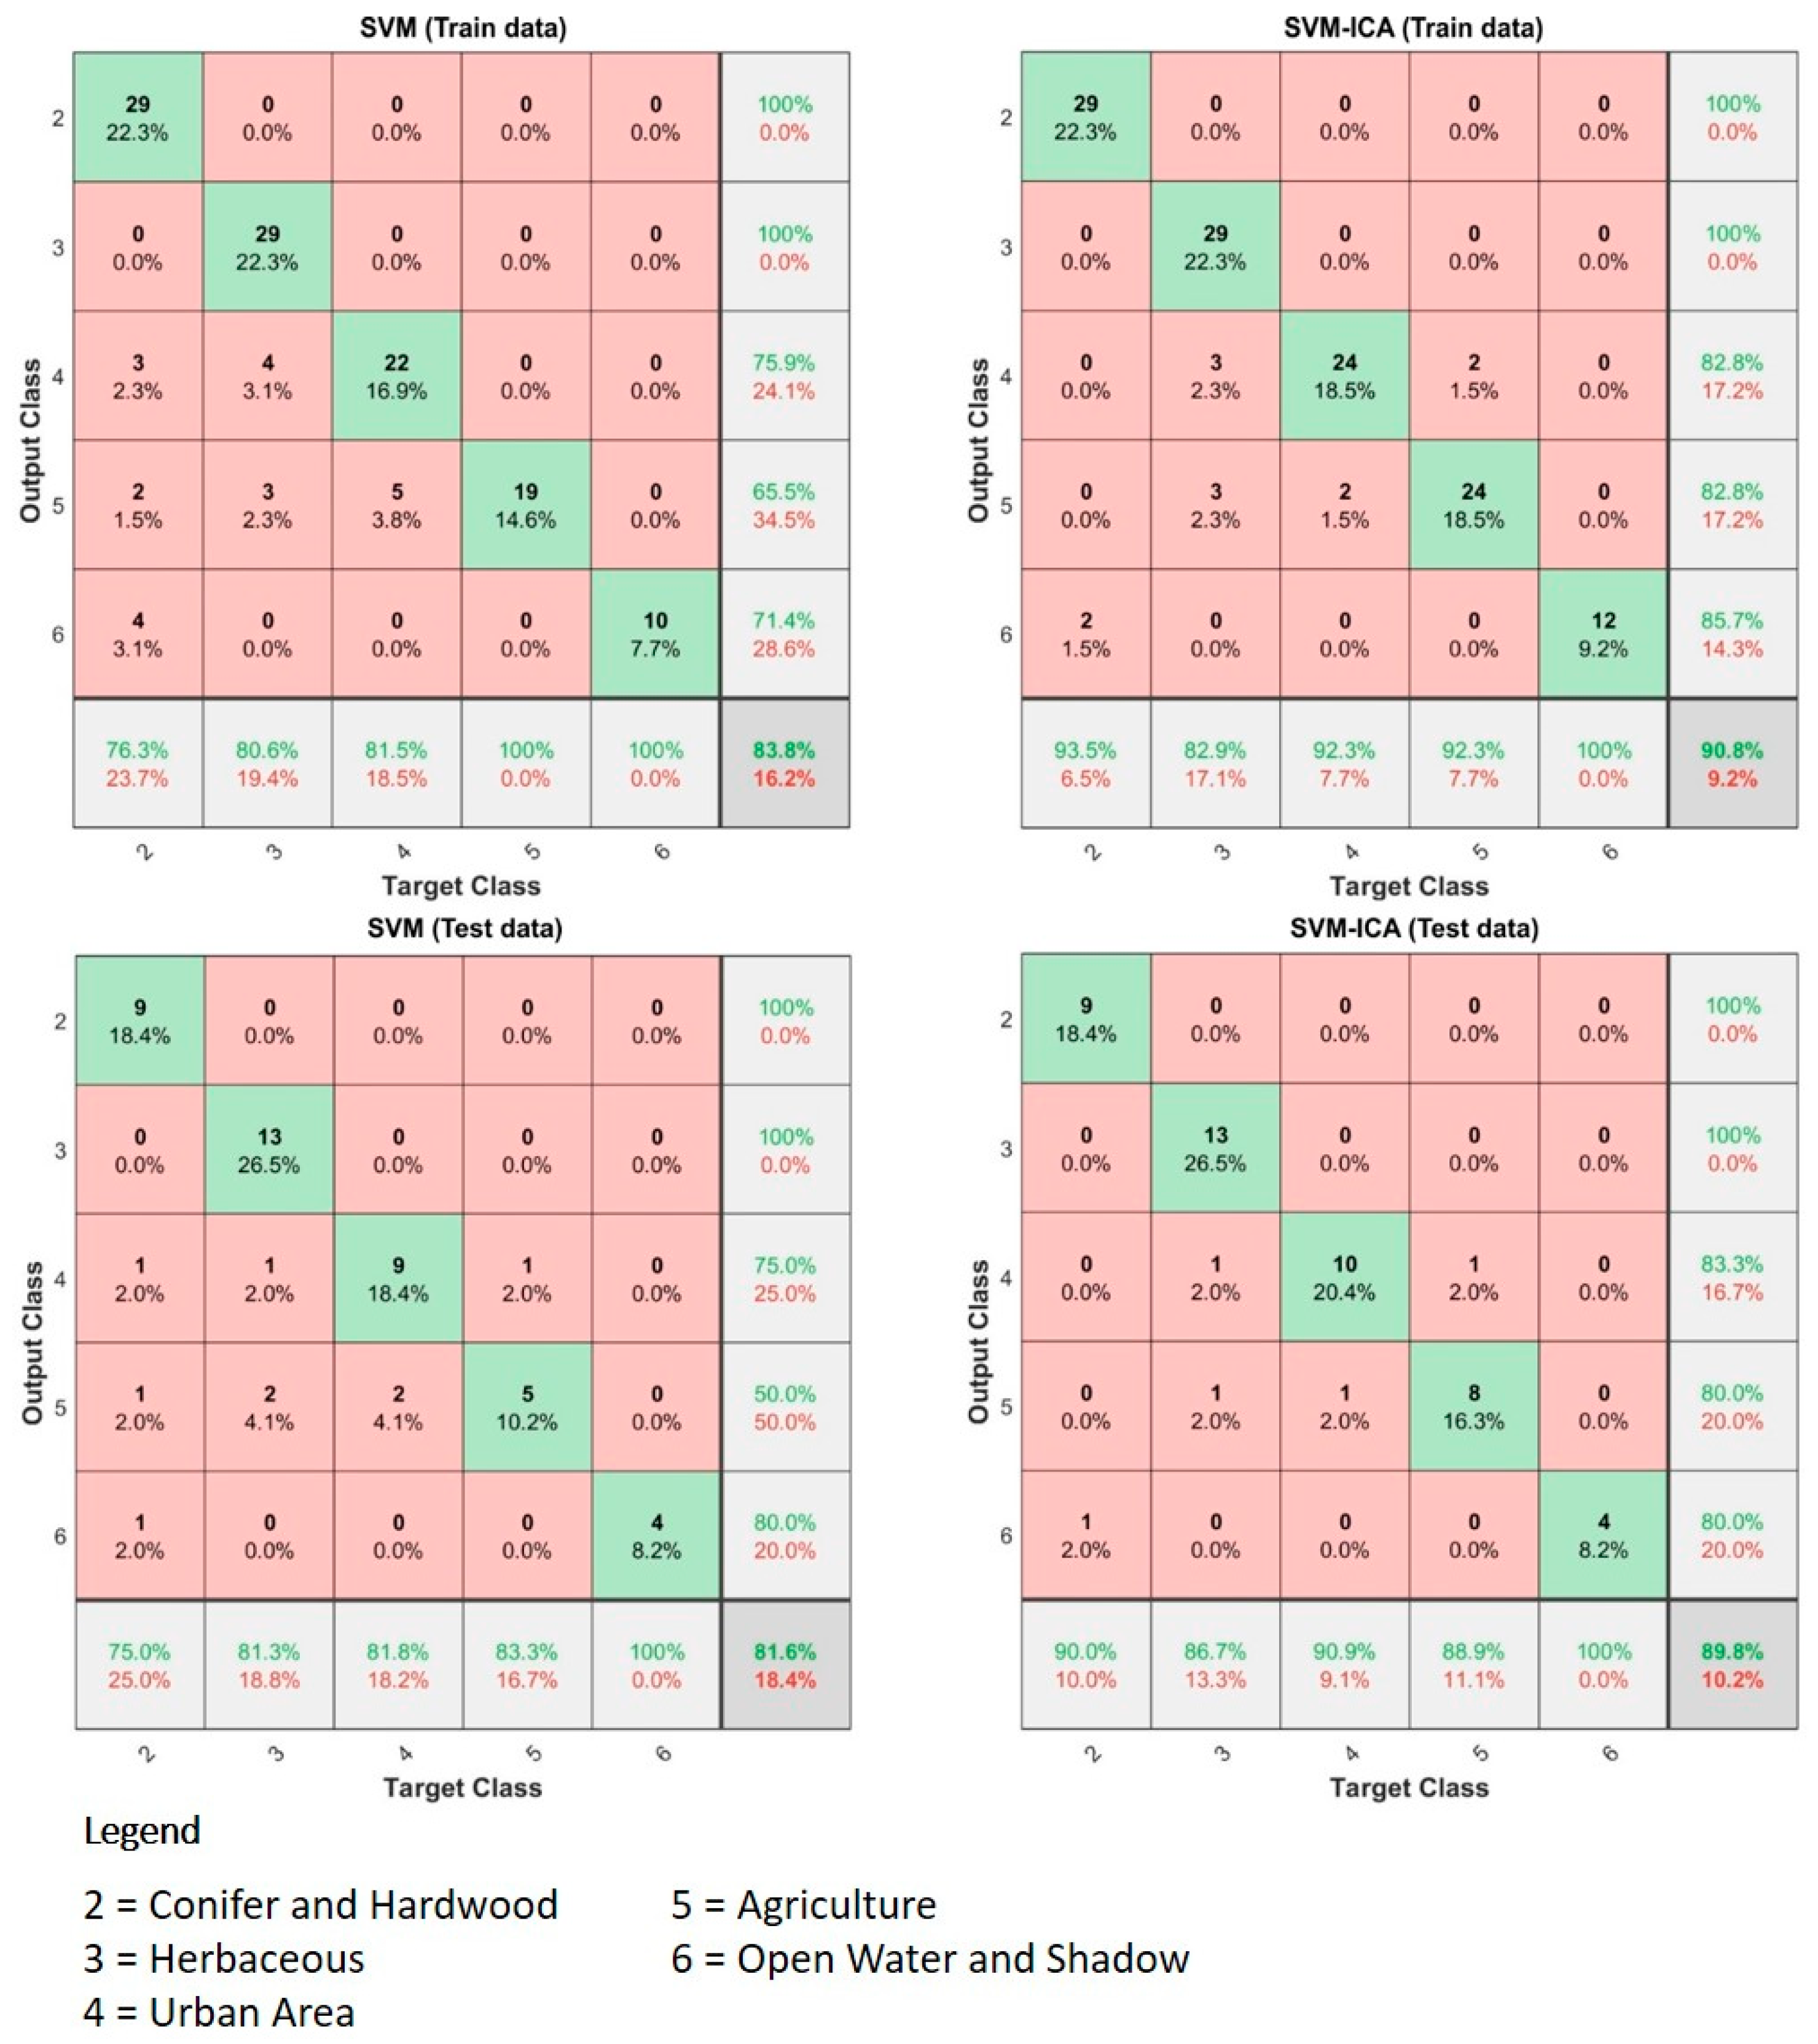
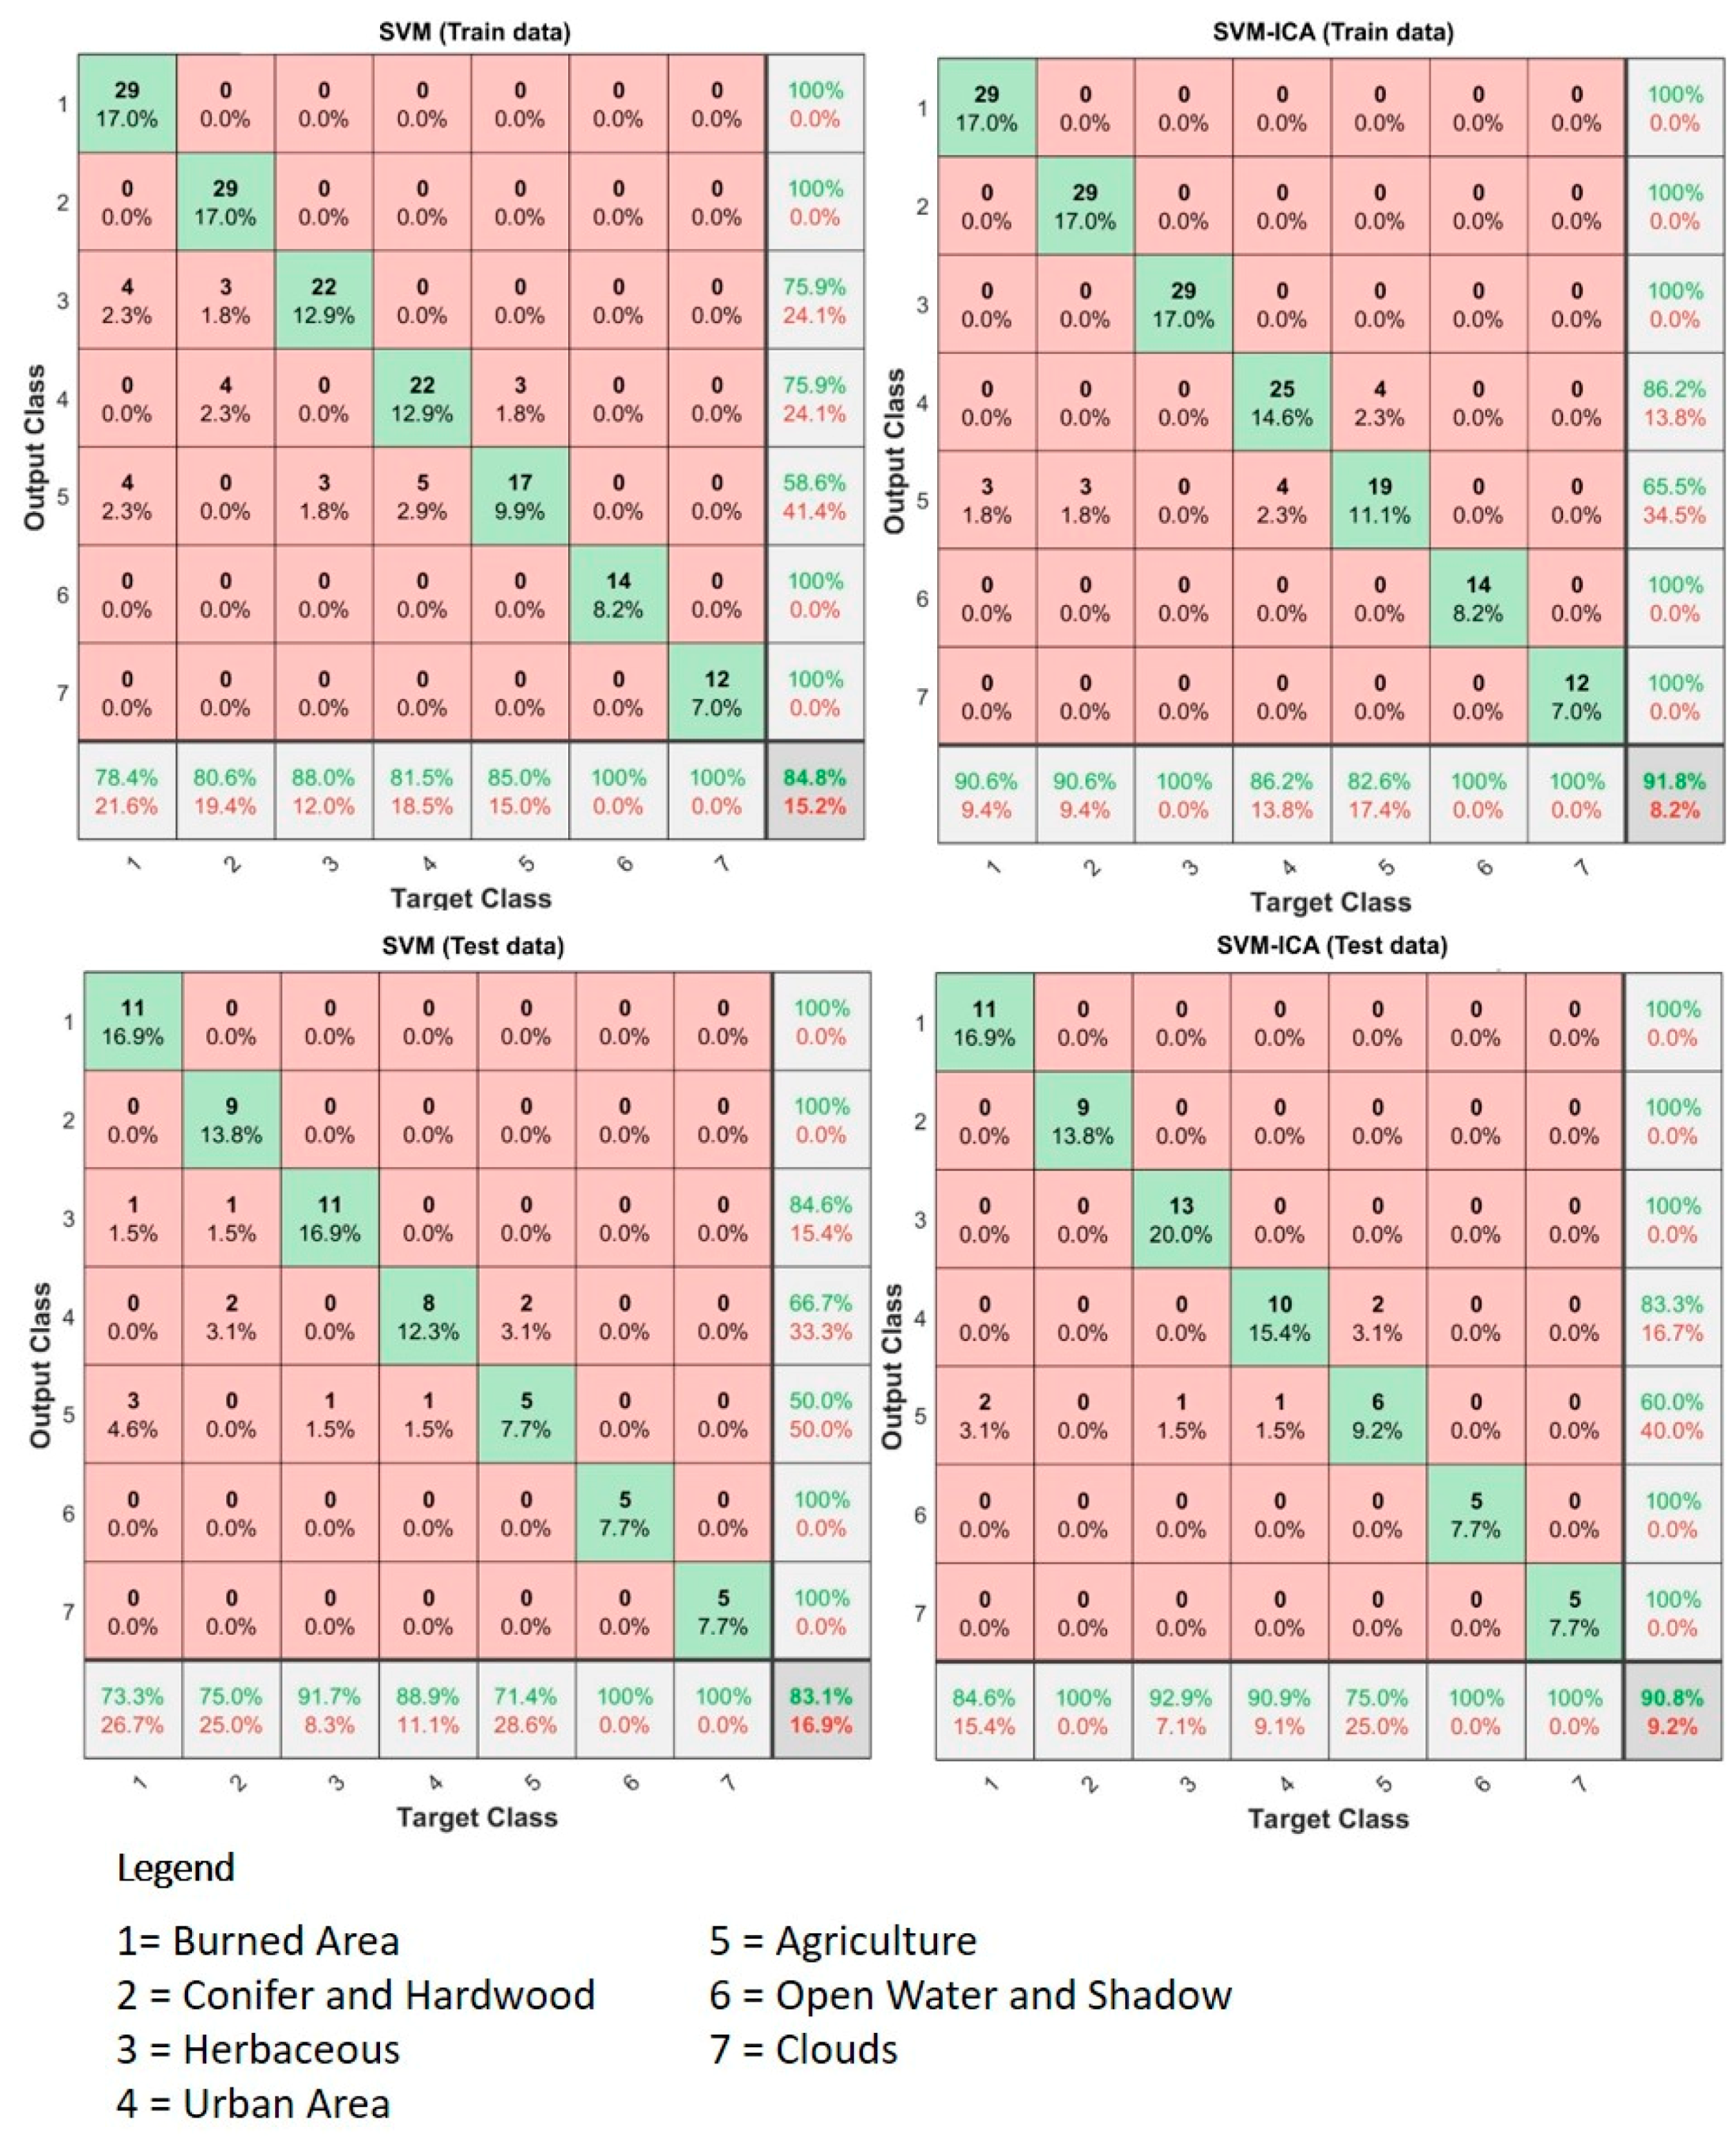
3.4. Accuracy Assessment

After the pre- and post-wildfire classification had been acquired from the Sentinel-2 imagery, an accuracy assessment was performed using the same data and method that were used for Landsat-8 accuracy assessment. In total, 65 pixels were used as the test data to generate the SVM and SVM–ICA accuracy assessments. The test data were acquired using the stratified random sampling method and assessed on a pixel-by-pixel basis using the error matrices method. Overall accuracy and kappa coefficient data were acquired from the error matrices of each map generated. The accuracy results for SVM and SVM–ICA are shown in Figure 11 and Figure 12, respectively.
According to the accuracy assessments of the two algorithms, the overall accuracy and kappa coefficient indicated generally accurate results. However, the SVM–ICA results, with higher overall accuracy and kappa coefficient, were superior to the SVM results. The pre-wildfire overall accuracy and kappa coefficient from the SVM algorithm reached 83.3% and 0.794 while those for the SVM–ICA were 90.8% and 0.883, respectively. The post-wildfire accuracy results also show that SVM-ICA superior to the maps classified by SVM classifier. On the post-wildfire results, SVM-ICA overall accuracy and kappa coefficient reach 91.80% and 0.903, respectively, differ about 7.0% with the SVM classifier which achieve 84.80% for its overall accuracy and 0.82 for its kappa coefficient. According to the error matrices results, although the results of SVM–ICA were superior to the results from SVM, the SVM-ICA experienced misclassification as well. In SVM–ICA, some agriculture area was classified as burned area, conifer and hardwood class, and urban area. Because the accuracy assessment outcome was influenced by the classification outcome, misclassification of classes on the map also affected the overall accuracy and kappa coefficient results. A discussion of accuracy assessment is presented in the next section (Section 4).

4. Discussion

There was a need to classify the burned area from the Camp Fire wildfire in Butte County. By collecting data from Landsat-8 and Sentinel-2, pre- and post-wildfire maps were generated. Two methods of classification were used to produce the pre- and post-wildfire maps: the SVM algorithm and the SVM–ICA algorithm, which is considered a novel method for mapping burned area, especially in regions of California. To characterize the accuracies of these two methods, an accuracy assessment was performed. The two satellite imageries were trained and tested and satisfactory results were obtained.
In general, the SVM and SVM–ICA models successfully distinguished the classes whether in pre- and post-wildfire events, especially the burned area in the post-fire occurrence from other classes in the study area. By comparing the results from both satellite imageries, the hybrid algorithm (SVM–ICA) was superior to the SVM algorithm. For the pre-fire by Landsat-8 results, the SVM and SVM–ICA differed by 3.8% in overall accuracy and 0.05 in kappa coefficient; for the Sentinel-2 results, the SVM and SVM–ICA differed by 7.0% in overall accuracy and 0.09 in kappa coefficient. For the post-fire by Landsat-8 results, the SVM and SVM-ICA differed by 4.7% and 0.06 in overall accuracy and kappa coefficient, respectively; for the Sentinel-2 results, the SVM and SVM-ICA differed by 7.0% in overall accuracy and 0.08 in kappa coefficient. Other studies that compared SVM and SVM–ICA have shown that the hybrid algorithm produces better results than the non-hybrid algorithm [36]. Because the hybrid algorithm could choose a suitable feature on the algorithm parameter, SVM–ICA could generate more precise results than SVM for the post-wildfire map. Furthermore, despite the cloudy condition of the satellite imagery, SVM–ICA could distinguish the burned area among the classes.
The total burned area was compared with the results from WERT (2018), which attained a total burned area of 62,052 ha, or 620,520,000 m2; this was considerably different from the Landsat-8 and Sentinel-2 results. The total burned area from both satellite data detected by SVM and SVM-ICA ranged from 194,759,857 m2 to 200,055,754 m2 for Sentinel-2, and 354,256,787 m2 to 376,689,003 m2 for Landsat-8. The differences of the total burned areas between the WERT report and this study is due to various factors, e.g., misclassifications, different date acquirements, and the approach used to calculate the burned area. According to the WERT report, it used a different classification method and acquisition date, which impacted the total area result. WERT used burned area reflectance classification to classify maps acquired from Sentinel-2 data for the pre-wildfire condition (October 11, 2018) and the post-wildfire condition (November 18, 2018). The date of acquisition, especially for the post-wildfire condition, is an important consideration. Since the acquired dates that can be accessed publicly from Landsat-8 and Sentinel-2 were 1 month after containment had been achieved, we assumed that the burned area would not be as wide as at the containment date. The containment date is November 25, 2018, while this study acquired the satellite data from December 26, 2018 (Landsat-8) and December 31, 2018 (Sentinel-2). Moreover, affected houses were classified as urban area, resulting in a smaller total burned area than in the WERT report.
Additionally, by considering the accuracies from SVM and SVM–ICA, several aspects of the differences in Landsat-8 and Sentinel-2 results can be explored. For example, in the classifying process, some areas had a similar spectral that confused the classifier when determining the output class such as the hardwood class that is similar to agriculture area, or the open water from paddy rice field (agriculture) that recognized as urban area. This problem presented a challenge for classification of the optical image using a pixel-by-pixel based method. In addition, differences in date influenced the differences between the Landsat-8 and Sentinel-2 results.
The availability and cloud cover factor of the satellite imagery used were likely to have affected the acquisition of soil or vegetation data by the satellite. The late date of acquisition, relative to event occurrence, indicates that conditions may differ from those initially after the wildfire. Because of these limitations, improved materials are needed for future studies. Nevertheless, this study is relevant and the findings are applicable for other scenarios in other regions because the data used are freely accessible.

5. Conclusions

The results of this study demonstrate that the methods used, SVM and SVM–ICA, could reveal the burned area map for the Camp Fire wildfire. SVM–ICA attained a higher accuracy (overall accuracies of 90.80% for pre-fire and 91.80% for post-fire), compared with SVM (83.80% for pre-fire and 84.80% for post-fire) for the Sentinel-2. Moreover, for Landsat-8, the SVM-ICA attained a higher accuracy than the SVM algorithm, with an overall accuracy of 83.80% for the pre-fire, and 83.60% for post-fire, while the SVM accuracy was 80.00% for the pre-fire and 78.90% for the post-fire. Notably, the satellite data and classifier used influenced the results of classification and accuracy. The burned area map is an essential tool in disaster assessment after a wildfire. Therefore, the results of this study are expected to be useful for planners, researchers, and policymakers as a basis for studying the occurrence of the Camp Fire wildfire and developing mitigation and evacuation plans to minimize the severity of such hazards in the future. Although the results successfully mapped the burned area for the purposes of mitigation and evacuation, a different method might be preferable in future studies to achieve the most effective mapping classification of burned area, especially in a Mediterranean area such as California. Further research pertaining to mapping and prediction of wildfire severity or danger should be applied to other wildfire disasters in other regions or decades, particularly in California, USA, which has been highly susceptible to wildfire disasters in recent decades.

Author Contributions

Conceptualization, C.-W.L. and M.S.; methodology, C.-W.L., M.S., and M.P.; software, M.S., M.P.; validation, C.-W.L., M.S., and M.P.; formal analysis, M.S.; investigation, C.-W.L.; resources, M.P.; data curation, M.P.; writing—original draft preparation, M.S.; writing—review and editing, M.S.; visualization, C.-W.L.; supervision, C.-W.L.; project administration, C.-W.L.; funding acquisition, C.-W.L. All authors have read and agreed to the published version of the manuscript.

Funding

This research was supported by a grant from the National Research Foundation of Korea provided by the government of Korea (No. 2019R1A2C1085686).

Conflicts of Interest

The authors declare no conflict of interest. The funders had no role in the design of the study; the collection, analyses, or interpretation of data; the writing of the manuscript, or the decision to publish the results.

References

  1. Westerling, A.L. Increasing western US forest wildfire activity: sensitivity to changes in the timing of spring. Philos. Trans. R. Soc. B Biol. Sci. 2016, 371, 20150178. [Google Scholar] [CrossRef] [PubMed]
  2. WERT Camp Fire Watershed Emergency Response Team (WERT) Final Report. Available online: http://cdfdata.fire.ca.gov/pub/cdf/images/incidentfile2277_4330.pdf (accessed on 20 June 2019).
  3. BBC Number missing in US fire leaps to 631. Available online: https://www.bbc.com/news/world-us-canada-46230927 (accessed on 15 January 2019).
  4. Baldassari, E. Camp Fire death toll grows to 29, matching 1933 blaze as state’s deadliest. Available online: https://www.eastbaytimes.com/2018/11/11/crews-continue-to-battle-strong-winds-in-deadly-camp-fire/ (accessed on 15 January 2019).
  5. CNBC Deadly California wildfire now 100% contained after scorching 154,000 acres. Available online: https://www.cnbc.com/2018/11/25/deadly-california-wildfire-now-100percent-contained.html (accessed on 15 January 2019).
  6. Rogan, J.; Franklin, J. Mapping Wildfire Burn Severity in Southern California Forests and Shrublands Using Enhanced Thematic Mapper Imagery. Geocarto Int. 2001, 16, 91–106. [Google Scholar] [CrossRef]
  7. Catry, F.X.; Rego, F.C.; Bação, F.L.; Moreira, F. Modeling and mapping wildfire ignition risk in Portugal. Int. J. Wildl. Fire 2009, 18, 921–931. [Google Scholar] [CrossRef] [Green Version]
  8. Hood, S.M.; Smith, S.L.; Cluck, D.R. Predicting mortality for five California conifers following wildfire. For. Ecol. Manage. 2010, 260, 750–762. [Google Scholar] [CrossRef]
  9. Meddens, A.J.H.; Kolden, C.A.; Lutz, J.A. Detecting unburned areas within wildfire perimeters using Landsat and ancillary data across the northwestern United States. Remote Sens. Environ. 2016, 186, 275–285. [Google Scholar] [CrossRef]
  10. Miller, J.D.; Thode, A.E. Quantifying burn severity in a heterogeneous landscape with a relative version of the delta Normalized Burn Ratio (dNBR). Remote Sens. Environ. 2007, 109, 66–80. [Google Scholar] [CrossRef]
  11. Topaloğlu, R.H.; Sertel, E.; Musaoğlu, N. Assessment of classification accuracies of sentinel-2 and landsat-8 data for land cover / use mapping. Int. Arch. Photogramm. Remote Sens. Spat. Inf. Sci. 2016, 41, 1055–1059. [Google Scholar] [CrossRef]
  12. Vega-García, C.; Chuvieco, E. Applying Local Measures of Spatial Heterogeneity to Landsat-TM Images for Predicting Wildfire Occurrence in Mediterranean Landscapes. Landsc. Ecol. 2006, 21, 595–605. [Google Scholar] [CrossRef]
  13. Veraverbeke, S.; Verstraeten, W.W.; Lhermitte, S.; Goossens, R. Evaluating Landsat Thematic Mapper spectral indices for estimating burn severity of the 2007 Peloponnese wildfires in Greece. Int. J. Wildl. Fire 2010, 19, 558. [Google Scholar] [CrossRef] [Green Version]
  14. Wu, Z.; Middleton, B.; Hetzler, R.; Vogel, J.; Dye, D. Vegetation Burn Severity Mapping Using Landsat-8 and WorldView-2. Photogramm. Eng. Remote Sens. 2015, 81, 143–154. [Google Scholar] [CrossRef]
  15. Brewer, C.K.; Winne, J.C.; Redmond, R.L.; Opitz, D.W.; Mangrich, M.V. Classifying and Mapping Wildfire Severity. Photogramm. Eng. Remote Sens. 2005, 71, 1311–1320. [Google Scholar] [CrossRef] [Green Version]
  16. Hoque, M.A.-A.; Phinn, S.; Roelfsema, C.; Childs, I. Tropical cyclone disaster management using remote sensing and spatial analysis: A review. Int. J. Disaster Risk Reduct. 2017, 22, 345–354. [Google Scholar] [CrossRef] [Green Version]
  17. Pyle, D.M.; Mather, T.A.; Biggs, J. Remote sensing of volcanoes and volcanic processes: integrating observation and modelling – introduction. Geol. Soc. Lond. Spec. Publ. 2013, 380, 1–13. [Google Scholar] [CrossRef]
  18. Patel, D.P.; Srivastava, P.K. Flood Hazards Mitigation Analysis Using Remote Sensing and GIS: Correspondence with Town Planning Scheme. Water Resour. Manag. 2013, 27, 2353–2368. [Google Scholar] [CrossRef]
  19. Kennedy, R.E.; Andréfouët, S.; Cohen, W.B.; Gómez, C.; Griffiths, P.; Hais, M.; Healey, S.P.; Helmer, E.H.; Hostert, P.; Lyons, M.B.; et al. Bringing an ecological view of change to Landsat-based remote sensing. Front. Ecol. Environ. 2014, 12, 339–346. [Google Scholar] [CrossRef]
  20. Zhang, H.K.; Roy, D.P. Using the 500 m MODIS land cover product to derive a consistent continental scale 30 m Landsat land cover classification. Remote Sens. Environ. 2017, 197, 15–34. [Google Scholar] [CrossRef]
  21. Roy, D.P.; Wulder, M.A.; Loveland, T.R.; Woodcock, C.E.; Allen, R.G.; Anderson, M.C.; Helder, D.; Irons, J.R.; Johnson, D.M.; Kennedy, R.; et al. Landsat-8: Science and product vision for terrestrial global change research. Remote Sens. Environ. 2014, 145, 154–172. [Google Scholar] [CrossRef] [Green Version]
  22. Wang, Q.; Blackburn, G.A.; Onojeghuo, A.O.; Dash, J.; Zhou, L.; Zhang, Y.; Atkinson, P.M. Fusion of Landsat 8 OLI and Sentinel-2 MSI Data. IEEE Trans. Geosci. Remote Sens. 2017, 55, 3885–3899. [Google Scholar] [CrossRef] [Green Version]
  23. U.S. National Park Service Landsat 8 Helps Map Fires during Long, Busy Alaska Fire Season. Available online: https://www.nps.gov/articles/wildland-fire-landsat-8-helps-map-fires-alaska.htm (accessed on 18 December 2019).
  24. Roy, D.P.; Huang, H.; Boschetti, L.; Giglio, L.; Yan, L.; Zhang, H.H.; Li, Z. Landsat-8 and Sentinel-2 burned area mapping - A combined sensor multi-temporal change detection approach. Remote Sens. Environ. 2019, 231, 111254. [Google Scholar] [CrossRef]
  25. Huang, H.; Roy, D.; Boschetti, L.; Zhang, H.; Yan, L.; Kumar, S.; Gomez-Dans, J.; Li, J. Separability Analysis of Sentinel-2A Multi-Spectral Instrument (MSI) Data for Burned Area Discrimination. Remote Sens. 2016, 8, 873. [Google Scholar] [CrossRef] [Green Version]
  26. San-Miguel-Ayanz, J.; Pereira, J.M.C.; Boca, R.; Strobl, P.; Kucera, J.; Pekkarinen, A. Forest Fires in the European Mediterranean Region: Mapping and Analysis of Burned Areas. In Earth Observation of Wildland Fires in Mediterranean Ecosystems; Springer: Berlin/Heidelberg, Germany, 2009; pp. 189–203. [Google Scholar]
  27. Mallinis, G.; Koutsias, N. Comparing ten classification methods for burned area mapping in a Mediterranean environment using Landsat TM satellite data. Int. J. Remote Sens. 2012, 33, 4408–4433. [Google Scholar] [CrossRef]
  28. Ramesh, V.; Anbazhagan, S. Landslide susceptibility mapping along Kolli hills Ghat road section (India) using frequency ratio, relative effect and fuzzy logic models. Environ. Earth Sci. 2015, 73, 8009–8021. [Google Scholar] [CrossRef]
  29. Anbalagan, R.; Kumar, R.; Lakshmanan, K.; Parida, S.; Neethu, S. Landslide hazard zonation mapping using frequency ratio and fuzzy logic approach, a case study of Lachung Valley, Sikkim. Geoenvironmental Disasters 2015, 2, 6. [Google Scholar] [CrossRef] [Green Version]
  30. Keramitsoglou, I.; Kiranoudis, C.T.; Maiheu, B.; De Ridder, K.; Daglis, I.A.; Manunta, P.; Paganini, M. Heat wave hazard classification and risk assessment using artificial intelligence fuzzy logic. Environ. Monit. Assess. 2013, 185, 8239–8258. [Google Scholar] [CrossRef] [PubMed]
  31. Zare, M.; Pourghasemi, H.R.; Vafakhah, M.; Pradhan, B. Landslide susceptibility mapping at Vaz Watershed (Iran) using an artificial neural network model: a comparison between multilayer perceptron (MLP) and radial basic function (RBF) algorithms. Arab. J. Geosci. 2013, 6, 2873–2888. [Google Scholar] [CrossRef]
  32. Chen, W.; Zhang, S.; Li, R.; Shahabi, H. Performance evaluation of the GIS-based data mining techniques of best-first decision tree, random forest, and naïve Bayes tree for landslide susceptibility modeling. Sci. Total Environ. 2018, 644, 1006–1018. [Google Scholar] [CrossRef]
  33. Esfandiarpour-Boroujeni, I.; Karimi, E.; Shirani, H.; Esmaeilizadeh, M.; Mosleh, Z. Yield prediction of apricot using a hybrid particle swarm optimization-imperialist competitive algorithm- support vector regression (PSO-ICA-SVR) method. Sci. Hortic. (Amst.) 2019, 257, 108756. [Google Scholar] [CrossRef]
  34. Shao, Y.; Lunetta, R.S. Comparison of support vector machine, neural network, and CART algorithms for the land-cover classification using limited training data points. ISPRS J. Photogramm. Remote Sens. 2012, 70, 78–87. [Google Scholar] [CrossRef]
  35. Tien Bui, D.; Shahabi, H.; Shirzadi, A.; Chapi, K.; Hoang, N.-D.; Pham, B.; Bui, Q.-T.; Tran, C.-T.; Panahi, M.; Bin Ahmad, B.; et al. A Novel Integrated Approach of Relevance Vector Machine Optimized by Imperialist Competitive Algorithm for Spatial Modeling of Shallow Landslides. Remote Sens. 2018, 10, 1538. [Google Scholar] [CrossRef] [Green Version]
  36. Le, H.V.; Bui, Q.T.; Tien Bui, D.; Tran, H.H.; Hoang, N.D. A Hybrid Intelligence System Based on Relevance Vector Machines and Imperialist Competitive Optimization for Modelling Forest Fire Danger Using GIS | Le | JOURNAL OF ENVIRONMENTAL INFORMATICS. Available online: http://www.jeionline.org/index.php?journal=mys&page=article&op=view&path%5B%5D=201800404 (accessed on 18 November 2019).
  37. United States Cencus Bureau Population and Housing Unit Estimates. Available online: https://www.census.gov/programs-surveys/popest.html (accessed on 16 January 2019).
  38. U.S. Geological Survey Landsat 8 Data Users Handbook. Available online: https://www.usgs.gov/media/files/landsat-8-data-users-handbook (accessed on 18 November 2019).
  39. ESA Sentinel-2 User Handbook. Available online: https://sentinel.esa.int/documents/247904/685211/Sentinel-2_User_Handbook (accessed on 12 November 2019).
  40. Drusch, M.; Del Bello, U.; Carlier, S.; Colin, O.; Fernandez, V.; Gascon, F.; Hoersch, B.; Isola, C.; Laberinti, P.; Martimort, P.; et al. Sentinel-2: ESA’s Optical High-Resolution Mission for GMES Operational Services. Remote Sens. Environ. 2012, 120, 25–36. [Google Scholar] [CrossRef]
  41. Laine, J. Crop identification with Sentinel-2 satellite imagery in Finland. Available online: https://aaltodoc.aalto.fi/handle/123456789/33726 (accessed on 18 November 2019).
  42. Schmedtmann, J.; Campagnolo, M. Reliable Crop Identification with Satellite Imagery in the Context of Common Agriculture Policy Subsidy Control. Remote Sens. 2015, 7, 9325–9346. [Google Scholar] [CrossRef] [Green Version]
  43. Chen, W.; Pourghasemi, H.R.; Panahi, M.; Kornejady, A.; Wang, J.; Xie, X.; Cao, S. Spatial prediction of landslide susceptibility using an adaptive neuro-fuzzy inference system combined with frequency ratio, generalized additive model, and support vector machine techniques. Geomorphology 2017, 297, 69–85. [Google Scholar] [CrossRef]
  44. Vapnik, V.N. The Nature of Statistical Learning Theory; Springer: New York, NY, USA, 2000; ISBN 978-1-4419-3160-3. [Google Scholar]
  45. Vapnik, V.N. An overview of statistical learning theory. IEEE Trans. Neural Netw. 1999, 10, 988–999. [Google Scholar] [CrossRef] [PubMed] [Green Version]
  46. Choubin, B.; Moradi, E.; Golshan, M.; Adamowski, J.; Sajedi-Hosseini, F.; Mosavi, A. An ensemble prediction of flood susceptibility using multivariate discriminant analysis, classification and regression trees, and support vector machines. Sci. Total Environ. 2019, 651, 2087–2096. [Google Scholar] [CrossRef]
  47. Xu, C.; Dai, F.; Xu, X.; Lee, Y.H. GIS-based support vector machine modeling of earthquake-triggered landslide susceptibility in the Jianjiang River watershed, China. Geomorphology 2012, 145–146, 70–80. [Google Scholar] [CrossRef]
  48. Jaafari, A.; Pourghasemi, H.R. Factors Influencing Regional-Scale Wildfire Probability in Iran. In Spatial Modeling in GIS and R for Earth and Environmental Sciences; Elsevier: Amsterdam, The Netherlands, 2019; pp. 607–619. [Google Scholar]
  49. Bouaziz, M.; Wijaya, A.; Gloaguen, R. Remote gully erosion mapping using aster data and geomorphologic analysis in the Main Ethiopian Rift. Geo-Spat. Inf. Sci. 2011, 14, 246–254. [Google Scholar] [CrossRef]
  50. Deng, S.; Lin, S.Y.; Chang, W.L. Application of multiclass support vector machines for fault diagnosis of field air defense gun. Expert Syst. Appl. 2011, 38, 6007–6013. [Google Scholar] [CrossRef]
  51. Atashpaz-Gargari, E.; Lucas, C. Imperialist competitive algorithm: An algorithm for optimization inspired by imperialistic competition. In Proceedings of the 2007 IEEE Congress on Evolutionary Computation, CEC Singapore, Singapore, 25–28 September 2007; pp. 4661–4667. [Google Scholar]
  52. Jaafari, A.; Zenner, E.K.; Panahi, M.; Shahabi, H. Hybrid artificial intelligence models based on a neuro-fuzzy system and metaheuristic optimization algorithms for spatial prediction of wildfire probability. Agric. For. Meteorol. 2019, 266–267, 198–207. [Google Scholar] [CrossRef]
  53. Wang, Y.; Hong, H.; Chen, W.; Li, S.; Panahi, M.; Khosravi, K.; Shirzadi, A.; Shahabi, H.; Panahi, S.; Costache, R. Flood susceptibility mapping in Dingnan County (China) using adaptive neuro-fuzzy inference system with biogeography based optimization and imperialistic competitive algorithm. J. Environ. Manage. 2019, 247, 712–729. [Google Scholar] [CrossRef]
  54. Kim, C. Land use classification and land use change analysis using satellite images in Lombok Island, Indonesia. For. Sci. Technol. 2016, 12, 183–191. [Google Scholar] [CrossRef]
  55. Foody, G.M. Status of land cover classification accuracy assessment. Remote Sens. Environ. 2002, 80, 185–201. [Google Scholar] [CrossRef]
  56. Congalton, R.G. A review of assessing the accuracy of classifications of remotely sensed data. Remote Sens. Environ. 1991, 37, 35–46. [Google Scholar] [CrossRef]
  57. FRAP Landcover: California Wildlife Habitat Relationships System Types. Available online: https://frap.fire.ca.gov/media/10311/fveg_19_ada.pdf (accessed on 1 December 2019).
  58. Smits, P.C.; Dellepiane, S.G.; Schowengerdt, R.A. Quality assessment of image classification algorithms for land-cover mapping: A review and a proposal for a cost-based approach. Int. J. Remote Sens. 1999, 20, 1461–1486. [Google Scholar] [CrossRef]
  59. Foody, G. Thematic map comparison: Evaluating the statistical significance of differences in classification accuracy. Photogramm. Eng. Remote Sens. 2004, 627–633. [Google Scholar] [CrossRef]
  60. Kadavi, P.R.; Lee, C.-W. Land cover classification analysis of volcanic island in Aleutian Arc using an artificial neural network (ANN) and a support vector machine (SVM) from Landsat imagery. Geosci. J. 2018, 22, 653–665. [Google Scholar] [CrossRef]
  61. Cohen, J. A Coefficient of Agreement for Nominal Scales. Educ. Psychol. Meas. 1960, 20, 37–46. [Google Scholar] [CrossRef]
  62. Congalton, R.G.; Green, K. Assessing the Accuracy of Remotely Sensed Data; CRC Press: New York, NY, USA, 1999; ISBN 9780429143977. [Google Scholar]
  63. Halmy, M.W.A.; Gessler, P.E.; Hicke, J.A.; Salem, B.B. Land use/land cover change detection and prediction in the north-western coastal desert of Egypt using Markov-CA. Appl. Geogr. 2015, 63, 101–112. [Google Scholar] [CrossRef]
Figure 1. Maps of Butte County, California, United States of America, where the Camp Fire wildfire burned for 17 days, from November 8 to November 25: (a) location of Butte County in relation to the city of Los Angeles and (b) image of Butte County from Sentinel-2 data acquired on November 11, 2018.
Remotesensing 12 00623 g001
Figure 2. Pre- and post-wildfire event satellite imagery in false color combination captured by Landsat-8 (a) on September 21, 2018, (b) on December 26, 2018, and Sentinel-2 (c) on November 6, 2018, and (d) on December 31, 2018.
Remotesensing 12 00623 g002
Figure 3. Workflow diagram of the pre- and post-wildfire mapping using SVM and SVM-ICA algorithms for Camp Fire occurrence. Along with the pre- and post-classification maps, an accuracy assessment was done for each map generated from this study.
Remotesensing 12 00623 g003
Figure 4. The most significant margin for the optimal linear classifier (hyperplane), modified from Deng et al. [50].
Remotesensing 12 00623 g004
Figure 5. Changing a nonlinear separation to a linear separation in feature space, modified from Deng et al. [50].
Remotesensing 12 00623 g005
Figure 6. Flowchart of ICA modified from Atashpaz-Gargari amd Lucas [51].
Remotesensing 12 00623 g006
Figure 7. Results of the SVM and SVM–ICA classifications from the Landsat-8 imagery of the Camp Fire wildfire: (a) SVM pre-wildfire map, (b) SVM post-wildfire map, (c) SVM–ICA pre-wildfire map, and (d) SVM–ICA post-wildfire map. The pre- and post-wildfire data were acquired on September 21, 2018 and December 26, 2018 respectively.
Remotesensing 12 00623 g007
Figure 8. Overall accuracy of SVM and SVM-ICA results for classifying pre-wildfire occurrence from the Landsat-8 images.
Remotesensing 12 00623 g008
Figure 9. Overall accuracy of SVM results for classifying post-wildfire occurrence from the Landsat-8 images.
Remotesensing 12 00623 g009
Figure 10. Classification results from the Sentinel-2 imagery of the Camp Fire wildfire using SVM classifier for (a) pre-wildfire occurrence, (b) post-wildfire occurrence, and using the SVM–ICA for (c) pre-wildfire occurrence, and (d) post-wildfire occurrence. The pre- and post-wildfire data were acquired on November 6, 2018 and December 31, 2018.
Remotesensing 12 00623 g010
Figure 11. Overall accuracy of the pre-wildfire classification by SVM and SVM-ICA from Sentinel-2 images.
Remotesensing 12 00623 g011
Figure 12. Overall accuracy of the post-wildfire classification by SVM and SVM–ICA from Sentinel-2 images.
Remotesensing 12 00623 g012

