Evaluation of Environmental Moisture from NWP Models with Measurements from Advanced Geostationary Satellite Imager—A Case Study

 , and
, and
Abstract
:
1. Introduction
- How to evaluate moisture in the environment from NWP models using the new GEO satellite imager data?
- How does satellite data assimilation (DA) improve the moisture forecasts in the environment?
- How are the forecasts of moisture in the environment associated with TC’s track and intensity forecasts in NWP models?
2. Data and Methodologies
2.1. NWP Models
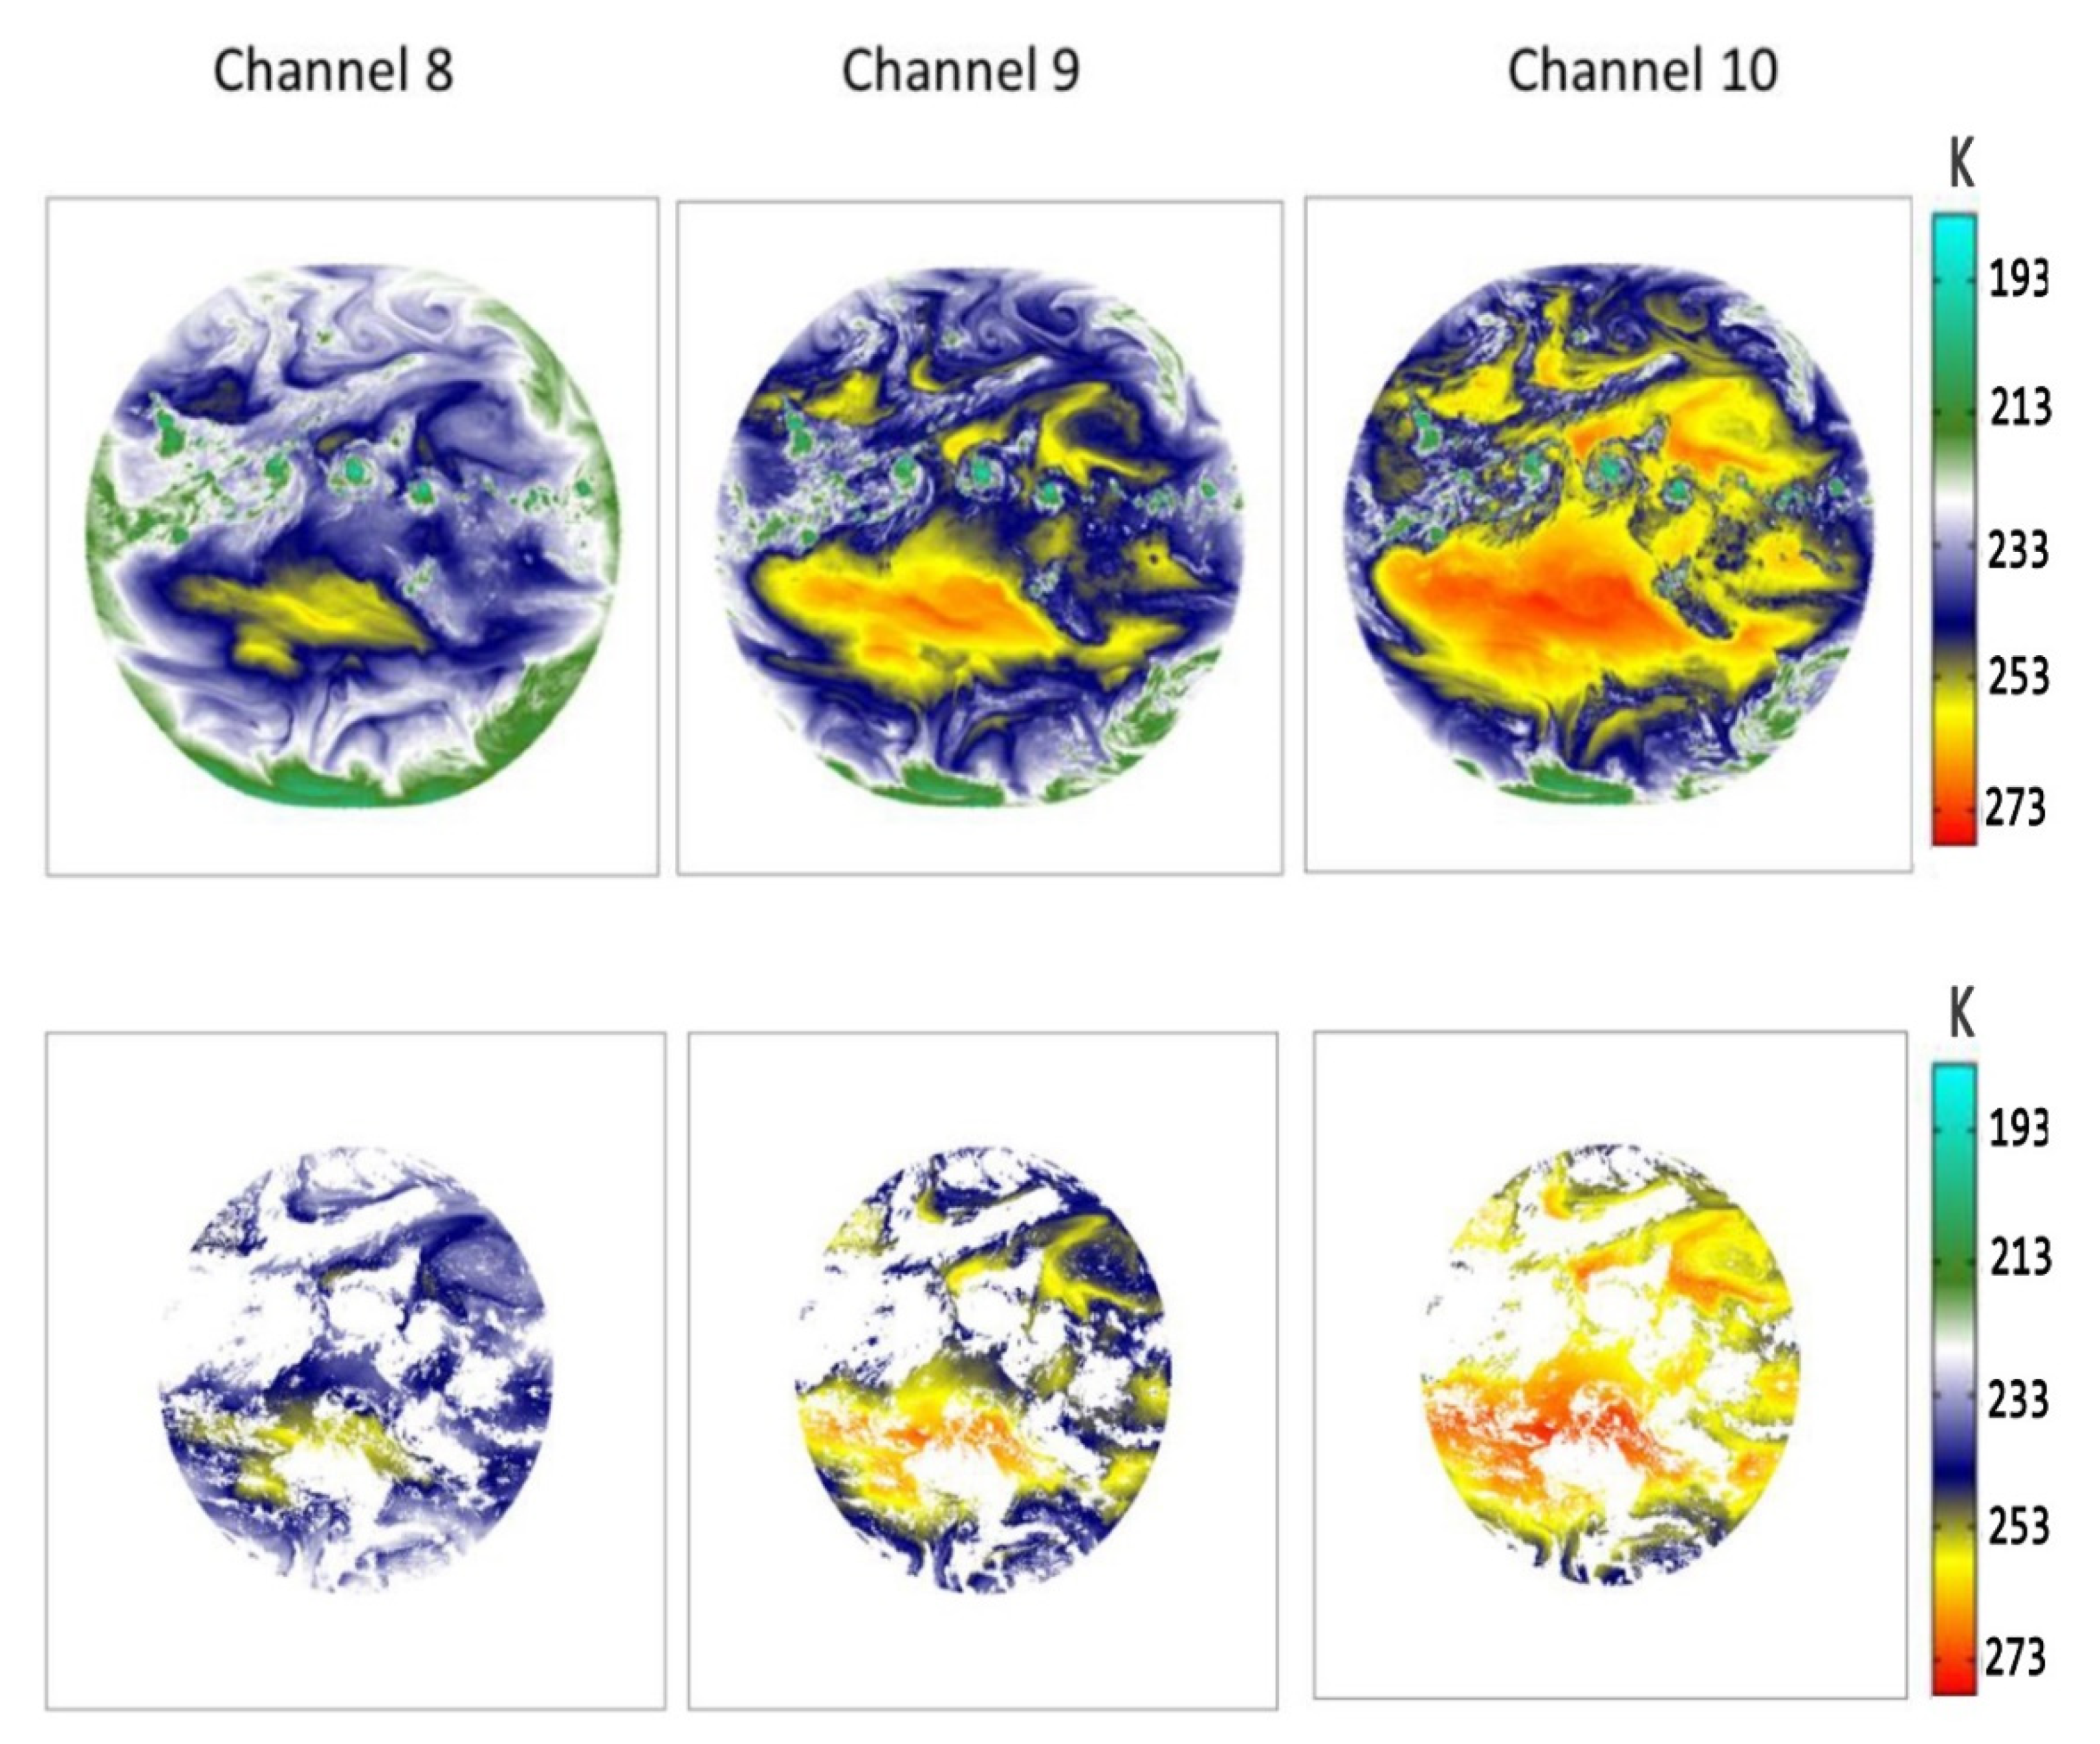
2.2. AHI Data
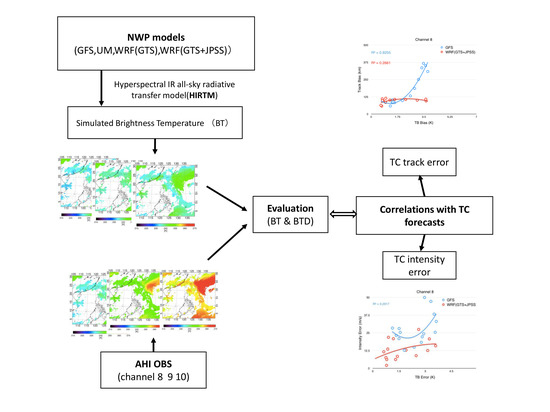
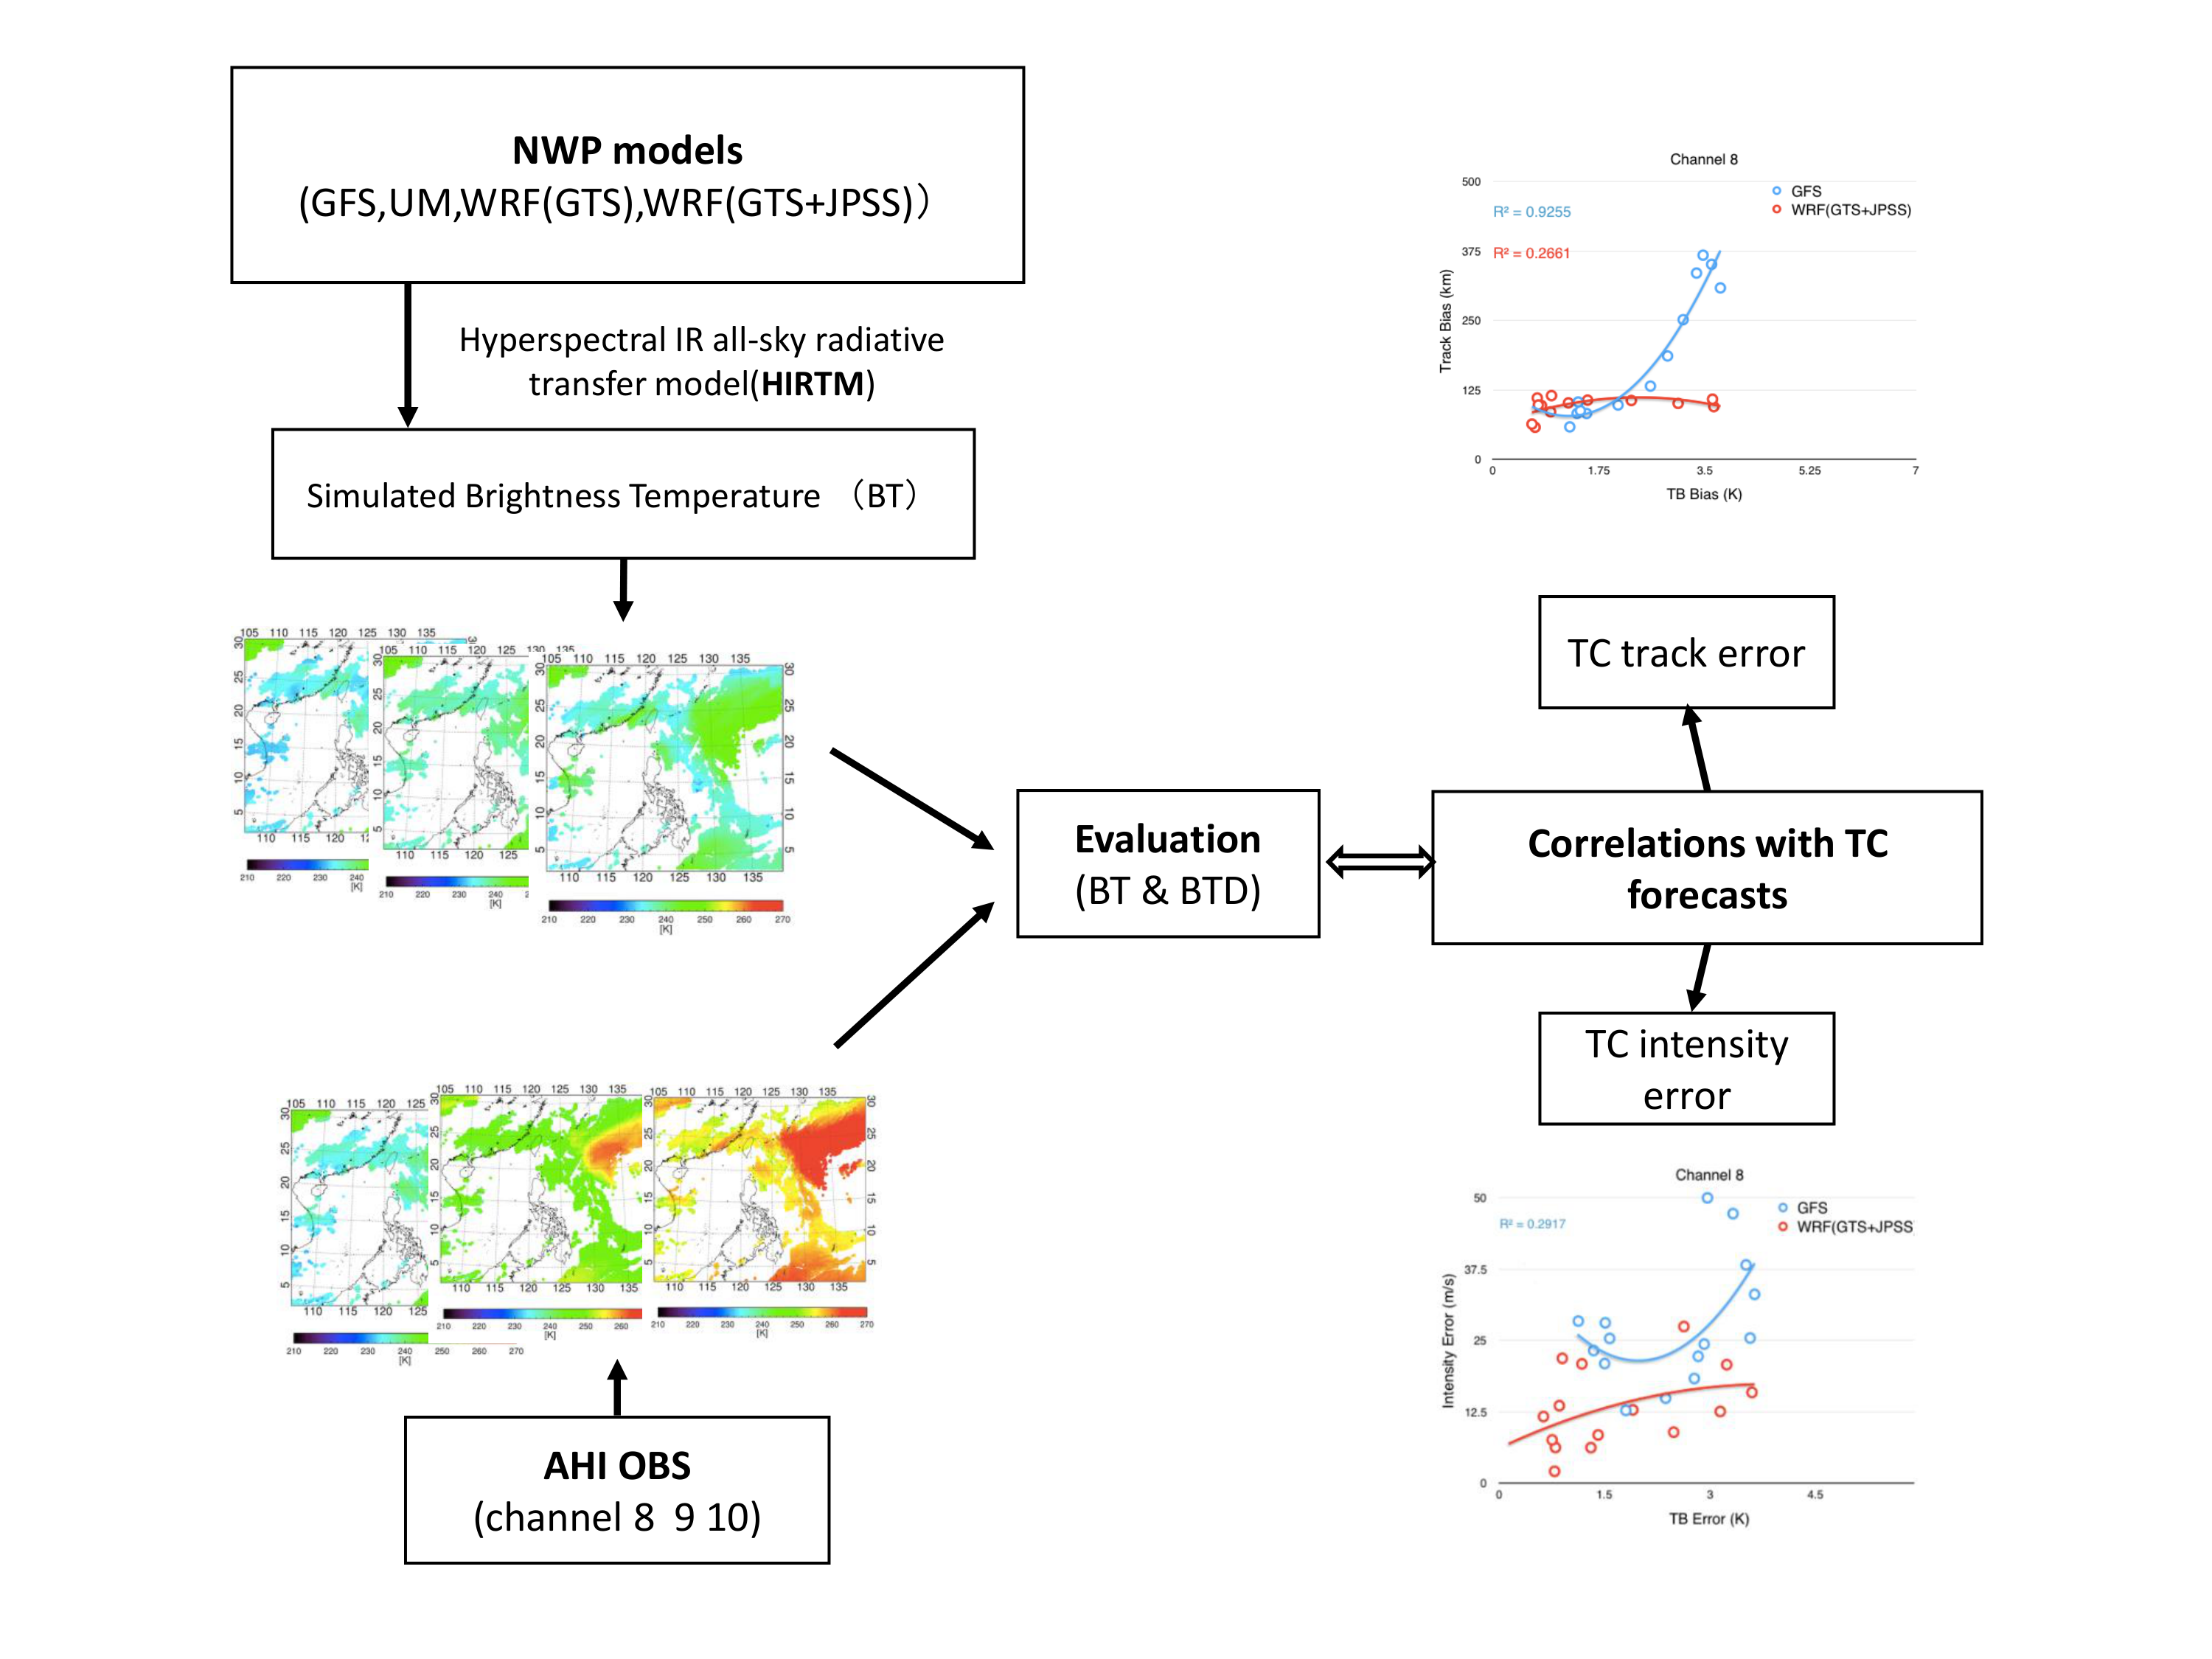
2.3. Methodologies
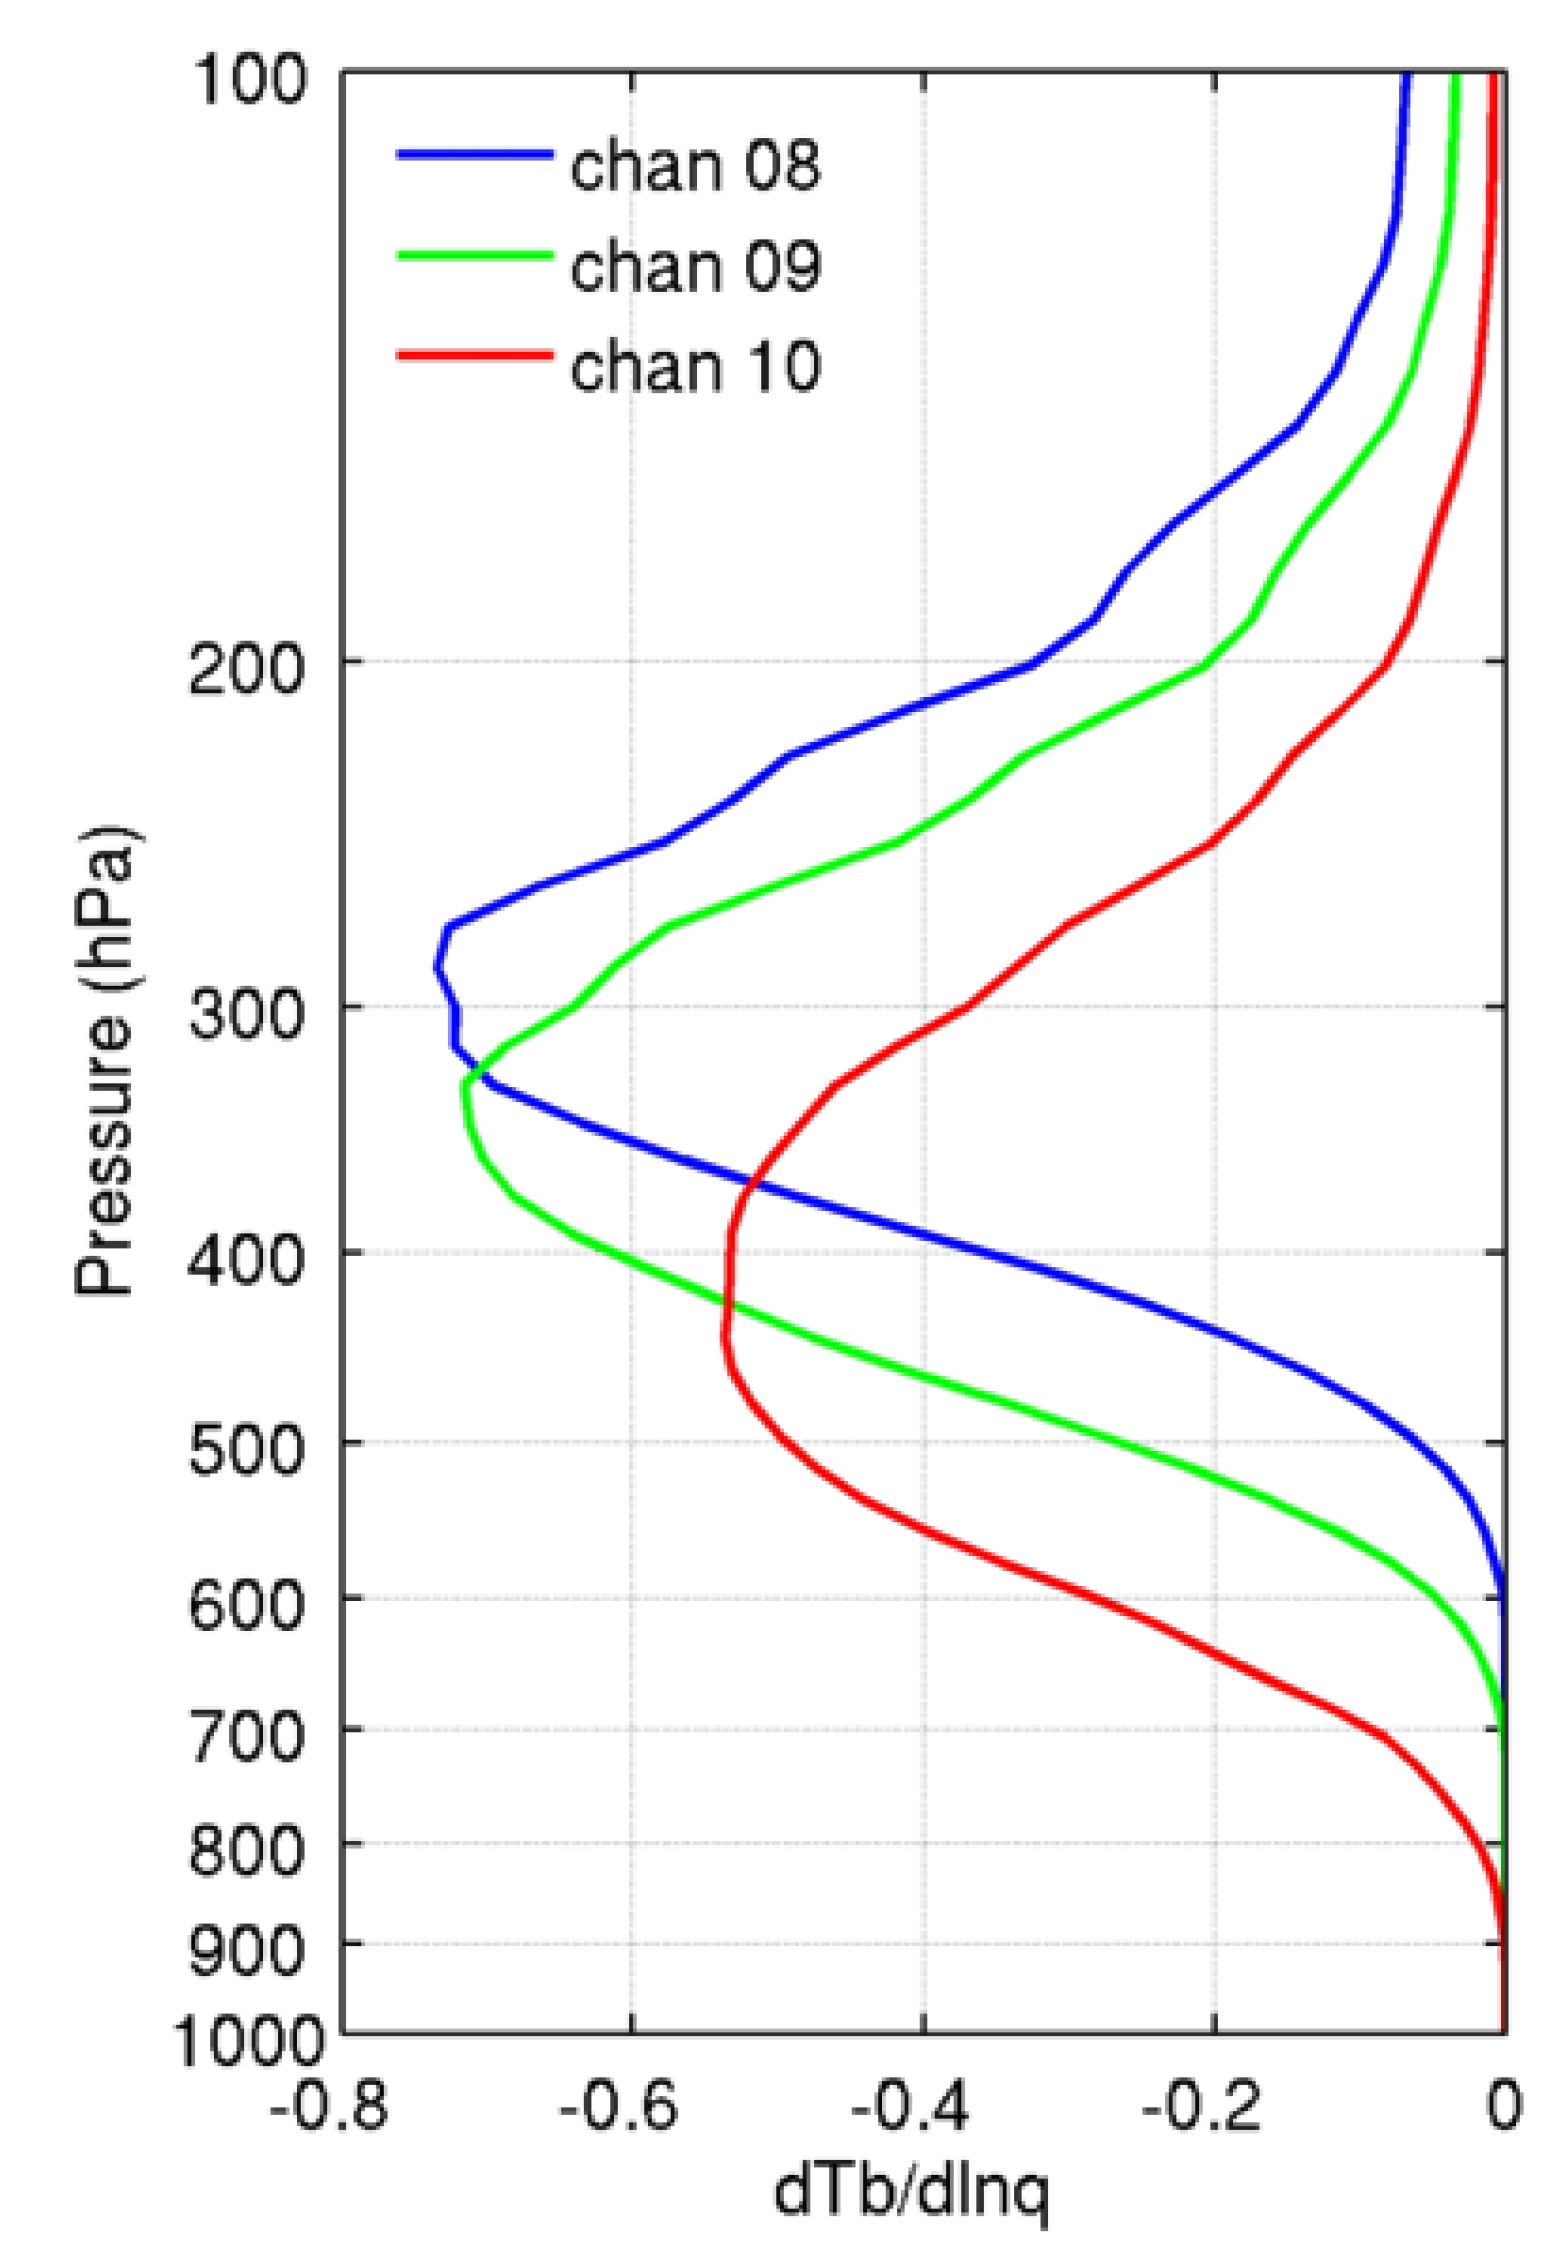
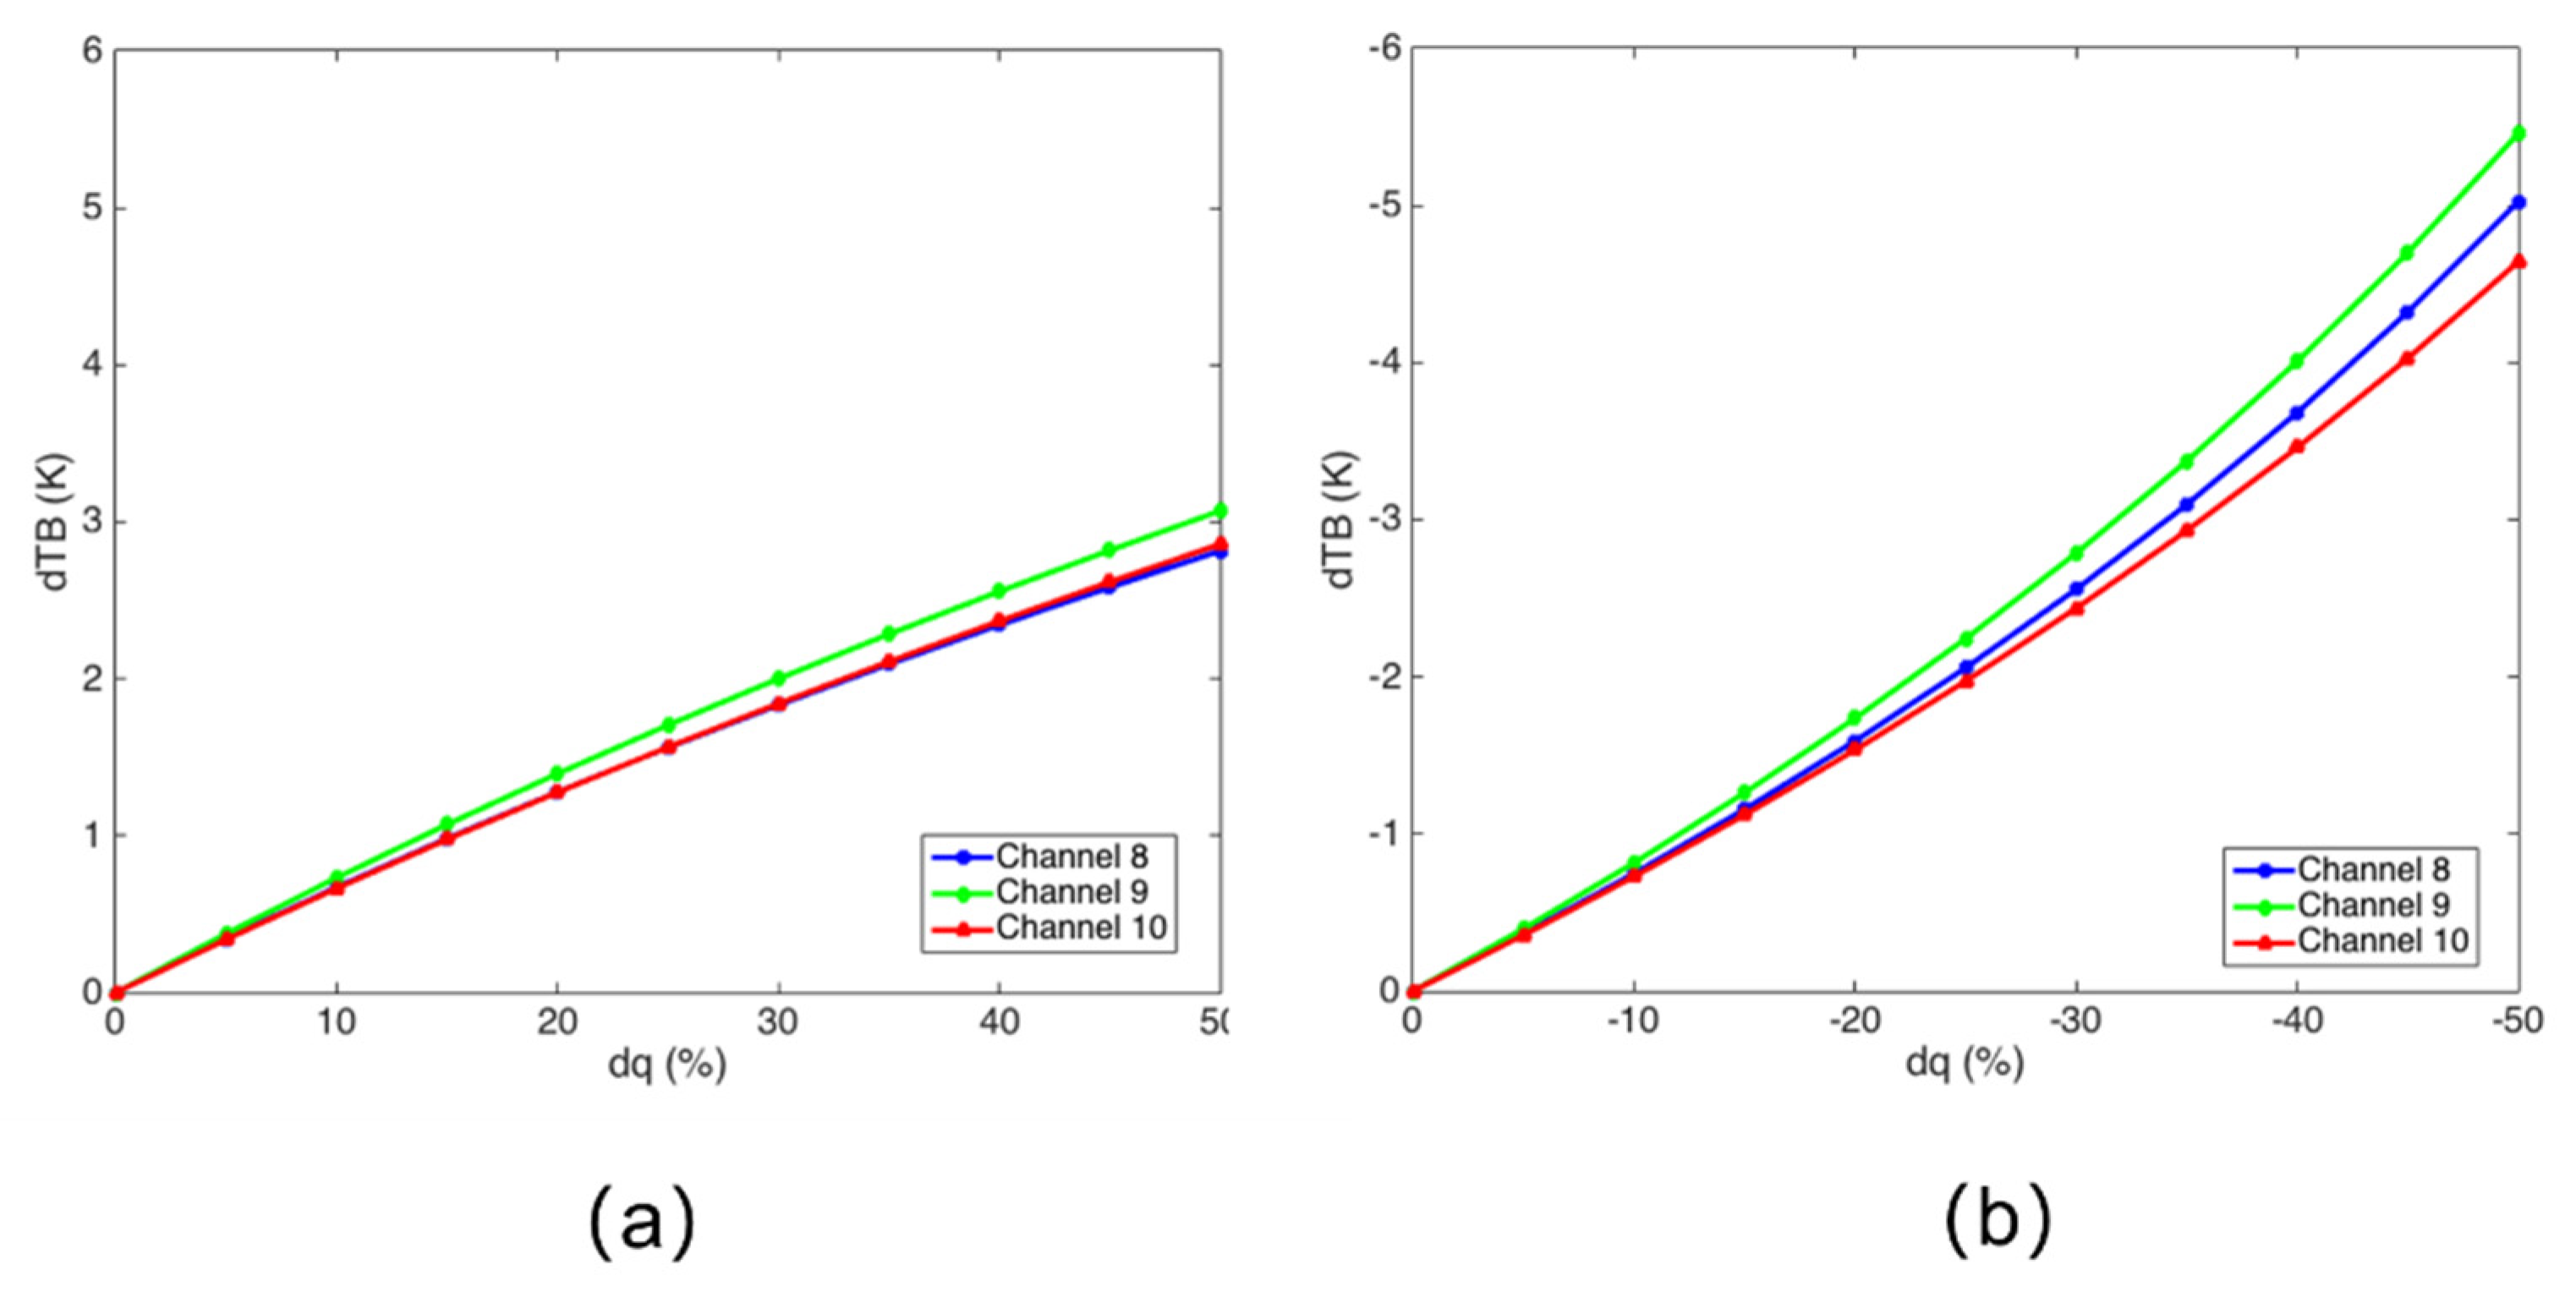
2.4. Sensitivity Study
3. Results
3.1. NWP Models Assessment
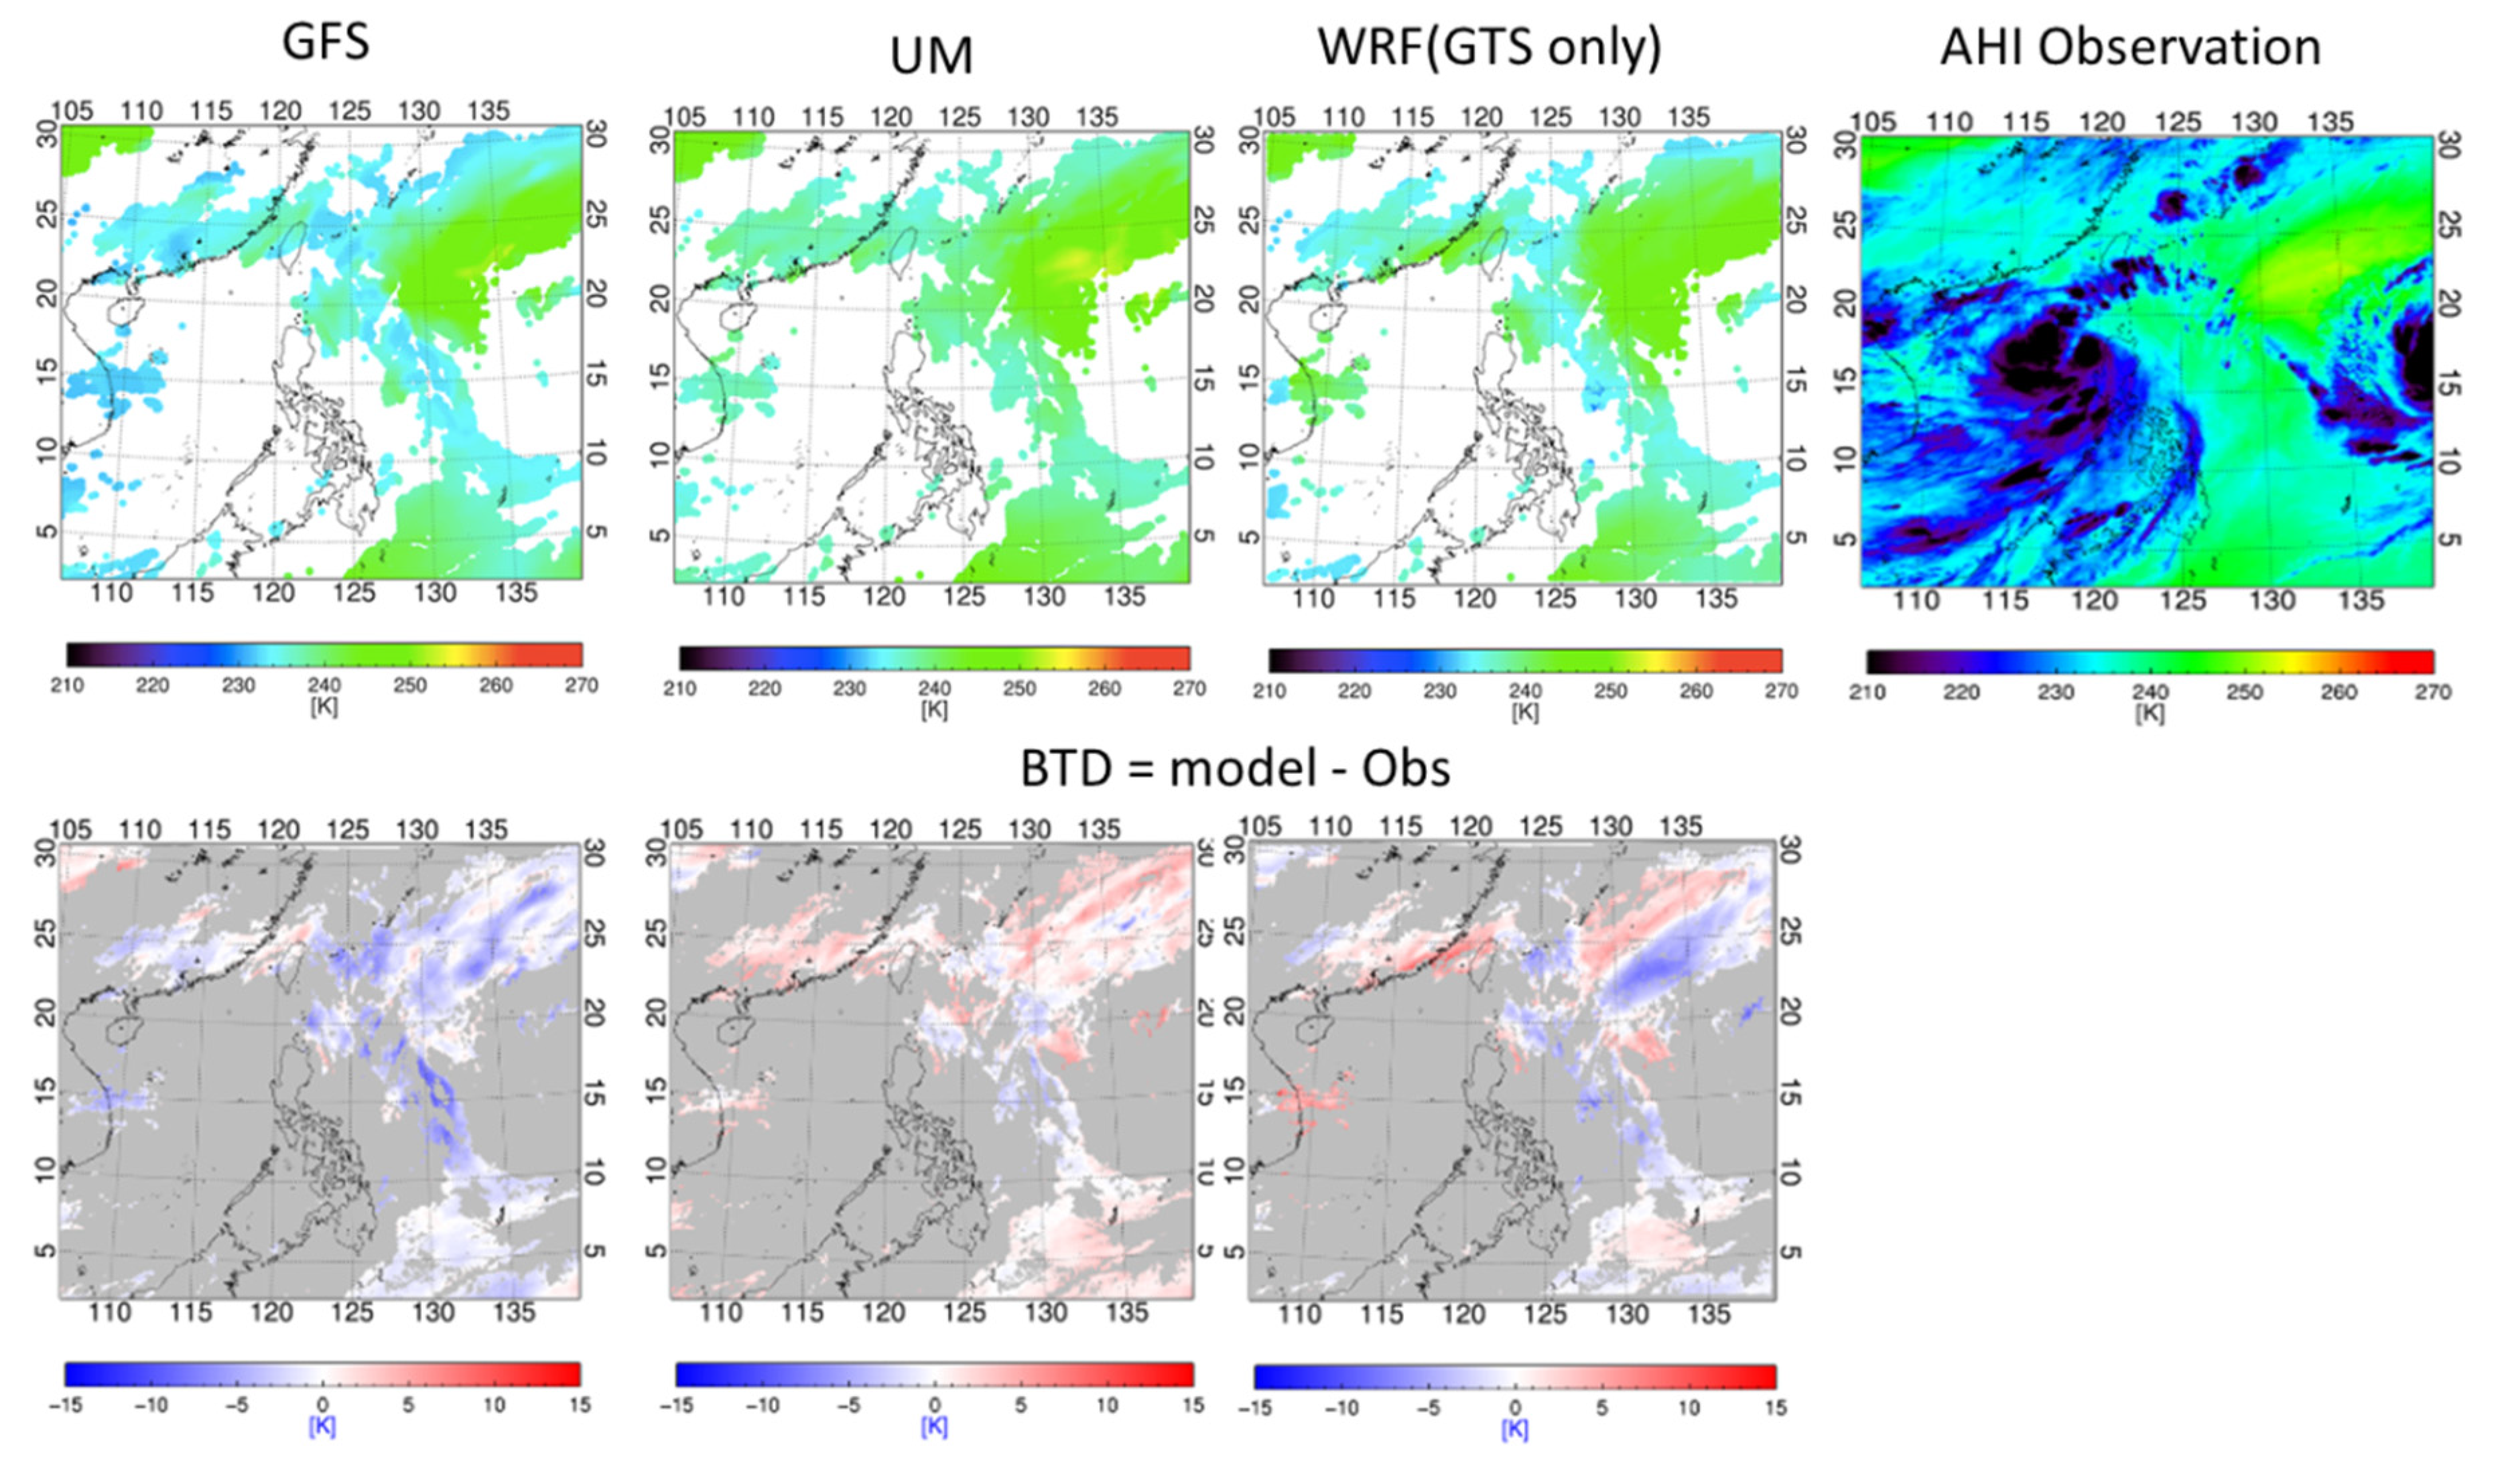
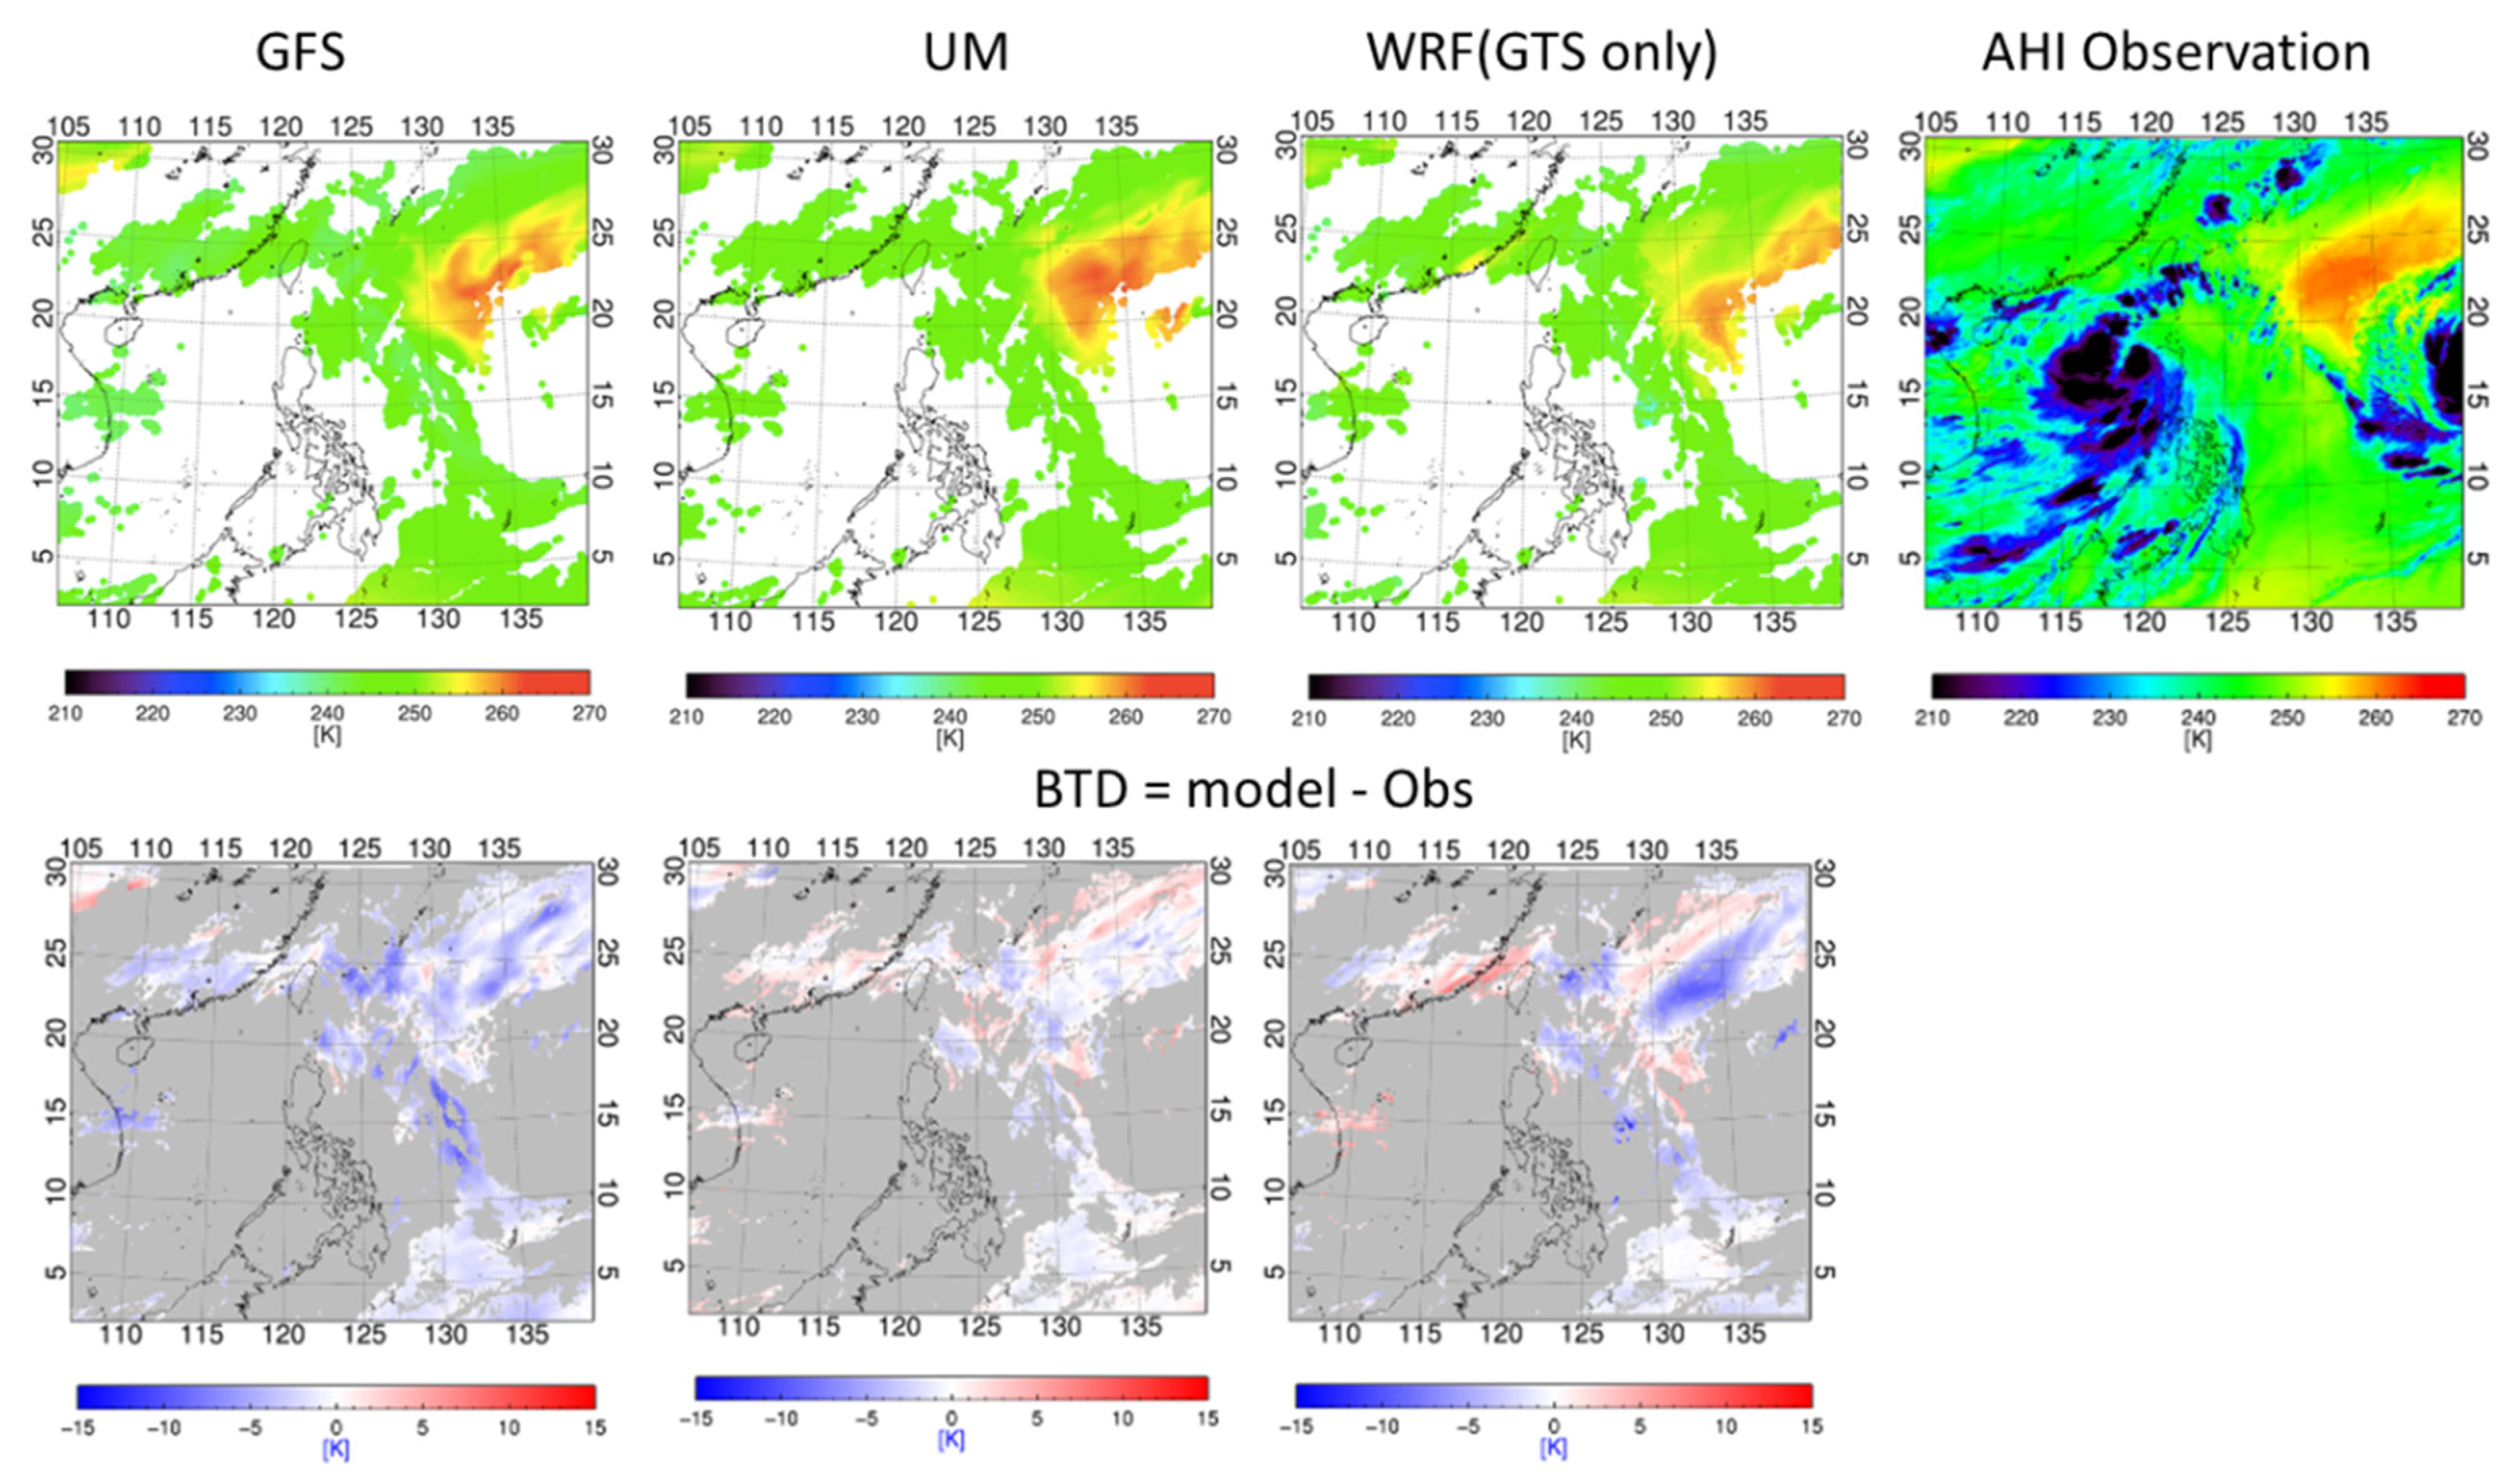
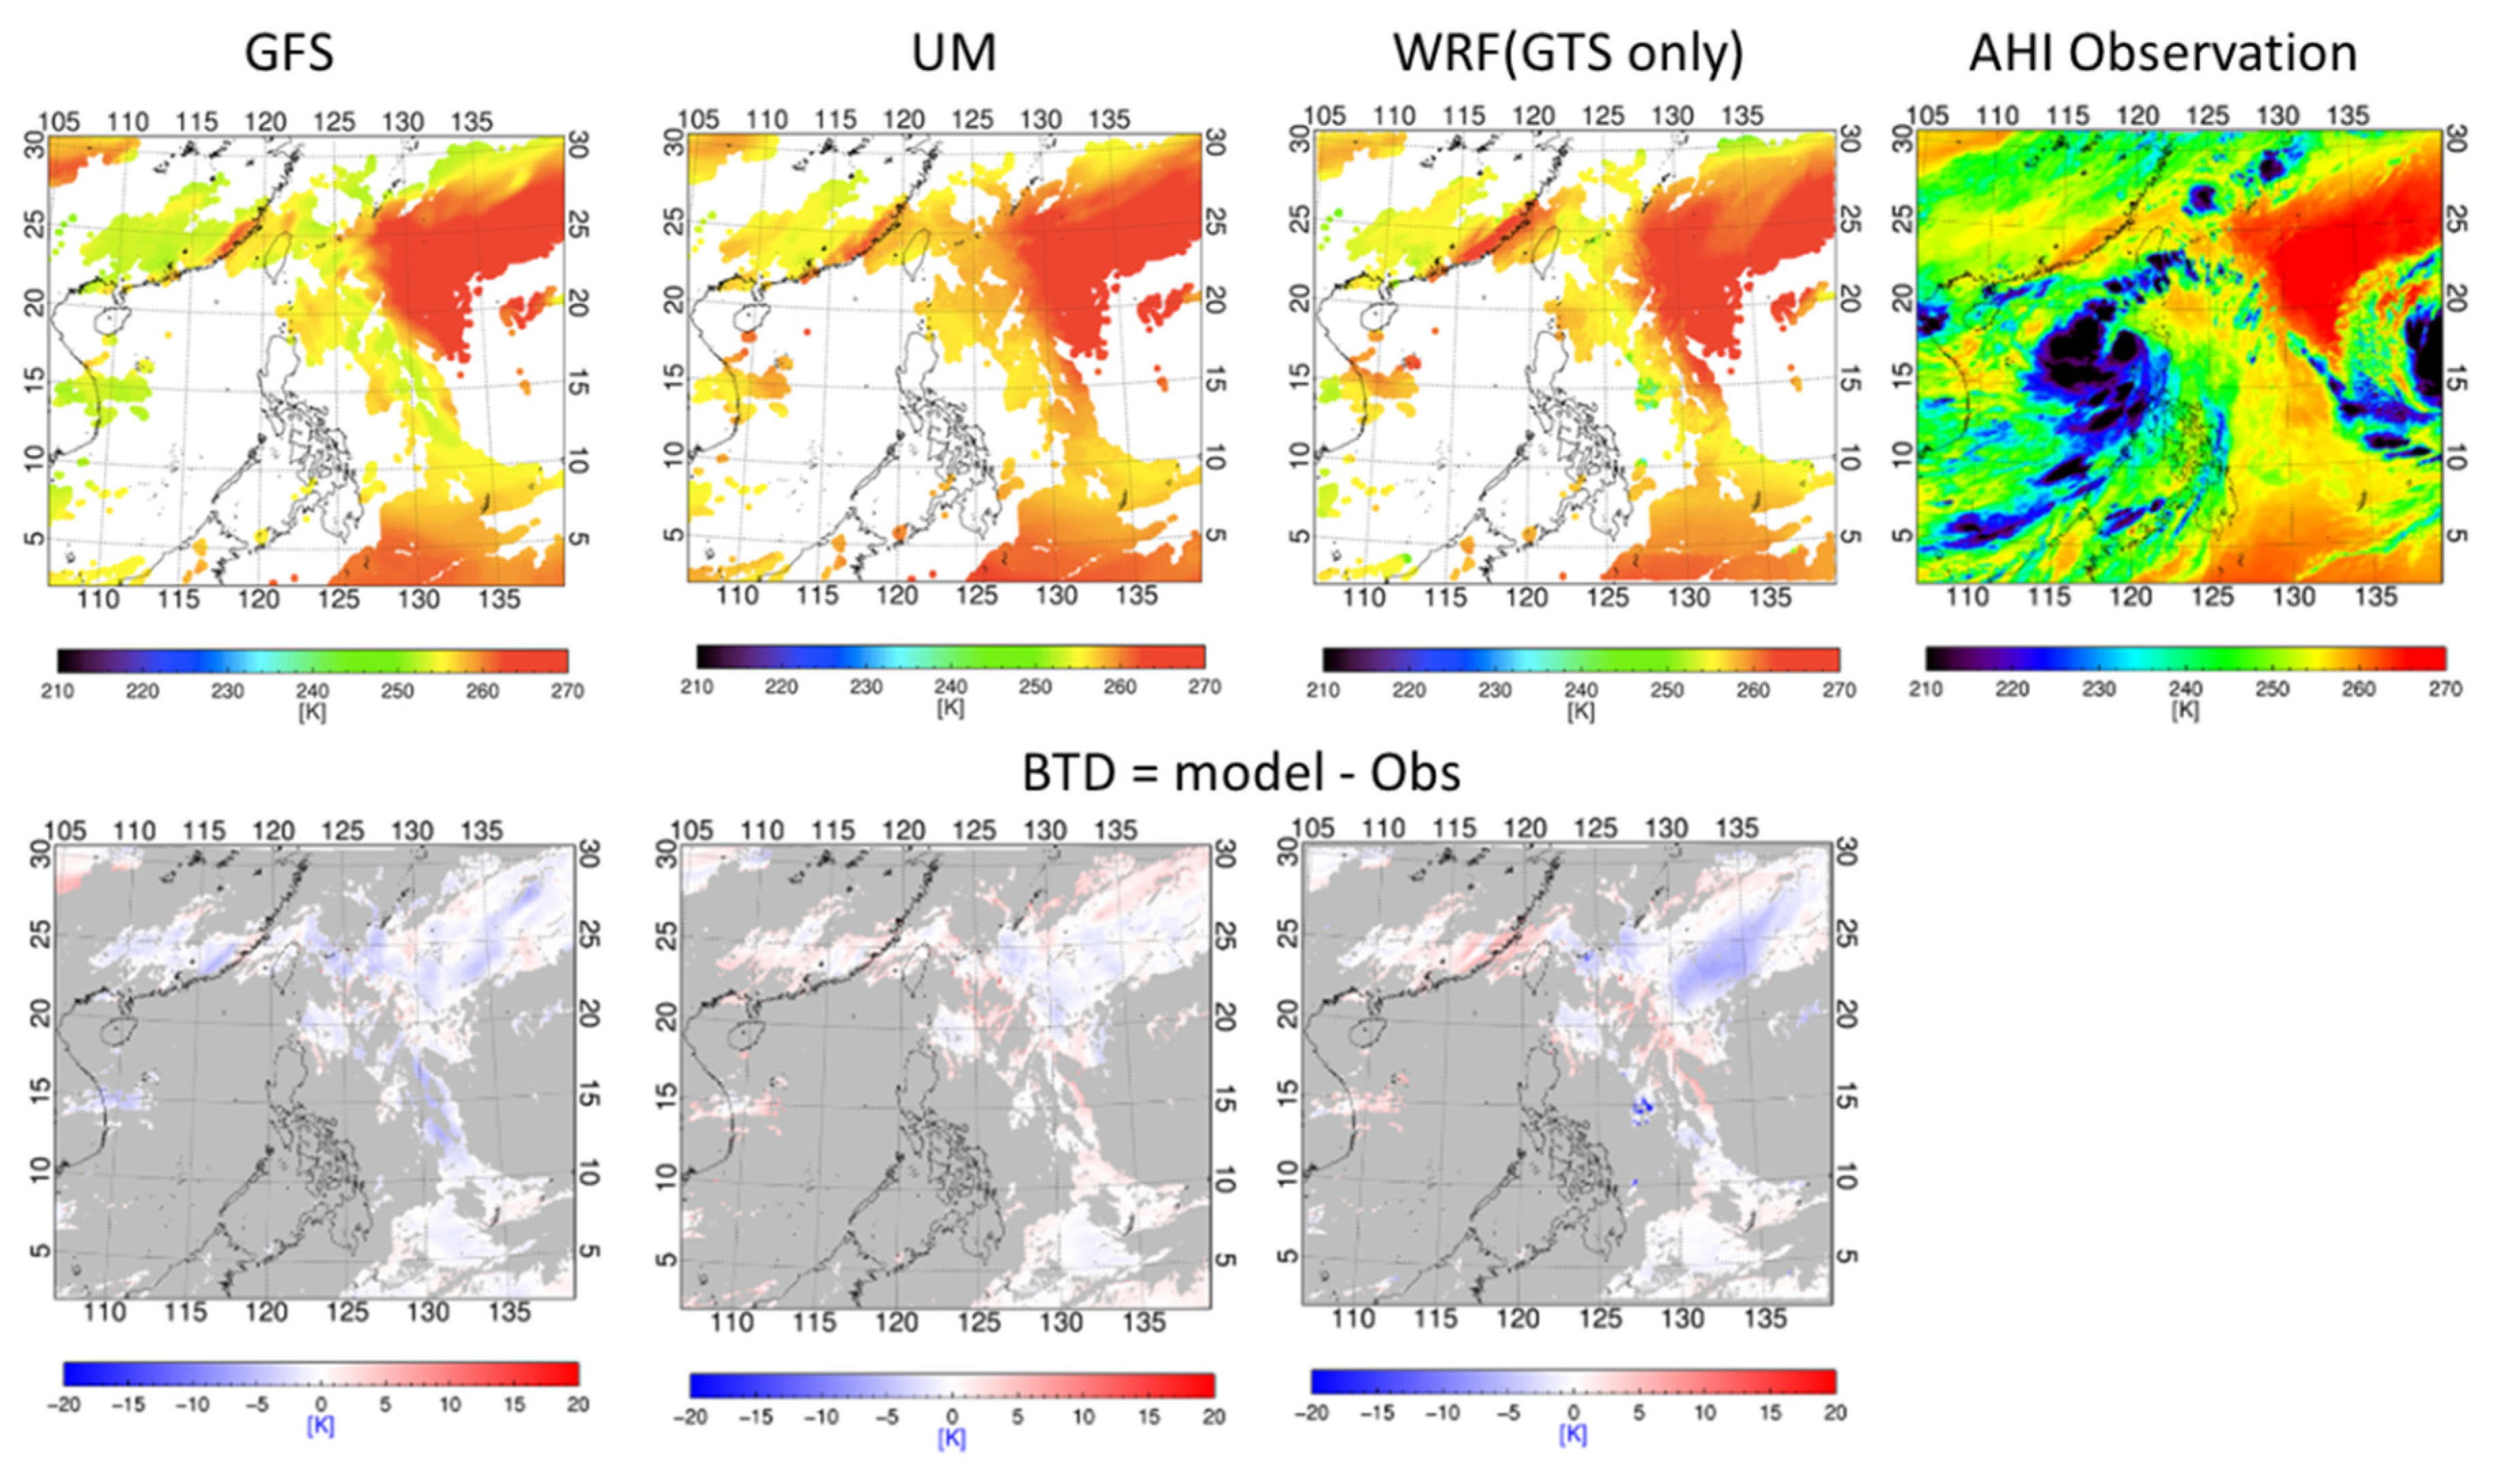
3.1.1. BT Differences between NWP Models and AHI WV Absorption Bands Observations
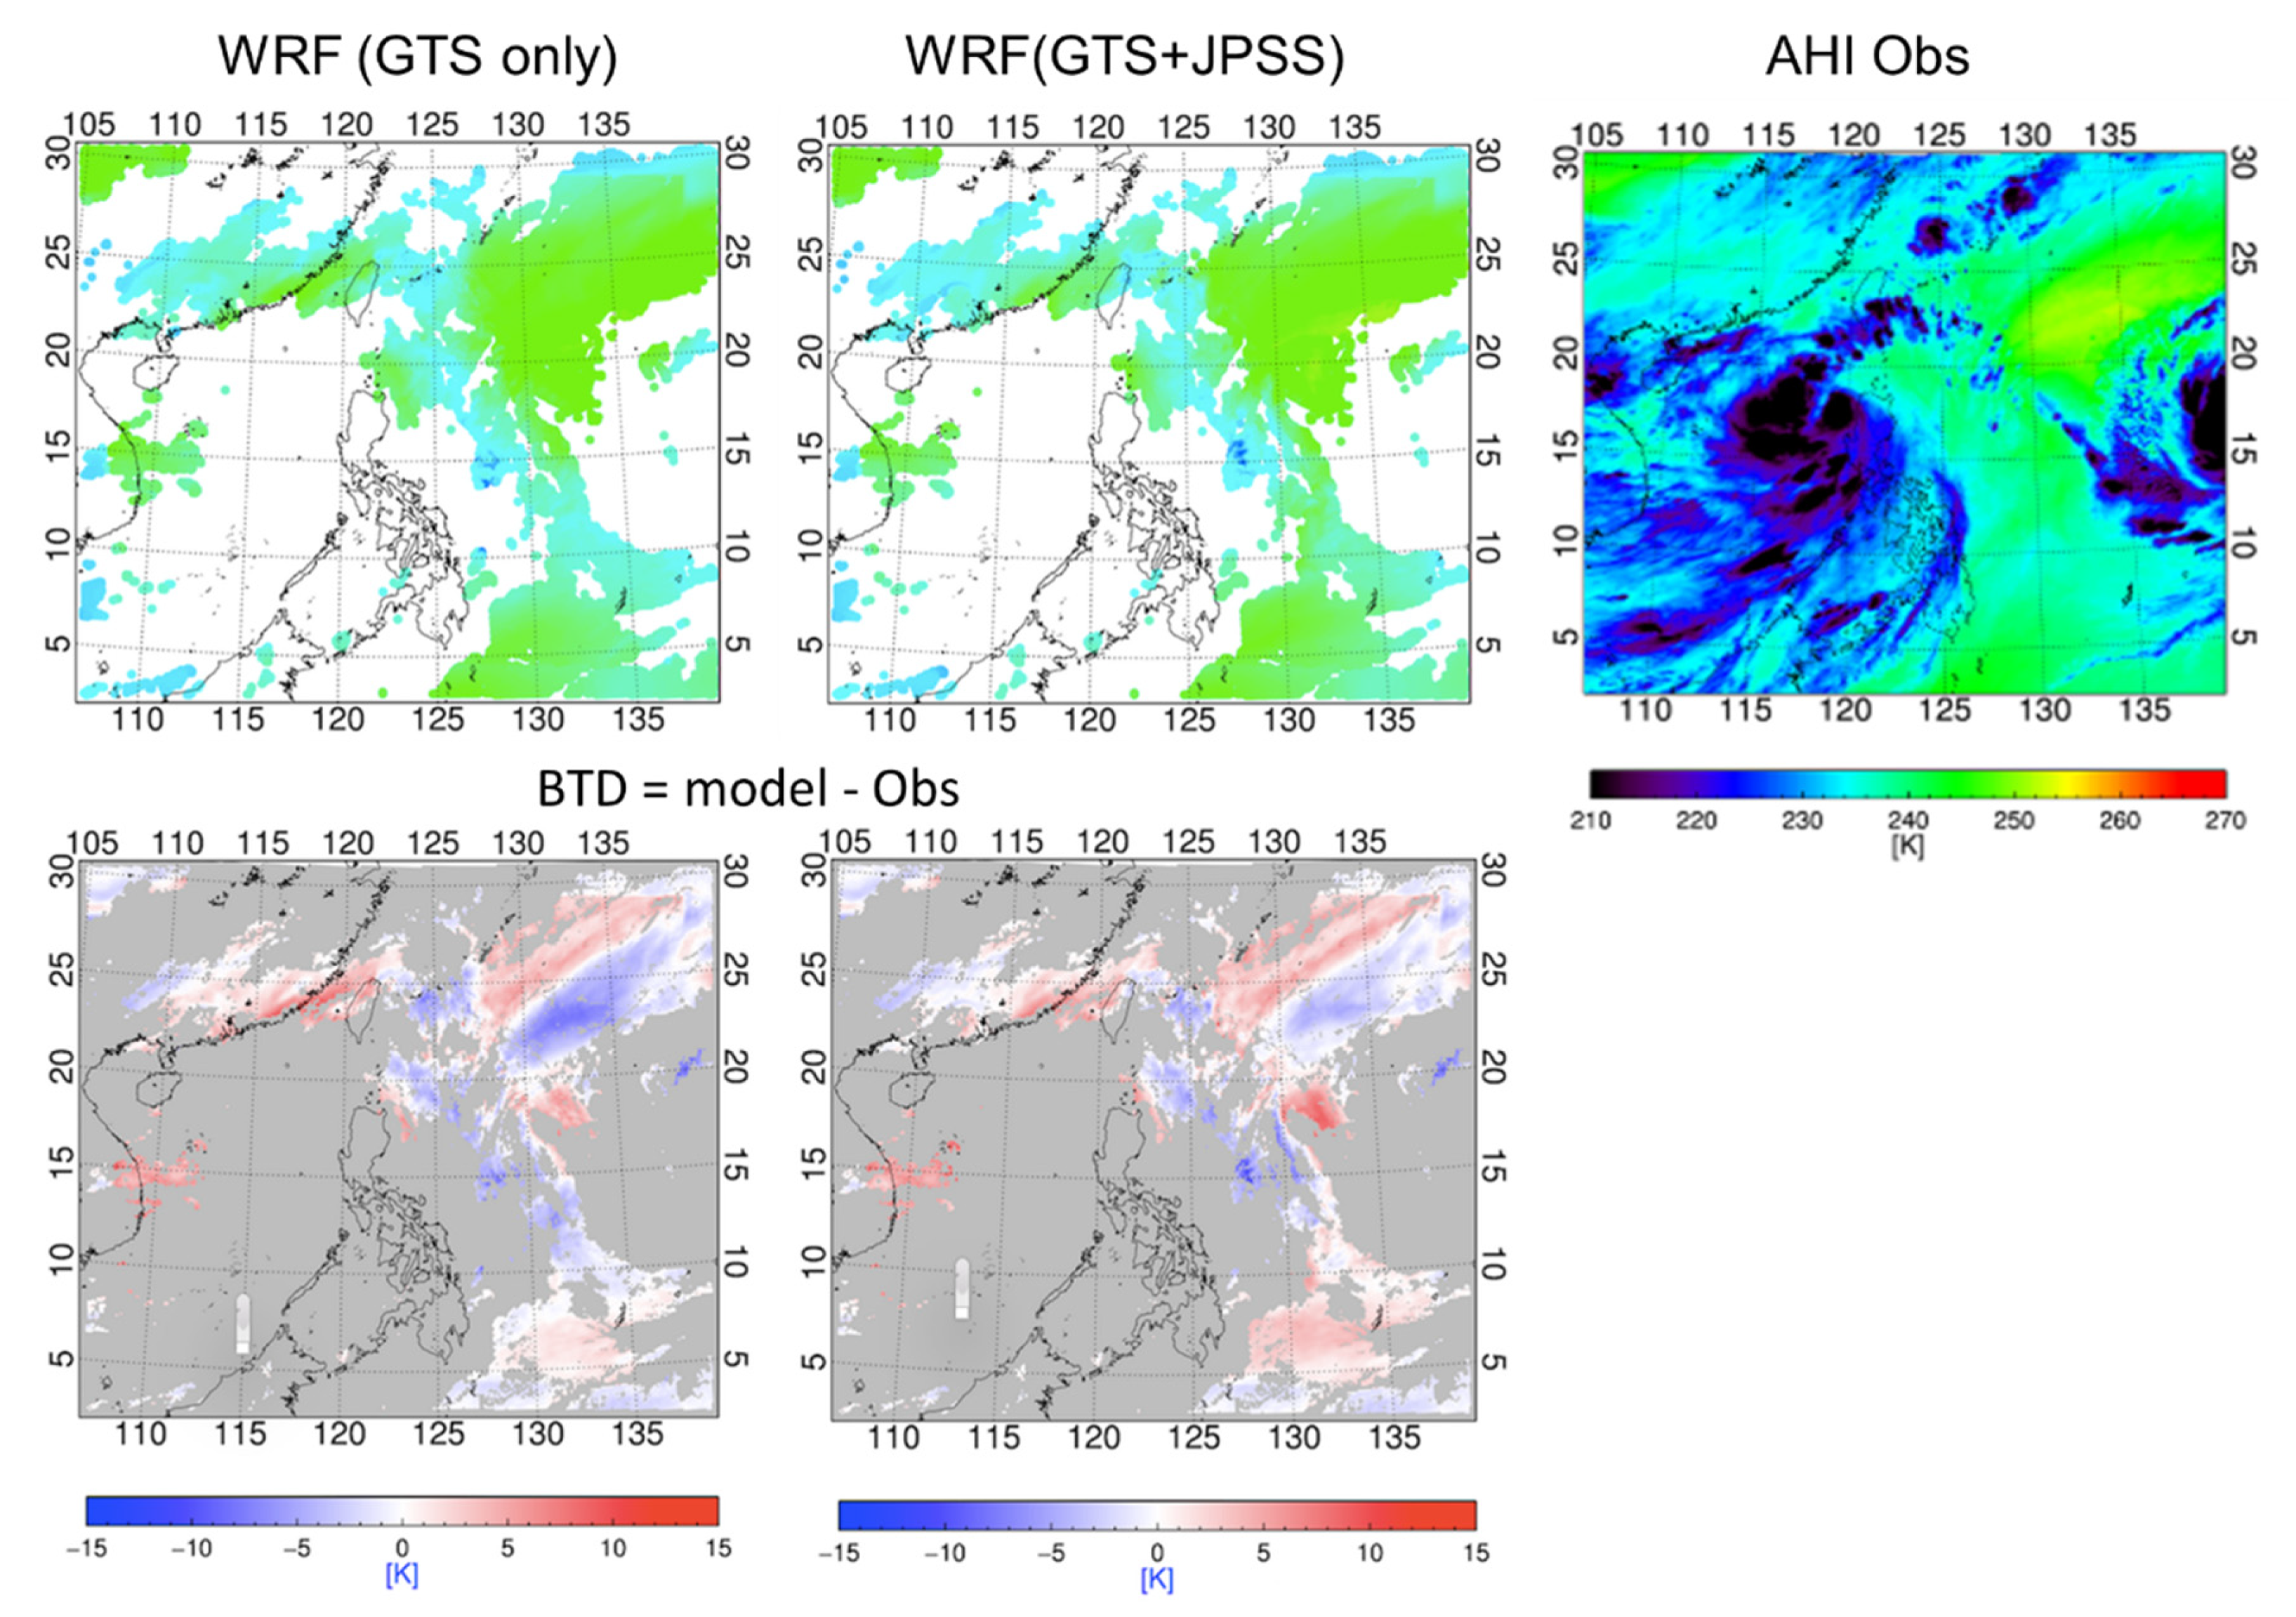
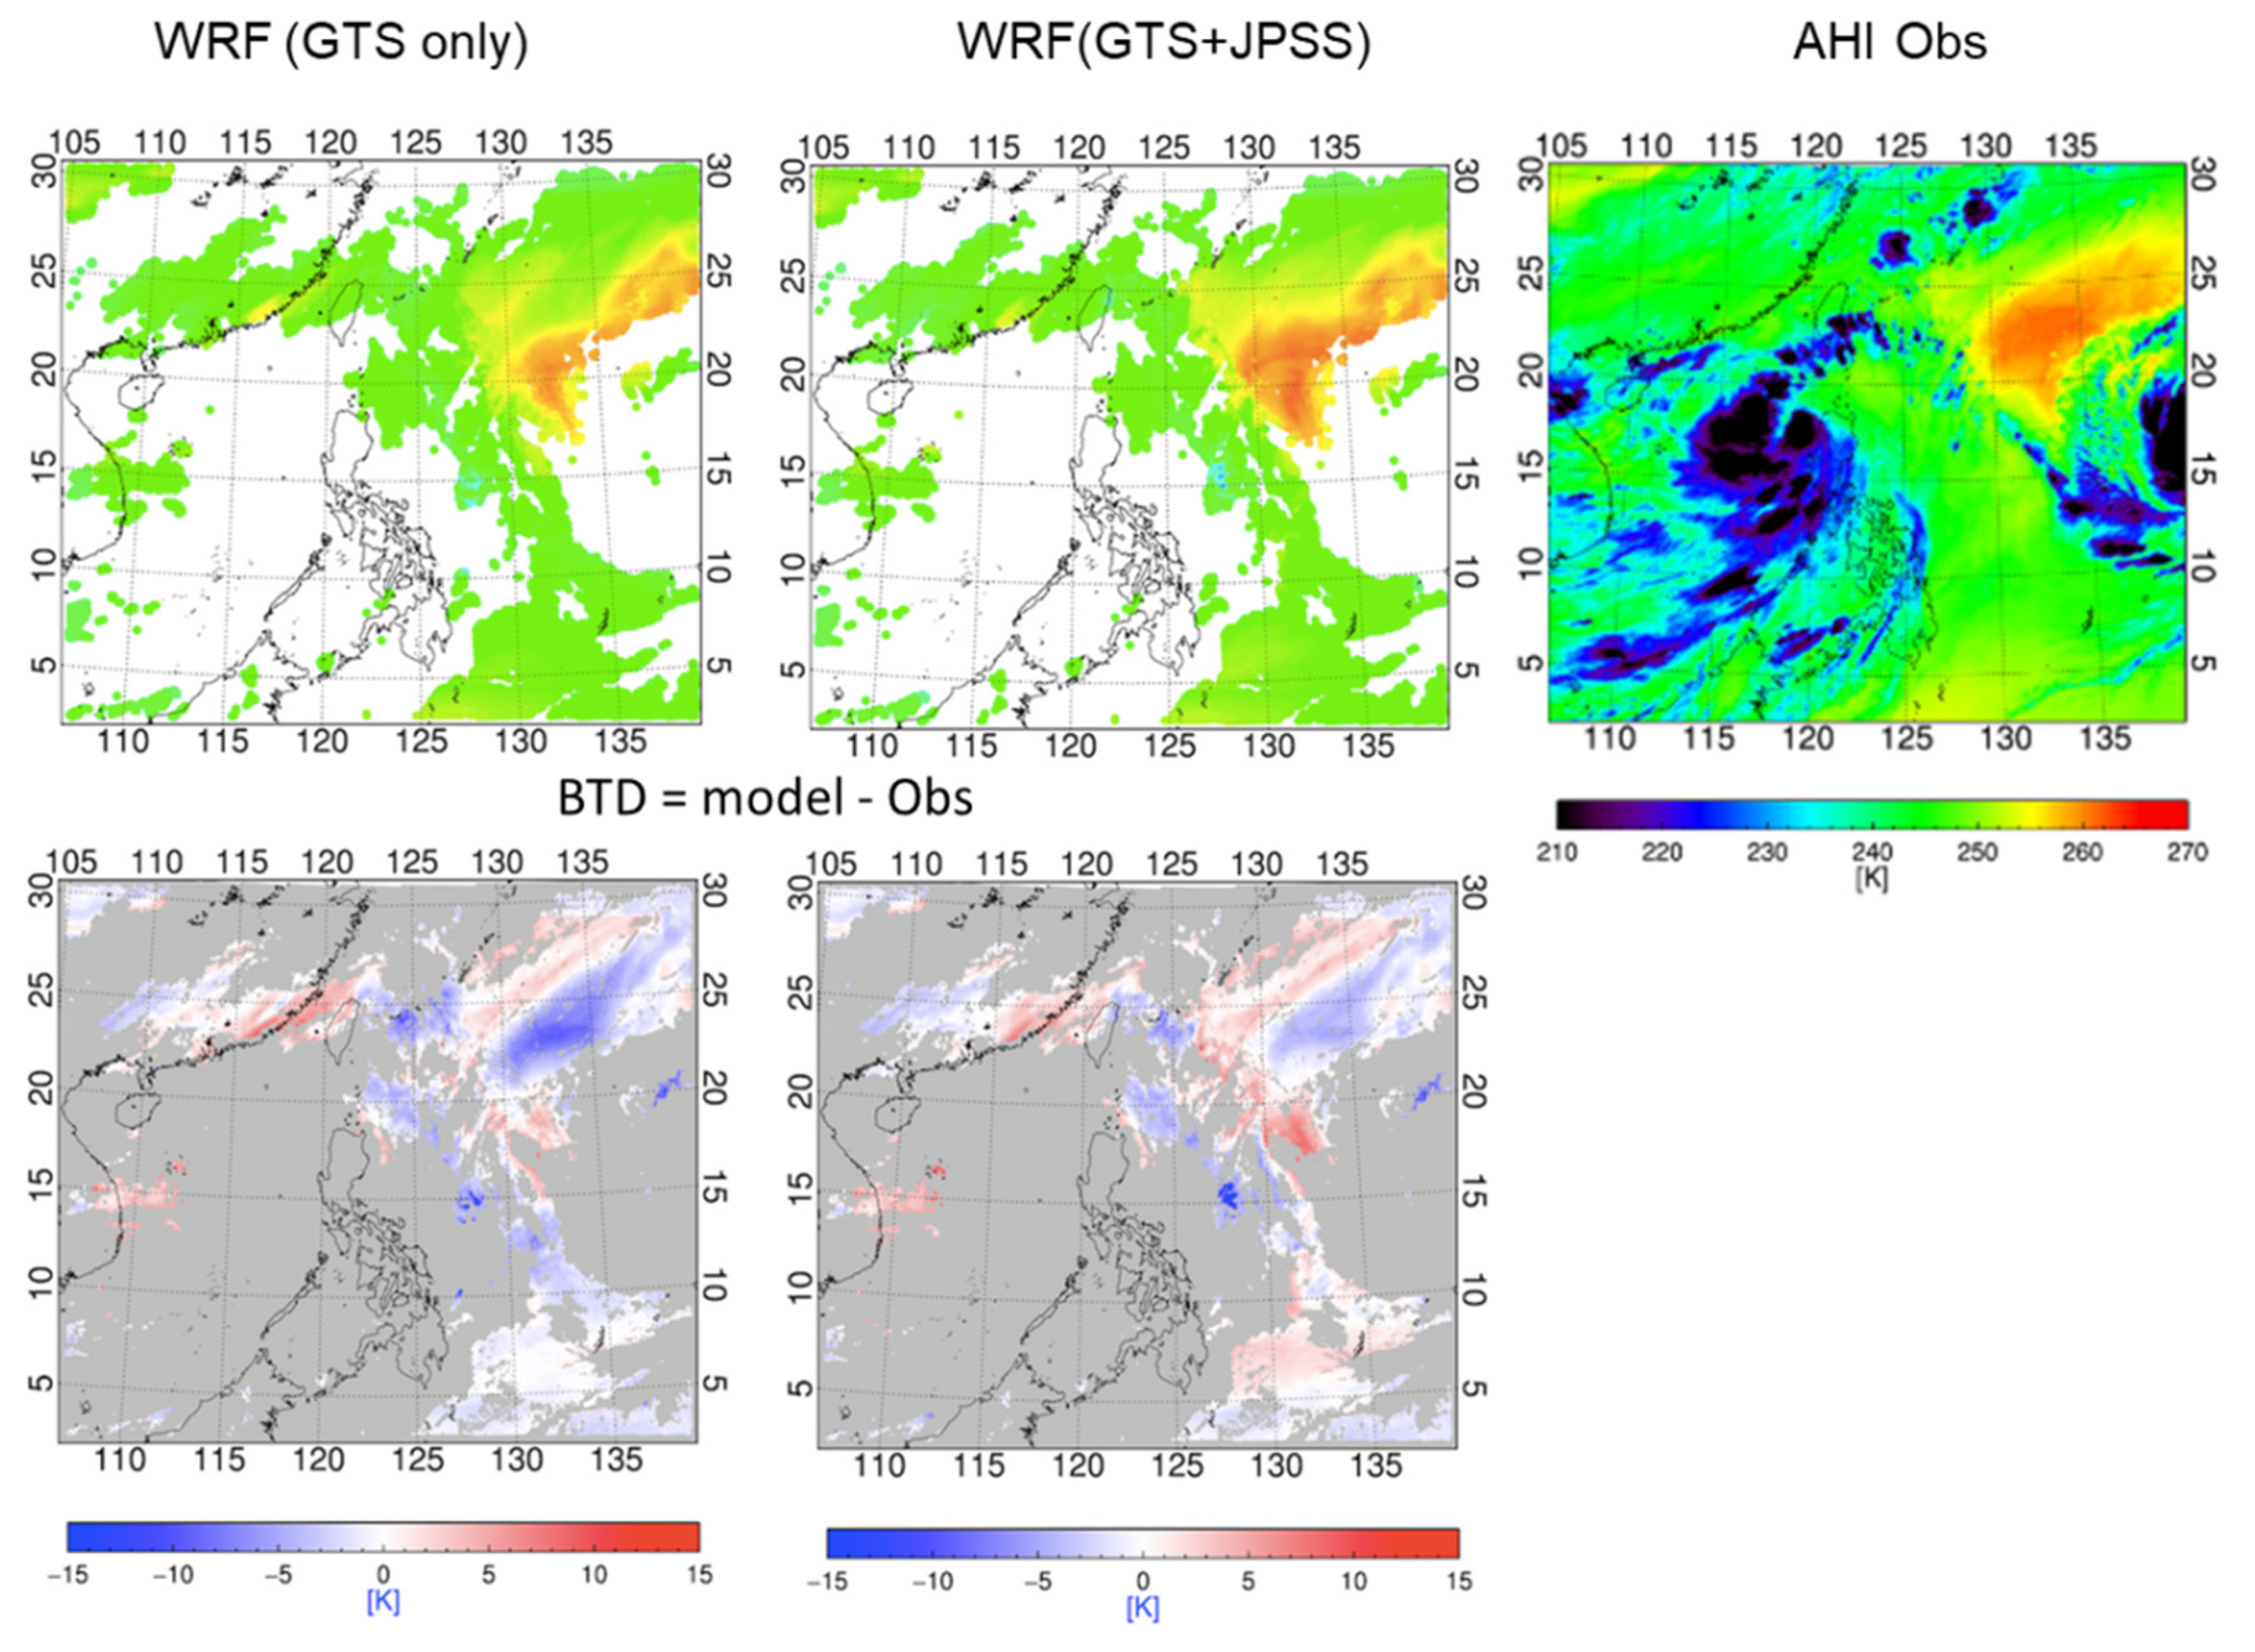
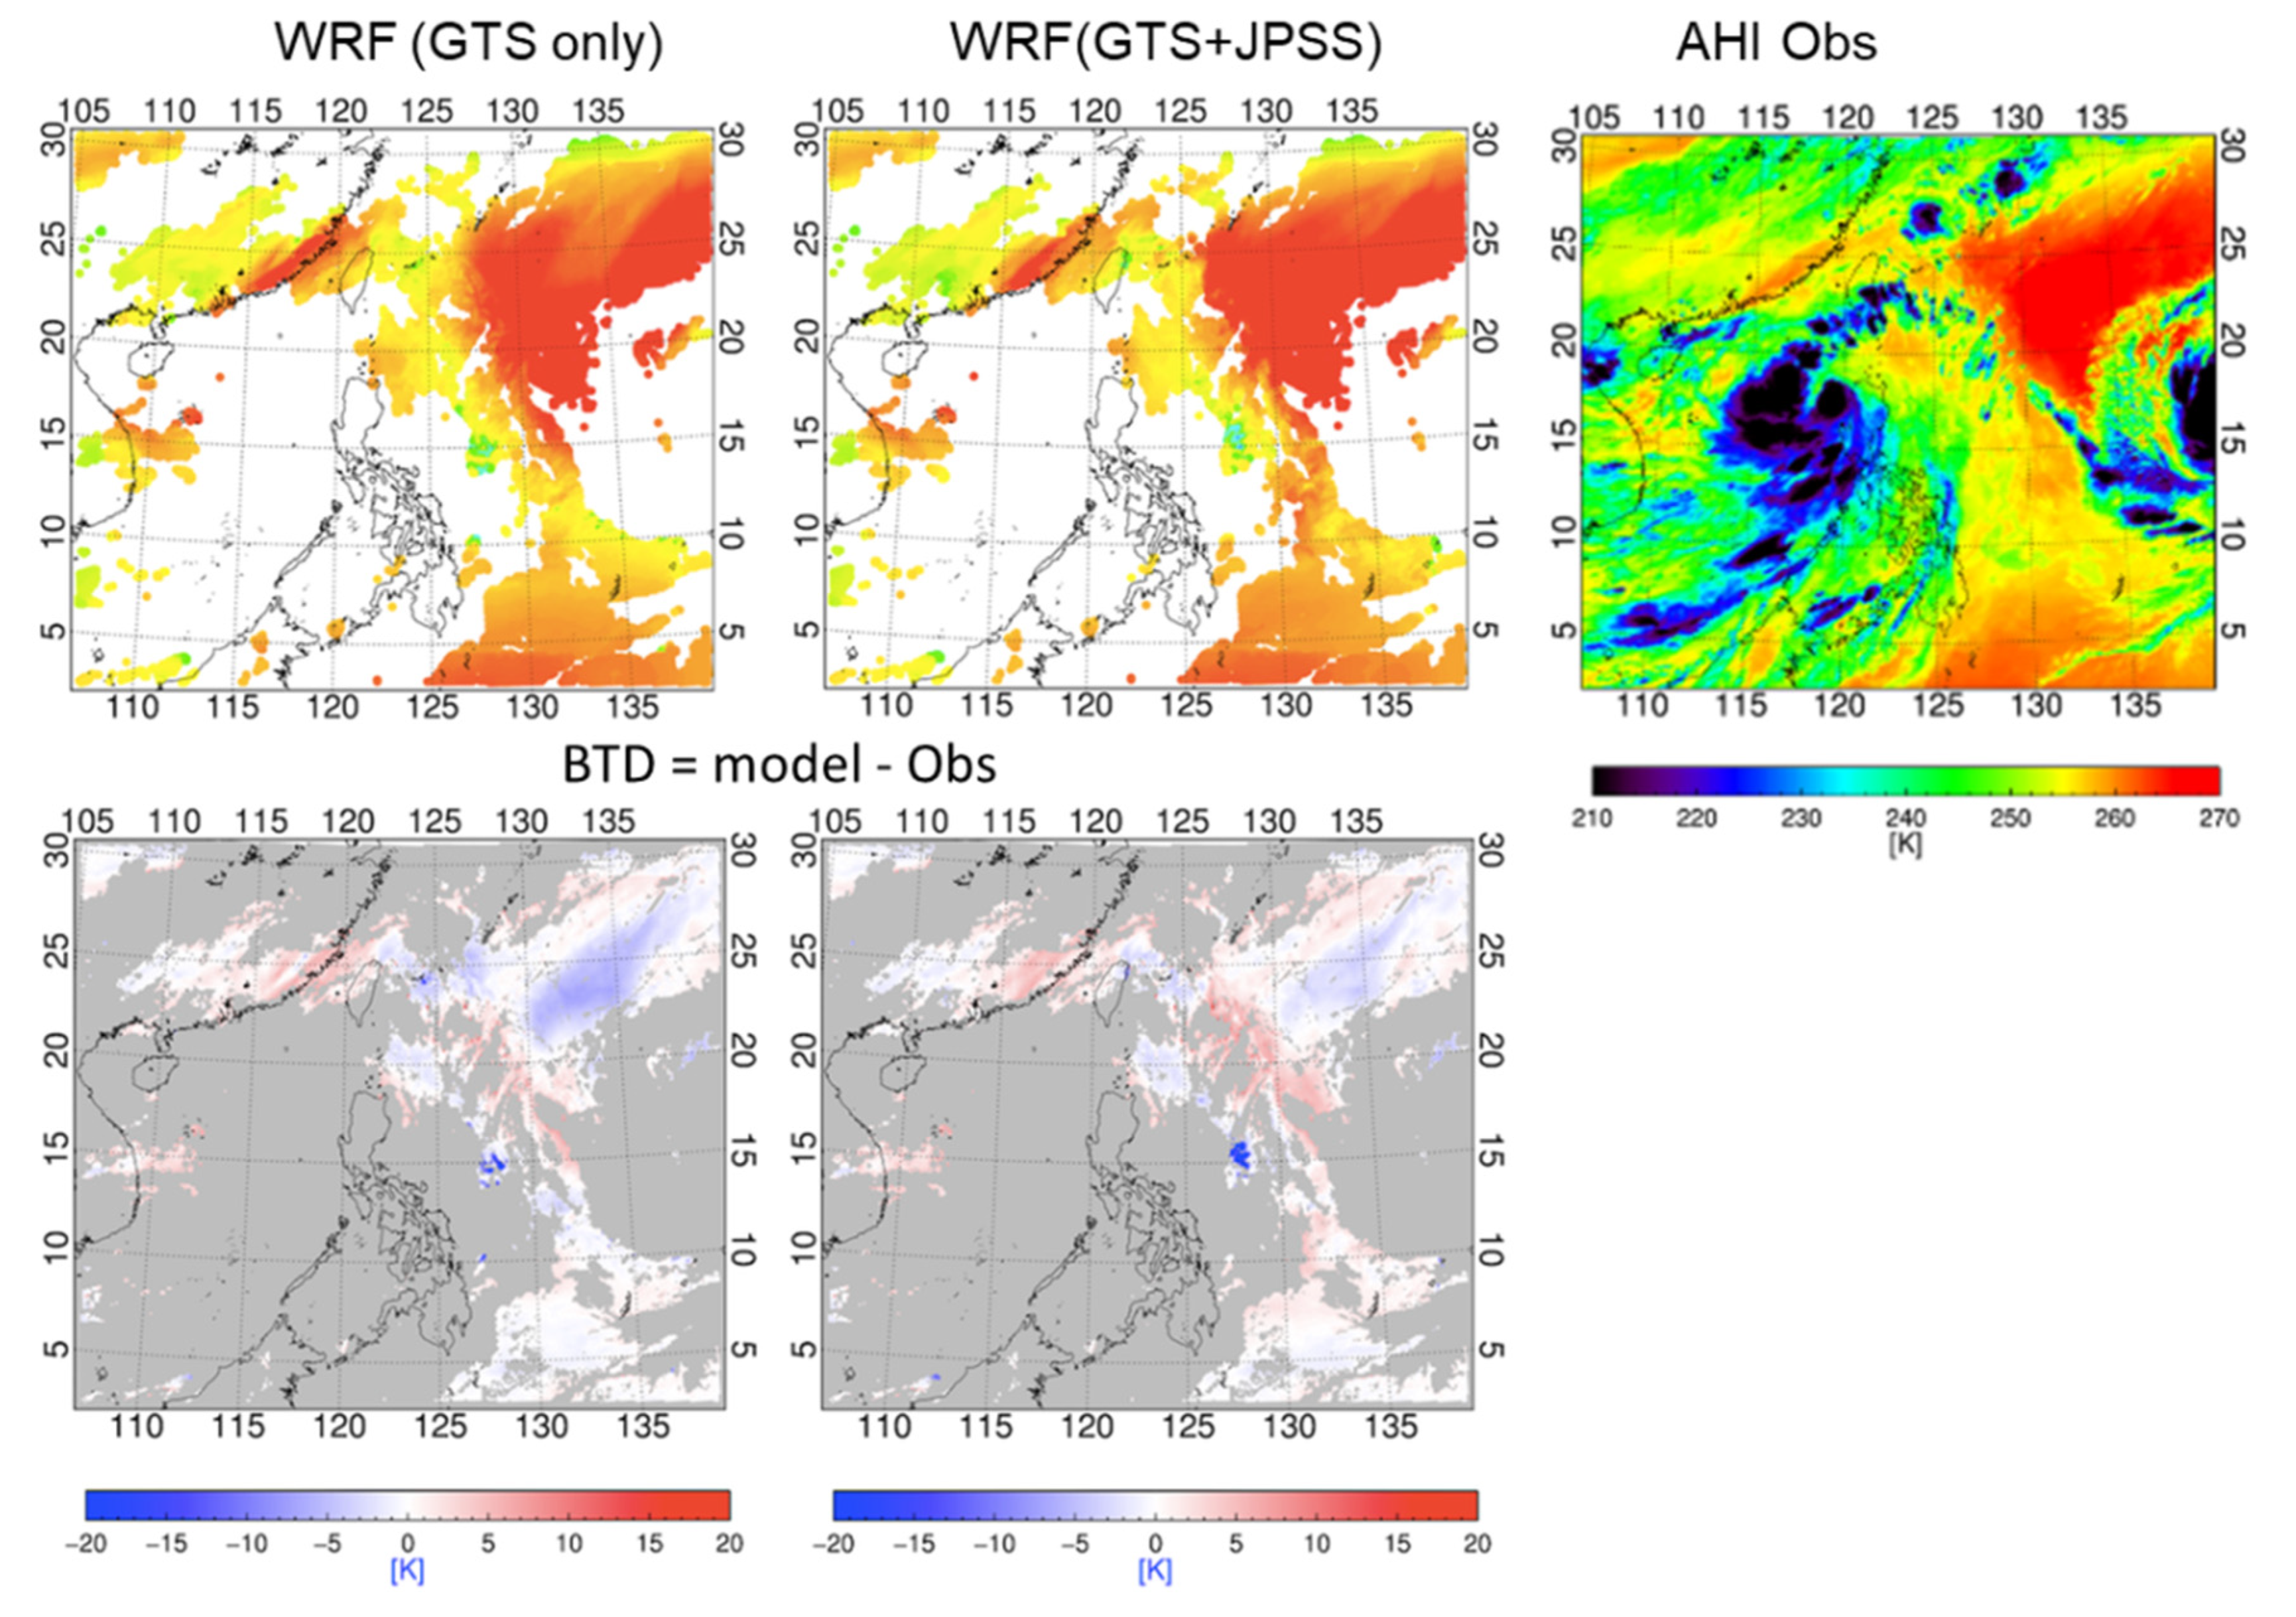
3.1.2. Evaluation of Satellite Data Assimilation for Tropospheric Moisture Simulation
3.2. Relations between the Moisture Forecast Bias and the TC Forecast Bias
4. Discussion
5. Conclusions
- From the BT sensitivity test, the BTs of all three WV absorption bands are more sensitive when moisture is getting drier, as well as the BTs will change slowly when the atmosphere becomes more saturated.
- In this case, by comparing the BTDs from NWP models (GFS, UM, WRF (GTS only) and WRF (GTS+JPSS)), it shows that the UM model has an overall better environmental moisture forecast, especially over the mid-lower troposphere (for channels 9 and 10). With additional satellite data assimilated (results from regional WRF with JPSS), more accurate environmental moisture forecasts can be obtained.
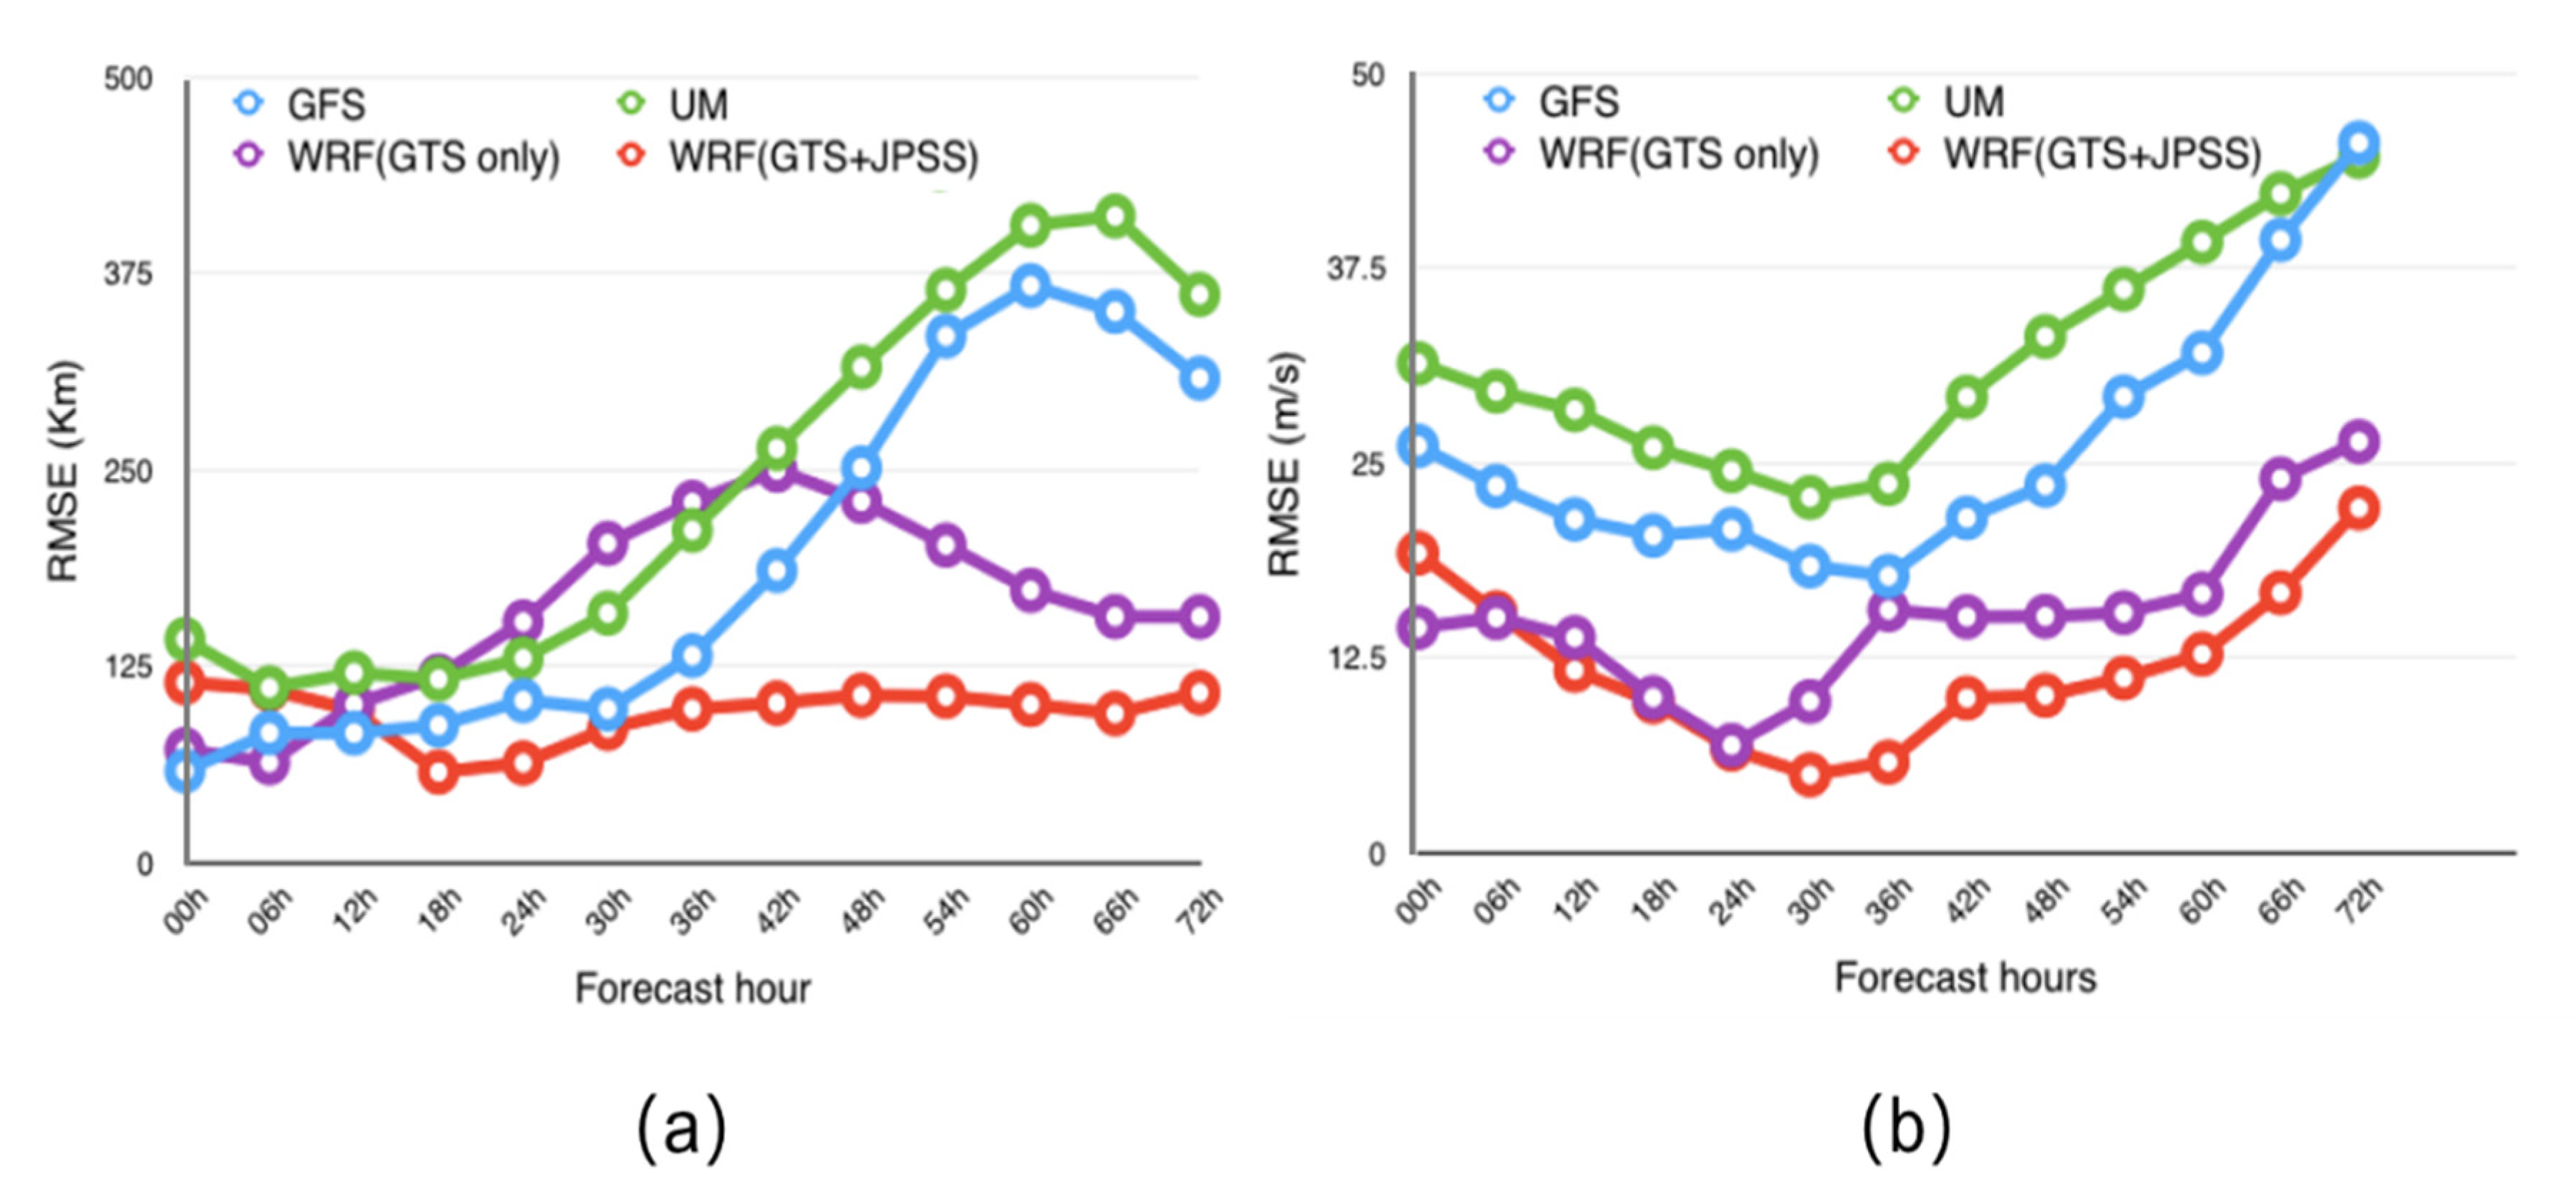
- For the track and intensity forecasts of TC, in general, regional models have smaller track and intensity bias than global models. The performance of the regional models is better than the global models for the track forecast, especially after 24 h in this particular case. For the intensity forecasts, the regional models are comparable to the global models.
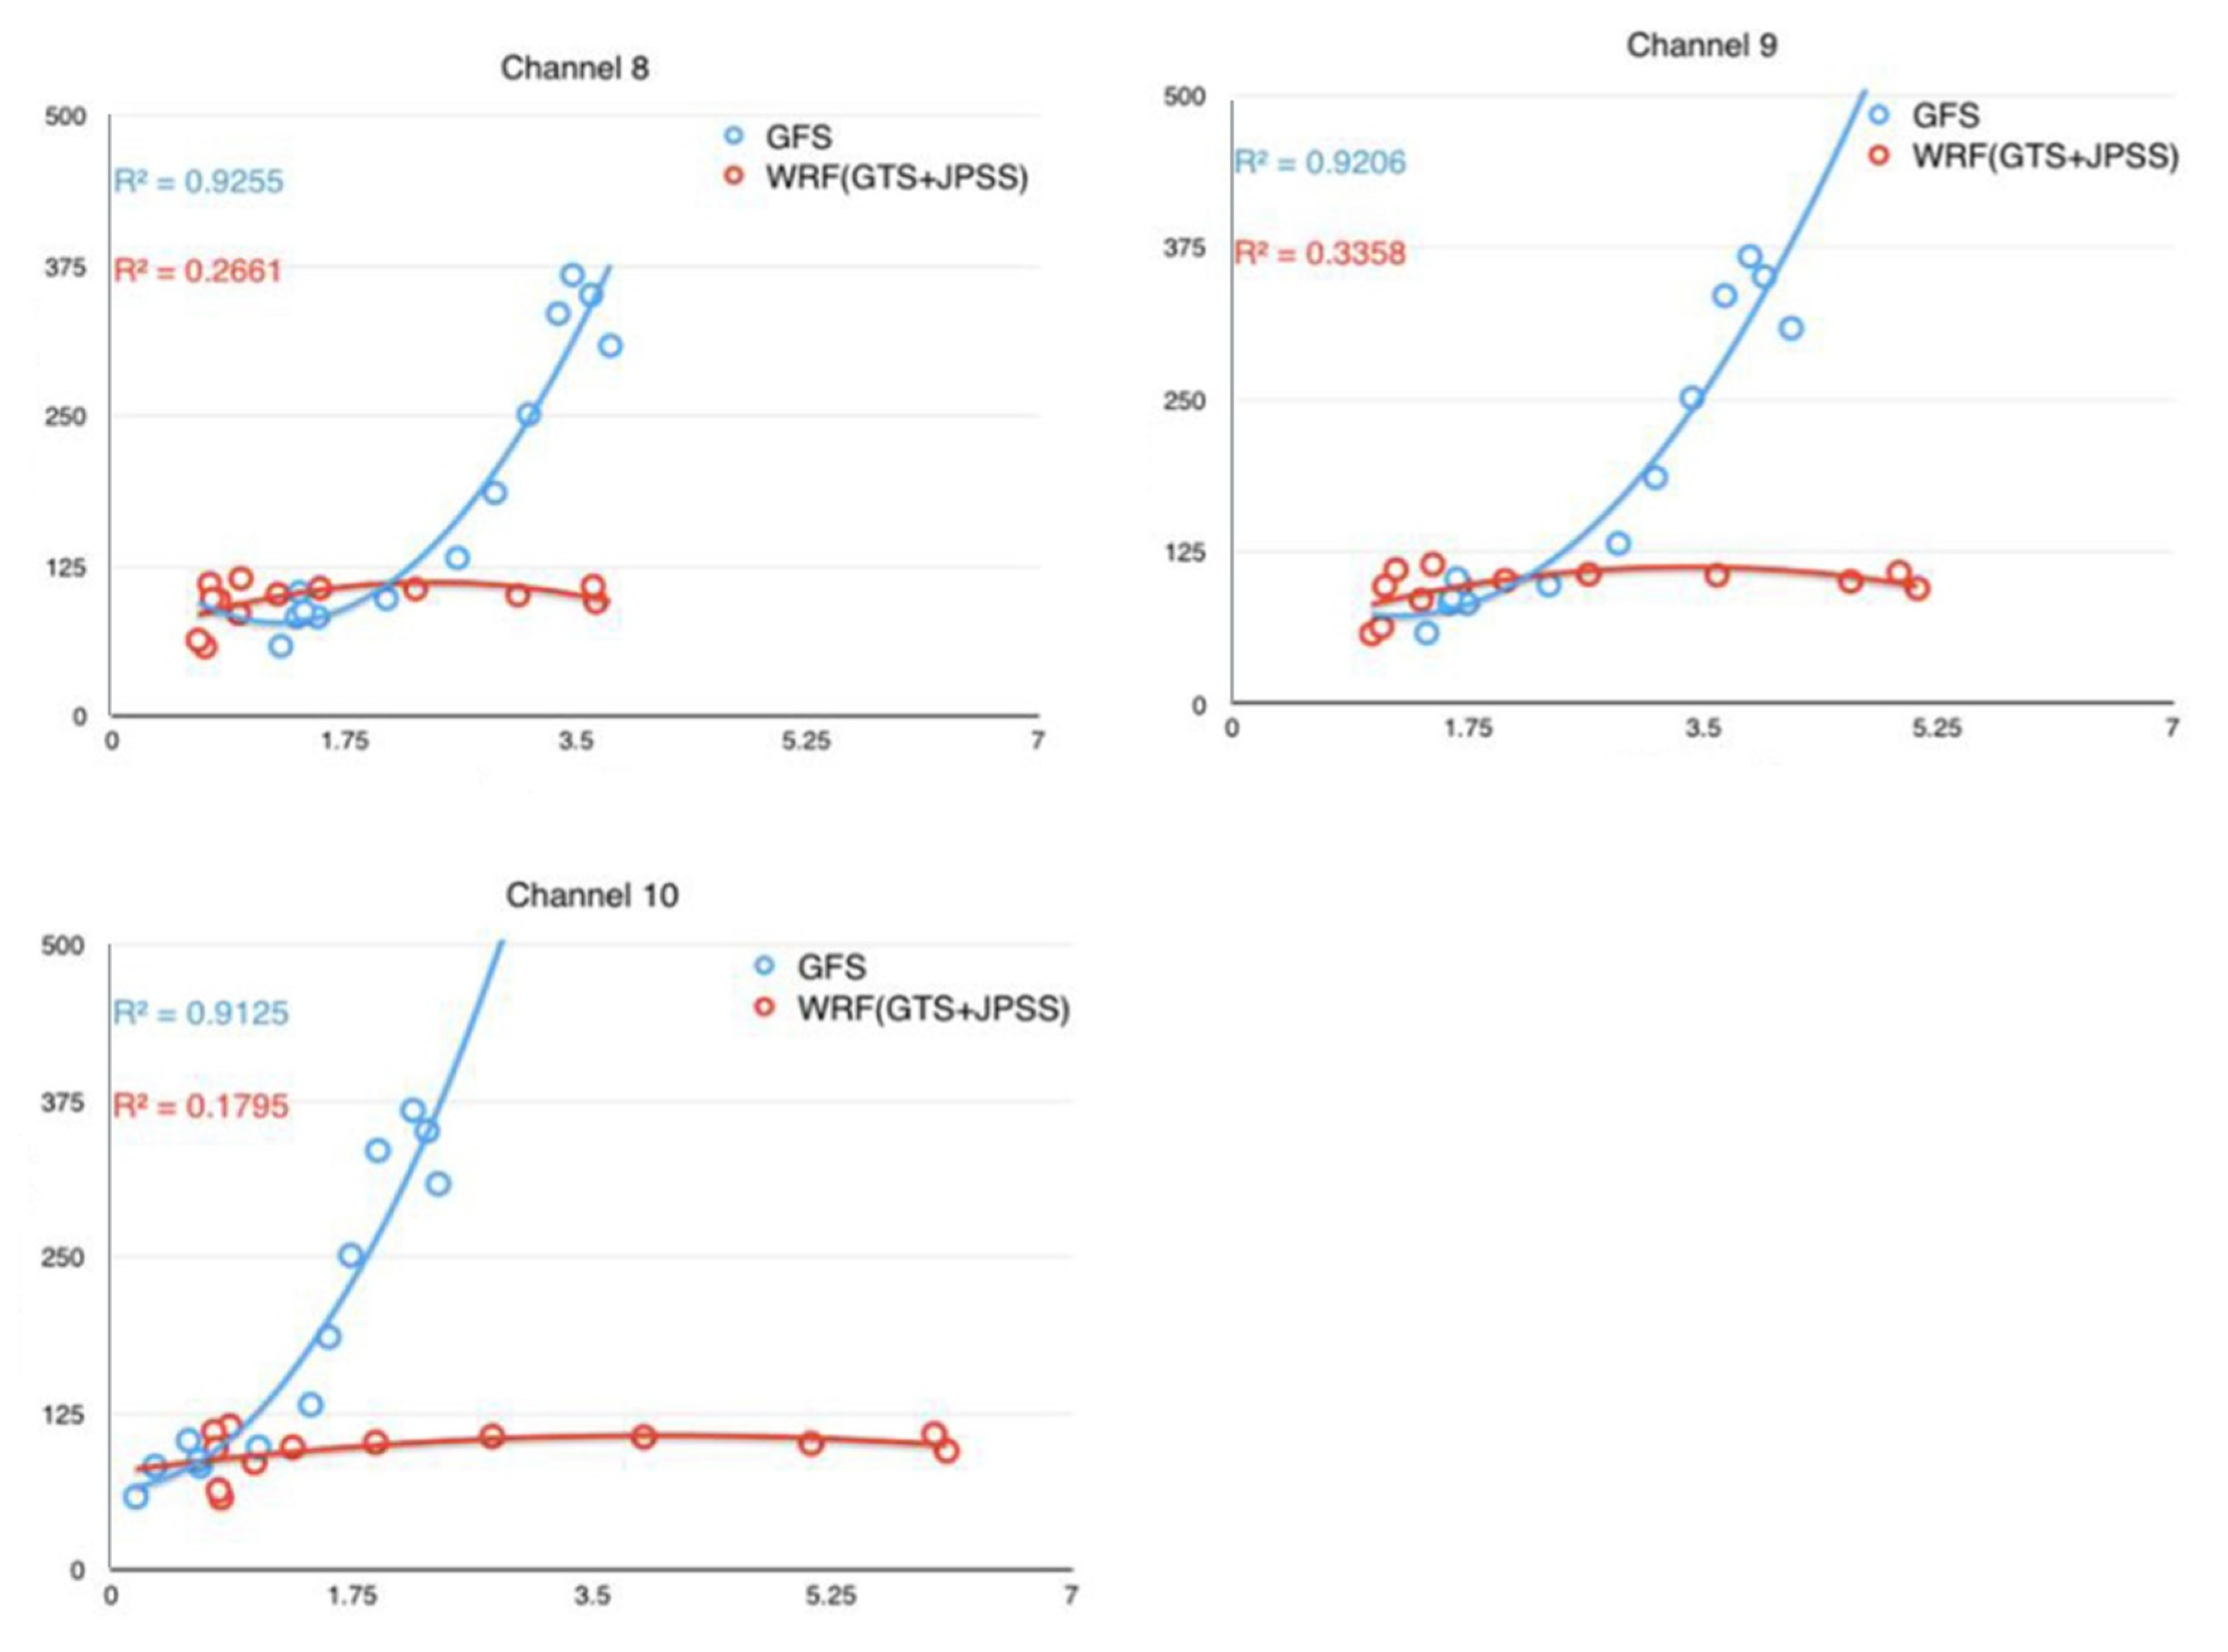
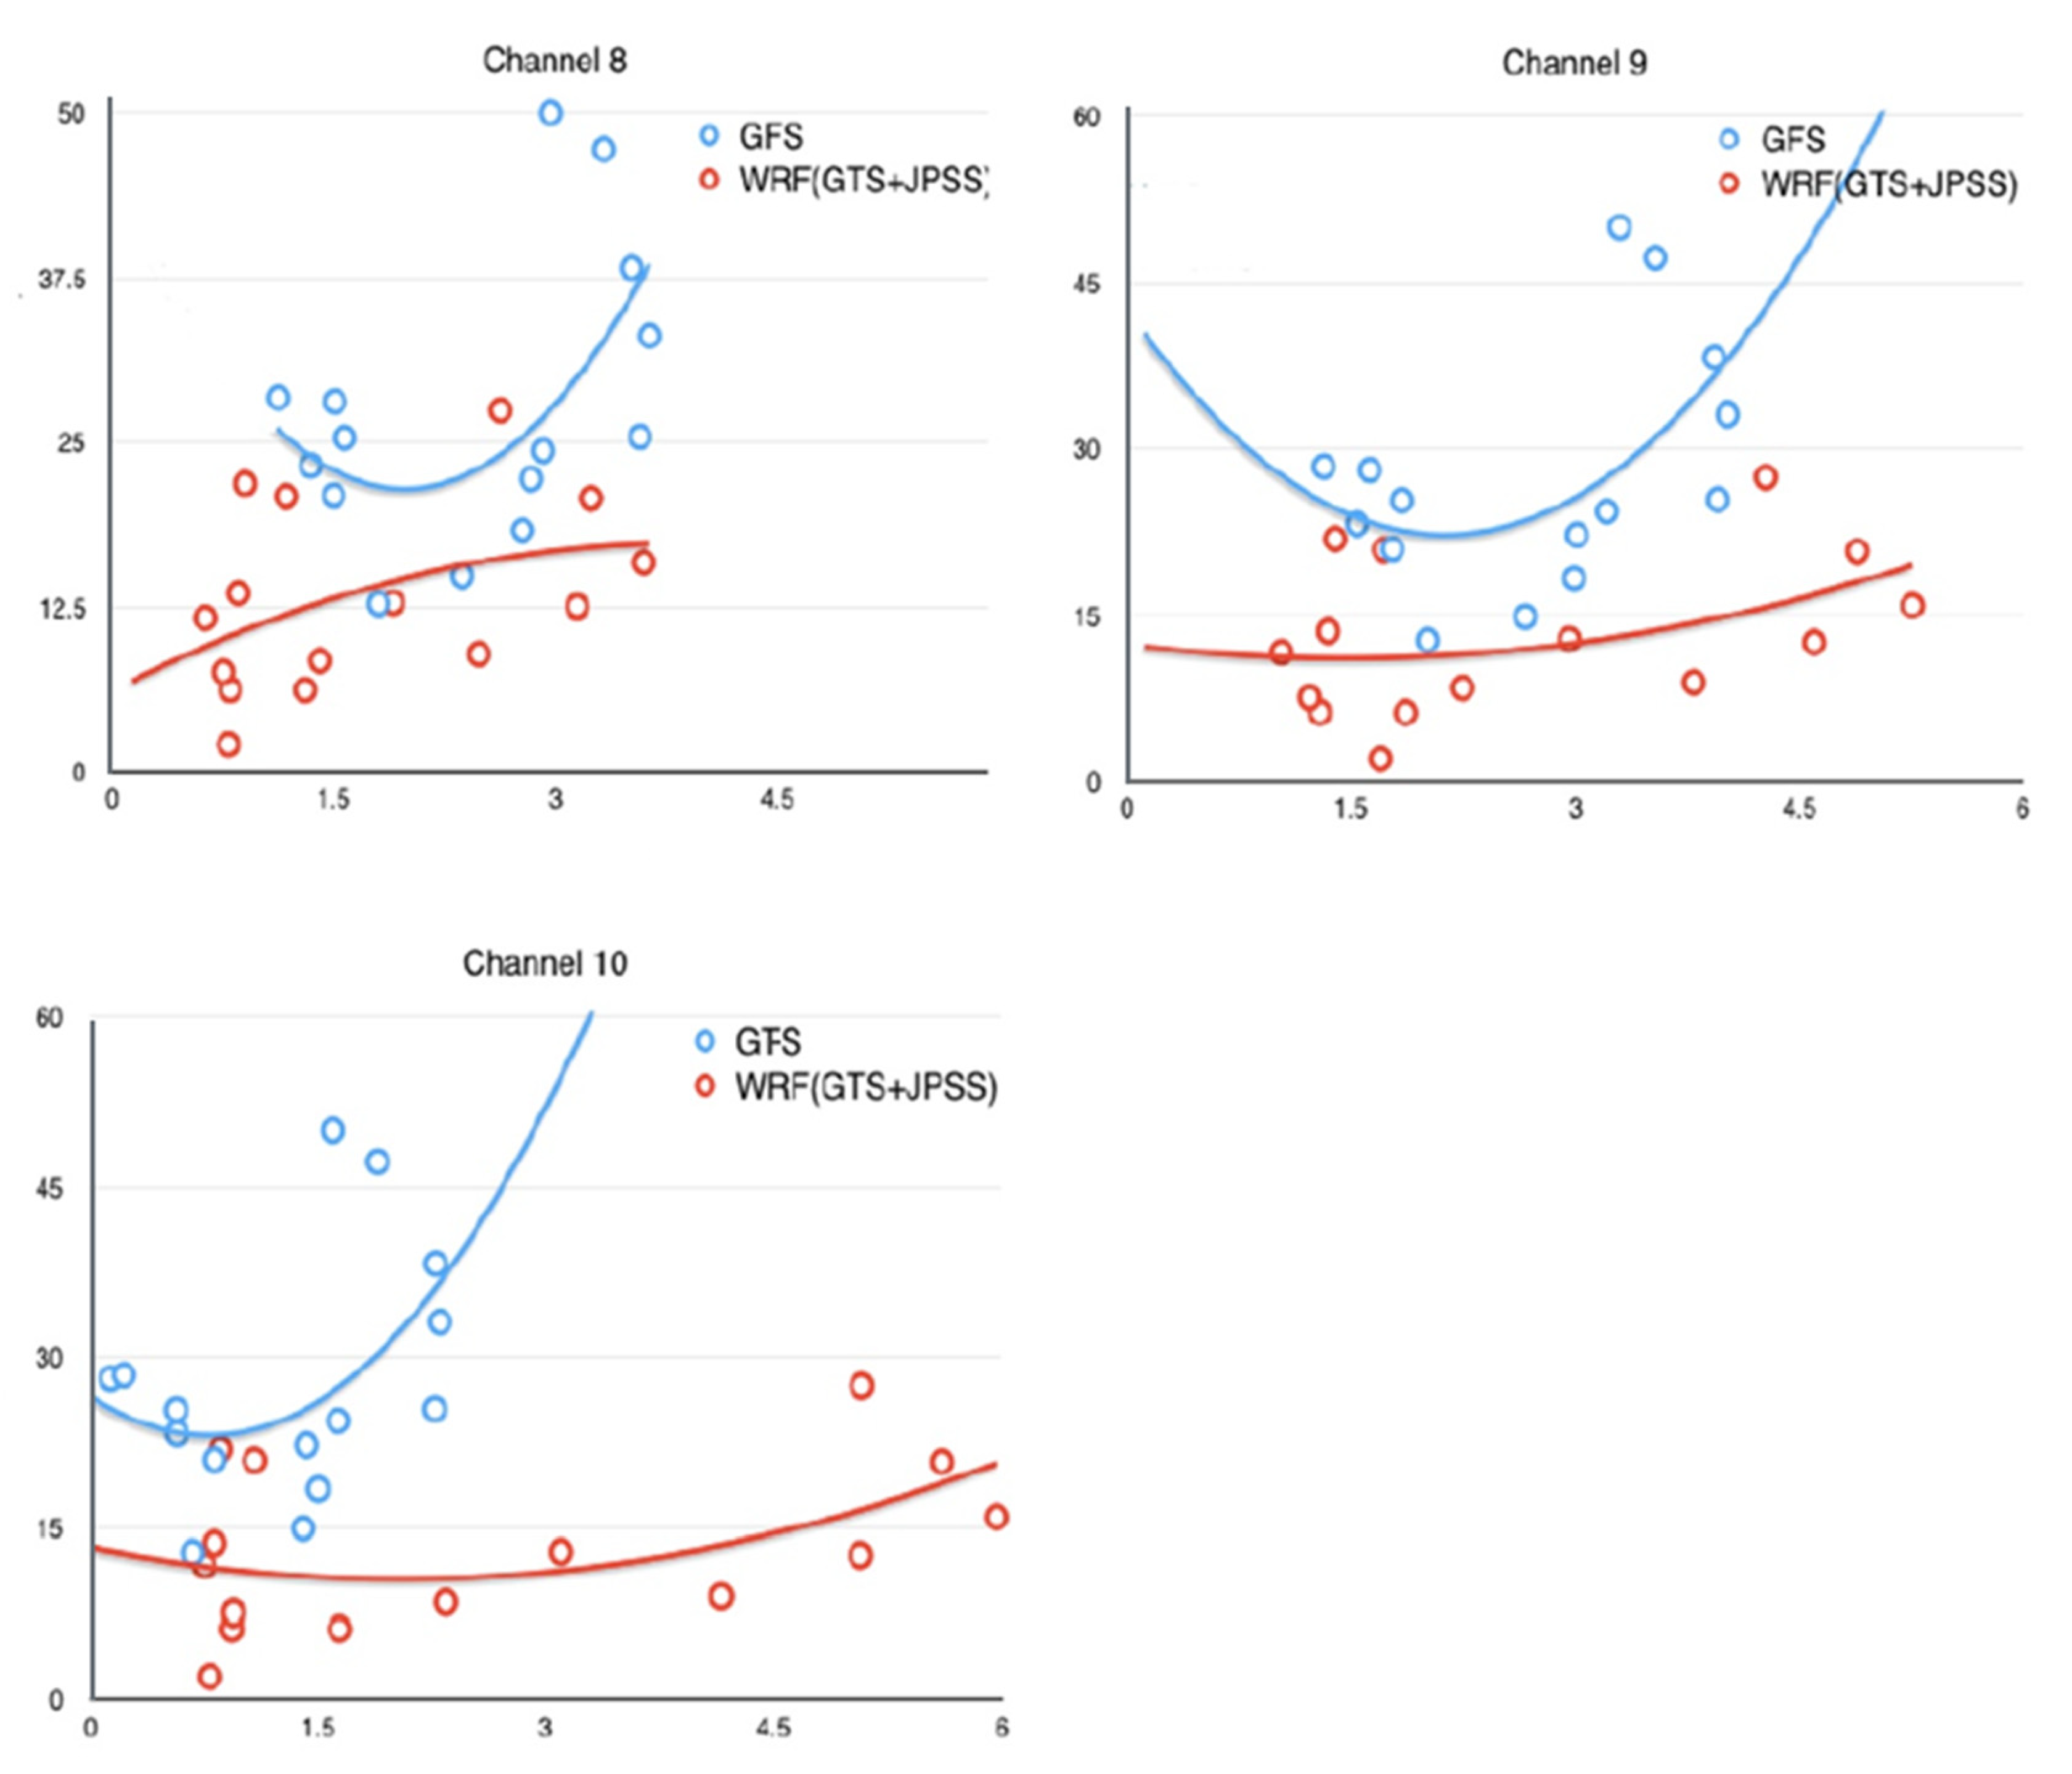
- From the relationship between environmental moisture forecast bias and track forecast bias, it is clear that a smaller moisture bias tends to result in a smaller track bias of TC, especially in the GFS model.
Author Contributions
Funding
Acknowledgments
Conflicts of Interest
References
- Trenberth, K.E.; Fasullo, J.T.; Kiehl, J. Earth’s Global Energy Budget. Bull. Am. Meteorol. Soc. 2009, 90, 311–324. [Google Scholar] [CrossRef]
- Soden, B.J.; Held, I.M. An Assessment of Climate Feedbacks in Coupled Ocean–Atmosphere Models. J. Clim. 2006, 19, 3354–3360. [Google Scholar] [CrossRef]
- Pierrehumbert, R.T. The hydrologic cycle in deep-time climate problems. Nature 2002, 419, 191–198. [Google Scholar] [CrossRef] [PubMed]
- Held, I.M.; Soden, B.J. Water vapor feedback and global warming. Annu. Rev. Energy Environ. 2000, 25, 441–475. [Google Scholar] [CrossRef] [Green Version]
- Li, J.; Li, J.; Otkin, J.; Schmit, T.J.; Liu, C.-Y. Warning information in a preconvection environment from the geostationary advanced infrared sounding system—A simulation study using the IHOP case. J. Appl. Meteorol. Climatol. 2011, 50, 776–783. [Google Scholar] [CrossRef]
- Li, J.; Liu, C.-Y.; Zhang, P.; Schmit, T.J. Applications of full spatial resolution space-based advanced infrared soundings in the preconvection environment. Weather Forecast. 2012, 27, 515–524. [Google Scholar] [CrossRef]
- Bessho, K.; Date, K.; Hayashi, M.; Ikeda, A.; Imai, T.; Inoue, H.; Kumagai, Y.; Miyakawa, T.; Murata, H.; Ohno, T.; et al. An Introduction to Himawari-8/9—Japan’s New-Generation Geostationary Meteorological Satellites. J. Meteorol. Soc. Jpn. Ser. II 2016, 94, 151–183. [Google Scholar] [CrossRef] [Green Version]
- Schmit, T.J.; Gunshor, M.M.; Menzel, W.P.; Gurka, J.J.; Li, J.; Bachmeier, A.S. Introducing the next-generation Advanced Baseline Imager on GOES-R. Bull. Am. Meteorol. Soc. 2005, 86, 1079–1096. [Google Scholar] [CrossRef]
- Schmit, T.J.; Griffith, P.; Gunshor, M.M.; Daniels, J.M.; Goodman, S.J.; Lebair, W.J. A closer look at the ABI on the GOES-R series. Bull. Am. Meteorol. Soc. 2017, 98, 681–698. [Google Scholar] [CrossRef]
- Yang, J.; Zhang, Z.; Wei, C.; Lu, F.; Guo, Q. Introducing the new generation of Chinese geostationary weather satellites, Fengyun-4. Bull. Am. Meteorol. Soc. 2017, 98, 1637–1658. [Google Scholar] [CrossRef]
- Min, M.; Wu, C.; Li, C.; Liu, H.; Xu, N.; Wu, X.; Chen, L.; Wang, F.; Sun, F.; Qin, D. Developing the science product algorithm testbed for Chinese next-generation geostationary meteorological satellites: Fengyun-4 series. J. Meteorol. Res. 2017, 31, 708–719. [Google Scholar] [CrossRef]
- Folland, C.K.; Palmer, T.N.; Parker, D.E. Sahel rainfall and worldwide sea temperatures, 1901–1985. Nature 1986, 320, 602. [Google Scholar] [CrossRef]
- Sud, Y.C.; Smith, W.E. Influence of Local Land-Surface Processes on the Indian Monsoon: A Numerical Study. J. Clim. Appl. Meteorol. 1985, 24, 1015–1036. [Google Scholar] [CrossRef] [Green Version]
- Da, C. Preliminary assessment of the Advanced Himawari Imager (AHI) measurement onboard Himawari-8 geostationary satellite. Remote Sens. Lett. 2015, 6, 637–646. [Google Scholar] [CrossRef]
- Li, J.; Wolf, W.W.; Menzel, W.P.; Zhang, W.; Huang, H.-L.; Achtor, T.H. Global soundings of the atmosphere from ATOVS measurements: The algorithm and validation. J. Appl. Meteorol. 2000, 39, 1248–1268. [Google Scholar] [CrossRef]
- Wang, P.; Li, J.; Li, J.; Li, Z.; Schmit, T.J.; Bai, W. Advanced infrared sounder subpixel cloud detection with imagers and its impact on radiance assimilation in NWP. Geophys. Res. Lett. 2014, 41, 1773–1780. [Google Scholar] [CrossRef]
- Lee, Y.-K.; Li, J.; Li, Z.; Schmit, T. Atmospheric temporal variations in the pre-landfall environment of typhoon Nangka (2015) observed by the Himawari-8 AHI. Asia-Pac. J. Atmos. Sci. 2017, 53, 431–443. [Google Scholar] [CrossRef]
- Liu, Z.; Min, M.; Li, J.; Sun, F.; Di, D.; Ai, Y.; Li, Z.; Qin, D.; Li, G.; Lin, Y. Local Severe Storm Tracking and Warning in Pre-Convection Stage from the New Generation Geostationary Weather Satellite Measurements. Remote Sens. 2019, 11, 383. [Google Scholar] [CrossRef] [Green Version]
- Bai, W.; Wu, C.; Li, J.; Wang, W. Impact of Terrain Altitude and Cloud Height on Ozone Remote Sensing from Satellite. J. Atmos. Ocean. Technol. 2014, 31, 903–912. [Google Scholar] [CrossRef]
- Di, D.; Ai, Y.; Li, J.; Shi, W.; Lu, N. Geostationary satellite-based 6.7 μm band best water vapor information layer analysis over the Tibetan Plateau. J. Geophys. Res. Atmos. 2016, 121, 4600–4613. [Google Scholar] [CrossRef] [Green Version]
- Schmit, T.J.; Li, J.; Lee, S.J.; Li, Z.; Dworak, R.; Lee, Y.-K.; Bowlan, M.; Gerth, J.; Martin, G.D.; Straka, W. Legacy atmospheric profiles and derived products from GOES-16: Validation and applications. Earth Space Sci. 2019, 6, 1730–1748. [Google Scholar] [CrossRef]
- Imai, T.; Yoshida, R. Algorithm theoretical basis for Himawari-8 cloud mask product. Meteorol. Satell. Cent. Tech. Note 2016, 61, 1–17. [Google Scholar]
- Li, J.; Li, Z.; Wang, P.; Schmit, T.J.; Bai, W.; Atlas, R. An efficient radiative transfer model for hyperspectral IR radiance simulation and applications under cloudy-sky conditions. J. Geophys. Res. Atmos. 2017, 122, 7600–7613. [Google Scholar] [CrossRef]
- Seemann, S.W.; Borbas, E.E.; Knuteson, R.O.; Stephenson, G.R.; Huang, H.-L. Development of a global infrared land surface emissivity database for application to clear sky sounding retrievals from multispectral satellite radiance measurements. J. Appl. Meteorol. Climatol. 2008, 47, 108–123. [Google Scholar] [CrossRef]
- Di, D.; Li, J.; Han, W.; Bai, W.; Wu, C.; Menzel, W.P. Enhancing the Fast Radiative Transfer Model for FengYun-4 GIIRS by Using Local Training Profiles. J. Geophys. Res. Atmos. 2018, 123, 12,583–12,596. [Google Scholar] [CrossRef]
- Di, D.; Min, M.; Li, J.; Gunshor, M.M. The Radiance Differences between Wavelength and Wavenumber Spaces in Convolving Hyperspectral Infrared Sounder Spectrum to Broadband for Intercomparison. Remote Sens. 2019, 11, 1177. [Google Scholar] [CrossRef] [Green Version]
- Kleist, D.T.; Parrish, D.F.; Derber, J.C.; Treadon, R.; Wu, W.-S.; Lord, S. Introduction of the GSI into the NCEP global data assimilation system. Weather Forecast. 2009, 24, 1691–1705. [Google Scholar] [CrossRef] [Green Version]
- Wu, W.-S.; Purser, R.J.; Parrish, D.F. Three-dimensional variational analysis with spatially inhomogeneous covariances. Mon. Weather Rev. 2002, 130, 2905–2916. [Google Scholar] [CrossRef] [Green Version]
- Lim, A.H.; Jung, J.A.; Huang, H.-L.A.; Ackerman, S.A.; Otkin, J.A. Assimilation of clear sky atmospheric infrared sounder radiances in short-term regional forecasts using community models. J. Appl. Remote Sens. 2014, 8, 083655. [Google Scholar] [CrossRef]
- Schwartz, C.S.; Liu, Z.; Lin, H.-C.; McKeen, S.A. Simultaneous three-dimensional variational assimilation of surface fine particulate matter and MODIS aerosol optical depth. J. Geophys. Res. Atmos. 2012, 117. [Google Scholar] [CrossRef]
- Wang, P.; Li, J.; Goldberg, M.D.; Schmit, T.J.; Lim, A.H.; Li, Z.; Han, H.; Li, J.; Ackerman, S.A. Assimilation of thermodynamic information from advanced infrared sounders under partially cloudy skies for regional NWP. J. Geophys. Res. Atmos. 2015, 120, 5469–5484. [Google Scholar] [CrossRef]
- Wang, P.; Li, J.; Li, Z.; Lim, A.H.; Li, J.; Schmit, T.J.; Goldberg, M.D. The Impact of Cross-track Infrared Sounder (CrIS) Cloud-Cleared Radiances on Hurricane Joaquin (2015) and Matthew (2016) Forecasts. J. Geophys. Res. Atmos. 2017, 122, 13–201. [Google Scholar] [CrossRef] [Green Version]
- Wang, P.; Li, J.; Lu, B.; Schmit, T.J.; Lu, J.; Lee, Y.-K.; Li, J.; Liu, Z. Impact of moisture information from advanced Himawari imager measurements on heavy precipitation forecasts in a regional NWP model. J. Geophys. Res. Atmos. 2018, 123, 6022–6038. [Google Scholar] [CrossRef]
- Wang, P.; Li, J.; Li, Z.; Lim, A.H.; Li, J.; Goldberg, M.D. Impacts of Observation Errors on Hurricane Forecasts when Assimilating Hyperspectral Infrared Sounder Radiances in Partially Cloudy Skies. J. Geophys. Res. Atmos. 2019, 124, 10802–10813. [Google Scholar] [CrossRef]
- Zhang, M.; Zupanski, M.; Kim, M.-J.; Knaff, J.A. Assimilating AMSU-A radiances in the TC core area with NOAA operational HWRF (2011) and a hybrid data assimilation system: Danielle (2010). Mon. Weather Rev. 2013, 141, 3889–3907. [Google Scholar] [CrossRef] [Green Version]
- Li, J.; Han, W. A step forward toward effectively using hyperspectral IR sounding information in NWP. Adv. Atmos. Sci. 2017, 34, 1263–1264. [Google Scholar] [CrossRef] [Green Version]
- Lee, J.-R.; Li, J.; Li, Z.; Wang, P.; Li, J. ABI water vapor radiance assimilation in a regional NWP model by accounting for the surface impact. Earth Space Sci. 2019, 6, 1652–1666. [Google Scholar] [CrossRef]
- Chung, E.-S.; Soden, B.J.; Sohn, B.-J.; Schmetz, J. Model-simulated humidity bias in the upper troposphere and its relation to the large-scale circulation. J. Geophys. Res. 2011, 116, D10110. [Google Scholar] [CrossRef]
- Iacono, M.J.; Delamere, J.S.; Mlawer, E.J.; Clough, S.A. Evaluation of upper tropospheric water vapor in the NCAR Community Climate Model (CCM3) using modeled and observed HIRS radiances. J. Geophys. Res. Atmos. 2003, 108, ACL 1-1–ACL 1-19. [Google Scholar] [CrossRef]
- Lim, A.H.N.; Jung, J.A.; Nebuda, S.E.; Daniels, J.M.; Bresky, W.; Tong, M.; Tallapragada, V. Tropical Cyclone Forecasts Impact Assessment from the Assimilation of Hourly Visible, Shortwave, and Clear-Air Water Vapor Atmospheric Motion Vectors in HWRF. Weather Forecast. 2019, 34, 177–198. [Google Scholar] [CrossRef]
- Li, Z.; Li, J.; Gunshor, M.; Moeller, S.-C.; Schmit, T.J.; Yu, F.; McCarty, W. Homogenized Water Vapor Absorption Band Radiances From International Geostationary Satellites. Geophys. Res. Lett. 2019, 46, 10599–10608. [Google Scholar] [CrossRef] [Green Version]


| NWP Models | Developed by | Domain | Temporal Resolution | Horizontal Resolution | Vertical Resolution |
|---|---|---|---|---|---|
| GFS | NCEP | Global | 6 h | 13 km for the first 240 h and 27 km from 240 to 384 h | 64 levels through 384 h |
| UM | Met Office | 16 km | 70 levels | ||
| WRF | NCAR, NOAA | Regional | 12km | 51 levels |
| Channels | Channel 8 | Channel 9 | Channel 10 | |||
|---|---|---|---|---|---|---|
| (Unit/K) | Mean | STD | Mean | STD | Mean | STD |
| WRF (GTS only) | −1.6862 | 2.685 | −1.6812 | 2.343 | −0.3773 | 1.9742 |
| WRF(GTS+JPSS) | −0.9132 | 2.6005 | −1.5845 | 2.2406 | −0.2212 | 1.9506 |
© 2020 by the authors. Licensee MDPI, Basel, Switzerland. This article is an open access article distributed under the terms and conditions of the Creative Commons Attribution (CC BY) license (http://creativecommons.org/licenses/by/4.0/).
Share and Cite
Jiang, X.; Li, J.; Li, Z.; Xue, Y.; Di, D.; Wang, P.; Li, J. Evaluation of Environmental Moisture from NWP Models with Measurements from Advanced Geostationary Satellite Imager—A Case Study. Remote Sens. 2020, 12, 670. https://0-doi-org.brum.beds.ac.uk/10.3390/rs12040670
Jiang X, Li J, Li Z, Xue Y, Di D, Wang P, Li J. Evaluation of Environmental Moisture from NWP Models with Measurements from Advanced Geostationary Satellite Imager—A Case Study. Remote Sensing. 2020; 12(4):670. https://0-doi-org.brum.beds.ac.uk/10.3390/rs12040670
Chicago/Turabian StyleJiang, Xiaowei, Jun Li, Zhenglong Li, Yunheng Xue, Di Di, Pei Wang, and Jinlong Li. 2020. "Evaluation of Environmental Moisture from NWP Models with Measurements from Advanced Geostationary Satellite Imager—A Case Study" Remote Sensing 12, no. 4: 670. https://0-doi-org.brum.beds.ac.uk/10.3390/rs12040670