A Precise Indoor Visual Positioning Approach Using a Built Image Feature Database and Single User Image from Smartphone Cameras


Abstract
:
1. Introduction
2. Related Work
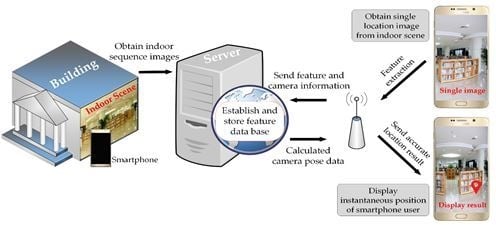
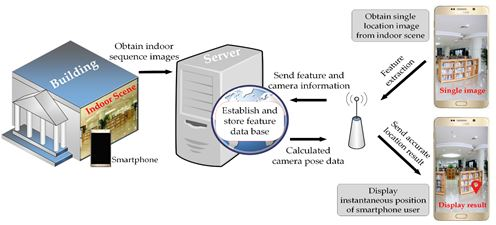
3. Methodology
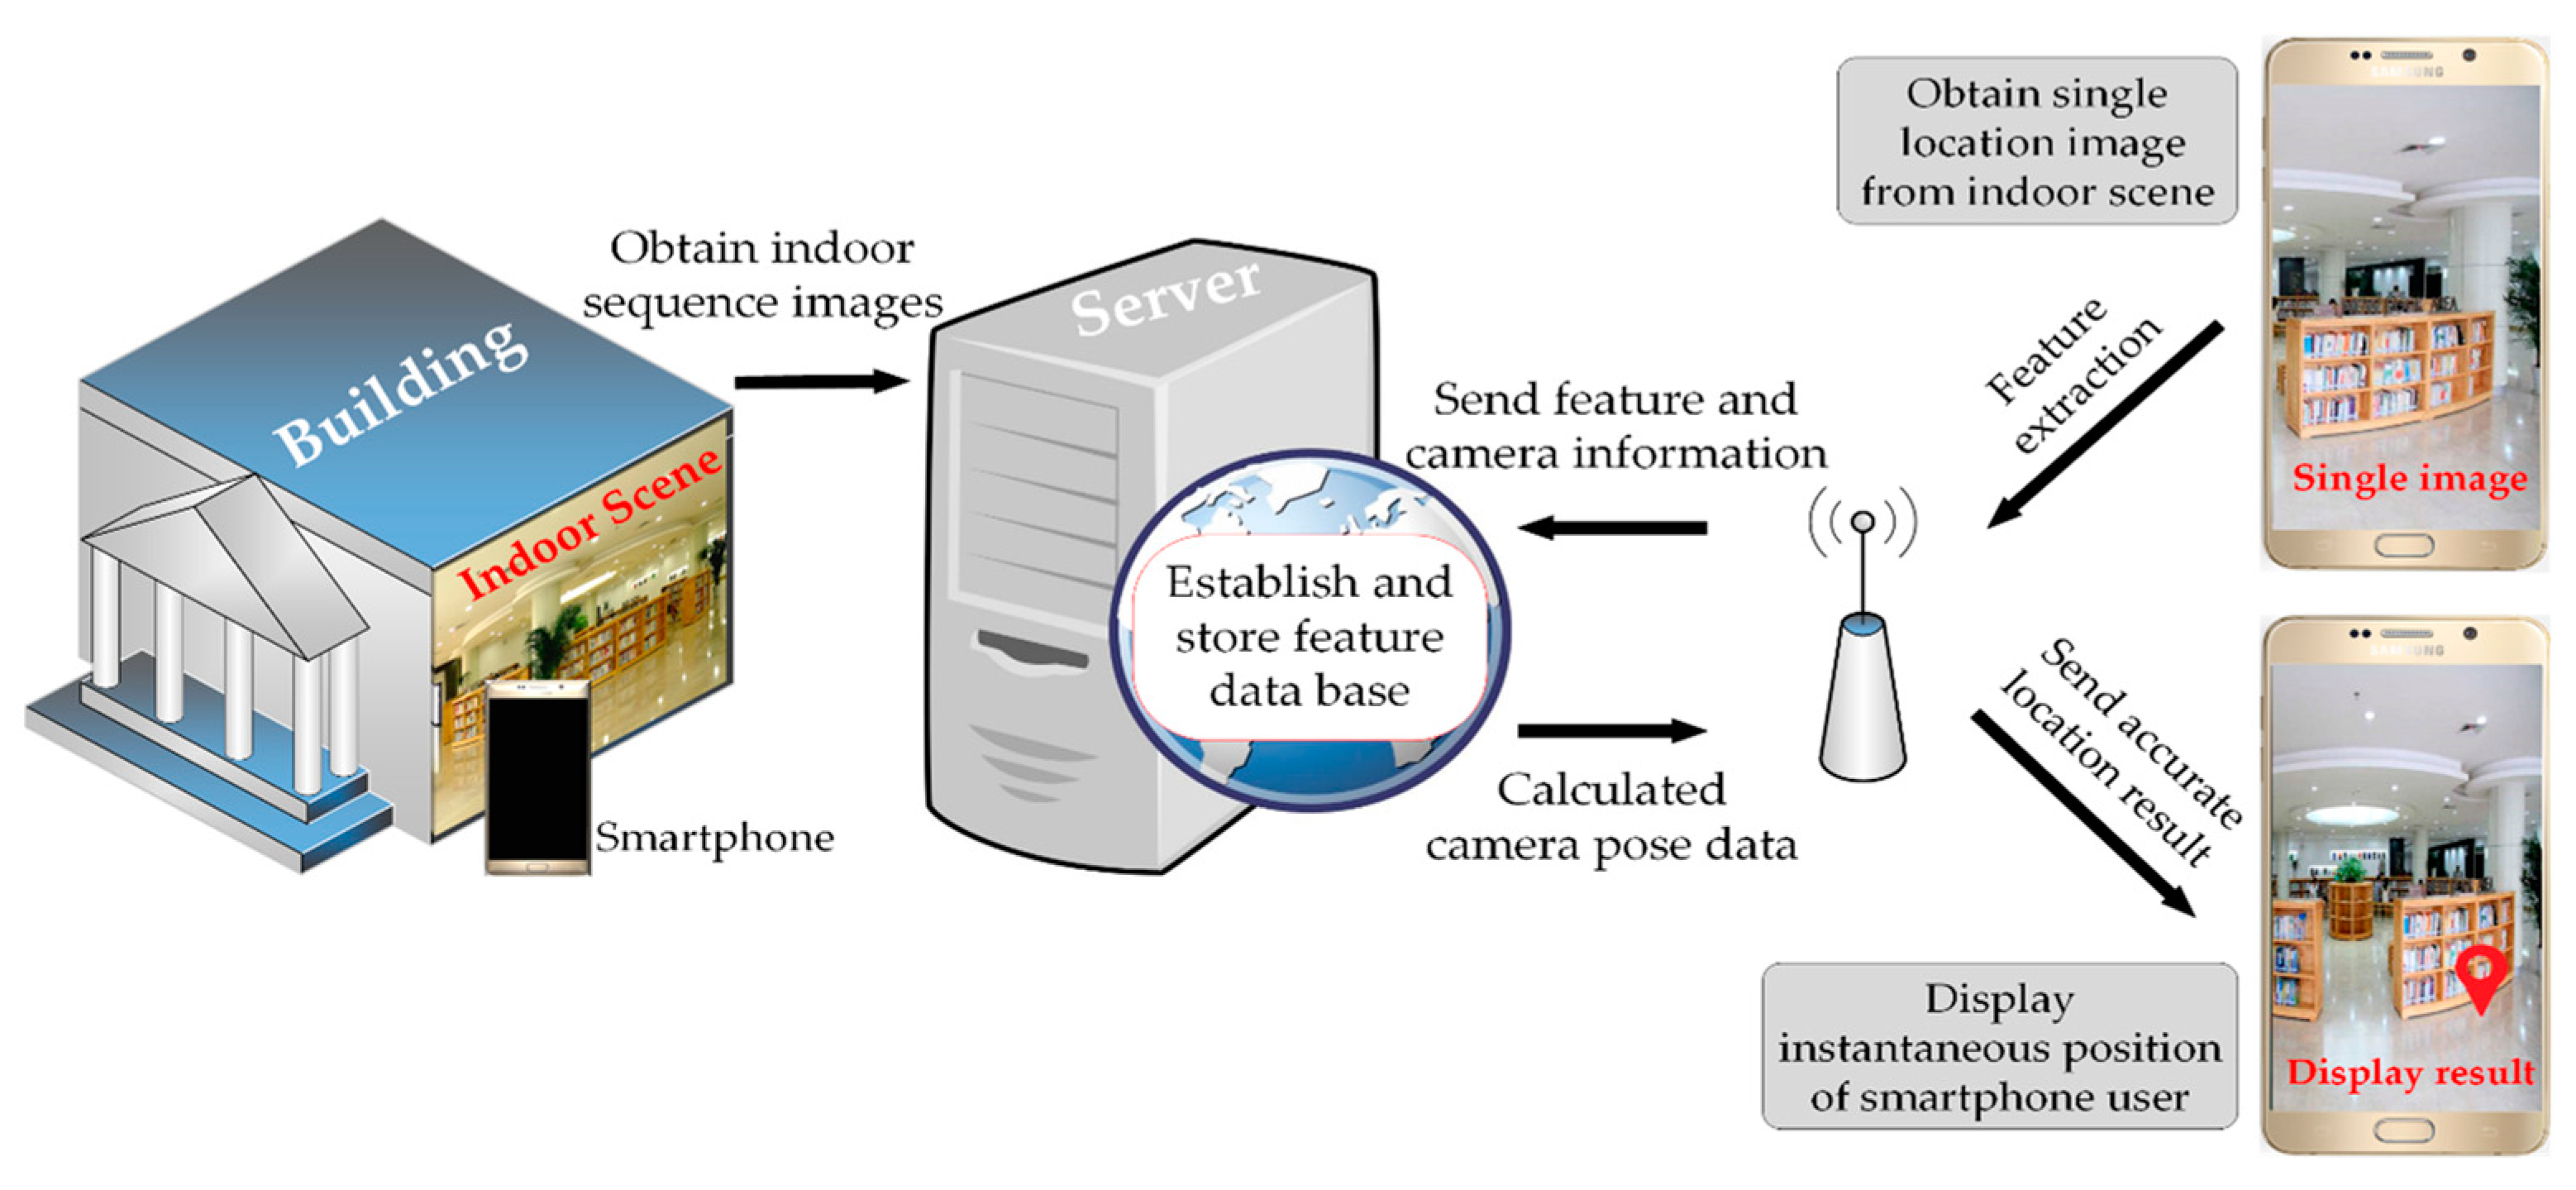
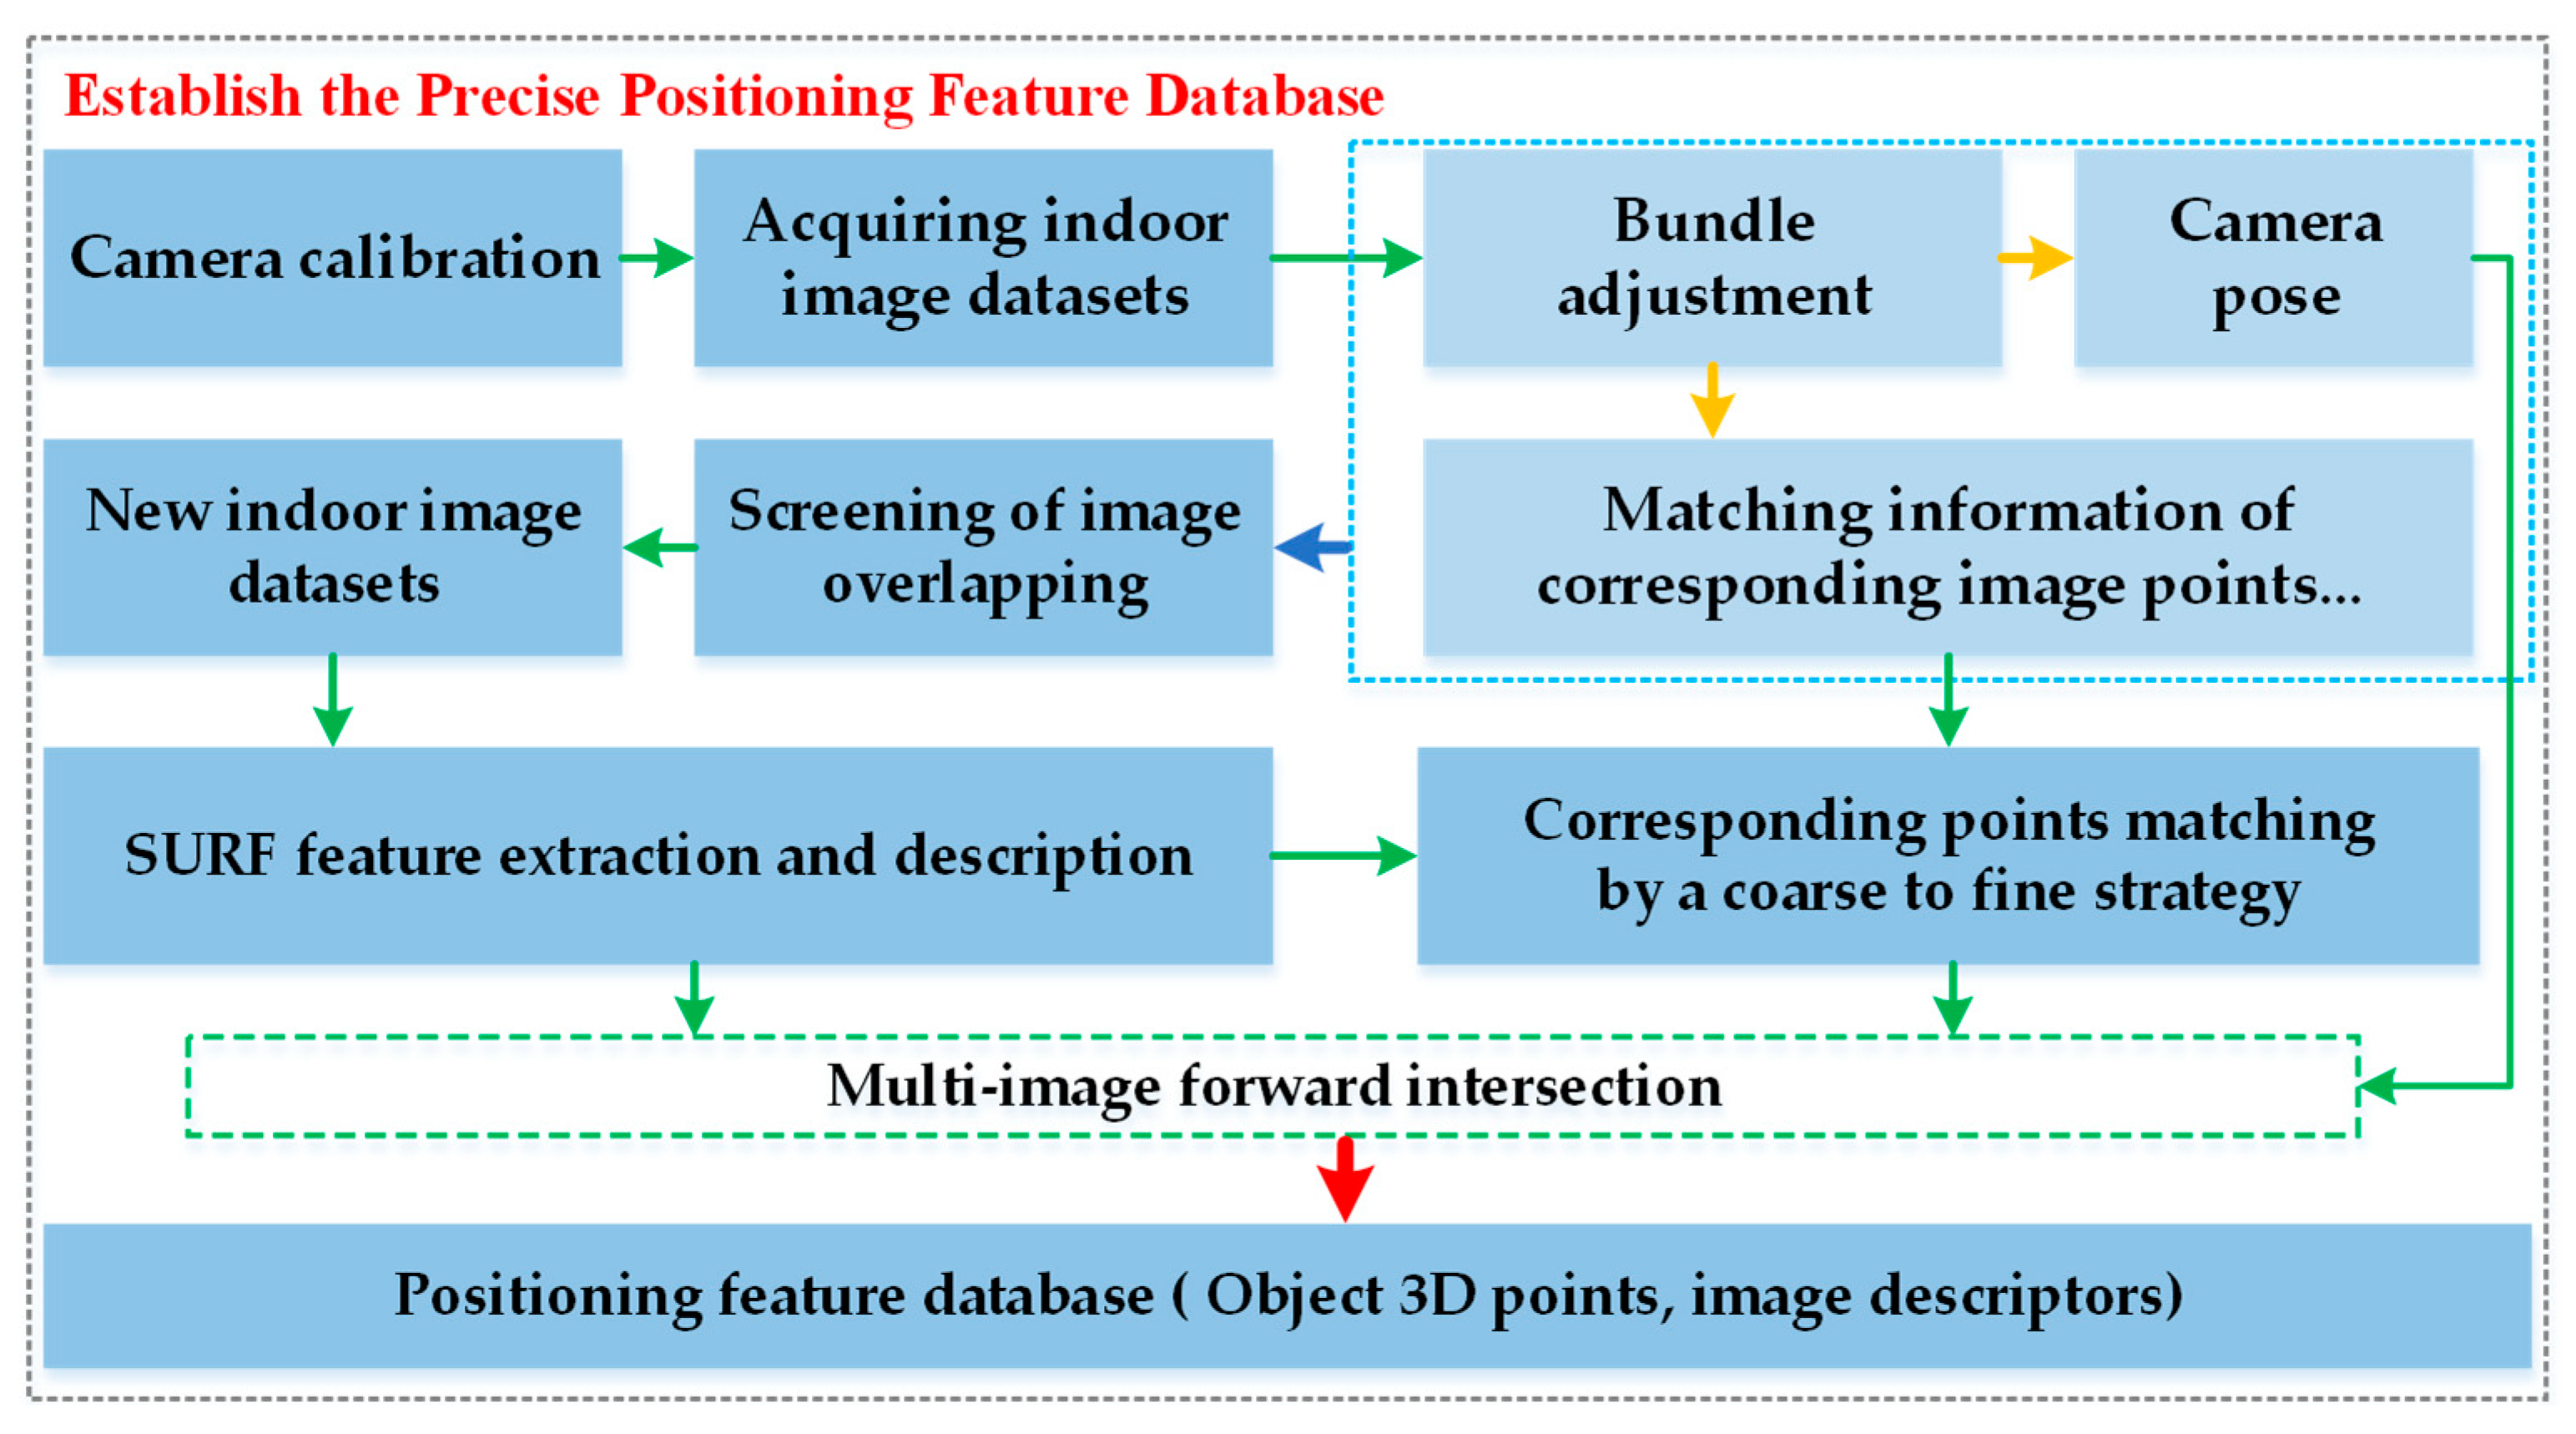
3.1. Precise Positioning Feature Database Establishment
3.1.1. Obtaining and Pre-Processing the Indoor Image Data Set
3.1.2. Accelerated Image Feature Matching
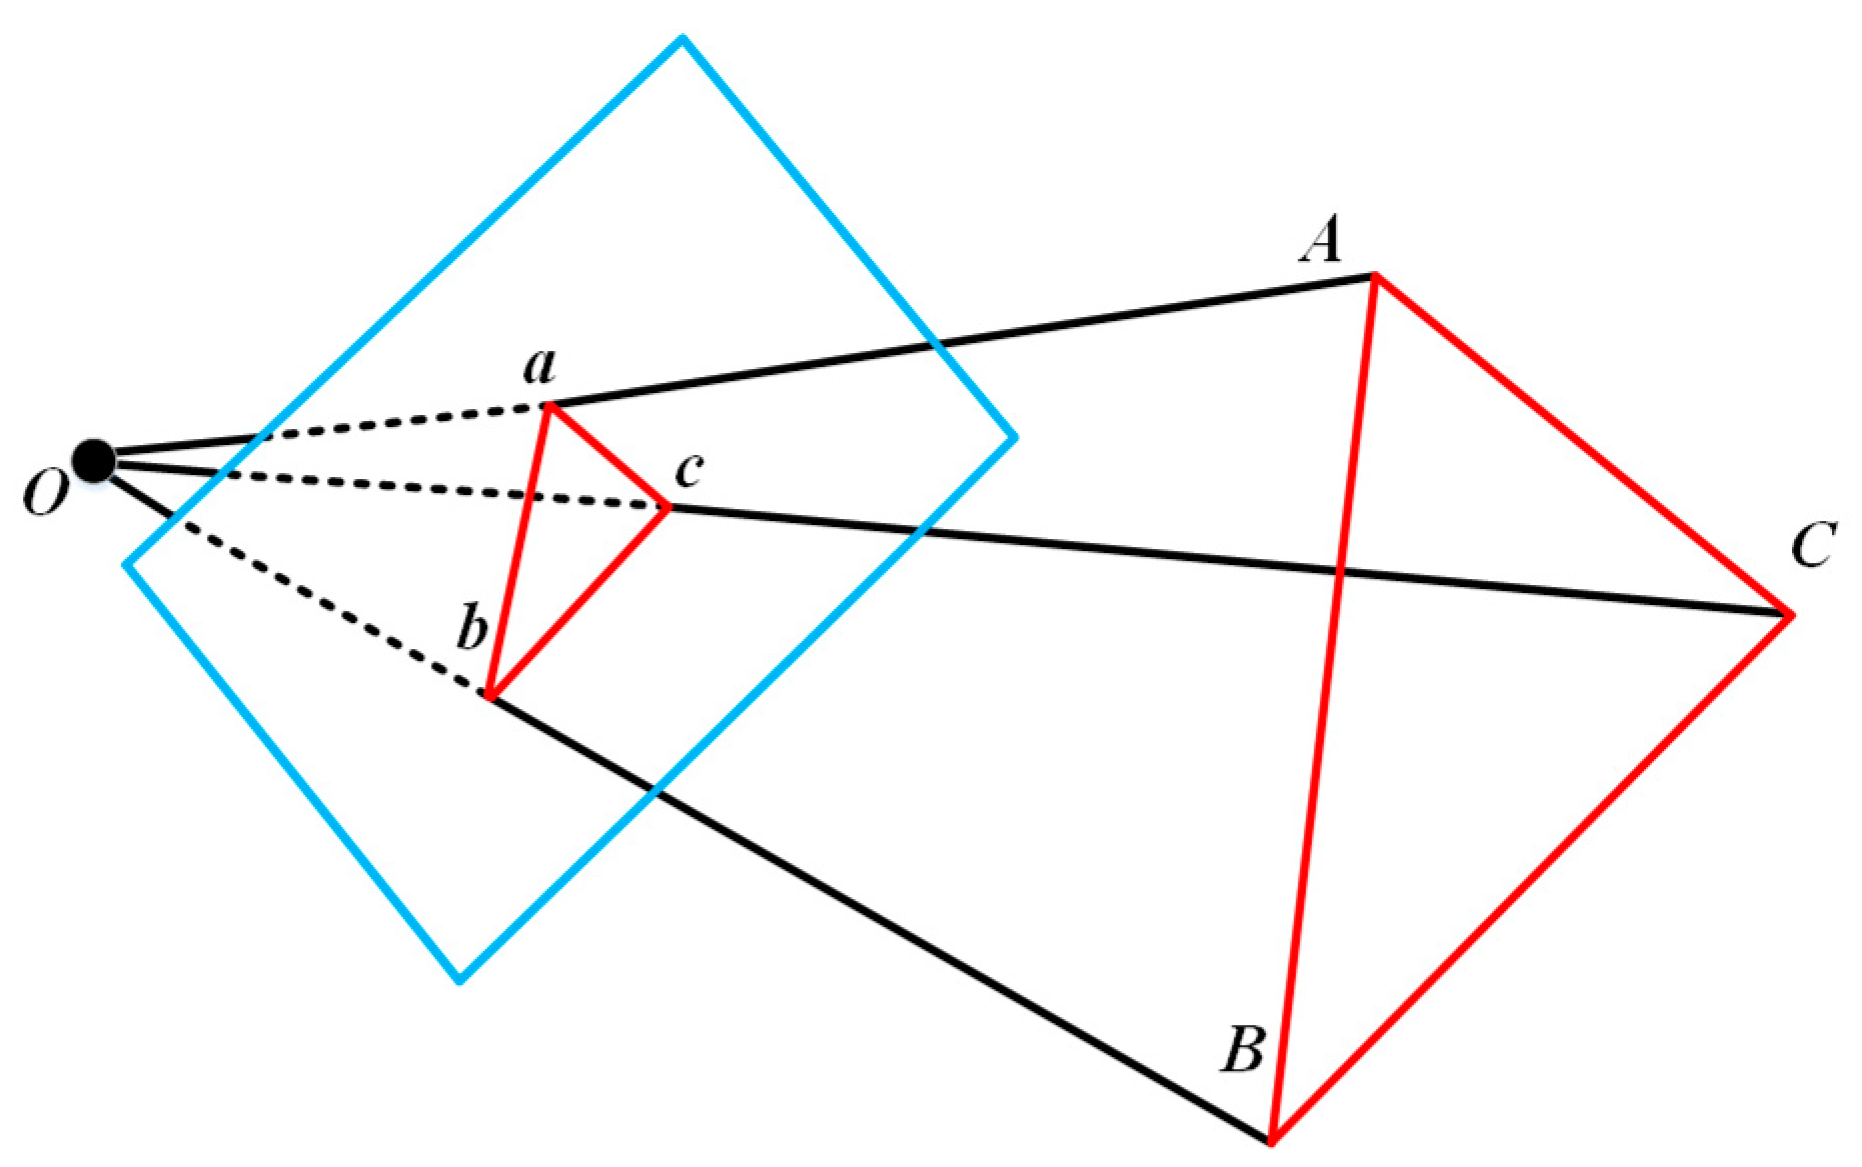
3.1.3. Multi-Image Spatial Forward Intersection
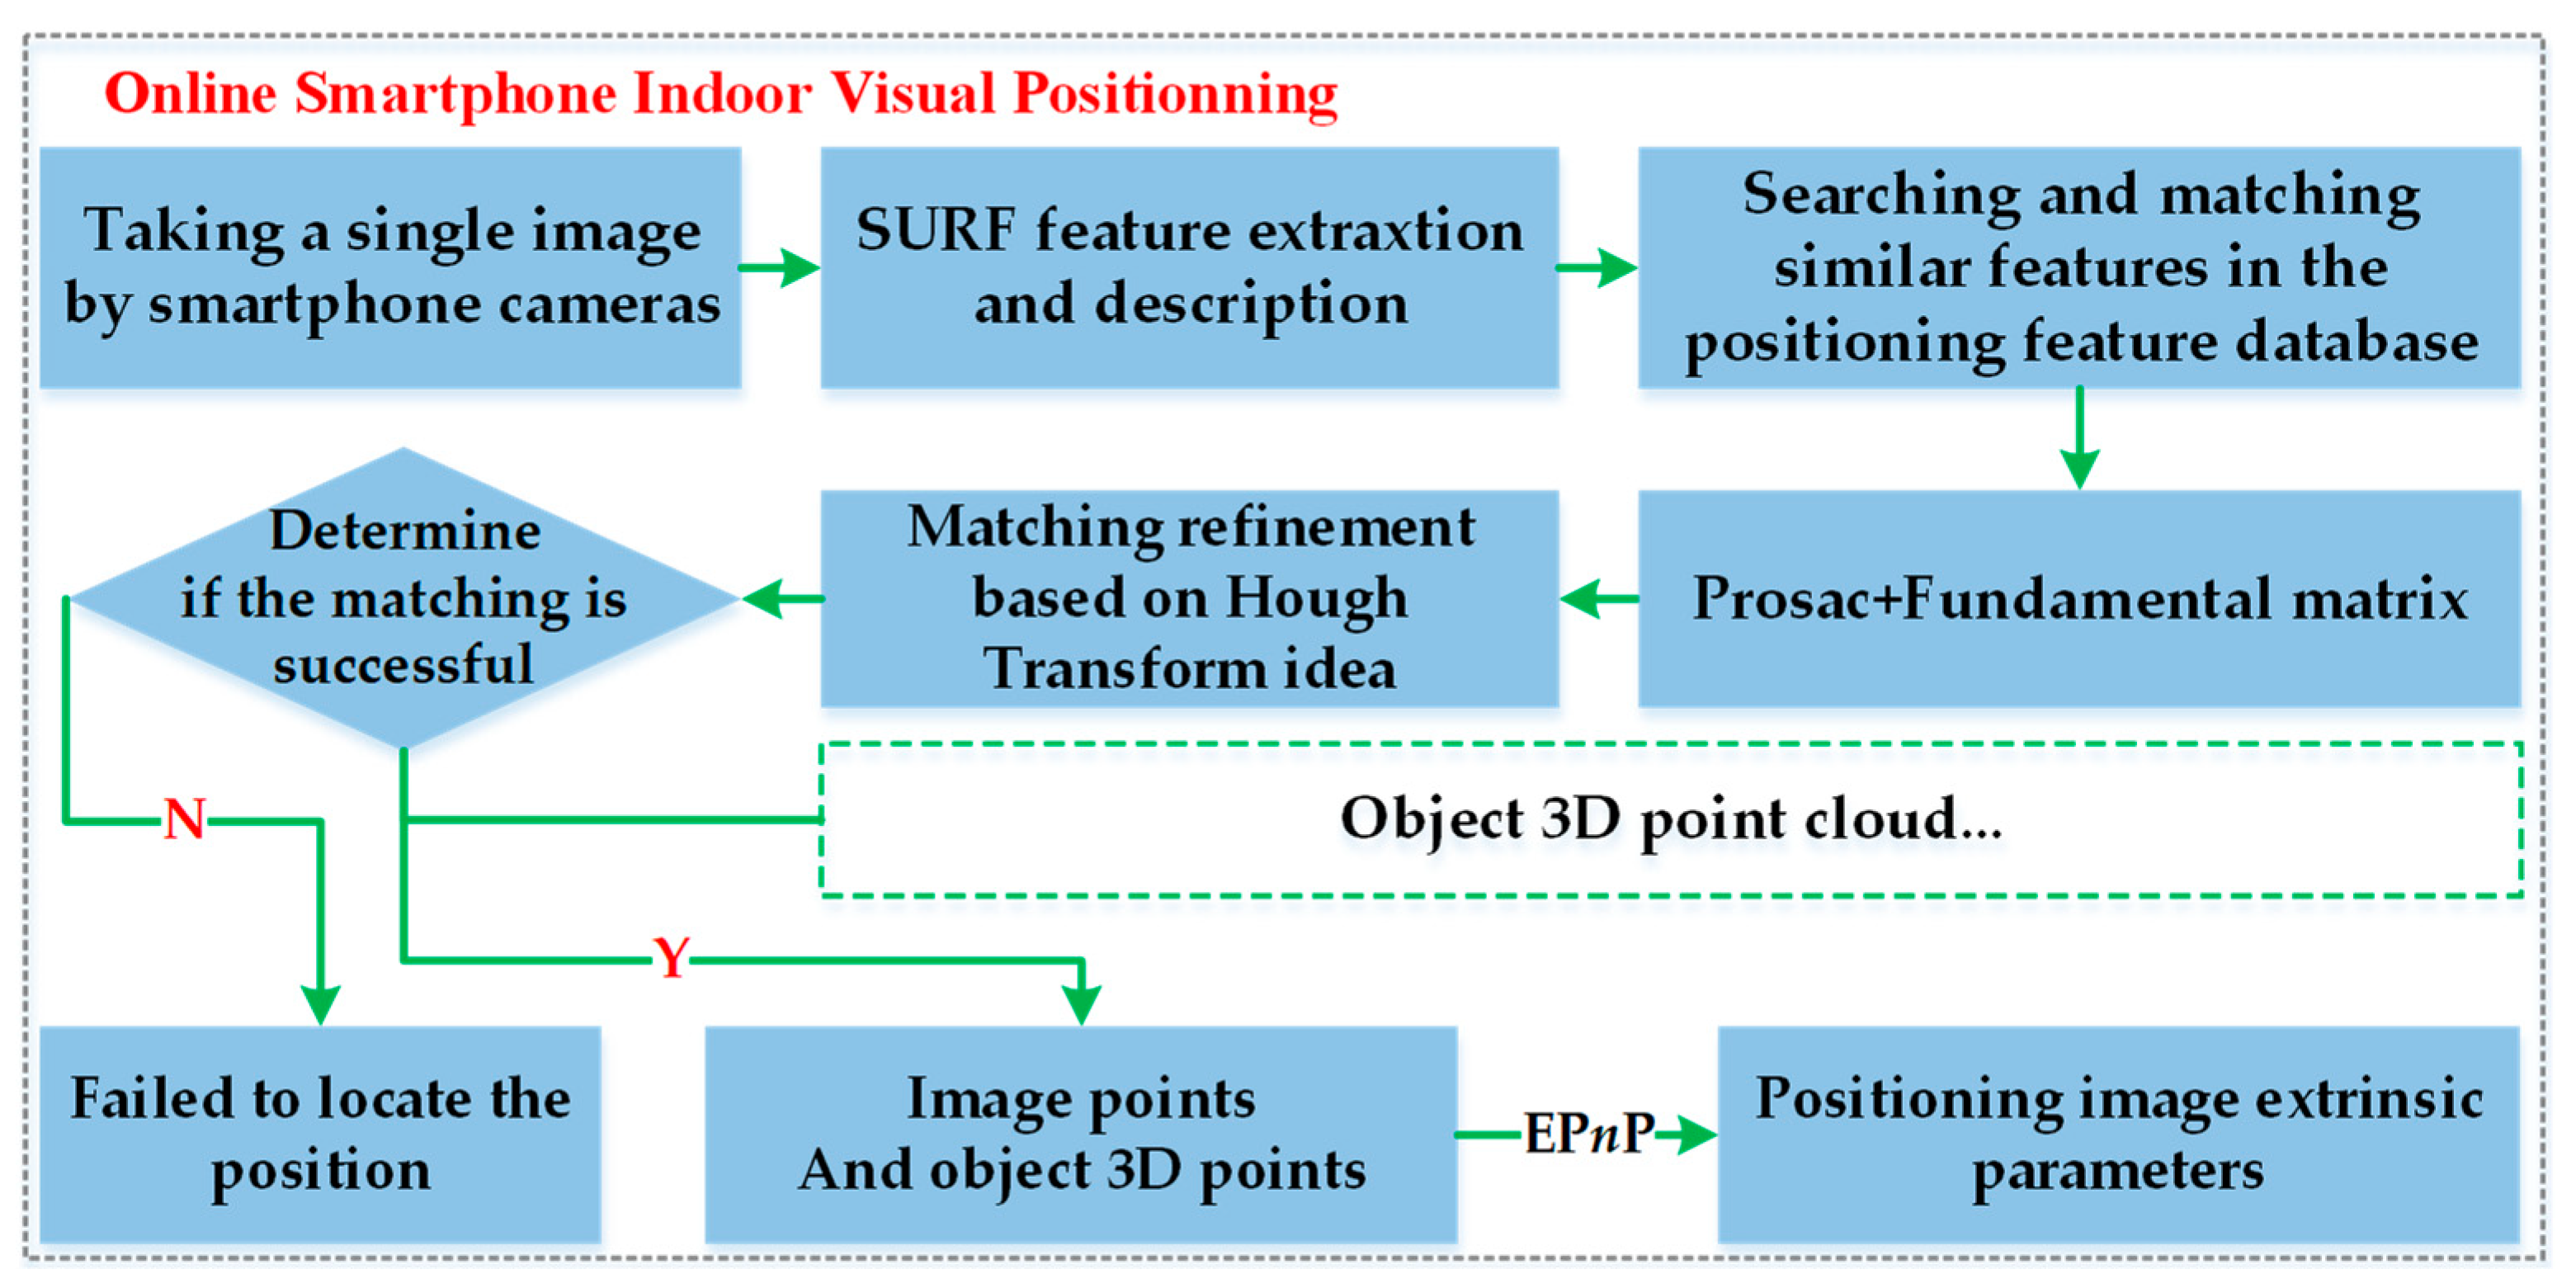
3.2. Online Smartphone Indoor Visual Positioning
3.2.1. SURF Feature Retrieval and Matching in Positioning Feature Database
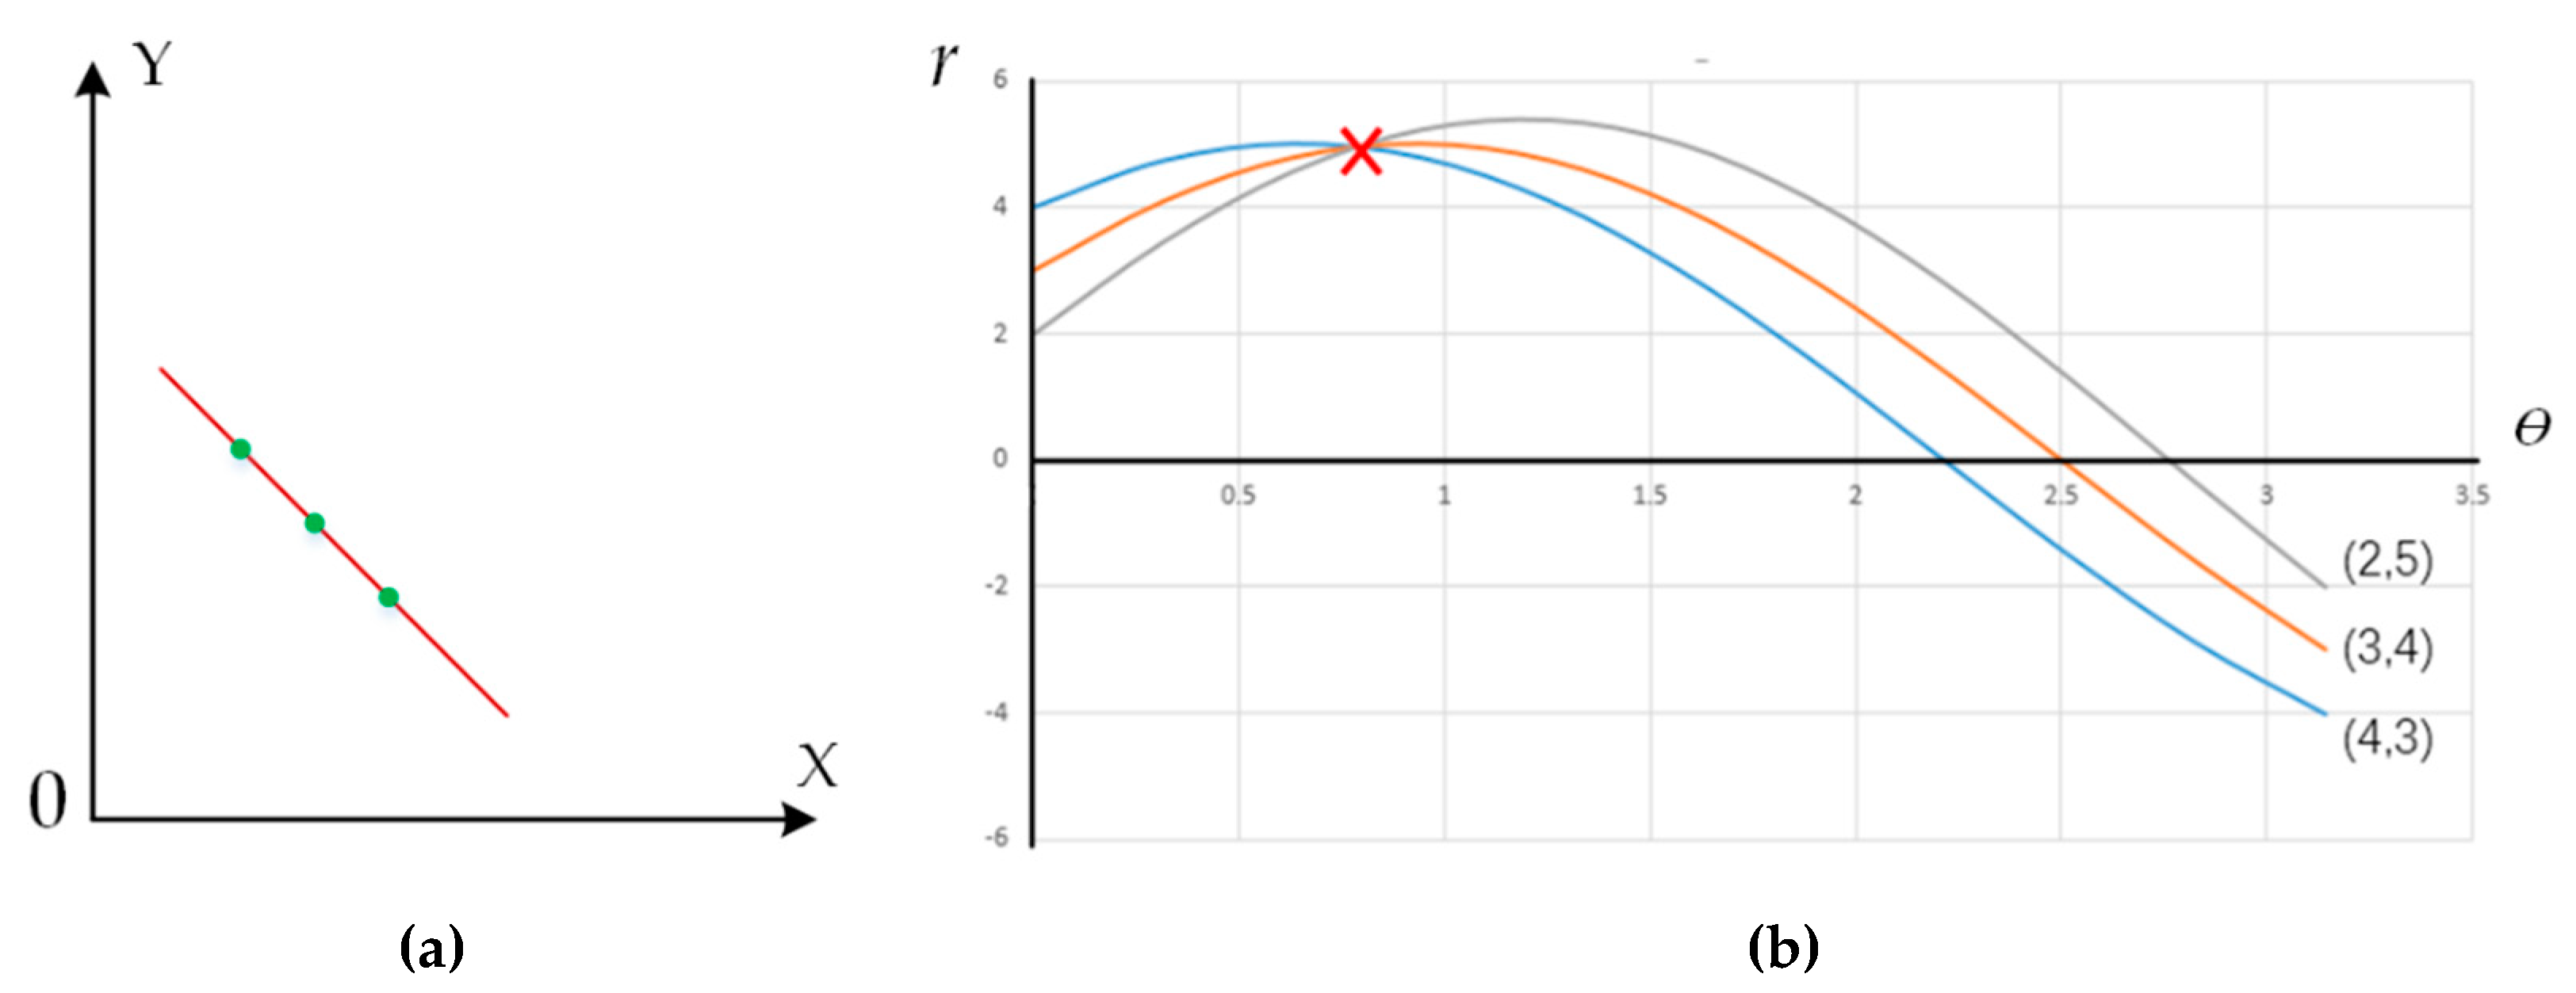
3.2.2. Matching Error Elimination Based on Hough Transform Voting Idea
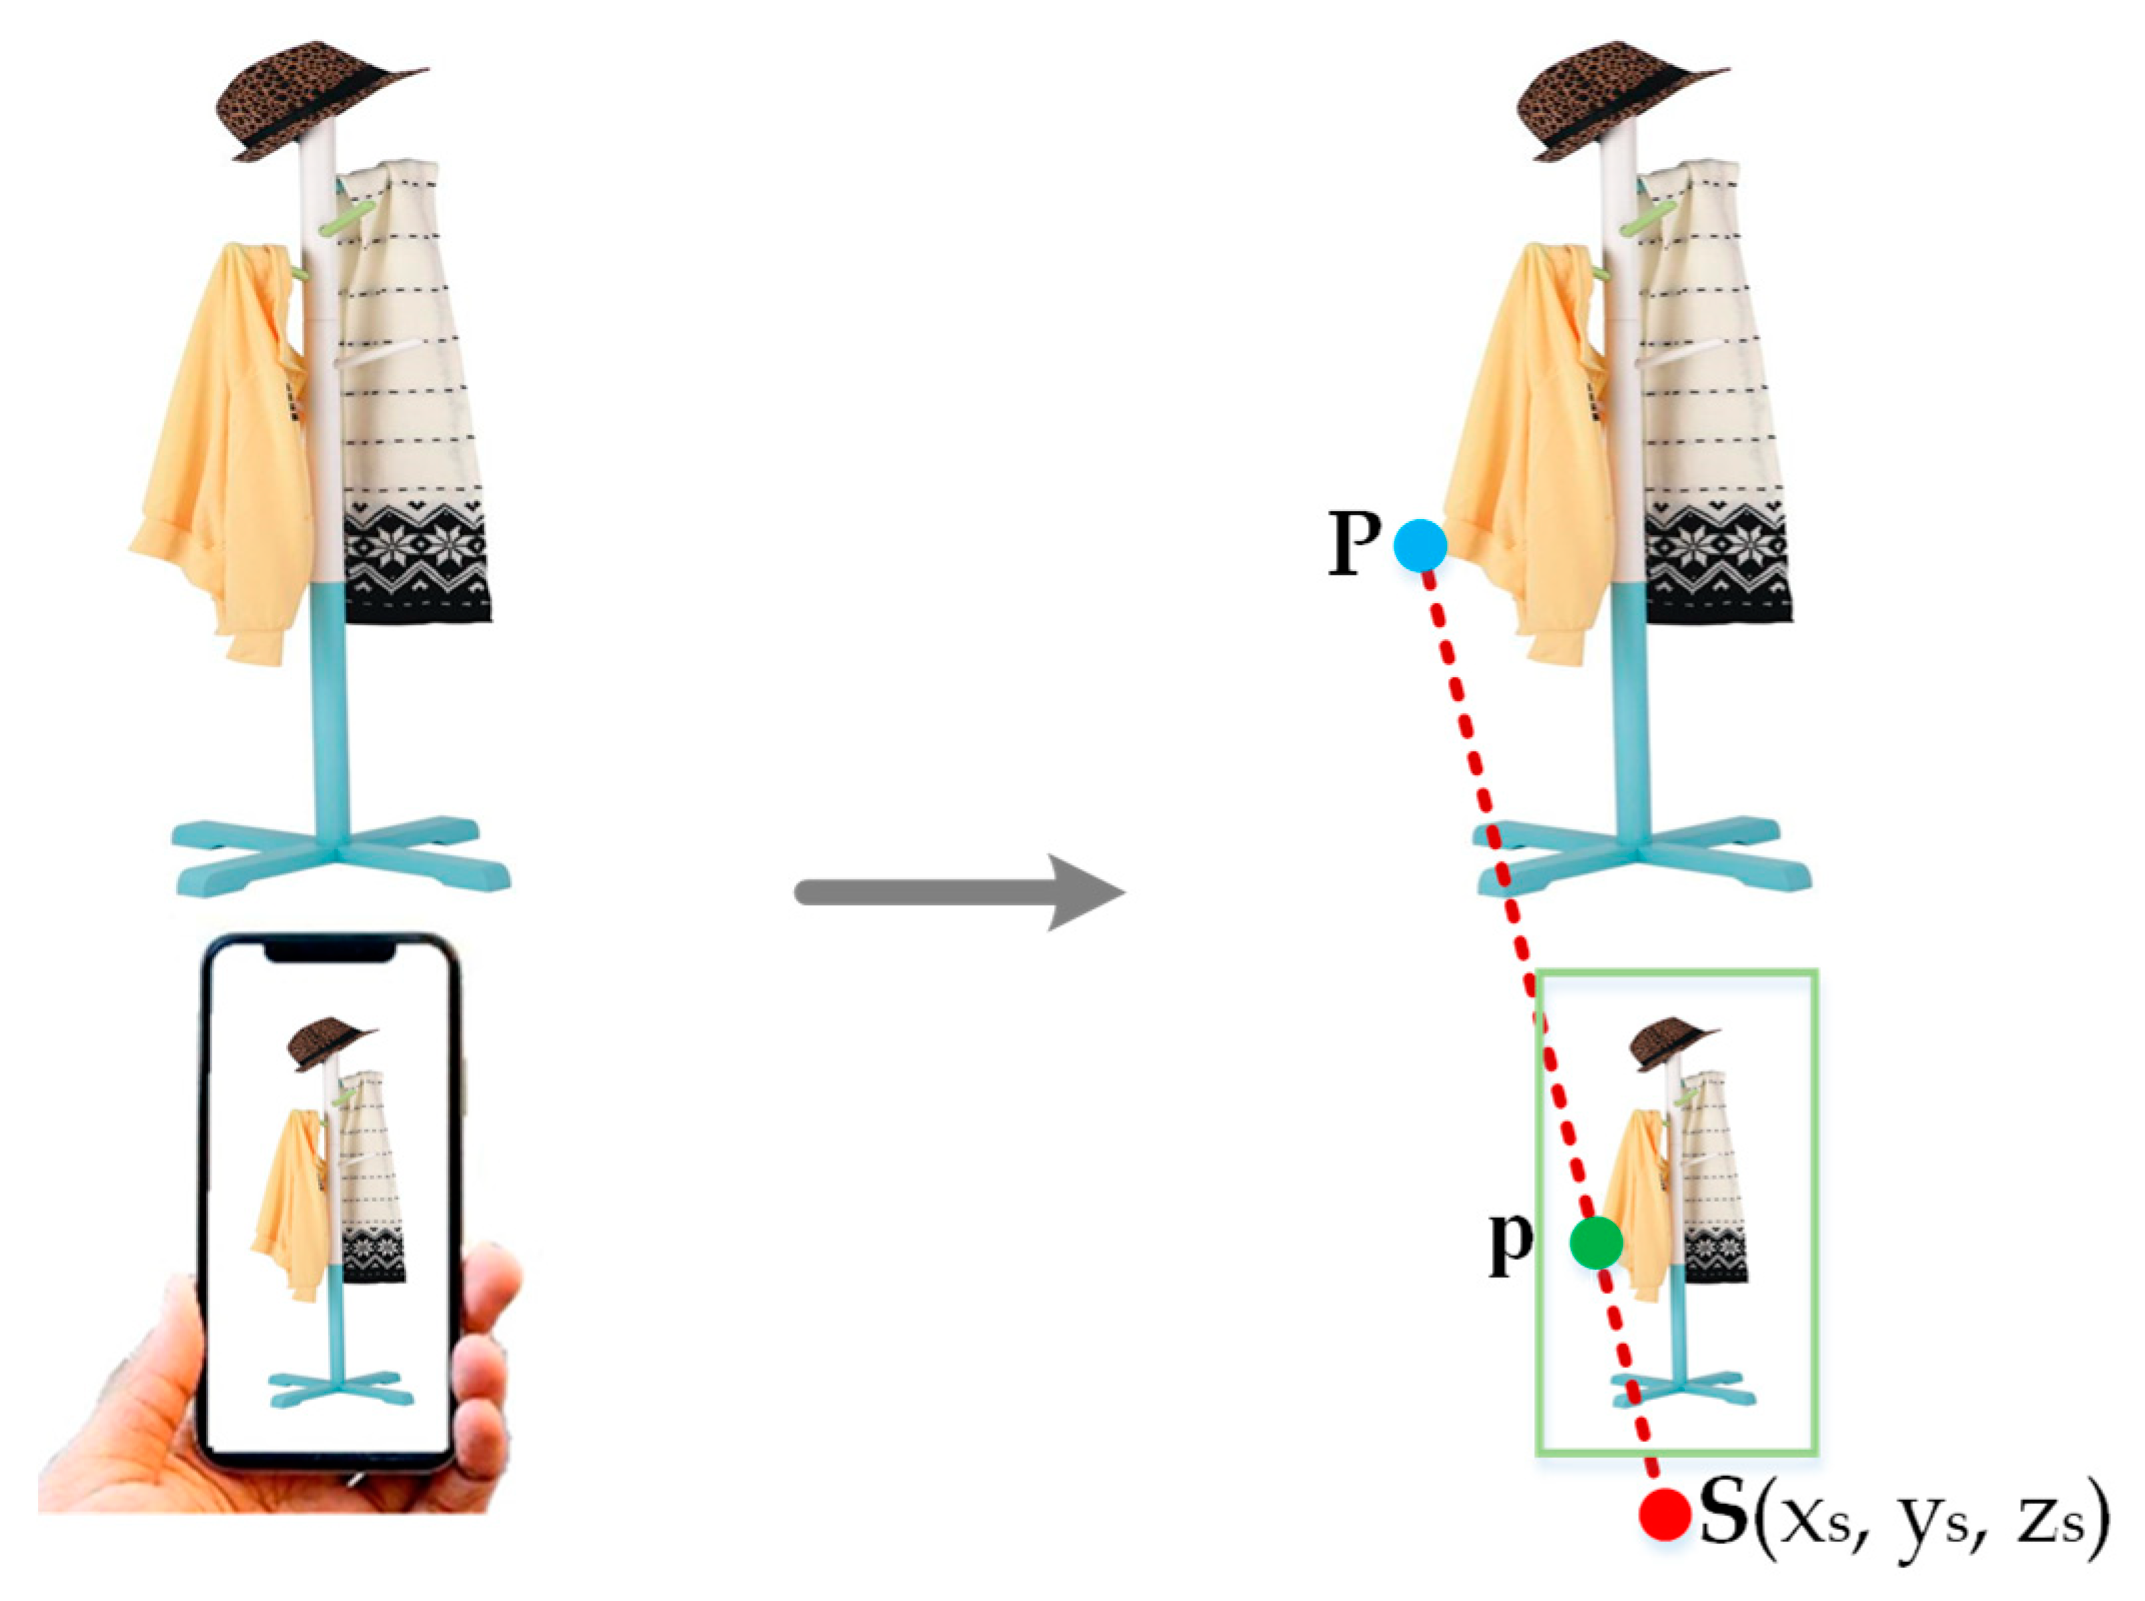
3.2.3. Single Image Positioning
4. Experimental Analysis
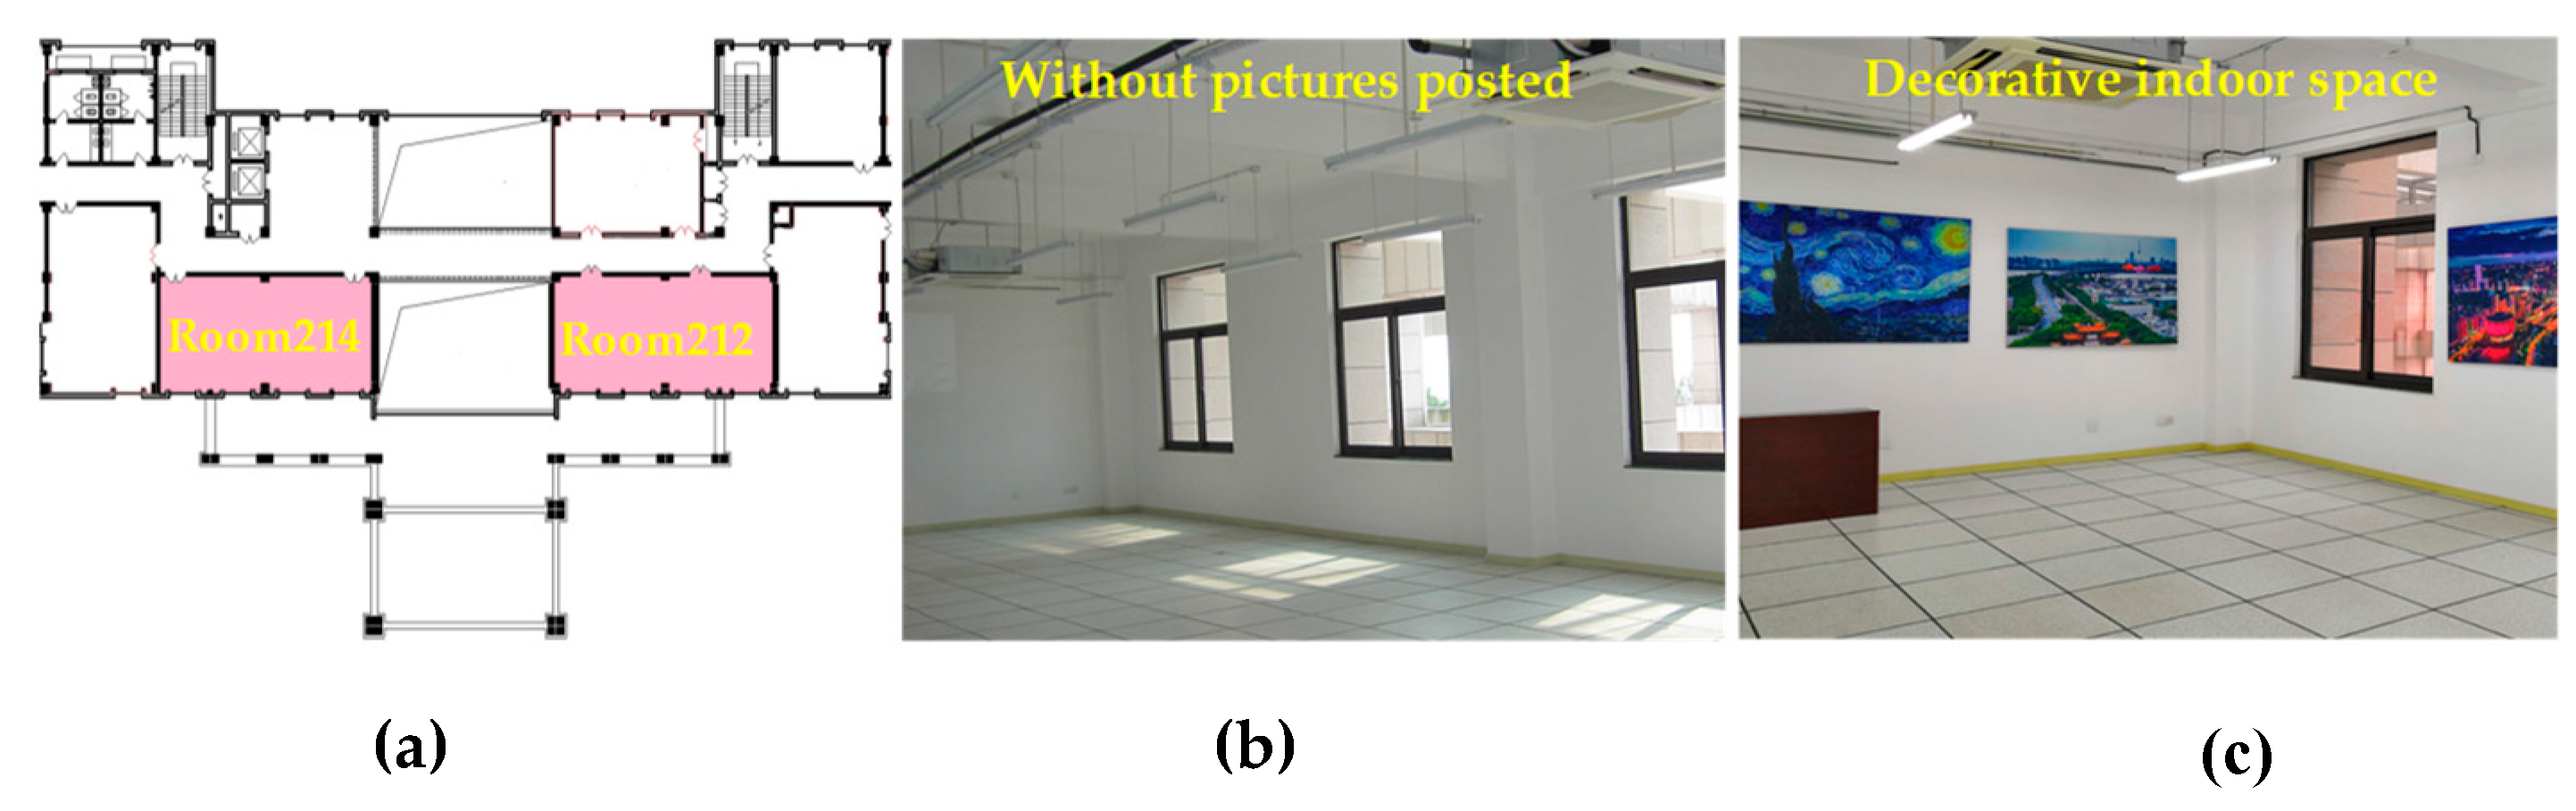
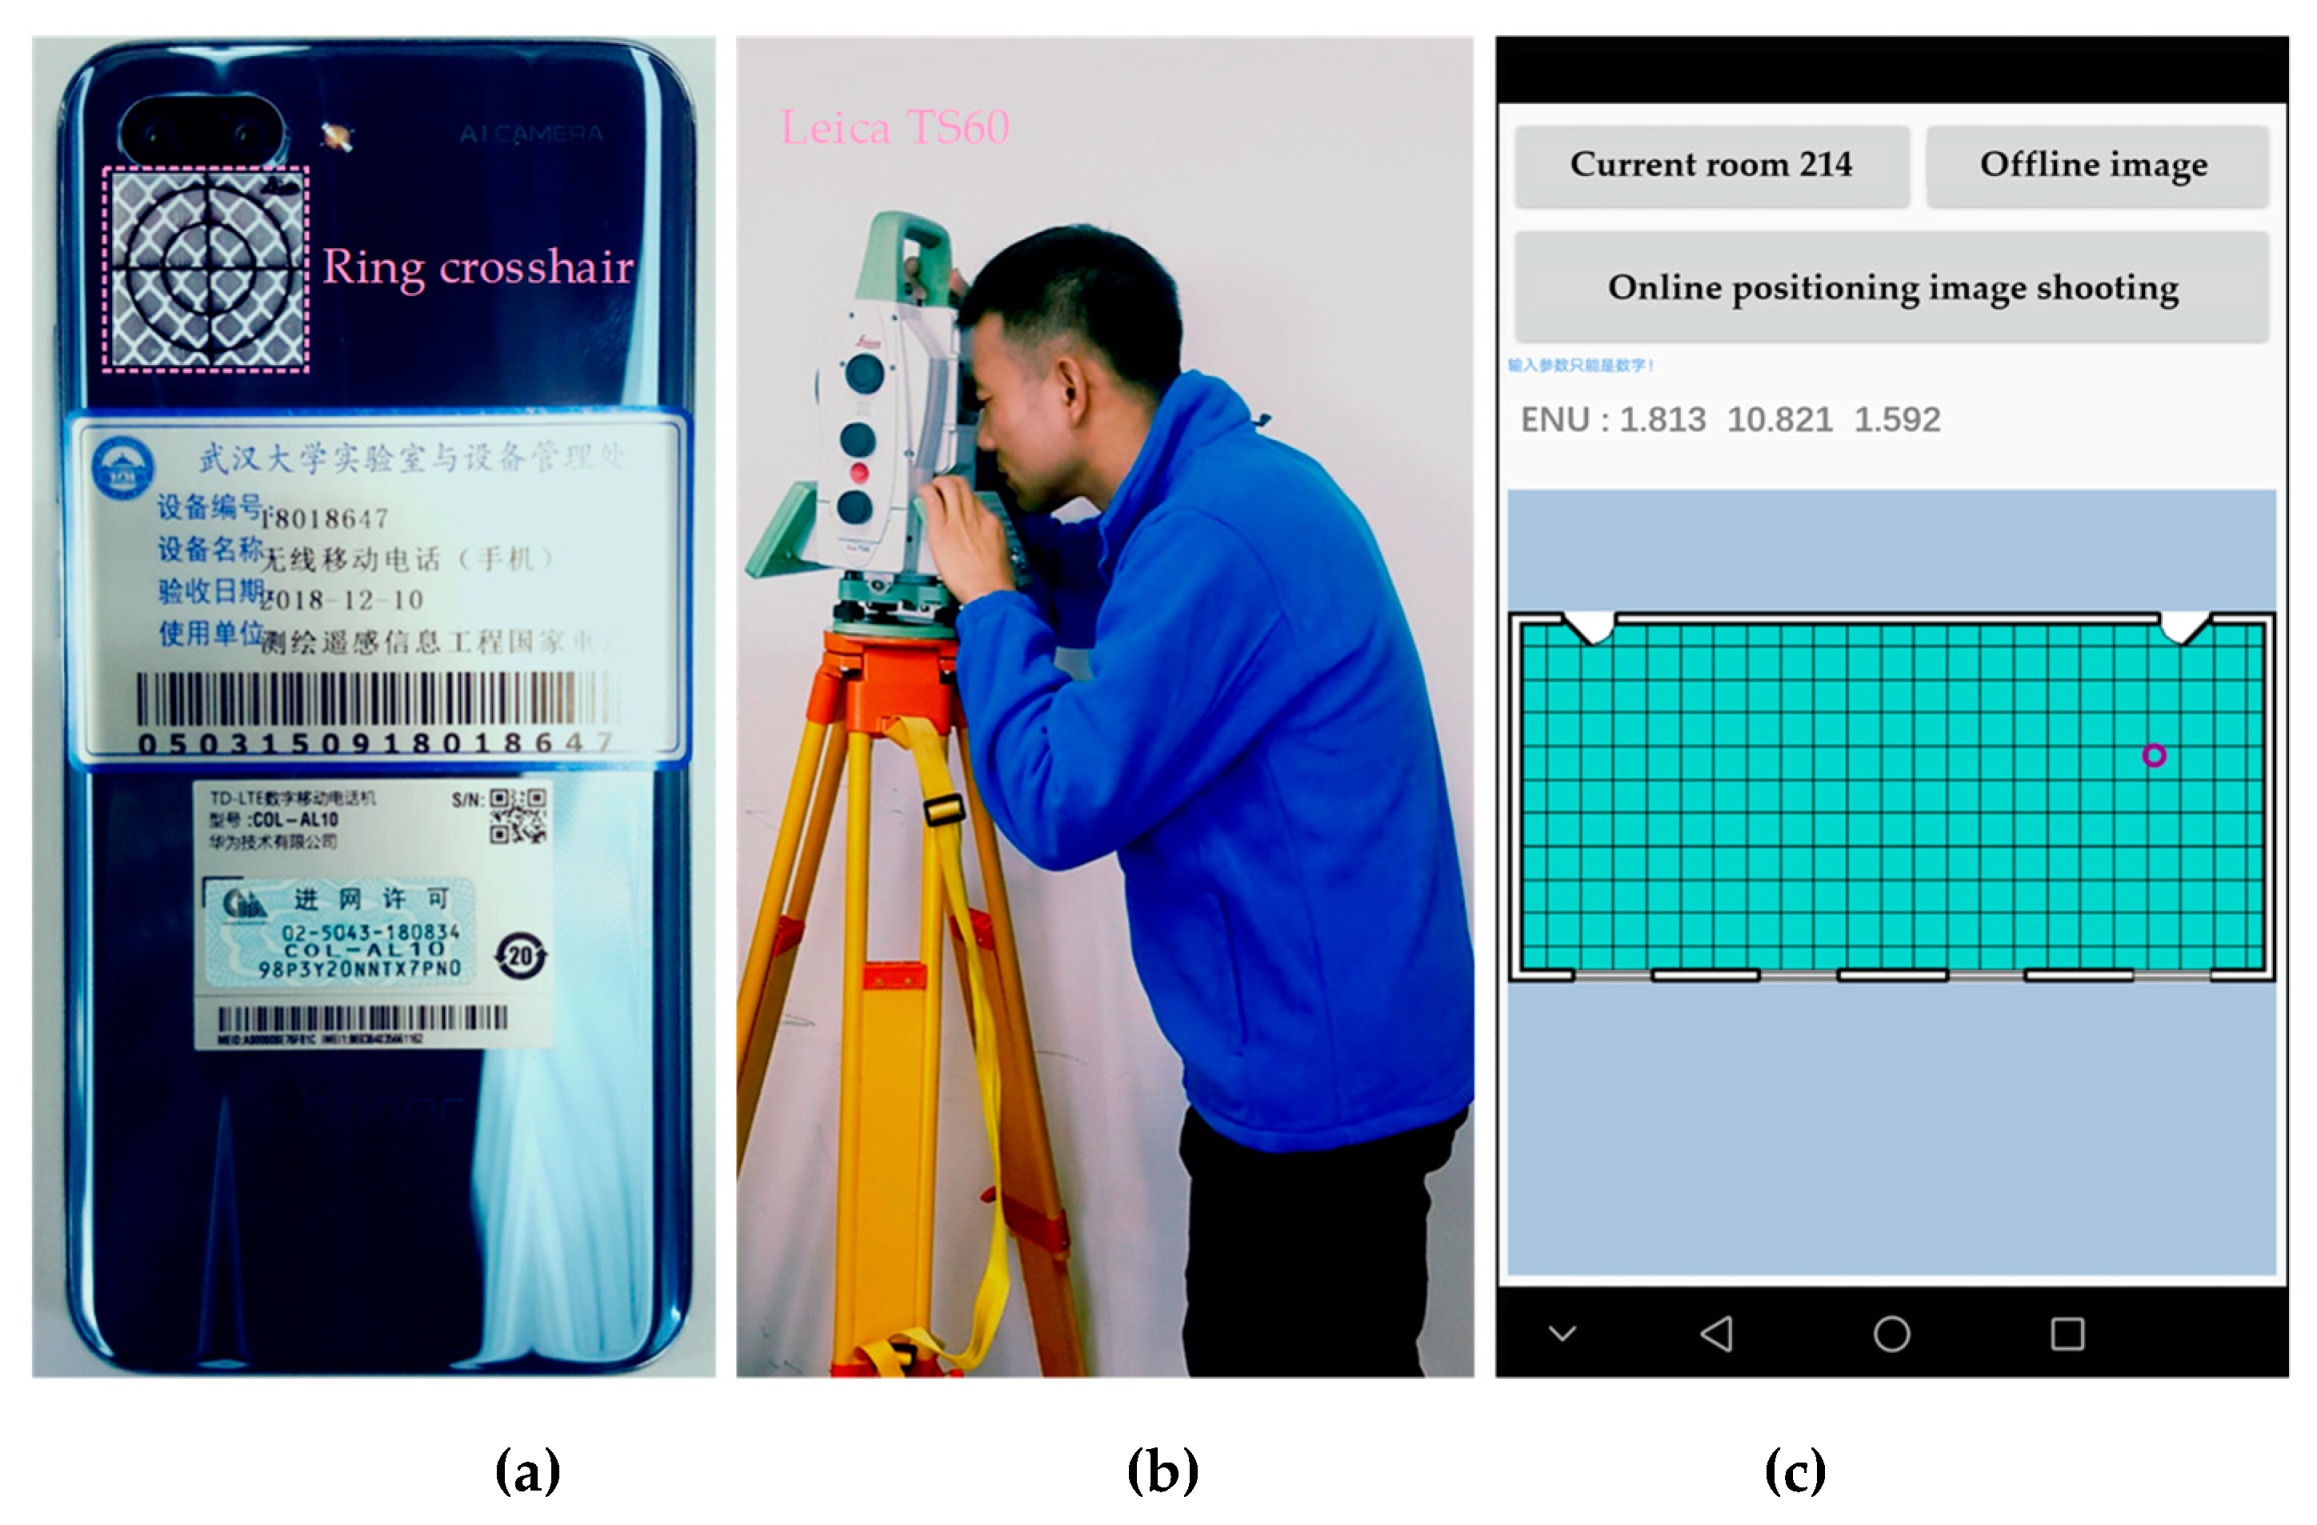
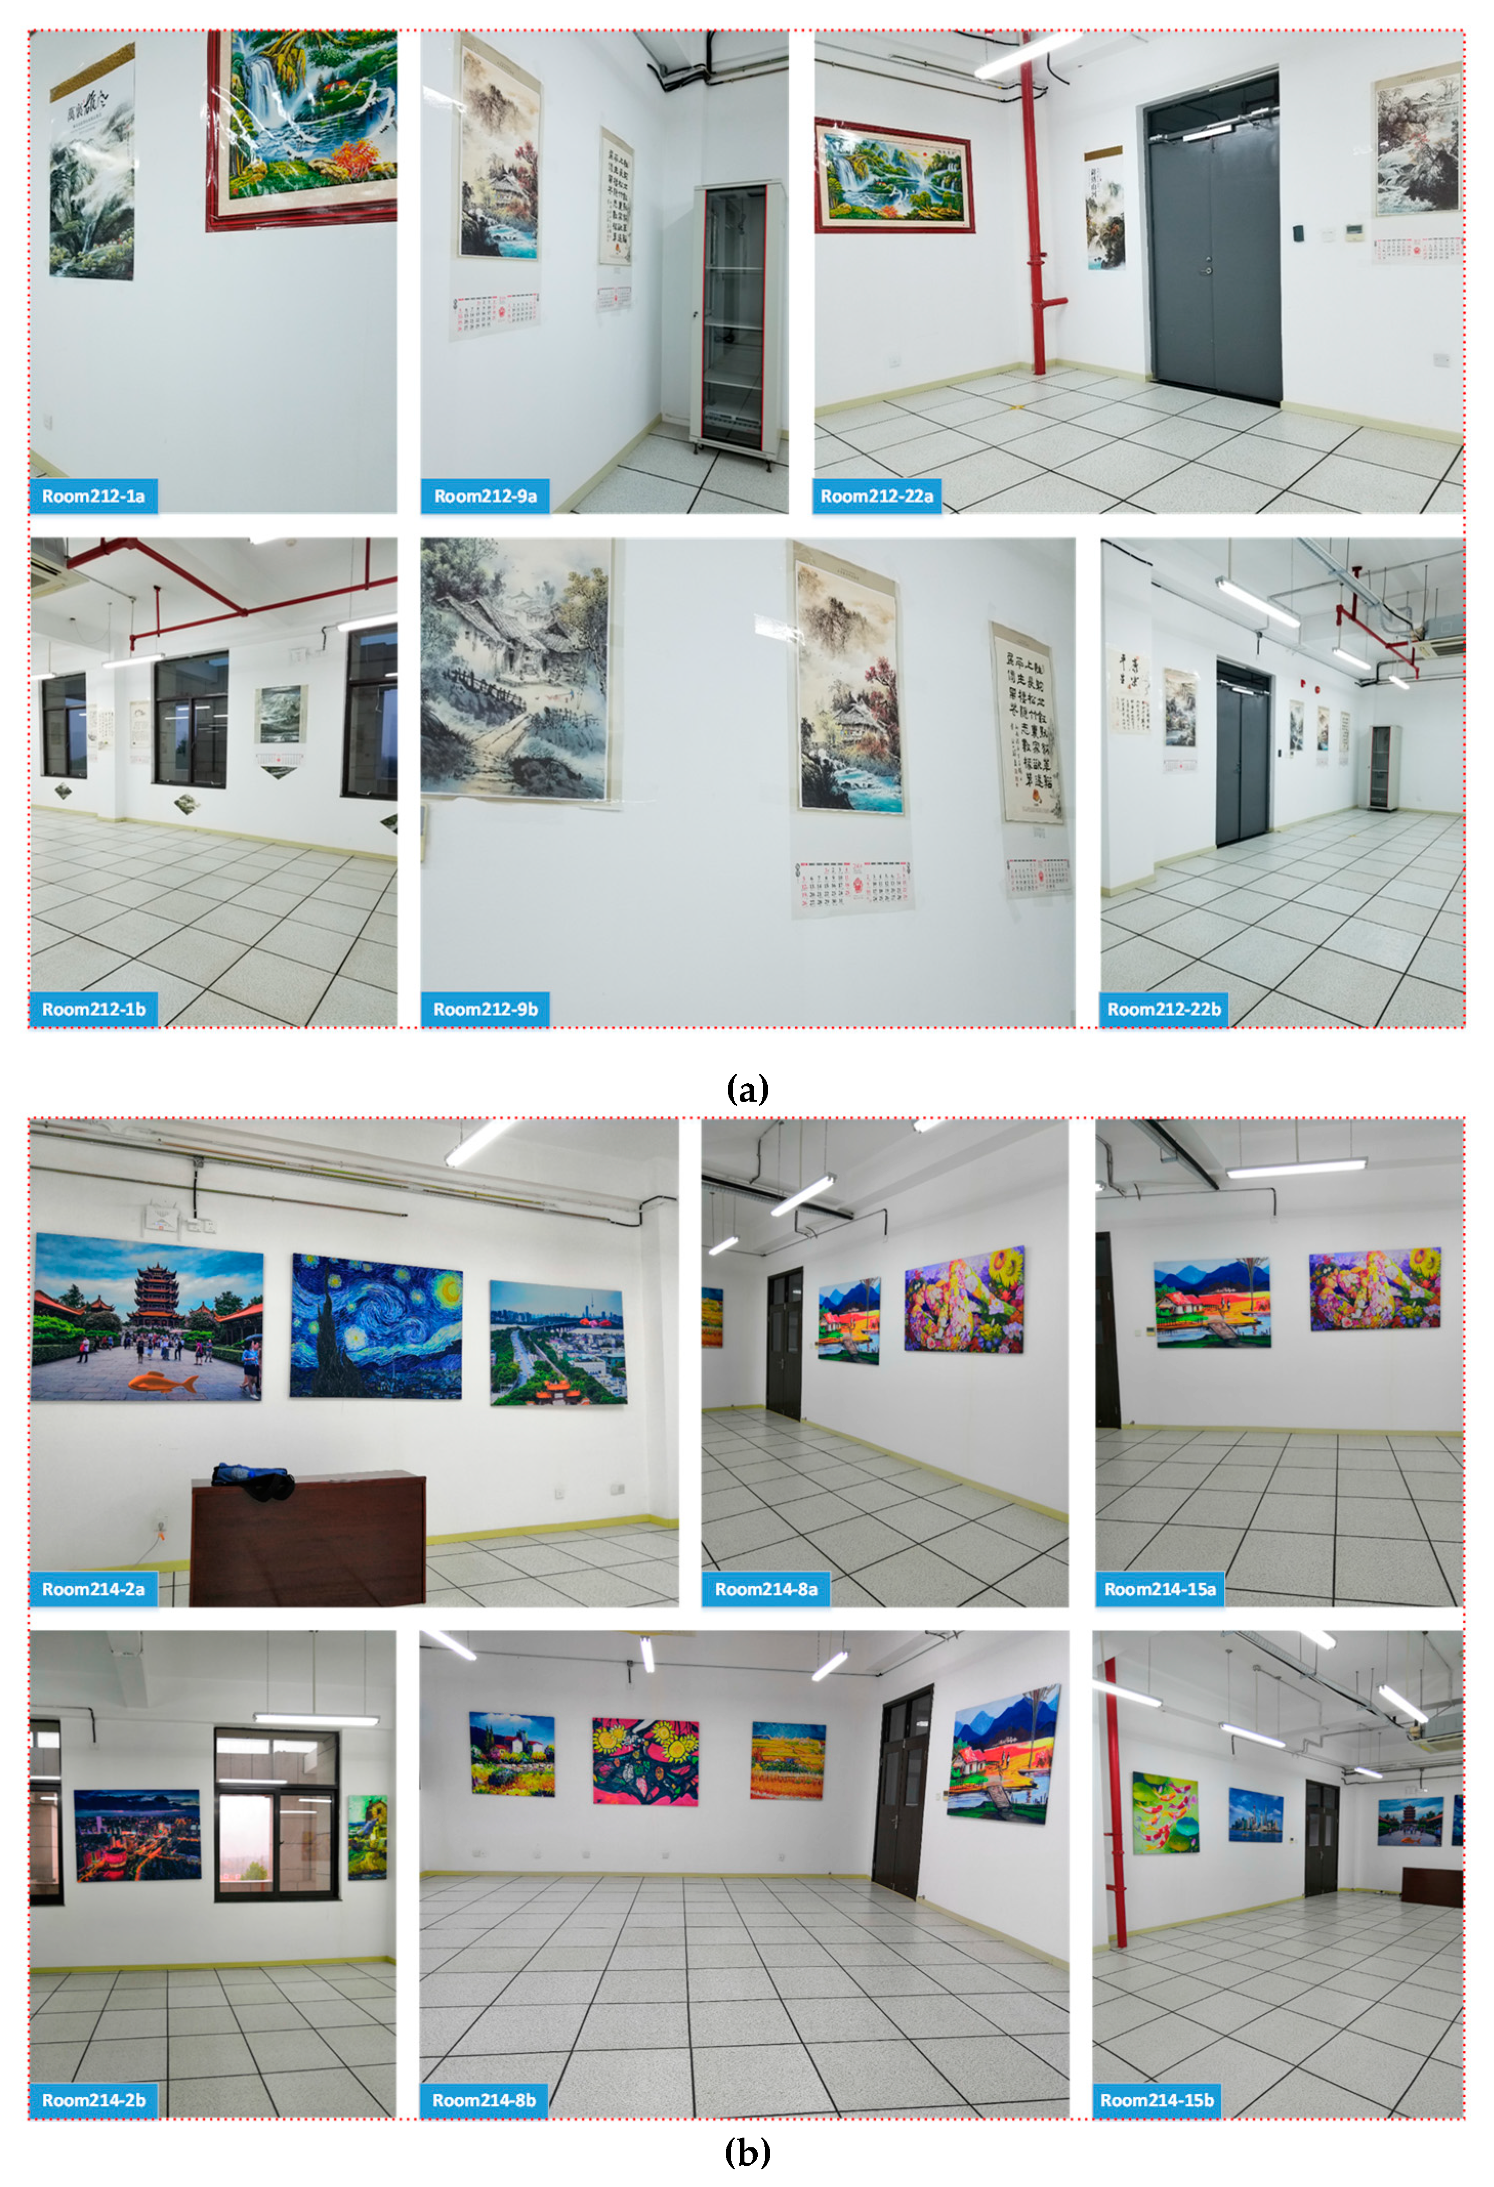
4.1. Test Data and Experimental Environment
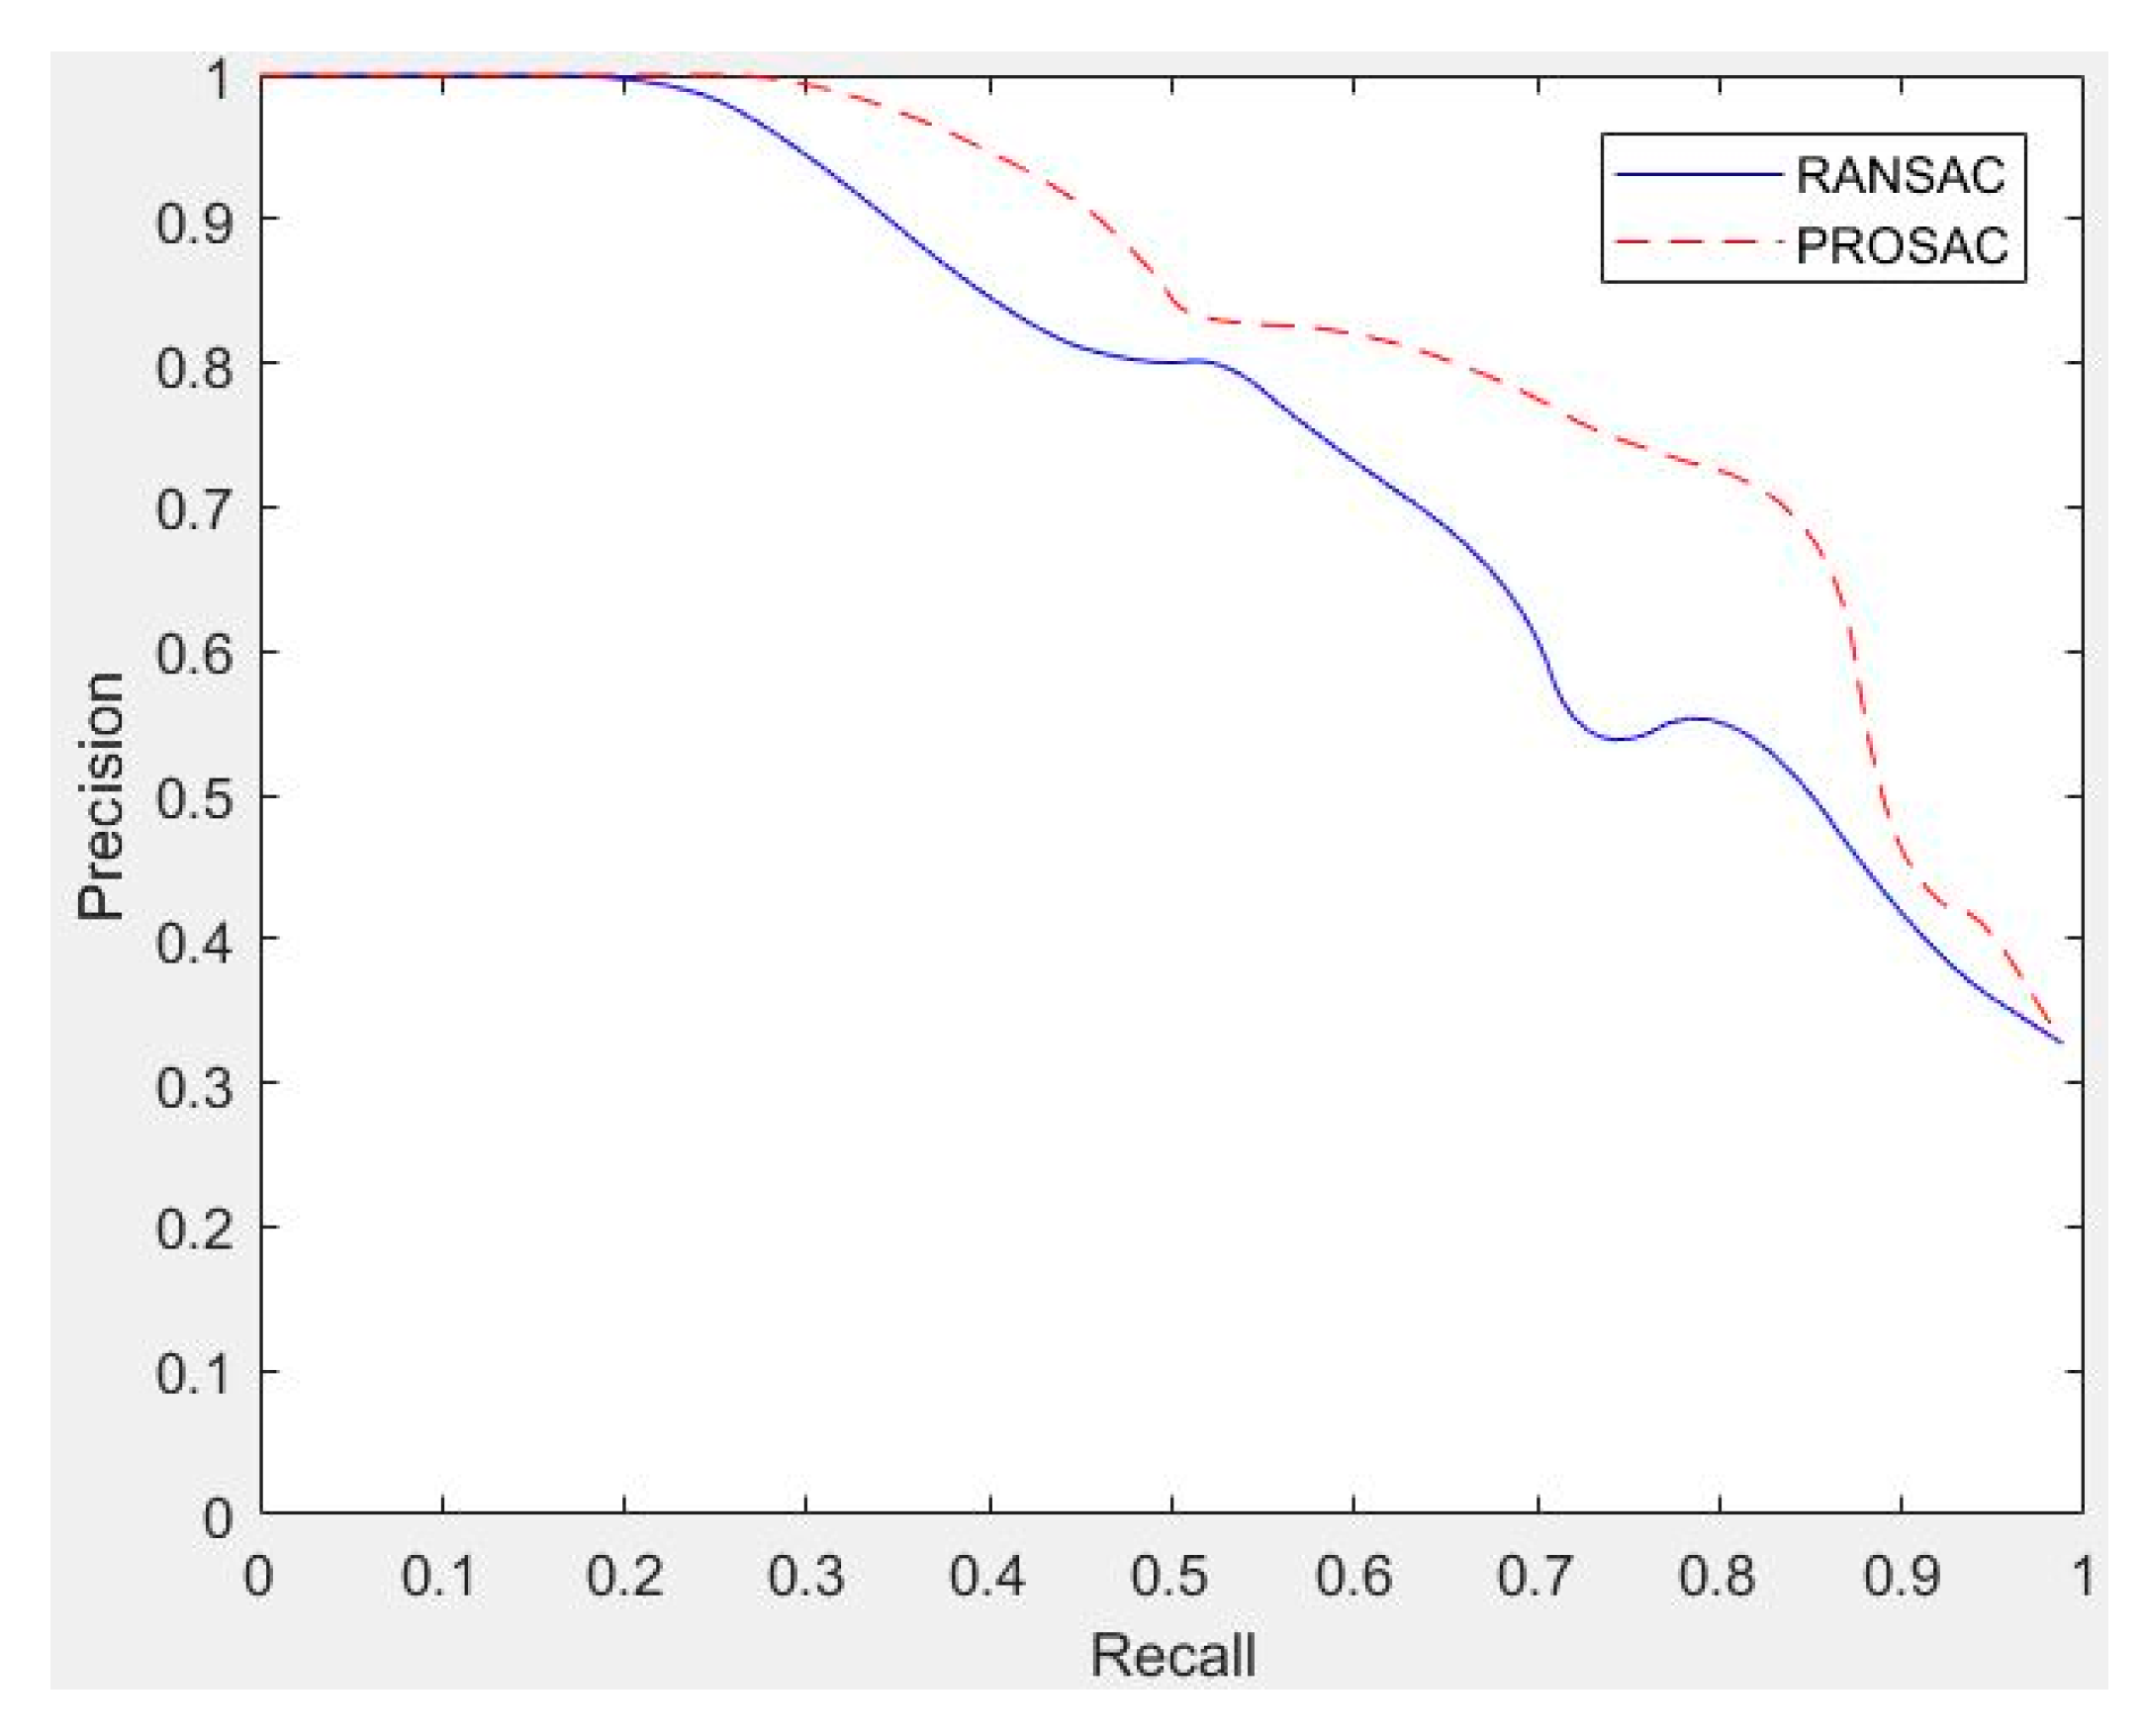
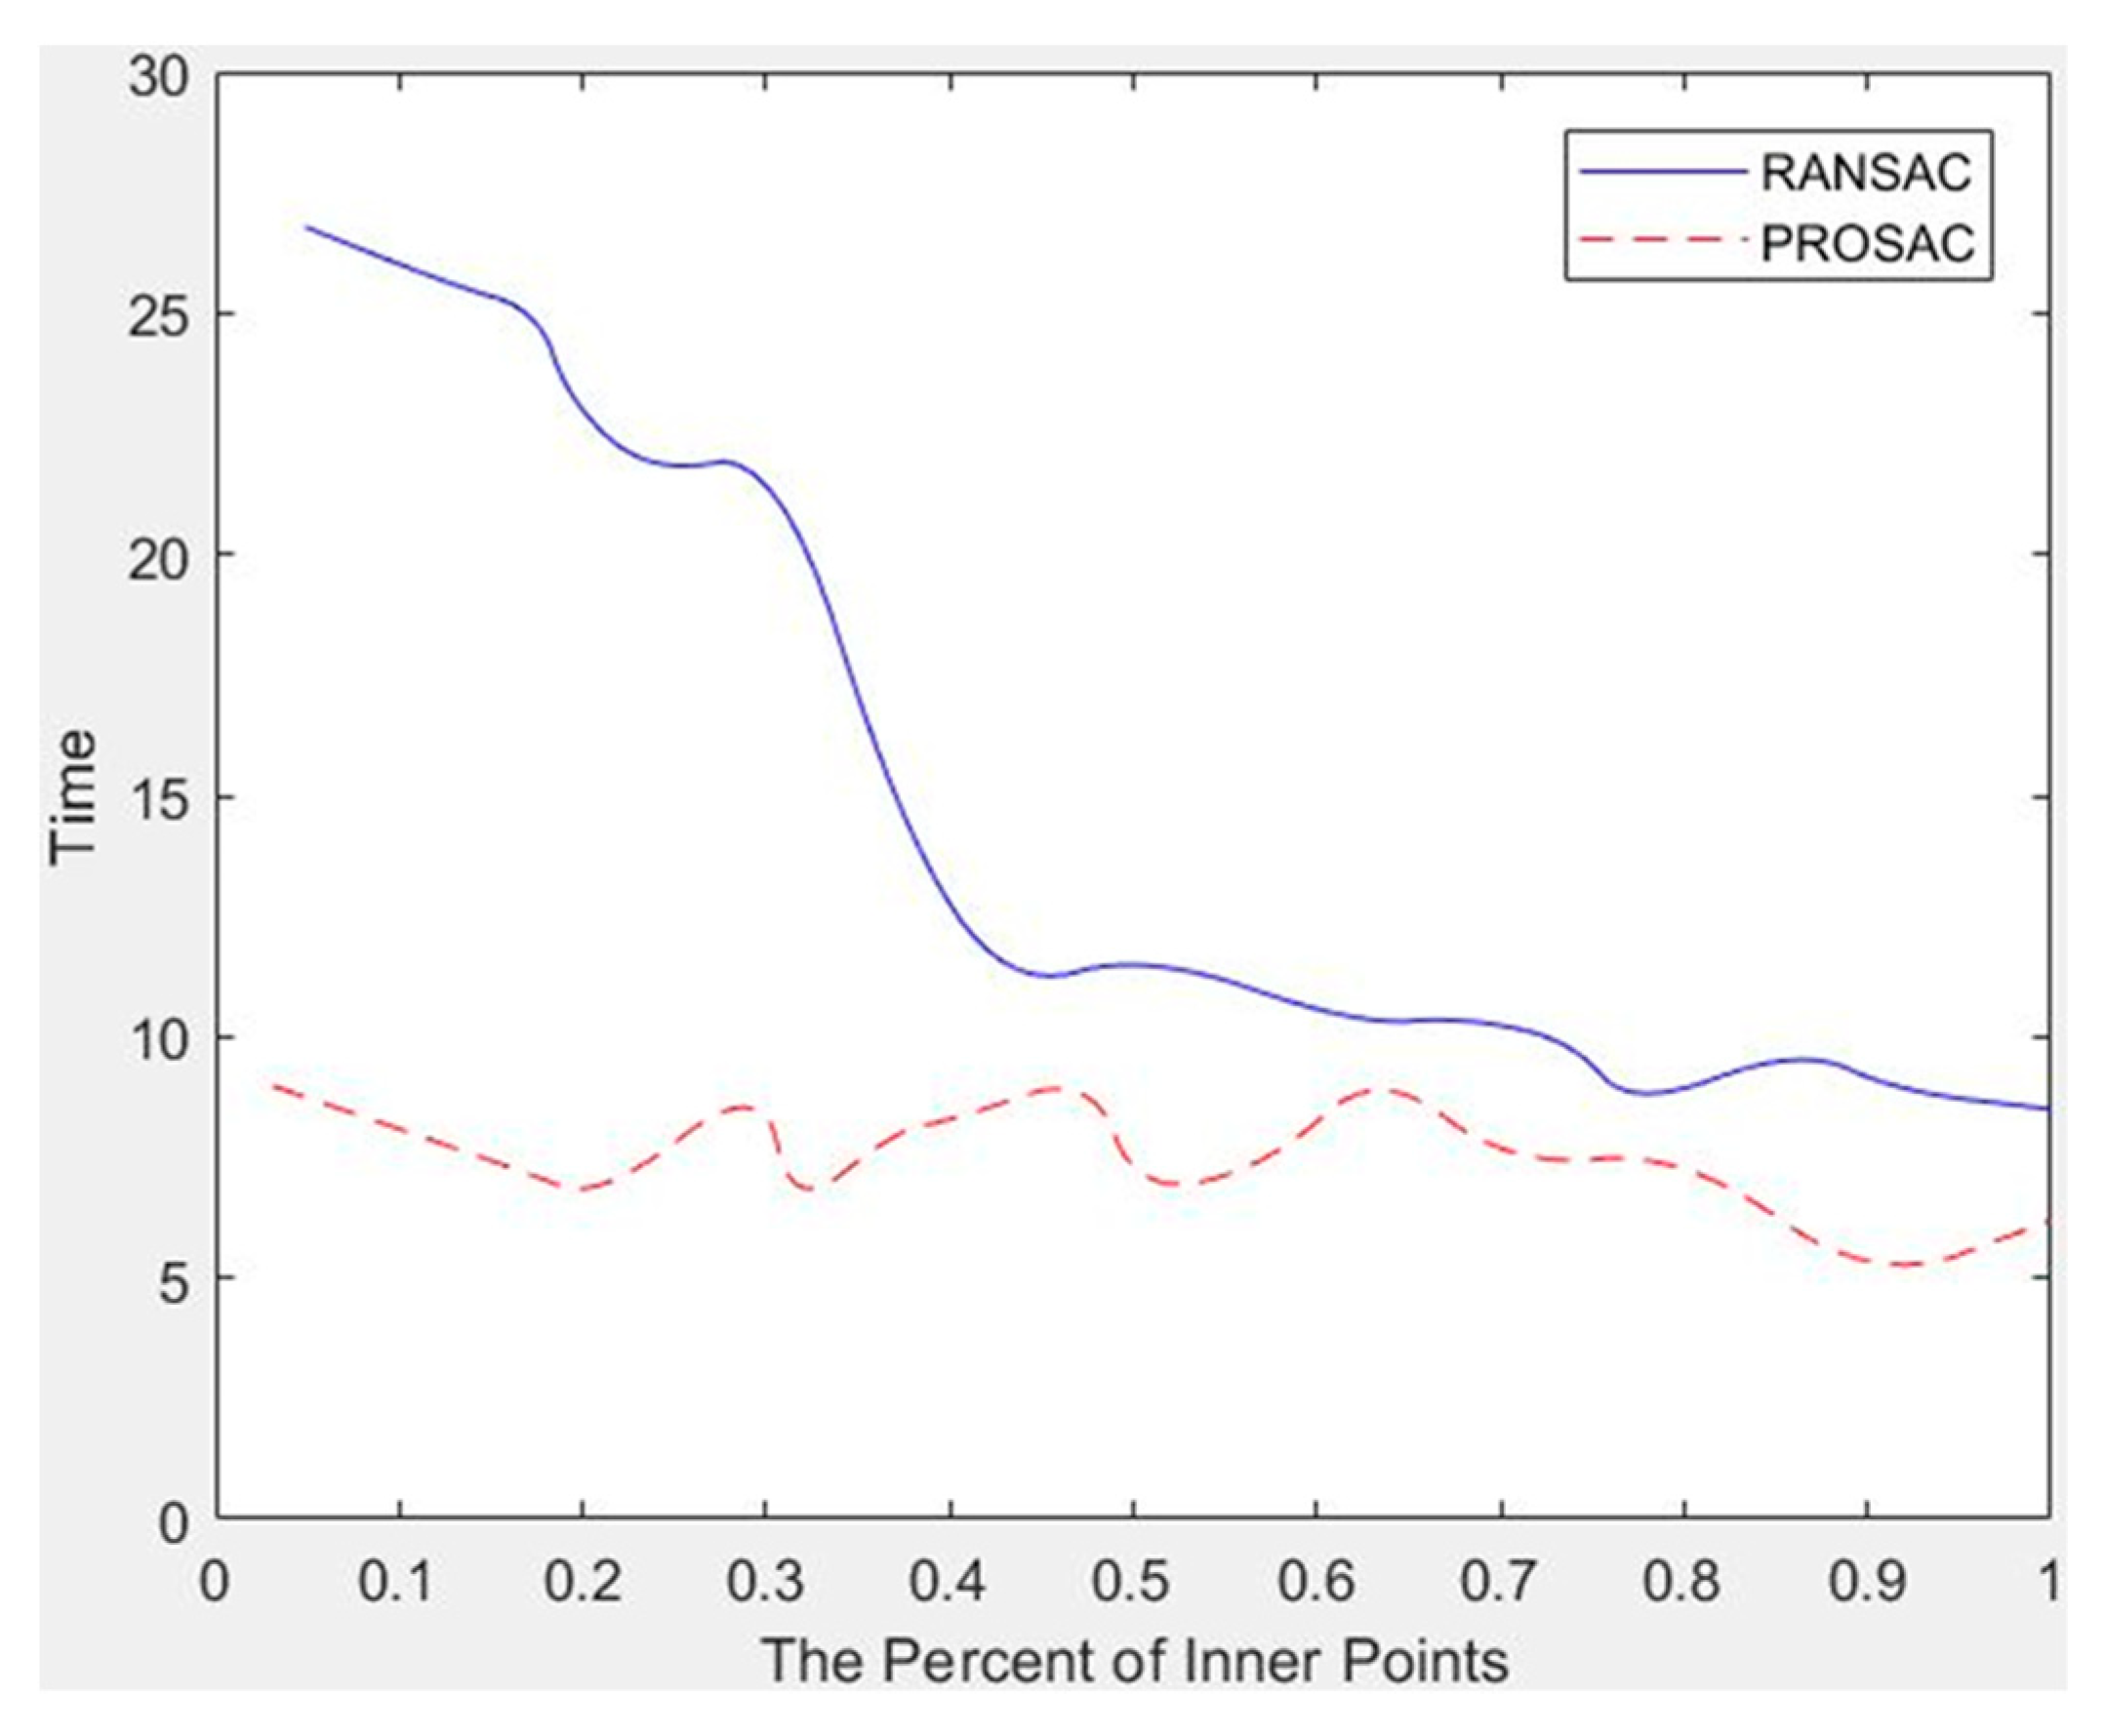
4.2. Optimization Matching Results Comparison of RANSAC and PROSAC Algorithms
4.3. Experimental Comparison Before and after Using the Mismatch Elimination Method Based on HTVI
4.4. Comparison Experiment of Three Camera-Pose Estimation Methods
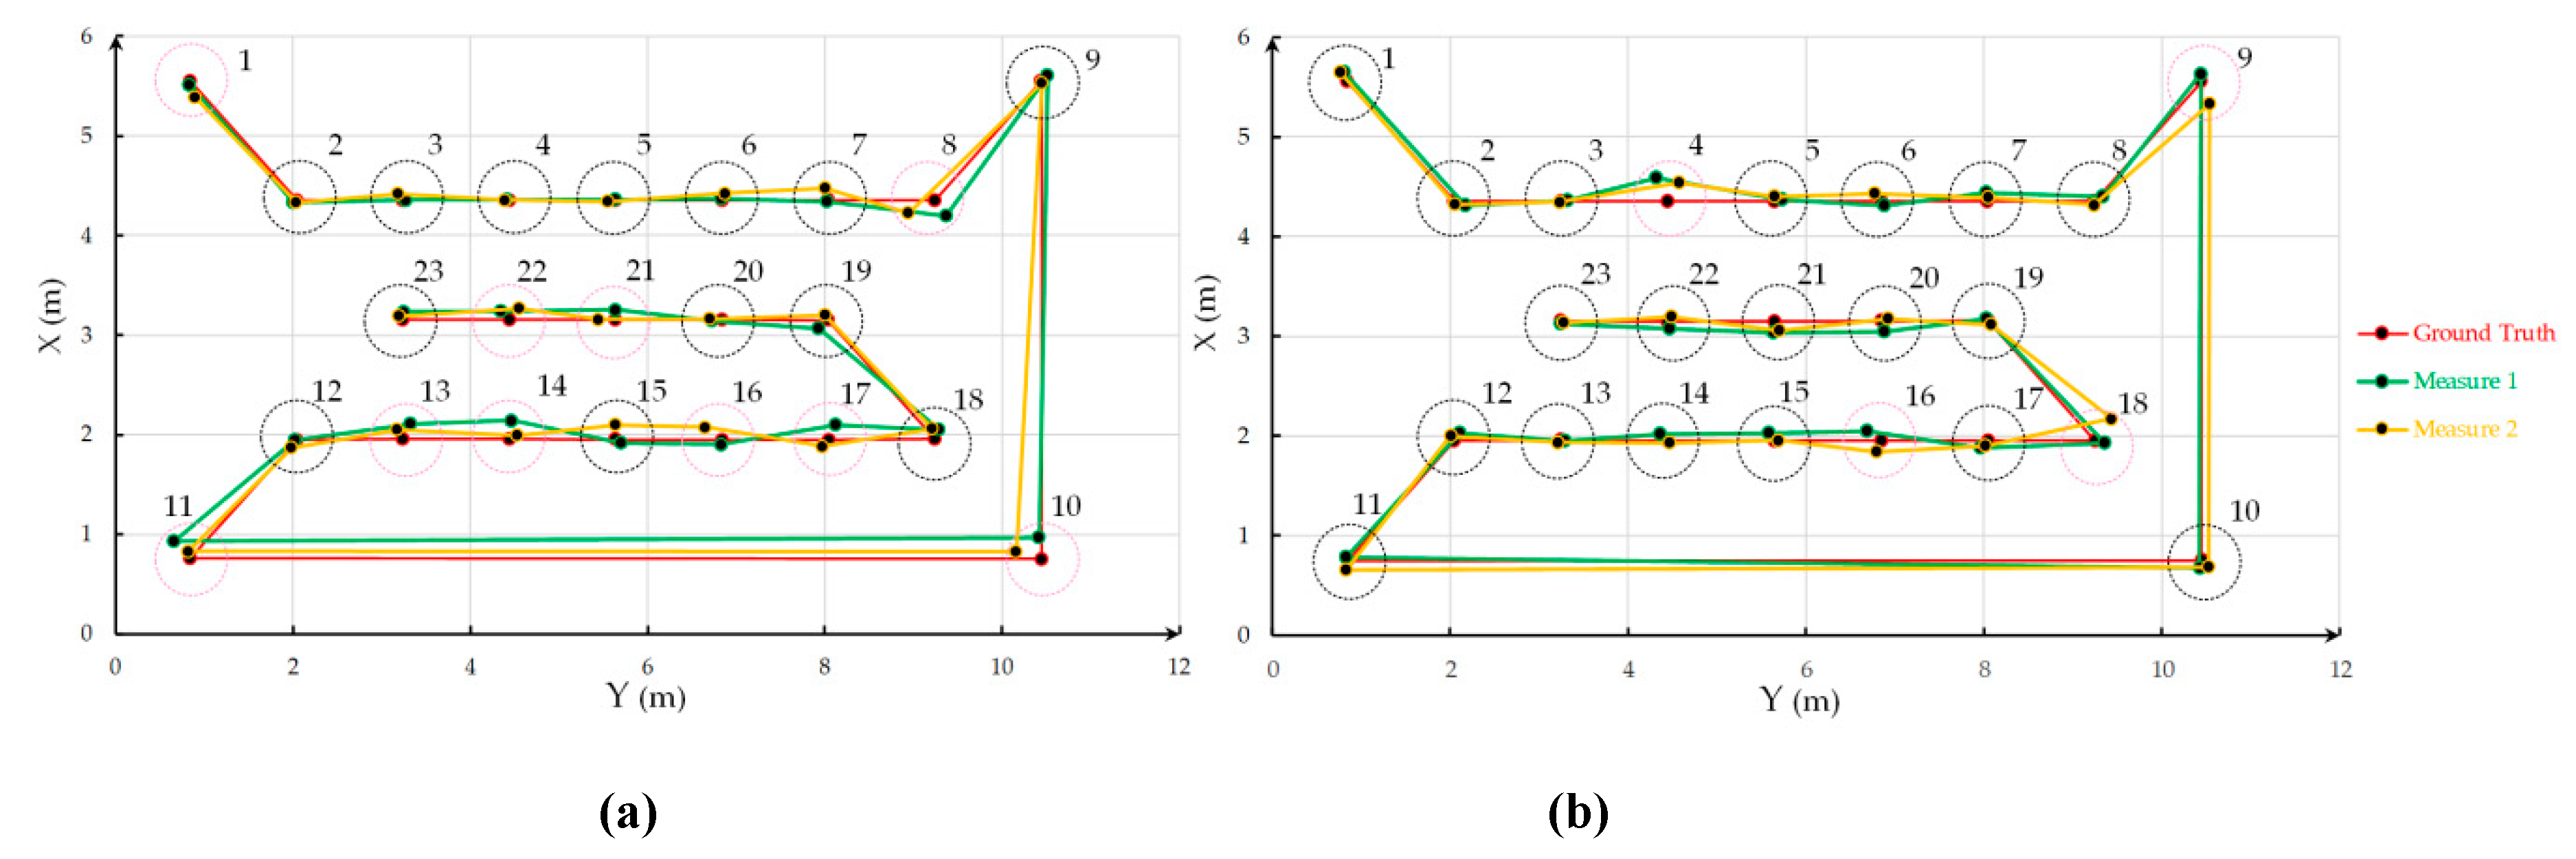
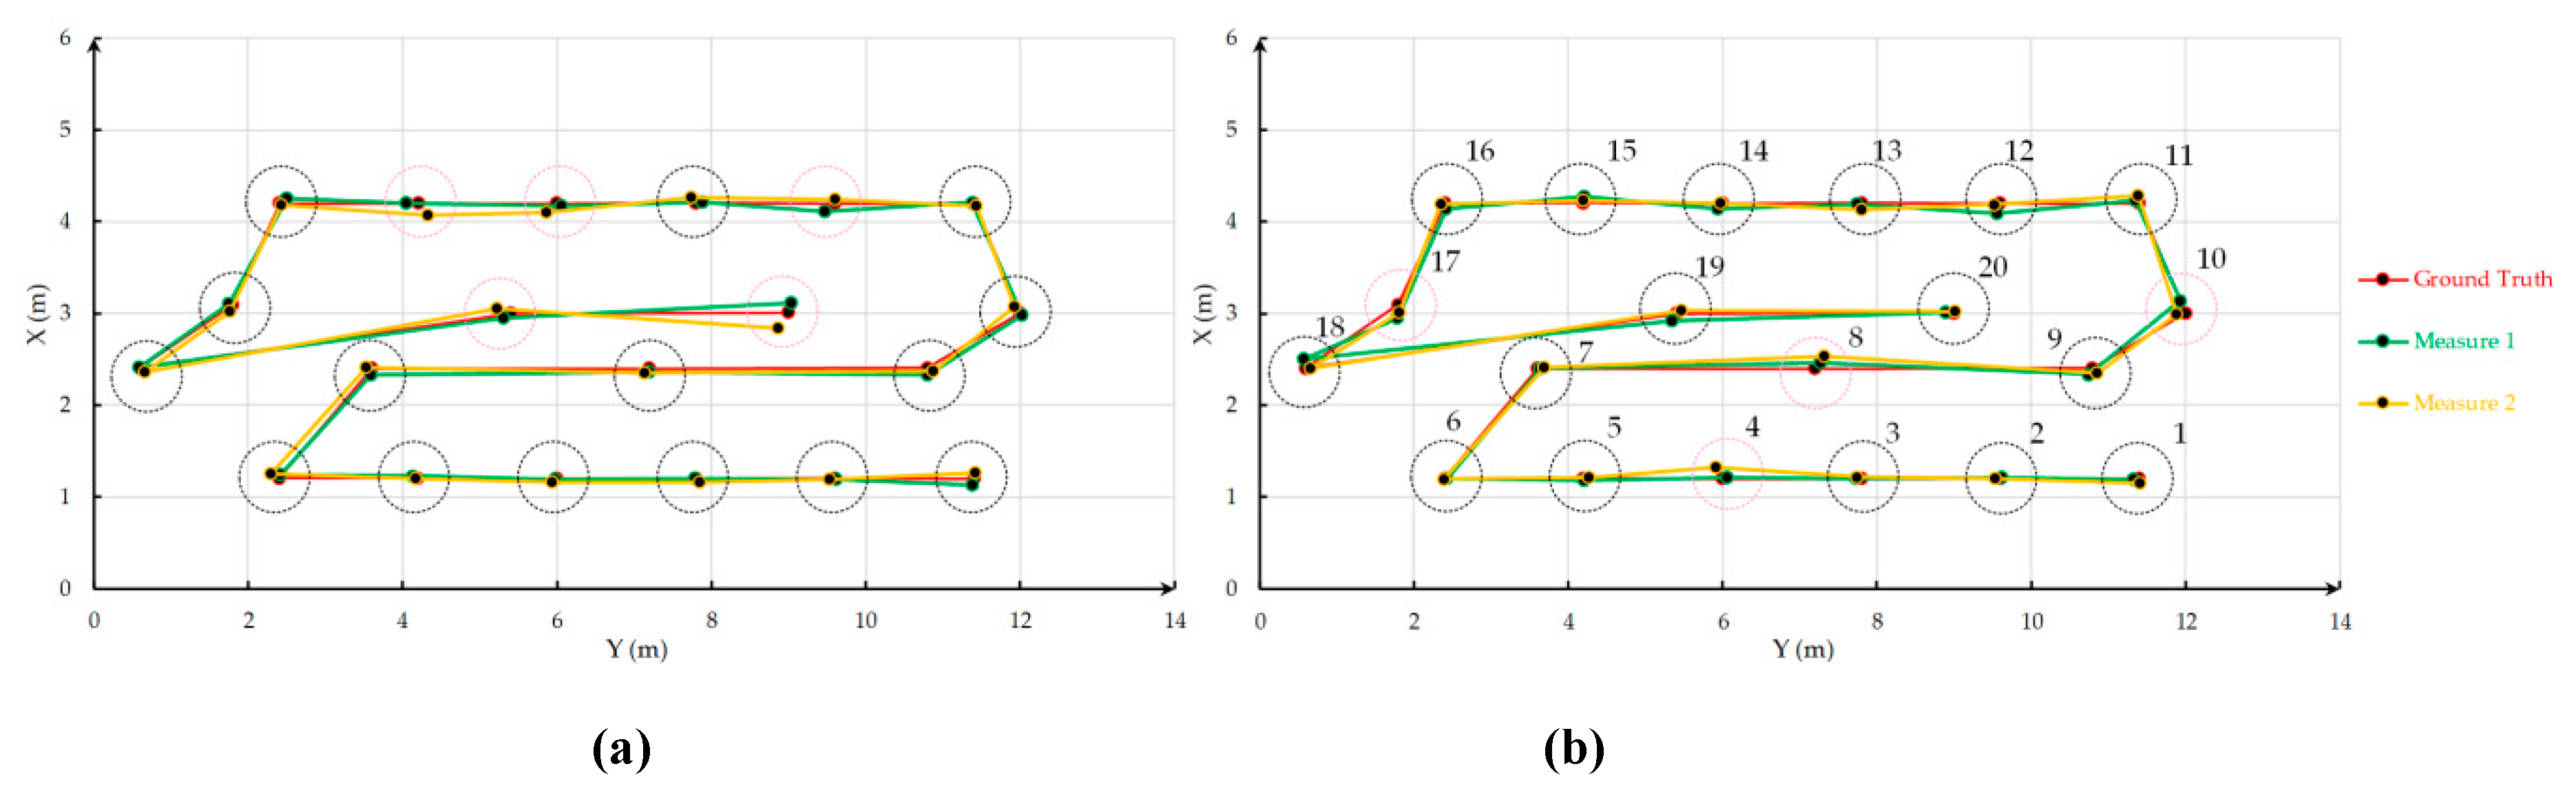
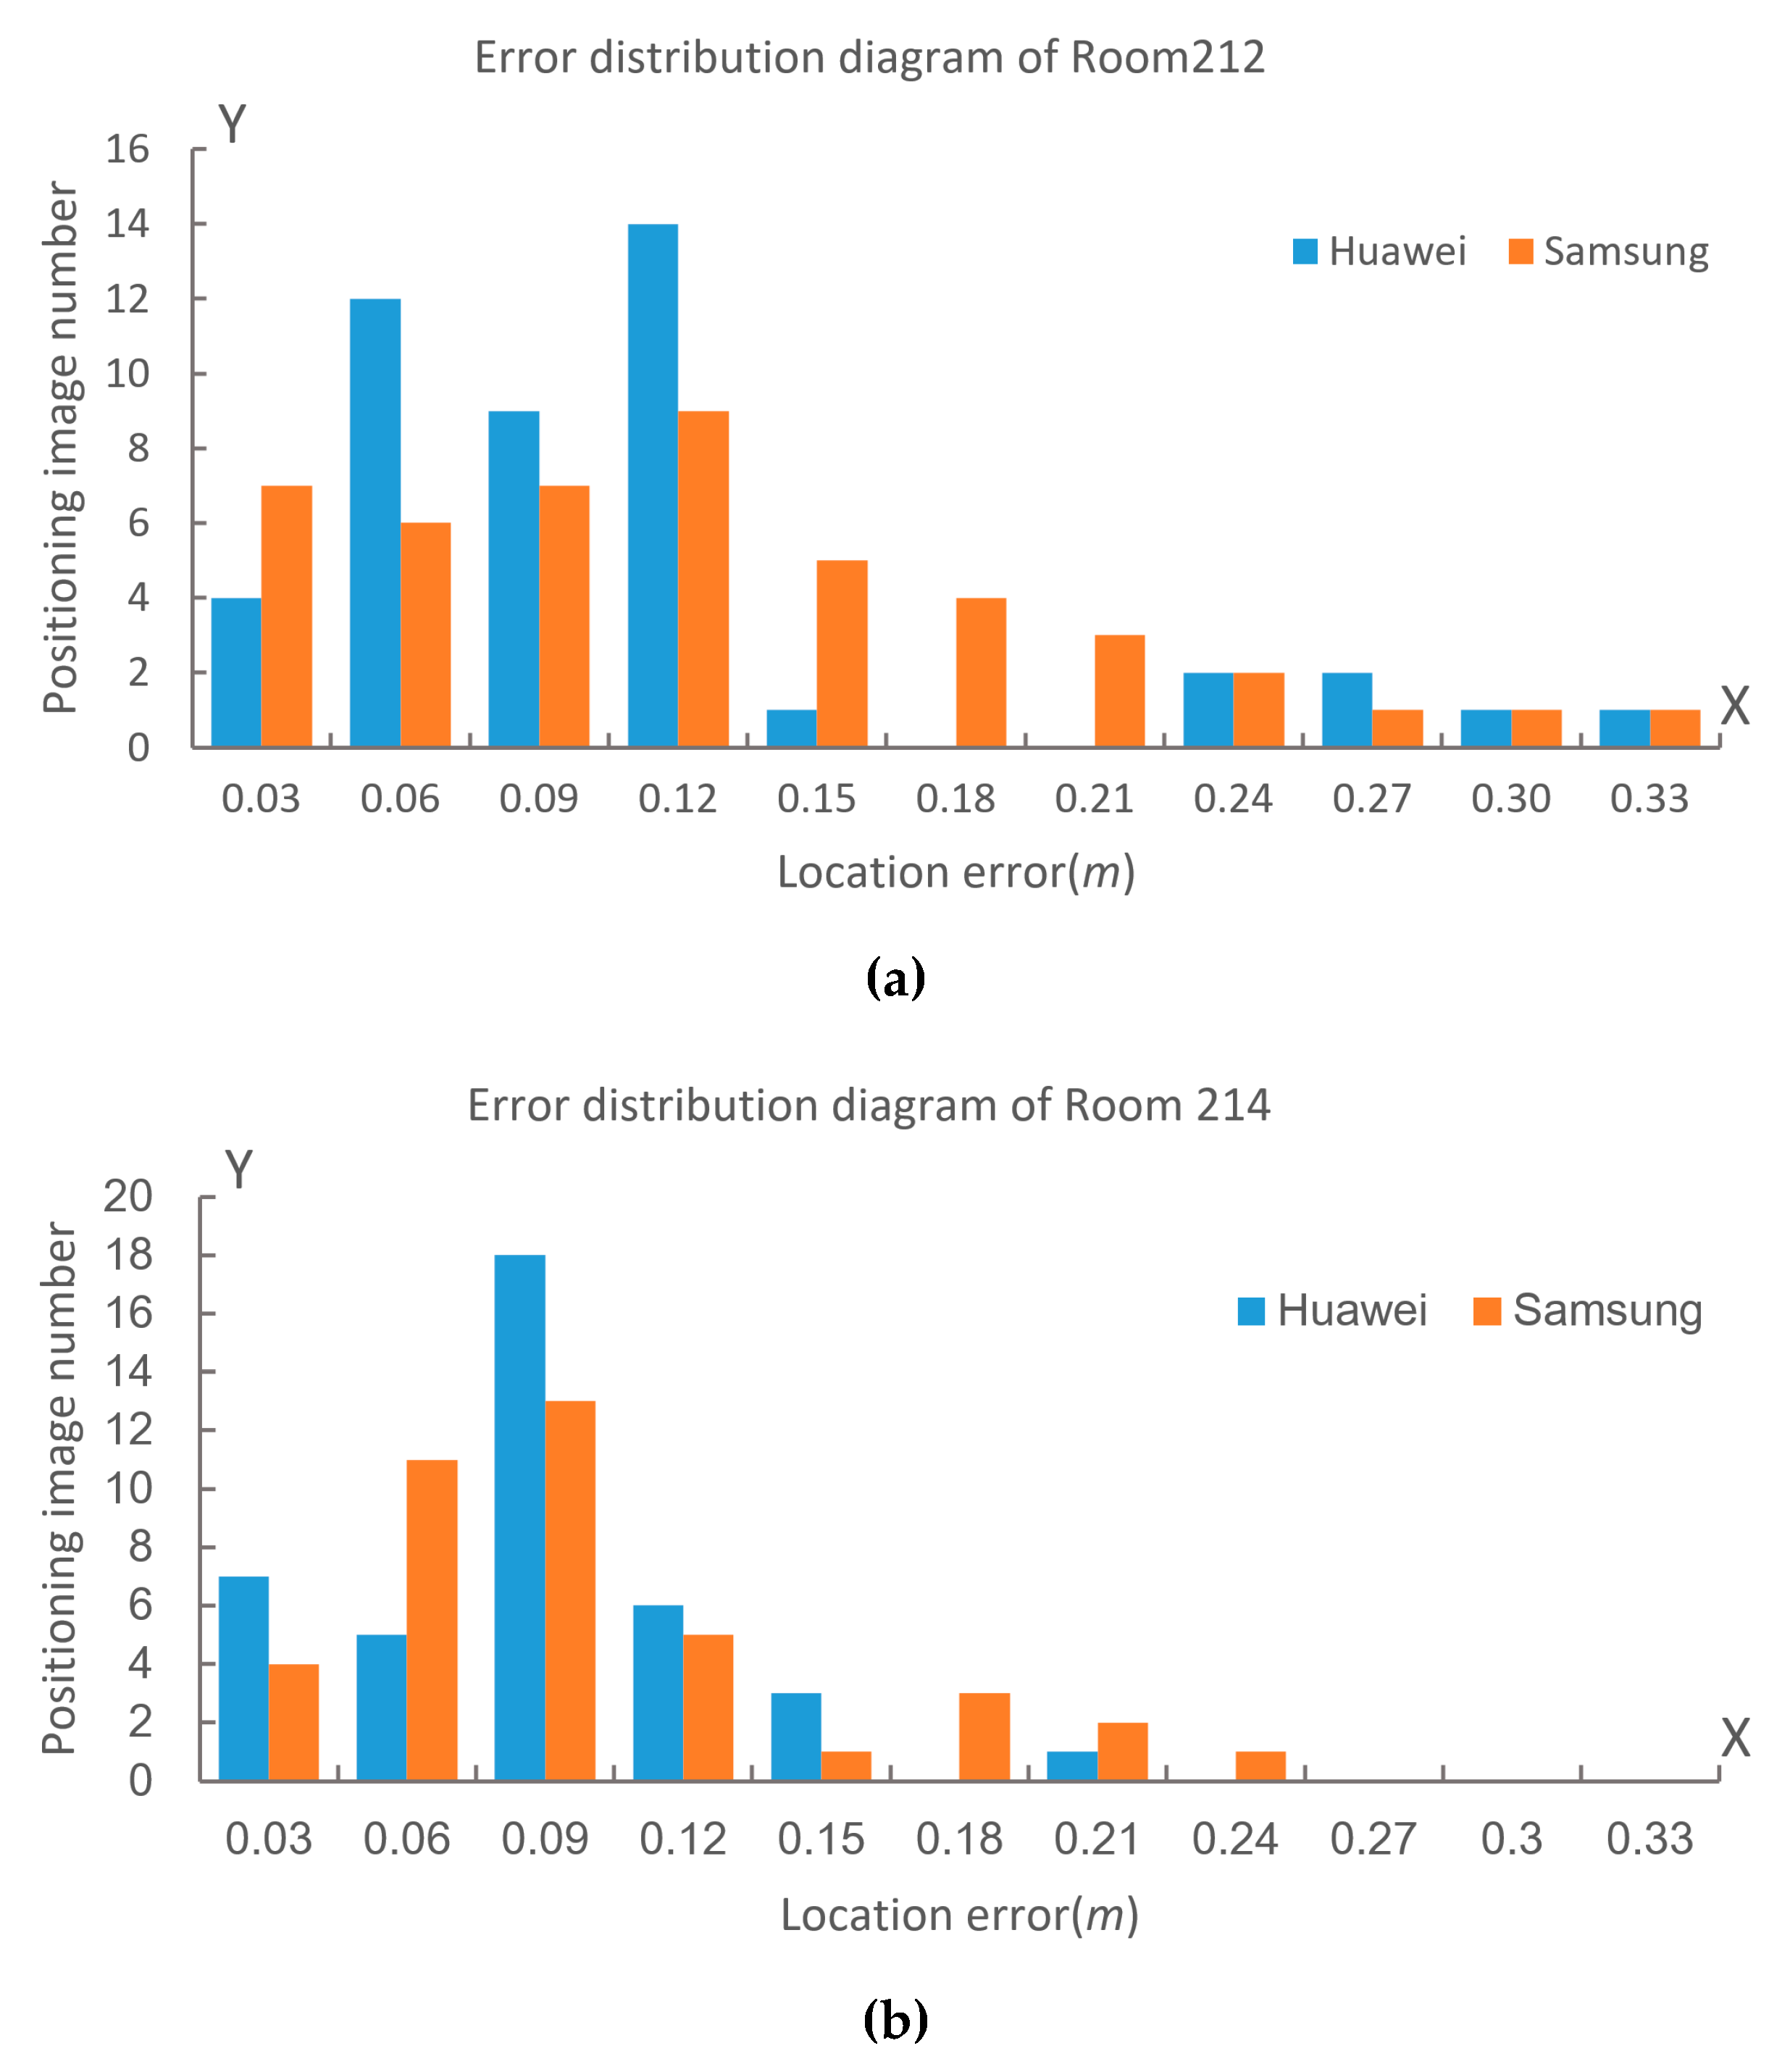
4.5. Experimental Accuracy Evaluation with Decorated Indoor Scene
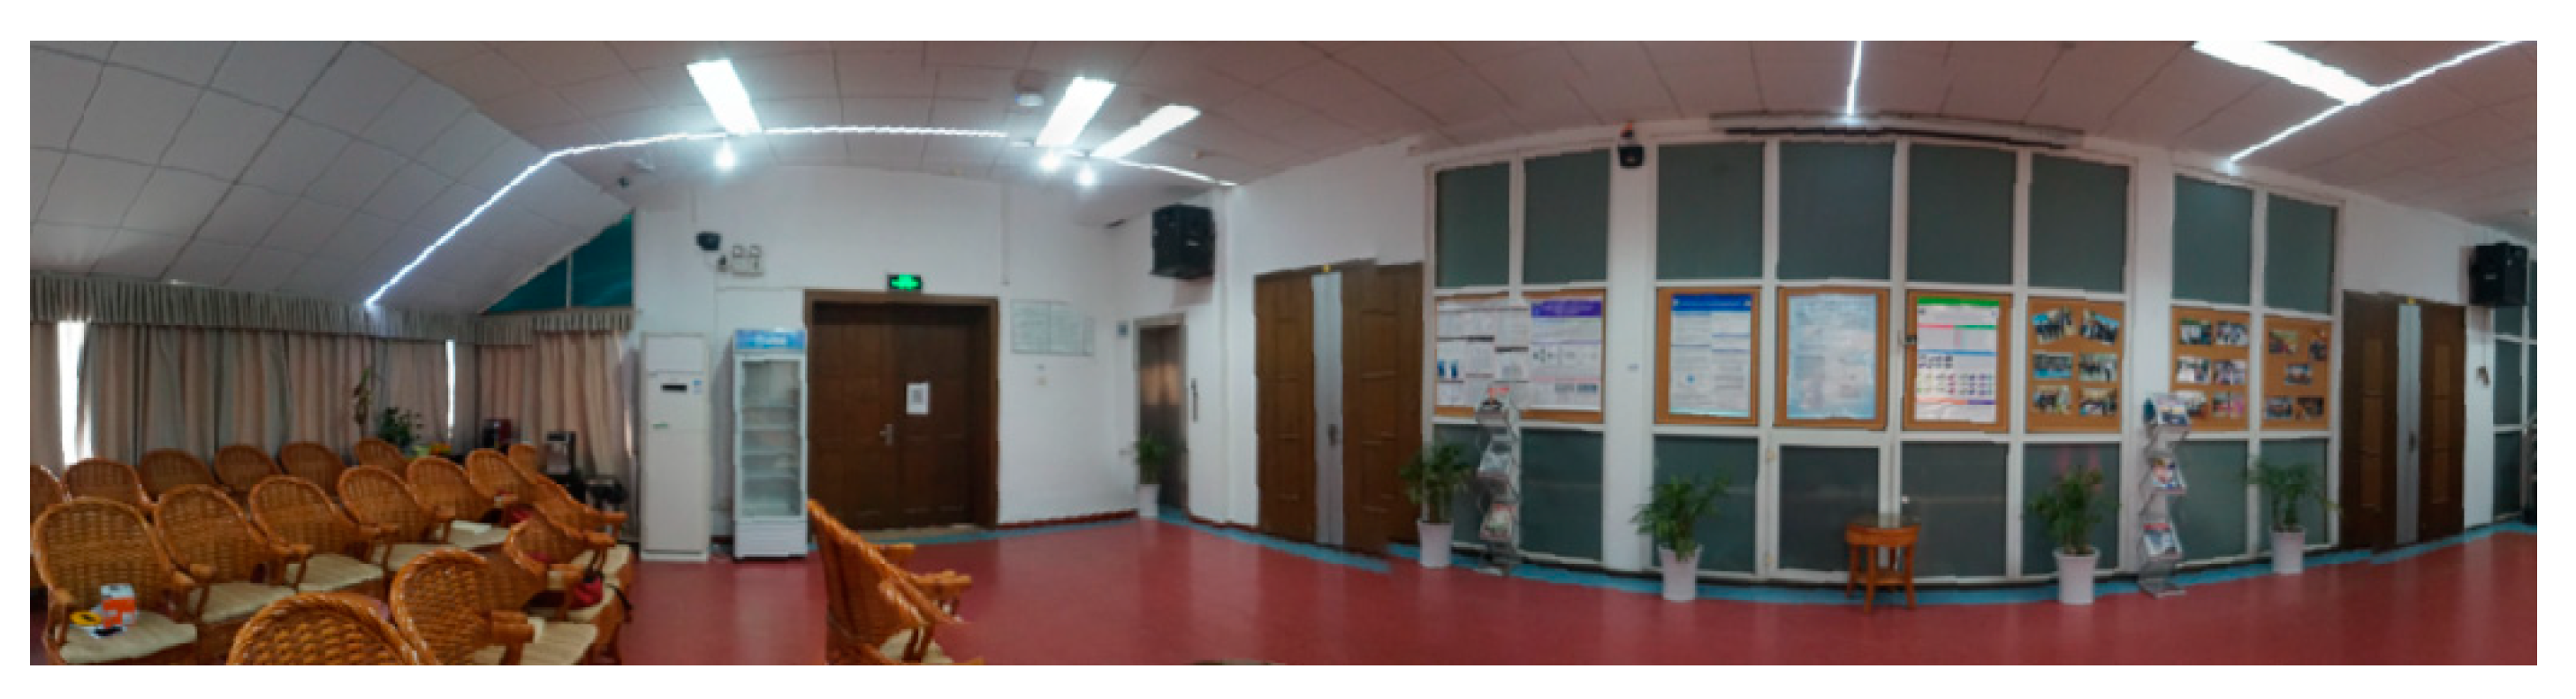
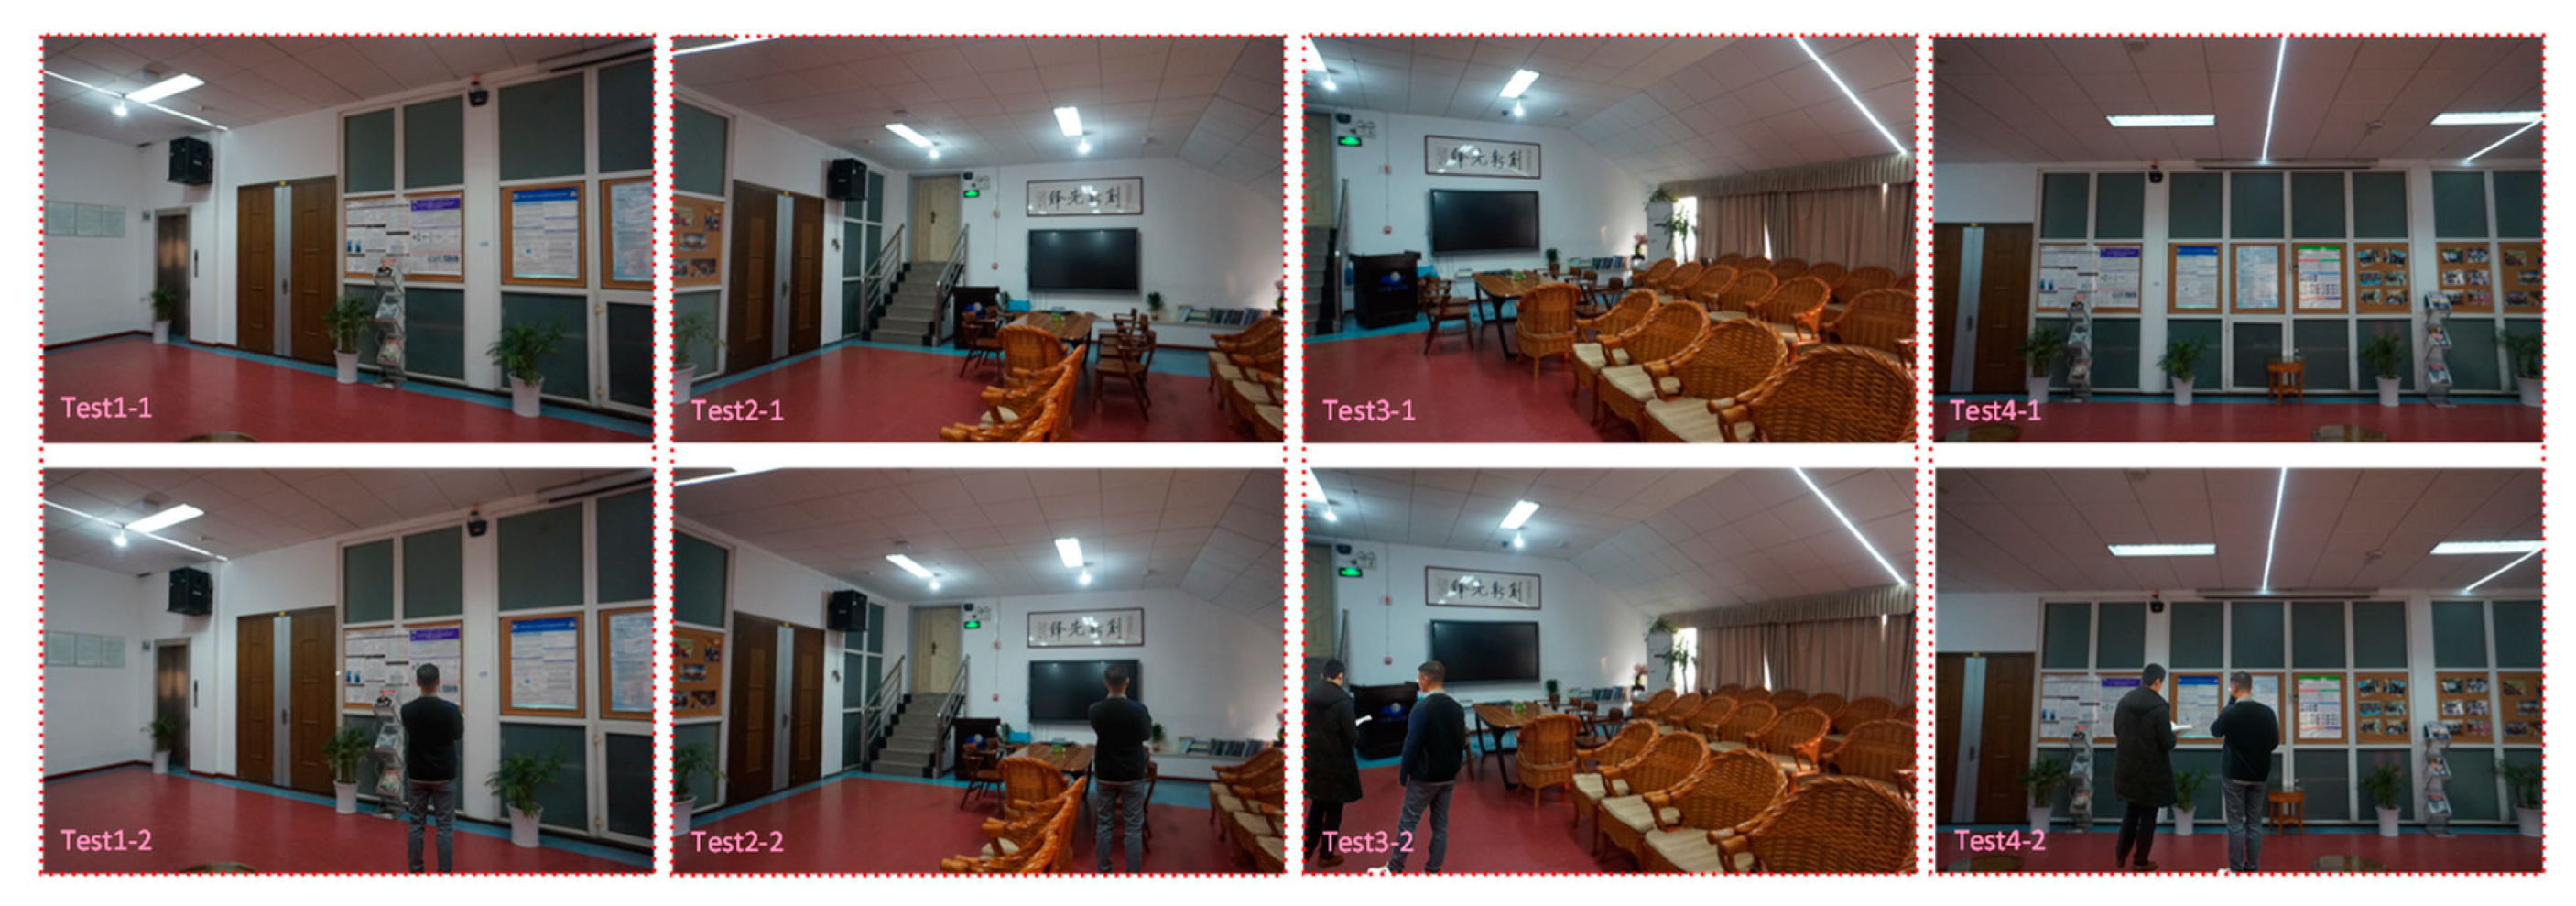
4.6. Experimental Accuracy Comparison in Real Indoor Scene
5. Discussion
6. Conclusions
Author Contributions
Funding
Conflicts of Interest
References
- Liang, J.; Corso, N.; Turner, E.; Zakhor, A. Image based localization in indoor environments. In Proceedings of the Fourth International Conference on Computing for Geospatial Research and Application, San Jose, CA, USA, 22–24 July 2013; IEEE: Piscataway, NJ, USA, 2013; pp. 70–75. [Google Scholar]
- Wu, T.; Liu, J.; Li, Z.; Liu, K.; Xu, B. Accurate Smartphone Indoor Visual Positioning Based on a High-Precision 3D Photorealistic Map. Sensors 2018, 18, 1974. [Google Scholar] [CrossRef] [PubMed] [Green Version]
- Liao, X.; Chen, R.; Li, M.; Guo, B.; Niu, X.; Zhang, W. Design of a Smartphone Indoor Positioning Dynamic Ground Truth Reference System Using Robust Visual Encoded Targets. Sensors 2019, 19, 1261. [Google Scholar] [CrossRef] [PubMed] [Green Version]
- Huitl, R.; Schroth, G.; Hilsenbeck, S.; Schweiger, F.; Steinbach, E. TUMindoor: An extensive image and point cloud dataset for visual indoor localization and mapping. In Proceedings of the 19th IEEE International Conference on Image Processing, Lake Buena Vista, FL, USA, 30 September–3 October 2012. [Google Scholar]
- Acharya, D.; Ramezani, M.; Khoshelham, K.; Winter, S. BIM-Tracker: A model-based visual tracking approach for indoor localisation using a 3D building model. ISPRS J. Photogramm. Remote Sens. 2019, 150, 157–171. [Google Scholar] [CrossRef]
- Liao, X.; Li, M.; Chen, R.; Guo, B.; Wang, X. An Image-based Visual Localization Approach to Urban Space. In Proceedings of the 2018 Ubiquitous Positioning, Indoor Navigation and Location-Based Services (UPINLBS), Wuhan, China, 22–23 March 2018; pp. 1–5. [Google Scholar]
- Alfian, G.; Syafrudin, M.; Ijaz, M.F.; Syaekhoni, M.A.; Fitriyani, N.L.; Rhee, J. A Personalized Healthcare Monitoring System for Diabetic Patients by Utilizing BLE-Based Sensors and Real-Time Data Processing. Sensors 2018, 18, 2183. [Google Scholar] [CrossRef] [Green Version]
- Xia, S.; Liu, Y.; Yuan, G.; Zhu, M.; Wang, Z. Indoor fingerprint positioning based on wi-fi: An overview. ISPRS Int. J. Geo-Inf. 2017, 6, 135. [Google Scholar] [CrossRef] [Green Version]
- Monica, S.; Ferrari, G. UWB-based localization in large indoor scenarios: Optimized placement of anchor nodes. IEEE Aerosp. Electron. Syst. Mag. 2015, 51, 987–999. [Google Scholar] [CrossRef]
- Liu, F.; Li, X.; Wang, J.; Zhang, J. An Adaptive UWB/MEMS-IMU Complementary Kalman Filter for Indoor Location in NLOS Environment. Remote Sens. 2019, 11, 2628. [Google Scholar] [CrossRef] [Green Version]
- Pratama, A.R.; Widyawan; Hidayat, R. Smartphone-based Pedestrian Dead Reckoning as an indoor positioning system. In Proceedings of the International Conference on System Engineering and Technology, Bandung, Indonesia, 11–12 September 2012. [Google Scholar]
- Zhuang, Y.; El-Sheimy, N. Tightly-Coupled Integration of WiFi and MEMS Sensors on Handheld Devices for Indoor Pedestrian Navigation. IEEE Sens. J. 2015, 16, 224–234. [Google Scholar] [CrossRef]
- Kuang, J.; Niu, X.; Chen, X. Robust Pedestrian Dead Reckoning Based on MEMS-IMU for Smartphones. Sensors 2018, 18, 1391. [Google Scholar] [CrossRef] [Green Version]
- Lu, Y.H.; Delp, E.J. An overview of problems in image-based location awareness and navigation. In Proceedings of the Visual Communications and Image Processing, San Jose, CA, USA, 18 January 2004. [Google Scholar]
- Zhang, W.; Kosecka, J. Image Based Localization in Urban Environments. In Proceedings of the International Symposium on 3D Data Processing, Chapel Hill, NC, USA, 14–16 June 2006; pp. 33–40. [Google Scholar]
- Li, L.; Yu, H. Improved SIFT performance evaluation against various image deformations. In Proceedings of the IEEE Information Technology and Artificial Intelligence Conference, Liverpoo, UK, 26–28 October 2015; pp. 172–175. [Google Scholar]
- Zhang, C.; Wang, X.; Guo, B. Space Location of Image in Urban Environments Based on C/S Structure. Geomat. Inf. Sci. Wuhan Univ. 2018, 43, 978–983. [Google Scholar]
- Wang, J.; Zha, H.; Cipolla, R. Coarse-to-fine vision-based localization by indexing scale-Invariant features. IEEE Trans. Syst. Man Cybern. Part B 2006, 36, 413–422. [Google Scholar] [CrossRef] [PubMed]
- Walch, F.; Hazirbas, C.; Leal, L.; Sattler, T.; Hilsenbeck, S.; Cremers, D. Image-based localization using LSTMs for structured feature correlation. In Proceedings of the IEEE International Conference on Computer Vision, Las Vegas, NV, USA, 27–30 June 2016; pp. 627–637. [Google Scholar]
- Kendall, A.; Grimes, M.; Cipolla, R. PoseNet: A Convolutional Network for Real-Time 6-DOF Camera Relocalization. In Proceedings of the IEEE International Conference on Computer Vision, Santiago, Chile, 7–13 December 2015; pp. 2938–2946. [Google Scholar]
- Rublee, E.; Rabaud, V.; Konolige, K.; Bradski, G. ORB: An efficient alternative to SIFT or SURF. In Proceedings of the IEEE International Conference on Computer Vision, Providence, RI, USA, 16–21 June 2012; pp. 2564–2571. [Google Scholar]
- Sattler, T.; Leibe, B.; Kobbelt, L. Efficient & effective prioritized matching for large-scale image-based localization. IEEE Trans. Pattern Anal. Mach. Intell. 2017, 39, 1744–1756. [Google Scholar] [PubMed]
- Bay, H.; Tuytelaars, T.; Gool, L.V. SURF: Speeded up robust features. In Proceedings of the European Conference on Computer Vision, Graz, Austria, 7–13 May 2006; pp. 404–417. [Google Scholar]
- Breiman, L. Random forests. Mach. Learn. 2001, 45, 5–32. [Google Scholar] [CrossRef] [Green Version]
- Zhang, H.; Berg, A.C.; Maire, M.; Malik, J. Svm-knn: Discriminative nearest neighbor classification for visual category recognition. In Proceedings of the 2006 IEEE Computer Society Conference on Computer Vision and Pattern Recognition (CVPR 2006), New York, NY, USA, 17–22 June 2006; pp. 2126–2136. [Google Scholar]
- Feng, G.; Ma, L.; Tan, X.; Qin, D. Drift-Aware Monocular Localization Based on a Pre-Constructed Dense 3D Map in Indoor Environments. ISPRS Int. J. Geo-Inf. 2018, 7, 299. [Google Scholar] [CrossRef] [Green Version]
- Xu, Z.; Wu, L.; Liu, J.; Shen, Y.; Li, F.; Wang, R. Modification of SFM Algorithm Referring to Image Topology and Its Application in 3-Dimension Reconstruction of Disaster Area. Geomat. Inf. Sci. Wuhan Univ. 2015, 40, 599–606. [Google Scholar]
- Wu, X.; Zhang, Y.; Zhao, L.; Yu, Y.; Wang, T.; Li, L. Comparison of the Accuracy of Incremental SFM with POS-aid Bundle Adjustment. Acta Geod. Et Cartogr. Sinia 2017, 46, 198–207. [Google Scholar]
- Heller, J.; Havlena, M.; Jancosek, M.; Torii, A. 3D reconstruction from photographs by CMP SfM web service. In Proceedings of the 14th IAPR International Conference on Machine Vision Applications, Tokyo, Japan, 18–22 May 2018; pp. 30–34. [Google Scholar]
- Davison, A.; Reid, I.; Molton, N.; Stasse, O. Monoslam: Real-time single camera slam. IEEE Trans. Pattern Anal. Mach. Intell. 2007, 29, 1052–1067. [Google Scholar] [CrossRef] [Green Version]
- Klein, G.; Murray, D. Parallel Tracking and Mapping for Small AR Workspaces. In Proceedings of the IEEE and ACM International Symposium on Mixed and Augmented Reality, Cambridge, UK, 15–18 September 2008; pp. 1–10. [Google Scholar]
- Mur-Artal, R.; Montiel, J.; Tardós, J. Orb-slam: A versatile and accurate monocular slam system. IEEE Trans. Robot. 2017, 31, 1147–1163. [Google Scholar] [CrossRef] [Green Version]
- Engel, J.; Schöps, T.; Cremers, D. LSD-SLAM: Large-Scale Direct Monocular SLAM. In Proceedings of the European Conference on Computer Vision, Zurich, Switzerland, 6–12 September 2014; pp. 834–849. [Google Scholar]
- Forster, C.; Pizzoli, M.; Scaramuzza, D. SVO: Fast semi-direct monocular visual odometry. In Proceedings of the IEEE International Conference on Robotics and Automation, Hongkong, China, 31 May–5 June 2014; pp. 15–22. [Google Scholar]
- Newcombe, R.; Izadi, S.; Hilliges, O.; Molyneaux, D.; Kim, D.; Davison, A. Kinect Fusion: Real-time dense surface mapping and tracking. In Proceedings of the IEEE International Symposium on Mixed and Augmented Reality, Atlanta, GA, USA, 5–8 November 2012; pp. 127–136. [Google Scholar]
- Audras, C.; Comport, A.; Meilland, M.; Rives, P. Real-time dense appearance-based slam for RGB-D sensors. In Proceedings of the Australasian Conference on Robotics and Automation, Melbourne, Australia, 7–9 December 2011. [Google Scholar]
- Endres, F.; Hess, J.; Engelhard, N.; Sturm, J.; Cremers, D.; Burgard, W. An evaluation of the RGB-D SLAM system. In Proceedings of the IEEE International Conference on Robotics and Automation, St Paul, MN, USA, 14–19 May 2012; pp. 1691–1696. [Google Scholar]
- Matthias, N.; Izadi, S.; Stamminger, M. Real-time 3D reconstruction at scale using voxel hashing. ACM Trans. Graph. 2013, 32, 1–11. [Google Scholar]
- Kerl, C.; Sturm, J.; Cremers, D. Robust odometry estimation for RGB-D cameras. In Proceedings of the IEEE International Conference on Robotics and Automation, Karlsruhe, Germany, 6–10 May 2013; pp. 3748–3754. [Google Scholar]
- Vestena, K.; Dos Santos, D.; Oilveira, E.; Pavan, N.; Khoshelham, K. A weighted closed-form solution for Rgb-D data registration. ISPRS-Int. Arch. Photogramm. Remote Sens. Spat. Inf. Sci. 2016, XLI-B3, 403–409. [Google Scholar] [CrossRef]
- Qin, J.; Li, M.; Liao, X.; Zhong, J. Accumulative Errors Optimization for Visual Odometry of ORB-SLAM2 Based on RGB-D Cameras. ISPRS Int. J. Geo-Inf. 2019, 8, 581. [Google Scholar] [CrossRef] [Green Version]
- Lecun, Y.; Bengio, Y.; Hinton, G. Deep learning. Nature 2015, 521, 436. [Google Scholar] [CrossRef] [PubMed]
- Kendall, A.; Cipolla, R. Modelling Uncertainty in Deep Learning for Camera Relocalization. In Proceedings of the IEEE International Conference on Robotics and Automation (ICRA), Seattle, WA, USA, 26–30 May 2015; pp. 4762–4769. [Google Scholar]
- Ye, F.; Su, Y.; Xiao, H. Remote Sensing Image Registration Using Convolutional Neural Network Features. IEEE Geosci. Remote Sens. Lett. 2018, 15, 232–236. [Google Scholar] [CrossRef]
- García-Olalla, O.; Alegre, E.; Fernández-Robles, L.; Fidalgo, E.; Saikia, S. Textile Retrieval Based on Image Content from CDC and Webcam Cameras in Indoor Environments. Sensors 2018, 18, 1329. [Google Scholar]
- Zheng, L.; Yang, Y.; Tian, Q. Sift meets cnn: A decade survey of instance retrieval. IEEE Trans. Pattern Anal. Mach. Intell. 2016, 99, 1224–1244. [Google Scholar] [CrossRef] [Green Version]
- Acharya, D.; Khoshelham, K.; Winter, S. BIM-PoseNet: Indoor camera localization using a 3D indoor model and deep learning from synthetic images. ISPRS J. Photogramm. Remote Sens. 2019, 150, 245–258. [Google Scholar] [CrossRef]
- Sharma, A.; Paliwal, K. Linear discriminant analysis for the small sample size problem: An overview. Int. J. Mach. Learn. Cybern. 2014, 6, 443–454. [Google Scholar] [CrossRef] [Green Version]
- Agarwal, S.; Furukawa, Y.; Snavely, N.; Simon, I.; Curless, B.; Seitz, M.; Szeliski, R. Building Rome in a day. Commun. ACM 2011, 54, 105–112. [Google Scholar] [CrossRef]
- Batur, A.; Yadikar, N.; Mamat, H.; Aysa, A.; Ubul, K. Complex Uyghur document image matching and retrieval based on modified SURF feature. CAAI Trans. Intell. Syst. 2019, 14, 296–305. [Google Scholar]
- Lun, L. Research on Indoor Positioning Algorithm Based on PROSAC Algorithm. Master’s Thesis, Harbin Institute of Technology, Harbin, China, 2018. [Google Scholar]
- Hough, P. Method and Means for Recognizing Complex Patterns. U.S. Patent 3,069,654, 18 December 1962. [Google Scholar]
- Duda, R.; Hart, H. Use of the Hough transformation to detect lines and curves in pictures. Commun. ACM 1972, 15, 11–15. [Google Scholar] [CrossRef]


| No. | Before (m) | After (m) | Ground Truth (m) | ||
|---|---|---|---|---|---|
| Measure | Point Error | Measure | Point Error | ||
| 1 | No output | Failure | (1.931, 5.980) | 0.88 | (1.186, 5.517) |
| 2 | (3.156, 4.593) | 1.26 | (3.320, 4.521) | 0.30 | (3.030, 4.415) |
| 3 | (−3.230, 3.071) | Wrong | (2.141, 2.678) | 0.89 | (2.920, 3.110) |
| 4 | (2.850, 11.27) | Wrong | (3.061, 2.028) | 0.43 | (3.030, 2.440) |
| 5 | No output | Failure | (5.785, 3.130) | 0.25 | (6.025, 3.080) |
| 6 | (9.053, 2.847) | 0.28 | (8.506, 3.162) | 0.48 | (8.900, 3.110) |
| 7 | (9.620, 2.943) | 0.67 | (9.167, 2.536) | 0.61 | (8.900, 3.110) |
| 8 | (8.181, 1.582) | 0.39 | (7.885, 1.690) | 0.56 | (8.390, 1.915) |
| 9 | (3.832, 11.873) | Wrong | (3.679,1.591) | 0.47 | (4.060, 1.850) |
| 10 | (5.623, 4.128) | 0.46 | (5.661, 4.035) | 0.41 | (5.380, 3.725) |
| Method | Error | Time |
|---|---|---|
| PnP | 4.277 mm | 5.531 ms |
| EPnP | 1.311 mm | 5.111 ms |
| UPnP | 2.796 mm | 5.309 ms |
| Room 212 | |||
|---|---|---|---|
| Phone Type | Huawei Honor 10 | Samsung Galaxy S8 | |
| Measure (m) | Measure (m) | ||
| RMSE | ΔX (m) | 0.099 | 0.094 |
| ΔY (m) | 0.069 | 0.097 | |
| ΔD (m) | 0.120 | 0.135 | |
| Room 214 | |||
|---|---|---|---|
| Phone Type | Huawei Honor 10 | Samsung Galaxy S8 | |
| Measure (m) | Measure (m) | ||
| RMSE | ΔX (m) | 0.061 | 0.058 |
| ΔY (m) | 0.059 | 0.075 | |
| ΔD (m) | 0.085 | 0.095 | |
| No. | Room 212 (Huawei Honor 10) | Room 212 (Samsung Galaxy S8) | ||
|---|---|---|---|---|
| Measure Error 1 | Measure Error 2 | Measure Error 1 | Measure Error 2 | |
| MSEP (m) | MSEP (m) | MSEP (m) | MSEP (m) | |
| 1 | 0.096 | 0.118 | 0.039 | 0.179 |
| 2 | 0.130 | 0.032 | 0.040 | 0.020 |
| 3 | 0.073 | 0.009 | 0.032 | 0.084 |
| 4 | 0.268 | 0.223 | 0.028 | 0.056 |
| 5 | 0.087 | 0.047 | 0.007 | 0.093 |
| 6 | 0.057 | 0.101 | 0.020 | 0.081 |
| 7 | 0.088 | 0.039 | 0.017 | 0.130 |
| 8 | 0.104 | 0.037 | 0.203 | 0.323 |
| 9 | 0.076 | 0.242 | 0.083 | 0.022 |
| 10 | 0.081 | 0.104 | 0.218 | 0.292 |
| 11 | 0.035 | 0.097 | 0.257 | 0.082 |
| 12 | 0.097 | 0.063 | 0.022 | 0.100 |
| 13 | 0.041 | 0.041 | 0.173 | 0.113 |
| 14 | 0.116 | 0.030 | 0.188 | 0.094 |
| 15 | 0.103 | 0.045 | 0.070 | 0.143 |
| 16 | 0.186 | 0.317 | 0.050 | 0.230 |
| 17 | 0.106 | 0.060 | 0.167 | 0.098 |
| 18 | 0.119 | 0.287 | 0.108 | 0.112 |
| 19 | 0.026 | 0.055 | 0.143 | 0.061 |
| 20 | 0.110 | 0.078 | 0.115 | 0.134 |
| 21 | 0.111 | 0.105 | 0.105 | 0.196 |
| 22 | 0.075 | 0.061 | 0.130 | 0.156 |
| 23 | 0.028 | 0.038 | 0.083 | 0.056 |
| No. | Room 214 (Huawei Honor 10) | Room 214 (Samsung Galaxy S8) | ||
|---|---|---|---|---|
| Measure Error 1 | Measure Error 2 | Measure Error 1 | Measure Error 2 | |
| MSEP (m) | MSEP (m) | MSEP (m) | MSEP (m) | |
| 1 | 0.071 | 0.052 | 0.075 | 0.065 |
| 2 | 0.017 | 0.070 | 0.013 | 0.068 |
| 3 | 0.072 | 0.054 | 0.018 | 0.059 |
| 4 | 0.062 | 0.150 | 0.036 | 0.071 |
| 5 | 0.025 | 0.077 | 0.073 | 0.035 |
| 6 | 0.030 | 0.006 | 0.042 | 0.123 |
| 7 | 0.047 | 0.089 | 0.075 | 0.067 |
| 8 | 0.099 | 0.183 | 0.042 | 0.079 |
| 9 | 0.086 | 0.076 | 0.070 | 0.076 |
| 10 | 0.149 | 0.113 | 0.035 | 0.100 |
| 11 | 0.062 | 0.083 | 0.022 | 0.042 |
| 12 | 0.117 | 0.076 | 0.162 | 0.046 |
| 13 | 0.063 | 0.070 | 0.091 | 0.087 |
| 14 | 0.083 | 0.022 | 0.057 | 0.165 |
| 15 | 0.070 | 0.028 | 0.154 | 0.183 |
| 16 | 0.059 | 0.053 | 0.107 | 0.031 |
| 17 | 0.146 | 0.087 | 0.051 | 0.087 |
| 18 | 0.103 | 0.067 | 0.014 | 0.076 |
| 19 | 0.093 | 0.075 | 0.104 | 0.185 |
| 20 | 0.115 | 0.023 | 0.115 | 0.219 |
| Our Method’s Measure Error (m) | Baseline Method’s Measure Error (m) | ||||||
|---|---|---|---|---|---|---|---|
| No. | MSEP | No. | MSEP | No. | MSEP | No. | MSEP |
| 1 | 0.136 | 17 | 0.070 | 1 | 0.271 | 17 | 0.263 |
| 2 | 0.101 | 18 | 0.085 | 2 | 0.289 | 18 | 0.370 |
| 3 | 0.059 | 19 | 0.088 | 3 | 0.234 | 19 | 0.294 |
| 4 | 0.178 | 20 | 0.210 | 4 | 0.255 | 20 | 0.355 |
| 5 | 0.089 | 21 | 0.188 | 5 | 0.393 | 21 | 0.110 |
| 6 | 0.112 | 22 | 0.160 | 6 | 0.303 | 22 | 0.271 |
| 7 | 0.152 | 23 | 0.053 | 7 | 0.285 | 23 | 0.275 |
| 8 | 0.122 | 24 | 0.142 | 8 | 0.141 | 24 | 0.381 |
| 9 | 0.127 | 25 | 0.104 | 9 | 0.287 | 25 | 0.402 |
| 10 | 0.147 | 26 | 0.078 | 10 | 0.266 | 26 | 0.343 |
| 11 | 0.056 | 27 | 0.139 | 11 | 0.317 | 27 | 0.376 |
| 12 | 0.257 | 28 | 0.147 | 12 | 0.289 | 28 | 0.228 |
| 13 | 0.119 | 29 | 0.095 | 13 | 0.215 | 29 | 0.249 |
| 14 | 0.121 | 30 | 0.204 | 14 | 0.360 | 30 | 0.264 |
| 15 | 0.124 | 31 | 0.115 | 15 | Failure | 31 | 0.339 |
| 16 | 0.078 | 32 | 0.085 | 16 | Failure | 32 | 0.302 |
| No. | Our Method (m) | Baseline Method (m) | ||||
|---|---|---|---|---|---|---|
| ΔX | ΔY | MSEP | ΔX | ΔY | MSEP | |
| 1-1 | 0.025 | 0.098 | 0.101 | 0.253 | −0.082 | 0.266 |
| 1-2 | 0.026 | 0.110 | 0.113 | 0.284 | −0.125 | 0.310 |
| 2-1 | 0.081 | 0.037 | 0.089 | −0.394 | −0.080 | 0.402 |
| 2-2 | 0.038 | 0.168 | 0.172 | −0.382 | −0.107 | 0.397 |
| 3-1 | 0.084 | −0.023 | 0.087 | −0.218 | 0.176 | 0.280 |
| 3-1 | 0.034 | −0.160 | 0.164 | −0.257 | 0.095 | 0.274 |
| 4-1 | −0.002 | 0.048 | 0.048 | 0.013 | −0.268 | 0.268 |
| 4-2 | −0.046 | 0.044 | 0.064 | −0.023 | 0.298 | 0.299 |
| Our Method | Baseline Method Inliers | ||||||
|---|---|---|---|---|---|---|---|
| No. | Inliers | No. | Inliers | No. | Inliers | No. | Inliers |
| 1-1 | 112 | 2-1 | 135 | 1-1 | 125 | 2-1 | 142 |
| 1-2 | 106 | 2-2 | 112 | 1-2 | 119 | 2-2 | 142 |
| 3-1 | 73 | 4-1 | 148 | 3-1 | 95 | 4-1 | 158 |
| 3-2 | 65 | 4-2 | 134 | 3-2 | 91 | 4-2 | 154 |
© 2020 by the authors. Licensee MDPI, Basel, Switzerland. This article is an open access article distributed under the terms and conditions of the Creative Commons Attribution (CC BY) license (http://creativecommons.org/licenses/by/4.0/).
Share and Cite
Li, M.; Chen, R.; Liao, X.; Guo, B.; Zhang, W.; Guo, G. A Precise Indoor Visual Positioning Approach Using a Built Image Feature Database and Single User Image from Smartphone Cameras. Remote Sens. 2020, 12, 869. https://0-doi-org.brum.beds.ac.uk/10.3390/rs12050869
Li M, Chen R, Liao X, Guo B, Zhang W, Guo G. A Precise Indoor Visual Positioning Approach Using a Built Image Feature Database and Single User Image from Smartphone Cameras. Remote Sensing. 2020; 12(5):869. https://0-doi-org.brum.beds.ac.uk/10.3390/rs12050869
Chicago/Turabian StyleLi, Ming, Ruizhi Chen, Xuan Liao, Bingxuan Guo, Weilong Zhang, and Ge Guo. 2020. "A Precise Indoor Visual Positioning Approach Using a Built Image Feature Database and Single User Image from Smartphone Cameras" Remote Sensing 12, no. 5: 869. https://0-doi-org.brum.beds.ac.uk/10.3390/rs12050869