Review

Forestry Remote Sensing from Unmanned Aerial Vehicles: A Review Focusing on the Data, Processing and Potentialities

1
Engineering Department, School of Science and Technology, University of Trás-os-Montes e Alto Douro, 5000-801 Vila Real, Portugal
2
Centre for Robotics in Industry and Intelligent Systems (CRIIS), INESC Technology and Science (INESC-TEC), 4200-465 Porto, Portugal
3
Centre for the Research and Technology of Agro-Environmental and Biological Sciences, University of Trás-os-Montes e Alto Douro, 5000-801 Vila Real, Portugal
4
Institute of Electronics and Informatics Engineering of Aveiro (IEETA), Campus Universitário de Santiago, 3810-193 Aveiro, Portugal
*
Author to whom correspondence should be addressed.
Submission received: 7 February 2020 / Revised: 18 March 2020 / Accepted: 21 March 2020 / Published: 24 March 2020
(This article belongs to the Special Issue Application of Remote Sensing in Agroforestry)

Abstract

:
Currently, climate change poses a global threat, which may compromise the sustainability of agriculture, forestry and other land surface systems. In a changing world scenario, the economic importance of Remote Sensing (RS) to monitor forests and agricultural resources is imperative to the development of agroforestry systems. Traditional RS technologies encompass satellite and manned aircraft platforms. These platforms are continuously improving in terms of spatial, spectral, and temporal resolutions. The high spatial and temporal resolutions, flexibility and lower operational costs make Unmanned Aerial Vehicles (UAVs) a good alternative to traditional RS platforms. In the management process of forests resources, UAVs are one of the most suitable options to consider, mainly due to: (1) low operational costs and high-intensity data collection; (2) its capacity to host a wide range of sensors that could be adapted to be task-oriented; (3) its ability to plan data acquisition campaigns, avoiding inadequate weather conditions and providing data availability on-demand; and (4) the possibility to be used in real-time operations. This review aims to present the most significant UAV applications in forestry, identifying the appropriate sensors to be used in each situation as well as the data processing techniques commonly implemented.

Graphical Abstract

1. Introduction

Remote sensing has been one of the most attractive research fields over the last decades. It provides several techniques that measure different Earth physical properties of shapes using reflected or emitted energy, at a given time or period [1,2]. Remote sensing has been influenced by significant progress in several technologies, such as advanced data processing techniques, Geographical Information Systems (GIS) and Global Navigation Satellite Systems (GNSS), which contributed to improve and expand its applications [3].
Monitoring forest ecosystems, particularly in national forest inventory (NFI) programmes to enhance estimates, is one of the particular applications where remote sensing has been extensively used [4]. Forest ecosystems are very dynamic, being extremely important to the acquisition of accurate and up-to-date data [5]. The regular acquisition of data could be very expensive, depending on which remote sensing platform is being used [6]. Considering the traditional airborne and spaceborne remote sensing platforms, the spatial and temporal resolutions provided by satellite-based data are usually not suited to achieve regional or local objectives. On the other hand, airborne platforms can be used to acquire more scale-appropriate data. However, they are expensive when regular time-series monitoring is desired. Comparing these platforms to unmanned aircraft systems (UAS), it is quite clear that traditional remote sensing platforms are not suitable for real-time applications, once UAS combine high spatial resolution and quick turnaround times with lower operational costs [7]. For these reasons, the interest in UAS has been increasing.
UAS is defined as the entire system that includes the necessary equipment, network and technicians prepared to control the unmanned aircraft [8]. These platforms offer the potential to be used in several applications, such as environmental, emergency/rescue, surveillance and agroforestry [9]. Compared to airborne platforms, unmanned aerial vehicles (UAVs—referring to the platform itself), do not require a human pilot on board. Its control is conducted by a pilot using a ground station or a remote control, which contributes to decrease the price of these operations [10].
Small-sized UAVs are usually divided into two groups: fixed-wing and rotating-wing [11]. Both types are constrained different conditions [12] such as: the area to map and its geographical complexity, the desired spatial resolution, weather conditions and take-off and landing space. Fixed-wing UAVs usually offer a longer travel distance in a single flight, for the same payload, reaching a high cruise speed, making them especially suitable for usage in larger areas with its spatial resolution reaching few centimetres. On the other hand, rotary-wing or multi-rotor solutions, which rely on a set of propellers arranged around its core, are more flexible, being adequate to cover smaller areas with the ability to obtain a sub-centimetric spatial resolution. Moreover, when compared to fixed-wing UAVs, rotary-wing UAVs have a better manoeuvrability, since they are able to stand in a fixed position, are less prone to vibrations [13] and have the ability to vertically take-off and land (VTOL) [11]. In contrast, fixed-wing UAVs require a corridor for take-off and landing operations. For each project, the choice of the appropriate UAV solution has relevance, as well as the choice of the sensors that could be included in these platforms [12].
In the management process of forests and agricultural resources, there are some peculiarities that make UAVs one of the most suitable options to be considered: firstly, due to low material and operational costs and high-intensity data collection [14]; secondly, UAVs can host a wide range of sensors that could be adapted to be task-oriented [15]; thirdly, UAV missions can be planned in a flexible manner, avoiding inadequate weather conditions and providing data availability on-demand [16]; and lastly, UAVs can be used in real-time operations, for example, using thermal sensors that could be operating in order to detect forest fires, contributing to control fire spread in space and time [17]. Considering the identified advantages, in Koh and Wich [18] the opportunities that have emerged with the appearance of UAVs are clearly reflected, namely in forests monitoring. In the referred study, the goal was to monitor tropical forests in Indonesia using a UAV, once it offers affordable costs. Moreover, the higher cost of high-resolution satellite data and the issues related to frequent cloud cover also promoted the use of UAV, due to the flexibility and operability offered. UAVs can save time, manpower and financial resources for local conservation workers and researchers in the developing tropics [18].
Considering the potential of UAVs, Section 2 presents some concepts related to three three-dimensional (3D) data acquisition using UAVs. The most suitable UAV applications in forestry are presented in Section 3, where the appropriate sensors to be used in each situation are identified alongside with the data processing techniques commonly implemented (Section 4). Both Section 3 and Section 4 were elaborated based on a thorough review of research studies that were organized by application type (forest structural parameters estimation, tree species mapping and classification, forest fire and post-fire monitoring, forest health monitoring and disease detection, and other applications). Finally, Section 5 presents the main conclusions derived from the present study/review.
This document has been prepared so that it can be read in two different ways. Firstly, it can be read in its entirety, allowing readers to have a clear overview of the recent advances that result from the use of UAVs for forestry applications. Secondly, for readers familiar with the topics addressed, each section is self-contained and for that reason can be read separately and in any order. Finally, the tables at the end of each section summarizes the review of each addressed topic, and can be useful if consulted first.

2. Three-Dimensional Data Acquisition Using Unmanned Aerial Vehicles

In recent years, there has been a continuous improvement of remote sensing techniques and sensors, which provided high-resolution data acquisition, varying in spatial, spectral and temporal scales [19]. These technological advances allowed the appearance of methods for measuring and monitoring several aspects of complex forest structures [20], thus allowing for describing and analysing the vertical and horizontal distribution of vegetative elements [21].
In order to provide a better insight of forest’s structure and variability, sensors that are able to detect 3D structure have been employed in UAVs [22]. Essentially, sensors that can be used in remote sensing are active or passive. Regarding the active sensors, those are responsible for providing the energy necessary to detect the objects. The sensor transmits radiation toward the object, which in turn reflects the radiation to be detected and measured by the sensor [23]. Laser altimeters, light detection and ranging (LiDAR), radar, ranging instruments are among the most used active sensors in remote sensing [24]. Regarding passive sensors, those can detect natural radiation that is emitted or reflected by the objects. Most of these sensors operate in the visible, infrared, thermal infrared parts of the electromagnetic spectrum [10]. RGB, multispectral, hyperspectral and thermal sensors are some examples of passive sensors [15]. While LiDAR sensors can directly obtain 3D properties in the form of point clouds, to achieve the same with some passive sensors the photogrammetric processing can be used and is the most popular method.

2.1. LiDAR Sensors

In the last decade, improvements in the spatial resolution allowed airborne platforms to occupy a prominent role [25]. These platforms gained a renewed importance for remote sensing, due to new sensors implemented. For example, LiDAR sensors can provide a better resolution and a high-point density, when airborne platforms flight at a low speed [26]. The LiDAR technology is presented as one of the most feasible alternatives to monitor forest structure, composition and function [27]. These scanning systems are composed of an emitter and a receiver of the laser beam (laser pulses) and integrate an inertial navigation system (INS) and GNSS responsible for the orientation of the scanner in the space (position and inclination angles). These components have contributed significantly to LiDAR development, allowing the capture of multiple returns and to reach the ground, even in forested areas [28]. LiDAR sensors makes use of time of flight principle or phase-based differences to measure distances to objects. This is achieved by measuring the time frame between sent and returned laser pulses which are backscattered from objects. The returns generate a 3D point cloud, representing, in the case of forested environments, the vegetation structure [29]. In order to further improve the accuracy and quality of these data and to generate a best-fitting surface, interpolation and modulation methods could be used [30]. LiDAR sensors offers the possibility to penetrate the forest canopy which gives the ability to accurately measure structural canopy parameters, such as forest height, canopy openness and leaf area density along the entire vertical profile [31].
Initially, the use of LiDAR systems was confined to manned aircrafts through optically pumped solid-state lasers with short pulses [32]. However, nowadays, this type of sensors appears as a viable option to be implemented in UAVs, once it represents one of the fastest technologies in the domain of direct acquisition of spatial data, making possible to collect reliable and dense 3D point data over a given area of interest [33].

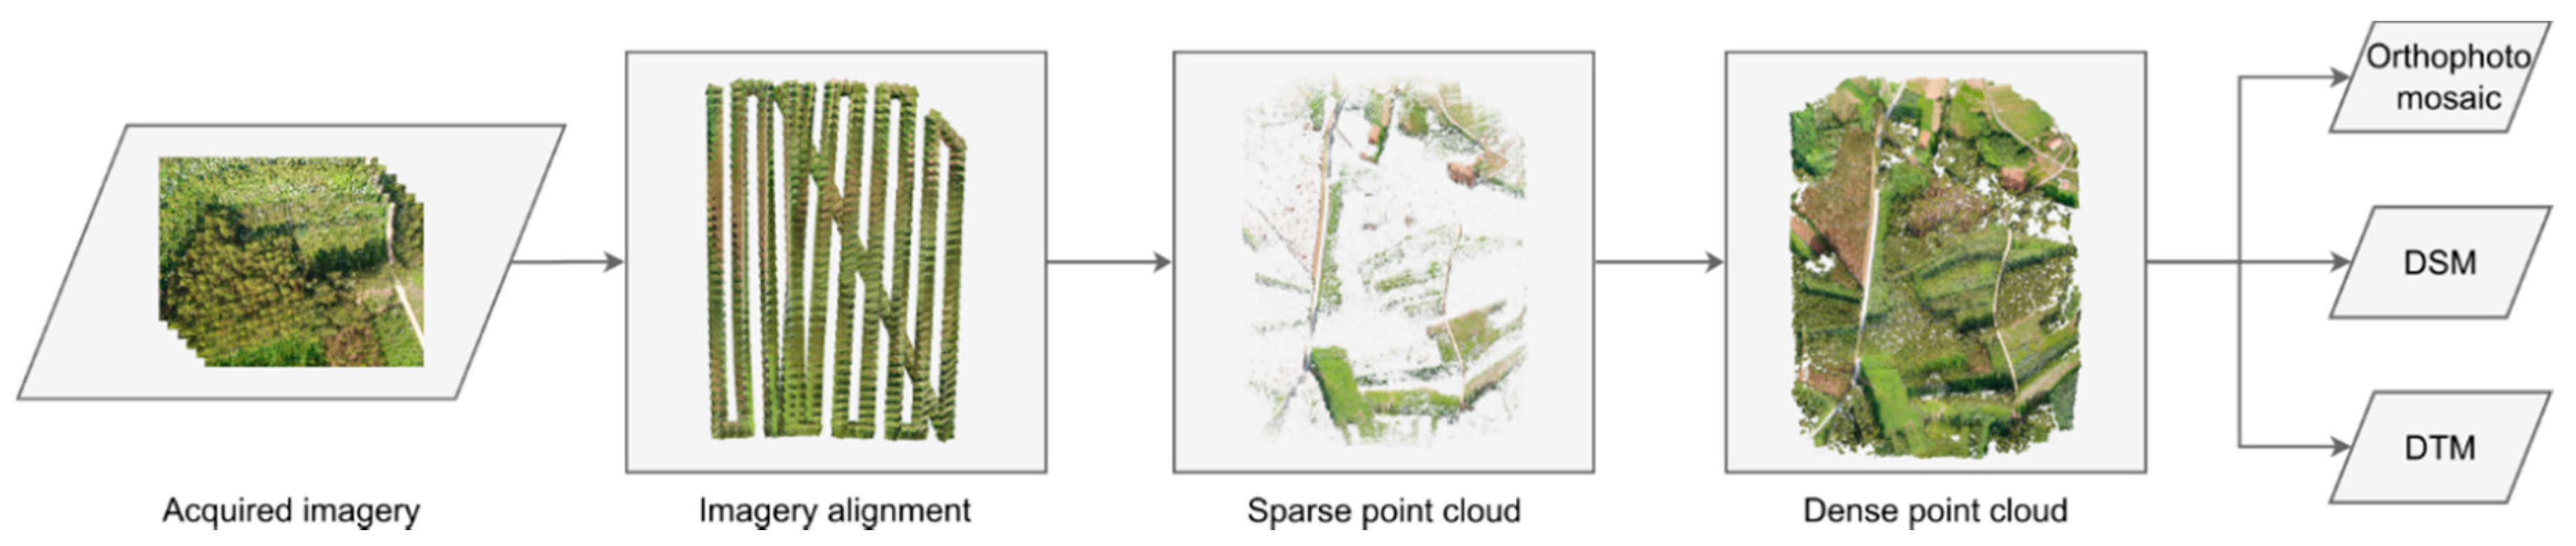
2.2. Photogrammetric Processing of UAV-Based Imagery

Recent sensors and innovative image processing techniques, such as structure from motion (SfM), have been used for generating point clouds derived from images [34]. This technique applies sophisticated algorithms, which are based on traditional stereoscopic photogrammetry principles, that use defined geometrical features captured in several images with different angular view points towards to generate a 3D point cloud [35]. In the case of aerial imagery acquired form UAVs, SfM techniques allow to extract 3D information, providing point clouds based on feature matches within overlapping images [36]. This way, UAV imagery emerged as a feasible alternative for the monitoring of the 3D structure of forests [37]. From the interpolation of the generated dense point clouds, several raster outcomes can be obtained. This process is summarized in Figure 1.
Currently, there are software solutions capable of performing a photogrammetric processing pipeline for different sensors. Some are commercially distributed, as the example of Agisoft MetaShape (Agisoft LLC, St. Petersburg, Russia) and Pix4Dmapper (Pix4D SA, Lausanne, Switzerland). There are also some open source options, for example MICMAC [38] and Open Drone Map [39]. The affordability of both UASs and photogrammetric processing software enabled the promotion of remote sensing studies and applications for research and commercial purposes.

2.3. Data Processing, Vegetation Segmentation and Classification

As mentioned in Section 2.1 and Section 2.2, both LiDAR and photogrammetry techniques are capable of generating dense point clouds in which each point represents a coordinate in the space (X, Y, Z). However, to deeply explore such products in the forest context, a few methods can be applied to automatically obtain forest-related parameters that are crucial towards its monitoring [40,41,42,43], such as tree height, canopy diameter, canopy area, diameter at breast height (DBH), volume, among others. These methods can be directly applied to the point clouds by filtering them into each isolated tree or by point cloud interpolation transforming its 3D data into a raster [29]. Point cloud interpolation can be achieved through different techniques commonly used in GIS data, as the example of Delaunay Triangulation [44] or Inverse Distance Weighting (IDW) [45] and triangulated irregular networks (TIN) [46]. Different outcomes can be driven from point clouds such as contour lines, terrain slopes, Digital Surface Models (DSMs) and Digital Terrain Models (DTMs). Whereas a DSM presents the features above the ground level, e.g., trees and shrubs—typically the results that provide the altitude of the surface objects where all pixels have the same spatial resolution—the DTM discards features above ground level, using only the points belonging to the ground. The subtraction of both models (DSM–DTM) provides the height difference between objects/features presented in above ground level providing, in the case of vegetation monitoring, a canopy height model (CHM), where vegetation height is present [47]. Considering photogrammetric outcomes, other types of data (depending on the sensor) can be generated such as orthophoto mosaics, vegetation indices, spectral signatures and land surface temperature [48].
Usually, CHMs or DSMs, point clouds and spectral information are used in tree segmentation processes [49]. Depending on the type of data, there are several algorithms for tree detection, being the detection rate dependent on the forest type—usually higher in coniferous stands than broadleaves [50,51,52], tree density and clustering [52,53,54] and not in the algorithm used [53].
Concerning the tree detection using CHMs or DSMs, there are two types of methods widely used (i.e., raster-based algorithms): variable-sized window (VSW) and watershed delineation (WD). VSW developed by Pupescu et al. [55] uses a variable-sized window to identify the local maxima in a surface mesh. Local maxima algorithms typically involve the selection of a search radius [56]. The WD is a method based on image processing that offers an improvement for crown geometries and creates a mesh inverting the CHM or DSM with the objective to detect the local minima of ridges and delineate adjacent individual tree crowns [57]. Watershed approaches can also be combined with local maxima detection to limit the number of local maxima within a segment to one [56]. Figure 2 presents an example of such approach in an area mainly composed by maritime pine trees.
Regarding the methods for tree detection using point clouds, there are two methods widely used: point cloud segmentation and the layer stacking [49]. The point cloud segmentation consists into first locating the local maxima points and consequently these points are iteratively assigned to trees based on a distance threshold of similar characteristics into homogeneous regions [58]. Point cloud segmentation methods are generally categorized into five classes: (1) edge-based methods; (2) region-based methods; (3) attributes-based methods; (4) model-based methods; and (5) graph-based methods [59]. Recently, Ayrey et al. [54] developed the layer stacking method, in which point cloud is sliced at given height threshold intervals and trees are isolated in each layer, then the results from all layers are merged producing, in this way, representative tree profiles. The authors compared the novel algorithm with WD, where the method of layer stacking reached higher detection rates.
Spectral information can also be used to segment and detect trees, the application of vegetation indices and object-based image analysis (OBIA) being some of the most common methods. Segmentation using vegetation indices is a pixel-based approach that can be defined as a set of arithmetic operations applied in different bands of the electromagnetic spectrum, which are usually used in remote sensing for extraction of different characteristics such as water status, vegetative vigour, presence of diseases, biomass estimation, among others [10]. Among the vast number of existing vegetation indices, the Normalized Difference Vegetation Index (NDVI) [60] is the most used in remote sensing. Although, in recent years, several others indices were developed with different purposes being some of some of the most representative listed in [10,61]. On the other hand, OBIA is an alternative to a pixel-based methods with basic analysis unit as image objects instead of individual pixels [62,63]. This kind of method groups a number of pixels into shapes with a meaningful representation of the objects with the goal to address more complex classes that are defined by spatial and hierarchical relationships within and during the classification process [64].
Nevertheless, all the methods previously presented are used to segment vegetation and not to identify and classify different species. In this scope, multispectral data acquired from UAVs has been used in tree species classification, but, in some cases, the data has been limited to RGB imagery and/or to modified RGB cameras to acquire near-infrared (NIR) or Red Edge channels using [65,66,67], also known as colour infrared (CIR) imagery. However, recently the development of small hyperspectral imaging sensors has enabled high-spectral and spatial resolution measurements from UAVs [68,69,70]. Hyperspectral sensors offer a large amount of data that is widely used in species classification with higher accuracies when compared to multispectral data [71]. Nevertheless, to extract patterns and features from these great amount of data, there is a need for more complex methods for its analysis and interpretation [72]. For this purpose, the most common methods are based on machine learning (ML) approaches as support-vector machines (SVMs) or random forests (RFs) [73,74]. Thus, tasks such as the detection and classification of tree species can be carried out with many different methods, regardless the type of sensor used.

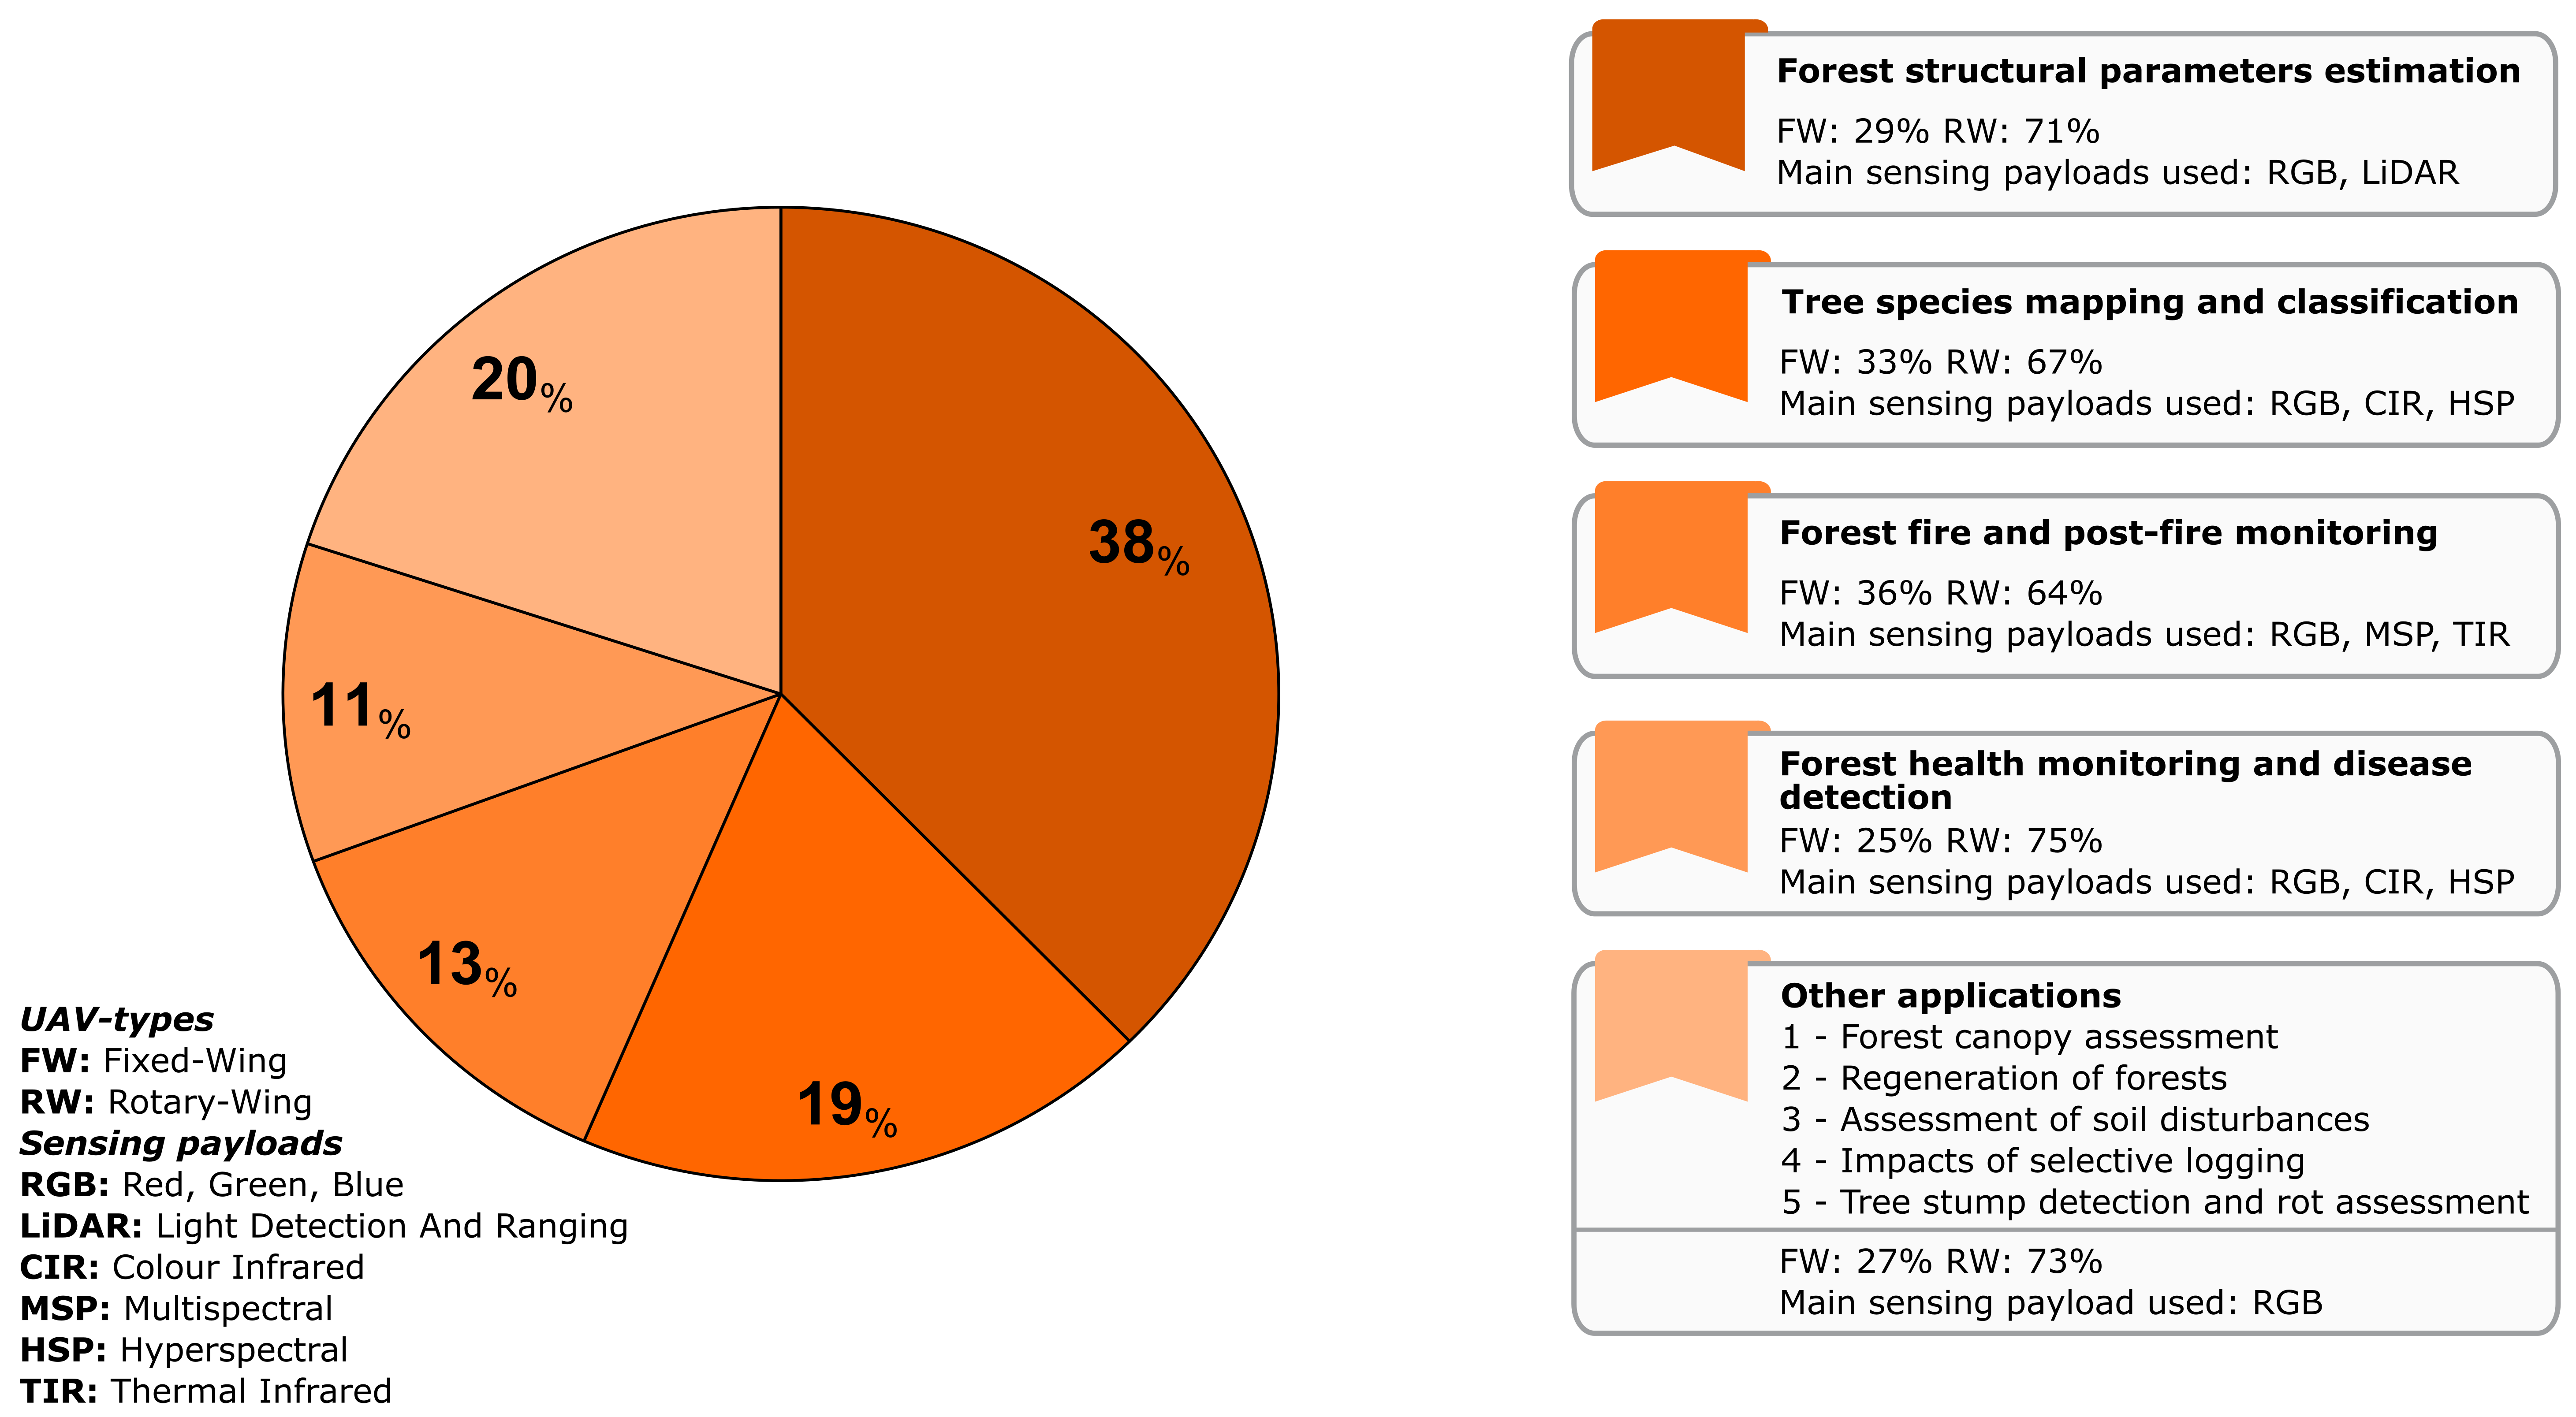
3. Applications of UAVs for Forestry Purposes

One of the biggest challenges in the application of remote sensing to forestry is associated with collecting updated and timely data over the target areas. In the assessment of pest outbreaks or wildfire spread in a forested landscapes, there is a risk of satellite imagery becoming unavailable and aerial photography from crewed/manned aircrafts becoming unaffordable [75]. On the other hand, the use of UAVs has considerable benefits, such as reduced costs, temporal and spatial flexibility, high accuracy data and the advantage of no human risks [76]. Forest fire monitoring and management was one of the first fields that showed the importance of UAVs in forestry [77]. In addition, there are a set of other applications that should be considered. For example, tree height and tree crown diameter determination have an important role in forestry monitoring [78,79]. To acquire multi-temporal and accurate data, different sensors could be used in forest surveying, namely LiDAR sensors, which provide precise tree information obtained from digital surface models. Moreover, hyperspectral sensors also allow tree classification and health monitoring. However, approaches with low-cost RGB sensors combined with photogrammetric processing should be considered as a valid alternative to those expensive sensors [79]. This section aims to present the reviewed UAV-based studies depending on each type of application. In this review, the studies using UAVs were grouped into five categories: (1) forest structural parameters estimation; (2) tree species mapping and classification; (3) forest fire and post-fire monitoring; (4) forest health monitoring and disease detection; and (5) other applications.

3.1. Forest Structural Parameters Estimation

Forest inventory involves a continuous monitoring process, which is based on regular and periodic measurements of physical, chemical and biological parameters that are crucial to detect changes in forests over time [80]. In the past, field and aerial surveys were performed to collect forest cover data, while aerial photography was used for plot-based analysis of forest stocks [81]. A few years later, with the emergence of satellite imaging technology and, more recently, the appearance of UAVs, these have been contributing to simplify, optimize and reduce the costs associated with the forest monitoring procedures [37]. In this way, this section is dedicated to analysing studies related to forest structure parameters estimation using UAV data, comparing and identifying the most suitable UAV sensors for this purpose. The extracted parameters can be evaluated at the stand-level by considering several metrics or at an individual tree level. Regarding stand-level parameters, such as basal area, biomass or volume, they are better derived using an area-based approach (ABA), whereas tree-level parameters, such as stem density, are better derived using an individual tree crown (ITC) approach [82]. Considering the ABA approaches, the response variable results from a combined value over a sample plot, such as volume per ha or mean tree height. In turn, ITC approaches are related to the estimation of attributes from trees or tree crowns [83].
In the studies analysed regarding this topic, UAV data acquisition was conducted, and its accuracy was assessed by comparing it with ground-truth measurements or by using other remotely sensed data as reference (e.g., airborne laser scanner (ALS) point clouds). Taking this into account, the following studies are analysed by focusing in the sensor type used to perform UAV data acquisition, the tree species analysed, and the parameters estimated from the UAV-based data. The estimated and measured values are commonly evaluated by their correlation using statistical methods to measure how close the data are to a fitted regression line or curve. This way, and to facilitate text interpretation, we consider values for coefficient of determination (R2) and Pearson’s correlation (r) lower than 0.5 as being a low correlation, between 0.5 up to 0.7 as good correlation and above 0.7 as a strong correlation.

3.1.1. Stand-Level Studies

Regarding stand-level studies, several authors estimated height (H) parameters, such as Lorey’s mean height (HL), dominant height (Hdom) and maximum height (HM), using UAV-based data.
Considering the results on HL, Puliti et al. [37], Cao et al. [84] (UAV-LiDAR; UAV-RGB) and Ota et al. [85] obtained consistent results, revealing adjusted R2 values with strong correlation for Lorey’s mean height, (respectively 0.71, 0.90, 0.82 and 0.93). Regarding results of Hdom, Puliti et al. [37], Ota et al. [85] and Guo et al. [86] also reached strong correlation (R2 respectively 0.97, 0.91 and 0.81). Analysing the results of HM, Ota et al. [85] confirmed a strong correlation (R2 = 0.93) for this parameter.
Considering the height parameters estimated by several studies, the results were coherent, presenting a strong correlation. However, it is worth to notice that results are dependent on UAV sensor used (e.g., RGB, LiDAR, CIR), as well as the forest characteristics and species. Taking into account the sensors used in the aforementioned studies, Puliti et al. [37] used a UAV-based CIR imagery; Cao et al. [84] and Ota et al. [85] used a UAV-based RGB imagery; and Cao et al. [84] and Guo et al. [86] used a UAV LiDAR system. Despite the fact the results obtained are similar, Cao et al. [84] refer that the accuracies of models obtained with UAV-LiDAR were higher than those obtained by UAV-RGB. Indeed, UAV-RGB point clouds were limited to the upper canopy, lacking the ability to penetrate below the canopy as UAV-LiDAR. Considering the forest characteristics and species, Puliti et al. [37] suggested that boreal forests are usually considered as a more simple type due to the species composition and the height variations, in contrast with temperate broadleaved forests that are complex due to the irregular height of species. In line with this, Cao et al. [84] analysed different tree species, dawn redwood (coniferous) and poplar (broadleaved), revealing that the results obtained with different sensors were more similar in dawn redwood (coniferous) specie. According to the author, this is because dawn redwood (coniferous) has a more regular tree crown shape when compared to poplar (broadleaved) species, which simplifies identification process executed by the algorithm. Ota et al. [85], in turn, concluded that the estimated results obtained in managed temperate coniferous forests are comparable to the conifer-dominated boreal forests and superior to those obtained in dry tropical forests.
Stem number (Sn) was modulated by few authors. Puliti et al. [37] and Cao et al. [84] (UAV-LiDAR; UAV-RGB) obtained a good correlation for Sn parameter (R2 respectively 0.60, 0.56 and 0.50), demonstrating similarity in their studies. Comparing these results with those obtained in height parameters, Sn presents lower correlations. Following these results, Gobakken and Næsset [87] refer that stem number models are associated to large errors, being underestimated in plots with very dense forest. As it already mentioned, Cao et al. [84] implemented their study in forests with different species characterized by irregular height and crown, thus contributing to the lowest correlation obtained in Sn.
Giannetti et al. [88], Chen et al. [89], Goodbody et al. [90] and Puliti et al. [37] obtained similar stem volume (Sv) results (R2 respectively 0.80–0.83, 0.91, 0.93, 0.85), presenting a strong correlation. Giannetti et al. [88] and Puliti et al. [37] used a UAV-based CIR imagery, while Chen et al. [89] and Goodbody et al. [90] used UAV-based RGB imagery. According to Goodbody et al. [90], Sv parameter was modelled with high accuracy, in boreal forest, using UAV structure from motion (SfM) algorithm.
In the basal area (BA) estimation, Alonzo et al. [91] achieved a strong correlation (R2 = 0.79). On the other hand Puliti et al. [37] and Cao et al. [84] (UAV-LiDAR; UAV-RGB) obtained a good correlation in BA parameter (R2 respectively 0.60, 0.64 and 0.61). Considering the Alonzo et al. [91] study, authors mentioned that the classification accuracy was improved using three variables representing crown height, colour and form. Authors also referred that SfM point cloud data generated robust models.
The diameter at breast height (DBH) parameter was analysed in Cao et al. [84] study. Authors obtained a good correlation using a LiDAR sensor (UAV-LiDAR) and RGB sensor (UAV-RGB), with R2 respectively 0.69 and 0.50. However, the UAV-LiDAR data presented a slightly better correlation than RGB sensor. Despite this, the UAV-RGB data also proved the ability to provide estimations of forest structural attributes with similar accuracies.
Several studies achieved promising results in the volume (V) estimation. Cao et al. [84] (UAV-LiDAR; UAV-RGB), Ota et al. [85] and Jayathunga et al. [92] achieved a strong correlation in the estimation of this parameter (R2 respectively 0.78, 0.70, 0.75 and 0.84). Considering these results, Cao et al. [84] obtained, once again, a higher correlation using LiDAR system. On the other hand, Jayathunga et al. [92] achieved a strong correlation thanks to digital photogrammetry of UAV imagery, combined with LiDAR-DTM, which can be feasible for the estimation of V of uneven-aged mixed conifer-broadleaf forest.
In above ground biomass (AGB) estimation, a good correlation was achieved by Cao et al. [84] (UAV-LiDAR; UAV-RGB), with R2 respectively 0.68 and 0.63. Alonzo et al. [91] and Guo et al. [86], in turn, had a strong correlation for AGB parameter, respectively R2 = 0.92 and 0.84. As verified in Cao et al. [84] study, Guo et al. [86] also used LiDAR sensor in different types of forest, demonstrating the ability of this system to map forest structure under different vegetation types and terrain conditions, with a high point density. Regarding Alonzo et al. [91] study, the strong correlation obtained stands out, once authors used a UAV-RGB sensor. An explanation for this result can be related to the type of forest analysed, once authors estimated parameters in the boreal forest.
Table 1 summarizes the studies addressed in this subsection by presenting the UAV type and sensors used in each study. The most relevant results are also provided.

3.1.2. Tree-Level Studies

Considering tree-level studies, interesting results were obtained for tree height estimation. The higher accuracies obtained using the low-cost UAV-RGB sensor revealed the potential of this solution. Ni et al. [93] (R2 = 0.87), Guerra-Hernández et al. [94] (R2 = 0.81), Guerra-Hernández et al. [95] (R2 = 0.96) and Lin et al. [96] (R2 = 0.92) studies presented a strong correlation in the height parameter estimation, using a UAV-RGB sensor. Guerra-Hernández et al. [97] have a more recent study that also performed height estimations with an RGB sensor, obtaining a good correlation (r: 0.61–0.69). On the other hand, Jaakkola et al. [98] (r = 0.92) and Yin and Wang [99] (r > 0.90) used a UAV-LiDAR sensor and achieved a strong correlation. Sankey et al. [100], in turn, obtained a strong correlation (R2 = 0.90) using LiDAR, multispectral (MSP) and hyperspectral (HSP) sensor. In the studies analysed, Wallace et al. [101] offered a different approach comparing the performance of two UAV sensors, LiDAR and RGB, for height estimations. The authors obtained better results using LiDAR (R2 = 0.84) than RGB (R2 = 0.68). According to Wallace et al. [101], LiDAR proved to be the best solution to estimate the vertical distribution of vegetation, once it better penetrates the upper canopy. Whereas SfM presented the poor definition of the mid- and understory parts of the forest. In the study performed by Wallace et al. [101], the plot analysed consisted of Eucalyptus pulchella trees, varying in age and ranging in height from 4.7 m to 16.2 m, which could complicate the acquisition of high-density point cloud data of the vertical distribution of vegetation.
Regarding tree crown diameter (CD) estimation, Sankey et al. [100] and Yin and Wang [99] achieved a strong correlation (R2 respectively 0.72 and 0.83–0.85), using LiDAR system. Considering the study areas where authors used the UAV-RGB sensor, Panagiotidis et al. [78] analysed two different plots. Plot 1 was composed of Norway spruce (Picea abies L.) together with European larch (Larix decidua Mill.) and Scots pine (Pinus sylvestris L.), while plot 2 was mainly composed of Norway spruce and Scots pine together with scattered individuals of European larch and Silver birch (Betula pendula Roth). The CD estimation obtained in plot 1 had a good correlation (R2 = 0.63). On the other hand, the CD estimation obtained in plot 2 presented a strong correlation (R2 = 0.85). Another study was developed by Guerra-Hernández et al. [94] with the use of UAV-RGB sensor, allowing obtaining a strong correlation (R2 = 0.95). Despite the good performance obtained by Guerra-Hernández et al. [94], authors referred that methodology was applied on a flat terrain below sparsely distributed trees without the need of supplementary data points to generate a DTM. However, poor performance is expected in denser vegetated areas, due to the impossibility of aerial photography for penetrating through vegetation.
Regarding DBH estimations using RGB sensor, the results achieved in the several studies analysed are consistent. Carr and Slyder [102] (r: 0.82), Iizuka et al. [103] (R2 = 0.78–0.79) and Guerra-Hernández et al. [95] (R2 = 0.79) presented a strong correlation. According to Carr and Slyder [102], it may be possible to measure basal area directly from the point cloud data, instead of using the typical regression-based approaches. The slicing and averaging approach, performed in the study, mitigates errors due to scattering in the point cloud. Considering the LiDAR performance in DBH estimations, contrasting results were identified. While Jaakkola et al. [98] (r = 0.88) achieved a strong correlation, Chisholm et al. [104] (R2 = 0.45) obtained a low correlation. In the Chisholm et al. [104] study, authors refer that the use of UAV-mounted LiDAR for the below-canopy, without the use of GPS, has several limitations. However, it seems to be a promising technology, once DBH estimates were strongly positively correlated with the human-based ones.
In Sv estimations, Jaakkola et al. [98] used a UAV-Lidar system, obtaining a strong correlation (r: 0.88). Authors proposed a new concept based on the above and inside-canopy laser scanning survey through a UAV platform. In this way, the authors intended to improve the acquisition of the compact information of tree trunks and crowns. Regarding to Abdollahnejad et al. [105] study, authors used a UAV-RGB sensor, achieving a strong correlation (R2 = 0.71). Abdollahnejad et al. [105] concluded that remote sensing techniques revealed effective for characterizing forest tree parameters.
Considering the AGB parameter, Lin et al. [96] (R2 = 0.96), Otero et al. [106] (R2 = 0.75) and Guerra-Hernández et al. [95] (R2 = 0.86–0.87) performed studies using an RGB sensor, obtaining a strong correlation. Lin et al. [96] highlighted that a good AGB estimation is dependent of an accurate individual tree height extraction. In their study, a strong correlation was achieved for the height parameter (R2 = 0.92), which contributed to obtaining similar AGB results to those obtained by UAV-LiDAR system. Moreover, it is important to note that authors applied their methodology in a relatively low density subalpine coniferous forest, which contributed to obtained correlation. On the other hand, Jaakkola et al. [98] obtained a strong correlation (r = 0.89) using a LiDAR sensor.
Table 2 summarizes the studies addressed in this subsection by presenting the UAV type and sensors used in each study. Some of the most significant obtained results are also provided.

3.2. Tree Species Mapping and Classification

UAV-based data can help distinguish tree species by their structural parameters or by their spectral response and vegetation structure. This way, several studies can be found addressing this topic focusing in forest type classification or in tree species classification. Several classification methods were used (Table 3). However, two methods stand out: random forest (RF) and support vector machines (SVM). The selection of the most feasible method is dependent on the type of problem being solved. In the case of having multiple features but limited records, a support vector machine is the best option. In the case of needing to handle high data dimensionality and multicollinearity, RF might work better [109].
Considering studies that use RF as a classification method (Table 3) applied to the UAV-RGB-based imagery, the ones performed by Goodbody et al. [110] and Röder et al. [111] are highlighted. In the Goodbody et al. [110] study, authors intended to evaluate forestry regeneration in clear-cut stands in two different areas. In this way, authors computed several outcomes, such as orthophoto mosaics, dense point clouds and vegetation indices (NGRDI [112], VARIg [113], GLI [114]), which were used for the application of Object-Based Image Analysis (OBIA) methodology and RF classification method. The methodologies applied led to good results with overall accuracies of 86% to 95% for the first area and overall accuracy for the second area that ranged from 93% to 95%. On the other hand, Röder et al. [111] assessed forest disturbances caused by the European bark beetle (Ips typographus L.) in stands dominated by Norway spruce (Picea abies). RF was used to classify tree/non-tree areas to restrict the algorithm for tree crowns. Considering the results obtained, authors referred that the number of correctly delineated trees by automatic approach (mean value = 24.1%) was far lower than values reported by other studies performed in different locations, justifying the poor performance of the process with the complex structure of the sites.
Regarding the RF method applied to UAV-RGB-NIR-based imagery, Michez et al. [67] used RGB and CIR sensors to survey two riparian forest sites. OBIA was applied for individual tree segmentation, and different object sizes were tested, and a RF classifier was applied. The overall accuracy reached 79.5% in site 1 and 84.1% in site 2. The black alder’s health assessment reached 90.6% accuracy. Sá et al. [115], in turn, investigated how UAV can be used to map the invasive plant Acacia longifolia and to monitoring the effect of biocontrol agent Trichilogaster acaciaelongifoliae and to evaluate if there is a linear correlation between the number of flowers. For the classification, the authors used a RF with the orthophoto mosaics (RGB+NIR) and the CHM as input where 70% of data was used for training and 30% for validation. RF classification had an overall accuracy higher than 0.95 with Cohen’s Kappa and higher than 0.85 in the seven test sites when detecting the presence of flowers of Acacia longifolia. The authors concluded that UAVs clearly offer a simple and reliable method to map the distribution of the investigated invasive species, with higher accuracy in the peak of flowering. However, linearly correlating the number of flowers with UAV imagery failed. Indeed, the use of RF method applied to UAV-RGB-NIR data proved to be effective in species classification.
Considering the RF method applied to multispectral (MSP) data, Franklin and Ahmed [116] studied deciduous tree species classification using OBIA and RF. Both methods were combined for the classification, and 23 tree crowns (species: White birch, aspen, Sugar maple and Red maple) were used for validation. The dataset was composed by spectral, textural and shape features. An overall accuracy of 78% was obtained. Aspen and birch were the most distinct species; the two different maple species appeared to be confused with each other and with immature trees and understory shrubs.
Nevalainen et al. [71] performed a study with the application of the RF method to UAV-hyperspectral (HSP)-based data. Authors addressed the data fusion from UAV-based RGB and HSP data (33 bands, 507.60 nm to 819.70 nm) for individual tree detection and classification in a boreal forest. Four classes were proposed to be detected among these tree species: Pine, Spruce, Birch and Larch. Several classification methods were tested, the highest accuracy was achieved by RF (95.2%). On the other hand, Melville et al. [117] applied OBIA in UAV HSP data (20 bands, from 600 to 875 nm) and used a photogrammetric-driven DSM to distinguish different native lowland species: Themeda triandra grassland, Wilsonia rotundifolia, Danthonia/Poa grassland, and Acacia dealbata. A RF classifier was applied to the objects resulting from OBIA application in the surveyed area, including the DSM altitude values, spectral information and terrain slope. Training data for RF obtained an overall accuracy of 97.44%. When applied to the whole studied area the overall accuracy decreased to 71.8%. This decrease in the accuracy was justified by some confusion among Wilsonia and soil classes. However, there was a clear spatial distribution of the studied species matching the ground-truth observations. Nevalainen et al. [71] and Melville et al. [117] demonstrated the huge potential of RF when associated with HSP sensor, presenting good accuracies in their results.
Regarding the application of the k-NN and SVM methods to UAV-HSP imagery, the study performed by Cao et al. [118] stands out. The authors explored the use of UAV hyperspectral data (125 bands, 454 nm to 950 nm) and DSM for mangrove species classification. The surveyed area (3 ha) was composed of the following species: K. candel, A. aureum, A. corniculatum, S. apetala, A. ilicifolius, H. littoralis, and T. populnea. KC and SA. Apart from these species, shadow, water and broadwalk were the non-vegetation classes considered for classification. For this purpose, the area was clustered by means of OBIA, then spectral, textural features and vegetation indices were derived from hyperspectral data and height information was extracted from the DSM. Band selection was performed using classification and regression tree (CART) method and feature reduction was made through correlation-based feature selection (CFS) algorithm. The clustered objects were classified in the different mangrove species and other land covers. In the classification features (spectral, textural and VIs) the overall accuracy was 76.12% for kNN and 82.39% for SVM. When considering DSM, the accuracy increased to 82.09% for kNN and to 88.66% in SVM. SVM outperformed kNN and height information played a crucial role into discriminating mangrove species with similar spectral information.
Other classification methods were also used. Among the studies analysed, the ones performed by Gini et al. [65,119] were highlighted, once it compares different classification methods (Table 3): unsupervised and supervised. Authors explored the usage of UAV-based RGB and CIR imagery in a park area in Italy. They classified eight classes, four belonging to trees and the remaining were grass, bare soil, concrete and shadow. Unsupervised and supervised classification methods were applied. The unsupervised method (ISODATA) obtained an overall accuracy of 50%, not being able to distinguish most of the tree species classes. Good results were obtained in concrete class since this has higher spectral differences than other classes. The supervised method relied in the maximum likelihood algorithm, and allowed an overall accuracy of 79%, the hornbean class being the less accurate and classified as part of the other vegetation class.
Many other studies regarding the use of UAV-based data for classification can be found in the literature. The most relevant works are listed below:
Sankey et al. [120] applied the decision trees (DT) method. Nevalainen et al. [71] applied the decision trees (DT), naive bayes (NB) and multi-layer perceptron (MLP) methods. Gini et al. [65,119] applied the ISODATA and maximum likelihood (MaxL) methods. Jayathunga et al. [92] applied maximum likelihood (MaxL) method. Laliberte et al. [121] applied hierarchical image classification (HIC) method. Morales et al. [122] applied convolutional neural network (CNN) method. Alonzo et al. [91] applied canonical discriminant classifier (CDC) method. Generically, the authors obtained good accuracies with the classification methods used.

3.3. Forest Fire and Post-Fire Monitoring

Fires are one of the most disturbing events occurring in forests. They can cause life and property losses. Once a forest fire burns off vegetation, soil, organic matter, and moisture, the danger of landslides or other secondary disasters is present [128]. Therefore, forest fire and post-fire monitoring are essential, which are extremely dependent on emerging remote sensing technologies. In this way, this section intends to explore and analyse fire and post-fire monitoring studies focusing on the UAV-sensors potential.
Regarding forest fire prevention, some countries adopted legislation towards vegetation management to increase the safety of populations in wildland–urban interfaces. This way, Fernández-Álvarez et al. [49] proposed a methodology for monitoring the compliance of identified vegetation with the fire prevention legislation, using UAV LiDAR-driven models in wildland–urban interfaces. The data processing workflow consisted of filtering the LiDAR point cloud to obtain DTM, DSM, and consequently CHM and shrub cover. For this purpose, the authors identified biomass management strips which, depending on the type, can have different diameters (ranging from 2 m to 50 m). The shrub cover was computed by considering LiDAR returns with more than 0.2 m and lower than 3 m. For individual tree detection, the authors applied the watershed method in the inverted CHM and a method consisting of variable-sized window. This methodology enabled to estimate tree parameters such as height, pruning height, and spacing.
Martínez-de Dios et al. [129], Merino et al. [130], Hristov et al. [131], McKenna et al. [132], Aicardi et al. [133], White et al. [134], Larrinaga and Brotons [135], Fernández-Guisuraga [136], Mayr et al. [137] performed studies based on the use of UAV-RGB sensor. Martínez-de Dios et al. [129], Merino et al. [130] and Hristov et al. [131] studies also used a thermal infrared sensor (TIR). Martínez-de Dios et al. [129] proposed a system to fill the gap in temporal and spatial resolution of forest fire information acquisition. The system has high flexibility and modularity and relies on the complementary usage of UAVs and static cameras. This way, potential false alarms from static cameras can be reduced by a UAV confirmation. The proposed approach enabled through multi-camera data fusion to estimate, in real-time, fire geometry as its location and width of fire front, spread rate, its direction, and fire flame height. Authors reported some challenges such as smoke occluding the visual images, the dynamics of the fire front which lead to high-frequency fluctuations, and and errors in image geo-referencing. The research continued in Merino et al. [130], which used multiple UAVs to mitigate the errors and limitations from Martínez-de Dios et al. [129] by having different perspectives of the fire front, avoiding the presence of smoke occluding the fire front, and to cover more extensive areas. Hristov et al. [131], in turn, proposed a conceptual model combining medium altitude fixed-wing UAVs for permanent monitoring of a certain area. If a potential fire is detected, low altitude rotary-wing UAVs are triggered to confirm the forest fire. If confirmed, ground level teams are notified, and the fixed-wing UAV continues the fire monitoring. In case of a false alarm the UAV returns to its base and the fixed-wing UAV maintains its monitoring procedure. Both UAVs are equipped with RGB and thermal sensors. However, no practical applications were presented.
Considering the studies developed by Shin et al. [138], White et al. [134] and Fernández-Guisuraga et al. [136], authors used MSP sensors. Shin et al. [138] evaluated the feasibility of using UAV imagery to estimate forest canopy fuels and its structure in a ponderosa pine (Pinus ponderosa) stand with a small Gambel oak (Quercus gambelii) component. The results obtained indicate that UAV imagery can be used to accurately estimate forest canopy cover (R2 = 0.82, RMSE = 8.9%). Tree density estimates correctly detected 74% of field-mapped trees with a 16% commission error rate. Individual tree height estimation was strongly correlated with field measurements (R2 = 0.71, RMSE = 1.83 m), while canopy base height estimation had a poor correlation (R2 = 0.34, RMSE = 2.52 m). This way, UAVs can provide additional data to supplement, or potentially substitute, traditional estimates of canopy fuel. Considering the spatial resolution that can be achieved by UAVs, White et al. [134] evaluated the potential of jake pine (Pinus banksiana) saplings identification in post-fire environments. The best results were achieved in the latter epoch due to sapling development compared to ground vegetation cover, combination of RGB and NIR-R bands obtained higher accuracies. The Red-edge band did not provide any substantial improvements of results, only when used along with NIR band. In the study performed by Fernández-Guisuraga et al. [136], the possibility of using UAVs to generate multi-spectral orthophoto mosaics for large areas affected by forest fires was evaluated. For this purpose, 3000 ha were surveyed using a UAV equipped with a multi-spectral sensor. Acquired UAV-based data was compared against satellite imagery (WorldView-2) and it provided higher spatial variability in heterogeneous burned areas, and NDVI from both sources was compared. It was concluded that the high-resolution multispectral data acquired can be used for post-fire decision making and interpretation of fine-scale ground patterns.
Table 4 summarizes the used UAV types, sensing payloads and principal outcomes used in each study addressed in this subsection.

3.4. Forest Health Monitoring and Disease Detection

The detection of diseases in forest trees caused by biotic or abiotic factors is essential for forest sustainability. To prevent and monitor events that could compromise the forest health, new remotely sensing sensors and platforms have been emerging, providing enhanced and accurate information of forest condition [139].
Näsi et al. [140] and Minařík and Langhammer [141] presented similar studies, related to the detection of Bark Beetle damage in Norway spruces. While Näsi et al. [140] used a Fabry-Pérot Interferometer (FPI) composed of a low-cost miniaturized hyperspectral camera and a RGB camera, mounted on a rotary wing UAV, and Minařík and Langhammer [141] used a UAV equipped with a multispectral sensor. Näsi et al. [140] considered three classes (healthy, infested, and dead) and Minařík and Langhammer [141] five classes (healthy, infested, dead, forest restoration and grass). According to Näsi et al. [140], the classification of healthy and infested trees was challenging due to minor differences in the spectra. On the other hand, the class ‘dead’ was clearly distinguishable from the other two. Minařík and Langhammer [141], in turn, refers that the digital number (DN) values of dead trees are separable only in the red and red-edge portion of the spectrum from infested trees. In the NIR wavelengths, differences were not verified between DN values of dead and infested trees. Considering the results obtained, in the Näsi et al. [140] study the overall classification accuracy was 90% for one test site and 72% for the other. The authors stated that their study proved for the first time the feasibility of the FPI technology in capturing 3D hyperspectral data in forest areas. In Minařík and Langhammer [141], NDVI and the Normalized Difference Red Edge (NDRE) [142] were able to correctly distinguish the boundary categories represented by the healthy and dead trees. On the other hand, the Anthocyanin reflectance index [143] and Red Edge–Green NDVI [144] were not able to separate and distinguish the categories of forest status.
Considering studies that use the UAV-RGB sensor applied to the detection of diseases, Cardil et al. [145] assessed the insect outbreak impacts, more specifically the pine processionary moth, on a forest mostly covered by conifers (Pinus sylvestris, Pinus nigra) and deciduous species (Quercus ilex, Quercus faginea). According to the authors, it was possible to identify healthy, infested and completed defoliated trees, with an overall accuracy of 79 %. When defoliation is low, and located in treetops or small branches, it may not be possible to recognize trees as infested. The results obtained proved that UAVs can be used with enough accuracy on processionary moth infestation severity mapping. A similar study, using the UAV-RGB sensor, was performed by Otsu et al. [146]. The authors estimated the severity of defoliation caused by the pine processionary moth. Tests were performed in areas composed mainly by Pinus nigra and Pinus sylvestris trees. Several vegetation indices were used and their difference (dVI) was computed. Even though dVIs were calibrated, nNDVIs resulted better with an accuracy of 78.7%. These results show great potential in the use of UAV images as an alternative to other conventional ground-truth data. In Otsu et al. [146], it was found that using Moisture Stress Index (MSI) the overall accuracy was a very promising approach for estimating the severity of defoliation.
Considering the studies based on the application of UAV-based RGB and CIR imagery, Lehmann et al. [147] proposed a low-cost solution, for private forest owners, to detect pest infestations, this being achieved by detection of defoliation and altered leaf reflection. Authors applied photogrammetric workflow and used OBIA techniques. Two study sites were considered, composed of oak trees, which can be infected by the oak splendour beetle. A modified NDVI derived classification was used to distinguish between five vegetation health classes. Very good (site A) and good (site B) overall KIA statistics were achieved. However, for the classes ‘infested’ and ‘dead branches’, KIA statistics were poorer. Some dead branches were often misclassified. Infested branches classification achieved suitable results. With this approach the cause of stress was not possible to be detected. Another study, performed by Smigaj et al. [148] presented a system to detect disease-induced canopy temperature increase. The system is composed of a fixed-wing UAV carrying thermal, RGB and CIR sensors. The acquired imagery was used to evaluate the detection of Red Band Needle Blight in Scots and Lodgepole pine stands flying. Datasets were geometrically corrected by registering to a CHM. A moderate positive correlation was obtained between tree temperature and disease progress suggesting that it might be possible to detect sub-degree temperature differences induced by a disease onset. However, more tests must be performed at different periods of the day and various atmospheric conditions, since plant temperature can potentially be influenced by environmental factors. Table 5 summarizes the used UAV types, sensing payloads and principal outcomes used in each study addressed in this subsection.

3.5. Other Applications
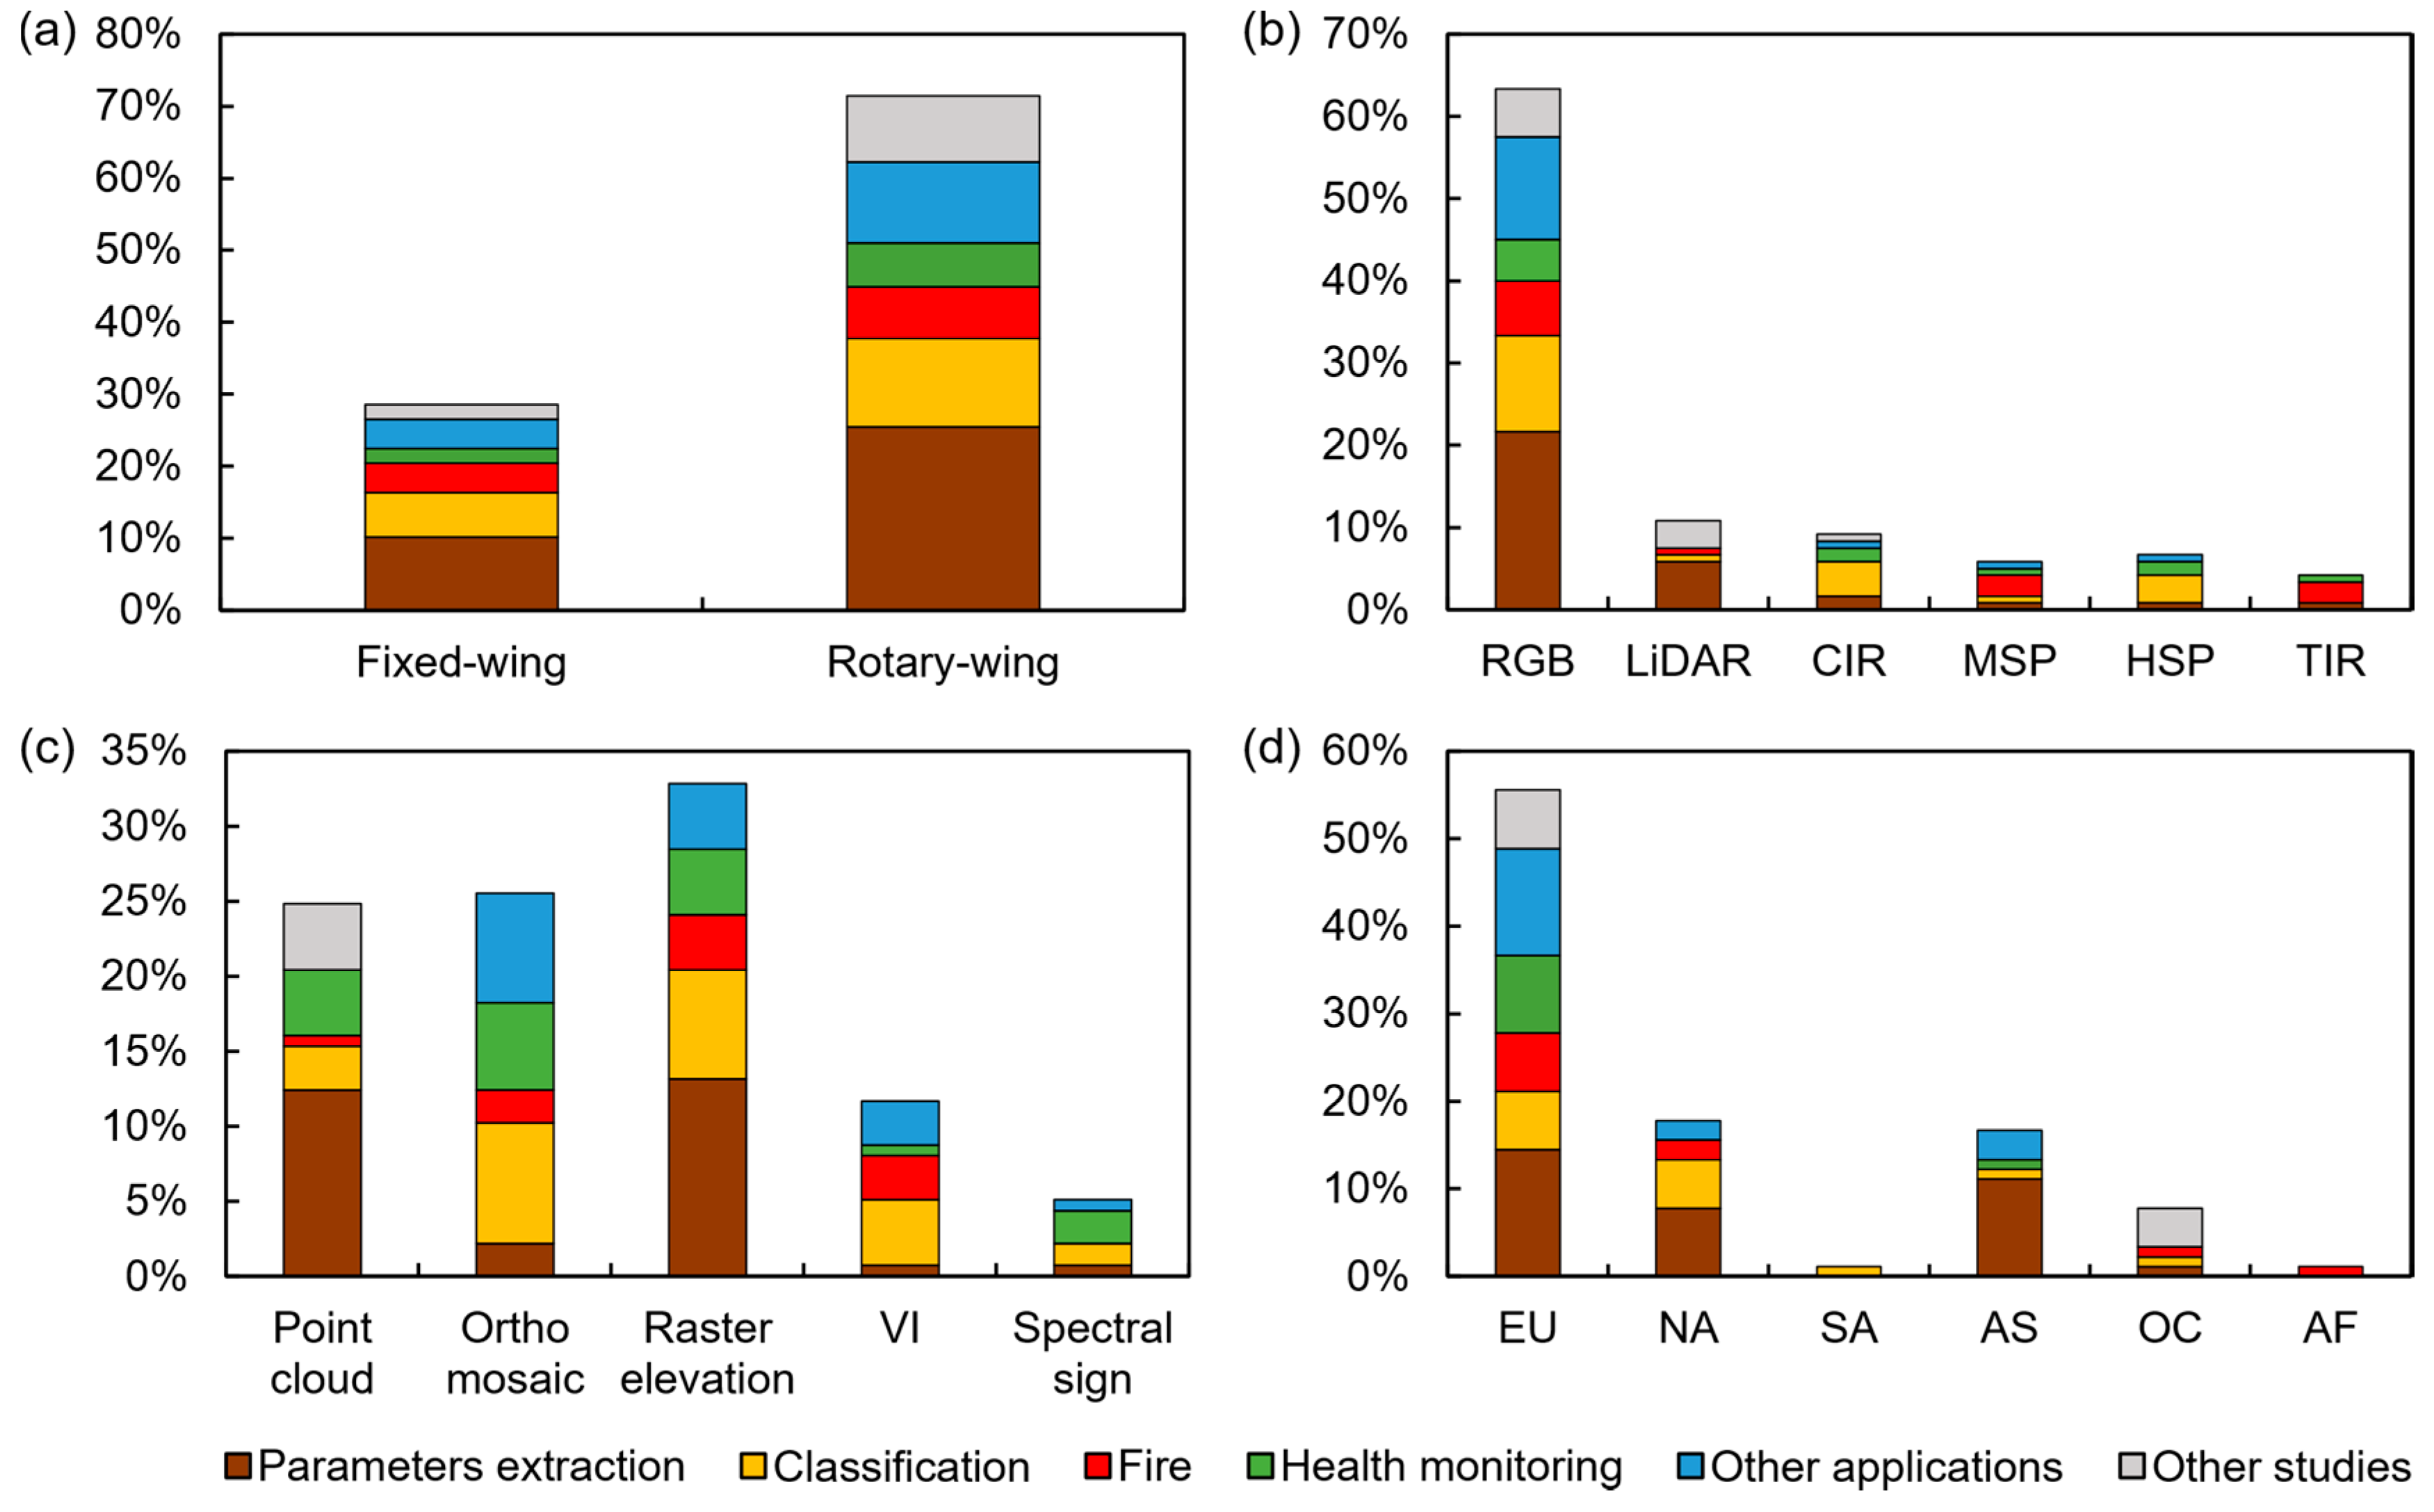
Apart from tree monitoring, the high spatial resolution and versatility of UAVs enable to make other forestry-related studies that were not possible, or at least the results would be much worse, if another remote sensing platform were used. These studies include: (1) forest canopy assessment (2) regeneration of forests (3) assessment of soil disturbances in post-harvest areas; (4) impacts of selective logging; and (5) tree stump detection, and rot assessment.
Forest canopy assessment is crucial in the characterization of forest ecosystems [7]. Several studies related to the estimation of canopy attributes were analysed, focusing on canopy cover, canopy gaps, leaf area index, foliage clumping and leaf angle distribution. Regarding canopy cover estimations, Li et al. [125] evaluated the use of UAV-based RGB imagery to determine understory and overstory vegetation cover. For this purpose, a method named back-projection of 3D point cloud onto superpixel-segmented image (BAPS) was developed for automatically estimating overstory crown cover and understory vegetation cover. BAPS accuracy was validated by comparison with CHMs, supervised classification (maximum likelihood) and using in-situ reference values, an RMSE of less than 0.12 was obtained showing the ability of BAPS method in the estimation of understory and overstory vegetation cover. Considering the estimation of canopy gaps, Getzin et al. [152,153] analysed forest gap information for ecological assessment of plant diversity in forests [152] and to monitor its patterns and to provide a spatial quantification [153], in temperate managed and unmanaged forests. For this purpose, a fixed-wing UAV equipped with an RGB sensor was used. In Getzin et al. [152], it was showed that aerial imagery of canopy gaps can be used to assess floristic biodiversity of the forest understory. More specifically, the spatial implicit information on gap shape metrics were enough to reveal a strong dependency between disturbance patterns and plant diversity (R2 up to 0.74). In Getzin et al. [153], the orthorectified imagery of the canopy gaps was delineated for further comparison. This study proved that UAVs can be used for mapping spatial dynamics of repeated canopy gap formation in a multi-temporal approach (yearly), relating gap patterns to forests spatio-temporal dynamics. Bagaram et al. [154], in turn, studied the relation between forest gaps and biodiversity features to explore the possibility of: (1) mapping forest canopy gaps from orthophoto mosaics using UAV-based RGB imagery, and (2) deriving patch metrics that can be tested as covariates of variables of interest for forest biodiversity monitoring. Considering the results obtained, canopy cover (75% smaller than 7 m2) can be estimated by UAV RGB imagery, using the red band and contrast split segmentation. Regarding correlation results, mixed forests (beech and turkey oak) obtained strongest correlations (adjusted R2 ranging from 0.52 to 0.87) followed by turkey oak forests with intermediate correlations, followed by the weakest correlations in beech forests. Strong correlations were also achieved in the same forest types were observed for forest habitat biodiversity variables (with adjusted R2 ranging from 0.52 to 0.79). Regarding leaf area index (LAI) estimation, Tian et al. [155] intended to supply the lack of forestry studies mapping LAI with UAV-based multispectral imagery. The study was conducted in a mangrove forest with variety of vegetation species using a UAV NDVI and compare them with WorldView-2 (WV2) NDVI (2 m spatial resolution. Three types of NDVIs were estimated, average NDVI, vegetated specific NDVI, and scaled NDVI. The highest accuracy for WV2 (R2 = 0.778, RMSE = 0.424) was achieved using the average NDVI, whereas the optimal accuracy for UAV (R2 = 0.817, RMSE = 0.423) was obtained using scaled NDVI. The application of UAV revealed a better performance in plots that were covered by homogeneous mangrove species, while WV2 obtained a higher accuracy than UAV in the plots covered with a variety of mangrove species. Chianucci et al. [7] estimated some forest canopy attributes such as: canopy cover, foliage clumping and LAI, using an UAV equipped with a RGB sensor, obtaining accurate measurements of canopy structure from the UAV digital photographs. Considering leaf angle distribution (LAD), which affects biophysical interaction between sunlight and forest canopies, McNeil et al. [156] used digital photographs from UAVs to measure LAD. The results showed that UAVs are able to measure LAD in virtually any broadleaf forest environment.
Several studies evidence the contribute of UAVs in the detection of forests regeneration. Feduck et al. [157] analysed the ability of UAV-based RGB imagery to detect coniferous seedlings in replanted forest-harvest areas, in leaf-off conditions, obtaining a detection rate of 75.8% (n = 149). In Puliti et al. [158], UAV data was used for modelling tree density and canopy height, in young boreal forests stands under regeneration. Considering an ABA, fitted random forest models using ground-truth data and the corresponding UAV data were used. Then, the models were validated at plot and stand level. The RMSE obtained at the stand-level, UAV data presented the smallest values for mean height (0.56 m) and tree density (1175 trees/ha), with the UAV-based data being 50% smaller than ALS data. UAVs showed the potential for the inventory of forest stands under regeneration, due to the high accuracy of data and the time saving compared to traditional field techniques. Imangholiloo et al. [127] investigated the use of UAV-based photogrammetric point clouds and hyperspectral imagery for characterizing seedling stands in leaf-off and leaf-on conditions by estimating tree density and height, in young seedling stands in the southern boreal forests of Finland. A CHM using an ALS DTM was created, then, watershed segmentation was used to delineate the tree canopy boundary at individual tree level, obtaining its height and spectral information. Moreover, several vegetation indices were calculated and used in species classification process, based a random forest model. Considering the plot level, the tree density and the mean tree height were estimated. Regarding the results, the tree density was underestimated by 17.5% and 20.2% in leaf-off and leaf-on conditions, respectively. The mean tree height was underestimated by 20.8% and 7.4% in leaf-off and leaf-on conditions, respectively. The results indicated that UAVs have the ability to characterize seedling stands and can be used to supplement or replace the in-field inventories. Automatic detection of conifer seedlings along recovering seismic lines in UAV-based imagery was addressed by Fromm et al. [126] using CNNs. Of the different implemented CNN architectures, the faster region-CNN (R-CNN) was highlighted with the best performance (mean average precision of 81%). Considering the results obtained, UAV imagery can be used to detect conifer seedlings in regenerating sites with high accuracy.
Considering studies related to soil disturbance assessment, Talbot et al. [159] presented an UAV-based approach for soil disturbance assessment after forest harvesting operations. For this purpose, a multi-rotor UAV equipped with an RGB sensor was used to perform flights in six different sites after forest harvesting, using a cut-to-length system. Photogrammetric processing was used to create orthophoto mosaics, which in turn, were used to delineate the wheel tracks and machine trails damage, per site (in three classes: light, moderate and severe). From the 33 ha analysed, 15% showed traces of vehicle traffic and 63% was categorized as light. Traffic intensity varied from 787 to 1256 m/ha (weighted mean of 956 m/ha). An overall weighted mean of 4.7% of the total area was compromised by severe rutting. A similar study was conducted by Pierzchała et al. [160], to estimate soil displacements after logging operations in steep slope terrain. Data was compared against a pre-harvest ALS-DTM. This way, UAVs can be used as a cost-effective alternative for post-harvest surveying, constituting a rapid assessment of the disturbance extent and erosion risk mapping in a wide range of sites. Nevalainen et al. [161] assessed the rut depth distribution and measurement of a logging site using photogrammetric point clouds form UAV-based RGB imagery. The proposed method can classify rut depths into two categories: insignificant depression and harmful rut depth. The Pearson correlation between rut depths manually measured and by UAV photogrammetry was r = 0.67 with 65% of accuracy in classifying deep ruts (depth of over 20 cm).
Ota et al. [162] assessed the impact of selective logging in tropical forests using a multi-rotor UAV equipped with a RGB sensor. Two 9 ha plots were surveyed. Acquired data was subjected to photogrammetric processing to compute the DSM and orthophoto mosaics. Flights were conducted before and after logging and DSMs from both epochs were subtracted. This study demonstrated the ability of UAVs to estimate changes in AGB in selective logging and can be applied for quantify impacts of legal and illegal logging in tropical forests.
Making use of the high spatial resolution of UAVs, Puliti et al. [163] used a multi-rotor UAV to acquire RGB imagery in a post-harvest site for tree-stump detection. This way, stumps were automatically detected, segmented, classified and measured. Photogrammetric processing of the acquired RGB imagery resulted into orthophoto mosaics and a DSM. The DSM was used to create a DTM based on the local minima filter, then both were subtracted to obtain the stump height model. Height values of non-discarded pixels were multiplied by the red bad of the orthophoto mosaic, then the area was divided into a100 m2 grid and the local maxima search was applied. A region growing procedure was implemented for tree-stump detection, followed by refinement at a single stump level. The authors assessed the possibility to detect root- and butt-rot on the stamps, using a machine learning approach based on a RF classifier. The accuracy obtained ranged from 68% to 80%, and in the detected stumps the root- and butt-rot was detected with 82.1% accuracy. Pixels with height lower than 2 cm or greater than 1 m were discarded.

4. Discussion

In this section it is intended to analyse previously mentioned studies to provide insights towards UAV type usage (fixed-wing or rotary-wing), the sensor type, the more significant outcomes, and the region where the studies where performed. Figure 3 presents the percentage of studies found in the literature regarding each of these parameters.
Regarding UAV type usage (Figure 3a) there is a clear prevalence of rotary-wing UAVs over fixed-wing UAVs, with a percentage of 71% and 29%, respectively. This fact can be related with different conditions related with availability and/or by their characteristics. Considering that rotary-wing UAVs are usually more affordable than fixed-wings, in fact some of the used UASs were commercially available of-the-shelf solutions with integrated sensing payloads. An example of such a UAV is presented in Figure 4c. Moreover, the requirement of a corridor needed for take-off and land operations from fixed-wing UAVs are challenging to find in some contexts, especially in forested areas where there can be a lack of such areas along with terrain topography. While, in turn, rotary-wing UAVs do not need as much space for such operations since they have the ability of VTOL, making mission planning with such UAVs easier, with a few square meters with no aerial obstacles being enough. Another aspect is the UAV payload capacity in which, usually, rotary-wing UAVs provide higher payload capacity. For instance, UAVs presented in Figure 4a and Figure 4c have a small payload capacity, being only able to carry small cameras. On the other hand, the UAVs shown in Figure 4b and Figure 4d support higher payloads such as hyperspectral and LiDAR sensors. However, the number of rotors and propeller size play a crucial role in payload capacity [12].
Considering sensing payloads (Figure 3b), there is a clear tendency in the usage of RGB sensors (63%), which were used in all reviewed areas. LiDAR sensors were the second most commonly used sensor (11%), being mostly used for forestry parameters extraction and in comparative studies. The preference for RGB sensor over LiDAR can be justified by the costs associated with both systems. It is clear that UAV-based RGB imagery is a cost-effective approach when compared to LiDAR [89,97]. The remaining sensing payloads were categorized into colour infrared (CIR), multispectral (MSP), hyperspectral (HSP) and thermal infrared (TIR) sensors. CIR sensors that are composed by modified RGB sensors, by removing the infrared filters, enable the acquisition of spectral data from NIR/RedEdge parts of the electromagnetic spectrum [10]. Around 9% of the reviewed studies used this type of sensor, especially for classification tasks. Multispectral sensors were considered as sensors used for spectral information acquisition at certain relatively narrow bands of the electromagnetic spectrum and were found in 6% of the reviewed studies. Hyperspectral sensors were used in 7% of the studies, and can provide a wider number of bands, usually covering the visible and NIR parts of the electromagnetic spectrum (400–1000 nm). Most hyperspectral sensors used in the reviewed studies were classified as push-broom or Fabry-Perot interferometer sensors—for more information towards hyperspectral imagery acquisition refer to [164]. TIR sensors enable to acquire thermal imagery and were the least sensing payload used, with only 4% usage.
Considering the products used for data analysis (Figure 3c), there is a clear usage of products containing height information (60%), rather than products based on spectral information. This shows the importance of height data from point cloud and raster data for forestry applications purposes. On the other hand, considering the products encompassing spectral information (orthophoto mosaics, vegetation indices and spectral information), 26% of the studies used orthophoto mosaics for data processing, while spectral information was present in 5% of the studies. Given the lower number of studies using UAV hyperspectral sensors, this was expected. Vegetation indices were used in 12% of the studies, especially for classification and post-fire related studies.
Considering the geographical area were the studies were conducted (Figure 3d), 56% were in Europe, followed by North America (18%), Asia (17%) and Oceania with 8%. Only four studies were conducted in South America and Africa, two in each region. Regarding the areas where those studies were focused, the studies conducted in the European continent were spread through all of them; studies conducted in North America were focused in parameters extraction and classification, while most of Asian studies focused in parameters extraction. Studies performed in Oceania were dedicated to selection of optimal data acquisition and processing parameters, and comparison of UAV-based photogrammetry with UAV LiDAR or ALS data. This general overview provided a context throughout the reviewed studies, and in the next sub-sections the specific applications presented in Section 3 are discussed.

4.1. Forest Structural Parameters Estimation

The estimation of forest parameters is crucial for forest management. Indeed, 37% of the reviewed studies were focused on this topic. Considering parameters estimation two approaches were observed, at the stand-level and at the tree-level (refer to Table 1 and Table 2 for more information about these studies). Considering only the stand-level studies, height metrics were the most used. The volumetric estimations were also an evaluated parameter since most of reviewed studies used point clouds for this purpose. The BA and AGB parameters were also widely estimated in these studies. Considering the tree-level studies, height metrics were clearly the most estimated parameters, followed by AGB and DBH. Height parameters were widely estimated, once it easily can be obtained using point cloud or raster data (CHM). On the other hand, AGB and DBH estimations are dependent of the allometric equations [85,88,91,95] and/or using regression [37,84,85,88,91,98,103,105,165], since these parameters cannot be directly estimated from UAV-based data.
Regarding the results obtained in these studies, UAV-based data provided good estimations with low error rates for height metrics when comparing to ground-truth data. However, it is important to distinguish the performance of the sensing payloads used in these studies. In both approaches (stand-level and tree-level), the RGB sensor was the most used, followed by LiDAR and, then, CIR sensors (Table 1 and Table 2). Considering the results from Cao et al. [84] (UAV-LiDAR R2 = 0.90; UAV-RGB R2 = 0.82) in the height metrics, it can be noted the higher accuracy obtained by the LiDAR sensor over the RGB sensor. Another comparative study was performed by Wallace et al. [101], which obtained better results using LiDAR (R2 = 0.84) than RGB (R2 = 0.68). Cao et al. [84] argued that UAV-RGB point clouds were limited to the upper canopy, lacking the ability to penetrate below the canopy as UAV-LiDAR point clouds. Wallace et al. [101], in turn, referred that LiDAR proved to be the best solution to estimate the vertical distribution of vegetation, once it better penetrates the upper canopy. The situation experienced by the authors could be related to the type of forest and species analysed. Cao et al. [84] inventoried poplar (broadleaved) species, characterized by their irregular tree crown and shape. In the study performed by Wallace et al. [101], the plot analysed consisted of Eucalyptus pulchella trees, varying in age and ranging in height from 4.7 m to 16.2 m, which complicates the acquisition of high-density point cloud data of the vertical distribution of vegetation.
Considering the other parameters estimated, at the stand-level studies, Sn, BA and DBH were mostly estimated with a good correlation. On the other hand, V parameter, in most studies were estimated with a strong correlation. Regarding the AGB parameter, studies presented good and strong correlations. According to the tree-level studies, the CD, DBH, V and AGB were mostly estimated with a strong correlation.

4.2. Tree Species Mapping and Classification

Tree species classification is an important step towards forestry inventory. However, in order to perform such a task using remotely sensed data, some challenges emerge, such as high data dimensionality, which makes the selection of the most relevant variables a time-consuming [166], error-prone and subjective task [167]. In the scope of this review, 20% of the studies performed tree classification varying the forest type and species. The most used outcome was orthophoto mosaics followed by CHMs/DSMs and VIs. Regarding sensing payloads RGB, CIR and Hyperspectral were the most used. These outcomes and sensors, contrasting with parameter estimation studies, such as LiDAR sensors and point clouds, had a lower usage rate.
Most of the studies concerning this topic focused on individual tree detection using different outcomes, then OBIA algorithms are applied [67,116,117,118,121,123,124], creating a set of clusters. Properties of these clusters were then used to create datasets with different extracted parameters. Those datasets were then used for classification, using different approaches (Table 3). By analysing the used methods, RF appears as the most frequently used method. Indeed, this ensemble classifier produces multiple decision trees, by using a random subset of training samples and variables, having the capacity to handle high data dimensionality and multicollinearity in a rapid manner and being insensitive to overfitting [167]. Moreover, the study performed by Nevalainen [71] compared different classifiers (k-NN, decision trees, naïve bayes, and RF). The best results were obtained by RF. Considering the overall accuracy of the reviewed studies, it depends on several factors, and is also related to the data source and acquisition parameters. Nevertheless, only one study relied on the usage of deep learning [122], revealing that this field is relatively unexplored in UAV remote sensing.

4.3. Forest Fire and Post-Fire Monitoring

Regarding fire scenarios, it is notorious that most of the studies focused in the post-fire forest rehabilitation. However, some points must be raised towards a real-time monitoring system, the most important being the complexity of such systems to cover big areas along with drawbacks on flight endurance due, which makes small-sized UAVs not suitable for such operations. On the other hand, large UAVs with higher payload capability can be used to monitor wildfires on a regional-scale. An example of such an approach is NASA’s Ikhana UAS [168]. However, the complementary usage of small-sized UAVs, as suggested by Hristov et al. [131], can reduce false positives, improving the management of field teams. Another aspect is that only one study was found covering wildfire prevention [49], which proved that the usage of UAV LiDAR data can be beneficial for mapping areas with higher fuel concentration. Once again, UAVs could be employed to assess the risk of forests when exposed to fire. Nevertheless, the importance of forest restauration and recovery in post-fire scenarios is important to improve/study its recovery and to measure fire severity, for taking measures in a quicker manner. Regarding this, sensing payloads TIR sensors proved to be useful for real-time fire monitoring, while multispectral shown potential in post-fire forest rehabilitation. As for the used outcomes, VIs, CHMs and orthophoto mosaics were the most used.

4.4. Forest Health Monitoring and Disease Detection

In the field of forest health monitoring and disease/pest detection there is a clear indication that rotary-wing UAVs are the most used, following the tendency of the previous discussed studies. In the reviewed studies only two employed fixed-wing UAVs [148,151]. From sensing payload stand of view, RGB sensors were the most used. Näsi et al. [140,149] used an hyperspectral sensor as main sensor with the addition of a RGB sensor, while Smigaj et al. [148] used a TIR sensor along with RGB and CIR sensors and Minařík and Langhammer [141] used a multispectral sensor. Wen et al. [151] aimed to detect pest infestations, more specifically rodent infestations. Minařík and Langhammer [141] assessed forest disturbances such as windstorms and bark beetle outbreaks. Smigaj et al. [148] proposed a system to detect Red Band Needle Blight infection levels caused by climate changes and its consequences such as the increase of pathogens. The remaining works [140,145,146,147,149,150] concentrated efforts to detect damage made by insects such as oak splendour beetle, bark beetle and pine processionary moth. The studies covered several tree species such as oak trees, Norway spruces, scots and lodgepole pine and several other pie trees.

4.5. Other Applications

Apart from forest applications with more incidence towards tree development and its status, other applications in forestry contexts were explored using UAVs for: forest canopy assessment (canopy cover [125], canopy gaps [152,153,154], LAI [7,155], foliage clumping [7] and leaf angle distribution [156]), regeneration of forests [126,127,157,158], assessment of soil disturbances in post-harvest areas [159,160,161], monitoring of logging operations [162] and tree-stump detection [163]. Most of the studies rely in the use of RGB sensors mounted on rotary-wing UAVs (apart from the multispectral sensor used in [155]), except for canopy gaps [152,153,154] in which a fixed-wing UAVs were used. Most of these studies were possible to be carried out due to the high spatial resolution provided by UAVs when comparing to other remote sensing platforms. The most used outcome was the orthophoto mosaic, followed by the CHM.

4.6. Data Acquisition and Processing Optimization and Comparison between LiDAR and Photogrammetry

The studies addressed throughout this review have shown that LiDAR and photogrammetry techniques are both feasible solutions for measuring and monitoring aspects of complex forest structures. However, there are several contrasts that should be analysed. Regarding the costs associated with both processes, it is clear that UAV-based photogrammetry is a cost-effective approach when compared to LiDAR [89,97]. Analysing CHM processing, it is possible to conclude that imaging technology can capture spectral information that could produce a more detailed representation of the upper canopy. However, this technology does not provide the same level of canopy penetration as LiDAR data, which contributes to deteriorate the level of information on vertical stratification of vegetation layers and the terrain points. In addition, due to the lack of information about ground terrain to generate accurate canopy height, usually it is necessary to use a DTM. In this point LiDAR is, effectively, better because of its ability to penetrate canopy gaps and to record returns from the ground [169]. However, photogrammetric techniques could achieve interesting results in areas of mixed forest, with small trees and small-sized crowns [170]. Considering the different studies and reflections about these approaches, both can generate point clouds, but, usually, LiDAR-based point clouds have less point density and no colour information, unlike point clouds generated from RGB imagery. Both have problems with transparent surfaces and water bodies. Comparing both technologies, the main deduction is that one is not better than the other, having their strengths and weaknesses. There is a trade-off that must be analysed between the needs, costs and the characteristics of the area to be surveyed when selecting which approach to use.
In order to illustrate the challenges experienced in some of the reviewed studies, a comparison of point clouds obtained with UAV LiDAR data and through photogrammetric processing of UAV-based RGB imagery is presented in Figure 5, showing three different scenarios: a profile near the limits of a tree plot (Figure 5a); a dense canopy plot (Figure 5b); and an overview of relatively sparse trees (Figure 5c). It is noticeable that the LiDAR-based point cloud provides a better representation of each single tree, as in the case of Figure 5a, in turn, the photogrammetric point cloud was able to provide points in the terrain and for some stems. As for the case of the dense canopy plot (Figure 5b), the LiDAR point cloud provided, once more, a better distribution of the points, while most of the points of the photogrammetric point cloud were located in the top of the canopy. In the case of the sparse vegetation (Figure 5c), the photogrammetric point cloud provided more points, while the LiDAR point cloud showed a lower number of points located in the canopy. This fact can be explained due to the smaller tree crown diameter in this area, in the case of the LiDAR point cloud, and, in the photogrammetry case, the high contrast between tree canopy and ground vegetation. In all cases a higher number of points form the photogrammetric point cloud was verified.
Since imagery quality is a function of the ambient light, photogrammetry techniques tend to perform poorly in low light conditions [108]. Texture homogeneity can cause possible lack of unique tie points in several images (e.g., shadowed, sandy, water or snow areas), complicating the post processing those areas. Figure 6a presents an overview of the DSMs obtained from both LiDAR and photogrammetry over the same area. Generally, it is possible that in the presence of dense canopies (Figure 6b,d), the photogrammetric DSM, does not provide many ground points as the LiDAR DSM and presents difficult into obtaining points in homogeneous and shadowed areas (Figure 6c,e).
This way, accurate DTMs can be challenging to achieve using photogrammetry due to the difficulty of penetrating into vegetated areas, such as dense vegetation canopies, providing lack of points in all images due to perspective occlusion. To overcome this limitation, some studies used pre-existent DTMs computed by ALS data [85,89,111,169]. Narrow objects such as tree logs and some branches are another issue since photogrammetry techniques perform rough approximations and then smoothing operations are usually applied for noise removal. On the other hand, LiDAR data is an expensive option, especially when surveying areas not occluded by vegetation. LiDAR itself does not provide any spectral information and, generally, has lower point density than photogrammetry techniques. Higher LiDAR costs are related to the need of high precision GNSS receivers and IMUs, while photogrammetry relies in post processing of the acquired imagery, which, in turn, common GNSS receivers and less advanced IMUs serve the needs of those techniques.

5. Conclusions

In this review a detailed analysis and overview of the potential benefits derived using UAVs in forest applications is presented. This review has shown that LiDAR and photogrammetry techniques are both feasible solutions for measuring and monitoring aspects of complex forest structures. To achieve this, recent studies were reviewed with the focus on UAV type, sensors, data processing and forestry applications. Therefore, it can be stated that this review provides professional foresters with information to assist them in choosing the most suitable UAS for their remote-sensing purposes.
This detailed review allowed to conclude that UAVs present several advantages when compared with traditional remote sensing platforms, like satellites and manned aircrafts. It is now possible to successfully overcome one of the main challenges in the application of remote sensing to forestry, which consists of collecting updated and timely data. It was also possible to provide a general context of the usage of UASs in forested environments, which can be used for multiple purposes ranging from forest structural parameters estimation to tree species classification and from forest health monitoring to fire and post-fire monitoring. Moreover, other studies were also reviewed, focusing in the optimization of UAV data acquisition parameters and comparison of UAV-based photogrammetric processing with ALS or UAV LiDAR data.
Regarding the sensing payload, RGB sensors are the most commonly used, mainly due to its affordable price and significance of results. LiDAR and CIR sensors are respectively the second and third most used sensors. Considering forestry parameters estimation, two main approaches were found in the literature: at the stand-level and at the tree-level. Generally, height metrics were the most used. Regarding the results from these studies, UAV-based data provided good estimations with low error rates for height metrics when comparing to ground-truth data. In fact, UAV-based data acquisition enables forest data acquisition quicker than ground-based inventories, at lower costs and with more detail than other remote sensing platforms.
Summing up, UAVs with the addressed sensors are going mainstream and its importance for decision support is becoming increasingly relevant for researchers and foresters, and related business professionals as innovative techniques are being developed for a sharpen optimization of the forestry underlying processes. However, and despite these promising results, some limitations can be identified. There is a lack of precise rule frameworks, which contributes to tedious requests for flight permissions [48]. Moreover, the stability of UAVs is a subject of concern, once it is dependent on the wind conditions in the survey location. One of the most severe limitations associated with the use of UAVs is related to the difficulty of fully covering forests on a large scale [171]. This constraint could be associated with national aviation regulations or, even, to the limitations in the payload capacity, which could be insufficient to cover all the surveyed area. For this reason, future improvements in hardware and battery technology are crucial, to increase flight endurance. However, future generations of UAVSs will continue to evolve and will be able to offer more autonomy and better, cheaper and more accurate sensors. Therefore, it is foreseeable that in the near future, forestry applications based on high resolution aerial images obtained by UAV will proliferate. This way, UAVs have the potential to play a vital role in sustainable forest management. Their flexibility associated with accurate and low-cost products will transform conventional forestry practices.

Author Contributions

Conceptualization, N.G, L.P. and J.J.S.; data curation, N.G., L.P.; formal analysis, N.G., L.P., P.M., N.S.; funding acquisition, E.P., and J.J.S.; investigation, N.G., L.P., and P.M.; methodology, N.G., L.P. and J.J.S.; project administration, E.P., and J.J.S.; resources, N.G., and J.J.S.; software, L.P., and N.G.; supervision, E.P., and J.J.S.; validation, L.P. and J.J.S.; visualization, N.G., and L.P.; writing—original draft, N.G., L.P., P.M., and N.S.; writing—review and editing, E.P., and J.J.S. All authors have read and agreed to the published version of the manuscript.

Funding

This work was partially financed by the European Regional Development Fund (ERDF) through the Operational Programme for Competitiveness and Internationalisation - COMPETE 2020 under the PORTUGAL 2020 Partnership Agreement, and through the Portuguese National Innovation Agency (ANI) as a part of project “REVEAL - Drones for supporting traffic accident evidence acquisition by Law Enforcement Agents” (Nº 33113). Financial support provided by the FCT-Portuguese Foundation for Science and Technology (PD/BD/150260/2019) to Pedro Marques, under the Doctoral Programme “Agricultural Production Chains – from fork to farm” (PD/00122/2012), to Luís Pádua (SFRH/BD/139702/2018) and to Nuno Silva (SFRH/BD/137968/2018/J567573bYgFF).

Acknowledgments

The authors are grateful to Aeromedia (https://aeromedia.es/) for providing the UAV-based LiDAR and RGB data used to produce all the figures referring LiDAR data.

Conflicts of Interest

The authors declare no conflict of interest. The funders had no role in the design of the study; in the collection, analyses, or interpretation of data; in the writing of the manuscript, or in the decision to publish the results.

Abbreviations

List of acronyms and abbreviations.
AcronymExpansionAcronymExpansion
ABAArea-Based ApproachkNNk-Nearest Neighbours
AGBAbove Ground BiomassLADLeaf Angle Distribution
ALSAirborne Laser ScanningLAILeaf Area Index
BABasal AreaLiDARLight Detection And Ranging
CARTClassification And Regression TreeMaxLMaximum Likelihood
CDCrown DiameterMLMachine Learning
CDCCanonical Discriminant ClassifierMLPMulti-Layer Perceptron
CFSCorrelation-based Feature SelectionMSIMoisture Stress Index
CHMCanopy Height ModelMSPmultispectral
CIRColour InfraredNBNaive Bayes
CNNConvolutional Neural NetworkNDRENormalized Difference Red Edge
DBHDiameter at Breast HeightNDVINormalized Difference Vegetation Index
DNDigital NumberNIRNear-Infrared
DSMDigital Surface ModelOBIAObject Based Image Analysis
DTDecision TreesRFRandom Forest
DTMDigital Terrain ModelRSRemote Sensing
FPIFabry-Pérot InterferometerSfMStructure from Motion
GISGeographical Information SystemsSnStem Number
GNSSGlobal Navigation Satellite SystemsSvStem Volume
HHeightSVMSupport Vector Machine
HdomDominant HeightTINTriangulated Irregular Networks
HICHierarchical Image ClassificationTIRThermal Infrared
HLLorey’s Mean HeightUASUnmanned Aircraft System
HMMaximum HeightUAVUnmanned Aerial Vehicle
HSPHyperspectralVVolume
IDWInverse Distance WeightingVSWVariable-Sized Window
INSInertial Navigation SystemVTOLVertically Take-Off and Landing
ITCIndividual Tree CrownWDWatershed Delineation

References

  1. Joseph, G. Fundamentals of Remote Sensing; Orient Blackswan Pvt. Ltd.: Hyderabad, Telangana, India, 2005; ISBN 978-81-7371-535-8. [Google Scholar]
  2. Roy, P.S.; Behera, M.D.; Srivastav, S.K. Satellite Remote Sensing: Sensors, Applications and Techniques. Proc. Natl. Acad. Sci. USA India Sect. A Phys. Sci. 2017, 87, 465–472. [Google Scholar] [CrossRef] [Green Version]
  3. Emery, W.; Camps, A. Introduction to Satellite Remote Sensing: Atmosphere, Ocean, Land and Cryosphere Applications; Elsevier: Amsterdam, The Netherlands, 2017; ISBN 978-0-12-809259-0. [Google Scholar]
  4. Barrett, F.; McRoberts, R.E.; Tomppo, E.; Cienciala, E.; Waser, L.T. A questionnaire-based review of the operational use of remotely sensed data by national forest inventories. Remote Sens. Environ. 2016, 174, 279–289. [Google Scholar] [CrossRef]
  5. Goodbody, T.R.H.; Coops, N.C.; White, J.C. Digital Aerial Photogrammetry for Updating Area-Based Forest Inventories: A Review of Opportunities, Challenges, and Future Directions. Curr. For. Rep. 2019, 5, 55–75. [Google Scholar] [CrossRef] [Green Version]
  6. Colomina, I.; Molina, P. Unmanned aerial systems for photogrammetry and remote sensing: A review. ISPRS J. Photogramm. Remote Sens. 2014, 92, 79–97. [Google Scholar] [CrossRef] [Green Version]
  7. Chianucci, F.; Disperati, L.; Guzzi, D.; Bianchini, D.; Nardino, V.; Lastri, C.; Rindinella, A.; Corona, P. Estimation of canopy attributes in beech forests using true colour digital images from a small fixed-wing UAV. Int. J. Appl. Earth Obs. Geoinf. 2016, 47, 60–68. [Google Scholar] [CrossRef] [Green Version]
  8. Gupta, S.G.; Ghonge, M.M.; Jawandhiya, D.P.M. Review of Unmanned Aircraft System (UAS). Int. J. Adv. Res. Comput. Eng. Technol. 2013, 2, 14. [Google Scholar] [CrossRef]
  9. Santamaria, E.; Barrado, C.; Pastor, E.; Royo, P.; Salami, E. Reconfigurable automated behavior for UAS applications. Aerosp. Sci. Technol. 2012, 23, 372–386. [Google Scholar] [CrossRef]
  10. Pádua, L.; Vanko, J.; Hruška, J.; Adão, T.; Sousa, J.J.; Peres, E.; Morais, R. UAS, sensors, and data processing in agroforestry: A review towards practical applications. Int. J. Remote Sens. 2017, 38, 2349–2391. [Google Scholar] [CrossRef]
  11. Toth, C.; Jóźków, G. Remote sensing platforms and sensors: A survey. ISPRS J. Photogramm. Remote Sens. 2016, 115, 22–36. [Google Scholar] [CrossRef]
  12. Anderson, K.; Gaston, K.J. Lightweight unmanned aerial vehicles will revolutionize spatial ecology. Front. Ecol. Environ. 2013, 11, 138–146. [Google Scholar] [CrossRef] [Green Version]
  13. Wallace, L.O.; Lucieer, A.; Turner, D.; Watson, C.S. Error assessment and mitigation for hyper-temporal UAV-borne LiDAR surveys of forest inventory. In Proceedings of the Silvilaser, Hobart, Australia, 16–19 October 2011. [Google Scholar]
  14. Wargo, C.A.; Church, G.C.; Glaneueski, J.; Strout, M. Unmanned Aircraft Systems (UAS) research and future analysis. In Proceedings of the 2014 IEEE Aerospace Conference, Big Sky, MT, USA, 1–8 March 2014; pp. 1–16. [Google Scholar]
  15. Shakhatreh, H.; Sawalmeh, A.; Al-Fuqaha, A.; Dou, Z.; Almaita, E.; Khalil, I.; Othman, N.S.; Khreishah, A.; Guizani, M. Unmanned Aerial Vehicles: A Survey on Civil Applications and Key Research Challenges. arXiv 2018, arXiv:1805.00881. [Google Scholar] [CrossRef]
  16. Dunford, R.; Michel, K.; Gagnage, M.; Piégay, H. Potential and constraints of Unmanned Aerial Vehicle technology for the characterization of Mediterranean riparian forest. Int. J. Remote Sens. 2009, 30, 4915–4935. [Google Scholar] [CrossRef]
  17. Torresan, C.; Berton, A.; Carotenuto, F.; Di Gennaro, S.F.; Gioli, B.; Matese, A.; Miglietta, F.; Vagnoli, C.; Zaldei, A.; Wallace, L. Forestry applications of UAVs in Europe: A review. Int. J. Remote Sens. 2017, 38, 2427–2447. [Google Scholar] [CrossRef]
  18. Koh, L.P.; Wich, S.A. Dawn of Drone Ecology: Low-Cost Autonomous Aerial Vehicles for Conservation. Trop. Conserv. Sci. 2012, 5, 121–132. [Google Scholar] [CrossRef] [Green Version]
  19. Zellweger, F.; Braunisch, V.; Baltensweiler, A.; Bollmann, K. Remotely sensed forest structural complexity predicts multi species occurrence at the landscape scale. For. Ecol. Manag. 2013, 307, 303–312. [Google Scholar] [CrossRef]
  20. Hill, A.; Breschan, J.; Mandallaz, D. Accuracy Assessment of Timber Volume Maps Using Forest Inventory Data and LiDAR Canopy Height Models. Forests 2014, 5, 2253–2275. [Google Scholar] [CrossRef] [Green Version]
  21. McElhinny, C.; Gibbons, P.; Brack, C.; Bauhus, J. Forest and woodland stand structural complexity: Its definition and measurement. For. Ecol. Manag. 2005, 218, 1–24. [Google Scholar] [CrossRef]
  22. Wallace, L.; Lucieer, A.; Watson, C.; Turner, D. Development of a UAV-LiDAR System with Application to Forest Inventory. Remote Sens. 2012, 4, 1519–1543. [Google Scholar] [CrossRef] [Green Version]
  23. Zheng, G.; Moskal, L.M. Retrieving Leaf Area Index (LAI) Using Remote Sensing: Theories, Methods and Sensors. Sensors 2009, 9, 2719–2745. [Google Scholar] [CrossRef] [Green Version]
  24. Turner, W.; Spector, S.; Gardiner, N.; Fladeland, M.; Sterling, E.; Steininger, M. Remote sensing for biodiversity science and conservation. Trends Ecol. Evol. 2003, 18, 306–314. [Google Scholar] [CrossRef]
  25. Mondello, C.; Hepner, G.; Williamson, R.A. 10-Year Industry Forecast: Phases I-III - Study Documentation. Photogramm. Eng. Remote Sens. 2004, 70, 5–58. [Google Scholar]
  26. Andersen, H.-E.; Mcgaughey, R.J.; Reutebuch, S.E. Assessing the influence of flight parameters, interferometric processing, slope and canopy density on the accuracy of X-band IFSAR-derived forest canopy height models. Int. J. Remote Sens. 2008, 29, 1495–1510. [Google Scholar] [CrossRef] [Green Version]
  27. Bergen, K.M.; Goetz, S.J.; Dubayah, R.O.; Henebry, G.M.; Hunsaker, C.T.; Imhoff, M.L.; Nelson, R.F.; Parker, G.G.; Radeloff, V.C. Remote sensing of vegetation 3-D structure for biodiversity and habitat: Review and implications for lidar and radar spaceborne missions. J. Geophys. Res. Biogeosciences 2009, 114. [Google Scholar] [CrossRef] [Green Version]
  28. Pilarska, M.; Ostrowski, W.; Bakuła, K.; Górski, K.; Kurczyński, Z. The potential of light laser scanners developed for unmanned aerial vehicles—The review and accuracy. ISPRS Int. Arch. Photogramm. Remote Sens. Spat. Inf. Sci. 2016, 42, 87–95. [Google Scholar] [CrossRef] [Green Version]
  29. Vazirabad, Y.F.; Karslioglu, M.O. Lidar for Biomass Estimation. In Biomass Detection, Production and Usage; InTech: Rijeka, Croatia, 2011. [Google Scholar]
  30. Gordon, S.; Lichti, D.; Franke, J.; Stewart, M. Measurement of Structural Deformation using Terrestrial Laser Scanners. In Proceedings of the 1st FIG International Symposium on Engineering Surveys for Construction Works and Structural Engineering, Nottingham, UK, 28 June–1 July 2004; p. 16. [Google Scholar]
  31. Almeida, D.R.A.; Stark, S.C.; Chazdon, R.; Nelson, B.W.; Cesar, R.G.; Meli, P.; Gorgens, E.B.; Duarte, M.M.; Valbuena, R.; Moreno, V.S.; et al. The effectiveness of lidar remote sensing for monitoring forest cover attributes and landscape restoration. For. Ecol. Manag. 2019, 438, 34–43. [Google Scholar] [CrossRef]
  32. Baltsavias, E.P. A comparison between photogrammetry and laser scanning. ISPRS J. Photogramm. Remote Sens. 1999, 54, 83–94. [Google Scholar] [CrossRef]
  33. Habib, A.; Ghanma, M.; Tait, M. Integration of LIDAR and photogrammetry for close range applications. Int. Arch. Photogramm. Remote Sens. Spat. Inf. Sci. 2004, 35, 1045–1050. [Google Scholar]
  34. James, M.R.; Robson, S. Straightforward reconstruction of 3D surfaces and topography with a camera: Accuracy and geoscience application. J. Geophys. Res. Earth Surf. 2012, 117. [Google Scholar] [CrossRef] [Green Version]
  35. Snavely, N.; Seitz, S.M.; Szeliski, R. Modeling the World from Internet Photo Collections. Int. J. Comput. Vis. 2008, 80, 189–210. [Google Scholar] [CrossRef] [Green Version]
  36. Fritz, A.; Kattenborn, T.; Koch, B. UAV-based photogrammetric point clouds—Tree stem mapping in open stands in comparison to terrestrial laser scanner point clouds. Int. Arch. Photogramm. Remote Sens. Spat. Inf. Sci. 2013, 40, 141–146. [Google Scholar] [CrossRef] [Green Version]
  37. Puliti, S.; Ørka, H.O.; Gobakken, T.; Næsset, E. Inventory of Small Forest Areas Using an Unmanned Aerial System. Remote Sens. 2015, 7, 9632–9654. [Google Scholar] [CrossRef] [Green Version]
  38. Rupnik, E.; Daakir, M.; Pierrot Deseilligny, M. MicMac—A free, open-source solution for photogrammetry. Open Geospat. Data Softw. Stand. 2017, 2, 14. [Google Scholar] [CrossRef]
  39. Dakota, B.; Fitzsimmons, S.; Toffanin, P. Open Drone Map. 2017. Available online: https://www.opendronemap.org/ (accessed on 10 October 2019).
  40. Hyyppa, J.; Kelle, O.; Lehikoinen, M.; Inkinen, M. A segmentation-based method to retrieve stem volume estimates from 3-D tree height models produced by laser scanners. IEEE Trans. Geosci. Remote Sens. 2001, 39, 969–975. [Google Scholar] [CrossRef]
  41. Wulder, M.A.; Hall, R.J.; Coops, N.C.; Franklin, S.E. High Spatial Resolution Remotely Sensed Data for Ecosystem Characterization. BioScience 2004, 54, 511–521. [Google Scholar] [CrossRef] [Green Version]
  42. Hyde, P.; Dubayah, R.; Walker, W.; Blair, J.B.; Hofton, M.; Hunsaker, C. Mapping forest structure for wildlife habitat analysis using multi-sensor (LiDAR, SAR/InSAR, ETM+, Quickbird) synergy. Remote Sens. Environ. 2006, 102, 63–73. [Google Scholar] [CrossRef]
  43. Van Leeuwen, M.; Nieuwenhuis, M. Retrieval of forest structural parameters using LiDAR remote sensing. Eur. J. For. Res. 2010, 129, 749–770. [Google Scholar] [CrossRef]
  44. Delaunay, B. Sur la sphere vide. Izv. Akad. Nauk SssrOtd. Mat. I Estestv. Nauk 1934, 7, 1–2. [Google Scholar]
  45. Shepard, D. A Two-dimensional Interpolation Function for Irregularly-spaced Data. In Proceedings of the 1968 23rd ACM National Conference, Las Vegas, NV, USA, 27–29 August 1968; ACM: New York, NY, USA, 1968; pp. 517–524. [Google Scholar]
  46. Fowler, R.J.; Little, J.J. Automatic Extraction of Irregular Network Digital Terrain Models. In Proceedings of the 6th Annual Conference on Computer Graphics and Interactive Techniques, Chicago, IL, USA, 8–10 August 1979; ACM: New York, NY, USA, 1979; pp. 199–207. [Google Scholar]
  47. Popescu, S.C.; Wynne, R.H.; Nelson, R.F. Measuring individual tree crown diameter with lidar and assessing its influence on estimating forest volume and biomass. Can. J. Remote Sens. 2003, 29, 564–577. [Google Scholar] [CrossRef]
  48. Nex, F.; Remondino, F. UAV for 3D mapping applications: A review. Appl. Geomat. 2014, 6, 1–15. [Google Scholar] [CrossRef]
  49. Fernández-Álvarez, M.; Armesto, J.; Picos, J. LiDAR-Based Wildfire Prevention in WUI: The Automatic Detection, Measurement and Evaluation of Forest Fuels. Forests 2019, 10, 148. [Google Scholar] [CrossRef] [Green Version]
  50. Mei, C.; Durrieu, S. Tree crown delineation from digital elevation models and high resolution imagery. Proc. Int. Arch. Photogramm. Remote Sens 2004, 36, 3–6. [Google Scholar]
  51. Ke, Y.; Quackenbush, L.J. Comparison of individual tree crown detection and delineation methods. In Proceedings of the 2008 ASPRS Annual Conference (American Society of Photogrammetry and Remote Sensing, Bethesda, Maryland), Portland, OR, USA, 28 April–2 May 2008; p. 11. [Google Scholar]
  52. Kaartinen, H.; Hyyppä, J.; Yu, X.; Vastaranta, M.; Hyyppä, H.; Kukko, A.; Holopainen, M.; Heipke, C.; Hirschmugl, M.; Morsdorf, F.; et al. An International Comparison of Individual Tree Detection and Extraction Using Airborne Laser Scanning. Remote Sens. 2012, 4, 950–974. [Google Scholar] [CrossRef] [Green Version]
  53. Vauhkonen, J.; Ene, L.; Gupta, S.; Heinzel, J.; Holmgren, J.; Pitkänen, J.; Solberg, S.; Wang, Y.; Weinacker, H.; Hauglin, K.M.; et al. Comparative testing of single-tree detection algorithms under different types of forest. Forestry 2012, 85, 27–40. [Google Scholar] [CrossRef] [Green Version]
  54. Ayrey, E.; Fraver, S.; Jr, J.A.K.; Kenefic, L.S.; Hayes, D.; Weiskittel, A.R.; Roth, B.E. Layer Stacking: A Novel Algorithm for Individual Forest Tree Segmentation from LiDAR Point Clouds. Can. J. Remote Sens. 2017, 43, 16–27. [Google Scholar] [CrossRef]
  55. Popescu, S.C.; Wynne, R.H.; Nelson, R.F. Estimating plot-level tree heights with lidar: Local filtering with a canopy-height based variable window size. Comput. Electron. Agric. 2002, 37, 71–95. [Google Scholar] [CrossRef]
  56. Duncanson, L.I.; Cook, B.D.; Hurtt, G.C.; Dubayah, R.O. An efficient, multi-layered crown delineation algorithm for mapping individual tree structure across multiple ecosystems. Remote Sens. Environ. 2014, 154, 378–386. [Google Scholar] [CrossRef]
  57. Chen, Q.; Baldocchi, D.; Gong, P.; Kelly, M. Isolating Individual Trees in a Savanna Woodland Using Small Footprint Lidar Data. Photogramm. Eng. Remote Sens. 2006, 72, 923–932. [Google Scholar] [CrossRef] [Green Version]
  58. Li, W.; Guo, Q.; Jakubowski, M.K.; Kelly, M. A new method for segmenting individual trees from the lidar point cloud. Photogramm. Eng. Remote Sens. 2012, 78, 75–84. [Google Scholar] [CrossRef] [Green Version]
  59. Nguyen, A.; Le, B. 3D point cloud segmentation: A survey. In Proceedings of the 2013 6th IEEE Conference on Robotics, Automation and Mechatronics (RAM), Manila, Philippines, 12–15 November 2013; pp. 225–230. [Google Scholar]
  60. Rouse, J.W., Jr.; Haas, R.H.; Schell, J.A.; Deering, D.W. Monitoring Vegetation Systems in The Great Plains with ERTS. In Proceedings of the Third Earth Resources Technology Satellite-1 Symposium, Washington, DC, USA, 10–14 December 1973; NASA: Greenbelt, MD, USA, 1974; Volume 1, pp. 309–317. [Google Scholar]
  61. Salamí, E.; Barrado, C.; Pastor, E. UAV Flight Experiments Applied to the Remote Sensing of Vegetated Areas. Remote Sens. 2014, 6, 11051–11081. [Google Scholar] [CrossRef] [Green Version]
  62. Castilla, G.; Hay, G.J. Image objects and geographic objects. In Object-Based Image Analysis: Spatial Concepts for Knowledge-Driven Remote Sensing Applications; ; Lecture Notes in Geoinformation and Cartography; Blaschke, T., Lang, S., Hay, G.J., Eds.; Springer: Berlin/Heidelberg, Germany, 2008; pp. 91–110. ISBN 978-3-540-77058-9. [Google Scholar]
  63. Blaschke, T. Object based image analysis for remote sensing. ISPRS J. Photogramm. Remote Sens. 2010, 65, 2–16. [Google Scholar] [CrossRef] [Green Version]
  64. Lang, S. Object-based image analysis for remote sensing applications: Modeling reality—Dealing with complexity. In Object-Based Image Analysis: Spatial Concepts for Knowledge-Driven Remote Sensing Applications; Lecture Notes in Geoinformation and Cartography; Blaschke, T., Lang, S., Hay, G.J., Eds.; Springer: Berlin/Heidelberg, Germany, 2008; pp. 3–27. ISBN 978-3-540-77058-9. [Google Scholar]
  65. Gini, R.; Passoni, D.; Pinto, L.; Sona, G. Use of Unmanned Aerial Systems for multispectral survey and tree classification: A test in a park area of northern Italy. Eur. J. Remote Sens. 2014, 47, 251–269. [Google Scholar] [CrossRef]
  66. Lisein, J.; Michez, A.; Claessens, H.; Lejeune, P. Discrimination of Deciduous Tree Species from Time Series of Unmanned Aerial System Imagery. PLoS ONE 2015, 10, e0141006. [Google Scholar] [CrossRef] [PubMed]
  67. Michez, A.; Piégay, H.; Lisein, J.; Claessens, H.; Lejeune, P. Classification of riparian forest species and health condition using multi-temporal and hyperspatial imagery from unmanned aerial system. Environ. Monit. Assess. 2016, 188, 146. [Google Scholar] [CrossRef] [PubMed] [Green Version]
  68. Zarco-Tejada, P.J.; González-Dugo, V.; Berni, J.A.J. Fluorescence, temperature and narrow-band indices acquired from a UAV platform for water stress detection using a micro-hyperspectral imager and a thermal camera. Remote Sens. Environ. 2012, 117, 322–337. [Google Scholar] [CrossRef]
  69. Lucieer, A.; Malenovský, Z.; Veness, T.; Wallace, L. HyperUAS—Imaging Spectroscopy from a Multirotor Unmanned Aircraft System. J. Field Robot. 2014, 31, 571–590. [Google Scholar] [CrossRef] [Green Version]
  70. Suomalainen, J.; Anders, N.; Iqbal, S.; Roerink, G.; Franke, J.; Wenting, P.; Hünniger, D.; Bartholomeus, H.; Becker, R.; Kooistra, L. A Lightweight Hyperspectral Mapping System and Photogrammetric Processing Chain for Unmanned Aerial Vehicles. Remote Sens. 2014, 6, 11013–11030. [Google Scholar] [CrossRef] [Green Version]
  71. Nevalainen, O.; Honkavaara, E.; Tuominen, S.; Viljanen, N.; Hakala, T.; Yu, X.; Hyyppä, J.; Saari, H.; Pölönen, I.; Imai, N.N.; et al. Individual Tree Detection and Classification with UAV-Based Photogrammetric Point Clouds and Hyperspectral Imaging. Remote Sens. 2017, 9, 185. [Google Scholar] [CrossRef] [Green Version]
  72. Singh, A.; Ganapathysubramanian, B.; Singh, A.K.; Sarkar, S. Machine Learning for High-Throughput Stress Phenotyping in Plants. Trends Plant Sci. 2016, 21, 110–124. [Google Scholar] [CrossRef] [Green Version]
  73. Li, M.; Im, J.; Beier, C. Machine learning approaches for forest classification and change analysis using multi-temporal Landsat TM images over Huntington Wildlife Forest. GIScience Remote Sens. 2013, 50, 361–384. [Google Scholar] [CrossRef]
  74. Shang, X.; Chisholm, L.A. Classification of Australian Native Forest Species Using Hyperspectral Remote Sensing and Machine-Learning Classification Algorithms. IEEE J. Sel. Top. Appl. Earth Obs. Remote Sens. 2014, 7, 2481–2489. [Google Scholar] [CrossRef]
  75. Tang, L.; Shao, G. Drone remote sensing for forestry research and practices. J. For. Res. 2015, 26, 791–797. [Google Scholar] [CrossRef]
  76. Banu, T.P.; Borlea, G.F.; Banu, C. The Use of Drones in Forestry. J. Environ. Sci. Eng. B 2016, 5, 557–562. [Google Scholar]
  77. Ambrosia, V.G.; Wegener, S.S.; Sullivan, D.V.; Buechel, S.W.; Dunagan, S.E.; Brass, J.A.; Stoneburner, J.; Schoenung, S.M. Demonstrating UAV-Acquired Real-Time Thermal Data over Fires. Photogramm. Eng. Remote Sens. 2003, 69, 391–402. [Google Scholar] [CrossRef]
  78. Panagiotidis, D.; Abdollahnejad, A.; Surový, P.; Chiteculo, V. Determining tree height and crown diameter from high-resolution UAV imagery. Int. J. Remote Sens. 2017, 38, 2392–2410. [Google Scholar] [CrossRef]
  79. Pádua, L.; Marques, P.; Adáo, T.; Hruška, J.; Peres, E.; Morais, R.; Sousa, A.; Sousa, J.J. UAS-based Imagery and Photogrammetric Processing for Tree Height and Crown Diameter Extraction. In Proceedings of the International Conference on Geoinformatics and Data Analysis, Prague, Czech Republic, 20–22 April 2018; ACM: New York, NY, USA, 2018; pp. 87–91. [Google Scholar]
  80. Köhl, M. New Approaches for Multi Resource Forest Inventories. In Advances in Forest Inventory for Sustainable Forest Management and Biodiversity Monitoring; Forestry Sciences; Corona, P., Köhl, M., Marchetti, M., Eds.; Springer: Dordrecht, The Netherlands, 2003; pp. 1–16. ISBN 978-94-017-0649-0. [Google Scholar]
  81. Bergseng, E.; Ørka, H.O.; Næsset, E.; Gobakken, T. Assessing forest inventory information obtained from different inventory approaches and remote sensing data sources. Ann. For. Sci. 2015, 72, 33–45. [Google Scholar] [CrossRef] [Green Version]
  82. Yu, X.; Hyyppä, J.; Holopainen, M.; Vastaranta, M. Comparison of Area-Based and Individual Tree-Based Methods for Predicting Plot-Level Forest Attributes. Remote Sens. 2010, 2, 1481–1495. [Google Scholar] [CrossRef] [Green Version]
  83. Breidenbach, J.; Astrup, R. The Semi-Individual Tree Crown Approach. In Forestry Applications of Airborne Laser Scanning: Concepts and Case Studies; Managing Forest Ecosystems; Maltamo, M., Næsset, E., Vauhkonen, J., Eds.; Springer: Dordrecht, The Netherlands, 2014; pp. 113–133. ISBN 978-94-017-8663-8. [Google Scholar]
  84. Cao, L.; Liu, H.; Fu, X.; Zhang, Z.; Shen, X.; Ruan, H. Comparison of UAV LiDAR and Digital Aerial Photogrammetry Point Clouds for Estimating Forest Structural Attributes in Subtropical Planted Forests. Forests 2019, 10, 145. [Google Scholar] [CrossRef] [Green Version]
  85. Ota, T.; Ogawa, M.; Mizoue, N.; Fukumoto, K.; Yoshida, S. Forest Structure Estimation from a UAV-Based Photogrammetric Point Cloud in Managed Temperate Coniferous Forests. Forests 2017, 8, 343. [Google Scholar] [CrossRef]
  86. Guo, Q.; Su, Y.; Hu, T.; Zhao, X.; Wu, F.; Li, Y.; Liu, J.; Chen, L.; Xu, G.; Lin, G.; et al. An integrated UAV-borne lidar system for 3D habitat mapping in three forest ecosystems across China. Int. J. Remote Sens. 2017, 38, 2954–2972. [Google Scholar] [CrossRef]
  87. Gobakken, T.; Næsset, E. Estimation of diameter and basal area distributions in coniferous forest by means of airborne laser scanner data. Scand. J. For. Res. 2004, 19, 529–542. [Google Scholar] [CrossRef]
  88. Giannetti, F.; Chirici, G.; Gobakken, T.; Næsset, E.; Travaglini, D.; Puliti, S. A new approach with DTM-independent metrics for forest growing stock prediction using UAV photogrammetric data. Remote Sens. Environ. 2018, 213, 195–205. [Google Scholar] [CrossRef]
  89. Chen, S.; McDermid, G.J.; Castilla, G.; Linke, J. Measuring Vegetation Height in Linear Disturbances in the Boreal Forest with UAV Photogrammetry. Remote Sens. 2017, 9, 1257. [Google Scholar] [CrossRef] [Green Version]
  90. Goodbody, T.R.H.; Coops, N.C.; Tompalski, P.; Crawford, P.; Day, K.J.K. Updating residual stem volume estimates using ALS- and UAV-acquired stereo-photogrammetric point clouds. Int. J. Remote Sens. 2017, 38, 2938–2953. [Google Scholar] [CrossRef]
  91. Alonzo, M.; Andersen, H.-E.; Morton, D.C.; Cook, B.D. Quantifying Boreal Forest Structure and Composition Using UAV Structure from Motion. Forests 2018, 9, 119. [Google Scholar] [CrossRef] [Green Version]
  92. Jayathunga, S.; Owari, T.; Tsuyuki, S. The use of fixed–wing UAV photogrammetry with LiDAR DTM to estimate merchantable volume and carbon stock in living biomass over a mixed conifer–broadleaf forest. Int. J. Appl. Earth Obs. Geoinf. 2018, 73, 767–777. [Google Scholar] [CrossRef]
  93. Ni, W.; Liu, J.; Zhang, Z.; Sun, G.; Yang, A. Evaluation of UAV-based forest inventory system compared with LiDAR data. In Proceedings of the 2015 IEEE International Geoscience and Remote Sensing Symposium (IGARSS), Milan, Italy, 26–31 July 2015; pp. 3874–3877. [Google Scholar]
  94. Guerra-Hernández, J.; Gonzalez-Ferreiro, E.; Sarmento, A.; Silva, J.; Nunes, A.; Correia, A.C.; Fontes, L.; Tomé, M.; Diaz-Varela, R. Using high resolution UAV imagery to estimate tree variables in Pinus pinea plantation in Portugal. For. Syst. 2016, 25, 9. [Google Scholar] [CrossRef] [Green Version]
  95. Guerra-Hernández, J.; González-Ferreiro, E.; Monleón, V.J.; Faias, S.P.; Tomé, M.; Díaz-Varela, R.A. Use of Multi-Temporal UAV-Derived Imagery for Estimating Individual Tree Growth in Pinus pinea Stands. Forests 2017, 8, 300. [Google Scholar] [CrossRef]
  96. Lin, J.; Wang, M.; Ma, M.; Lin, Y. Aboveground Tree Biomass Estimation of Sparse Subalpine Coniferous Forest with UAV Oblique Photography. Remote Sens. 2018, 10, 1849. [Google Scholar] [CrossRef] [Green Version]
  97. Guerra-Hernández, J.; Cosenza, D.N.; Rodriguez, L.C.E.; Silva, M.; Tomé, M.; Díaz-Varela, R.A.; González-Ferreiro, E. Comparison of ALS- and UAV(SfM)-derived high-density point clouds for individual tree detection in Eucalyptus plantations. Int. J. Remote Sens. 2018, 39, 5211–5235. [Google Scholar] [CrossRef]
  98. Jaakkola, A.; Hyyppä, J.; Yu, X.; Kukko, A.; Kaartinen, H.; Liang, X.; Hyyppä, H.; Wang, Y. Autonomous Collection of Forest Field Reference—The Outlook and a First Step with UAV Laser Scanning. Remote Sens. 2017, 9, 785. [Google Scholar] [CrossRef] [Green Version]
  99. Yin, D.; Wang, L. Individual mangrove tree measurement using UAV-based LiDAR data: Possibilities and challenges. Remote Sens. Environ. 2019, 223, 34–49. [Google Scholar] [CrossRef]
  100. Sankey, T.; Donager, J.; McVay, J.; Sankey, J.B. UAV lidar and hyperspectral fusion for forest monitoring in the southwestern USA. Remote Sens. Environ. 2017, 195, 30–43. [Google Scholar] [CrossRef]
  101. Wallace, L.; Lucieer, A.; Malenovský, Z.; Turner, D.; Vopěnka, P. Assessment of Forest Structure Using Two UAV Techniques: A Comparison of Airborne Laser Scanning and Structure from Motion (SfM) Point Clouds. Forests 2016, 7, 62. [Google Scholar] [CrossRef] [Green Version]
  102. Carr, J.C.; Slyder, J.B. Individual tree segmentation from a leaf-off photogrammetric point cloud. Int. J. Remote Sens. 2018, 39, 5195–5210. [Google Scholar] [CrossRef]
  103. Iizuka, K.; Yonehara, T.; Itoh, M.; Kosugi, Y. Estimating Tree Height and Diameter at Breast Height (DBH) from Digital Surface Models and Orthophotos Obtained with an Unmanned Aerial System for a Japanese Cypress (Chamaecyparis obtusa) Forest. Remote Sens. 2018, 10, 13. [Google Scholar] [CrossRef] [Green Version]
  104. Chisholm, R.A.; Cui, J.; Lum, S.K.Y.; Chen, B.M. UAV LiDAR for below-canopy forest surveys. J. Unmanned Veh. Syst. 2013, 1, 61–68. [Google Scholar] [CrossRef] [Green Version]
  105. Abdollahnejad, A.; Panagiotidis, D.; Surový, P. Estimation and Extrapolation of Tree Parameters Using Spectral Correlation between UAV and Pléiades Data. Forests 2018, 9, 85. [Google Scholar] [CrossRef] [Green Version]
  106. Otero, V.; Van De Kerchove, R.; Satyanarayana, B.; Martínez-Espinosa, C.; Fisol, M.A.B.; Ibrahim, M.R.B.; Sulong, I.; Mohd-Lokman, H.; Lucas, R.; Dahdouh-Guebas, F. Managing mangrove forests from the sky: Forest inventory using field data and Unmanned Aerial Vehicle (UAV) imagery in the Matang Mangrove Forest Reserve, peninsular Malaysia. For. Ecol. Manag. 2018, 411, 35–45. [Google Scholar] [CrossRef]
  107. Surový, P.; Ribeiro, N.A.; Panagiotidis, D. Estimation of positions and heights from UAV-sensed imagery in tree plantations in agrosilvopastoral systems. Int. J. Remote Sens. 2018, 39, 4786–4800. [Google Scholar] [CrossRef]
  108. Dandois, J.P.; Olano, M.; Ellis, E.C. Optimal Altitude, Overlap, and Weather Conditions for Computer Vision UAV Estimates of Forest Structure. Remote Sens. 2015, 7, 13895–13920. [Google Scholar] [CrossRef] [Green Version]
  109. Pádua, L.; Guimarães, N.; Adão, T.; Marques, P. Classification of an Agrosilvopastoral System Using RGB Imagery from an Unmanned Aerial Vehicle. In Proceedings of the EPIA Conference on Artificial Intelligence. EPIA 2019, Vila Real, Portugal, 3–6 September 2019; Moura Oliveira, P., Novais, P., Reis, L., Eds.; Springer: Cham, Switzerland, 2019. [Google Scholar]
  110. Goodbody, T.R.H.; Coops, N.C.; Hermosilla, T.; Tompalski, P.; Crawford, P. Assessing the status of forest regeneration using digital aerial photogrammetry and unmanned aerial systems. Int. J. Remote Sens. 2018, 39, 5246–5264. [Google Scholar] [CrossRef]
  111. Röder, M.; Latifi, H.; Hill, S.; Wild, J.; Svoboda, M.; Brůna, J.; Macek, M.; Nováková, M.H.; Gülch, E.; Heurich, M. Application of optical unmanned aerial vehicle-based imagery for the inventory of natural regeneration and standing deadwood in post-disturbed spruce forests. Int. J. Remote Sens. 2018, 39, 5288–5309. [Google Scholar] [CrossRef]
  112. Tucker, C.J. Red and photographic infrared linear combinations for monitoring vegetation. Remote Sens. Environ. 1979, 8, 127–150. [Google Scholar] [CrossRef] [Green Version]
  113. Gitelson, A.A.; Kaufman, Y.J.; Stark, R.; Rundquist, D. Novel algorithms for remote estimation of vegetation fraction. Remote Sens. Environ. 2002, 80, 76–87. [Google Scholar] [CrossRef] [Green Version]
  114. Louhaichi, M.; Borman, M.M.; Johnson, D.E. Spatially Located Platform and Aerial Photography for Documentation of Grazing Impacts on Wheat. Geocarto Int. 2001, 16, 65–70. [Google Scholar] [CrossRef]
  115. De Sá, N.C.; Castro, P.; Carvalho, S.; Marchante, E.; López-Núñez, F.A.; Marchante, H. Mapping the Flowering of an Invasive Plant Using Unmanned Aerial Vehicles: Is There Potential for Biocontrol Monitoring? Front. Plant Sci. 2018, 9, 293. [Google Scholar] [CrossRef] [PubMed] [Green Version]
  116. Franklin, S.E.; Ahmed, O.S. Deciduous tree species classification using object-based analysis and machine learning with unmanned aerial vehicle multispectral data. Int. J. Remote Sens. 2018, 39, 5236–5245. [Google Scholar] [CrossRef]
  117. Melville, B.; Lucieer, A.; Aryal, J. Classification of Lowland Native Grassland Communities Using Hyperspectral Unmanned Aircraft System (UAS) Imagery in the Tasmanian Midlands. Drones 2019, 3, 5. [Google Scholar] [CrossRef] [Green Version]
  118. Cao, J.; Leng, W.; Liu, K.; Liu, L.; He, Z.; Zhu, Y. Object-Based Mangrove Species Classification Using Unmanned Aerial Vehicle Hyperspectral Images and Digital Surface Models. Remote Sens. 2018, 10, 89. [Google Scholar] [CrossRef] [Green Version]
  119. Gini, R.; Passoni, D.; Pinto, L.; Sona, G. Aerial images from an UAV system: 3D modeling and tree species classification in a park area. ISPRS—Int. Arch. Photogramm. Remote Sens. Spat. Inf. Sci. 2012, 39, 361–366. [Google Scholar] [CrossRef] [Green Version]
  120. Sankey, T.T.; McVay, J.; Swetnam, T.L.; McClaran, M.P.; Heilman, P.; Nichols, M. UAV hyperspectral and lidar data and their fusion for arid and semi-arid land vegetation monitoring. Remote Sens. Ecol. Conserv. 2018, 4, 20–33. [Google Scholar] [CrossRef]
  121. Laliberte, A.S.; Herrick, J.E.; Rango, A.; Winters, C. Acquisition, orthorectification, and object-based classification of unmanned aerial vehicle (UAV) imagery for rangeland monitoring. Photogramm. Eng. Remote Sens. 2010, 76, 661–672. [Google Scholar] [CrossRef]
  122. Morales, G.; Kemper, G.; Sevillano, G.; Arteaga, D.; Ortega, I.; Telles, J. Automatic Segmentation of Mauritia flexuosa in Unmanned Aerial Vehicle (UAV) Imagery Using Deep Learning. Forests 2018, 9, 736. [Google Scholar] [CrossRef] [Green Version]
  123. Fraser, B.T.; Congalton, R.G. Evaluating the Effectiveness of Unmanned Aerial Systems (UAS) for Collecting Thematic Map Accuracy Assessment Reference Data in New England Forests. Forests 2019, 10, 24. [Google Scholar] [CrossRef] [Green Version]
  124. Brovkina, O.; Cienciala, E.; Surový, P.; Janata, P. Unmanned aerial vehicles (UAV) for assessment of qualitative classification of Norway spruce in temperate forest stands. Geo-Spat. Inf. Sci. 2018, 21, 12–20. [Google Scholar] [CrossRef] [Green Version]
  125. Li, L.; Chen, J.; Mu, X.; Li, W.; Yan, G.; Xie, D.; Zhang, W. Quantifying Understory and Overstory Vegetation Cover Using UAV-Based RGB Imagery in Forest Plantation. Remote Sens. 2020, 12, 298. [Google Scholar] [CrossRef] [Green Version]
  126. Fromm, M.; Schubert, M.; Castilla, G.; Linke, J.; McDermid, G. Automated Detection of Conifer Seedlings in Drone Imagery Using Convolutional Neural Networks. Remote Sens. 2019, 11, 2585. [Google Scholar] [CrossRef] [Green Version]
  127. Imangholiloo, M.; Saarinen, N.; Markelin, L.; Rosnell, T.; Näsi, R.; Hakala, T.; Honkavaara, E.; Holopainen, M.; Hyyppä, J.; Vastaranta, M. Characterizing Seedling Stands Using Leaf-Off and Leaf-On Photogrammetric Point Clouds and Hyperspectral Imagery Acquired from Unmanned Aerial Vehicle. Forests 2019, 10, 415. [Google Scholar] [CrossRef] [Green Version]
  128. Shin, J.; Seo, W.; Kim, T.; Park, J.; Woo, C. Using UAV Multispectral Images for Classification of Forest Burn Severity—A Case Study of the 2019 Gangneung Forest Fire. Forests 2019, 10, 1025. [Google Scholar] [CrossRef] [Green Version]
  129. Martínez-de Dios, J.R.; Merino, L.; Caballero, F.; Ollero, A. Automatic forest-fire measuring using ground stations and Unmanned Aerial Systems. Sensors 2011, 11, 6328–6353. [Google Scholar] [CrossRef] [Green Version]
  130. Merino, L.; Caballero, F.; Martínez-de-Dios, J.R.; Maza, I.; Ollero, A. An Unmanned Aircraft System for Automatic Forest Fire Monitoring and Measurement. J. Intell. Robot. Syst. 2012, 65, 533–548. [Google Scholar] [CrossRef]
  131. Hristov, G.; Raychev, J.; Kinaneva, D.; Zahariev, P. Emerging Methods for Early Detection of Forest Fires Using Unmanned Aerial Vehicles and Lorawan Sensor Networks. In Proceedings of the 2018 28th EAEEIE Annual Conference (EAEEIE), Reykjavik, Iceland, 26–28 September 2018; pp. 1–9. [Google Scholar]
  132. McKenna, P.; Erskine, P.D.; Lechner, A.M.; Phinn, S. Measuring fire severity using UAV imagery in semi-arid central Queensland, Australia. Int. J. Remote Sens. 2017, 38, 4244–4264. [Google Scholar] [CrossRef]
  133. Aicardi, I.; Garbarino, M.; Lingua, A.; Lingua, E.; Marzano, R.; Piras, M. Monitoring Post-Fire Forest Recovery Using Multitemporal Digital Surface Models Generated from Different Platforms. Earsel Eproceedings 2016, 15, 1–8. [Google Scholar]
  134. White, R.A.; Bomber, M.; Hupy, J.P.; Shortridge, A. UAS-GEOBIA Approach to Sapling Identification in Jack Pine Barrens after Fire. Drones 2018, 2, 40. [Google Scholar] [CrossRef] [Green Version]
  135. Larrinaga, A.R.; Brotons, L. Greenness Indices from a Low-Cost UAV Imagery as Tools for Monitoring Post-Fire Forest Recovery. Drones 2019, 3, 6. [Google Scholar] [CrossRef] [Green Version]
  136. Fernández-Guisuraga, J.M.; Sanz-Ablanedo, E.; Suárez-Seoane, S.; Calvo, L. Using Unmanned Aerial Vehicles in Postfire Vegetation Survey Campaigns through Large and Heterogeneous Areas: Opportunities and Challenges. Sensors 2018, 18, 586. [Google Scholar] [CrossRef] [Green Version]
  137. Mayr, M.J.; Malß, S.; Ofner, E.; Samimi, C. Disturbance feedbacks on the height of woody vegetation in a savannah: A multi-plot assessment using an unmanned aerial vehicle (UAV). Int. J. Remote Sens. 2018, 39, 4761–4785. [Google Scholar] [CrossRef]
  138. Shin, P.; Sankey, T.; Moore, M.M.; Thode, A.E. Evaluating Unmanned Aerial Vehicle Images for Estimating Forest Canopy Fuels in a Ponderosa Pine Stand. Remote Sens. 2018, 10, 1266. [Google Scholar] [CrossRef] [Green Version]
  139. Dash, J.; Pearse, G.; Watt, M. UAV Multispectral Imagery Can Complement Satellite Data for Monitoring Forest Health. Remote Sens. 2018, 10, 1216. [Google Scholar] [CrossRef] [Green Version]
  140. Näsi, R.; Honkavaara, E.; Lyytikäinen-Saarenmaa, P.; Blomqvist, M.; Litkey, P.; Hakala, T.; Viljanen, N.; Kantola, T.; Tanhuanpää, T.; Holopainen, M. Using UAV-Based Photogrammetry and Hyperspectral Imaging for Mapping Bark Beetle Damage at Tree-Level. Remote Sens. 2015, 7, 15467–15493. [Google Scholar] [CrossRef] [Green Version]
  141. Minařík, R.; Langhammer, J. Use of a multispectral UAV photogrammetry for detection and tracking of forest disturbance dynamics. Int. Arch. Photogramm. Remote Sens. Spat. Inf. Sci. 2016, 41. [Google Scholar] [CrossRef]
  142. Barnes, E.; Clarke, T.; Richards, S.; Colaizzi, P.; Haberland, J.; Kostrzewski, M.; Waller, P.; Choi, C.; Riley, E.; Thompson, T. Coincident detection of crop water stress, nitrogen status and canopy density using ground based multispectral data. In Proceedings of the Fifth International Conference on Precision Agriculture, Bloomington, MN, USA, 16–19 July 2000; Volume 1619. [Google Scholar]
  143. Gitelson, A.A.; Chivkunova, O.B.; Merzlyak, M.N. Nondestructive estimation of anthocyanins and chlorophylls in anthocyanic leaves. Am. J. Bot. 2009, 96, 1861–1868. [Google Scholar] [CrossRef] [PubMed]
  144. Ju, C.-H.; Tian, Y.-C.; Yao, X.; Cao, W.-X.; Zhu, Y.; Hannaway, D. Estimating Leaf Chlorophyll Content Using Red Edge Parameters. Pedosphere 2010, 20, 633–644. [Google Scholar] [CrossRef]
  145. Cardil, A.; Vepakomma, U.; Brotons, L. Assessing Pine Processionary Moth Defoliation Using Unmanned Aerial Systems. Forests 2017, 8, 402. [Google Scholar] [CrossRef] [Green Version]
  146. Otsu, K.; Pla, M.; Vayreda, J.; Brotons, L. Calibrating the Severity of Forest Defoliation by Pine Processionary Moth with Landsat and UAV Imagery. Sensors 2018, 18, 3278. [Google Scholar] [CrossRef] [Green Version]
  147. Lehmann, J.R.K.; Nieberding, F.; Prinz, T.; Knoth, C. Analysis of Unmanned Aerial System-Based CIR Images in Forestry—A New Perspective to Monitor Pest Infestation Levels. Forests 2015, 6, 594–612. [Google Scholar] [CrossRef] [Green Version]
  148. Smigaj, M.; Gaulton, R.; Barr, S.L.; Suárez, J.C. UAV-borne thermal imaging for forest health monitoring: Detection of disease-induced canopy temperature increase. Int. Arch. Photogramm. Remote Sens. Spat. Inf. Sci. 2015, 40, 349–354. [Google Scholar] [CrossRef] [Green Version]
  149. Näsi, R.; Honkavaara, E.; Blomqvist, M.; Lyytikäinen-Saarenmaa, P.; Hakala, T.; Viljanen, N.; Kantola, T.; Holopainen, M. Remote sensing of bark beetle damage in urban forests at individual tree level using a novel hyperspectral camera from UAV and aircraft. Urban For. Urban Green. 2018, 30, 72–83. [Google Scholar] [CrossRef]
  150. Otsu, K.; Pla, M.; Brotons, L. Estimating the Severity of Defoliation Due to Pine Processionary Moth Using a Combination of Landsat and UAV Imagery. In Proceedings of the IGARSS 2018—2018 IEEE International Geoscience and Remote Sensing Symposium, Valencia, Spain, 22–27 July 2018; pp. 3979–3982. [Google Scholar]
  151. Wen, A.; Zheng, J.; Chen, M.; Mu, C.; Tao, M. Spatial distribution of rodent pests in desert forest based on UAV remote sensing. In Proceedings of the 2016 IEEE International Geoscience and Remote Sensing Symposium (IGARSS), Beijing, China, 10–15 July 2016; pp. 1804–1807. [Google Scholar]
  152. Getzin, S.; Wiegand, K.; Schöning, I. Assessing biodiversity in forests using very high-resolution images and unmanned aerial vehicles. Methods Ecol. Evol. 2012, 3, 397–404. [Google Scholar] [CrossRef]
  153. Getzin, S.; Nuske, R.S.; Wiegand, K. Using Unmanned Aerial Vehicles (UAV) to Quantify Spatial Gap Patterns in Forests. Remote Sens. 2014, 6, 6988–7004. [Google Scholar] [CrossRef] [Green Version]
  154. Bagaram, M.B.; Giuliarelli, D.; Chirici, G.; Giannetti, F.; Barbati, A. UAV Remote Sensing for Biodiversity Monitoring: Are Forest Canopy Gaps Good Covariates? Remote Sens. 2018, 10, 1397. [Google Scholar]
  155. Tian, J.; Wang, L.; Li, X.; Gong, H.; Shi, C.; Zhong, R.; Liu, X. Comparison of UAV and WorldView-2 imagery for mapping leaf area index of mangrove forest. Int. J. Appl. Earth Obs. Geoinf. 2017, 61, 22–31. [Google Scholar] [CrossRef]
  156. McNeil, B.E.; Pisek, J.; Lepisk, H.; Flamenco, E.A. Measuring leaf angle distribution in broadleaf canopies using UAVs. Agric. For. Meteorol. 2016, 218–219, 204–208. [Google Scholar] [CrossRef]
  157. Feduck, C.; McDermid, G.J.; Castilla, G. Detection of Coniferous Seedlings in UAV Imagery. Forests 2018, 9, 432. [Google Scholar] [CrossRef] [Green Version]
  158. Puliti, S.; Solberg, S.; Granhus, A. Use of UAV Photogrammetric Data for Estimation of Biophysical Properties in Forest Stands Under Regeneration. Remote Sens. 2019, 11, 233. [Google Scholar] [CrossRef] [Green Version]
  159. Talbot, B.; Rahlf, J.; Astrup, R. An operational UAV-based approach for stand-level assessment of soil disturbance after forest harvesting. Scand. J. For. Res. 2018, 33, 387–396. [Google Scholar] [CrossRef] [Green Version]
  160. Pierzchała, M.; Talbot, B.; Astrup, R. Estimating Soil Displacement from Timber Extraction Trails in Steep Terrain: Application of an Unmanned Aircraft for 3D Modelling. Forests 2014, 5, 1212–1223. [Google Scholar] [CrossRef] [Green Version]
  161. Nevalainen, P.; Salmivaara, A.; Ala-Ilomäki, J.; Launiainen, S.; Hiedanpää, J.; Finér, L.; Pahikkala, T.; Heikkonen, J. Estimating the Rut Depth by UAV Photogrammetry. Remote Sens. 2017, 9, 1279. [Google Scholar] [CrossRef] [Green Version]
  162. Ota, T.; Ahmed, O.S.; Minn, S.T.; Khai, T.C.; Mizoue, N.; Yoshida, S. Estimating selective logging impacts on aboveground biomass in tropical forests using digital aerial photography obtained before and after a logging event from an unmanned aerial vehicle. For. Ecol. Manag. 2019, 433, 162–169. [Google Scholar] [CrossRef]
  163. Puliti, S.; Talbot, B.; Astrup, R. Tree-Stump Detection, Segmentation, Classification, and Measurement Using Unmanned Aerial Vehicle (UAV) Imagery. Forests 2018, 9, 102. [Google Scholar] [CrossRef] [Green Version]
  164. Adão, T.; Hruška, J.; Pádua, L.; Bessa, J.; Peres, E.; Morais, R.; Sousa, J.J. Hyperspectral Imaging: A Review on UAV-Based Sensors, Data Processing and Applications for Agriculture and Forestry. Remote Sens. 2017, 9, 1110. [Google Scholar] [CrossRef] [Green Version]
  165. Floris, A.; Clementel, F.; Colle, G.; Gubert, F.; Bertoldi, L.; De Lorenzi, G. Stima di volumi legnosi forestali con dati fotogrammetrici telerilevati da UAV su piccole superfici: Un caso di studio in Trentino. In Proceedings of the Atti della “16a Conferenza Nazionale ASITA”, Vicenza, Italy, 6–9 November 2012; pp. 681–688. [Google Scholar]
  166. Körting, T.S.; Garcia Fonseca, L.M.; Câmara, G. GeoDMA—Geographic Data Mining Analyst. Comput. Geosci. 2013, 57, 133–145. [Google Scholar] [CrossRef] [Green Version]
  167. Belgiu, M.; Drăguţ, L. Random forest in remote sensing: A review of applications and future directions. ISPRS J. Photogramm. Remote Sens. 2016, 114, 24–31. [Google Scholar] [CrossRef]
  168. Ambrosia, V.G.; Wegener, S.; Zajkowski, T.; Sullivan, D.V.; Buechel, S.; Enomoto, F.; Lobitz, B.; Johan, S.; Brass, J.; Hinkley, E. The Ikhana unmanned airborne system (UAS) western states fire imaging missions: From concept to reality (2006–2010). Geocarto Int. 2011, 26, 85–101. [Google Scholar] [CrossRef]
  169. Lisein, J.; Pierrot-Deseilligny, M.; Bonnet, S.; Lejeune, P. A Photogrammetric Workflow for the Creation of a Forest Canopy Height Model from Small Unmanned Aerial System Imagery. Forests 2013, 4, 922–944. [Google Scholar] [CrossRef] [Green Version]
  170. Thiel, C.; Schmullius, C. Comparison of UAV photograph-based and airborne lidar-based point clouds over forest from a forestry application perspective. Int. J. Remote Sens. 2017, 38, 2411–2426. [Google Scholar] [CrossRef]
  171. Puliti, S.; Ene, L.T.; Gobakken, T.; Næsset, E. Use of partial-coverage UAV data in sampling for large scale forest inventories. Remote Sens. Environ. 2017, 194, 115–126. [Google Scholar] [CrossRef]
Figure 1. Typical photogrammetric processing pipeline. The acquired imagery goes through an imagery alignment processing, resulting in a sparse point cloud, which in turn, is densified into a dense point cloud, by interpolating it several raster outcomes can result: digital surface model (DSM), digital terrain model (DTM), orthophoto mosaic, among others (depending on the sensor type).
Remotesensing 12 01046 g001
Figure 2. Example of an individual tree crown detection and delineation approach using: (a) a canopy height model; (b) identified treetops using local maxima; and (c) tree crown delineation using watershed transform.
Remotesensing 12 01046 g002
Figure 3. Distribution of the reviewed studies per: (a) unmanned aerial vehicle type; (b) sensing payload type (CIR: colour infrared; MSP: multispectral; HSP: hyperspectral; TIR: thermal infrared); (c) most relevant outcomes used; (d) and continents were the studies were performed (EU: Europe; NA: North America; SA: South America; AS: Asia; OC: Oceania; AF: Africa).
Remotesensing 12 01046 g003
Figure 4. Some of the most used unmanned vehicle types: (a) fixed-wing, SenseFly eBee; (b) PrecisionHawk Lancaster; (c) rotary-wing, DJI Phantom 4 and (d) DJI Matrice 600 Pro.
Remotesensing 12 01046 g004
Figure 5. Comparison of a LiDAR point cloud with a photogrammetric point cloud, both acquired using an unmanned aerial vehicle: (a) a profile in the limits of a tree plot; (b) a dense canopy plot; and (c) young coniferous trees. Data courtesy of Aeromedia.
Remotesensing 12 01046 g005
Figure 6. Digital surface models (DSMs) driven from LiDAR (centre) data and through photogrammetric processing (right) of RGB imagery in the same area. Orthophoto mosaic for visual interpretation (left); general overview of the area (a); and close views of the areas 1, 2, 3, and 4 (be). Data courtesy of Aeromedia.
Remotesensing 12 01046 g006
Table 1. Unmanned aerial vehicle type, sensing payloads and results from stand-level studies.
StudiesUAV TypeSensor TypeResults (R2)
FWRWRGBLiDARCIRHLHMHdomSnBASvDBHVAGB
Puliti et al. [37] 0.71 0.970.600.600.85
Giannetti et al. [88] 0.80–0.83
Chen et al. [89] 0.91
Cao et al. [84] 0.90 0.560.64 0.690.780.68
Cao et al. [84] 0.82 0.50.61 0.500.700.63
Ota et al. [85] 0.930.930.91 0.75
Alonzo et al. [91] 0.79 0.92
Jayathunga et al. [92] 0.84
Guo et al. [86] 0.81 0.84
Goodbody et al. [90] 0.93
FW: Fixed-Wing; RW: Rotary-Wing; CIR: Colour infrared; HL: Lorey’s Mean Height; HM: Maximum Height; Hdom: Dominant Height; Sn: Stem Number; BA: Basal Area; Sv: Stem Volume; DBH: Diameter at Breast Height; V: Volume; AGB: Above Ground Biomass.
Table 2. Unmanned aerial vehicle type, sensing payloads and results from tree-level studies.
StudiesUAV TypeSensor TypeResults (R2; *r)
FWRWRGBLiDARMSPHSPHCDDBHSvAGB
Ni et al. [93] 0.87
Wallace et al. [101] 0.84
Wallace et al. [101] 0.68
Guerra-Hernández et al. [97] 0.61–0.69*
Chen et al. [89] 0.76*
Carr and Slyder [102] 0.82*
Surový et al. [107]
Dandois et al. [108] 0.86
Chisholm et al. [104] 0.45
Sankey et al. [100] 0.900.72
Guerra-Hernández et al. [94] 0.810.95
Lin et al. [96] 0.92 0.96
Panagiotidis et al. [78] 0.75–0.720.63–0.85
Yin and Wang [99] > 0.90.83–0.85
Otero et al. [106] 0.60 0.75
Guerra-Hernández et al. [95] 0.96 0.79 0.86–0.87
Abdollahnejad et al. [105] 0.87 0.780.71
Jaakkola et al. [98] 0.92* 0.88*0.88*0.89*
FW: Fixed-Wing; RW: Rotary-Wing; MSP: Multispectral; HSP: Hyperspectral; H: Tree Height; CD: Crown Diameter; DBH: Diameter at Breast Height; Sv: Stem Volume; AGB: Above Ground Biomass.
Table 3. Unmanned aerial vehicle type, sensing payloads and classifiers used for tree classification.
StudiesUAV TypeSensorsClassification Method
FWRWRGBLiDARCIRMSPHSPk-NNDTNBMLPRFISOMaxLSVMHICCNNCDC
Fraser and Congalton [123]
Brovkina et al. [124]
Sankey et al. [120]
Nevalainen et al. [71]
Melville et al. [117]
Michez et al. [67]
Gini et al. [65,119]
Cao et al. [118]
Laliberte et al. [121]
Morales et al. [122]
Goodbody et al. [110]
Franklin and Ahmed [116]
Röder et al. [111]
de Sá et al. [115]
Alonzo et al. [91]
Jayathunga et al. [92]
Li et al. [125]
Fromm et al. [126]
Imangholiloo et al. [127]
FW: Fixed-Wing; RW: Rotary-Wing; CIR: Colour Infrared; MSP: Multispectral; HSP: Hyperspectral; k-NN: k-Nearest Neighbours; DT: Decision Trees; NB: Naive Bayes; MLP: Multi-Layer Perceptron; RF: Random Forest; ISO: ISODATA; MaxL: Maximum Likelihood; SVM: Support Vector Machine; HIC: Hierarchical Image Classification; CNN: Convolutional Neural Network; CDC: Canonical Discriminant Classifier.
Table 4. Unmanned aerial vehicle type, sensing payloads and more significant outcomes used in fire and post-fire studies.
StudiesUAV TypeSensor TypeOutcomes Used
FWRWRGBLiDARMSPTIRPCOMCHMDSMVI
Fernández-Álvarez et al. [49]
Shin et al. [138]
Martínez-de Dios et al. [129]; Merino et al. [130]
Hristov et al. [131]
McKenna et al. [132]
Aicardi et al. [133]
White et al. [134]
Larrinaga and Brotons [135]
Fernández-Guisuraga et al. [136]
Mayr et al. [137]
FW: Fixed-Wing; RW: Rotary-Wing; MSP: Multispectral; TIR: Thermal Infrared; PC: Point Cloud; OM: Orthophoto Mosaic; CHM: Canopy Height Model; DSM: Digital Surface Model; VI: Vegetation Indices.
Table 5. Compilation of the studies reviewed in this subsection summarized by their main objectives, conclusions and UAV type and sensors used in each case.
StudiesUAV TypeSensor Type
FWRWRGBCIRMSPHSPTIR
Lehmann et al. [147]
Näsi et al. [140,149]
Smigaj et al. [148]
Cardil et al.; Otsu et al. [145,146,150]
Wen et al. [151]
Minařík and Langhammer [141]
FW: Fixed-Wing; RW: Rotary-Wing; CIR: Colour Infrared; MSP: Multispectral; HSP: Hyperspectral; TIR: Thermal Infrared.

