Article

An Introduction to the Geostationary-NASA Earth Exchange (GeoNEX) Products: 1. Top-of-Atmosphere Reflectance and Brightness Temperature

1
NASA Ames Research Center, Moffett Field, CA 94035, USA
2
School of Natural Sciences, California State University Monterey Bay, Seaside, CA 93955, USA
3
Bay Area Environment Research Institute, Moffett Field, CA 94035, USA
4
JAXA Earth Observation Research Center, Sengen, Tsukuba, Ibaraki 305-8505, Japan
5
Center for Environmental Remote Sensing, Chiba University, Chiba 263-8522, Japan
6
NOAA/NESDIS/STAR, NCWCP, College Park, MD 20740, USA
*
Author to whom correspondence should be addressed.
Current Affiliation: School of Geography and Resources, Guizhou Education University, Guiyang 550018, China.
Submission received: 23 March 2020 / Revised: 10 April 2020 / Accepted: 11 April 2020 / Published: 17 April 2020
(This article belongs to the Special Issue Earth Monitoring from A New Generation of Geostationary Satellites)

Abstract

:
GeoNEX is a collaborative project led by scientists from NASA, NOAA, and many other institutes around the world to generate Earth monitoring products using data streams from the latest Geostationary (GEO) sensors including the GOES-16/17 Advanced Baseline Imager (ABI), the Himawari-8/9 Advanced Himawari Imager (AHI), and more. An accurate and consistent product of the Top-Of-Atmosphere (TOA) reflectance and brightness temperature is the starting point in the scientific processing pipeline and has significant influences on the downstream products. This paper describes the main steps and the algorithms in generating the GeoNEX TOA products, starting from the conversion of digital numbers to physical quantities with the latest radiometric calibration information. We implement algorithms to detect and remove residual georegistration uncertainties automatically in both GOES and Himawari L1bdata, adjust the data for topographic relief, estimate the pixelwise data-acquisition time, and accurately calculate the solar illumination angles for each pixel in the domain at every time step. Finally, we reproject the TOA products to a globally tiled common grid in geographic coordinates in order to facilitate intercomparisons and/or synergies between the GeoNEX products and existing Earth observation datasets from polar-orbiting satellites.

Graphical Abstract

1. Introduction

Earth monitoring has improved dramatically over the past four decades. Advances in sensor technologies coupled with sophisticated algorithms now allow routine retrievals of biophysical variables useful in long-term climate monitoring, as well as operational resource management [1,2]. Although a majority of Earth observation satellites are on Low Earth Orbits (LEO), especially polar orbits, Geostationary (GEO) satellites such as the European Meteosat Second Generation (MSG), carrying the Spinning Enhanced Visible and InfraRed Imager (SEVIRI), has allowed us to monitor large parts of Africa and Europe in near real-time [3,4]. The trend towards sophisticated geostationary sensors continues with the launch of the Japanese HIMAWARI8 and 9 (carrying the Advanced Himawari Imager (AHI)) [5], the American GOES 16 and 17 (carrying the Advanced Baseline Imager (ABI)) [6,7], the Chinese Fengyun-4 (carrying the Advanced Geosynchronous Radiation Imager (AGRI)) [8], and the Korean GEO-KOMPSAT-2A (carrying the Advanced Meteorological Imager (AMI)) [9]. The European MeteoSat Third Generation (MTG) satellite, which is to be launched in the near future, will carry similarly advanced instruments including the Flexible Combined Imager (FCI) [10]. Compared with their predecessors, this latest third-generation of geostationary sensors has significantly improved spectral, spatial, temporal, and radiometric resolutions, poised to make significant contributions to Earth monitoring.
As an example, the ABI instrument on GOES 16/17 is a state-of-the-art radiometer that has 16 spectral bands covering the visible, NIR, and IR portions of the reflected solar radiation, as well as Earth’s emitted electromagnetic energy (Figure 1), providing a suite of key measurements of atmosphere and land surface properties. It has a 500 m nadir resolution for the red band (Band 2), 1 km for most visible and near-infrared bands (Bands 1, 3, and 5), and 2 km for other IR bands, close to those offered by modern moderate resolution sensors such as MODIS (MODerate resolution Imaging Spectroradiometer) and VIIRS (Visible Infrared Imaging Radiometer Suite) (Figure 1). In its current operational mode, ABI scans the Earth’s full disk every 10 minutes and the Conterminous U.S. (CONUS) every five minutes. The radiometric resolutions of the ABI bands are also improved by the use of 12 bit (14 bit for Band 4) digital numbers. It is also equipped with an onboard solar diffuser to help calibrate the instrument and ensure the high radiometric quality of the data [6,7]. In many ways, therefore, ABI (and the other new geostationary sensors) provides land and atmosphere monitoring capabilities comparable to flagship Earth observing sensors like MODIS and VIIRS.
Compared with polar orbiting or LEO satellites (for simplicity, in this paper, we may refer to the two types of orbits interchangeably), monitoring Earth by geostationary sensors has its own characteristics. Revolving Earth with the same angular velocity as Earth’s rotation, a geostationary satellite appears motionless related to the ground and therefore can scan the same side (full disk) of the Earth’s surface as frequently as every five minutes. Such a high frequency of data significantly enhances our abilities to study diurnally-varying phenomena such as land-atmosphere energy and mass fluxes, snow-melt and accumulation, forest fires, and floods, just to name a few. The high temporal resolutions of geostationary data also offer exciting possibilities for overcoming cloud cover that severely impedes the utility of polar orbiters in areas such as the Amazon or Central Africa, both being critical regions for global change studies [11,12,13,14,15,16]. Significant doubts remain about the behavior of the ecosystems (phenology, productivity, etc.) in these regions because of our inability to gather sufficient cloud-free observations. Studies using SEVIRI data have shown that with six hourly observations, one can create a cloud-free mosaic of Africa every 3–5 days [3,4]. Our initial analysis [17] of the first-year’s ABI data indicated a similar time window for cloud-free mosaics over the Amazon. With a (quasi) global constellation formed by the third-generation geostationary satellites (e.g., Himawari-8/9, GOES16/17, FY-4, GEO-KOMPSAT, and the future MTG) that collect observations every 15 min, therefore, it is promising that we will be able to study the equatorial tropics in a way that was not possible before.
Geostationary data also come with challenges not often found in LEO data. The Sun-target-satellite geometries from the geostationary orbit feature fixed view angles, but constantly changing solar illumination angles at a given surface location, nearly reciprocal to the LEO Sun-synchronous observations. The angular dependence of photons reflected from the surface, generally described with the Bi-directional Reflectance Distribution Function (BRDF) [18], can have significant influences on the measured radiance at different times and/or different locations. Such BRDF effects must be carefully accounted for in processing geostationary data as traditional assumptions about the isotropy of surface reflectance (i.e., “Lambertian surface”) may introduce large uncertainties, especially in mid-/high latitudes, where the view zenith angles are large.
This paper introduces the GeoNEX (Geostationary-NASA Earth Exchange) datasets produced from a collaborative effort led by scientists from NASA, NOAA, and many other research institutes around the world. NEX is a cloud-computing platform that brings scientists together with NASA datasets and scalable compute resources to produce new products or perform large-scale data analytics [19]. The GeoNEX effort is particularly initialized with the goal to explore the potential of data streams from operational GEO satellites (GOES16/17, Himawari 8/9, etc.) in creating rigorous science products that are supplementary to existing Earth monitoring datasets from LEO satellites. To achieve this goal, we carefully adapted NASA EOS (Earth Observing System) algorithms to exploit the advantages of the geostationary data while overcoming their challenges. We also developed a common framework that facilitated the intercomparisons and cross-calibration between GEO and LEO sensors, ensuring the consistency and continuity of GeoNEX products with EOS datasets. We will give detailed descriptions of the GeoNEX products in a series of papers, starting with this one.
This paper focuses on the processing of the Level 1G (L1G) GeoNEX products, namely the Top-Of-Atmosphere (TOA) Bidirectional Reflectance Factor (BRF) (reflective bands) and brightness temperature (emissive bands). We first introduce the global tiled grid that is defined for all GeoNEX products. We then describe the steps to convert DN (Digital Number) values to physical quantities with the latest radiometric calibration information, detect and remove residual georegistration errors in the input data stream, and calculate accurate Sun and satellite angles for each pixel in the domain at each time step. We illustrate these processing steps with results from GOES16 ABI and Himawari-8 AHI as examples before concluding the paper.

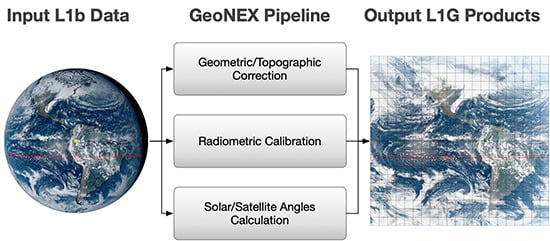
2. Materials and Methods

Figure 2 shows a schematic diagram of the processing pipeline of the GeoNEX TOA L1G products. It has four main components: radiometric calibration, geometric correction, pixelwise Sun/satellite angles’ calculation, as well as the gridding and tiling of the final products. This section describes these processing components, starting with an introduction to the GeoNEX global tile grid.

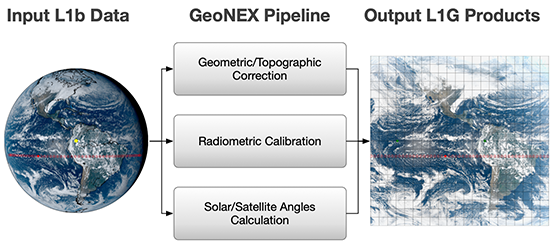
2.1. Global Geographic Tile Grid

With a global constellation of the third-generation of geostationary satellites oriented, we define a common tiled grid in the geographic (latitude/longitude) projection for the GeoNEX products (Figure 3). Spanning from 60 N and 180 W at the upper-left corner to 60 S and 180 E at the lower-right corner, the grid was divided into 6 × 6 tiles that were numbered from 0 to 59 in the longitudinal (horizontal) direction and from 0 to 19 in the latitudinal (vertical) direction. Pixels (grid cells) were created at regular 0.005 , 0.01 , and 0.02 resolutions, where a 0.02 pixel contained exactly four 0.01 pixels and a 0.01 pixel contained exactly four 0.005 pixels. The layout and the resolutions of the pixels were in correspondence to the three native spatial resolutions (i.e., 500 m, 1 km, and 2 km) common to the geostationary satellite data in different spectral bands [7]. The geographic projection of the grid was chosen to facilitate intercomparisons between geostationary and polar-orbiting sensors [20].
Shown in Figure 3, each of the geostationary sensors largely covers a 120 × 120 portion of the common grid around their subpoint. Beyond this extent, the spatial resolution of the data increases dramatically as the viewing zenith angles approach 90 , making the data difficult to use. We define the domain of GOES-16/ABI to be from 138 W to 18 W (Horizontal Tiles 7 to 26) and that of Himawari-8/AHI to be from 84 E to 24 W (Horizontal Tiles 44 to 59 and Tile 0 to Tile 3). The domains of the other sensors can be defined in similar ways. In the rest of the paper, we will mainly use GOES16/ABI and Himawari-8/AHI as examples to illustrate our processing.

2.2. TOA Radiance

The Level 1b (L1b) data of ABI and AHI provide DN to calculate radiometrically and geometrically calibrated spectral radiance (L, W·m 2 sr 1 μ m 1 ) measured at the TOA under the illumination-view geometry at the time of acquisition [7,21]. Both satellites are equipped with a blackbody (the Internal Calibration Target (ICT)) and a solar diffuser (the Solar Calibration Target (SCT)) for calibrating the Thermal Emissive Bands (TEB) and the Solar Reflective Bands (RSB), respectively. The onboard calibrators are rigorously calibrated prelaunch, and in-orbit measurements of them, along with those of the deep-space and the Moon, are used to derive the gain and the offset factors to convert the detector digital counts to radiance [22]. Intercomparison studies indicated that the calibrated AHI and ABI L1b radiance was consistent with those measured by LEO sensors like MODIS and VIIRS [23,24,25].
The performance of onboard calibration is operationally monitored with postlaunch algorithms to detect potential degradation of the sensors or other issues (e.g., sensor banding and striping noises). For instance, time series of AHI SCT observations show that the sensor sensitivities of Bands 1 to 4 degrade by 0.5% per year [21]. In response, beginning on 25 July 2017, JMA regularly updates the latest gain and offset factors in the HSD (Himawari Standard Data) files. Similarly, it has been noticed that the Band 2 radiance of ABI is 6.9% higher than other satellite and ground observations. Beginning on 23 April 2019, NOAA started to apply an empirical correction to GOES-16 ABI data in order to remove this bias. The calibration information of ABI and AHI is regularly updated and publicly accessible on the NOAA and JMA websites (e.g., https://www.star.nesdis.noaa.gov/GOESCal/index.php; http://www.data.jma.go.jp/mscweb/data/monitoring/calibration.html).
To our knowledge, neither JMA nor NOAA retrospectively process archived AHI or ABI data with new calibration coefficients. They also use different strategies and formats to update the calibration information. Therefore, we implemented a separate database to record the up-to-date radiometric calibration information, so that the same correction could be applied to the entire data record in generating the GeoNEX products, and the computed TOA radiance was consistent and coherent throughout the same data collection. The calibration information was saved in the product data files for backtracking and verification.

2.3. Bidirectional Reflectance Factor and Brightness Temperature

For the solar reflective bands (Bands 1–6 on both ABI and AHI), we calculated the bidirectional reflectance factor (BRF, R) from the radiance (L) as:
L = c 0 + c 1 · DN ,
R = π d 2 L E s u n cos θ s ,
where c 0 and c 1 are calibration coefficients, E s u n is the mean solar exoatmosphere spectral irradiance (W·m 2 μ m 1 ), d is the instantaneous Earth-Sun distance (in astronomical units), and θ s is the solar zenith angle. Daily values of the parameter d are included in the ABI netCDF files. They can also be calculated from the provided navigation information (i.e., Sun’s position under the J2000 inertial coordinate system). Algorithms to calculate θ s and other satellite angles are described below in a separate subsection.
For each of the thermal emissive bands (Bands 7–16 on both sensors), we first calculated the effective brightness temperature T e from the radiance L by the inverse Planck’s equation and then estimated the band-integrated brightness temperature ( T b ) from T e with a fitting linear (ABI) or quadratic (AHI) polynomial:
T e = h c k ln 1 1 + 2 h c 2 λ 5 L , T b = c 2 + c 3 · T e + c 4 · T e 2 ,
where c is the speed of light (m·s 1 ), h is Planck’s constant (J·s), k is the Boltzmann’s constant (J·K 1 ), and λ is the central wavelength (m) (note that in the calculation, we also needed to convert the unit of radiance L from “W·m 2 sr 1 μ m 1 ” to “W·m 2 sr 1 m 1 ” by multiplying by a factor of 10 6 ). The empirical coefficients c i were determined from numerical simulation results at high spectral resolutions and provided in AHI HSD and ABI netCDF files.

2.4. Map Projection and Coordinate Transformations

Image pixels from ABI or AHI are registered to a regular grid in the geostationary projection, in which Earth is deemed as a perfect ellipsoid defined by the Geodetic Reference System 1980 (GRS80) or the World Geodetic System 1984 (WGS84). The idealized satellite sensor is assumed to locate at a fixed point over the Equator with a constant altitude (Figure 4). The coordinates of the map projection, ( y , x ), are essentially the elevation and the azimuth angles ( δ S , ϕ S ) in a spherical-coordinate system, though the orientation of the two angles needs to be defined by the “sweep” axis of the ideal sensor (see below). With the geometric model illustrated in Figure 4, we can easily transform between the geographic latitude/longitude ( δ E , ϕ E ) coordinates and the ( δ S , ϕ S ) coordinates of the fixed-point projection. The transformation equations can be found in standard technical documents [26,27].
It should be noted that the ideal satellite sensor defined in the map projection is not necessarily the same as the physical satellite instruments. For instance, both ABI and AHI scan the Earth’s disk in the same fashion as illustrated in Figure 4, where the Line Of Scan (LOS) sweeps Earth’s surface in a west-east swath and the elevation of the scanning plane changes in the north-south (“y”) direction between swaths. This physical configuration corresponds to a “y” sweep axis, which is used in defining the map projection of AHI data. However, the map projection of ABI data defines the sweep axis to be “x”, in which the virtual LOS sweeps in the north-south swath and the elevation angle changes in the west-east (“x”) direction. Furthermore, although GOES-16 physically parks at the 75.2W longitude, its map projection uses the 75W longitude as the satellite subpoint. The navigation and registration (including map transformation and resampling) of the physical detector data to the fixed L1b grid are accomplished by the ground processing system at JMA (AHI) and NOAA (ABI), which is supposedly transparent to the data users. The relative flexibility between the physical instrument and the virtual satellite in the map projection of the L1b data reflects considerations on compatibility with legacy sensors.
In image processing, we also often use line and column numbers (l, c) of a pixel as its coordinates in the image space. Because the grid in the fixed-point projection is sampled at regular angular intervals, the conversions between the (l, c) and the (y, x) coordinates are determined by a linear transform with certain scaling factors and offset constants. As such, we can easily transform between the latitude/longitude coordinates ( δ , ϕ ) and the line/column (l, c) space as:
l g c g = f δ ϕ ,
where f denotes the transformation operator and the subscript (g) suggests that the coordinates are reprojected from the geographic space.
The ( l g , c g ) coordinates in the above equation are not necessarily integers, as the geographic grid points do not coincide with those in the fixed-point projection. A resampling scheme must be used to estimate the values at the geographic grids. We chose the nearest neighbor method in our processing, which is described below.

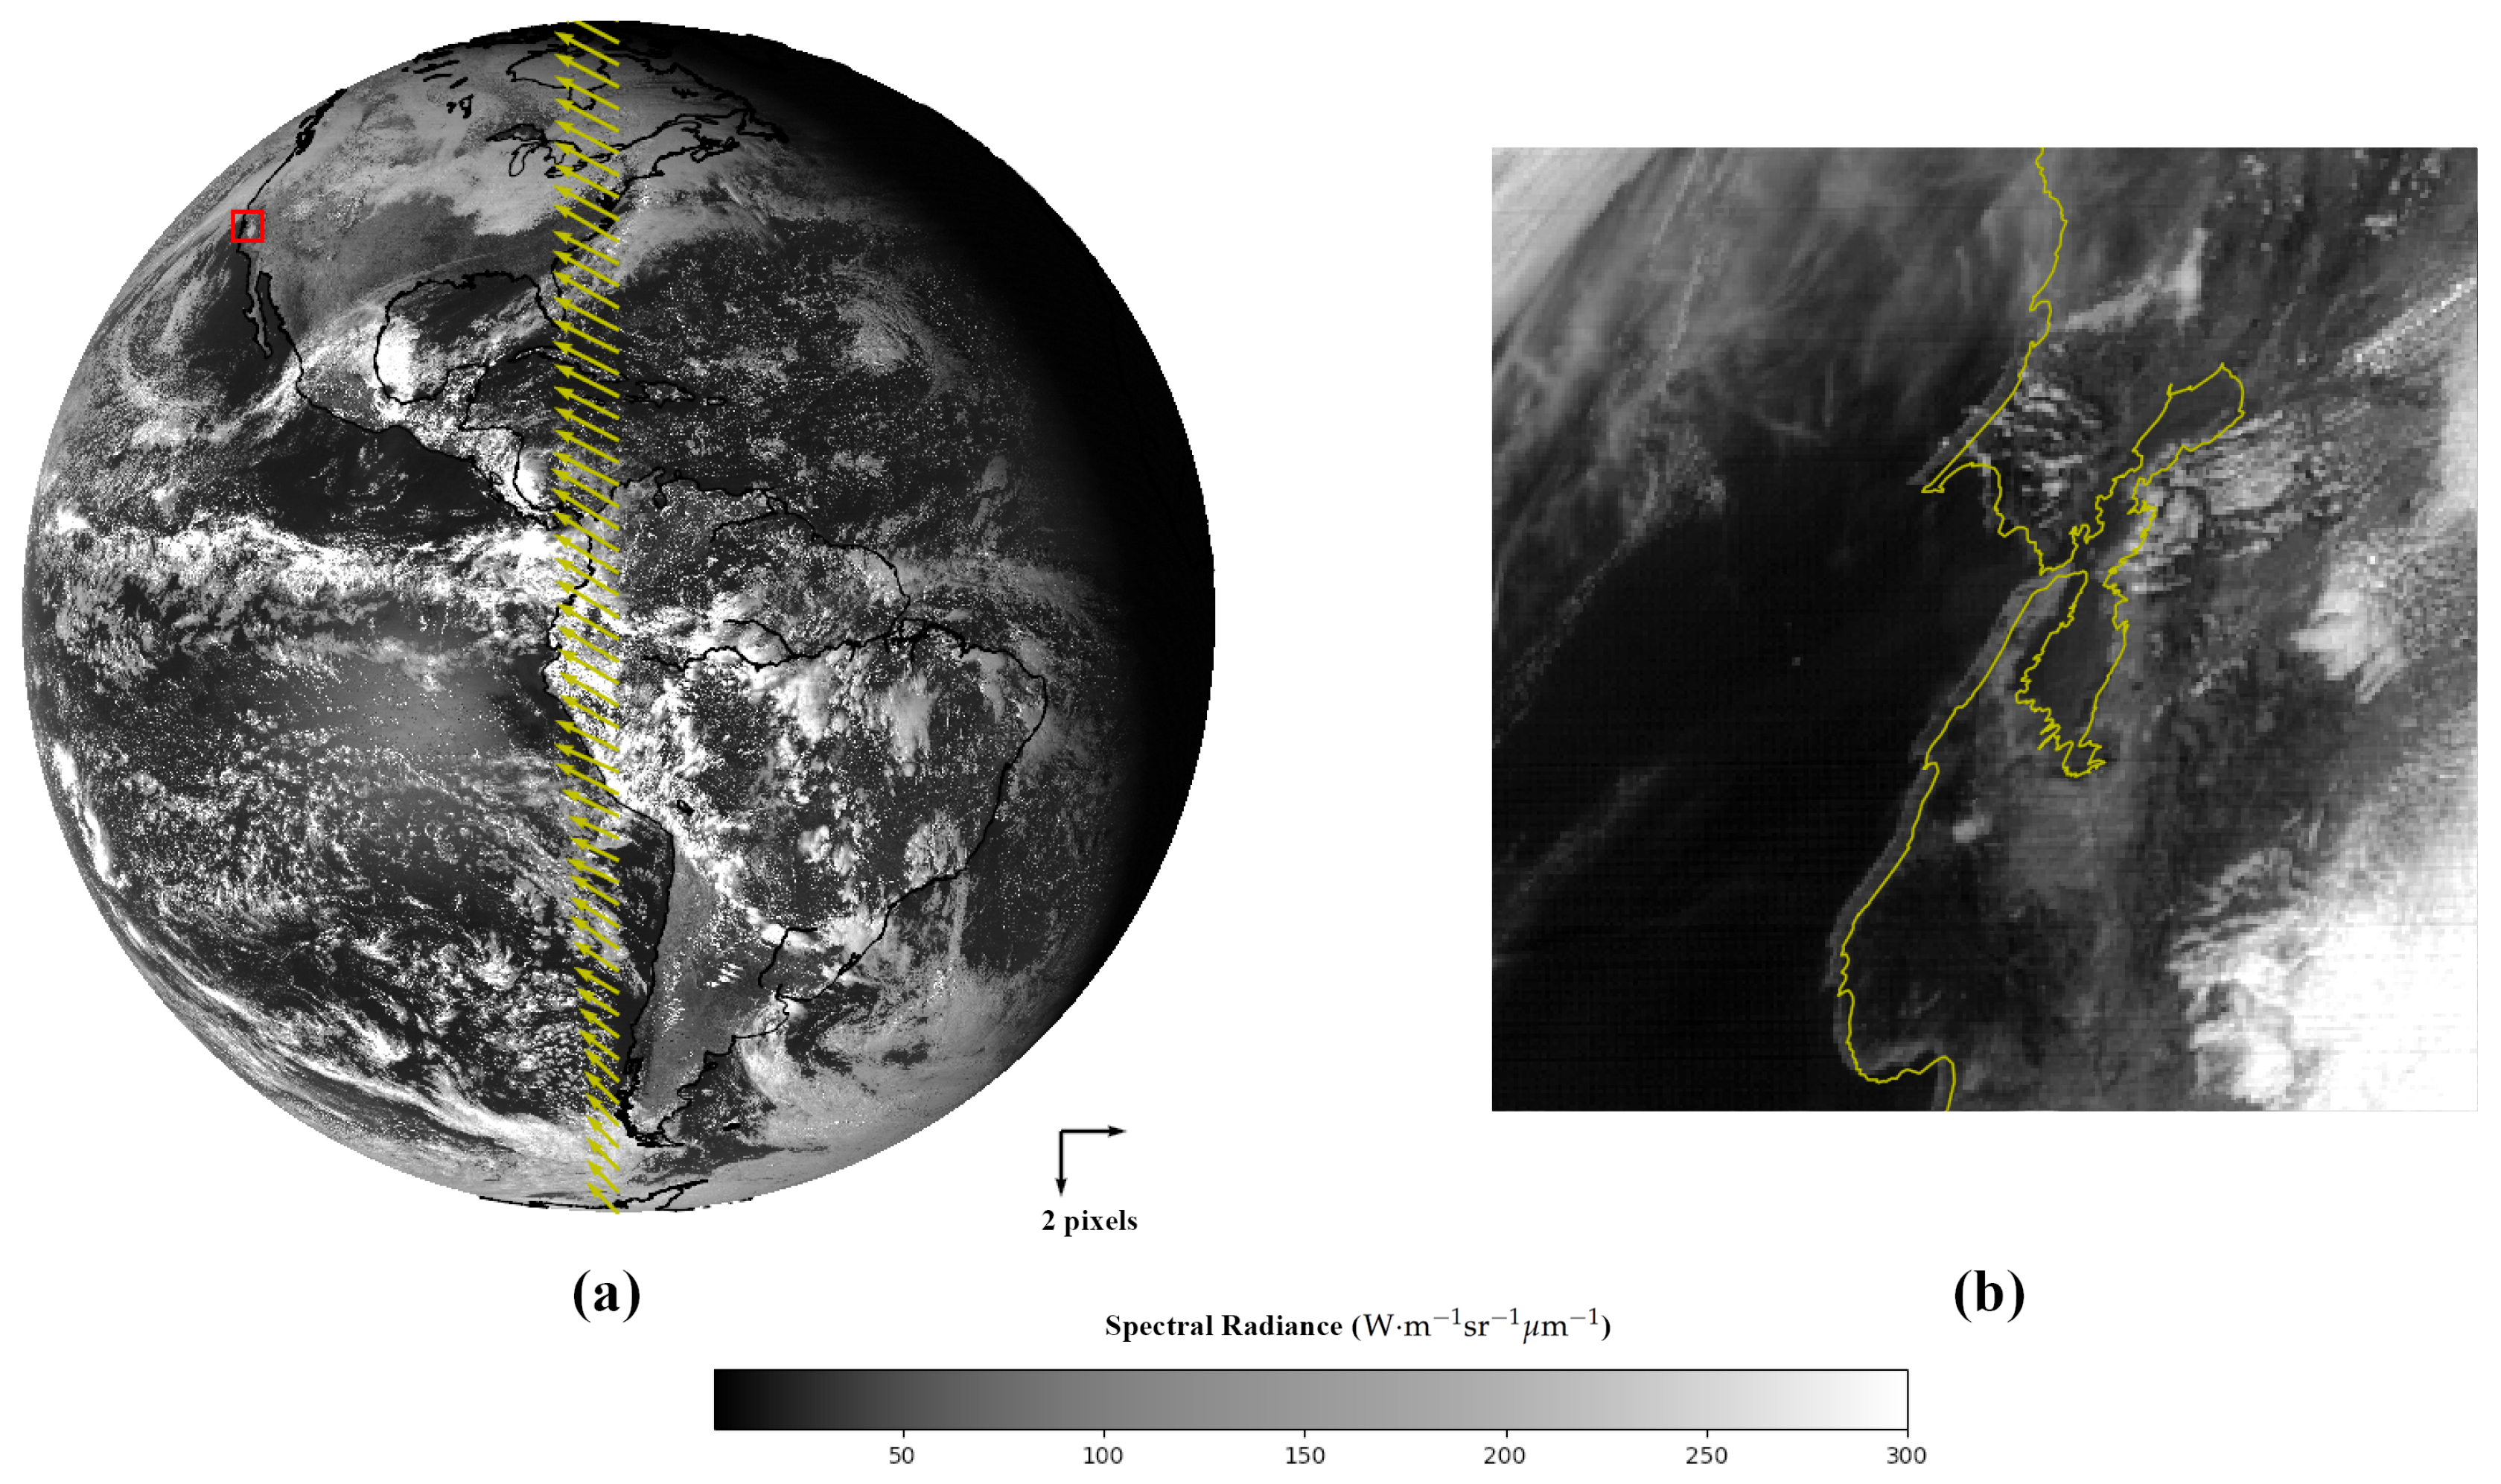
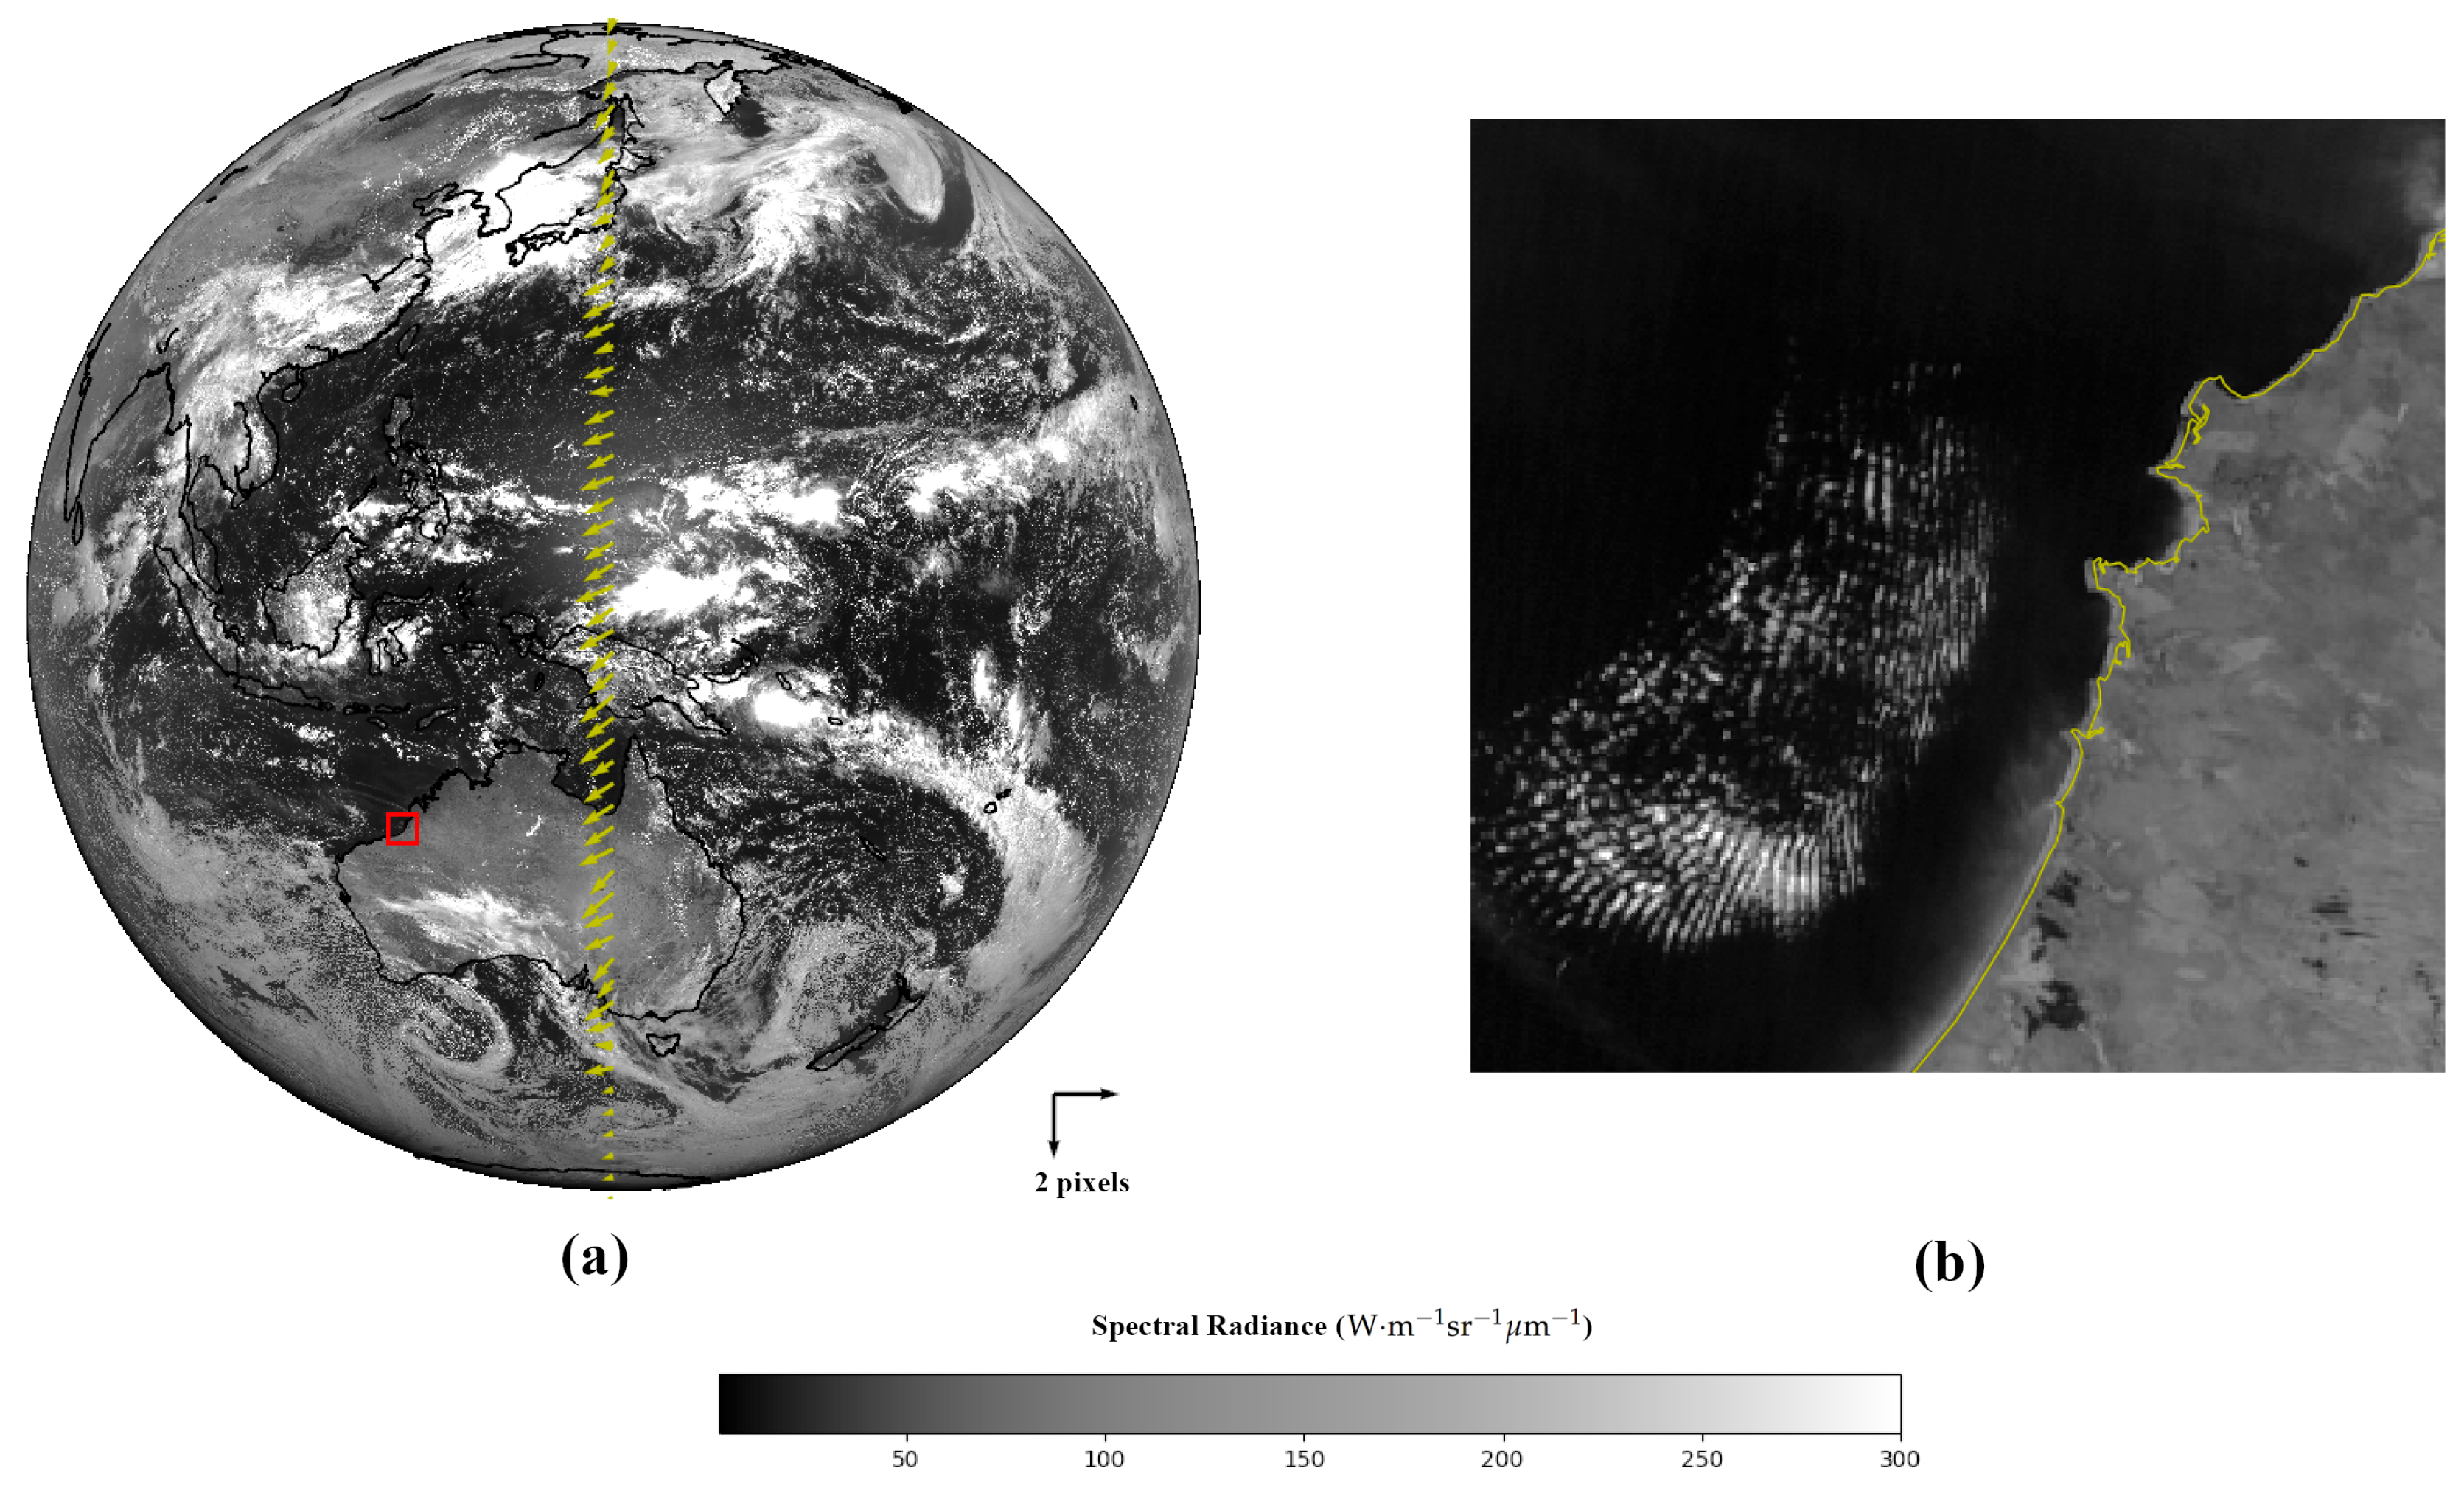
2.5. Phase Correlation Correction of Geolocations

Because the accuracy of geolocations of the input L1b data has critical impacts on the downstream processing (e.g., atmospheric correction), we implemented a scheme based on phase correlations to check and remove potential residual geolocation errors in the input data automatically. The emphasis on the residual errors was based on the fact that L1b data have already been geometrically navigated and registered [28,29]. Thus, we expected only slight translational offsets, by a couple of pixels to the maximum, in the input data.
To illustrate the idea of phase correlation correction, suppose we have a reference image P r ( l , c ) of a size M × N that is accurately georegistered. Another image P s ( l , c ) is a shifted version of P r , that is P s ( l , c ) = P r ( l + Δ l , c + Δ c ) . To detect the offsets ( Δ l , Δ c ), one way is to calculate the moving correlation between P r and P s in the pixel space by iteratively shifting the latter in both the line and the column directions until the correlation reaches its maximum value. A more efficient way to accomplish the task is to compute the cross-power spectrum in the Fourier frequency domain and then inverse it back to the pixel space [30,31,32], that is,
Q r ( u , v ) = F P r ( l , c ) , Q s ( u , v ) = F P s ( l , c ) = Q r ( u , v ) e 2 π i u Δ l M + v Δ c N , C ( u , v ) = Q r Q s * Q r Q s * = e 2 π i u Δ l M + v Δ c N , F 1 C ( u , v ) = δ D ( l Δ l , c Δ c ) .
Here, F and F 1 represent the forward and the inverse Fourier transform, u and v are the frequency variables, and the asterisk ( * ) indicates the complex conjugate. The Dirac delta function, δ D ( l + Δ l , c + Δ c ) , has a value of 1 when l = Δ l and c = Δ c , but is 0 otherwise. Therefore, the δ D function conveys information to decide the offsets of the test image P s . Note that Δ l and Δ c are not necessarily integers, and the algorithm is able to estimate subpixel offsets [33].
We created a reference full disk map at 0.005 resolution from the Shuttle Radar Topographic Mission (SRTM) Digital Elevation Model (DEM) data [34,35,36] and generated a dense set (>30,000) of landmark sites along coastlines. For each landmark site, two 125 × 125 chips were cropped from the reference map and the red band ( 0.005 ) radiance image, respectively, and run through the phase correlation algorithm to detect possible shifts around the landmark site. The algorithm consisted of additional screening steps to filter out (cloud) contaminated data and to ensure the quality of the retrieved geolocation errors ( Δ l , Δ c ).
Once Δ l and Δ c were estimated for all the individual landmark sites, we calculated their moving averages for each line (l) of the full disk image:
Δ l ( l ) Δ c ( l ) = 1 i D ( l ) 1 · i D ( l ) Δ l i Δ c i ,
where D ( l ) indicates the set of landmark sites (i) that fall in the moving window. The rationale that we only calculated the averaged geolocation errors by lines was based on the fact that both AHI and ABI scan the Earth’s disk in the west-east direction, and thus, we expect the relative geolocation errors along a scanning line to be small. In contrast, geolocation errors could be more remarkable between lines. This simplification helps reduce the complexity in searching for the nearest neighbor pixels (see below).
With the offsets ( Δ l ( l ) , Δ c ( l ) ) estimated, the corrected line/column coordinates ( l * , c * ) of a pixel (l, c) in the L1b image are thus:
l * ( l , c ) c * ( l , c ) = l c + Δ l ( l ) Δ c ( l ) .
The goal of the nearest neighbor resampling algorithm is then to find the pair of ( l * , c * ) that best matches with the coordinates ( l g , c g ) from Equation (4), i.e.,
( l , c ) = arg min ( l , c ) ( l * ( l , c ) l g ) 2 + ( c * ( l , c ) c g ) 2 .
This can be easily accomplished because we only need to search for l in the neighborhood of ( l g , c g ). Then, c can be accurately estimated as c g Δ c ( l ) , where “ · ” is the nearest integer function.
Because the above algorithm depends on the use of satellite images from a reflective band (e.g., the red band), currently, we apply the corrections only to daytime data. Research is still needed to check and correct potential geolocation errors in the nighttime data (emissive thermal infrared bands) in the future.

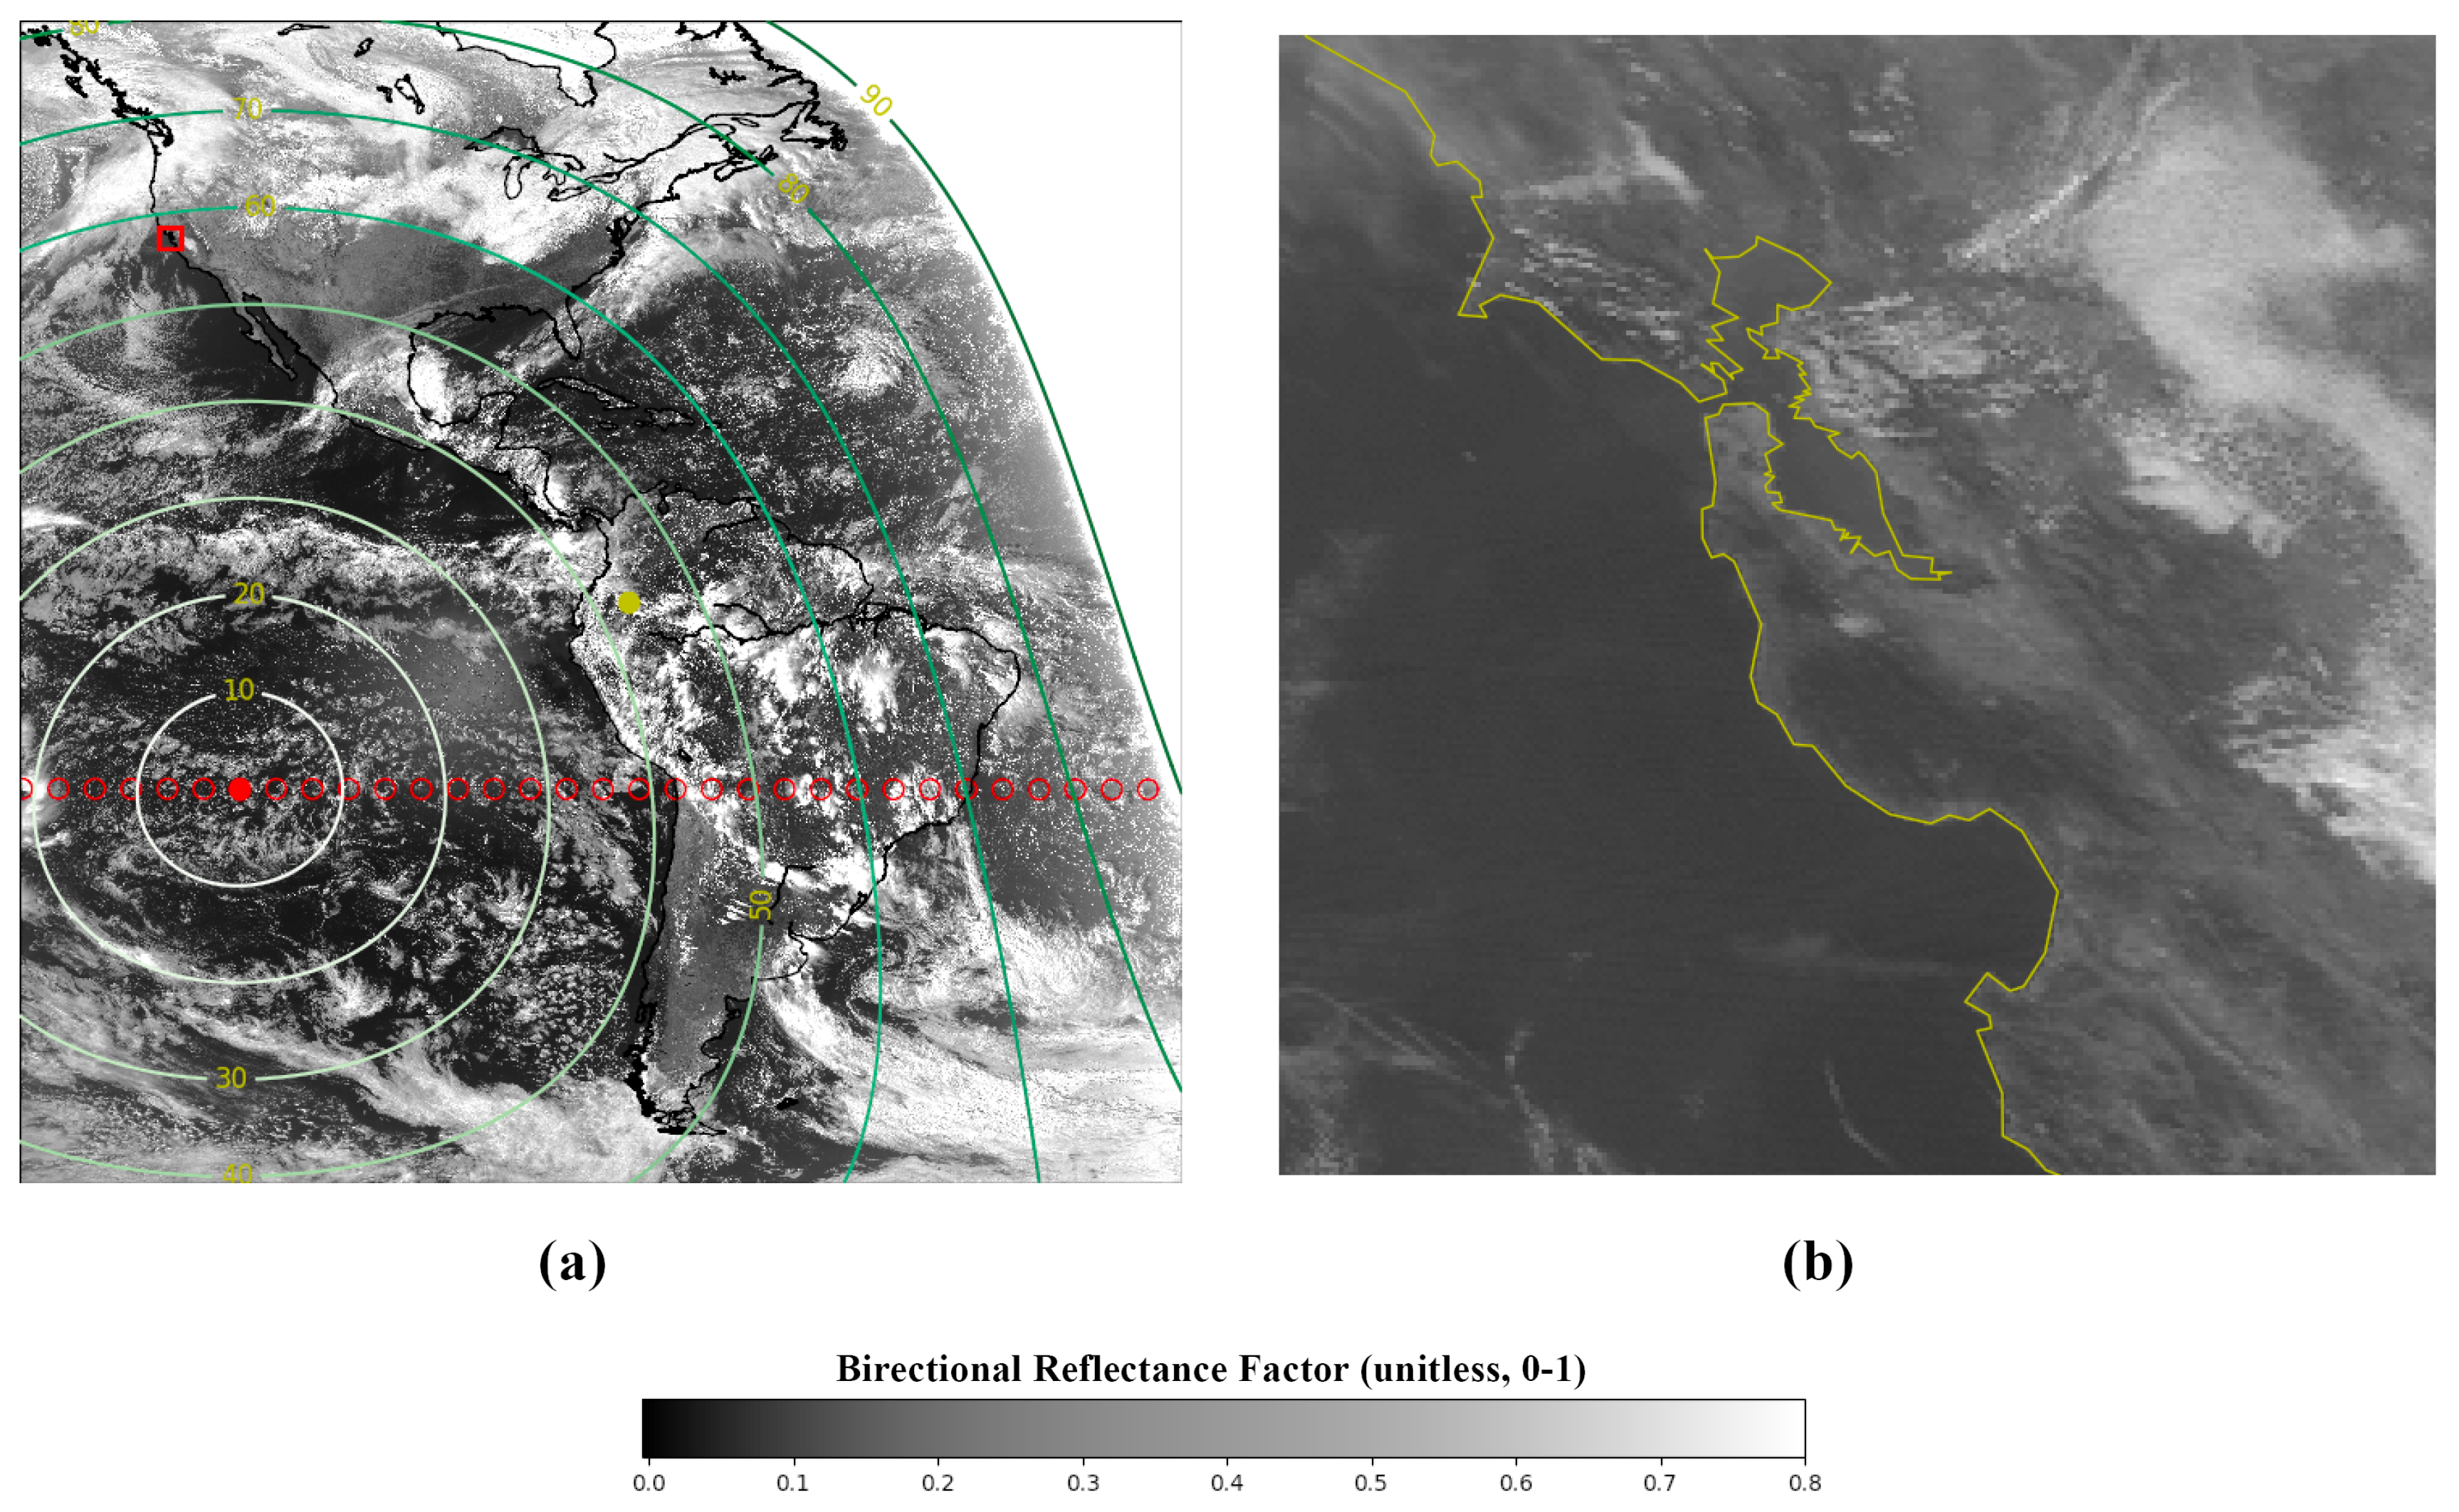
2.6. Orthorectification for Topographic Relief

To our knowledge, neither ABI nor AHI L1b data are corrected for terrain relief. Therefore, we implemented a simple orthorectification algorithm [37,38] to correct the data to the first order. We used the SRTM DEM as the input and used the map-projection algorithm described earlier to calculate the pixel offsets resulting from elevation variations. These offsets were then used to further correct the geolocation of pixels through the same procedure as described in the preceding subsection.

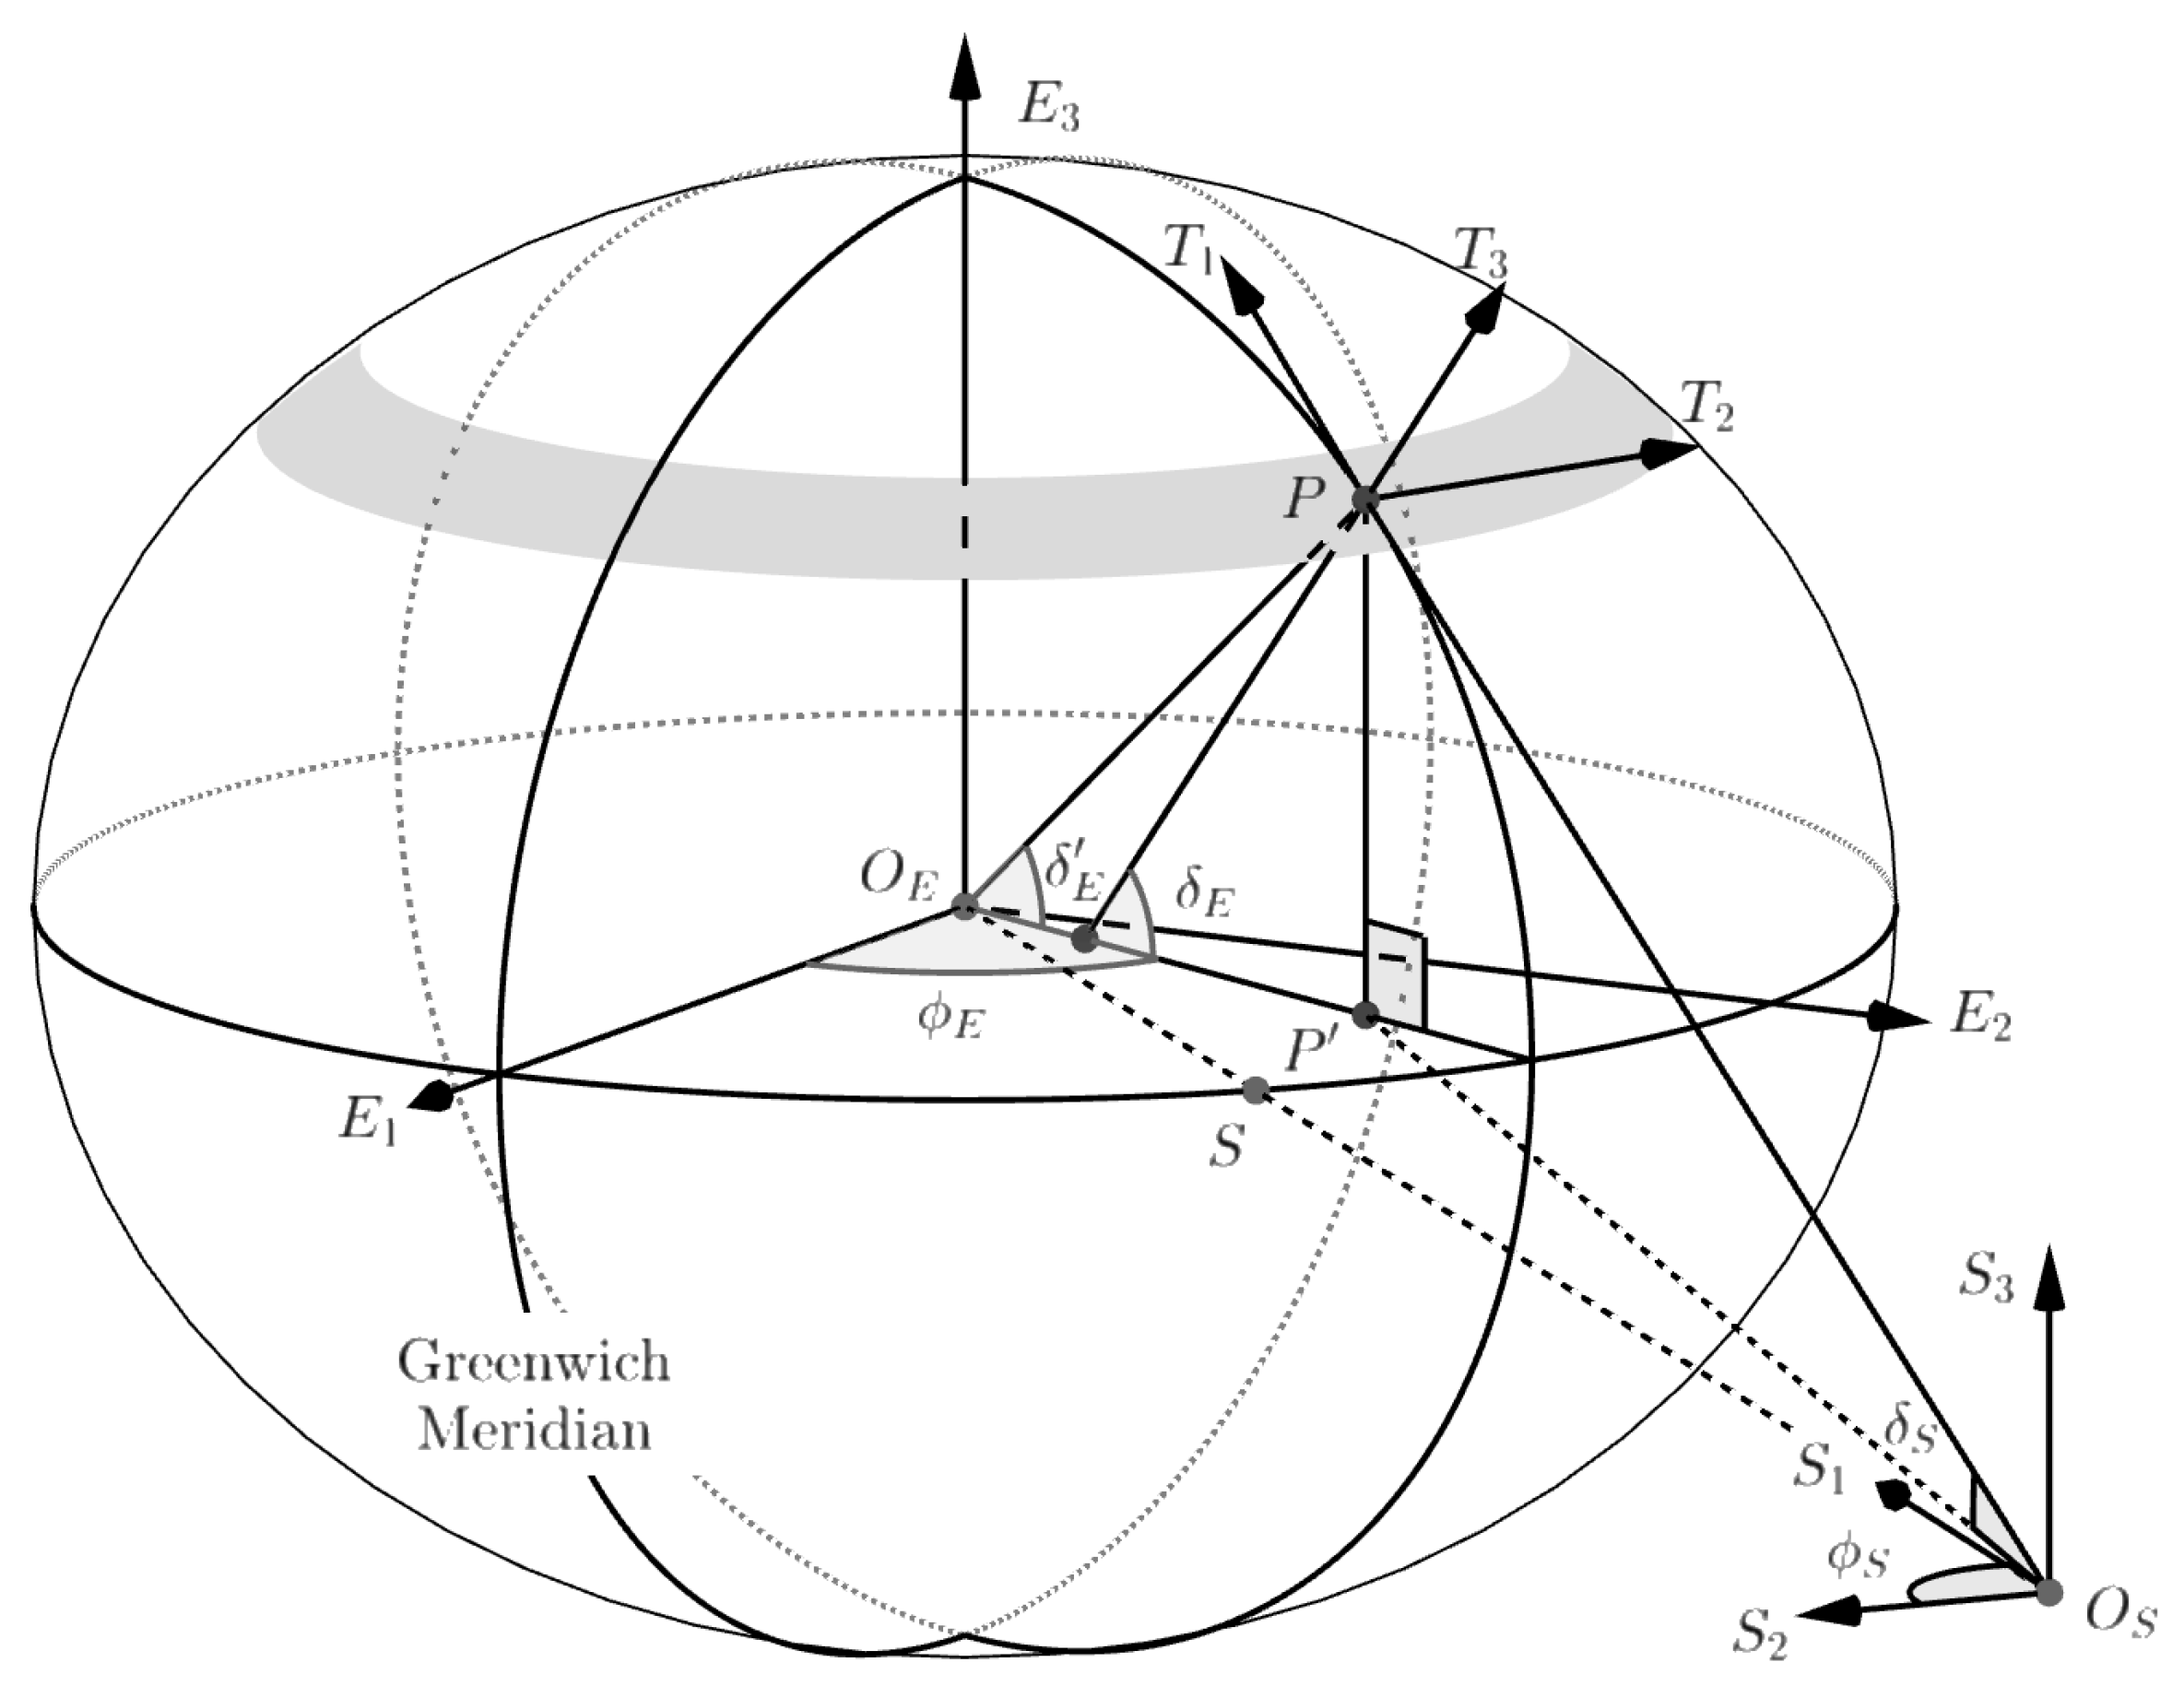
2.7. Satellite and Sun Angles

For a location (P) on the surface of the Earth (Figure 4), Sun illumination and satellite view angles are defined related to the horizon reference system represented by the axes ( T 1 , T 2 , T 3 ). Such a reference system is referred to as the topocentric coordinates and is distinct from the geocentric coordinates ( E 1 , E 2 , E 3 ) that are relative to the center of the Earth (Figure 4). Following the convention in the remote sensing literature, the zenith angle in the topocentric reference system is defined relative to the local geodetic normal ( T 3 ). The azimuth angle is defined related to local north ( T 1 ) and increases clockwise.
With the assumption that a geostationary satellite is located at a fixed point above Earth’s Equator, its zenith and azimuth angles relative to the location P can be conveniently calculated with ellipsoidal geodesy [39]. Briefly speaking, the algorithm first calculates the position vector of the satellite ( O E O S ) and the observation location ( O E P ) in the geocentric coordinate system. It then calculates the position vector of the satellite relative to the observation location ( P O S ) in the geocentric system. The last step is just to rotate the vector P O S from the geocentric system to the topocentric system and calculate the zenith and the azimuth angles from the Cartesian coordinates. The details of the algorithm can be found in [39].
The calculation of Sun angles is conceptually similar to the above, but more difficult. The complexity comes from the fact that the Sun-Earth position is constantly changing and the Earth is rotating. Therefore, in order to calculate the Sun’s position accurately in the local topocentric coordinates, we have to account for: (1) Earth’s orbital position relative to the Sun, (2) Earth’s rotation around its axis, (3) the precession and the nutation of Earth’s rotation axis, and (4) the effects of light aberration and the refraction of Earth’s atmosphere. A classic procedure to calculate the above elements is developed from the Variations Sèculaires des Orbites Planètaires Theory (VSOP87) [40] and summarized in the Solar Position Algorithm (SPA) [41]. In our processing, we implemented a revised version of the SPA algorithm, the SG2 (Solar Geometry 2) algorithm [42], to calculate the local solar position efficiently to a theoretic accuracy of 10 arc seconds (<0.005). Source codes of both SPA and SG2 algorithms are publicly available online (e.g., https://rredc.nrel.gov/solar/codesandalgorithms/spa/; http://www.oie.mines-paristech.fr/Valorisation/Outils/Solar-Geometry/).

2.8. Pixelwise Data Acquisition Time

An important source of uncertainties of the Sun position comes from the determination of the acquisition time for each pixel in an image. Neither ABI nor AHI L1b products provide the pixelwise time information. The AHI HSD files include the mean observation time for each scan (swath) of the full disk. Because the duration of the scans, estimated from the representative AHI scan timelines [28], ranges from 8 to 17 s, the direct use of the center time implies an uncertainty of 4 to 8 s. The situation is more challenging for ABI because the ABI L1b products provide only the scan start and end times for each data file, with the duration ranging from 5 min (Scan Mode 4) to 15 min (Scan Mode 3). Therefore, the direct use of the mean image observation time can introduce an uncertainty as high as 10 min at the pixel level under Scan Mode 3 of ABI, which was the default operation mode until 2 April 2019 (https://www.goes-r.gov/users/abiScanModeInfo.html).
We addressed this problem by using information from the scan timeline tables (“playlist”) of ABI and AHI, which contain the timing of the start and the end of each swath scan relative to the beginning of the full disk scan. We assumed that the west-east scanning rate of the instrument was constant and estimated the rate by the the ratio between the time duration of the center swath (the one closest to the Equator) and the number of pixels (per row) in the swath. For AHI, with the mean scan time given, we could easily apply the scanning rate to calculate the acquisition time for each pixel based on its offset from the center of the line. For ABI, an additional step was implemented to determine the swath number for each line of the full disk image. This was based on the estimation that the angular width of each swath was 14214 μ rad and the angular size of each (500 m) pixel was 14 μ rad. We used the central line as the starting point to calculate the swath boundaries northwards and southwards, respectively, as the scan lines were expected to be symmetric regarding the Equator (Tan, personal communication). As such, we reduced the uncertainties of the pixelwise data acquisition time to 1 s for most pixels in the image. Yet, as described earlier, the grid definition of ABI is rotated by 90from its physical scan mode, and thus, its scan lines do not necessarily align with the image grid lines [7]. Therefore, we may still have relatively large uncertainties (10 s) at some pixels on the edge of the scan lines. Furthermore, we neglected the cross-band acquisition time offsets, which can be as large as 1 s (Carr, personal communication). Calculation indicated that time uncertainties at the order of 10 s had little influence on the calculated solar angles. Therefore, we considered these additional uncertainties as secondary and leave them to solve in the future.

3. Results

In this section, we present the results regarding geolocation correction, solar/satellite geometries, and the angular dependencies of TOA reflectances. We will leave the intercomparisons of BRFs between the GEO (e.g., ABI/AHI) and LEO sensors (e.g., MODIS) for a separate paper [20].
Figure 5 shows an example of geolocation errors detected in ABI L1b data on 23 January 2018, 19:45 UTC, where the Band 2 (500 m) image was found to be shifted westwards by 2 pixels and northward by 1 pixel across the domain (Figure 5a). Such large geolocation errors can be easily recognized from a close-up view of the image, where it is apparent that the image of San Francisco Bay does not overlap with the reference coastlines (Figure 5b).
The geolocation error shown in Figure 5 is rather exceptional in the data records of GOES 16 ABI. Figure 6 shows time series of the line-by-line geolocation errors of ABI (Band 2) as a two-dimensional spatial-temporal diagram for the entire month of January 2018. For most of time and at most latitudes, the residual geolocation errors of ABI full disk images were well under ± 0.5 pixels (Figure 6). Indeed, the remarkable geolocation errors of Figure 5 lasted only for 30 min (or two time steps) before they totally disappeared. This rare incident turned out to be caused by a transient hardware issue of the onboard gyro and was quickly resolved by the operation team (Tan, personal communication). Nevertheless, the detection of a such an unusual incident illustrates the efficacy of our method in automatically capturing and correcting geolocation anomalies overlooked by the operational algorithms.
Figure 7 and Figure 8 show corresponding examples of geolocation errors from Himawari-8 AHI L1b data. In particular, Figure 7 shows the errors detected on 2 May 2018, 02:00 UTC. Compared to the reference data, the full disk image is shifted westward by 1 pixel in the low/mid-latitudes, where it is also slightly shifted southward (Figure 7a). Though not as remarkable as the example of Figure 5, these errors are also discernible in the close-up views (Figure 7b). Compared with those GOES16 ABI, the geolocation errors in Himawari-8 AHI L1b data appeared to be much more common (Figure 8). Anomalies with a magnitude of 1 pixel were almost found on a daily basis in May, 2018 (Figure 8) and other time periods (not shown). These residual errors appeared to be more remarkable in the west-east direction, a pattern being previously reported in the literature [28].
The different geolocation accuracy between GOES-16 ABI and Himawari-8 AHI L1b data may reflect the differences between their navigation systems. GOES-16/ABI uses star observations made through the foresight of the telescope, as well as other sensor parameters to determine the line-of-sight and thermal drift for image navigation and registration [43], whereas the Himawari-8/AHI approach is mainly based on matching landmarks [5]. In particular, GOES-16 has been equipped with a special Global Positioning System Receiver that is capable of delivering more accurate satellite navigation information to the flight control software, as well as the data georegistration algorithms [44], which help the satellite to achieve higher georegistration accuracy over Himawari 8. In either case, the results presented in Figure 5, Figure 6, Figure 7 and Figure 8 indicate that residual geolocation errors may be left in the L1b data and thus emphasize the necessity of implementing an additional geolocation correction component in our processing chain.
The GeoNEX processing chain takes the L1b radiance data such as shown in Figure 5 and Figure 7 to generate TOA BRFs. Figure 9 and Figure 10 show the corresponding results of GOES-16 ABI on 23 January 2018, 19:45 UTC, and of Himawari-8 AHI on 1 May 2018, 23:50 UTC, respectively. Compared with Figure 5 and Figure 7, these results showed that our algorithm successfully removed the residual geolocation errors in the input data and correctly reprojected them onto the common geographic grid (Figure 9 and Figure 10). For instance, the discrepancies between the satellite data and the reference coastlines in the zoomed-in views of San Francisco Bay (Figure 5b) and the La Grange Bay (Figure 7b) largely diminished (Figure 9b and Figure 10b).
Because solar illumination angles are key in calculating BRF, Figure 9 and Figure 10 also show contour maps of the solar zenith angles calculated for each pixel at its acquisition time around 1 January 2018, 19:45 UTC (GOES-16) and 2 May 2018, 02:00 UTC (Himawari-8), respectively. It is apparent that the solar zenith angles were close to 0 over pixels directly under the Sun and increased towards 90 over pixels located away from the solar subpoint. Pixels with zenith angles higher than 90 cannot be illuminated by the Sun and, thus, were masked out from the image. Note that the contours should be circular on a sphere, but were distorted by the geographic projection, which is not conformal in nature. They were particularly stretched in the west-east dimension at higher latitudes and influenced by the seasonal latitudinal changes of solar subpoints between the Northern and the Southern Hemispheres (Figure 9 and Figure 10). On a daily basis, however, the shapes of the contours changed little and could be thought to move with the solar subpoints across the domain. Therefore, Figure 9 and Figure 10 may help us visualize how the solar zenith (and azimuth) angle varied every 10–15 min at every pixel in the domain. They may also help us locate Sun glint, which occurs between the subpoints of the Sun and the geostationary satellites (Figure 9 and Figure 10).
Illustrated in Figure 9 and Figure 10, view angles of a given geostationary satellite are fixed at each pixel in the domain, while the solar illumination angles change at every time step. BRFs measured at different solar angles thus provide samples of the (TOA) Bidirectional Reflectance Distribution Function (BRDF) at each pixel under specific view angles. Figure 11 shows an example of such angular distributions of BRFs over a vegetated site in the Kakadu National Park in northern Australia. The data were compiled over the first week of May 2018, with the assumption that the surface reflectance properties did not significantly change during the period. The angular distribution of the BRFs showed a clear trajectory, illustrating sub-hourly variations of the TOA reflectances as the relative azimuth angles changed from 45 in the morning to 95 in the evening and the solar zenith angles varied between 30 around noon and 80 in the morning and the evening (Figure 11).
In general, variations of BRF were relatively small in the midday as compared to early morning or late afternoon. Yet, different spectral bands also showed distinct responses to the solar angle changes. BRFs of the blue (Band 1) and the green (Band 2) bands appeared to be more sensitive to changes in solar zenith angles and increased rapidly as the latter grew above 60 . In comparison, the sensitivities of the red (Band 3) and the NIR (Band 4) were more subdued with the increases in solar zenith angles (Figure 11). These patterns partially reflected the responses of sunlight to Rayleigh scattering in the atmosphere, as well as the spectral characteristics of surface reflectances. For instance, vegetated surfaces generally have a low ( 5 % ) reflectance in the blue band, while sunlight is more strongly ( 20 % ) scattered in this spectral range due to its shorter wavelength. Therefore, the increases of BRFs in the blue (and the green) bands with large solar zenith angles were mainly contributed by the enhanced scattering in the atmosphere (i.e., the path radiance). In contrast, vegetation has high (>30%) reflectance in the NIR band, where the Rayleigh scattering is low (<2%) in the atmosphere. Therefore, the NIR BRFs shown in Figure 11 were much less sensitive to changes in solar zenith angles. We recognize that other factors could contribute to the TOA BRDF behaviors, which are the central topic of the atmospheric correction algorithm for the GeoNEX data and will be discussed in a separate paper.
Finally, it is interesting to notice different BRDF effects from geostationary satellites that have overlapping spatial coverage (e.g., GOES16 and GOES17, Himawari-8, and GEO-KOMPSAT-2A). Figure 12 shows a pair of concurrent images acquired by GOES16 and GOES17 over most of the Conterminous U.S. and Central America at 17:00 UTC on 1 February 2019. Corresponding pixels in the two images were scanned at about the same time and thus featured the same solar angles, but different view angles. At 17:00 UTC, the longitude of the Sun (subpoint) largely coincided with GOES16 (East). As the sensor viewed the surface from the illumination direction, its image appeared to be “flat” (Figure 12). In comparison, GOES17 viewed the surface away from the principal plane and saw more shadows of clouds and surface features, and the image appeared to have more depth (Figure 12). The contrast between the images of GOES16 and GOES17 changeD as the position of the Sun changed. For instance, in four hours (21:00 UTC), the Sun will move to the longitude of GOES17, and its view will become “flat”, while that of GOES16 becomes richer in depth (not shown). Such stereo views of GOES east and GOES west have been used by the meteorological community to study atmospheric processes like cloud dynamics [45]. We believe that, with careful radiometric and geometric calibrations, they also provide valuable information for the purposes of Earth surface monitoring. This point further justifies our approach in producing a globally unified and consistent set of GeoNEX TOA products.

4. Conclusions

This paper introduced the main tasks and algorithms in processing GeoNEX TOA products from a global constellation of geostationary satellite sensors. The goal of the GeoNEX project is to exploit the capability of the new-generation geostationary sensors in improving current Earth monitoring products from polar orbiting sensors. We focused on building a processing pipeline to generate high-quality science products from geostationary data that were complementary to existing EOS datasets. TOA products are the first and a key step in the pipeline, which deserve special attention as they can have important impacts on all the downstream datasets.
We focused on three main tasks in generating the TOA products. The first was to convert the input L1b DN values to TOA radiance and brightness temperature with the latest radiometric calibration information and check for possible transient anomalies or long-term trends. Because the radiometric calibration performance of the satellite sensors is monitored by their operational science teams [23], we adopted vicarious approaches to evaluate the calculated radiance and brightness temperature, for instance, by comparing them to the corresponding observations from polar orbiting sensors. Due to the differences in the Sun-target-satellite geometry, GEO-LEO data intercomparisons were not straightforward. New methods for conducting such comparisons are still in development [46] and will be adopted into our processing as they become available.
The second key task was to detect and correct residual geolocation errors in the input data before reprojecting them onto the GeoNEX tiled grid. We accomplished this task by implementing a phase correlation-based algorithm. The reference landmarks used in the algorithm were generated from the SRTM-GL1 (global 1 arc second, or 30 m) DEM data. Our method detected geolocation errors in the L1b data files of both GOES16 ABI and Himawari-8 AHI, which showed different temporal-spatial patterns. The identified residual geolocation errors appeared more common in AHI data than those of ABI, partially reflecting the hardware differences between the two satellites. We expected similar residual geolocation errors to exist in the L1b data of other geostationary sensors (e.g., AMI, AGRI, etc.), which justified the additional geocorrection component in our processing chain. We recognize that the cross-band geolocation errors are neglected in the current version of GeoNEX products, which need to be addressed in the future.
The last, but important, task was to calculate the corresponding solar angles accurately for each pixel in the domain at every time step. Because neither NOAA nor JMA provides pixelwise time information in the L1b data files, we implemented an algorithm to estimate the information from the scan timeline tables of the instruments’ operation modes. We also assumed the (west-east) swath scanning rate to be largely constant and therefore estimated this rate as the ratio between the time duration of the central swath (the one closest to the Equator) and the number of pixels per line in the swath. These estimates allowed us to calculate the pixelwise acquisition time to the accuracy of a couple of seconds, sufficiently precise for the follow-up calculations. We then used the time and the geolocation information to calculate the corresponding solar angles accurately with the SG2 solar position algorithm.
With the above processing, the GeoNEX TOA products provided radiometrically calibrated BRFs (reflective bands), brightness temperatures (emissive bands), and pixelwise Sun angles at every time step, all of which were correctly registered to the common tiled grid in the geographic projection. As such, these datasets may find applications in many research fields and/or practical exercises. For instance, they could be conveniently stacked in spatial-temporal analyses to exploit the characteristic high temporal resolutions of the geostationary observations, or compiled according to the Sun-target-satellite geometries to investigate surface BRDF properties. Moreover, information contained in these data could help us retrieve various important parameters of the atmosphere and the surface, which is the central task of atmospheric correction, the next key step in our processing chain.

Author Contributions

W.W., S.L., and H.H. are the leading scientists on the GeoNEX project at NASA Ames Research Center. H.T. and A.H. are the leading scientists on the GeoNEX project at Chiba University, S.K. is the lead NOAA scientist for the GOES-R Product Generation System development. R.N. is the Principal Investigator of NASA Earth Exchange (NEX) and the leader of the GeoNEX effort. All authors have read and agreed to the published version of the manuscript.

Funding

W.W., S.L., H.H., and R.N. are supported by the National Aeronautics and Space Administration (NASA) under grants to NASA Earth Exchange (NEX). H.T. and A.H. are partially supported by the JST/CREST/EMS/TEEDDA fund JPMJCR15K4 (Japan) and funds from the Virtual Laboratory/Ministry of Education, Culture, Sports, Science, and Technology (Japan).

Acknowledgments

The authors are thankful to Bin Tan and Robert Wolfe of NASA Goddard Space Flight Center for insightful discussions on navigation and georegistration of GOES16/17 data. We appreciate James Carr of Carr Astronautics for help with pixelwise acquisition time computation for GOES ABI data.

Conflicts of Interest

The authors declare no conflict of interest.

References

  1. National Research Council (NRC). Earth Observations from Space: The First 50 Years of Scientific Achievements; The National Academies Press: Washington, DC, USA, 2008; p. 142. [Google Scholar]
  2. National Academies of Sciences, Engineering, and Medicine. Thriving on Our Changing Planet: A Decadal Strategy for Earth Observation from Space; National Academies Press: Washington, DC, USA, 2018. [Google Scholar]
  3. Fensholt, R.S.I.; Stisen, S.; Tucker, C. Analysing NDVI for the African continent using the geostationary meteosat second generation SEVIRI sensor. Remote Sens. Environ. 2006, 101, 212–229. [Google Scholar] [CrossRef]
  4. Fensholt, R.; Anyamba, A.; Huber, S.; Proud, S.; Tucker, C.; Small, J.; Pak, E.; Rasmussen, M.S.I.; Shisanya, C. Analysing the advantages of high temporal resolution geostationary MSG SEVIRI data compared to Polar Operational Environmental Satellite data for land surface monitoring in Africa. Int. J. Appl. Earth Obs. Geoinf. 2011, 13, 721–729. [Google Scholar] [CrossRef]
  5. Bessho, K.; Date, K.; Hayashi, M.; Ikeda, A.; Imai, T.; Inoue, H.; Kumagai, Y.; Miyakawa, T.; Murata, H.; Ohno, T.; et al. An Introduction to Himawari-8/9—Japan’s New-Generation Geostationary Meteorological Satellites. J. Meteorol. Soc. Jpn. Ser. 2016, 94, 151–183. [Google Scholar] [CrossRef] [Green Version]
  6. Schmit, T.; Griffith, P.; Gunshor, M.; Daniels, J.; Goodman, S.; Lebair, W. A Closer Look at the ABI on the GOES-R Series. Bull. Am. Meteorol. Soc. 2017, 98, 681–698. [Google Scholar] [CrossRef]
  7. Kalluri, S.; Alcala, C.; Carr, J.; Griffith, P.; Lebair, W.; Lindsey, D.; Race, R.; Wu, X.; Zierk, S. From Photons to Pixels: Processing Data from the Advanced Baseline Imager. Remote Sens. 2018, 10, 177. [Google Scholar] [CrossRef] [Green Version]
  8. Yang, J.; Zhang, Z.; Wei, C.; Lu, F.; Guo, Q. Introducing the New Generation of Chinese Geostationary Weather Satellites, Fengyun-4. Bull. Am. Meteorol. Soc. 2017, 98, 1637–1658. [Google Scholar] [CrossRef]
  9. Lee, S.; Ahn, M.; Chung, S. Atmospheric Profile Retrieval Algorithm for Next Generation Geostationary Satellite of Korea and Its Application to the Advanced Himawari Imager. Remote Sens. 2017, 9, 1294. [Google Scholar] [CrossRef] [Green Version]
  10. Durand, Y.; Hallibert, P.; Wilson, M.; Lekouara, M.; Grabarnik, S.; Aminou, D.; Blythe, P.; Napierala, B.; Canaud, J.; Pigouche, O.; et al. The flexible combined imager onboard MTG: From design to calibration. In Proceedings of the SPIE 9639, Sensors, Systems, and Next-Generation Satellites XIX, Toulouse, France, 21–24 September 2015; p. 963903. [Google Scholar]
  11. Myneni, R.; Yang, W.; Nemani, R.; Huete, A.; Dickinson, R.; Knyazikhin, Y.; Didan, K.; Fu, R.; Juárez, R.I.N.; Saatchi, S.S.; et al. Large seasonal swings in leaf area of Amazon rainforests. Proc. Natl. Acad. Sci. USA 2007, 104, 4820–4823. [Google Scholar] [CrossRef] [Green Version]
  12. Saleska, S.; Didan, K.; Huete, A.; Darocha, H. Amazon Forests Green-Up During 2005 Drought. Science 2007, 318, 612. [Google Scholar] [CrossRef] [Green Version]
  13. Samanta, A.; Ganguly, S.; Hashimoto, H.; Devadiga, S.; Vermote, E.; Knyazikhin, Y.; Nemani, R.; Myneni, R. Amazon forests did not green-up during the 2005 drought. Geophys. Res. Lett. 2010, 37, 5. [Google Scholar] [CrossRef]
  14. Morton, D.; Nagol, J.; Carabajal, C.; Rosette, J.; Palace, M.; Cook, B.; Vermote, E.; Harding, D.; North, P. Amazon forests maintain consistent canopy structure and greenness during the dry season. Nature 2014, 506, 211–214. [Google Scholar] [CrossRef] [PubMed]
  15. Bi, J.; Knyazikhin, Y.; Choi, S.; Park, T.; Barichivich, J.; Ciais, P.; Fu, R.; Ganguly, S.; Hall, F.; Hilker, T.; et al. Sunlight mediated seasonality in canopy structure and photosynthetic activity of Amazonian rainforests. Environ. Res. Lett. 2015, 10, 064014. [Google Scholar] [CrossRef] [Green Version]
  16. Doughty, R.; Köhler, P.; Frankenberg, C.; Magney, T.; Xiao, X.; Qin, Y.; Wu, X.; Moore, B. TROPOMI reveals dry-season increase of solar-induced chlorophyll fluorescence in the Amazon forest. Proc. Natl. Acad. Sci. USA 2019, 116, 22393–22398. [Google Scholar] [CrossRef] [PubMed]
  17. Hashimoto, H.; Wang, W.; Dungan, J.L.; Li, S.; Takenaka, H.; Higuchi, A.; Myneni, R.B.; Nemani, R.R. GOES ABI high-frequent observation proved the basin-wide existence of the seasonality in greeness of the Amazon evergreen forest. Nat. Commun. 2020. in review. [Google Scholar]
  18. Martonchik, J.; Bruegge, C.; Strahler, A. A review of reflectance nomenclature used in remote sensing. Remote Sens. Rev. 2000, 19, 9–20. [Google Scholar] [CrossRef]
  19. Nemani, R.; Votava, P.; Michaelis, A.; Melton, F.; Milesi, C. Collaborative Supercomputing for Global Change Science. Eos, Trans. Am. Geophys. Union 2011, 92, 109–110. [Google Scholar] [CrossRef]
  20. Li, S.; Wang, W.; Hashimoto, H.; Xiong, J.V.; Val, T.; Yao, J.; Qian, L.; Ichii, K.; Wang, Y.; Lyapustin, A.; et al. First provisional land surface reflectance product from geostationary satellite Himawari-8 AHI. Remote Sens. 2019, 11, 2990. [Google Scholar] [CrossRef] [Green Version]
  21. Okuyama, A.; Takahashi, M.; Date, K.; Hosaka, K.; Murata, H.; Tabata, T.; Yoshino, R. Validation of Himawari-8/AHI Radiometric Calibration Based on Two Years of In-Orbit Data. J. Meteorol. Soc. Jpn. Ser. II 2018, 96B, 91–109. [Google Scholar] [CrossRef] [Green Version]
  22. Datla, R.; Shao, X.; Cao, C.; Wu, X. Comparison of the Calibration Algorithms and SI Traceability of MODIS, VIIRS, GOES, and GOES-R ABI Sensors. Remote Sens. 2016, 8, 126. [Google Scholar] [CrossRef] [Green Version]
  23. Yu, F.; Wu, X. Radiometric Inter-Calibration between Himawari-8 AHI and S-NPP VIIRS for the Solar Reflective Bands. Remote Sens. 2016, 8, 165. [Google Scholar] [CrossRef] [Green Version]
  24. Chang, T.; Xiong, X.; Keller, G.; Wu, X. GEO-LEO reflective band intercomparison with bidiretional reflectance distribution function and atmospheric scattering corrections. J. Appl. Remote Sens. 2018, 12, 014002. [Google Scholar] [CrossRef]
  25. Qin, Y.; Mcvicar, T. Spectral band unification and inter-calibration of Himawari AHI with MODIS and VIIRS: Constructing virtual dual-view remote sensors from geostationary and low-Earth-orbiting sensors. Remote Sens. Environ. 2018, 209, 540–550. [Google Scholar] [CrossRef]
  26. Coordination Group for Meteorological Satellites (CGMS). Coordination Group for Meteorological Satellites: LRIT/HRIT Global Specification; CGMS: Darmstadt, Germany, 2013; p. 54. [Google Scholar]
  27. Harris Corporation Space and Intelligence Systems. Product Definition and Users’ Guide (PUG), Volume 3: Level1B Products for GOES-R Series Core Ground Segment (Revision-E); Harris Corporation: Melbourne, FL, USA, 2017. [Google Scholar]
  28. Okuyama, A.; Andou, A.; Date, K.; Hoasaka, K.; Mori, N.; Murata, H.; Tabata, T.; Takahashi, M.; Yoshino, R.; Bessho, K. Preliminary Validation of Himawari-8/AHI Navigation and Calibration; SPIE: Bellingham, WA, USA, 2015. [Google Scholar]
  29. Tan, B.; Dellomo, J.; Wolfe, R.; Reth, A. GOES-16 ABI Navigation Assessment; SPIE: Bellingham, WA, USA, 2018. [Google Scholar]
  30. Foroosh, H.; Zerubia, J.; Berthod, M. Extension of phase correlation to subpixel registration. IEEE Trans. Image Process. 2002, 11, 188–200. [Google Scholar] [CrossRef] [Green Version]
  31. Zitová, B.; Flusser, J. Image registration methods: A survey. Image Vis. Comput. 2003, 21, 977–1000. [Google Scholar] [CrossRef] [Green Version]
  32. Skakun, S.; Roger, J.; Vermote, E.; Masek, J.; Justice, C. Automatic sub-pixel co-registration of Landsat-8 Operational Land Imager and Sentinel-2A Multi-Spectral Instrument images using phase correlation and machine learning based mapping. Int. J. Digit. Earth 2017, 10, 1253–1269. [Google Scholar] [CrossRef]
  33. Guizar-sicairos, M.; Thurman, S.; Fienup, J. Efficient subpixel image registration algorithms. Opt. Lett. 2008, 33, 156–158. [Google Scholar] [CrossRef] [Green Version]
  34. Rodríguez, E.; Morris, C.; Belz, J. A Global Assessment of the SRTM Performance. Photogramm. Eng. Remote Sens. 2006, 72, 249–260. [Google Scholar] [CrossRef] [Green Version]
  35. Farr, T.; Rosen, P.; Caro, E.; Crippen, R.; Duren, R.; Hensley, S.; Kobrick, M.; Paller, M.; Rodriguez, E.; Roth, L.; et al. The Shuttle Radar Topography Mission. Rev. Geophys. 2007, 45, 2. [Google Scholar] [CrossRef] [Green Version]
  36. Satge, F.; Denezine, M.; Pillco, R.; Timouk, F.; Pinel, S.; Molina, J.; Garnier, J.; Seyler, F.; Bonnet, M. Absolute and relative height-pixel accuracy of SRTM-GL1 over the South American Andean Plateau. ISPRS J. Photogramm. Remote Sens. 2016, 121, 157–166. [Google Scholar] [CrossRef]
  37. Toutin, T. Review article: Geometric processing of remote sensing images: Models, algorithms and methods. Int. J. Remote Sens. 2004, 25, 1893–1924. [Google Scholar] [CrossRef]
  38. Tucker, C.J.; Grant, D.M.; Dykstra, J.D. NASA’s Global Orthorectified Landsat Data Set. Photogramm. Eng. Remote Sens. 2004, 70, 313–322. [Google Scholar] [CrossRef] [Green Version]
  39. Soler, T.; Eisemann, D. Determination of Look Angles to Geostationary Communication Satellites. J. Surv. Eng. 1994, 120, 115–127. [Google Scholar] [CrossRef] [Green Version]
  40. Bretagnon, P.; Francou, G. Planetary Theories in rectangular and spherical variables: VSOP87 solution. Astron. Astrophys. 1988, 202, 309. [Google Scholar]
  41. Reda, I.; Andreas, A. Solar Position Algorithm for Solar Radiation Applications (Revised); U.S. Department of Energy: Washington, DC, USA, 2008.
  42. Blanc, P.; Wald, L. The SG2 algorithm for a fast and accurate computation of the position of the Sun for multi-decadal time period. Sol. Energy 2012, 86, 3072–3083. [Google Scholar] [CrossRef] [Green Version]
  43. Igly, D.A.; Virgilio, V.N.; Gounder, K. Image Navigation and Registration For GOES-R Advanced Baseline Imager. In Proceedings of the 32nd AAS Guidance and Control Conference, Breckenridge, CO, USA, 30 January–4 February 2009. [Google Scholar]
  44. Winkler, S.; Ramsey, G.; Frey, C.; Chapel, J.; Chu, D.; Freesl, D.; Krimchansky, A.; Concha, M. GPS Receiver On-Orbit Performance for the GOES-R Spacecraft. In Proceedings of the 10th International ESA Conference on Guidance, Navigation & Control Systems, Salzburg, Austria, 29 May–2 June 2017. [Google Scholar]
  45. Hasler, A. Stereographic Observations from Geosynchronous Satellites: An Important New Tool for the Atmospheric Sciences. Bull. Am. Meteorol. Soc. 1981, 62, 194–212. [Google Scholar] [CrossRef] [Green Version]
  46. Adachi, Y.; Kikuchi, R.; Obata, K.; Yoshioka, H. Relative Azimuthal-Angle Matching (RAM): A Screening Method for GEO-LEO Reflectance Comparison in Middle Latitude Forests. Remote Sens. 2019, 11, 1095. [Google Scholar] [CrossRef] [Green Version]
Figure 1. Comparisons of spectral bands across third-generation geostationary sensors: ABI (Advanced Baseline Imager on GOESAHI (Advanced Himawari Imager on the Japanese Himawari 8/9), AMI (Advanced Meteorological Imager on the Korean GEO-KOMPSAT-2A), AGRI (Advanced Geosynchronous Radiation Imager on the Chinese Fengyun-4), and FCI (Flexible Combined Imager on European Meteosat Third Generation) with those of MODIS/VIIRS. The background thin lines show the atmospheric transmittance (for the reflective bands) and the atmospheric radiance of a typical mid-latitude summertime profile (for the emissive bands).
Remotesensing 12 01267 g001
Figure 2. Schematic diagram of the GeoNEX TOA (L1G) data processing pipeline. BRF, Bidirectional Reflectance Factor.
Remotesensing 12 01267 g002
Figure 3. Global tiled grid of GeoNEX products in the geographic projection. The color scheme indicates changes in spatial resolution due to satellite viewing geometry, with the finest (nadir) resolution being 1km. The third-generation geostationary satellites form a (quasi-)global constellation that effectively covers Earth’s surface from 60 N to 60 S. The thin blue lines indicate the 6 × 6 tiles, numbered horizontally from 0 to 59 and vertically from 0 to 19. MTG, MeteoSat Third Generation.
Remotesensing 12 01267 g003
Figure 4. Coordinates’ conversion between Earth and geostationary satellites. The axes ( E 1 , E 2 , E 3 ) define a geocentric Cartesian coordinate system with E 1 passing through the Greenwich Meridian. The pair ( δ E , ϕ E ) indicates the geographic latitude/longitude coordinates of a point P on Earth’s surface, while δ E indicates the corresponding geocentric latitude. The axes ( T 1 , T 2 , T 3 ) define the topocentric Cartesian system at P, with T 1 pointing to local north and T 3 pointing to the geodetic zenith. The idealized satellite sensor is located at O S , and the axes ( S 1 , S 2 , S 3 ) define a satellite-centered Cartesian system with S 1 pointing towards the center of Earth. As shown, the pair ( δ S , ϕ S ) denotes the elevation and the azimuth angles of P on the scanning plane. The sweep axis in this configuration (AHI) is “y”. In comparison, the elevation angle in the “x” sweep-axis configuration (ABI) is defined as the angle between the line O S P and the plane S 1 O s S 3 , while the azimuth angle is defined relative to S 3 in the plane S 1 O s S 3 . See the text for the details.
Remotesensing 12 01267 g004
Figure 5. Geolocation errors of GOES16 ABI L1b data on 23 January 2018, 19:45 UTC. Panel (a) shows the TOA spectral radiance of Band 2 ( 0.64 μ m) in the background, with the foreground yellow arrows indicating the geolocation error vectors ( Δ l , Δ c ) at different lines of the full disk image. The scales of the arrows are shown in the right-lower corner. Panel (b) shows an enlarged image of the zoomed-in area (i.e., San Francisco Bay) marked by the red rectangle in Panel (a).
Remotesensing 12 01267 g005
Figure 6. Spatial-temporal plots of the geolocation errors of GOES16 ABI L1b data from 1 January 2018, 00:00 UTC to 31 January 2018, 23:45 UTC. The top and bottom panels show the errors in the west-east direction ( Δ c ) and the north-south direction ( Δ l ), respectively. In either panel, the vertical axis indicates the line numbers of the full disk image, increasing from the top to the bottom. The horizontal axis represents the time dimension at a 15 min resolution. The color scheme indicates the geolocation errors in units of pixels. Nighttime data (with regard to the center of the image) are masked out in white. The geolocation errors are calculated based on the Band 2 ( 0.64 μ m) TOA spectral radiance.
Remotesensing 12 01267 g006
Figure 7. Same as Figure 5, but for Himawari-8 AHI on 2018/05/02, 02:00 UTC. The area marked by the red rectangle in Panel (a) and enlarged in Panel (b) is near the La Grange Bay of Western Australia. The 0.64 μ m channel is Band 3 on AHI.
Remotesensing 12 01267 g007
Figure 8. Same as Figure 6, but for Himawari-8 AHI from 1 May 2018, 00:00 UTC to 2018/05/01, 23:50 UTC, with a 10 min time resolution.
Remotesensing 12 01267 g008
Figure 9. TOA Bidirectional Reflectance Factor (BRF) of Band 2 of ABI on 2018/01/23, 19:45 UTC. The data were geocorrected and reprojected onto the GeoNEX common grid. Panel (a) shows the BRF over the 120 × 120 domain of GOES 16. The yellow circle indicates the subpoint of GOES 16. The solid red circle indicates the subpoint of the Sun at the nominal acquisition time (23 January 2018, 19:45 UTC), and the open red circles show the trace of the solar subpoints during the day at 15 min time steps. The green contour lines indicate the variation of solar zenith angles at an interval of 10 across the domain. Panel (b) shows an enlarged image of the area (San Francisco Bay) marked by the red rectangle in Panel (a).
Remotesensing 12 01267 g009
Figure 10. Same as Figure 9, but for Himawari-8 AHI (Band 3, 0.64 μ m) on 2 May 2018, 02:00 UTC. The trace of the solar subpoints (red circles) is calculated at 10 min time steps. The area marked by the red rectangle in Panel (a) and enlarged in Panel (b) is near the La Grange Bay of Western Australia.
Remotesensing 12 01267 g010
Figure 11. TOA BRFs of the first four bands of Himawari-8 AHI as functions of solar zenith and the relative azimuth angles in a 3D Cartesian coordinate system: (a) Band 1 (0.47 μ m), (b) Band 2 (0.51 μ m), (c) Band 3 (0.64 μ m), and (d) Band 4 (0.86 μ m). Data are compiled over a vegetated pixel located at ( 13.29 S, 132.65 E) in Kakadu National Park, Australia, from 1 May 2018 to 8 May 2018. Only BRF values with clear-sky and low-aerosol conditions are included in the example. The satellite view zenith and azimuth angles of the site are 17.8 and 29.4 , respectively. Solar relative azimuth angles are calculated as the difference between the solar and the satellite azimuth angles. Positive or negative relative azimuth angles indicate that the Sun is on the east or the west to the satellite, respectively.
Remotesensing 12 01267 g011
Figure 12. Concurrent TOA images of the Conterminous U.S. and Central America acquired by GOES16 and GOES17 at 17:00UTC on 1 February 2019. The pseudo true-color images are created based on TOA BRFs reprojected to the GeoNEX Common Grid, from Horizontal Tile 9 (126 W, left bound) to Tile 16 (78 W, right bound) and from Vertical Tile 1 (54 N, upper bound) to Tile 8 (6 N, lower bound). The longitude of the Sun is about 75 W at 17:00 UTC, outside the east boundary of the image. The subpoints of GOES16 and GOES17 can be found in Figure 3. The pseudo “green band” of the ABI instrument is generated from the red, the blue, and the near-infrared bands with linear weights of 0.483, 0.457, and 0.060, respectively. The thin gray lines indicate coastlines and the boundaries of the GeoNEX tiles.
Remotesensing 12 01267 g012

