
Modeling Gully Erosion Susceptibility to Evaluate Human Impact on a Local Landscape System in Tigray, Ethiopia


Physical Geography, Institute of Geographical Sciences, Freie Universität Berlin, Malteserstraße 74-100, 12449 Berlin, Germany
*
Author to whom correspondence should be addressed.
Remote Sens. 2021, 13(10), 2009; https://0-doi-org.brum.beds.ac.uk/10.3390/rs13102009
Submission received: 17 April 2021
/
Revised: 14 May 2021
/
Accepted: 15 May 2021
/
Published: 20 May 2021
(This article belongs to the Special Issue Quantifying Landscape Evolution and Erosion by Remote Sensing)
Abstract
:In recent years, modeling gully erosion susceptibility has become an increasingly popular approach for assessing the impact of different land degradation factors. However, different forms of human influence have so far not been identified in order to form an independent model. We investigate the spatial relation between gully erosion and distance to settlements and footpaths, as typical areas of human interaction, with the natural environment in rural African areas. Gullies are common features in the Ethiopian Highlands, where they often hinder agricultural productivity. Within a catchment in the north Ethiopian Highlands, 16 environmental and human-related variables are mapped and categorized. The resulting susceptibility to gully erosion is predicted by applying the Random Forest (RF) machine learning algorithm. Human-related and environmental factors are used to generate independent susceptibility models and form an additional inclusive model. The resulting models are compared and evaluated by applying a change detection technique. All models predict the locations of most gullies, while 28% of gully locations are exclusively predicted using human-related factors.

1. Introduction
Gullies are linear depressions of constant grade incised deeper than 0.3 m, resulting from the removal of soil and weathered bedrock by concentrated runoff [1,2]. Where gully erosion appears, it poses a problem for the conservation of arable land and thus for long-term food production [3,4,5]. Poesen et al. [6] conclude that 10%–94% of overall soil loss volume due to water erosion is caused by gullying. In order to predict and subsequently prevent gully erosion, several remote-sensing-based models are available that use machine learning algorithms and statistical methods, i.e., Random Forest (RF), Support Vector Machines (SVM), or Weights-of-Evidence (WoE).
These models aim to assess the geomorphic threshold that must be exceeded for the initiation of gully erosion based on classification rules and include a combination of environmental and land use factors [7,8,9,10]. The distinction between environmental and human-driven factors is only rarely addressed in the available modeling approaches, although soil erosion is primarily understood as a process of accelerated erosion resulting from human impact [11,12,13,14,15]. Gully erosion, in particular, has been shown to be related to different aspects of land use such as overgrazing, topsoil crusting, and unadapted irrigation techniques [5,16]. Furthermore, it is suggested that the occurrence of pathways, i.e., unpaved roads and footpaths, trigger the generation of concentrated runoff [14,16,17,18]; hollow ways are a typical indication of past gullying processes along pathways [19,20,21].
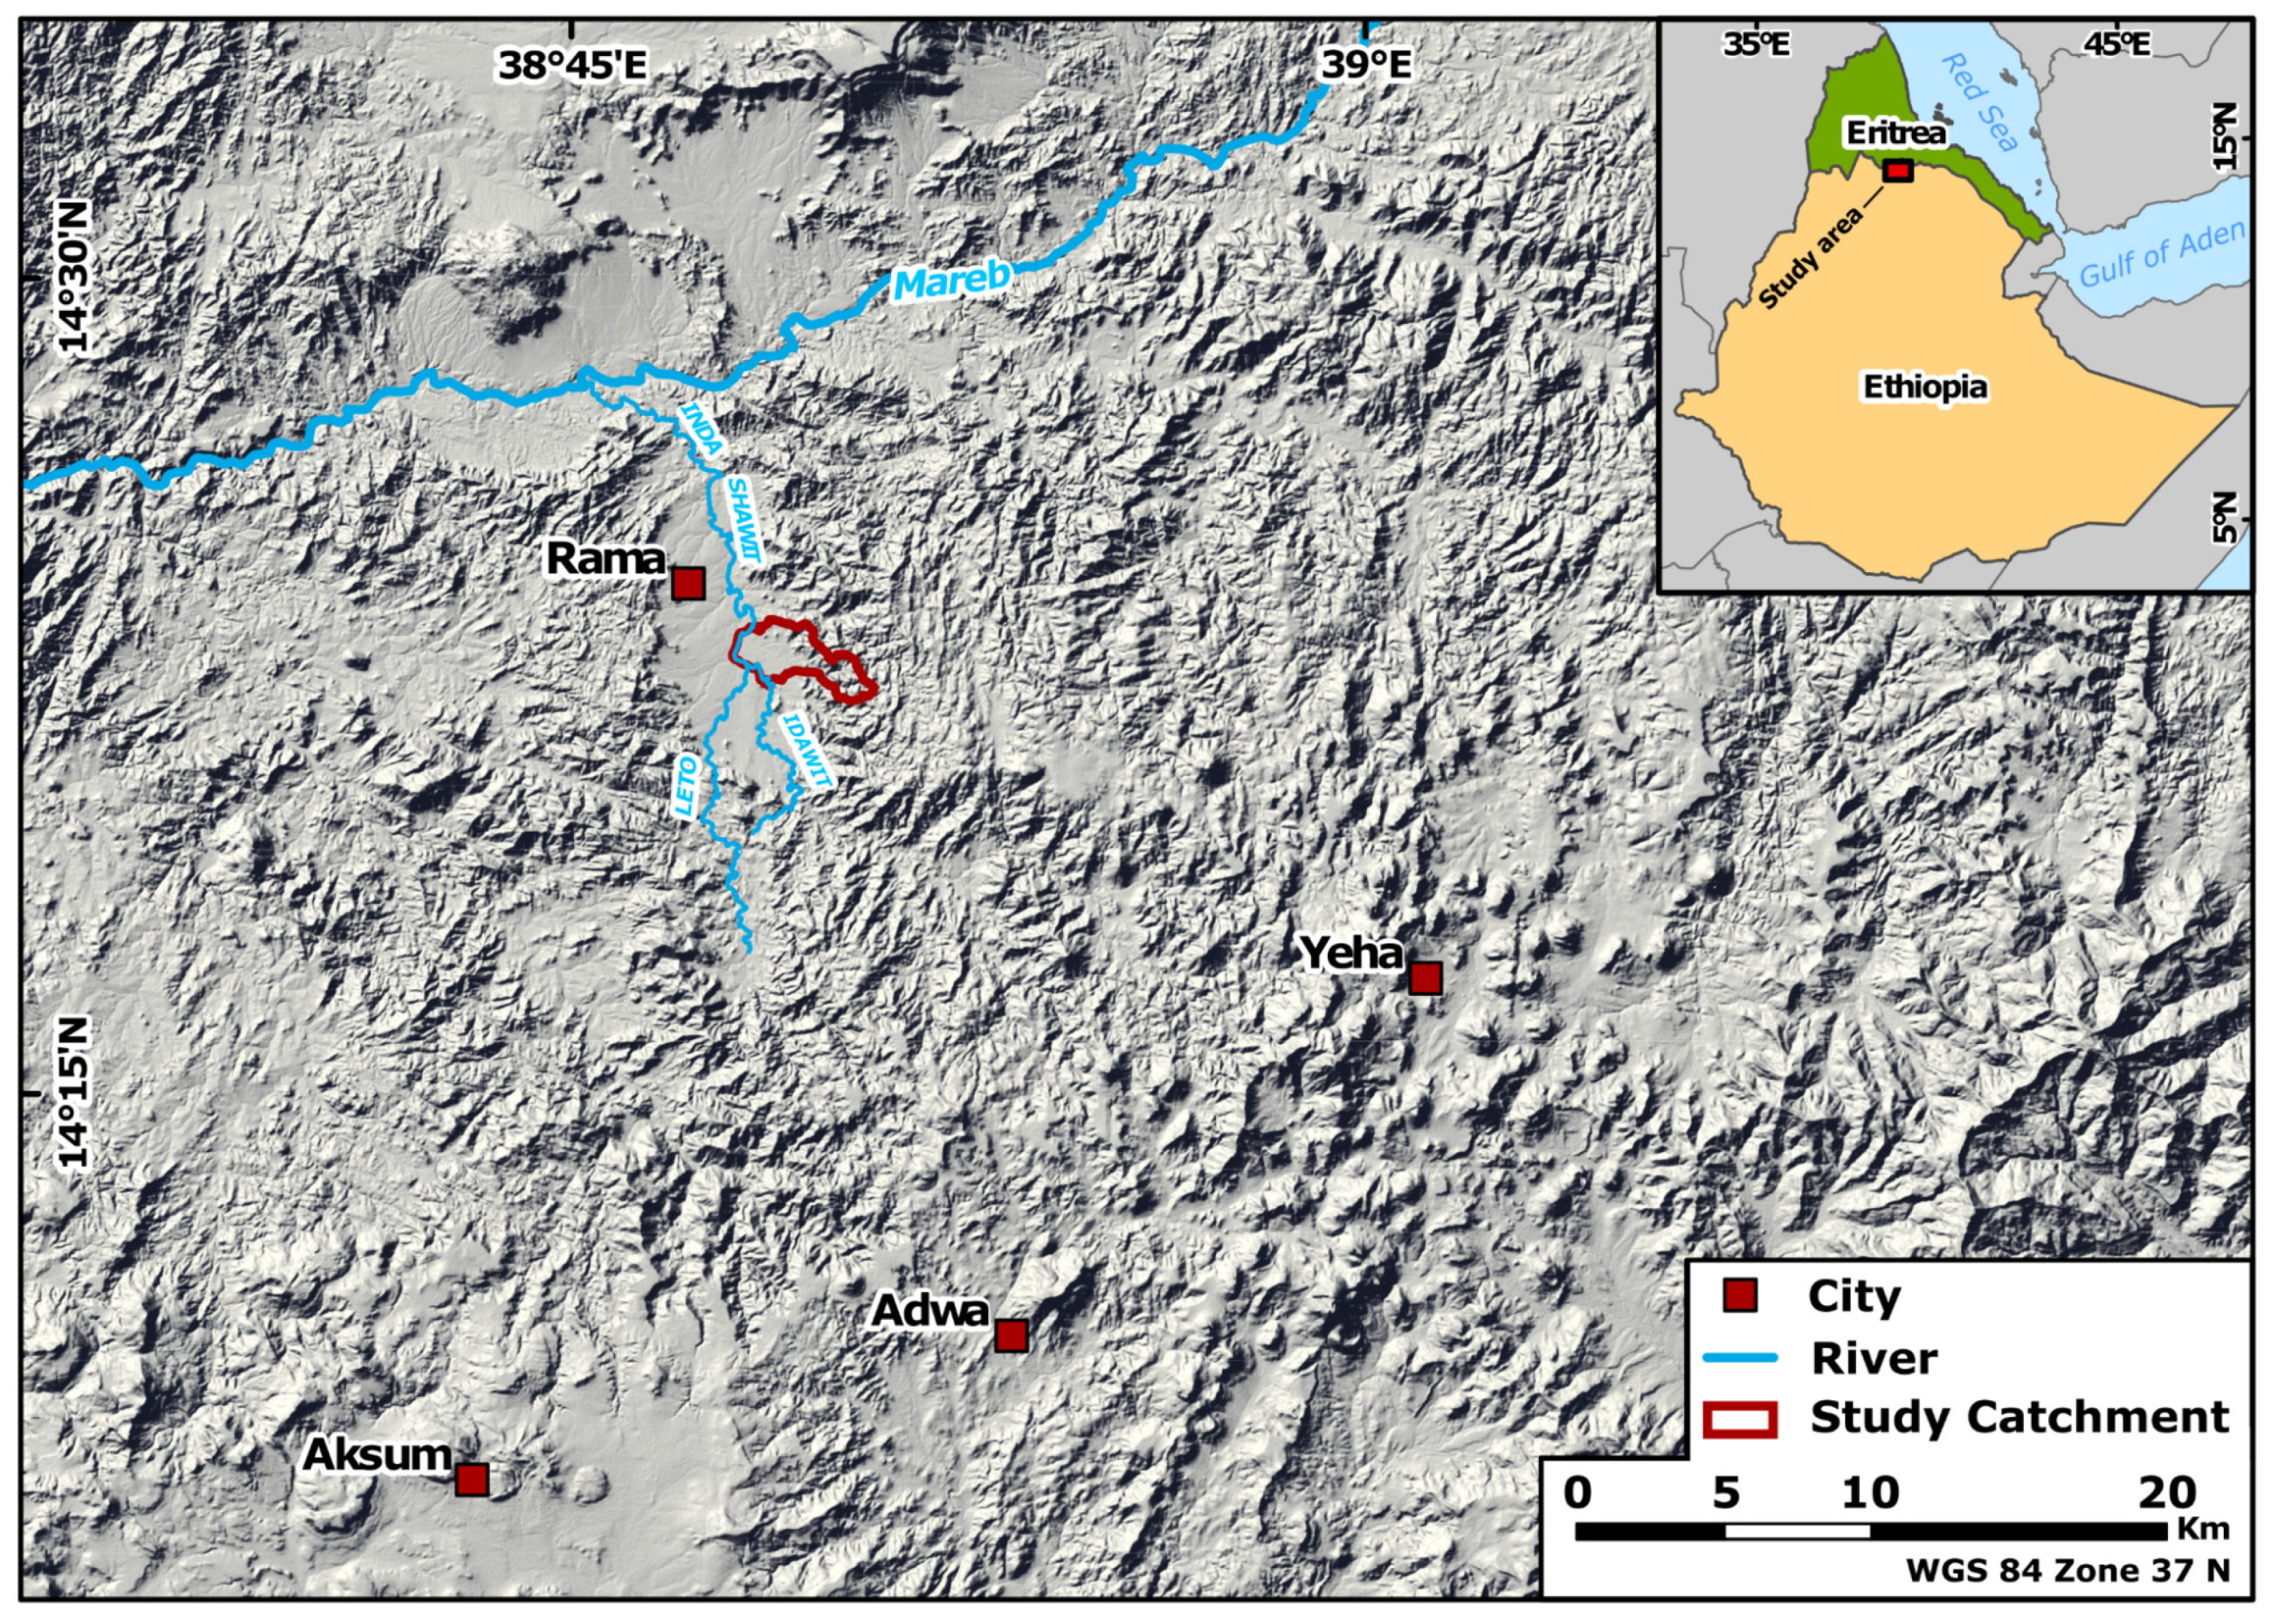
In the present study, we focus on the role of land use and settlement activities in gully erosion. We aim to generate a gully erosion susceptibility model which will: (a) distinguish between the influences of human and environment-related factors on the spatial distribution of gullies; and (b) evaluate the influence of pathways on the formation of gullies. A catchment in the north Ethiopian Highlands served as a study site (Figure 1), an area which is well known for current gully erosion dynamics [3,14,17,22].
2. Study Area
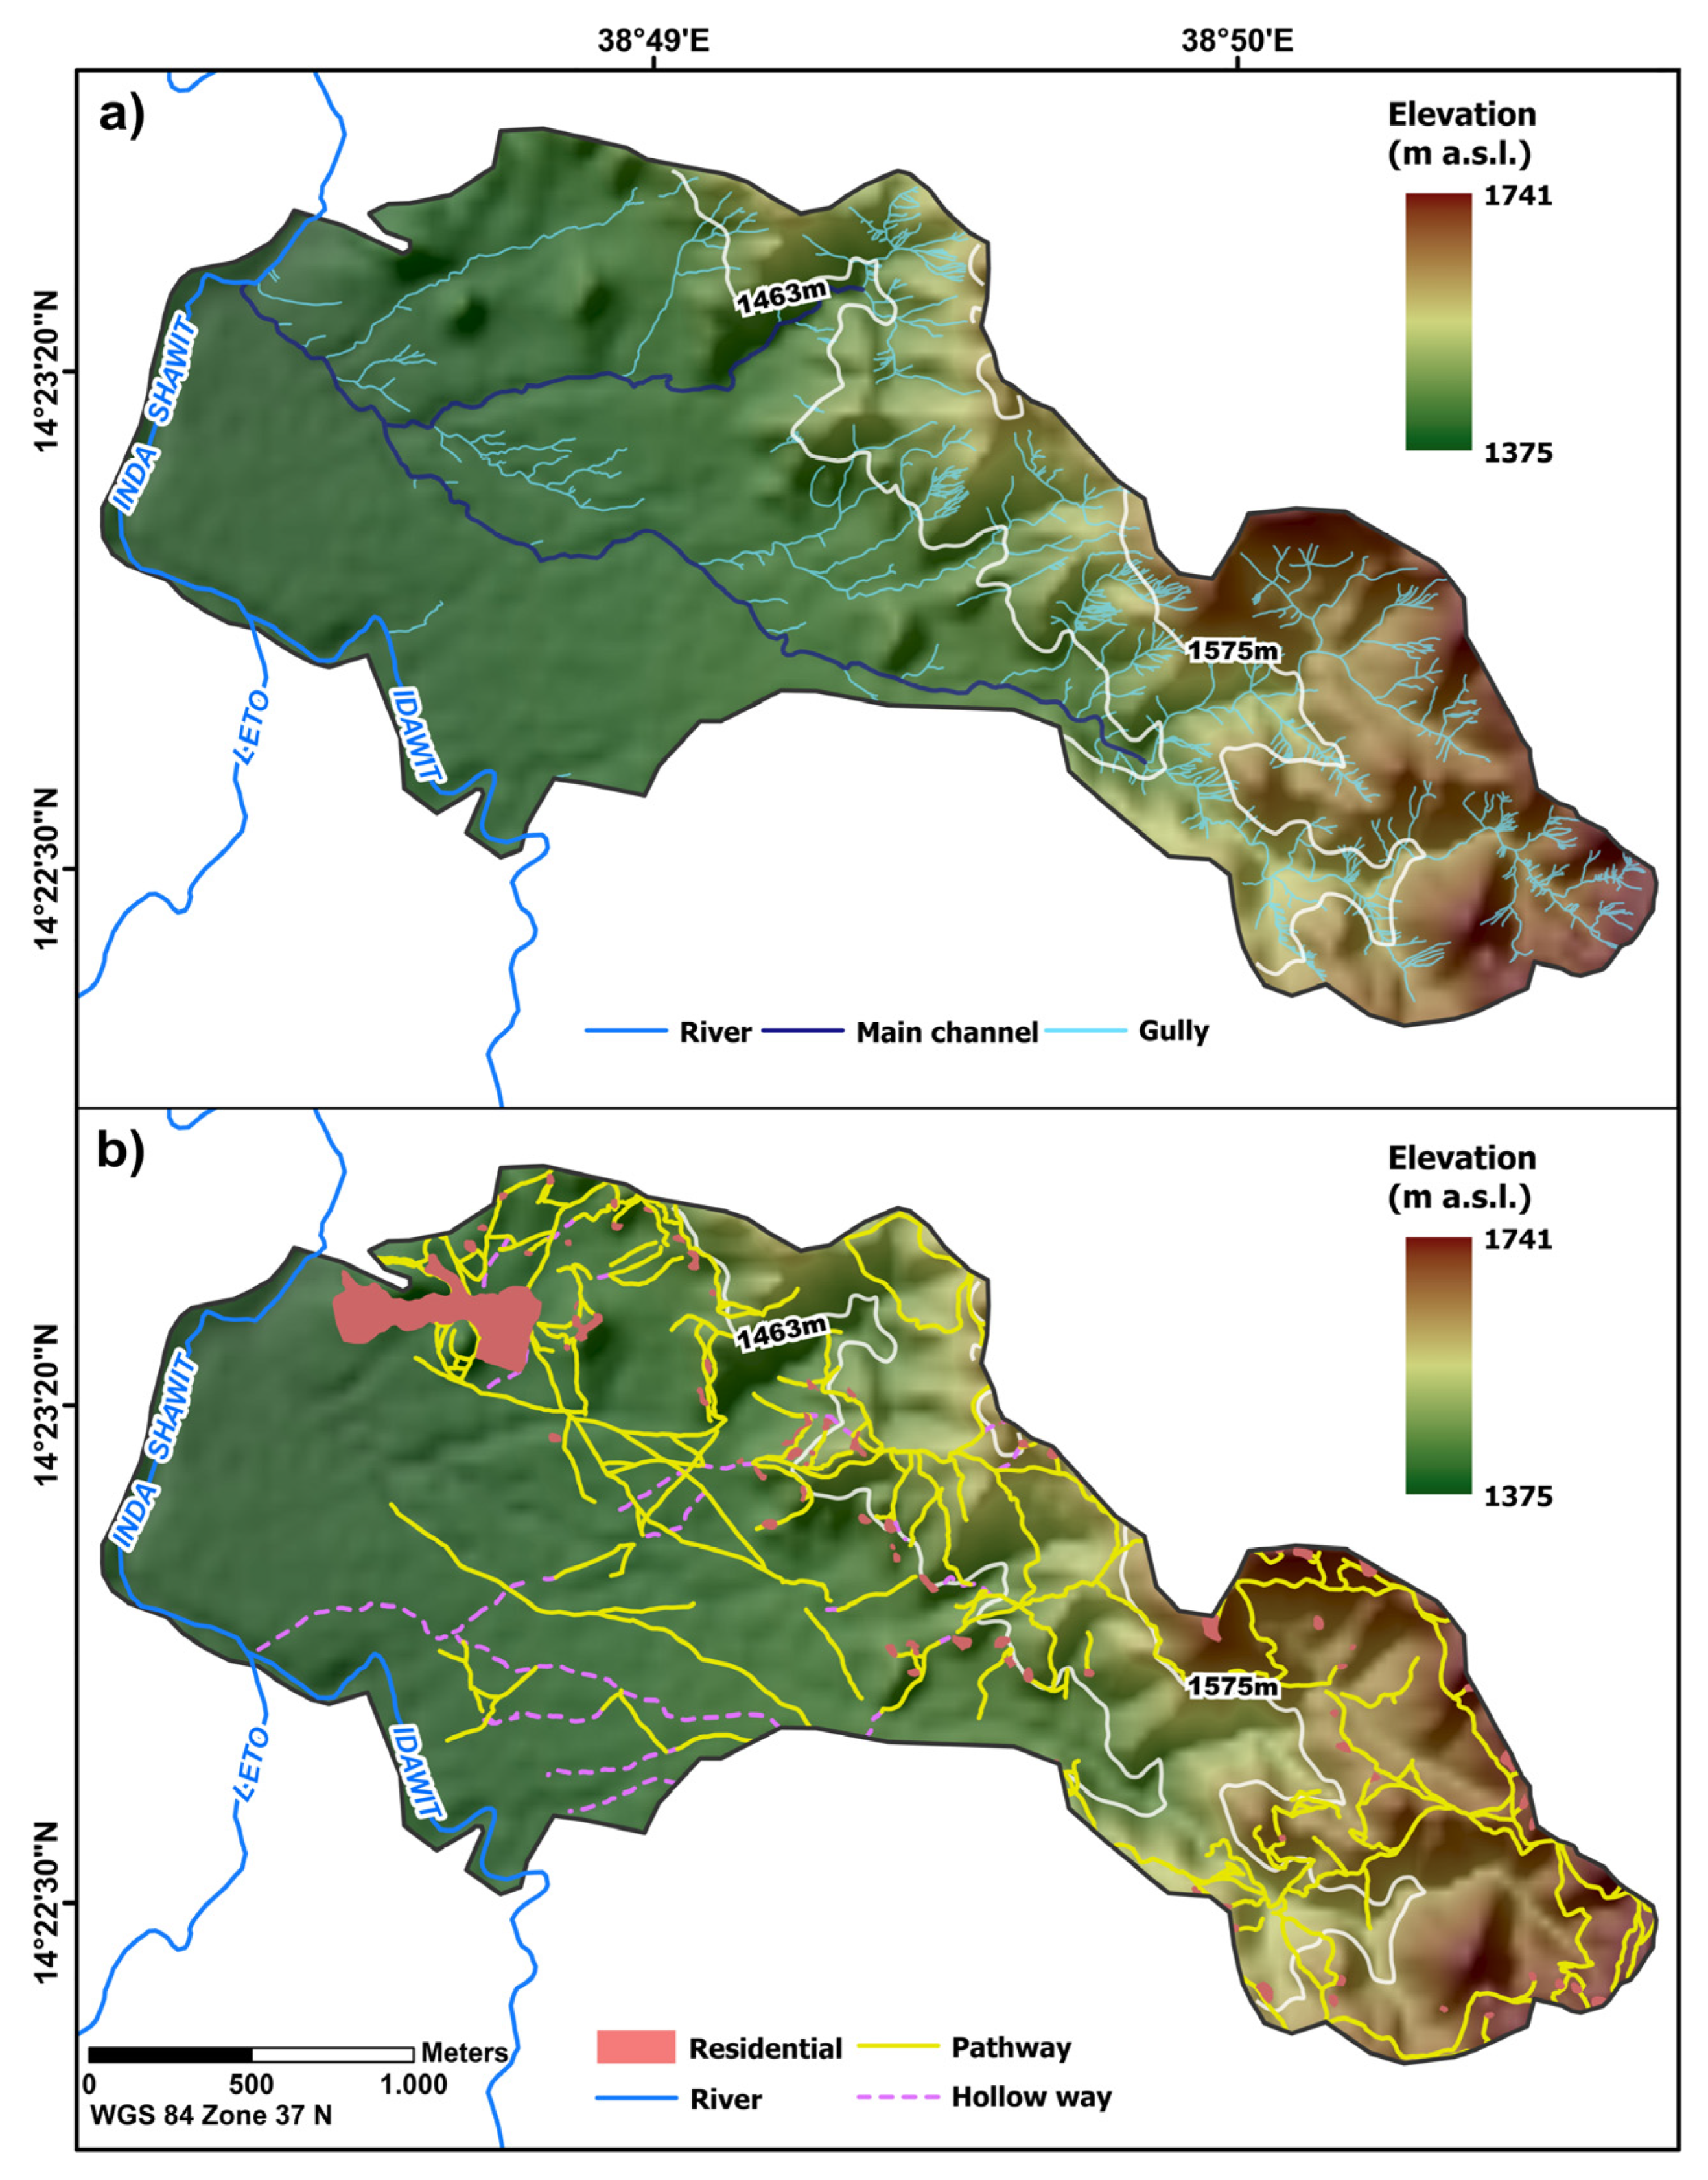
The study area is located in the Tigray region in the north Ethiopian Highlands, about 30 km north of Aksum and ca. 9 km south of the Mareb River (called the Gash River further downstream) which marks the border between Ethiopia and Eritrea here (Figure 1). The topography of the study area is characterized by a graben-like structure with a major S-N strike direction. A road connecting the Ethiopian town of Adwa with the Eritrean town of Adi Ugri runs through and follows this structure. The depression is drained by the River Inda Shawit which is a tributary to the Mareb River. The studied catchment is tributary to the Inda Shawit and lies on the eastern side of the depression c. 16 km south of the confluence of the Inda Shawit and Mareb River, covering ca. 6.7 km2. At the mouth to the Inda Shawit, the catchment is situated at 1375 m (a.s.l.). Due to its topography the study catchment can be subdivided into three zones: (a) the lowlands (<1463 m a.s.l.) predominant in the western and central parts, and (b) a transition zone (1463–1575 m a.s.l.) connecting the lowlands with (c) the hill country (>1575 m a.s.l.) that is dominated by short steep slopes with inclinations up to 40° (Figure 2a).
The annual precipitation cycle follows a bimodal pattern and reaches an average annual value of 300–800 mm [23]. At the Adwa weather station (1908 m a.s.l.), ca. 25 km to the south of the study area, annual rainfall amounts to 668 mm, and the annual temperature average is 19.6 °C (1982–2012) [24].
Rainfall occurs in the “belg”-season (March–May) and the “kiremt”-season (June–September), which corresponds to the major rainy season [25]. The potential mean annual evapotranspiration in the Tigray region varies between 1600 and 2100 mm; thus, up to 90% of the region is classified as semi-arid [26].
Referring to the Soil Atlas of Africa [27], ca. 93% of the study area is characterized by eutric cambisols, while in the headwater area, eutric leptosols are widespread. On-site soil identification showed that soils in the transition zone and the hill country consisted mainly of leptosols developed in highly weathered and eroded bedrock, indicating high morpho-dynamics [27].
Due to the periodic rainfall pattern and the annual negative water balance, local agriculture depends on irrigation. Land use in the western part of the lowlands is characterized by croplands and plantations where mainly avocado and mango trees are cultivated. The high water demand of these cash crops is met using a motorized pump system that lifts water from the Inda Shawit River. Field crops (maize, sorghum, teff, and finger millet) dominate the central lowlands. A small residential area is located in the northwest of the lowlands, complemented by scattered housing distributed over the entire catchment area. Amid the lowland’s agricultural areas, badlands have developed, mostly along the main channels and close to pathways. Sloping areas of the hill country and the transition zone are either terraced and used to cultivate finger millet and teff, or uncultivated land mostly covered by shrubs.
3. Modeling Gully Erosion
The formation of gullies is determined by the erodibility of the source material and the force of water as the eroding agent [14,28]. The erodibility is related to the geomorphic threshold; thus, it is a determinant for a landscape system’s stability [11,29,30]. In order to reproduce the terrain-forming process of gullying, various models aim to predict the influences on the erodibility threshold. Conditioning influences are approached mainly by topographic, climatic, pedogenic, and geological factors [21,31,32,33,34]. Additionally, Valentin et al. [5] emphasize the importance of land use change on the formation of gully erosion. Accordingly, Boardman [35] criticizes common soil erosion models stating that they underestimate the influence of socio-economic variables. This observation is underscored by the suggestion that, e.g., the construction of roads causes a reduction in the infiltration capacity and results in a concentration of superficial water, leading to surface runoff. This, in turn, has been shown to affect the formation of gullies [36,37]. Following similar principles, Schütt et al. [14] observe that a vast number of gullies formed along paths and cattle trails as well as in the vicinity of settlements. The compaction of sediment underneath paths and residential areas results in a reduction of infiltration capacity, in turn generating surface runoff [14,16,21]. Given these observations, it is evident that there is need for a model describing the spatial relation between gully erosion, pathways, and settlements.
Modeling gully erosion involves a high degree of complexity. Standard approaches for soil erosion modeling, such as the Universal Soil Loss Equation USLE [38] and its subsequent extensions (RUSLE; MUSLE) express the basic principle of erosion but cannot address the gully erosion process [39,40]. Other models, such as the Chemicals, Runoff, and Erosion from Agricultural Management Systems (CREAMS; [41]), the European Soil Erosion Model (ESEM; [42]), the Ephemeral Gully Erosion Model (EGEM; [43]) or the Water Erosion Prediction Project (WEPP; [44]), aim not only to address soil erosion, but also to reproduce erosion rates both quantitatively and qualitatively [7,15].
In order to understand the dynamics and emergence of gully erosion in terms of the variability of the conditioning factors, it is necessary to consider the spatial distribution of gully erosion as a first step. Correspondingly, the locations of gully heads can be associated with a combination of factors that cause instability and trigger erosion. The transition between stability and instability is described by a geomorphic threshold [29,30]. This dimensionless state is composed of environmental and human-related factors that describe and affect the physical basis of a specific location. Even though the above-mentioned models help to understand the fundamental processes of gully erosion, none of them addresses the spatial distribution of this terrain-forming process. Consequently, most recent studies about gully development using statistical models are based on remote sensing data and apply data mining methods and geographic information systems (GIS). Machine learning algorithms such as Support Vector Machines (SVM), AdaBoost, Artificial Neuronal Networks (ANN), Boosted Regression Tree (BRT), or Random Forest (RF) are frequently used for gully erosion modeling [7,8,31,45]. Statistical methods applied include Frequency Ratio (FR), Multivariate Adaptive Regression Splines (MARS), Weights-of-Evidence (WoE), and Maximum Entropy (ME) [7,8,10,21].
Comparison of the different approaches reveals that the Random Forest algorithm can handle large datasets and generate models with high accuracy. It can produce fast and stable classifications, especially given the need to incorporate multiple features. Additionally, RF is able to assess the importance of each variable used in order to calculate a multi-classifier, and evaluates its own accuracy [7,9,46].
4. Material and Methods
4.1. Database
Mapping of the gully, settlement, and pathway networks is based on Google Earth imagery (CNES/Airbus, Maxar Technologies, Map data ©2020) imported into QGIS (2.18.16) via the “QuickMapServices” plug-in. Mapping results were complemented and validated during a field campaign in November 2019. During the field campaign area-wide mapping of gullies and gully heads was also undertaken.
4.2. Gully Erosion Conditioning Factors
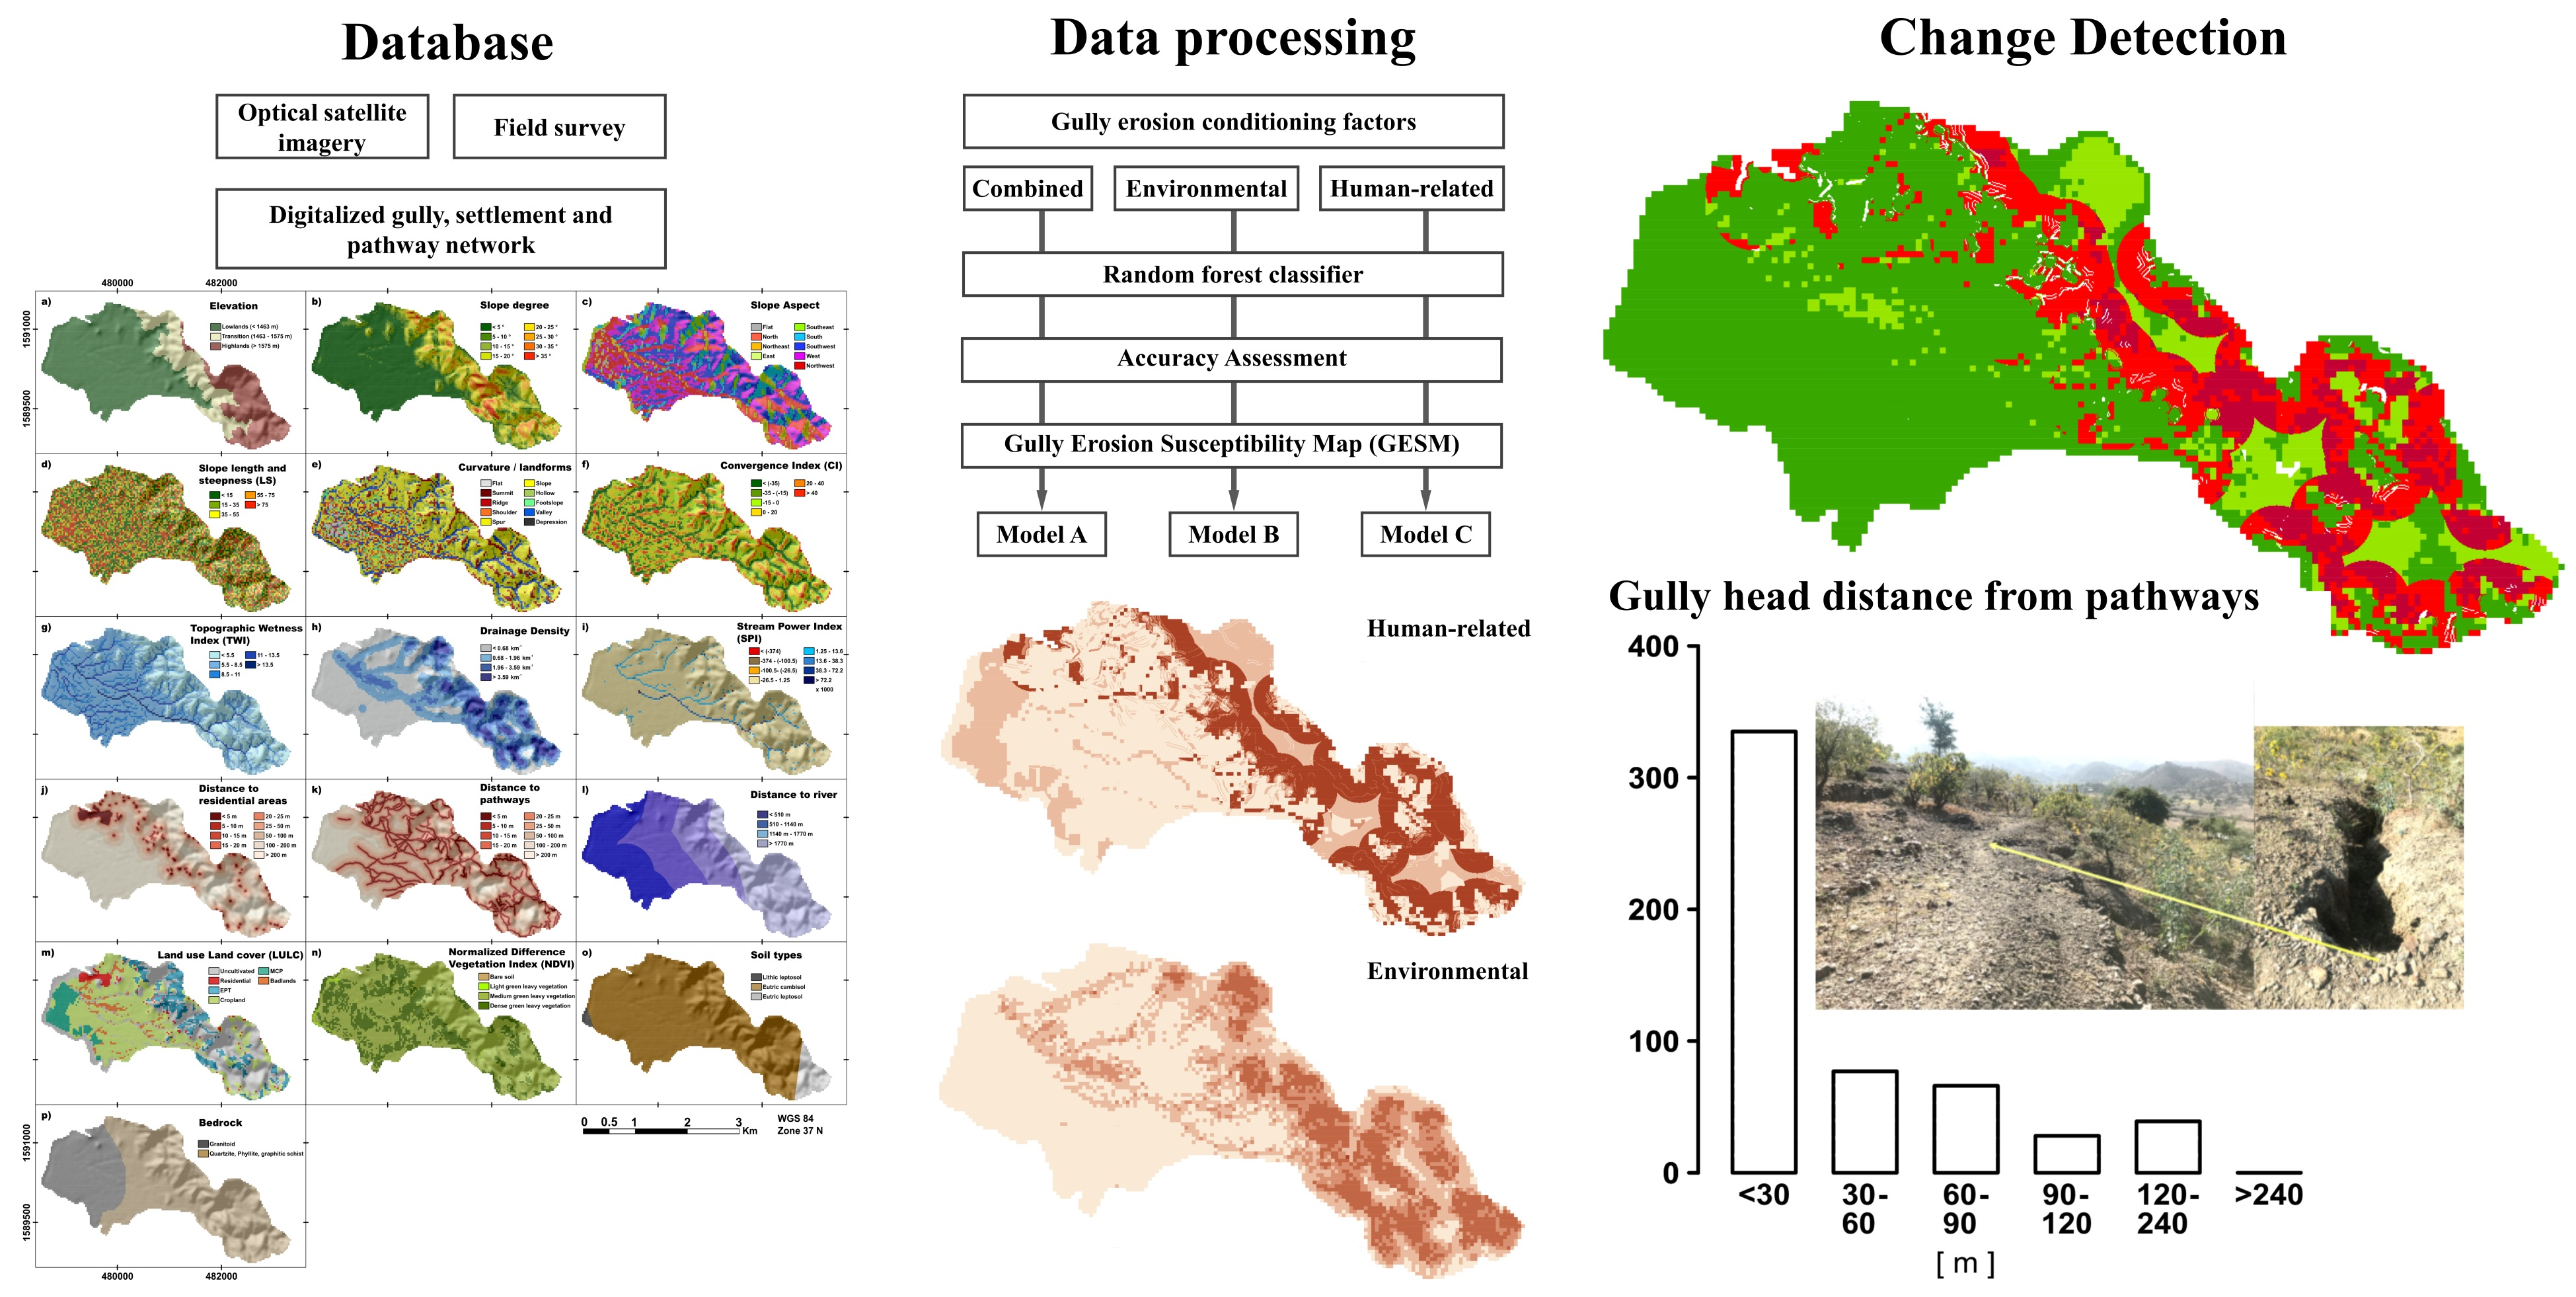
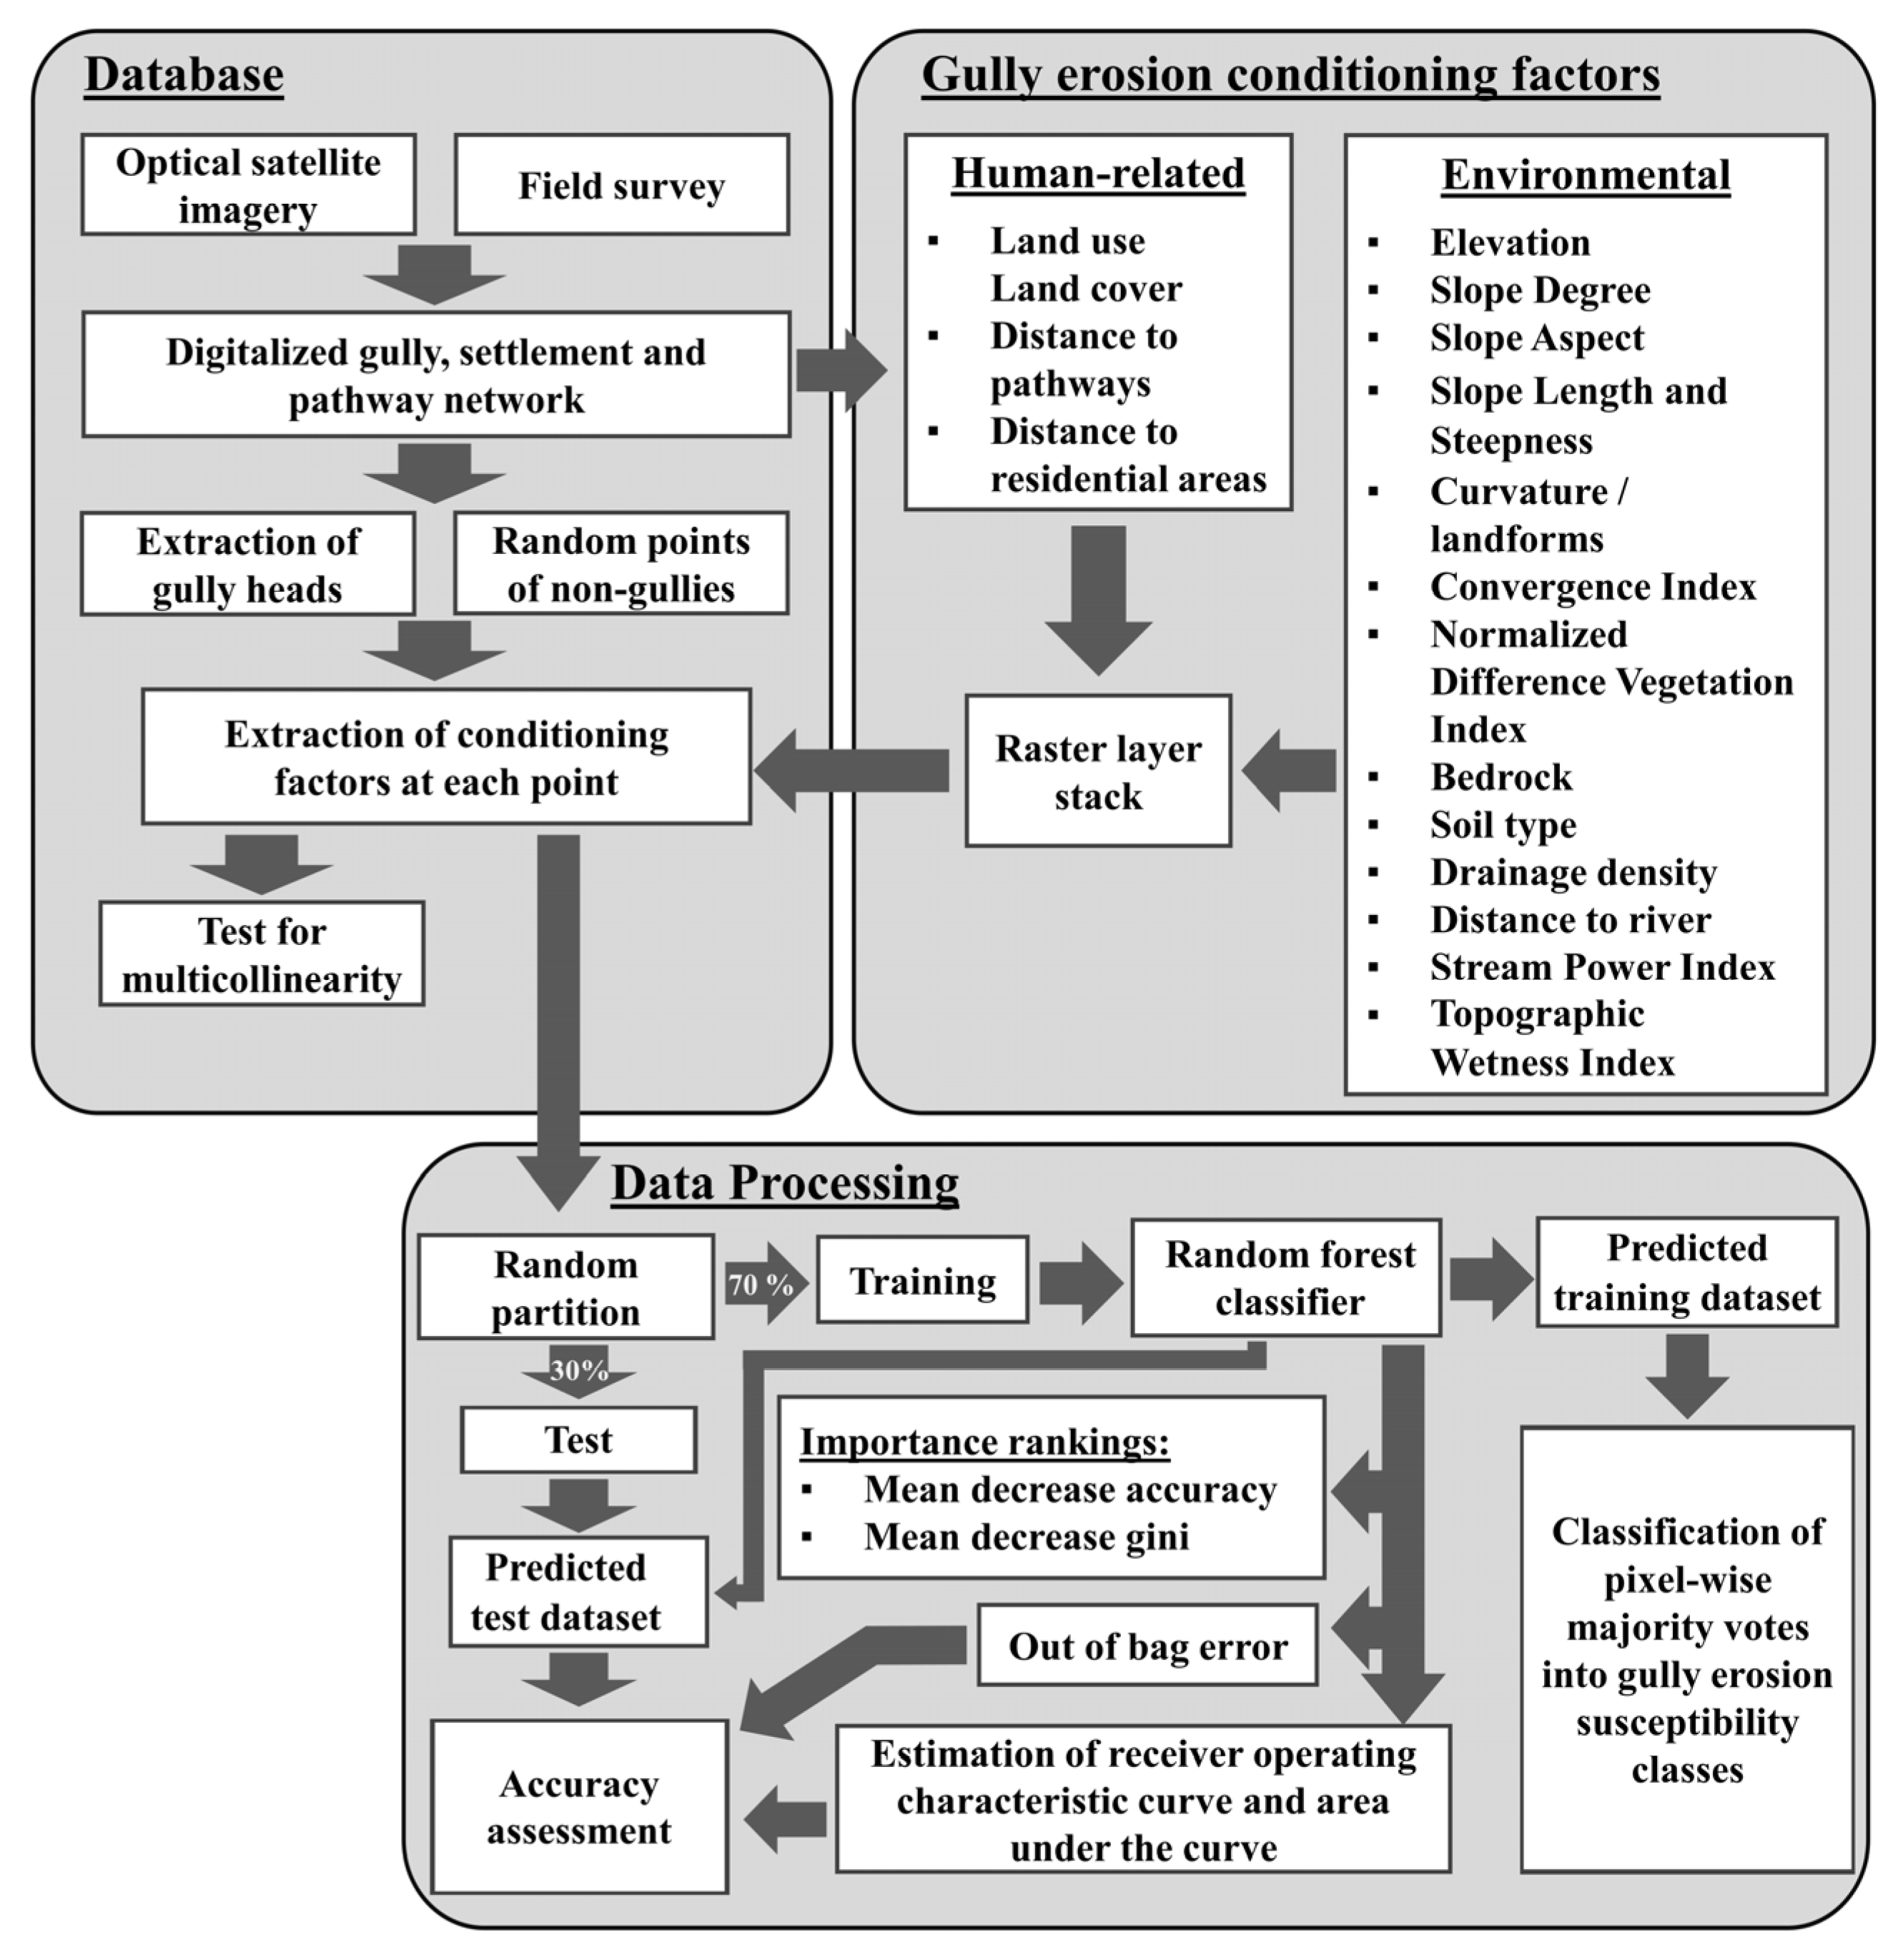
Sixteen factors potentially determining the location of gullies are considered; the compilation of these factors is based on a literature review. The factors are grouped into human-related and environmental influences, whereby environmental factors are understood as influences that also exist without human intervention (Figure 3, Table 1) [7,8,9,10,47]. Three factors were selected to reflect possible human drivers of gully erosion: distance to settlements, distance to pathways, and land use land cover (LULC). These three factors are associated with the occurrence of gullies in the literature [5,14,16,21,48]. The number of variables is not equal when comparing environmental and human-related factors. However, the lower amount of these human-related factors should not affect the prediction of gullies due to their independent evaluation and the overall similarity in magnitude.
Several of the environmental factors are derived from the Digital Surface Model (DSM) ALOS Global DSM (Version 2.2–2014) of the Japan Aerospace Exploration Agency (JAXA) with 30 m × 30 m spatial resolution. This serves as a basis to receive data on elevation [m a.s.l.] and to calculate all other topographical factors as derivatives (Supplementary Material, Figure S1a).
In addition to the delineation of slope degree and aspect values in ArcMap (10.5), the slope length and steepness factor (LS) of the Revised Universal Soil Loss Equation (RUSLE) were derived by applying the method of “Böhner and Selige 2006” in SAGA GIS (2.3.2) (Supplementary Material, Figure S1b–d). Terrain forms as described by their specific curvature were recorded by applying the Convergence Index (CI) using the eponymous SAGA GIS (2.3.2) tool. Additionally, the delineation of landforms (geomorphon) was undertaken by applying the GRASS GIS (7.8.4.) tool “r.geomorphon” (Supplementary Material, Figure S1e,f). The Topographic Wetness Index (TWI) and the Stream Power Index (SPI) were calculated using the eponymous modules in SAGA GIS (2.3.2) (Supplementary Material, Figure S1g,i). The relation between the cumulated length of channel segments in an area, defined as Drainage Density [49], was calculated in ArcMap (10.5) (Supplementary Material, Figure S1h). The captured lithologic characteristics of bedrock were manually digitized based on the geological map of Axum [55] using ArcMap (10.5) (Supplementary Material, Figure S1p). Factorized soil types are provided by the European Soil Data Centre (ESDAC) and are based on the classifications of the Soil Atlas of Africa [27] (Supplementary Material, Figure S1o). A Sentinel 2B (level 1-C) image (European Space Agency, ESA) was bottom-of-atmosphere (BOA) corrected and used to calculate the Normalized Difference Vegetation Index (NDVI) in the Sentinel Application Platform (SNAP, 7.0.3) (Supplementary Material, Figure S1n). The Sentinel scene was taken at the end of the kiremt-season (24.09.2019). This period not only provides a lower cloud cover, but also represents a potential phenological peak of the study area and consequently maximum vegetative-induced stability [54]. The land use land cover (LULC) was manually mapped during the field survey using the classes of cropland, mixed cropland and plantations, residential areas, badlands, erosion protection terraces, and currently uncultivated land (Supplementary Material, Figure S1m). The Euclidean distance to the mapped and digitized pathways network, river courses, and residential areas was calculated in ArcMap (10.5) (Supplementary Material, Figure S1j–l). Most of the factors were calculated at a horizontal resolution of 30 m, predetermined by the spatial resolution of the DSM and the Sentinel 2 image. To facilitate the combination of the distance raster layers (5 m) and the residual datasets (30 m), especially as footpaths can be only ca. 2–6 m wide, all factors were resampled to a spatial resolution of 5 m using nearest neighbor resampling in ArcMap (10.5). Variance inflation factors (VIF) were calculated in Rstudio (3.5.0) to estimate the multicollinearity between all the conditioning factors.
4.3. Data Processing
The calculations are based on selectively extracted factors at the origin of the mapped gullies (gully heads). The ArcMap (10.5) tool “point extract” was used to obtain the respective starting points of the digitalized gully-polylines.
The Random Forest (RF) algorithm [59] was applied in R environment using Rstudio (3.5.0) and the “randomForest” package of Liaw and Wiener [60]. From the combinations of classified human-related and environmental factors, a total of three models were trained to predict the formation of gullies within the studied catchment. Each of the models should allow susceptibility to gully erosion to be estimated for any given location.
At the mapped gully heads, human-related and environmental factors (Table 1) were extracted from the GIS environment and combined in order to train and validate the models in a ratio of 70:30 with 30% of the data for cross-validation (Figure 3). As a control group, the same amount of “non-gully” points were randomly created, visually validated, and added in the same ratio to the training and test datasets. Thus, in the bootstrap aggregation process of the random forest algorithm (so-called “bagging”), training points were randomly selected and used to derive a newly assembled bootstrapped dataset. In order to estimate a classification rule for each of the three models, it was specified how many of the variables are used for a decision at each split node of the decision trees (mtry). The “randomForest” package by Liaw and Wiener [60] contains the function “tuneRF”, which was used to identify the best amount of mtry variables dependent on the resulting prediction error. With the fixed number of mtry variables and trees, the algorithm built up the individual decision trees using a random subset of the bootstrapped dataset at each split [46,59,61].
Model A applies all 16 factors (Table 1) and was derived by using 500 trees at four mtry variables. In Model B, 13 variables incorporating only the environmental factors are processed in the RF algorithm by 600 trees and two mtry variables. Model C is exclusively based on the three human-related factors (Table 1) and was trained by 600 trees at three mtry variables. The prediction of gully erosion susceptibility in the study area by Models A–C led to pixel-wise majority votes, which were equally classified into five susceptibility classes (very low, low, moderate, high, very high). Each class corresponds to a share of 20%. Therefore, pixels representing classes from very low to low were determined to be susceptible to gully erosion by only 40% or less of all decision trees, indicating that gullies are less likely to develop in these areas. The moderate class addresses pixels close to the majority vote threshold and aims to prevent uncertain classifications (40–60%). High to very high scores indicate a substantial positive agreement between the decision trees (>60%), indicating that gullies are more likely to develop in these areas. Results were incorporated in a Gully Erosion Susceptibility Map (GESM) displayed for each model [32,33,45]. Three different methods were used to validate the model accuracies: (1) supervised validation by a subset and unbiased test dataset, (2) “out of bag” (OOB) error, automatically estimated by the random forest algorithm, and (3) comparison of the Receiver Operating Characteristic (ROC) curves and the corresponding Area Under the Curve (AUC) by the test data. To assess variable importance, the Mean Decreasing Accuracy (MDA) and the Mean Decrease of the Gini index (MDG) were applied following recent studies [7,47,62,63]. Differences among the models based on human-related and environmental influences were compared by applying a change detection between the Gully Erosion Susceptibility Map (GESM) of Models B and C. Dissimilar pixels were classified in ArcGIS into five classes regarding their susceptibility to gully erosion: (1) areas predicted as non-susceptible to gully erosion by either Model B and Model C or one of them, (2) areas predicted as susceptible to gully erosion only by Model B, (3) areas predicted as moderately susceptible to gully erosion by either Model B and Model C or one of them, (4) areas predicted as susceptible to gully erosion only by Model C and (5) areas predicted as susceptible to gully erosion by Model B and Model C.
5. Results
In the study catchment (6.7 km2) a total of 667 gullies and 546 gully heads were mapped. The variance inflation factors among all variables indicate no multicollinearity (Supplementary Material, Table S3). The most relevant human-related and environmental factors influencing the spatial distribution of gullies and gully heads are derived in the following (for remaining factors, see Table S1 in the Supplementary Material).
5.1. Gully Head Distribution
The majority of all gully heads are found in the hill country (51%), while 38% of the gully heads are in the transition zone, and 11% in the lowlands. Gully heads occur primarily on slopes with an inclination of 15%–35° (71%). The location of gully heads in the vicinity of pathways follows a bimodal distribution: 89% of the gully heads are located up to 100 m from pathways, while 21% of all gully heads occur at distances of less than 5 m distance from pathways. Distances of 5–25 m between gully heads and pathways are underrepresented (4%–7%) (Supplementary Material, Table S1). About 11% of all gully heads are located more than 100 m from pathways (Supplementary Material, Table S1). Furthermore, 71% of all gully heads are located more than 100 m from settlements (Supplementary Material, Table S1). Analyzing the distribution of gully heads among the different land use land cover classes shows that most gully heads are either located on uncultivated bare land (64% of all gully heads) or in areas covered by erosion protection terraces (25% of all gully heads). Only 7% of the gully heads occur on cultivated croplands (Supplementary Material, Table S1).
5.2. Model Performance
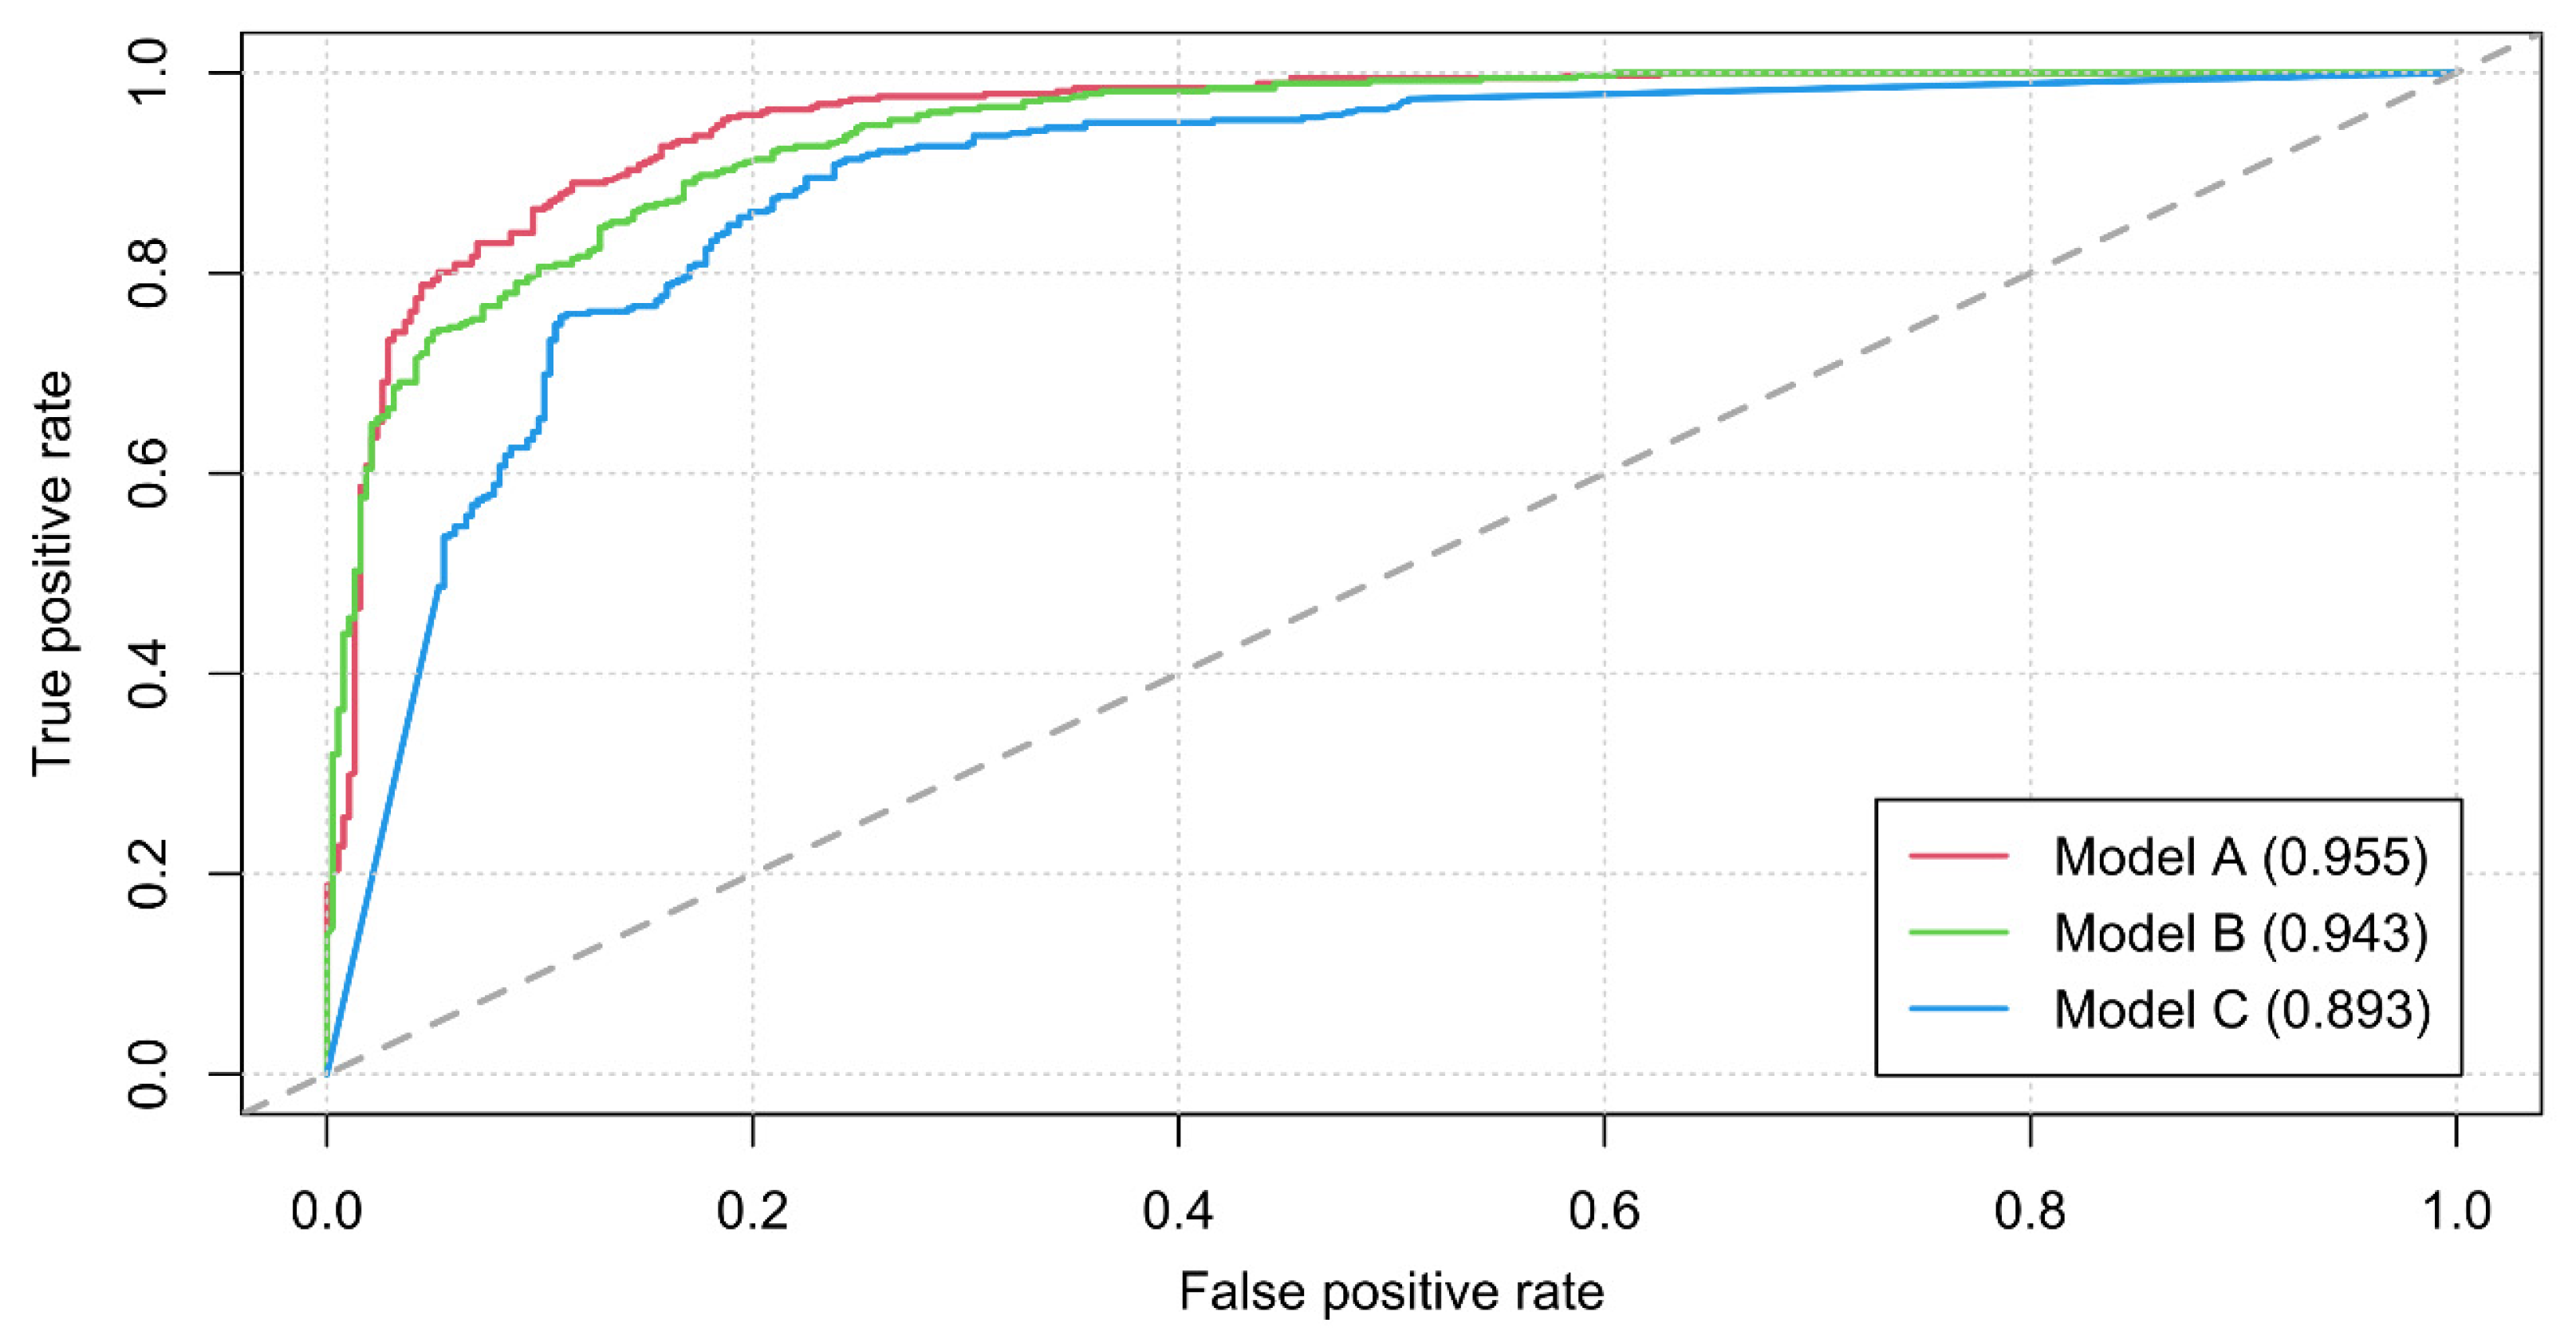
To train gully erosion susceptibility models, a training dataset of 764 points was applied. Half of these points correspond to mapped gully heads, while the other half are located in supervised areas that are not affected by gullying. Considering all factors (Model A, Table 1), 340 of 382 (89%) of the gully heads were correctly predicted, and 336 of 382 (88%) areas unaffected by gully heads were correctly predicted as “non-gully head locations”. The out-of-bag (OOB) error (11.52%) results in an accuracy of 88.48%; the verification of the test data reveals an accuracy of 89.26% for Model A (Table 2).
When training gully erosion susceptibility by including environmental factors only (Model B), gully heads are predicted with an accuracy of 87.44% and non-gully heads with an accuracy of 86.13%. The validation of the test data for Model B reveals an accuracy of 88.34% (Table 2) and an OOB error that corresponds to an accuracy of 86.78%. According to the comparison of receiver operating characteristic (ROC) curves, the area under the curve (AUC) of Model B is slightly lower than for Model A (Figure 4, Table 2). In Model C, applying exclusively human-related factors, the prediction of gully heads achieves an accuracy of 87.44% and, thus, is widely similar to that of Model B. According to the validation of the test data, Model C predicts the location of gully heads with 84.97% accuracy (Table 2). The AUC of Model C is lower than for Model A and Model B, indicating a higher false-positive rate for the classifications of Model C (Figure 4, Table 2). For Model C, the OOB error (18.32%) yields a precision of 81.68% and Model C predicts the location of non-gullies with an error of 24.08%.
5.3. Variable Importance
The Mean Decrease in Accuracy (MDA) and the Mean Decrease in Gini (MDG) scores estimate the drainage density, Land Use Land Cover (LULC), and elevation as the most important variables included in Model A (Table 3). According to the estimated MDA of Model A, these variables are followed by the slope aspect, distance to residential areas, slope degree, NDVI, and the distance to pathways (in descending relevance). In contrast to the MDA, the MDG indicates that the slope degree and distance to pathway have a higher impact on the performance of Model A. In contrast to MDA slope length, steepness (LS) and curvature are of higher influence for Model A in the MDG ranking. The least influential factor for both rankings of Model A is the stream power index (SPI). Essential variables for Model B are the drainage density and the elevation (Table 3). Furthermore, the MDG ranking indicates that the factors drainage density and elevation are followed in importance by slope degree, and after a considerable gap by slope aspect. In contrast to the MDG ranking, the MDA assessment for Model B estimates the NDVI and slope aspect factors as being more eminent for the model performance than the slope degree. MDA and MDG rankings for variables in Models A and B show great similarities (Table 3). For Model C, the land use land cover represents the most crucial factor applying both ranking systems, followed by the distance to residential areas and the distance to pathways (Table 3).
5.4. Spatial Distribution of Gully Erosion Susceptibility
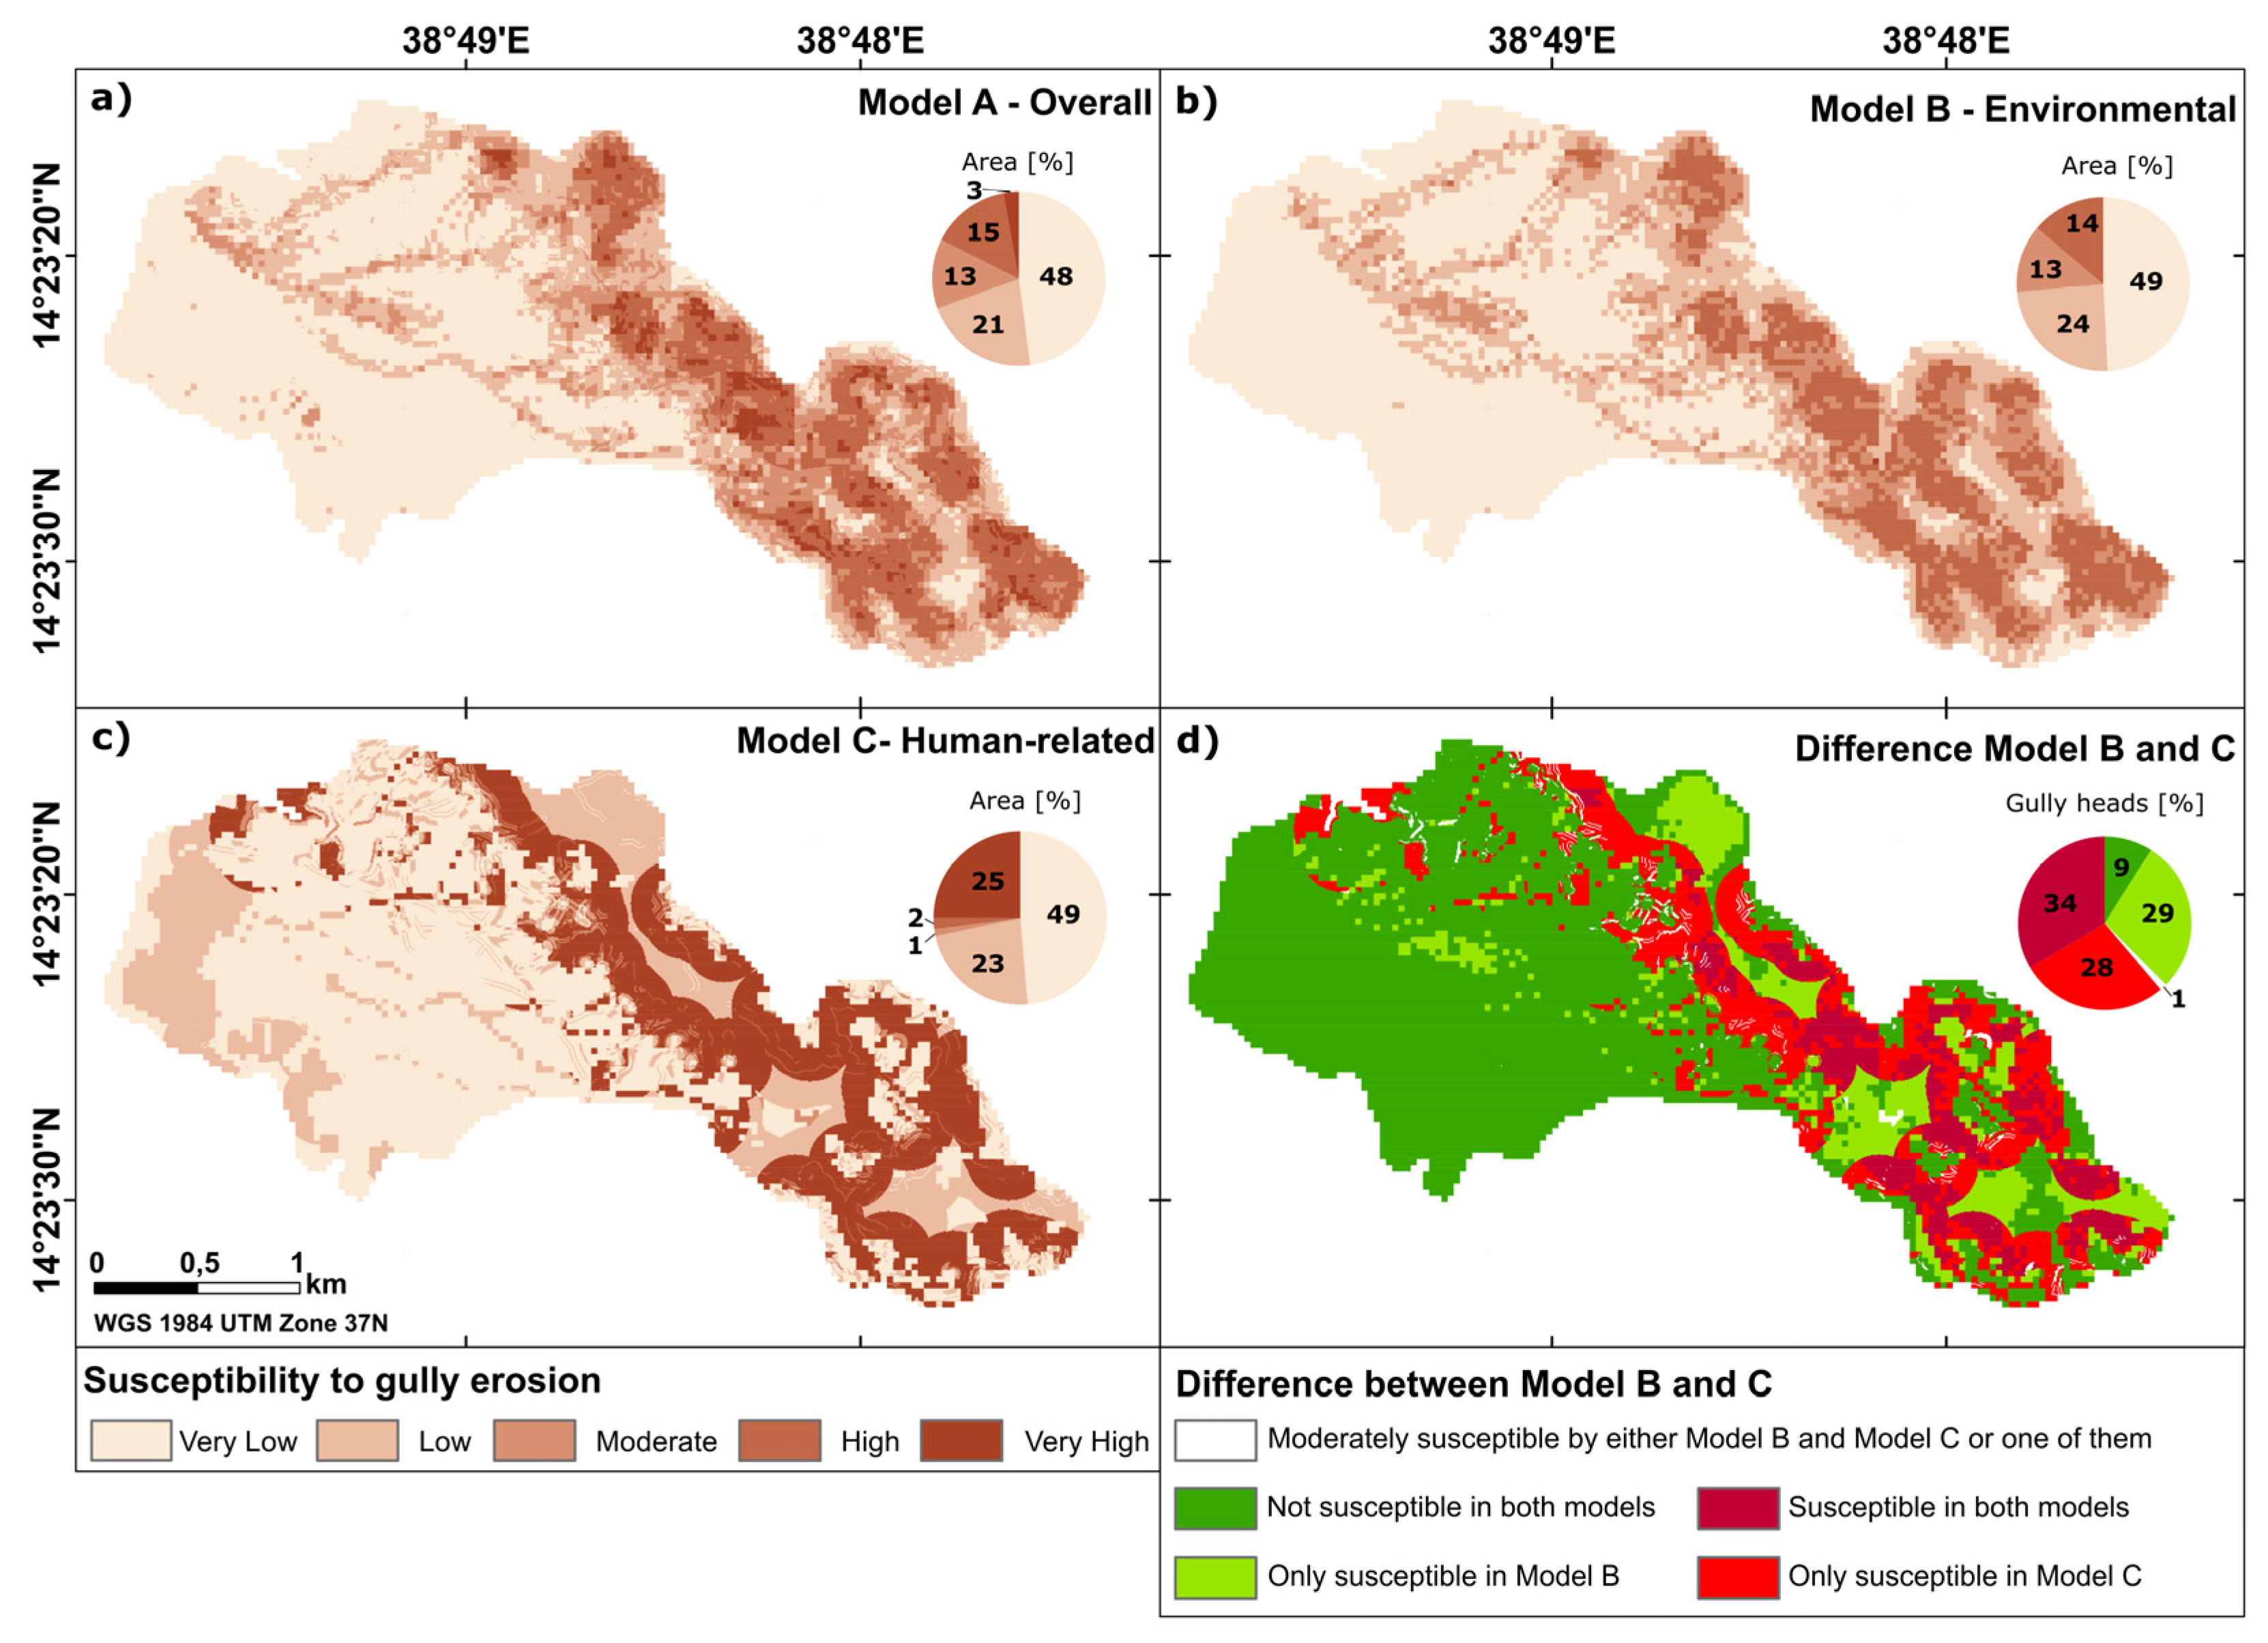
The spatially differentiated prediction of gully erosion susceptibility for the study catchment by Models A and B results in a pixel-wise maximum majority voting of 80.5%. This implies that the applied random forest algorithm of both models was not able to achieve an absolute distinction between gully erosion susceptibility and non-gully erosion susceptibility in all of its decision trees. In contrast, Model C achieves a maximum majority voting of 100%. All three models A–C clearly point out that about 50% of the study catchment displays very low susceptibility to gully erosion (Figure 5a–c).
Areas with low gully erosion susceptibility cover about 21% (Model A) with respect to. 24% (Model B) of the study area. Predominantly the lowlands show overall low susceptibility to gully erosion; however, low gully erosion susceptibility is also predicted for the proximity of mapped gully courses (Figure 2). Areas that are moderately susceptible to gully erosion cover 13% of the study catchment. Locations with high susceptibility for gully erosion show a widely similar spatial pattern with 15 (Model A) with respect to 14% (Model B). These areas that are highly susceptible to gully erosion predominantly occur in the transition zone and hill country as well as in the changeover between the transition zone and the lowlands. According to Model A, areas of very high gully erosion susceptibility cover 3%, while according to Model B they cover 0% of the study catchment and occur exclusively within the changeover between the hill country and the transition zone. Applying exclusively human-related factors (Model C) shows a slightly different spatial pattern of gully erosion susceptibility from those of Models A and B. Model C classifies 49% of the catchment area as having very low susceptibility to gully erosion and 23% as having low susceptibility to gully erosion; these areas predominantly occur in the western part of the lowlands. Compared to Models A and B, the outcomes of Model B in general predict a lower gully erosion susceptibility in the lowlands and a higher gully erosion susceptibility in the hill country and the transition zone. Areas of moderate (1%) and high (2%) gully erosion susceptibility are scarce in Model C (Figure 5c). In contrast to Models A and B, Model C estimates 25% of the catchment to be highly susceptible to gully erosion (Model A: 1%, Model B: 0%). The areas of high gully erosion susceptibility predicted by Model C primarily occur in the transition zone and hill country and in general occur in association with footpaths and residential areas (Figure 2b and Figure 5c).
5.5. Change Detection
Outputs of Model B (exclusively considering environmental factors) and Model C (exclusively considering human-related factors) are compared and assessed by change detection. The results exclude Model A (all factors) and are differentiated into five classes:
5.5.1. Areas Predicted as Susceptible to Gully Erosion by Model B and Model C
Comparing the gully erosion susceptibility predictions by Models B and C reveals that both models similarly predict 9% of the catchment to be highly to very highly susceptible to gully erosion. Comparison with the field datasets confirms that 183 (34%) of the gully heads mapped occur in areas predicted to be highly to very highly susceptible to gully erosion by both models with a core area of these 183 gully heads predominantly occurring in the hill country (120 gully heads) and the transition zone (63 gully heads), primarily on slopes with inclinations >10°. According to the LULC classification, 144 of the 183 gully heads are located in uncultivated areas and 39 gully heads can be found within erosion protection terraces. Of the 183 mapped gully heads found in areas predicted as being highly to very highly susceptible to gully erosion, 125 gully heads occur within 100–200 m of settlement areas and 126 (69%) occur at less than 50 m to pathways (Supplementary Material, Table S2).
5.5.2. Areas Predicted as Susceptible to Gully Erosion Only by Model B
Areas that are predicted as highly to very highly susceptible to gully erosion by Model B but not by Model C cover about 11% of the total study catchment. 156 (29%) of the mapped gully heads are located in areas predicted exclusively by Model B as being highly to very highly susceptible to gully erosion. 90% of these 156 gully heads occur at distances of more than 200 m from residential areas, while 58% of these 156 gully heads are located within 50 m of pathways (Supplemental Material, Table S2).
5.5.3. Areas Predicted as Susceptible to Gully Erosion Only by Model C
Overall, 18% of the study area is predicted as having high to very high susceptibility to gully erosion by Model C but not by Model B. Of the mapped gully heads, 151 (28%) are located in areas predicted exclusively by Model C as highly to very highly susceptible to gully erosion, with 91 of these gully heads being located in the hill country, 51 in the transition zone, and 9 in the lowlands. According to the distribution of land use land cover classes, these 151 gully heads primarily occur on uncultivated land (119 gully heads) and to a minor degree on erosion protection terraces (32 gully heads). Gully heads located within 50 m of the pathway network comprise 75% of those located in areas that are highly to very highly susceptible to gully erosion as predicted by Model C only. 86% of the gully heads occurring in areas predicted as susceptible to erosion exclusively by Model C are located within a distance of 50–200 m to settlement areas. Slopes with 15–30° inclination accommodate 77% of these 151 gully heads (Supplementary Material, Table S2).
5.5.4. Areas Predicted to Have Moderate Gully Erosion Susceptibility by Either Model B and Model C or by One of Them
Areas classified as being moderately susceptible to gully erosion either by Model B or Model C or by both show majority votes in the random forest between 40%–60% of all trees. These areas only cover about 1% of the total study catchment and do not follow a distinctive spatial pattern (Figure 5d). Only 7 (1%) of all mapped gully heads are located in such areas. In consequence, these areas are used to exclude uncertain classifications from the comparisons.
5.5.5. Areas Predicted as Non-Susceptible to Gully Erosion by Either Model B and Model C or by One of Them
Up to 60% of the study area is classified as having low to very low susceptibility to gully erosion by Model B as well as by Model C. These areas predominantly occur in the lowlands and partly the hill country (Figure 5d). In total, 49 of the mapped gully heads (9%) are located in areas predicted as having low to very low susceptibility to gully erosion either by Model B or by Model C, and 30 of these 49 mapped gully heads are located in the lowlands, 11 in the transition zone and 8 in the hill country. Correspondingly, 28 of these 49 gully heads are located on slopes with an inclination of less than 5° (Supplemental Material, Table S2). 31 of these 49 gully heads located in areas predicted to have low to very low gully erosion susceptibility can be found at distances of more than 200 m to settlement areas; 25 of these 49 gully heads are located less than 50 m from pathways.
6. Discussion
6.1. Modeling Gully Erosion Susceptibility
Comparing performances between the three Models A-C designed to predict gully erosion susceptibility by applying different conditioning factors in general certifies that all three models achieve a satisfying classification accuracy for gully erosion susceptibility (Table 2). The achieved accuracies are in agreement with performances recently published for gully erosion susceptibility assessment [7,64].
Model B, which includes just environmental factors, and Model C, exclusively including human-related factors, correspond to subsets of Model A. Therefore, the relevance of the implemented variables can be determined by comparing the accuracies of Models B and C. Comparing these two modeling approaches reveals that a considerably higher degree of accuracy is achieved with exclusively environmental rather than strictly human-related factors (Table 2). Consequently, Model A, which integrates all factors, generated the highest accuracy in predicting an area’s susceptibility to gully erosion. Taking both human and non-human related types of factor into account using a single model has previously produced highly accurate GESMs [7,47,64]. However, in these models distances to pathways and settlements were not considered as input factors.
The importance of the factor “distance to pathways” is neither represented in the mean decrease in accuracy (MDA) nor the mean decrease in Gini (MDG) ranking of Model A or Model C (Table 3). However, areas close to settlements, which like pathways are similarly exposed to strong trampling and resulting soil compaction [14], are less likely to have gully heads in their immediate vicinity than pathways. The MDA and MDG rankings indicate a more eminent impact of distance to residential areas on the performance in Models A and C than for distances to pathways (Table 3). Methodologically, this inverse importance of both factors relates to the training of Models A–C, as each model was trained by a supervised dataset to create a classification rule, i.e., a multi-classifier, that is able to effectively differentiate between factors associated with gully head points and random non-gully head points. This training implies that a factor that supports the prediction of non-gully heads (true negative classification) but decreases the performance for the prediction of gully heads (true positive classification) can still have a high value for the models and therefore a high importance rank. Consequently, an exclusive comparison of the rankings does not provide robust information about which of the factors have a decisive influence on controlling gully erosion. The root of this problem corresponds to the problems described by Braun [65] while discussing remote-sensing-based land use analysis. His “More Accuracy Less Meaningful” (MALM) approach criticizes the desire for the highest accuracy of predictions seen in many land use modeling studies, which often leads to a neglect of environmental validity for the modeling results. However, the chosen procedure of MDA and MDG rankings reflects how effectively an individual factor contributes to the model’s decision on a distinctive differentiation between gully heads and non-gully heads. Although the evaluation of MDA and MDG rankings is a valuable method to reflect the accuracy of predictions for each model and estimate valuable factors [63,66], it does not allow delineation between the different factor-sets applied in the miscellaneous model approaches.
6.2. Human Influence on Gully Erosion
It is assumed that morpho-dynamics underlie a dynamic equilibrium which can be disturbed by natural triggers as well as human impact [67]. Especially human settlement activities affect this dynamic equilibrium and change tipping points of surface shaping processes [12,67,68,69]. While settlement activities mostly cause an acceleration of erosion processes corresponding to soil erosion [12,68,69], targeted soil conservation and water harvesting measures increase landscape stability [70,71].
6.2.1. Land Use and Land Cover
The land use land cover factor (LULC) is one of the most eminent factors for Models A and C, which corresponds to the results of Gayen et al. [64] and the observations of Valentin et al. [5]. The land use land cover factor primarily displays areas that are utilized by humans (cropland, terraces, settlement areas) combined with different environmental characteristics and may also indicate land degradation [5,16,32]. One indicator for human-accelerated soil degradation is the extensive badlands found in the lowlands within the main agricultural area of the study catchment, which is predominantly used for cash crop cultivation. Human-driven interventions contributing to such soil disturbance are unsuitable soil cultivation practices and unsuitable crops [72], as well as insufficient maintenance of the cropping areas [14].
The majority of gully heads occur in areas that are classified as uncultivated. These areas, especially in the hill country, are primarily covered by sparse shrubland with poor ground vegetation. The resulting poor leaf coverage increases exposure to raindrop impact and generation of saturation overland flow [73,74] and causes low rooting density that reduces ground stabilization [75,76], and both contexts increase exposure to soil erosion and gully erosion, especially when combined with steep slope inclinations [74]. Moreover, pathways crossing these uncultivated areas are not considered in the land use land cover classification, thus the effects of gully erosion due to concentrated runoff developing along pathways cannot be differentiated [14,17]. Gully head density in areas of erosion protection terraces (192 gully heads/km2) is higher than gully head density in uncultivated areas (163 gully heads/km2) and, thus, indicates a higher susceptibility to gully erosion. The construction of erosion protection terraces aims to increase slope stability in the headwater area and thus to reduce linear erosion. However, although they are intended to prevent erosion, terraces in the study catchment are an area highly affected by gully erosion (Table S1). Similar to the descriptions of Nyssen et al. [17] and Schütt et al. [14], most of the stone terrace risers in the study catchment are unmaintained. Accordingly, their protective function is impaired, and especially during heavy rainfall events, backward erosion causes dissection of the terrace risers (cf. ‘bank gullies’) [6]. Further, uncontrolled excess water in the terraces infiltrates and soaks the riser, putting pressure on it in line with the hydraulic gradient [77]. Especially at the transition from dry season to rainy season, desiccation cracks frequently foster infiltration and the generation of subsurface runoff [77,78,79]. Large mud cracks observed on the surface of the terrace treads indicate such subsurface processes. For semi-arid areas, Bocco [11] observes that 60% of the gullies formed as a result of piping. The rare occurrence of gullies on croplands and plantations corresponds to the relatively flat terrain of these areas, which are mostly located in the lowlands, and thus the lack of the minimum hydraulic gradient for gully head development [11].
6.2.2. Distance from Pathways
Mapping of gully heads shows that about a quarter of the gully heads are located within 5 m of pathways, and almost all gully heads are located less than 100 m from pathways (Table S1). These findings coincide with the observations of Schütt et al. [14], who suggest that the initiation of gully erosion in the immediate vicinity of pathways is due to runoff concentration along the pathways. These observations were later validated for the Tigray region [21]. During the field survey it was observed that mainly cattle herds and occasional groups of people moved along the pathways to and from the Adwa-Adi Ugri main road, forming pathways by repeated trampling along the same route. The surface of pathways is usually bare, and trampling compacts the near-surface underground and reduces its pore volume [80]. Consequentially, during rainfall events, the reduced infiltration capacity of these compacted surfaces favors the generation of surface runoff [14,16,48,81]. Where this surface runoff causes erosion along the pathway, a hollow way can develop. It has been observed that most of these situations occur in areas of moderate relief, such as the transition zone. In contrast, in areas of stronger relief, such as in the hill country, surface runoff along the pathways is likely to result in downslope wash-over of the downhill pathway edge, consequently resulting in linear erosion in the direct slope direction, frequently at right angles to the pathway.
6.2.3. Distance from Settlements
Gully heads usually do not develop in the direct vicinity of settlements, with the majority of gully heads (71%) developing >100 m from settlements. As the immediate area around settlements is greatly affected by trampling and soil compaction, this is in sharp contrast to the development of gullies close to pathways. This contradiction can be explained by the fact that the terrain in settlement areas is mostly flat to moderately sloped, thus lacking the necessary hydraulic gradient to initiate gullies [11]. This coincides with the observation that the occurrence of gully heads in the vicinity of settlements in general coincides with an increase in slope inclination. In consequence, the results do not indicate a direct positive connection between the location of gully heads and settlement areas. However, this result is weakened by the distinct connection between the positions of gully heads and pathways and the merging of pathways at settlements (Figure 2b).
6.3. Modeling Environmental and Human-Related Factors
In order to assess areas of natural stability and areas affected by human influences and settlement activities, a change detection was conducted between the Gully Erosion Susceptibility Maps (GESM) with models based exclusively on natural factors (Model B) and exclusively on human-related factors (Model C). The change detection allows estimation of the influence of these two types of factor on triggering gully erosion. Change detection of gully erosion susceptibility prediction by Model B and Model C reveals that ca. 25% of the mapped gully heads are due to their location as distinctly controlled by human-related factors (LULC, distance to pathways, distance to settlement areas). Furthermore, according to the MDA and MDG evaluations, all three human-related factors are eminent for the RF algorithm of Model A, taking all factors into account (Table 3).
Independently from each other, Models B and C predicted the location of 29% and 28% of gully heads. Gully heads that occur in an overlap prediction of both Models B and C (34%) are more likely to be interpreted as environmentally triggered. However, the accelerating effect of diffuse human activities on land degradation and erosion processes (e.g., overgrazing, reducing infiltration capacity by soil compaction, damaging irrigation techniques, tillage) should not be ignored [13,68]. Accordingly, areas assessed as susceptible to gully erosion by Models B and C cannot be strictly attributed to a distinctively environmental origin. Considering the number of gully heads that are predicted by applying exclusively human factors (Model C) and those which are potentially influenced by an accelerating human-effect (overlapping predictions of Models B and C), the maximum human impact influences the development of up to 62% of the mapped gully heads.
7. Conclusions
It is evident from this work that gullies tend to occur in the immediate vicinity of footpaths, but not necessarily in the direct vicinity of residential areas. In general, gullies develop close to human-influenced areas, but environmental factors control their ultimate formation. In this respect, it is necessary to consider human influence as an accelerating factor when predicting Gully Erosion Susceptibility. In this research, different types of human influence were combined for the first time to generate a Gully Erosion Susceptibility Map (GESM) using a study catchment in the Ethiopian Highlands. The application of the data-mining algorithm “Random Forest” provided powerful models with stable and accurate predictions of Gully Erosion Susceptibility by incorporating several different natural and human-related factors. Applying the change detection tool enabled us to distinguish between natural and human-related drivers for gully head development and to identify intersections of both types of factors. Including the distance to pathways as an additional variable that affects gully erosion and distinguishing between natural and human-related factors by comparing Gully Erosion Susceptibility Maps can both be used to identify, monitor, and prevent further human acceleration of land degradation. Further research is required to better understand the impact of settlement activities on landscape dynamics taking both spatial and temporal aspects into account. Within a heterogeneous environment, modeling approaches should integrate such activities to provide applicable predictions of gully erosion susceptibility.
Supplementary Materials
The following are available online at https://0-www-mdpi-com.brum.beds.ac.uk/article/10.3390/rs13102009/s1, Figure S1: Gully erosion conditioning factors of the study catchment tributary to the Inda Shawit River; Table S1: Spatial coverage and distribution of gully heads among all conditioning factors; Table S2: Distribution of gully heads among all differences between Models B and C; Table S3: Multicollinearity of gully erosion conditioning factors by measures of the variable inflation factor.
Author Contributions
Conceptualization, R.B., J.H., N.N., B.S.; methodology, R.B.; software, R.B.; validation, R.B.; formal analysis, R.B.; investigation, R.B.; resources, R.B., N.N., J.H.; data curation, R.B.; writing—original draft preparation, R.B.; writing—review and editing, B.S., N.N., J.H.; visualization, R.B.; supervision, J.H., B.S.; project administration, J.H., B.S.; funding acquisition, B.S. All authors have read and agreed to the published version of the manuscript.
Funding
This research was funded by the Deutsche Forschungsgemeinschaft (DFG) as part of the project “Routes of Interaction: Interregional Contacts between the Northern Horn of Africa and the Nile Region” associated with the DFG priority program (SPP 2143) “Entangled Africa: Intra-African connections between Rainforest and Mediterranean (ca. 6000 to 500 BP)” (Project number: 361129650).
Data Availability Statement
DSM Source: ALOS Global DSM (v. 2.2–2014) available at (https://www.eorc.jaxa.jp/ALOS/en/aw3d30/index.htm, accessed on 7 July 2019); Sentinel-2 satellite imagery data, available at (https://scihub.copernicus.eu, accessed on 21 February 2020); Geological map of Axum (Map sheet: ND-37-6; scale: 1:250,000, Geological Survey of Ethiopia); Soil types: Jones et al. (2013) Soil Atlas of Africa, available at (https://esdac.jrc.ec.europa.eu, accessed on 8 December 2019).
Acknowledgments
The authors would like to express their gratitude for the logistical possibilities offered by the Sana’a branch of the German Archaeological Institute (DAI) under the direction of Iris Gerlach as well as the entire team during the field campaign in 2019. We would also like to thank the Department of Research and Conservation of Cultural Heritage of the Federal Democratic Republic of Ethiopia, executed by Haileyesus Desta Ayalew, Tsegazeab Mezgebe and Haftum Birhane, for accompanying our work. Furthermore, we would like to thank Katharine Thomas for English proofreading, the editor, and all anonymous reviewers for their helpful comments. We acknowledge support by the Open Access Publication Fund of the Freie Universität Berlin.
Conflicts of Interest
The authors declare no conflict of interest.
References
- Castillo, C.; Gómez, J. A century of gully erosion research: Urgency, complexity and study approaches. Earth-Sci. Rev. 2016, 160, 300–319. [Google Scholar] [CrossRef]
- Léonard, J.; Richard, G. Estimation of runoff critical shear stress for soil erosion from soil shear strength. Catena 2004, 57, 233–249. [Google Scholar] [CrossRef]
- Haregeweyn, N.; Tsunekawa, A.; Nyssen, J.; Poesen, J.; Tsubo, M.; Meshesha, D.T.; Schütt, B.; Adgo, E.; Tegegne, F. Soil erosion and conservation in Ethiopia. Prog. Phys. Geogr. Earth Environ. 2015, 39, 750–774. [Google Scholar] [CrossRef] [Green Version]
- Taddese, G. Land degradation: A challenge to Ethiopia. Environ. Manag. 2001, 27, 815–824. [Google Scholar] [CrossRef] [PubMed]
- Valentin, C.; Poesen, J.; Li, Y. Gully erosion: Impacts, factors and control. Catena 2005, 63, 132–153. [Google Scholar] [CrossRef]
- Poesen, J.; Nachtergaele, J.; Verstraeten, G.; Valentin, C. Gully erosion and environmental change: Importance and research needs. Catena 2003, 50, 91–133. [Google Scholar] [CrossRef]
- Arabameri, A.; Pradhan, B.; Pourghasemi, H.R.; Rezaei, K.; Kerle, N. Spatial Modelling of Gully Erosion Using GIS and R Programing: A Comparison among Three Data Mining Algorithms. Appl. Sci. 2018, 8, 1369. [Google Scholar] [CrossRef] [Green Version]
- Arabameri, A.; Blaschke, T.; Pradhan, B.; Pourghasemi, H.R.; Tiefenbacher, J.P.; Bui, D.T. Evaluation of Recent Advanced Soft Computing Techniques for Gully Erosion Susceptibility Mapping: A Comparative Study. Sensors 2020, 20, 335. [Google Scholar] [CrossRef] [Green Version]
- Hosseinalizadeh, M.; Kariminejad, N.; Chen, W.; Pourghasemi, H.R.; Alinejad, M.; Behbahani, A.M.; Tiefenbacher, J.P. Gully headcut susceptibility modeling using functional trees, naïve Bayes tree, and random forest models. Geoderma 2019, 342, 1–11. [Google Scholar] [CrossRef]
- Pourghasemi, H.R.; Yousefi, S.; Kornejady, A.; Cerdà, A. Performance assessment of individual and ensemble data-mining techniques for gully erosion modeling. Sci. Total Environ. 2017, 609, 764–775. [Google Scholar] [CrossRef] [Green Version]
- Bocco, G. Gully erosion: Processes and models. Prog. Phys. Geogr. Earth Environ. 1991, 15, 392–406. [Google Scholar] [CrossRef]
- Dotterweich, M. The history of soil erosion and fluvial deposits in small catchments of central Europe: Deciphering the long-term interaction between humans and the environment—A review. Geomorphology 2008, 101, 192–208. [Google Scholar] [CrossRef]
- Oldeman, L.R. Guidelines for General Assessment of the Status of Human-Inducted Soil Degradation; ISRIC: Wageningen, The Netherlands, 1988. [Google Scholar]
- Schütt, B.; Förch, G.; Thiemann, S. Soil erosion processes and landscape sensitivity in the Ethiopian Highlands. In Sustainable Management of Water Resources: Challenges and Prospects; Prasad, H., Abate, K., Ondieki, C.M., Eds.; Kenyatta University: Nairobi, Kenya, 2005; pp. 177–203. [Google Scholar]
- Schütt, B. Die indirekten Einflüsse des Menschen auf die Reliefsphäre. In Die Erdoberfläche-Lebens-und Gestaltungsraum Des Menschen: Forschungsstrategische und Programmatische Leitlinien Zukünftiger Geomorphologischer Forschung und Lehre; Dikau, R., Moldenhauer, K.-M., Bedehäsing, J., Eds.; Gebrüder Borntraeger: Berlin, Germany, 2006; pp. 47–55. ISBN 9783443211486. [Google Scholar]
- Sidle, R.C.; Jarihani, B.; Kaka, S.I.; Koci, J.; Al-Shaibani, A. Hydrogeomorphic processes affecting dryland gully erosion: Implications for modelling. Prog. Phys. Geogr. Earth Environ. 2019, 43, 46–64. [Google Scholar] [CrossRef]
- Nyssen, J.; Poesen, J.; Moeyersons, J.; Deckers, J.; Haile, M.; Lang, A. Human impact on the environment in the Ethiopian and Eritrean highlands—a state of the art. Earth-Sci. Rev. 2004, 64, 273–320. [Google Scholar] [CrossRef]
- Sidle, R.C.; Ochiai, H. Landslides: Processes, Prediction, and Land Use; American Geophysical Union: Washington, DC, USA, 2006; ISBN 978-0-87590-322-4. [Google Scholar]
- Bull, L.; Kirkby, M. Gully processes and modelling. Prog. Phys. Geogr. Earth Environ. 1997, 21, 354–374. [Google Scholar] [CrossRef]
- Kirkby, M.J.; Bracken, L.J. Gully processes and gully dynamics. Earth Surf. Process. Landf. 2009, 34, 1841–1851. [Google Scholar] [CrossRef]
- Nir, N.; Knitter, D.; Hardt, J.; Schütt, B. Human movement and gully erosion: Investigating feedback mechanisms using Frequency Ratio and Least Cost Path analysis in Tigray, Ethiopia. PLoS ONE 2021, 16, e0245248. [Google Scholar] [CrossRef]
- Frankl, A. Gully development and its spatio-temporal variability since the late 19th century in the northern Ethiopian Highlands. Afr. Focus 2012, 25, 25. [Google Scholar] [CrossRef]
- Nyssen, J.; Vandenreyken, H.; Poesen, J.; Moeyersons, J.; Deckers, J.; Haile, M.; Salles, C.; Govers, G. Rainfall erosivity and variability in the Northern Ethiopian Highlands. J. Hydrol. 2005, 311, 172–187. [Google Scholar] [CrossRef]
- Climate-Data.org. Klima Adwa (Äthiopien). Available online: https://de.climate-data.org/afrika/aethiopien/tigray/adwa-31960/ (accessed on 1 January 2021).
- Abebe, B.A. Modeling the Effect of Climate and Land Use Change on the Water Resources in Northern Ethiopia: The Case of Suluh River Basin. Ph.D. Thesis, Freie Universität Berlin, Berlin, Germany, 2014. [Google Scholar]
- Lemenih, E.M. Production, Value Addition and Marketing of Non-Wood Forest Products (NWFPs) from Arid and Semi-Arid Lands (ASALs) of Ethiopia; Intergovernmental Authority on Development: Addis Ababa, Ethiopia, 2010. [Google Scholar]
- Jones, A.; Breuning-Madsen, H.; Brossard, M.; Dampha, A.; Deckers, J.; Dewitte, O.; Gallali, T.; Hallett, S.; Jones, R.; Kilasara, M.; et al. Soil Atlas of Afrika; Publications Office of the European Union: Luxembourg, 2013. [Google Scholar]
- Conoscenti, C.; Di Maggio, C.; Rotigliano, E. Soil erosion susceptibility assessment and validation using a geostatistical multivariate approach: A test in Southern Sicily. Nat. Hazards 2008, 46, 287–305. [Google Scholar] [CrossRef]
- Ghosh, S.; Guchhait, S.K. Geomorphic Threshold and SCS-CN-Based Runoff and Sediment Yield Modelling in the Gullies of Dwarka–Brahmani Interfluve, West Bengal, India. In Gully Erosion Studies from India and Surrounding Regions; Shit, P.K., Pourghasemi, H.R., Bhunia, G.S., Eds.; Springer International Publishing: Cham, Switzerland, 2020; pp. 45–68. ISBN 978-3-030-23242-9. [Google Scholar]
- Schumm, S.A. Geomorphic Thresholds: The Concept and Its Applications. Trans. Inst. Br. Geogr. 1979, 4, 485. [Google Scholar] [CrossRef]
- Arabameri, A.; Pradhan, B.; Rezaei, K.; Conoscenti, C. Gully erosion susceptibility mapping using GIS-based multi-criteria decision analysis techniques. Catena 2019, 180, 282–297. [Google Scholar] [CrossRef]
- Rahmati, O.; Haghizadeh, A.; Pourghasemi, H.R.; Noormohamadi, F. Gully erosion susceptibility mapping: The role of GIS-based bivariate statistical models and their comparison. Nat. Hazards 2016, 82, 1231–1258. [Google Scholar] [CrossRef]
- Razavi-Termeh, S.V.; Sadeghi-Niaraki, A.; Choi, S.-M. Gully erosion susceptibility mapping using artificial intelligence and statistical models. Geomat. Nat. Hazards Risk 2020, 11, 821–844. [Google Scholar] [CrossRef]
- Zabihi, M.; Mirchooli, F.; Motevalli, A.; Darvishan, A.K.; Pourghasemi, H.R.; Zakeri, M.A.; Sadighi, F. Spatial modelling of gully erosion in Mazandaran Province, northern Iran. Catena 2018, 161, 1–13. [Google Scholar] [CrossRef]
- Boardman, J. Soil erosion science: Reflections on the limitations of current approaches. Catena 2006, 68, 73–86. [Google Scholar] [CrossRef]
- Jungerius, P.D.; Matundura, J.; Van De Ancker, J.A.M. Road construction and gully erosion in West Pokot, Kenya. Earth Surf. Process. Landf. 2002, 27, 1237–1247. [Google Scholar] [CrossRef]
- Nyssen, J.; Poesen, J.; Moeyersons, J.; Luyten, E.; Veyret-Picot, M.; Deckers, J.A.; Haile, M.; Govers, G. Impact of road building on gully erosion risk: A case study from the Northern Ethiopian Highlands. Earth Surf. Process. Landf. 2002, 27, 1267–1283. [Google Scholar] [CrossRef]
- Wischmeier, W.H.; Smith, D.D. Predicting Rainfall Erosion Losses: A Guide to Conservation Planning; Department of Agriculture, Science and Education Administration: Washington, DC, USA, 1978. [Google Scholar]
- Alewell, C.; Borrelli, P.; Meusburger, K.; Panagos, P. Using the USLE: Chances, challenges and limitations of soil erosion modelling. Int. Soil Water Conserv. Res. 2019, 7, 203–225. [Google Scholar] [CrossRef]
- Evans, R.; Boardman, J. The new assessment of soil loss by water erosion in Europe. Panagos P. et al., 2015 Environmental Science & Policy 54, 438–447—A response. Environ. Sci. Policy 2016, 58, 11–15. [Google Scholar] [CrossRef]
- Knisel, W.G. CREAMS: A Field Scale Model for Chemicals, Runoff, and Erosion from Agricultural Management Systems; Conservation report; Department of Agriculture, Science and Education Administration: Washington, DC, USA, 1980; Volume 26, p. 640. [Google Scholar]
- Morgan, R.P.C.; Quinton, J.N.; Smith, R.E.; Govers, G.; Poesen, J.; Auerswald, K.; Chisci, G.; Torri, D.; Styczen, M.E. The European Soil Erosion Model (EUROSEM): A dynamic approach for predicting sediment transport from fields and small catchments. Earth Surf. Process. Landf. 1998, 23, 527–544. [Google Scholar] [CrossRef]
- Woodward, D. Method to predict cropland ephemeral gully erosion. Catena 1999, 37, 393–399. [Google Scholar] [CrossRef]
- Flanagan, D.C.; Ascough, J.C.; Nearing, M.A.; Laflen, J.M. The Water Erosion Prediction Project (WEPP) Model. In Landscape Erosion and Evolution Modeling; Springer Science and Business Media LLC: Berlin, Germany, 2001; pp. 145–199. [Google Scholar]
- Gayen, A.; Pourghasemi, H.R.; Saha, S.; Keesstra, S.; Bai, S. Gully erosion susceptibility assessment and management of hazard-prone areas in India using different machine learning algorithms. Sci. Total Environ. 2019, 668, 124–138. [Google Scholar] [CrossRef] [PubMed]
- Breiman, L. Manual on Setting up, Using, and Understanding Random Forests v3.1; Statistics Department University of California Berke: California, CA, USA, 2002. [Google Scholar]
- Rahmati, O.; Tahmasebipour, N.; Haghizadeh, A.; Pourghasemi, H.R.; Feizizadeh, B. Evaluating the influence of geo-environmental factors on gully erosion in a semi-arid region of Iran: An integrated framework. Sci. Total Environ. 2017, 579, 913–927. [Google Scholar] [CrossRef] [PubMed]
- Harden, C.P. Incorporating roads and footpath in watershed-scale hydrologic and soil erosion models. Phys. Geogr. 1992, 13, 368–385. [Google Scholar] [CrossRef]
- Tarboton, D.G.; Bras, R.L.; Rodriguez-Iturbe, I. A physical basis for drainage density. Geomorphology 1992, 5, 59–76. [Google Scholar] [CrossRef]
- Böhner, J.; Selige, T. Spatial prediction of soil attributes using terrain analysis and climate regionalization. Göttinger Geograph. Abh. 2002, 115, 13–27. [Google Scholar]
- Panagos, P.; Borrelli, P.; Poesen, J.; Ballabio, C.; Lugato, E.; Meusburger, K.; Montanarella, L.; Alewell, C. The new assessment of soil loss by water erosion in Europe. Environ. Sci. Policy 2015, 54, 438–447. [Google Scholar] [CrossRef]
- Jasiewicz, J.; Stepinski, T.F. Geomorphons—A pattern recognition approach to classification and mapping of landforms. Geomorphology 2013, 182, 147–156. [Google Scholar] [CrossRef]
- Kiss, R. Determination of drainage network in digital elevation models, utilities and limitations. J. Hung. Geomath. 2004, 2, 16–29. [Google Scholar]
- Bisrat, E.; Kidanewold, B. Identification of surface water storing sites using Topographic Wetness Index (TWI) and Normalized Difference Vegetation Index (NDVI). J. Nat. Resour. Dev. 2018, 8, 91–100. [Google Scholar]
- Tadesse, T.; Habteselassie, B.; Mekonnen, T.; Tadesse, A.; Mahari, K.; Gudaya, A.; Seyid, G.; Genzebu, W.; Birhane, S.; Haro, W.; et al. Geological Map of Axum, Mapsheet: ND 37-6; Geological Survey of Ethiopia: Addis Ababa, Ethiopia, 1999.
- Dube, F.; Nhapi, I.; Murwira, A.; Gumindoga, W.; Goldin, J.; Mashauri, D. Potential of weight of evidence modelling for gully erosion hazard assessment in Mbire District–Zimbabwe. Phys. Chem. Earth Parts A/B/C 2014, 67–69, 145–152. [Google Scholar] [CrossRef]
- Moore, I.D.; Grayson, R.B.; Ladson, A.R. Digital terrain modelling: A review of hydrological, geomorphological, and biological applications. Hydrol. Process. 1991, 5, 3–30. [Google Scholar] [CrossRef]
- Beven, K.J.; Kirkby, M.J. A physically based, variable contributing area model of basin hydrology/Un modèle à base physique de zone d’appel variable de l’hydrologie du bassin versant. Hydrol. Sci. Bull. 1979, 24, 43–69. [Google Scholar] [CrossRef] [Green Version]
- Breiman, L. Random Forests. Mach. Learn. 2001, 45, 5–32. [Google Scholar] [CrossRef] [Green Version]
- Liaw, A.; Wiener, M. Classification and Regression by RandomForest. R News 2001, 2, 18–22. [Google Scholar]
- Breiman, L. Bagging Predictors. Mach. Learn. 1996, 24, 123–140. [Google Scholar] [CrossRef] [Green Version]
- Micheletti, N.; Foresti, L.; Robert, S.; Leuenberger, M.; Pedrazzini, A.; Jaboyedoff, M.; Kanevski, M. Machine Learning Feature Selection Methods for Landslide Susceptibility Mapping. Math. Geosci. 2014, 46, 33–57. [Google Scholar] [CrossRef] [Green Version]
- Nicodemus, K.K. Letter to the Editor: On the stability and ranking of predictors from random forest variable importance measures. Brief. Bioinform. 2011, 12, 369–373. [Google Scholar] [CrossRef] [Green Version]
- Gayen, A.; Haque, S.M.; Saha, S. Modeling of Gully Erosion Based on Random Forest Using GIS and R. In Gully Erosion Studies from India and Surrounding Regions; Shit, P.K., Pourghasemi, H.R., Bhunia, G.S., Eds.; Springer International Publishing: Cham, Switzerland, 2020; pp. 35–44. ISBN 978-3-030-23242-9. [Google Scholar]
- Braun, A.C. More accurate less meaningful? A critical physical geographer’s reflection on interpreting remote sensing land-use analyses. Prog. Phys. Geogr. Earth Environ. 2021. [Google Scholar] [CrossRef]
- Calle, M.L.; Urrea, V. Letter to the Editor: Stability of Random Forest importance measures. Brief. Bioinform. 2010, 12, 86–89. [Google Scholar] [CrossRef] [PubMed] [Green Version]
- Ahnert, F. Equilibrium, scale and inheritance in geomorphology. Geomorphology 1994, 11, 125–140. [Google Scholar] [CrossRef]
- Bork, H.-R. Landschaftsentwicklung in Mitteleuropa: Wirkungen des Menschen auf Landschaften; Klett-Perthes: Gotha, Germany, 1998; ISBN 3-623-00849-4. [Google Scholar]
- Dotterweich, M. The history of human-induced soil erosion: Geomorphic legacies, early descriptions and research, and the development of soil conservation—A global synopsis. Geomorphology 2013, 201, 1–34. [Google Scholar] [CrossRef]
- Berking, J.; Beckers, B.; Schütt, B. Runoff in two semi-arid watersheds in a geoarcheological context: A case study of Naga, Sudan, and Resafa, Syria. Geoarchaeology 2010, 25, 815–836. [Google Scholar] [CrossRef]
- Berking, J.; Beckers, B.; Knitter, D.; Schütt, B. Problems Concerning Ancient Water Management in the Mediterranean. J. Anc. Stud. 2016, 6, 74–101. [Google Scholar]
- Torri, D.; Rossi, M.; Brogi, F.; Marignani, M.; Bacaro, G.; Santi, E.; Tordoni, E.; Amici, V.; Maccherini, S. Badlands and the Dynamics of Human History, Land Use, and Vegetation Through Centuries. In Badlands Dynamics in a Context of Global Change; Elsevier Science: Amsterdam, The Netherlands, 2018; pp. 111–153. [Google Scholar]
- Young, R.A.; Wiersma, J.L. The role of rainfall impact in soil detachment and transport. Water Resour. Res. 1973, 9, 1629–1636. [Google Scholar] [CrossRef]
- Zhang, Q.; Wang, Z.; Wu, B.; Shen, N.; Liu, J. Identifying sediment transport capacity of raindrop-impacted overland flow within transport-limited system of interrill erosion processes on steep loess hillslopes of China. Soil Tillage Res. 2018, 184, 109–117. [Google Scholar] [CrossRef]
- Zheng, F.-L. Effect of Vegetation Changes on Soil Erosion on the Loess Plateau. Pedosphere 2006, 16, 420–427. [Google Scholar] [CrossRef]
- Zhou, P.; Luukkanen, O.; Tokola, T.; Nieminen, J. Effect of vegetation cover on soil erosion in a mountainous watershed. Catena 2008, 75, 319–325. [Google Scholar] [CrossRef]
- Bryan, R.; Jones, J. The significance of soil piping processes: Inventory and prospect. Geomorphology 1997, 20, 209–218. [Google Scholar] [CrossRef]
- Derbyshire, E. Geological hazards in loess terrain, with particular reference to the loess regions of China. Earth-Sci. Rev. 2001, 54, 231–260. [Google Scholar] [CrossRef]
- Schütt, B.; Frechen, M.; Hoelzmann, P.; Fritzenwenger, G. Late Quaternary landscape evolution in a small catchment on the Chinese Loess Plateau. Quat. Int. 2011, 234, 159–166. [Google Scholar] [CrossRef]
- Wilson, J.P.; Seney, J.P. Erosional Impact of Hikers, Horses, Motorcycles, and Off-Road Bicycles on Mountain Trails in Montana. Mt. Res. Dev. 1994, 14, 77. [Google Scholar] [CrossRef]
- Weaver, T.; Dale, D. Trampling effects of hikers, motorcycles and horses in meadows and forests. J. Appl. Ecol. 1978, 15, 451–457. [Google Scholar] [CrossRef]
Figure 1.
Regional overview. Hill-shade map of the study catchment (red frame) and the surroundings based on ALOS Global DSM elevation data with 30 m × 30 m pixel size (Version 2.2.), ©JAXA 2014.
Figure 1.
Regional overview. Hill-shade map of the study catchment (red frame) and the surroundings based on ALOS Global DSM elevation data with 30 m × 30 m pixel size (Version 2.2.), ©JAXA 2014.

Figure 2.
Overview map of the studied catchment area (red frame in Figure 1) and the mainstream (river) to which the watershed streams are tributary (ALOS Global DSM). (a) includes the drainage network, differentiated into gullies, main channels, and rivers. The white line marks the local topography-based division into lowlands (<1463 m above sea level (a.s.l.), transition (1463–1575 m a.s.l.), and hill country (>1575 m a.s.l.). (b) shows areas of human interaction (residential areas, pathways and hollow ways).

Figure 3.
Workflow for modeling gully erosion susceptibility.

Figure 4.
Comparison of the model performances by estimating the “receiver operating characteristic” (ROC) curve for each model (A-overall; B-environmental; C-human-related). Corresponding “area under the curve” (AUC) shares are shown in brackets.
Figure 4.
Comparison of the model performances by estimating the “receiver operating characteristic” (ROC) curve for each model (A-overall; B-environmental; C-human-related). Corresponding “area under the curve” (AUC) shares are shown in brackets.

Figure 5.
Pixel-wise predicted Gully Erosion Susceptibility Maps (GESM) and change detection between Models B and C. (a) Model A–based on 16 environmental and human-related factors, (b) Model B–based on 13 environmental factors, (c) Model C–based on three human-related factors, (d) Change detection between Models B and C.


Table 1.
Factors conditioning gully erosion for Models A, B and C including associated environmental or human-related origin, calculation methods and references to case studies that either established this method or related it to the development of gully erosion.
Table 1.
Factors conditioning gully erosion for Models A, B and C including associated environmental or human-related origin, calculation methods and references to case studies that either established this method or related it to the development of gully erosion.
| Model | Factor | Association | Database/method/algorithm | Reference | |
|---|---|---|---|---|---|
| Model A | Model B | Elevation | Environmental | 30 m ALOS Global DSM (v. 2.2–2014) | Japan Aerospace Exploration Agency (JAXA) |
| Slope degree | Environmental | Slope/ArcMap | |||
| Slope aspect | Environmental | Aspect/ArcMap | [49] | ||
| Slope length and steepness (LS) | Environmental | LS (Böhner and Selige 2006)/SAGA GIS | [50,51] | ||
| Curvature/landforms | Environmental | r.geomorphon/GRASS GIS | [52] | ||
| Convergence Index (CI) | Environmental | Convergence Index/SAGA GIS | [53] | ||
| Normalized Difference Vegetation Index (NDVI) | Environmental | European Space Agency (ESA)/Sentinel 2B (level 1-C) image (24.09.2019)/BOA-correction/NDVI/SNAP | [54] | ||
| Bedrock | Environmental | Geological map of Axum (Map sheet: ND-37-6; scale: 1:250,000, GSE)/Digitalization/rasterized (30 × 30 m)/ArcMap | [55] | ||
| Soil type | Environmental | European Soil Data Centre (ESDAC)/Soil Atlas of Africa (scale: 1:1,000,000–5,000,000)/digital polygons/rasterized (30 × 30 m)/ArcMap | [27] | ||
| Drainage Density | Environmental | Raster Calculation/ArcMap | [49] | ||
| Distance to river | Environmental | Digital mapping in QGIS/Euclidean distance/ArcMap | [56] | ||
| Stream Power Index (SPI) | Environmental | Stream Power Index/SAGA GIS | [57] | ||
| Topographic Wetness Index (TWI) | Environmental | Topographic Wetness Index/SAGA GIS | [58] | ||
| Model C | Land use land cover (LULC) | Human-related | On-site mapping/digital mapping in QGIS/rasterized (30 × 30 m)/ArcMap | [5,16] | |
| Distance to pathways | Human-related | On-site mapping/digital mapping in QGIS/Euclidean distance in ArcMap | [14,48] | ||
| Distance to residential areas | Human-related | On-site mapping/digital mapping in QGIS/Euclidean distance in ArcMap | [14,17] | ||
Table 2.
Performances of Models A, B, and C by out-of-bag (OOB) error, supervised test validation, and area under the curve (AUC) scores.
Table 2.
Performances of Models A, B, and C by out-of-bag (OOB) error, supervised test validation, and area under the curve (AUC) scores.
| Model | 100%-OOB Error | Test | AUC |
|---|---|---|---|
| Model A | 88.48% | 89.26% | 95.5% |
| Model B | 86.78% | 88.34% | 94.3% |
| Model C | 81.68% | 84.97% | 89.3% |
Table 3.
Rankings of the mean decrease accuracy (MDA) and mean decrease Gini (MDG) for Model A (all factors), Model B (exclusively factors displaying the natural environment) and Model C (exclusively factors displaying human impact).
Table 3.
Rankings of the mean decrease accuracy (MDA) and mean decrease Gini (MDG) for Model A (all factors), Model B (exclusively factors displaying the natural environment) and Model C (exclusively factors displaying human impact).
| MODEL A | ||||
| Rank | Conditioning Factor | MDA | Conditioning Factor | MDG |
| 1 | Drainage Density | 53.19 | Drainage Density | 92.82 |
| 2 | Land use land cover (LULC) | 40.97 | Land use land cover (LULC) | 62.83 |
| 3 | Elevation | 23.90 | Elevation | 43.13 |
| 4 | Slope aspect | 23.51 | Slope degree | 36.39 |
| 5 | Distance to residential areas | 21.13 | Slope aspect | 24.11 |
| 6 | Slope degree | 17.85 | Distance to pathways | 23.41 |
| 7 | Normalized Difference Vegetation Index (NDVI) | 14.22 | Distance to residential areas | 16.43 |
| 8 | Distance to pathways | 12.76 | Curvature/landforms | 14.05 |
| 9 | Distance to river | 8.38 | Slope length and steepness (LS) | 13.85 |
| 10 | Convergence Index (CI) | 8.23 | Convergence Index (CI) | 13.44 |
| 11 | Bedrock | 7.70 | Normalized Difference Vegetation Index (NDVI) | 12.48 |
| 12 | Soil | 7.64 | Topographic Wetness Index (TWI) | 7.60 |
| 13 | Curvature/landforms | 7.40 | Bedrock | 7.02 |
| 14 | Topographic Wetness Index (TWI) | 5.79 | Distance to river | 4.09 |
| 15 | Slope length and steepness (LS) | 5.06 | Soil | 2.72 |
| 16 | Stream Power Index (SPI) | 1.30 | Stream Power Index (SPI) | 1.26 |
| MODEL B | ||||
| 1 | Drainage Density | 66.17 | Drainage Density | 98.28 |
| 2 | Elevation | 32.37 | Elevation | 55.37 |
| 3 | Slope aspect | 25.07 | Slope degree | 50.56 |
| 4 | Normalized Difference Vegetation Index (NDVI) | 23.83 | Slope aspect | 28.64 |
| 5 | Slope degree | 23.19 | Curvature/landforms | 18.92 |
| 6 | Convergence Index (CI) | 13.35 | Normalized Difference Vegetation Index (NDVI) | 18.62 |
| 7 | Bedrock | 12.37 | Slope length and steepness (LS) | 17.95 |
| 8 | Topographic Wetness Index (TWI) | 11.37 | Convergence Index (CI) | 17.78 |
| 9 | Distance to river | 9.81 | Bedrock | 14.04 |
| 10 | Curvature/landforms | 9.27 | Topographic Wetness Index (TWI) | 13.31 |
| 11 | Soil | 5.24 | Distance to river | 6.13 |
| 12 | Slope length and steepness (LS) | 4.27 | Soil | 2.93 |
| 13 | Stream Power Index (SPI) | 1.39 | Stream Power Index (SPI) | 1.55 |
| MODEL C | ||||
| 1 | Land use land cover (LULC) | 160.06 | Land use land cover (LULC) | 169.47 |
| 2 | Distance to residential areas | 31.60 | Distance to residential areas | 39.95 |
| 3 | Distance to pathways | 23.74 | Distance to pathways | 38.19 |
Publisher’s Note: MDPI stays neutral with regard to jurisdictional claims in published maps and institutional affiliations. |
© 2021 by the authors. Licensee MDPI, Basel, Switzerland. This article is an open access article distributed under the terms and conditions of the Creative Commons Attribution (CC BY) license (https://creativecommons.org/licenses/by/4.0/).
Share and Cite
MDPI and ACS Style
Busch, R.; Hardt, J.; Nir, N.; Schütt, B. Modeling Gully Erosion Susceptibility to Evaluate Human Impact on a Local Landscape System in Tigray, Ethiopia. Remote Sens. 2021, 13, 2009. https://0-doi-org.brum.beds.ac.uk/10.3390/rs13102009
AMA Style
Busch R, Hardt J, Nir N, Schütt B. Modeling Gully Erosion Susceptibility to Evaluate Human Impact on a Local Landscape System in Tigray, Ethiopia. Remote Sensing. 2021; 13(10):2009. https://0-doi-org.brum.beds.ac.uk/10.3390/rs13102009
Chicago/Turabian StyleBusch, Robert, Jacob Hardt, Nadav Nir, and Brigitta Schütt. 2021. "Modeling Gully Erosion Susceptibility to Evaluate Human Impact on a Local Landscape System in Tigray, Ethiopia" Remote Sensing 13, no. 10: 2009. https://0-doi-org.brum.beds.ac.uk/10.3390/rs13102009
Note that from the first issue of 2016, this journal uses article numbers instead of page numbers. See further details here.