Article

Examples of Multi-Sensor Determination of Eruptive Source Parameters of Explosive Events at Mount Etna

1
Department of Earth Sciences, University of Geneva, 1205 Geneva, Switzerland
2
Centro Nazionale Terremoti (CNT), Istituto Nazionale di Geofisica e Vulcanologia (INGV), 00143 Rome, Italy
3
Laboratoire Magmas et Volcans, CNRS, IRD, OPGC, Université Clermont-Auvergne, F-63000 Clermont-Ferrand, France
4
Department of Earth Sciences, University of Firenze, 50124 Firenze, Italy
5
Department of Information Engineering, Sapienza University of Rome, 00184 Rome, Italy
6
Centre of Excellence CETEMPS, 67100 L’Aquila, Italy
7
Istituto Nazionale di Geofisica e Vulcanologia, Osservatorio Etneo, 95125 Catania, Italy
*
Author to whom correspondence should be addressed.
Remote Sens. 2021, 13(11), 2097; https://0-doi-org.brum.beds.ac.uk/10.3390/rs13112097
Submission received: 12 May 2021 / Revised: 22 May 2021 / Accepted: 23 May 2021 / Published: 27 May 2021

Abstract

:
Multi-sensor strategies are key to the real-time determination of eruptive source parameters (ESPs) of explosive eruptions necessary to forecast accurately both tephra dispersal and deposition. To explore the capacity of these strategies in various eruptive conditions, we analyze data acquired by two Doppler radars, ground- and satellite-based infrared sensors, one infrasound array, visible video-monitoring cameras as well as data from tephra-fallout deposits associated with a weak and a strong paroxysmal event at Mount Etna (Italy). We find that the different sensors provide complementary observations that should be critically analyzed and combined to provide comprehensive estimates of ESPs. First, all measurements of plume height agree during the strong paroxysmal activity considered, whereas some discrepancies are found for the weak paroxysm due to rapid plume and cloud dilution. Second, the event duration, key to convert the total erupted mass (TEM) in the mass eruption rate (MER) and vice versa, varies depending on the sensor used, providing information on different phases of the paroxysm (i.e., unsteady lava fountaining, lava fountain-fed tephra plume, waning phase associated with plume and cloud expansion in the atmosphere). As a result, TEM and MER derived from different sensors also correspond to the different phases of the paroxysms. Finally, satellite retrievals for grain-size can be combined with radar data to provide a first approximation of total grain-size distribution (TGSD) in near real-time. Such a TGSD shows a promising agreement with the TGSD derived from the combination of satellite data and whole deposit grain-size distribution (WDGSD).

1. Introduction

The injection of large volumes of tephra into the atmosphere during explosive eruptions has the potential to cause air traffic disruption, while the associated fallout may also impact public health, infrastructures, and various economic sectors (e.g., agriculture, tourism) [1,2]. The near real-time monitoring of active volcanoes is, thus, critical and requires strategies that are valid for a large set of eruptive conditions. At Mount Etna (Italy), a variety of monitoring networks exists and includes a unique set of complementary remote sensing systems with ground- and satellite-based infrared instruments (e.g., [3,4,5,6,7,8]), Doppler radars [9,10,11,12,13,14,15], infrasound arrays [16,17], lidar [18,19,20] and visual cameras [20,21,22] (Figure 1a). The Istituto Nazionale di Geofisica e Vulcanologia, Osservatorio Etneo (INGV-OE) is also responsible for characterizing tephra-fallout deposits associated with Etna explosive events [23,24,25,26,27]. Originally, each strategy has been used individually to provide some estimates of key eruptive source parameters (ESPs), such as mass eruption rate (MER), plume height (HT), total erupted mass (TEM), total grain-size distribution (TGSD), necessary to volcanic ash transportation and dispersal models (VATDMs) [3,4,12,13,14,16,21,28,29]. However, due to intrinsic limitations (e.g., sensor detection limits, deposit exposure), individual strategies cannot provide a comprehensive characterization of all these ESPs. Recently, multi-sensor strategies have been developed to better constrain MER, HT, and TGSD from ground sampling, plume models, and available remote sensing systems [7,15,30,31,32,33,34]. Ultimately, multi-sensor strategies are also being used for the real-time determination of column height during volcano monitoring activities [22]. However, the accuracy of such combined strategies remains poorly constrained. Moreover, the sensor applicability limits have been investigated mostly during strong events and not verified for less intense plumes.
Between 2011 and 2015, Etna has produced about 50 paroxysmal events associated with the emission of fountain-fed tephra plumes. All paroxysms are characterized by highly varying ESPs with plume heights ranging between 5.2 and 17.6 km above sea level [8,33,35,36]. Such variability of eruptive processes may challenge the development of multi-sensor strategies especially because they are mostly based on strong paroxysms such as the events on 23 November 2013 [6,7,27] and 3–5 December 2015 [14,37,38]. In order to discuss the capacity of various remote sensing strategies to provide accurate ESPs regardless of eruptive conditions, here we characterize the weak paroxysm that occurred on 10 April 2011 and we compare it with the strong paroxysm of 23 November 2013. It is important to note that in addition to the interest in exploring the characterization of weak paroxysms, which are generally more frequent than strong paroxysms [35,36], such a selection was mostly driven by the availability of geophysical data as well as deposit observations. In fact, both the 10 April 2011 and the 23 November 2013 paroxysms are associated with data from two Doppler radars, visual and infrared cameras, satellite retrievals, and infrasonic signals as well as deposit sampling.
On 8 April 2011, a strombolian activity started at the New Southeast Crater (NSEC) around 06:00 UTC and lasted 2 days until the activity turned into lava fountaining at 09:12 UTC on 10 April 2011 [4,35]. This activity was weak and characterized by few sustained ballistic emissions reaching about 200 m above the crater rim [5]. A fountain-fed plume was emitted (Figure 1b) and reached altitudes of ~4 km above sea level at 10:00 UTC then about 7 km at 11:00 UTC according to the Hybrid Single-Particle Lagrangian Integrated Trajectory Model (HYSPLIT) forecast [39]. Despite this weak activity, the plume was sub-vertical due to the presence of low wind speed with an average of 7.6 m/s [4]. This eruption, that lasted 250 min [30], has been recorded by a total of six different remote sensing systems (i.e., Microwave Weather Radar—MWR, L-Band Radar—VOLDORAD-2B, Satellites—Aqua/Terra- Moderate Resolution Imaging Spectroradiometer (MODIS) and MSG-Spinning Enhanced Visible and Infrared Imager (SEVIRI), Infrasound, Visual and Infrared Cameras) (Figure 1) and the tephra-fallout deposit was sampled just after the event at 18 different locations (Figure 2).
The 23 November 2013 paroxysm is one of the largest paroxysms that occurred at Etna since 2001 [6,7,27,30,31,32]. Sustained lava fountains reaching heights >1 km above the vent generated a moderately weak tephra plume at altitudes of 11–12 km a.s.l. under a mean wind velocity of 17.9 m/s [4]. Bombs and blocks were carried up to 5 km from the vent and a 2-cm thick tephra deposit with cm-sized lapilli up to 20 km from the vent was observed [27]. The 23 November 2013 paroxysmal episode has been well documented and already used in the past as a case study to test multi-sensor strategies [7,15,31,33].
This paper is organized as follows. In Section 2, we present all methodologies and strategies used to derive ESPs of the 10 April 2011 and the 23 November 2013 paroxysms. We describe the results in Section 3 and discuss them in Section 4. Finally, conclusions are drafted in Section 5. See Appendix A for all acronyms and symbols used in this paper.

2. Methodology

2.1. ESPs from Tephra-Fallout Deposit

During the 10 April 2011 paroxysm, the fountain-fed plume was drifted southeastwardly by predominant winds and produced an elongated tephra-fallout deposit up to the coastline (Figure 1 and Figure 2). In total, 18 samples were collected from 7 to 22 km from the NSEC (now simply called SEC). Unfortunately, as often happens at Etna due to the difficult access to summit areas and inside La Valle del Bove, no proximal data, i.e., <7 km from the vent, could be acquired.

2.1.1. Total Erupted Mass and Mass Eruption Rate

We compiled an isomass map from measurements of ground accumulation (g/m2) across the entire deposit. The TEM associated with the tephra-fallout deposit (TEMdep) was obtained based on the most used strategies in literature, i.e., by integrating the exponential best fit [40], the power-law best fit [41], and the Weibull best fit functions [42] of mass/area data versus the square root of isomass contours (Figure 2). The average MERdep was then derived by dividing the TEMdep obtained by the three integration methods by the duration of the tephra plume emission based on the two most meaningful remote sensing systems for this phase (i.e., MWR and satellite-based data; see following sections for more details).

2.1.2. Whole Deposit Grain-Size Distribution

All tephra-fallout samples were manually sieved down to 4 Φ (i.e., 63 microns). We obtained the mass of all individual sieved fractions, i.e., each half Φ class, using a 10−4 g resolution weighing scale (Figure A1). We determined the size distributions of all samples having a mass of ≤1 g using a BETTERSIZER morpho-grainsizer (https://www.3p-instruments.com/analyzers/bettersizer_s3_plus/; accessed on 26 May 2021). We applied the Voronoi Tessellation method of Bonadonna and Houghton [41] to compute the whole deposit grain-size distribution (WDGSD) by using a dedicated Matlab application [43].

2.2. ESPs from Doppler Radars

In this study, we consider two different ground-based pulsed Doppler radars whose respective different characteristics allow for different ESPs to be constrained. One of these radars is a scanning microwave weather radar (MWR) working at a wavelength λ of 3 × 10⁻² m and located at Catania airport, 33 km south from Mount Etna (Figure 1a). The MWR is operated by the Italian Civil Protection and provides 12 different elevated scans up to a maximum distance of 80 km from the radar site and with space-time resolution of 100 m and 10 min [7,14,15,33]. In addition, we take advantage of the fixed-pointing VOLDORAD-2B (V2B), located at La Montagnola Station (2610 m a.s.l.) (Figure 1a), which has been monitoring the near-source explosive activity of Etna’s summit craters since 2009 [11,12]. V2B is an L-band Doppler radar working at λ = 23.5 × 10⁻² m and whose sampling rate of 5 Hz allows to record explosive ejection at high time resolution. Besides, open-access data based on Doppler radar records at Etna is made available, including about 50 eruptive episodes since 2011 [12,44].

2.2.1. Mass Parameters from MWR

Various strategies have been developed to derive the MER from Doppler radar at Mount Etna. First, assuming that MWR detects near-source eruptive jets that are vertical during paroxysm and uniform within the vent surface, we can derive the MER based on the surface flux approach (SFA; [15,33]). Similarly to the methodology of Calvari et al. [4] to derive eruptive bulk volumes from thermal infrared images at Etna (see Section 2.4.1), the SFA uses the following equation:
M E R S F A ( t ) = v e x i t ( t ) ρ x S
where ρx is the density of the detected mixture set to 14.9 ± 3 kg/m3 for Mount Etna’s lava fountains [15] and S is the eruptive vent surface (m2). Using this approach implies that the exit velocity is linked to the whole erupted mixture, i.e., both lava fountains and tephra plumes.
An additional strategy can be used to derive the MER from the MWR. This second approach, called near surface approach (NSA; [14,33]), implies that the recorded velocity corresponds to that of tephra particles entering the beam and not the exit velocity at the vent. This method uses the following flux equation:
M E R N S A ( t ) = C t ( t ) v e n t r y ( t ) A
where MERNSA(t) represents the MER (kg/s) based on the NSA approach, Ct(t) is the tephra concentration (kg/m3), ventry is the entry velocity of particles in the radar beam (m/s) (as a first approximation ventry = vexit of Equation (1)), and A (different from S) is the entry surface of the detected volcanic jet in the beam (m2).
The computation of the tephra concentration (Equation (2)) detected by the MWR is based on the volcanic advanced (or Ash) radar retrieval algorithm (VARR) developed by Marzano et al. [10] and largely described in Marzano et al. [45], Mereu et al. [46], and Marzano et al. [15]. Basically, the VARR provides synthetic estimates of concentration Ct and mean diameter Dn of detected particle mixtures (see Section 2.2.3) by using a Monte Carlo approach. By entering a given tephra size class [15,47], the VARR solves equations that link the radar reflectivity factor Z (in dBZ) with both concentration and diameter [9,47]. Ct(t) is obtained using the following equation:
Ct(t) = βexp[Z(t)γ]
with β and γ being two parameters determined by the VARR related to a given class of tephra sizes (see [46]).
In addition to the SFA and NSA, the MWR provides 3D scans of the entire eruptive columns [14,15] and first estimates of HT. From this, we can use the top plume approach (TPA; [15]) by entering HT in the Degruyter and Bonadonna [48] formula to derive MERTPA. An additional approach that can be used with MWR data, the mass continuity approach (MCA; [15,47]), is based on the mass conservation equations and is calculated by considering the mass that enters and leaves a constrained volume above the eruptive vent (see [15,46] for more details).

2.2.2. Mass Parameters from V2B

Given that the V2B’s beam is fixed and pointing right above Etna’s active vents, it cannot provide direct information on the eruptive columns that are mostly fed by lava fountains. Nonetheless, as for MWR determination of mass parameters, the SFA (Equation (1)) and NSA (Equation (2)) can be used directly with V2B’s data [15]. The exit velocity from V2B is calculated by taking into account the elevation angle (θ) of the radar beam with vexit=vr/sin(θ) ([12]). In particular, 1/sin(θ) is equal to 4.45 in Equation (1) for all events that happened before December 2012 at Etna and 3.89 for the others until today [30]. Following V2B’s radar beam description provided by Donnadieu et al. [12] and Freret-Lorgeril et al. [30], A in Equation (2) corresponds to the half 3-D surface of the volume sounded above the vent, which has a height of 300 m (i.e., the length of the two probed volumes above the NSEC; [30]) and a radius of 280 m. Finally, for V2B, β and γ in Equation (3) are equal to 0.8827 and 0.04625, respectively.
In addition, assuming that the tephra plume is fed by the lava fountain, the product between V2B echo power and radial velocity (vr) measured in beam volumes above the erupting crater can also be used to calculate the MER. In fact, this product, directly proportional to the tephra mass in the bin (mass proxy), has been shown to be proportional to HT and has been calibrated using the theoretical formula of Degruyter and Bonadonna [48] that links HT to the MER [30]. Estimates of MER using the proxy method have been applied to 47 paroxysms that occurred at Etna between 2011 and 2015.

2.2.3. Radar Grain-Size Distribution

Dual-polarization radars, such as the MWR, provide the first estimates of grain-size distributions related to the size classes they are sensitive to. As stated above, the VARR provides an estimate of the reflectivity-weighted mean diameter Dn potentially detected by both MWR and V2B by applying the following parametric equation:
Dn(t) = δexp[Z(t)ε]
with δ and ε being two parameters, whose values depend on which class of tephra sizes is input in the VARR algorithm (see [45,46]).
Depending on the aforementioned tephra size classes, β, γ, δ, and ε parameters (Equations (3) and (4)) have different values and can provide polydisperse grain-size information from MWR measurements [46]. Starting from Ct estimates of VARR (Equation (3)), the MWR grain-size distribution is computed as the ratio between the particle weight Wp based on the mean diameter Dn (Equation (4)) and the total particle weight Wt of the whole tephra plume. We compute Wp as the total tephra mass, for discrete increasing steps of particle size and multiply by the gravitational acceleration in kg/m2/s. Each discrete mass value is normalized by the total particle weight Wt, computed as the integral of Wp extended to the whole particle diameter (D) range, i.e., a single class of possible sizes from 0.008 to 64 mm used in this study. In this way, we derive the GSDMWR (wt%) according to the following relation:
W p ( D n ) = ( 4 3 π ( D n 2 ) 3 ρ p ) g       and       w t % = W p ( D n ) 0 W ( D n ) d D   100
where g is the gravitational acceleration.

2.2.4. Plume Height

Given that the VOLDORAD 2B does not capture the whole plume but only the jet region, HT can only be determined based on the MWR located at Catania airport (Figure 1b). Plume height determination from MWR data is straightforward thanks to each radar scan of the eruptive column with a resolution of 10 min [14,15,28]. Height measurements by the MWR meet the usual detection limitations such as possible incomplete volume filling, beam scans not going high enough, small particle concentrations, and/or sizes remaining undetected on plume margins.

2.3. Mass Eruption Rate from Ground-Based Thermal Camera

The INGV-OE monitoring network includes ground-based thermal infrared cameras that have been used to indirectly determine the MER during paroxysmal events [3,4,6] (Figure 1a). By estimating the height of the thermally saturated domains in eruptive columns that are assumed to correspond to lava fountains [4] and found to be very similar to the vertical ballistic domain seen with the MWR [46], the Torricelli equation can be used to compute the source exit velocity (vexit in m/s) [15,33]. Assuming that the tephra plumes at Etna are fed by lava fountains during paroxysmal activity [15,30,33], the exit velocity can be used to compute the MER using the SFA method (Equation (1); [15]).

2.4. ESPs from Satellite Retrievals

2.4.1. Plume Height

Satellite-based observations made each 15 min by the geostationary MSG-SEVIRI platform are widely used to retrieve volcanic plume heights [7,8,49,50]. At Etna, they are retrieved by applying the dark pixel procedure [51] over an area of 729 km2 (9 × 9 pixels of 3 km resolution) centered on Etna’s summit craters [6,7] (Figure 1a). Assuming that detected plumes are in thermal equilibrium with the surrounding atmosphere, the volcanic plume heights can be derived from the comparison between the darkest pixel (the pixel with the lower brightness temperature computed at 11 μm) of the selected area and the ARPA atmospheric profiles available at INGV-OE every 6 h [8,20,52]. When available, we also use data obtained by MODIS onboard the NASA Terra and Aqua polar-orbiting platforms. Despite their lower temporal resolution, i.e., three-four measurements per day over Etnean area compared with 96 or 288 SEVIRI daily images (every 15 or 5 min respectively), MODIS spatial resolution is higher with an image pixel resolution of 1 km2. One of the main strengths of satellite-based detection is the capacity to capture volcanic plumes and clouds over large distances from their source (Figure 1a). However, as ground-based visible imagery, satellite-based ash detection suffers from the presence of meteorological water and ice clouds in the plume environment. In addition, satellite-derived plume height might present large uncertainties when plumes are too diluted to avoid ground contribution to the overall mixture temperature [52].
The discrimination between ash and ice/water vapor particles is obtained by exploiting their different absorption at 11 and 12 µm [53]. Negative brightness temperature difference (BTD), the difference between the brightness temperature at 11 and 12 µm, indicates the presence of ash and vice-versa for ice/water vapor particles. In particular, the 10 April 2011 event shows the formation of large quantities of ice particles that cover almost all the ash present in the volcanic cloud.

2.4.2. Erupted Mass and Grain-Size Distribution

Quantitative ESPs from SEVIRI data are derived using the volcanic plume retrieval algorithm to estimate the amount of fine ash and also SO2 carried by volcanic clouds (VPR; [7,29,54,55,56]). This procedure allows removing the detected volcanic cloud from satellite images by a linear interpolation of the radiances at the plume edges. The comparison between the original and the interpolated images allows the estimation of the volcanic cloud transmittances at SEVIRI thermal infrared (TIR) bands centered at 8.7, 10.8, and 12 µm (Channels 7, 9, and 10). From those quantities, the particles’ effective radius (Re) and the aerosol optical depth (AOD) are derived. From both Re and AOD, the ash mass per unit area (g/m²) can be computed using the Wen and Rose [57] simplified formula. The same procedure stands for MODIS Channels 29, 31, and 32. Consequently, we can compute the GSDsat by using values of particle radius in all pixels containing ash signal from the beginning to the end of the paroxysmal event. The GSDsat was weighted in mass, for each SEVIRI image, using the ratio between the total mass of pixels containing particles within a certain Φ range and the total mass of the whole volcanic cloud. We computed the mean GSDsat by averaging all the SEVIRI images that displayed at least 100 pixels containing ash particles. It is important to note that the ash particles retrieved in the TIR spectral range are those with effective radii (Re) between 0.5 and 10 µm (i.e., diameters comprised between 5.5 and 10 Φ).
From SEVIRI data, a mass flux (kg/s) used to determine a total erupted mass is computed from a transect perpendicular to the plume dispersal axis at 15 km from the vent and considering the wind speed derived from the ARPA profiles at the plume altitude. Finally, the MODIS-based mass fluxes are computed by applying the “traverse” approach [52,58,59,60,61] and considering the wind speed at the volcanic cloud altitude derived from the Trapani WMO atmospheric profiles (37.91 N, 12.50 E) [http://weather.uwyo.edu/upperair/sounding.html (last access on 15 April 2021)].

2.5. ESPs from Infrasound Array

At Etna, two small aperture infrasound arrays managed by the University of Florence are set up at 5500 (ETN at 2100 m a.s.l.) and 6500 m (MVT at 1800 m a.s.l.) from the summit vents for monitoring purposes (Figure 1a). Infrasonic data have been shown to be relevant at quantifying the dynamics of lava fountaining activity [62] and have been used to produce an early-warning system for paroxysmal events at Etna [16,63]. Experimental and numerical studies have been carried out to simulate the infrasound signal generated in eruptive conduits [64,65]. The acoustic waves generated in a volcanic conduit will be affected by the acoustic impedance contrast between the open-end surface of the volcanic vent and the atmosphere. A large part of the acoustic wave energy at the vent-atmosphere boundary is reflected inside the conduit as a function of the ka parameter defined by the acoustic wave number k and the effective vent radius a [65]. At the vent surface, acoustic pressure inside the conduit decreases drastically to equilibrate the atmospheric pressure, and, for the conservation of the flux, the acoustic velocity increases almost two times for a small value of ka. The propagation from inside the conduit to the atmosphere strongly influences the radiation pattern and the amplitude of the acoustic wavefield transmitted in the atmosphere. The directivity due to the vent radius and wave number for ka < 0.43 can be neglected and the radiation pattern is isotropic outside the vent [65].

Exit Velocities and MER

As shown by Ulivieri et al. [62] and Ripepe et al. [16], the frequency content for lava fountaining events at Mount Etna is typically below 1 Hz, as was the case of both the events described here. Considering a vent radius ranging between 5 and 20 m (i.e., 5 m, 10 m, 13.5 m, 20 m), ka values are ranging between 0.09 and 0.36 (see [65]), hence below 0.43. This means that the acoustic signal can be used to calculate the volumetric flux inside the conduit qi(t) considering a perfectly isotropic radiation pattern outside the vent and an insertion loss caused by topography IL = 0, given that the ETN array position is in the line-of-sight with the NSEC vent [65]:
q i ( t ) = 2 π r ( 1 + | R | ) ρ α 10 ( I L 20 ) 0 t Δ P ( t + r c ) d t
where α is the directivity at 0° being equal to 1, ΔP is the pressure signal (Pa), t is the time (s), r is the distance between the acoustic source and the array (m), c is the speed of sound of 345 m/s, ρ is the atmosphere density (kg/m3) and |R| is the acoustic reflectance that ranges between 0.99 and 0.90 for our ka values (0.09–0.36). Finally, we can estimate the infrasound acoustic velocity by dividing qi(t) by the cross-section area of the eruptive vent, which needs to be constrained. We used the exit velocities retrieved from V2B signals to constrain the best-suited vent radii to compute velocities from the acoustic signal. The resulting best vent radius will also be used in the SFA (Equation (1)) for both the V2B and MWR. In addition, we used infrasound velocity to determine the independent MER using the SFA methodology [15,66].

2.6. Plume Height from Visible Camera

The monitoring network of the INGV-OE uses a set of visual cameras that record Etna’s summit craters and their close environment in real-time. Images taken by these cameras have been calibrated to allow direct measurements of plume heights depending on daily weather forecast [20] and following isolines of heights above sea level (Figure 1b; [21,22]). In particular, we use a visible camera located at Catania (ECV; Figure 1a) to evaluate plume height during an explosive event. Images are recorded each 1 s and provide plume height estimates with an uncertainty of ±0.5 km [21]. The main limitations of this method are the strong influence of weather and light conditions, e.g., the presence of clouds, and the incapacity to measure heights above 9 km (a.s.l.) or when plumes are drifted outside the camera’s field of view during the period of 2011–2013. In order to improve the visible monitoring system and extend its use to various plume dispersal axes, a new camera was installed on the west flank of Mount Etna (i.e., Etna Bronte High Definition camera, EBHD). This camera, thanks to its field of view and depending on wind direction, allows a maximally visible determination of HT up to 15 km (a.s.l.) (see Scollo et al. [22] for more details).

3. Results

3.1. Plume Height Estimates

As previously described, plume height can be independently determined at Etna based on at least three different remote sensing systems that are complementary in terms of detection limits and space-time resolution (Visible Camera, Satellite retrievals—MODIS and SEVIRI, and X-Band radar—MWR) (see Figure 3).
Even though the determination of HT by the visual camera (ECV) was not possible after 11:20 UTC due to the presence of meteorological clouds, continuous detection during the whole 10 April 2011 paroxysm was possible with the MWR and SEVIRI (Figure 3a). In addition, a punctual measurement obtained at 12:30 UTC using MODIS data is also available. Heights obtained from ECV images (Figure 1b) are derived from 10:10 to 11:20 UTC [22,30]. Starting from 5 km a.s.l., HT increases rapidly and starts oscillating between 8 and 9 km a.s.l. (red dashed line in Figure 3a) from 10:58 to 11:20 UTC. After that time, the highest part of the plume leaves the camera field of view until the end of the paroxysm. As derived from MWR and SEVIRI data, HT also increases at 09:30 UTC from 1 km above NSEC to reach maximal altitudes of 8.9 ± 0.3 km a.s.l. as seen with the MWR at 11:20 UTC, and 6.1 km a.s.l. at 12:15 UTC using SEVIRI. Despite offering data only during the increase of the paroxysmal activity, ECV’s height estimates agree with MWR heights as does the 7.9 km height a.s.l. retrieved with MODIS at 12:30 UTC. On average, SEVIRI records display average HT that are 1–2 km lower than the MWR during the paroxysmal activity. Nevertheless, both instruments present similar HT values after the end of the paroxysm at 13:30 UTC with average values around 5.9 ± 0.4 km for MWR and 5.0 ± 0.6 km for SEVIRI until 15:15 UTC when HT starts to decrease.
HT on 23 November 2013 as detected by ECV started to increase from 09:15 up to 09:55 UTC to reach altitudes up to 9 ± 0.5 km a.s.l. (Figure 3b). HT derived by the MWR and SEVIRI increased rapidly at 09:30 UTC up to similar top heights of 11.7 km a.s.l. at 10:10 UTC and 12.0 km a.s.l. at 10:07 UTC, respectively. The MWR and ECV-based HT increase 5–10 min before satellite estimates. Over the same eruptive period between 09:30 and 10:30 UTC, mean HT derived from the MWR, ECV and SEVIRI are close with values of 8.2 ± 3.2, 7.4 ± 1.5, and 6.9 ± 3.4 km a.s.l., respectively. The X-band detection of the tephra plume ends at 10:40 UTC, ~20 min after the end of the paroxysm while visible and satellite thermal data last up to 11:30 and 12:02 UTC, respectively.

3.2. Determination of Exit Velocity, TEM and MER

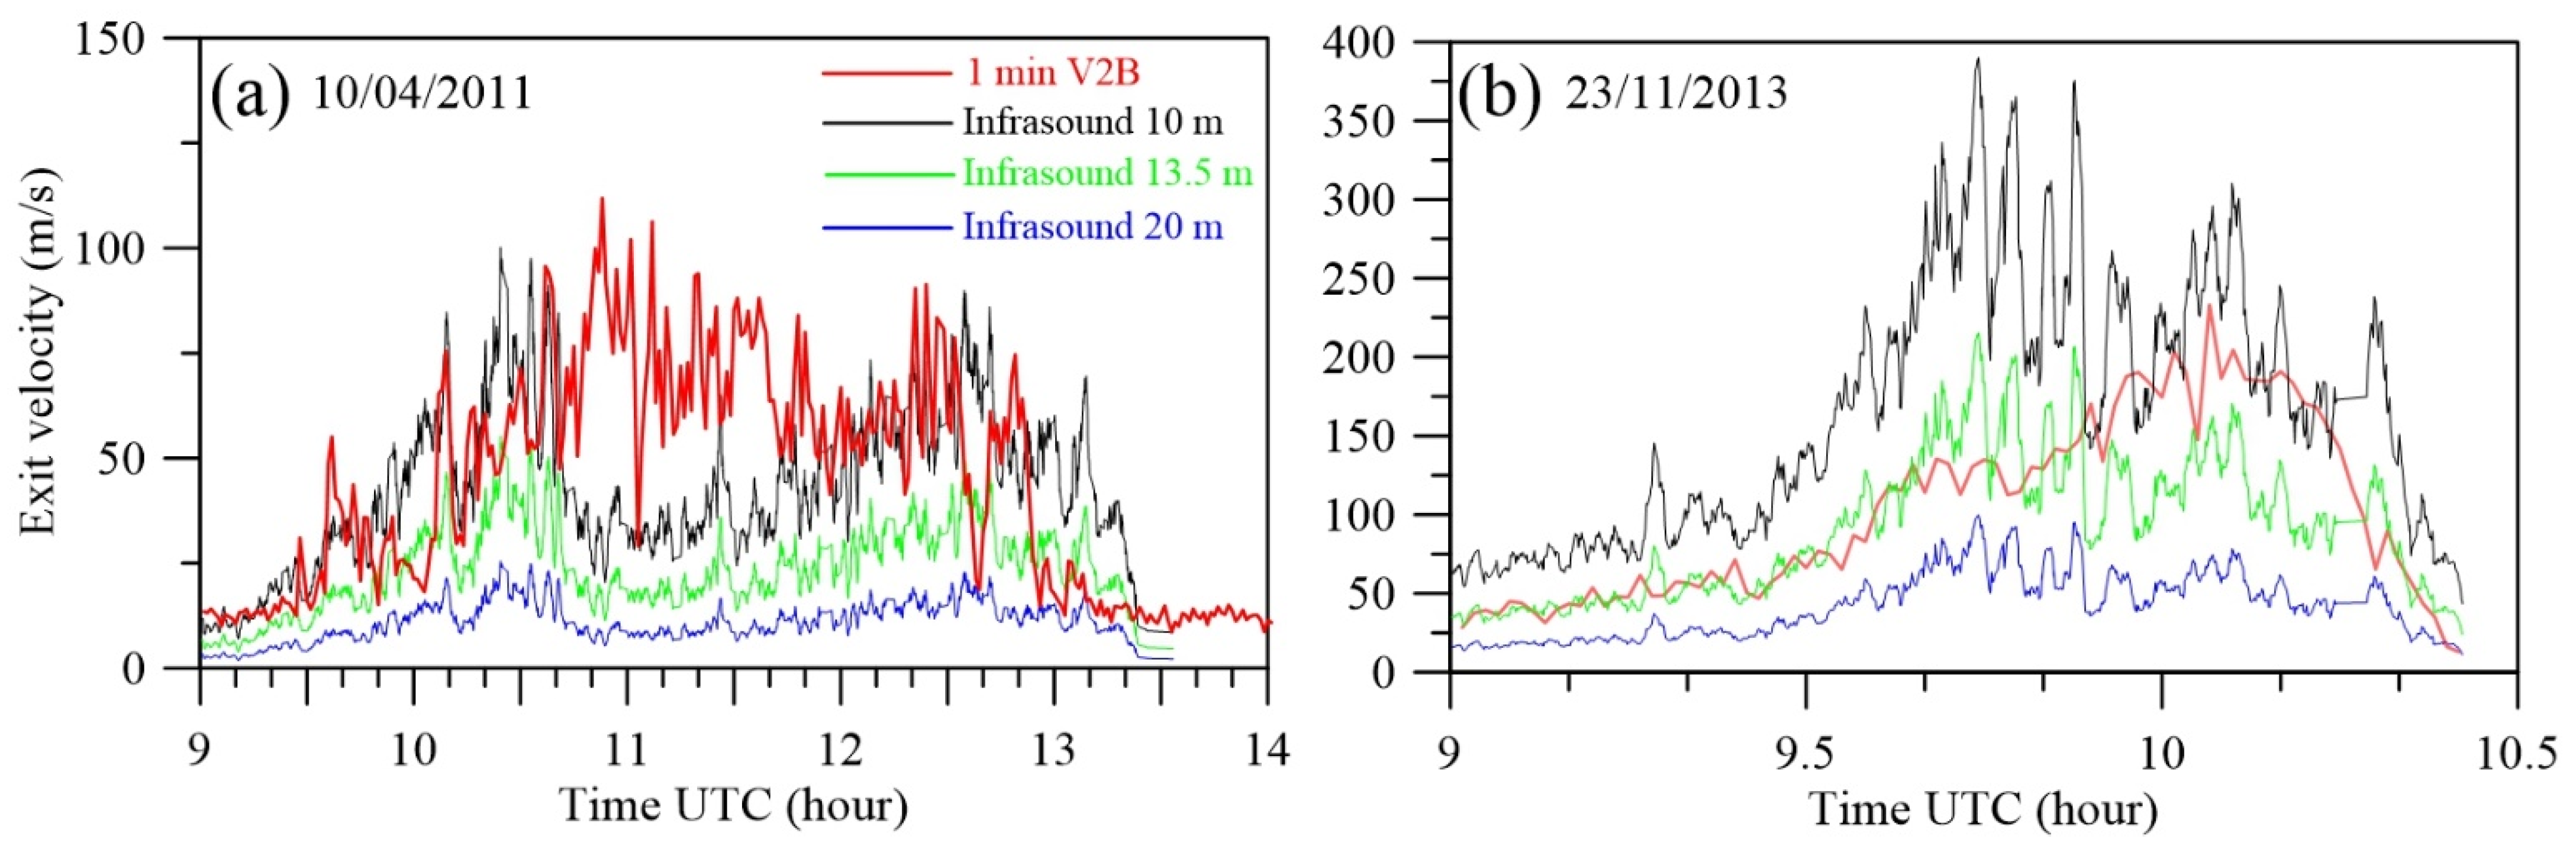
3.2.1. Mixture Exit Velocity from V2B and Infrasound

We determined the vertical velocity of the eruptive mixture above the vent as retrieved from the Doppler radar V2B and infrasound measurements. These vertical velocities can be considered as a first approximation of the source vexit that is used to compute MERSFA (Equation (1)) as well as the velocity ventry at which the eruptive mixture enters radar beams that are used to compute MERNSA (Equation (2)).
V2B and infrasound measurements result in a similar mean exit velocity when using vent radii considered in previous studies for Etna (i.e., a radius of 10 m and 13.5 m [3,15,67]). In particular, the mean exit velocity associated with V2B and infrasound is 43.7 ± 26.7 m/s and 42.6 ± 18.8 m/s for the 10 April 2011 paroxysm, and 101.1 ± 63.1 and 129.2 ± 62.7 m/s, respectively (Table 1 and Table 2 and Figure 4). The values of exit velocities associated with the infrasound are averaged between the calculation for 10 m and 13.5 m vent radius. Given that neither of the two values provides a perfect match, we will use both vent radii to compute the SFA-based MER hereafter.

3.2.2. TEM and MER from Tephra-Fallout Deposit

The integration of the three empirical fits of the ground mass accumulation versus square root of area contours of the 10 April 2011 event (Figure 5) results in values of TEMdep of about 1.3 × 10⁷, 1.4 × 10⁷, and 4.7 ± 2.3 × 10⁷ kg using the Weibull, exponential and power-law fit, respectively (Table 1). While the exponential and the Weibull fit can be integrated between zero and infinity, two integration limits have to be selected for the power-law fit due to the associated asymptotic nature. In particular, the proximal limit is calculated as proposed by Bonadonna and Houghton [41], while, in order to characterize the associated uncertainty, the distal integration limits were set both at 100 km and 400 km where ground accumulation becomes negligible (i.e., between 10−3 and 10−4 kg/m2 based on the thinning trend of Figure 5). In fact, given that the power-law exponent is <2 (Figure 5), the resulting volume is sensitive to the distal integration limit but not to the proximal one [41,68]. The TEMdep from the power-law fit is then averaged between the values obtained with the two different distal integration limits (100 and 400 km). Given the absence of proximal data (due to difficult access) and of distal data (due to most of the deposit falling in the sea) (e.g., [26]), Weibull and exponential estimates must be considered as minimal values [68] for this tephra deposit. As an example, Spanu et al. [69] have shown for the 24 November 2006 paroxysm of Etna that a lack of sampling within the first kilometers from the crater could lead to a loss of 30% of the TEM. In this context, even though associated with the uncertainty of the integration limits, the power law fit might provide a better estimate given that it can better predict the medial and distal gradual thinning. We obtain a value of MERdep by dividing each TEMdep by a mean duration of 310 ± 94 min determined based on the MWR and satellite-based infrared (Table 1). Accordingly, we found MERdep between 0.7 and 2.5 × 10³ kg/s (average of 1.4 ± 1.1 × 10³ kg/s) (Table 1; Figure 6).
The ground accumulation variation obtained for the 23 November 2013 tephra-fallout deposit was fitted with two exponential segments with a break in slope around 4 km as well as a Weibull and power-law function (Figure 5b). TEMdep obtained by the Exponential, the Weibull, and the power-law fits (Figure 5b) are similar with values of 1.2 × 10⁹, 1.3 × 10⁹, and 1.4 ± 0.0 × 10⁹ kg [27], respectively (Table 2). Here we fixed the distal integration of the power-law fit at 180 and 450 km, using the criteria of negligible deposit as for the 10 April event. Finally, using an average duration obtained from the SEVIRI and MWR approaches of 69 ± 35 min, we find MERdep between 2.9 and 3.4 × 10⁵ kg/s with an average of 3.1 ± 0.3 × 10⁵ kg/s for the 23 November 2013 paroxysm. Please see the following sections for the details on the sensor selection to derive the event duration.

3.2.3. MER and TEM from Remote Sensing

It is important to note that sensor-derived estimates of MER and TEM presented hereafter are computed over a duration that is based on the corresponding sensor signal (see Table 1 and Table 2). V2B MER methods are associated with different results: the velocity-derived NSA and SFA estimates appear relatively close, with mean values respectively of 1.4 and 2.8 × 10⁵ kg/s, whereas the MER proxy derived from both power and velocity shows a significantly larger dynamics and remains one order of magnitude below for this event with an average MER of 2.7 × 10⁴ kg/s (Figure 6a and Table 1). Altogether, MER values derived from all V2B strategies result in an average of 1.5 ± 1.3 × 10⁵ kg/s. It is important to note that the MER associated with V2B was averaged over 10 min in order to better compare it with the MWR results.
Time series of MER from MWR start at 09:30 UTC and show a concomitant increase with V2B estimates except for MWR-SFA values that show a constant value for the whole event (Figure 6b). MWR average values of the MER range between 2.6 ± 2.4 × 10⁴ and 2.3 ± 1.7 × 10⁵ kg/s as based on the MCA and TPA, respectively. In between, the respective average MER from the SFA and TPA are equal to 9.3 ± 0.4 × 10⁴ and 1.9 ± 2.3 × 10⁵ kg/s. In total, all MWR-MER methods provide an average MER of 1.4 ± 0.9 × 10⁵ kg/s. SFA-MER derived from ground-based thermal is similar to SFA-MER associated with MWR data and they are both relatively close to average values (Figure 6b,c; Table 1).
Infrasound MER values present small variations with time, with an average value of 2.0 ± 0.9 × 10⁵ kg/s. Figure 6c also highlights two trends for satellite-based MER data from SEVIRI and MODIS satellites that suggest a high amount of ice in the detected tephra plume and cloud. On average, MER values corresponding to the ash content are 7 and 18 times lower than ice in MODIS and SEVIRI time series, respectively (Table 1). Interestingly, MER values based on SEVIRI observations of HT (Figure 3) vary with time with a maximal value of 7.7 × 10⁴ kg/s at 12:00 UTC (Figure 6c) and a mean value of 2.7 ± 2.5 × 10⁴ kg/s, similar to mean MERs from V2B proxy and MWR NSA and MCA methods (Table 1).
All MERs from V2B are very close also for the 23 November 2013 paroxysm (Table 2). MERs from the NSA and SFA follow the same trend (Figure 6d) with mean values of 2.3 ± 3.5 × 10⁵ and 3.5 ± 3.7 × 10⁵ kg/s, respectively. Proxy-derived MERs remain lower than NSA and SFA MERs at the beginning of the event, following a similar trend until 09:20 UTC. It then strongly increases as a consequence of increasing echo power from the fountaining ejecta. Despite the fact that the average proxy-derived MER is similar to the SFA and NSA estimates, proxy MERs remain higher than the NSA and SFA estimates with a maximum value of 3.1 ± 1.6 × 10⁶ kg/s during the paroxysm climactic phase from 09:45 to 10:15 UTC (Figure 6d).
Concerning MWR estimates, the eruptive signal started from 09:30 UTC when exit velocities and HT estimates increased significantly (Figure 3 and Figure 4) and lasted up to 10:40 UTC for the TPA and MCA methods, whereas the SFA and NSA estimates lasted 30–40 min up to 10:10 UTC (Figure 6e). As shown by Marzano et al. [15], all MER methods using MWR data provide very similar estimates during the climactic phase of the 23 November 2013 paroxysm with maximal MER being comprised between 1.9 × 10⁶ kg/s (SFA) and 4.1 × 10⁶ kg/s (NSA) (Figure 6e).
The SFA method based on infrared data provide MERs that are comprised between 2.8 × 10⁴ kg/s and 1.5 × 10⁶ kg/s with a signal lasting 130 min from 08:20 and 10:20 UTC (Figure 6f and Table 2). Infrasound-based MERs using the SFA are close to ground-based infrared estimates and show a maximal value of 1.8 × 10⁶ kg/s. As for the 10 April 2011 event, satellite data present two trends for both plume/cloud ice and ash content whose values are, however, very close with a mean of 1.4 × 10³ vs 1.6 × 10³ kg/s (Table 2 and Figure 6f). Based on HT derived by satellite over 40 min, i.e., when HT becomes higher than the vent height of 3.2 km (Figure 3b), TPA-based MER are comprised between 2.1 × 10³ kg/s at 09:47 and 4.7 × 10⁶ at 10:07 UTC, respectively. The mean MER from HT measured by satellite is also very similar to the MWR mean value (Table 2).
In terms of TEMs, all methods show very different trends of time-integrated erupted mass for the 10 April 2011 event (Figure 7a). Final values, which correspond to TEMs, converge to a value around 109 kg (between 6.4 × 10⁸ kg for MWR MCA and 5.8 × 10⁹ kg for V2B SFA, respectively), whereas deposit and satellite ash content estimates are much lower (between 2.5 ± 1.9 × 10⁷ and 2.0 × 10⁶ kg, respectively) (Figure 7a and Table 1). In general, SFA, NSA, and TPA-derived ESPs display higher TEM values than those retrieved with proxy and MCA for all sensors (see Table 1 and V2B-TEMs in Figure 7a). The arithmetic mean associated with all methodologies for each sensor is between 1.2 and 2.8 × 10⁹ kg for V2B, MWR, infrasound, and ground-based thermal data (Table 1). For satellite mass data, two trends are still shown for both contents in ash and ice with TEMs respectively ranging between 2.0–49.0 × 10⁶ kg for SEVIRI and 2.3–14.1 × 10⁶ kg for MODIS data (Figure 7a; Table 1).
The TEMs observed for the 23 November 2013 paroxysm by V2B, MWR, infrasound and thermal camera span less than one order of magnitude between 2.7 × 10⁹ kg (V2B-NSA) and 5.8 × 10⁹ kg (ground-based infrared). Interestingly, all cumulative trends from infrasound, ground-based infrared and both Doppler radars are converging during the pre-climax phase toward a relatively narrow range of TEMs between 2.7 × 10⁹ and 6.4 × 10⁹ kg (Figure 7b and Table 2). As observed for the 10 April 2011 (Figure 7a), TEMs estimated from the satellite-derived plume/cloud, ice and ash content are lower than all other methods with very similar TEMs of 1.0–1.3 × 10⁷ kg (Table 2). Nevertheless, TPA-based TEM from SEVIRI is in the same order of magnitude as all other methods with a value of 3.6 × 10⁹ kg.
For both eruptive events and for all ground-based remote sensors, 0 to 10% of the TEM is emitted after the end of the fountaining activity as derived by V2B [30] and ground-based infrared [4] (Figure 7). While satellite-based TEMs are also reached by the end of the lava fountaining on 23 November 2013 (Figure 7b), 27 to 53% of the ash content and TPA-based TEMs, respectively, is detected after the end of the paroxysmal activity on 10 April 2011 (Figure 7a).

3.3. Total Grain-Size Distributions

3.3.1. Combination of WDGSD and GSDsat

The WDGSD derived by applying the Voronoi Tessellation method on the deposit data [41] is unimodal and well sorted with a sorting coefficient of 1.41 and an MdΦ [70] of 0.82 Φ, i.e., 0.57 mm (Figure 8a).
Both SEVIRI and MODIS data can be used to provide a GSDsat by using the VPR algorithm (Figure 8b). Such distributions are unimodal and very well sorted, i.e., sorting of 1.0 and 0.8, respectively, and consider that all detected material is under 20 microns of diameter; SEVIRI and MODIS GSDs display MdΦ values of 8.3 Φ (0.003 mm) and 6.9 Φ (0.008 mm), respectively. To combine deposit and satellite data, we choose the SEVIRI GSDsat that better describes the temporal variations of sizes in the detected plume/cloud instead of the MODIS punctual GSDsat, hardly representative of the whole event and only available for the 10 April event. In particular, we combined all GSDs from the tephra-fallout deposit and SEVIRI based on their relative TEM proportion (see for example Bonadonna et al. [71]). In order to take into account the uncertainty associated with the determination of TEM, here we consider both the power-law estimate only and the mean of all integration approaches (power-law, Weibull, and exponential), i.e., 4.2 and 8.1%, respectively. Both resulting TGSDs are bimodal (Figure 8c) and consider both the material that felt on the ground and the very fine part of the erupted material detected by satellite, which ranges between 1 and 20 µm.
The WDGSD and GSDsat of the 23 November 2013 paroxysm are shown in Figure 8d,e. The WDGSD, which was obtained by Poret et al. [31], is unimodal, coarse-grained with an MdΦ of –3.4 Φ (10 mm; lapilli-sized), and well sorted. This WDGSD is particularly depleted in fine ash with no material below 63 microns. SEVIRI GSDsat integrated over the whole event duration is also unimodal with an MdΦ of 7.7 Φ (0.005 mm) and sorting of 1.2. Given that the estimates of TEM based on the three integration methods for the 23 November 2013 event are all very similar, WDSGD and GSDsat were combined (see TGSD in Figure 8f) based on an average value of the three estimates (1.3 ± 0.1 × 10⁹ kg; Table 2) resulting in a mass ratio of 1.2% with the ash TEM obtained by SEVIRI (1.3 × 10⁷ kg) (Table 2).

3.3.2. Combination of the GSDMWR and GSDsat

Following the same methodology as described above, we combined the GSDMWR and the SEVIRI GSDsat (Figure 8c,d). Accordingly, we used the mass ratio between the arithmetic mean of MWR-based NSA and MCA TEMs (i.e., 1.6 ± 1.4 × 10⁹ kg and 4.9 ± 0.8 × 10⁹ kg, respectively for both events) and the satellite-based ash mass retrieved with the VPR (Table 1 and Table 2). A very small mass ratio of 0.12% and 0.27% between SEVIRI and MWR was found for the 10 April and the 23 November paroxysms, respectively. It is important to note that, given these very small mass ratios, the GSDMWR and the combined MWR-SEVIRI TGSD were very similar for both events in Figure 8c,f. Interestingly, the MWR-SEVIRI TGSD was similar to the WDGSD-SEVIRI TGSD for the 10 April 2011 event with an MdΦ of 1.0 (0.5 mm) and sorting of 0.87 (Figure 8c). However, in the case of the November 2013 event, the MWR-SEVIRI TGSD with an MdΦ of −0.4 (1.3 mm) was finer than the WDGSD-SEVIRI TGSD having an MdΦ of −3.4 (10.6 mm) (Figure 8f).

4. Discussion

4.1. Determination of Plume Height

HT is one of the keys and most common ESPs to be determined in real-time. In fact, active explosive volcanoes are generally monitored with visible cameras from which HT is derived when the wind velocity is known [21,22], with satellite data following the dark pixel procedure [51] and/or with radar data [72]. For tephra forecasting and modeling purposes, HT is an important input parameter [68,73,74] as it defines the spreading height of the volcanic cloud and strongly influences its dispersal axis and impact area [74,75] (and references therein). At Etna, HT is typically obtained based on visible camera [21,22], satellite-based observations [7,8,39,49] (and references therein) and MWR (X-band) radar detection [13,14,15]. However, as shown during the 10 April 2011 and the 23 November 2013 paroxysms, the accuracy of these three techniques depends on various conditions (Table 2).
Indeed, plume height estimates at Etna based on the camera located in Catania (ECV in Figure 1) are restricted to 9 km (a.s.l.), day light, no cloudy conditions (see Figure 1a; Figure 3a), and to the camera field of view [21,22]. ECV camera cannot track HT either when the plume dispersal axis is parallel to the camera line of sight. To overcome these limitations, a new camera was installed on the west flank of Etna volcano (i.e., Etna Bronte high definition camera, EBHD in Table 3 and Scollo et al. [22]) and will allow a maximally visible determination of HT up to 15 km (a.s.l.) (Table 2), under day light and no cloudy conditions.
Thanks to its 3-D scanning capacity at different elevation angles, the MWR covers an area of 160 km wide and 20 km high [13]. Mount Etna being at ~30 km from the radar site (Figure 1a; [13,14,15]), the MWR is able to detect ash plumes with typical southeastward dispersion up to maximum HT of ~12 km (a.s.l.), using the highest beam elevation angle. In addition, MWR data are exploitable for all light (day/night) and weather conditions (Table 3). Indeed, the dual-polarization capacity of the MWR allows us to discriminate ash particles from hydrometeors, which can affect the radar signature of a detected tephra plume [10,45,76].
Finally, we have shown that satellite-based HT estimates are generally lower (Figure 3a) or delayed (Figure 3b) in comparison with those from the MWR and ECV. In the case of the 10 April 2011 weak paroxysm, the detected ash plume/cloud is not opaque and this lead to underestimating HT when the dark pixel procedure [7,8,51,56] is applied as already observed in Scollo et al. [22]. Similarly, the delayed increase in HT (Figure 3b) might represent the duration taken by the plume to become sufficiently opaque, i.e., allowing an accurate estimate of its height using the Dark pixel procedure (see also [7,8,22]). This observation, linked to the overall determination of MER from satellite, might suggest that the dark pixel procedure becomes accurate when the ash emission is sufficiently sustained, as observed during climactic phases of paroxysms at Etna.

4.2. Insights into Exit Velocity Measurements

The exit velocity is a critical parameter to determine MER [4,13,15,30,66] and to constrain eruptive column dynamics [77,78,79,80,81]. Direct evaluation of exit velocities at Etna comes from the fixed-pointing near-source Doppler radar V2B at very high time resolution [12,30]. In addition, infrasound sensors, a more common tool for monitoring active volcanoes [62,63] (and references therein), can also provide exit velocities when vent characteristics are known [65]. In fact, the determination of the exit velocity based on infrasound data requires the infrasonic type of source to be constrained (e.g., dipole, quadrupole), which is still under investigation [64,66]. As a result, the V2B values of exit velocity were used in this paper to validate the vent radius used in literature for NSEC of Etna volcano (i.e., 10 m and 13.5 m [4,15]) to be used in the calculation of MER with the SFA strategies. V2B-derived exit velocities are recorded 100–200 m above the source vent and describe the ascent of coarse lapilli and block/bombs forming the lava fountain, whereas infrasound velocities are likely to describe the gas exit velocity [65]. Even though in the jet region gas and tephra are assumed to move at the same velocity (as the tephra is carried by the expanding gas), some of the largest blocks and bombs as seen by the V2B might be slower resulting in an underestimation of the mixture velocity. It is interesting to note that these two events are separated by a long time period including many eruptions and a significant cone shape modification [35,36]. This suggests that a 10–13.5 m range is reasonable to describe the NSEC radius for paroxysms at Etna during the present cycle of activity.

4.3. ESPs of Weak and Strong Paroxysms at Etna

Paroxysms at Etna are generally composed of two main components, i.e., a lava fountain and a tephra plume which is mostly fed by the lava fountain [4,30,35,81]. The contribution of each component to the TEM, MER, and TGSD of the cumulative event can be explored using different sensors.

4.3.1. Multi-Strategy TGSD Determination

The TGSD is certainly the most challenging parameter to be retrieved in near real-time [22,82] as all remote sensors are sensitive to various tephra size ranges whose limits are difficult to constrain [83] or need to be modeled (radar-based GSDs in Figure 8c,f) [15,45,84]. Satellite thermal-infrared retrievals are sensitive to very fine ash (<20 µm) within the top ash cloud layers, whereas MWR retrievals are mostly sensitive to tephra sizes from fine ash (>25 µm, [7]) to lapilli (up to 64 mm, [45]) within the plume.
Here we show a first attempt to provide a near-real-time TGSD by combining GSDMWR and GSDsat from SEVIRI (Figure 8). In fact, WDGSD and SEVIRI GSDsat had already been combined in the past with good results for TGSD (e.g., [31]), which, however, cannot be provided in near real-time. It is important to mention also that an MWR-SEVIRI TGSD not only can be produced in near real-time, but it can also overcome some of the limitations related to tephra-deposit sampling. In fact, it is important to bear in mind a few shortcomings of deposit sampling at Etna. First, the very proximal fraction deposited <0.5 km from the vent and contributing to building the eruptive cone, i.e., the lava fountain tephra deposit, is never sampled [35,36,81]. Second, the proximal fraction deposited <5 km and corresponding to the coarsest part of the tephra plume GSD is also rarely sampled because of access difficulties (i.e., presence of La Valle del Bove horseshoe-shaped depression) and problems in discriminating individual deposits in periods of frequent activity [26,69]. This is also the case for the 10 April 2011 event for which the first sample was taken at 7.2 km from the vent (Figure 2). Finally, due to prevailing wind directions heading towards the East at Etna, fountain-fed tephra plumes are frequently drifted above the Tyrrhenian Sea and the distal part of tephra fallout deposits is lost (see examples in Figure 1 and Figure 2). Accordingly, most of the paroxysm-related tephra deposits can only be sampled up to about 30 km (i.e., the coastline) (Figure 1a and Figure 2) except for when the emitted plume is directed Southwardly (e.g., 12 January 2011 paroxysm; [26]). In contrast, GSDMWR can provide information from the vent down to about 80 km from the vent depending on the size of the paroxysm.
The MWR-SEVIRI TGSD shows a promising agreement with the WDGSD-SEVIRI TGSD even though some caveats have to be considered. First, the ratio of the TEM associated with the different strategies used (i.e., tephra-fallout deposit and SEVIRI or MWR and SEVIRI) has a strong impact on the final TGSD. As an example, the large difference in TEM associated with the MWR and satellite retrievals resulted in a negligible contribution of the SEVIRI GSDsat to the final TGSD for both events. However, even if the mass contribution of the very fine material below 20 microns detected by SEVIRI represents less than 0.5% of the total amount detected by MWR for both the November 2013 and the April 2011 paroxysms, the GSDsat is essential for the characterization of the ash transport in the atmosphere using VATDM [31]. Second, while the GSDMWR shows a good agreement with the WDGSD (whole deposit GSD) for the 10 April event, it is considerably finer with respect to the WDGSD for the 23 November event. This is mostly related to the processing of radar data. In fact, even though the MWR actually sees particles also above 8 mm, these do not represent a large portion in number, and, therefore, they disappear in the final calculation of GSD in wt%. In addition, instead of considering several size classes in the VARR as in Mereu et al. [46] and Marzano et al. [15], we used a wider single size class (from 0.008 to 64 mm) to better combine it with SEVIRI GSD data and better compare it with the WDGSD. This new procedure simplifies the data treatment, but it loses information at the tail of the distribution (i.e., particles >8 mm and <63 μm).
To conclude, both the MWR-SEVIRI TGSD and the WDGSD-SEVIRI TGSD provide important insights. The first one can be derived in near real-time and can potentially combine information on both lapilli and ash-sized particles including the very fine ash detected from SEVIRI in all weather conditions and regardless of the coastline. The second one can provide fundamental information to help better calibrate the procedure to derive the MWR-SEVIRI TGSD as well as to run VATDMs of future eruptions of similar intensity when the near real-time TGSD is not available. It is important to remember that the derivation of TEM with the different sensors/strategies is crucial to the derivation of both TGSDs in order to best combine the different contributions.

4.3.2. The Role of Signal Duration in MER and TEM Determination

As stated in Section 3.2.3., we computed all MERs based on individual sensor signal duration. In fact, each sensor has its own signal duration depending on its time resolution, on which portion of the lava fountain, plume, and/or cloud it records data for and/or on what tephra size it is the most sensitive to. The duration variability observed in Table 1 and Table 2 is mostly due to the fact that the different sensors detect different phases of the eruption [5,35,85]. Three typical main phases can be detected for Etna paroxysms, as discussed below.
The first paroxysmal phase starts with lava fountaining (Phase I in Table 3) and is captured by a ground-based infrared camera and V2B that point directly at the area above the vent. This unstable activity produces also infrasonic waves in the conduit and at the vent that are well captured by the infrasonic array [62] and from which an early warning system has been developed [16]. The tephra emission during this phase is typically weak (mostly related to the building of the proximal cone) and is associated with low HT. This is why V2B, infrasound, and ground-based infrared provide eruptive signal before the other systems (i.e., 20 min earlier on 10 April and 60–120 min earlier on 23 November), whose signal is based on tephra plume emission (e.g., satellite and visible camera as well as, to some extent, MWR depending on its lowest scan elevation). It is important to note that Phase I is typically preceded by mild-Strombolian activity, lasting several hours to days before the start of Etna paroxysms [16,35,62]. Such activity does not induce significant tephra emission and is mostly recorded by infrasound only.
The second phase (Phase II in Table 3) is characterized by the emission of a sustained lava fountain-fed tephra plume. While some paroxysmal events present phases II associated with low eruptive intensities, e.g., the 10 April 2011 event, others are associated with plumes that can reach heights of 12–17 km above sea levels, such as the 23 November 2013 and the 3–5 December 2015 paroxysms [6,8,15,30,33]. This phase is well detected by all sensors including visual cameras, the MWR, and satellite-based infrared (Figure 6).
The third phase (Phase III in Table 3) represents the waning phase of the paroxysm [35]. While the lava fountain stops, the tephra plume and cloud emitted in Phase II are still expanding in the atmosphere. Phase III is well captured by the MWR (mostly TPA and MCA) and satellite but not by V2B, infrasound, and infrared sensors. This is the reason why, MWR and satellite signals last longer after the end of the fountaining activity, i.e., between 20 min and <2 h in both paroxysms presented herein (Figure 6 and Figure 7).
Given that the duration of the different sensor signals is associated with different phases of the eruption, we strongly suggest calculating MER based on TEM and duration associated with the same sensor. We can also conclude that V2B, infrasound array, infrared camera, and MWR can provide information on the duration of the sustained phases of the paroxysm (i.e., Phases I and II) (Figure 7a,b). In contrast, thermal-infrared satellite and MWR signal durations are related to the presence of a tephra plume and cloud in the atmosphere, including those associated with very fine ash (i.e., Phase II and III). Moreover, most of the paroxysm TEM associated with the tephra-fallout deposit (Table 1 and Table 2), is likely to be released during Phases II and III (Figure 7 and Section 3.2.3). This is why we computed deposit-based MERs using the mean signal duration as provided by MWR and satellite.

4.3.3. MER and TEM

As shown in our result section, a variety of sensors and associated strategies exist at Etna that can provide information on both the MER and TEM resulting in a large spread of values, especially for the 10 April 2011 event. The spread is mostly due to the fact that the different sensors and strategies record the 3 different phases of the paroxysm described in the previous section, and, therefore, are complementary (Table 3).
The methods that best record the tephra-plume activity (i.e., mainly during Phase II and III in Table 3) are the MWR-based MCA, the TPA (associated with all sensors), and the V2B-based proxy method (based on the Degruyter and Bonadonna [48] equation and valid for phase II; see Section 4.3.2). V2B-based proxy and MWR-based MCA methods present very similar TEMs for both paroxysms with values between 4.0 × 10⁸ and 4.6 × 10⁸ for the 2011 event, respectively (Table 1), against 4.6 × 10⁹ and 5.5 × 10⁹ kg for the 2013 event (Table 2). Over the same period of detection of the MWR signal, i.e., 09:30–10:30 UTC, V2B-based proxy MER is equal to 1.2 ± 1.2 × 10⁶ kg on average. This means that the MER-based MCA, V2B-based proxy, and satellite-based TPA MERs are similar for both the weak and strong paroxysms analyzed herein. In addition, these three methods present similar values to the MWR-based TPA MER for the strong 23 November paroxysm. However, they are one order of magnitude lower for the weak 10 April paroxysm. It is important to note that satellite-based HT (from which satellite-based TPA MERs are derived) is significantly lower than HT measured from the ECV, MWR, and MODIS for the 10 April event (Figure 3a). It is well-known that plume heights retrieved from the dark pixel procedure could be underestimated in the case of weak and non-sustained ash emission (see Section 4.1). Hence, the fact that both the MWR MCA and V2B Proxy MERs are similar to satellite-based TPA values in the case of the weak paroxysm suggests that they might also underestimate the MER during weak eruptive activity.
All sensor TEMs obtained using the SFA are relatively close, regardless of the event duration, with values between 1.2 × 10⁹ and 5.8 × 10⁹ kg for the 10 April 2011 against 3.2 × 10⁹ and 5.8 × 10⁹ kg for the 23 November 2013 paroxysm (Table 1 and Table 2). In fact, SFA estimates are not very different between both weak and strong paroxysms. This is due to the fact that the exit velocity, on which the SFA strongly depends, is not the most varying parameter among all paroxysms. Indeed, over 35 paroxysms out of 48 paroxysms including a climactic phase observed by V2B between 2011 and 2015 at Etna [30], the overall mean exit velocity was equal to 125.0 m/s with a standard deviation of ± 30%. Contrastingly, the mean proxy-derived TEM was equal to 1.21 × 10⁹ kg with a standard deviation of ±126%. This suggests that SFA estimates do not capture the real variability of intensity that exists between weak and strong paroxysms. Hence, the MER mostly based on exit velocities obtained by V2B, MWR, infrasound, and infrared might be overestimated during periods of weak activity and underestimated during intense periods, e.g., climactic phases. To better describe the variability of paroxysm intensities, approaches based on parameters related to a quantity of tephra, e.g., echo power of V2B or MWR reflectivities, should be preferred to SFA.
Regarding MWR-based and V2B-based NSA, all TEMs are similar to SFA estimates among both events (Table 1), except for the MWR-NSA TEM of the 2011 case which is up to one order of magnitude less than the other values. Indeed, NSA estimates are made by considering a given range of tephra for each radar, based on the VARR model outputs (see Section 2.2.1.; [10,15,46]). Although the dual-polarimetric capacity of the MWR allows us to model the GSD of detected tephra (Figure 8; see [46] and references therein), the size range detected by V2B inside the fountains, likely small lapilli, remains unknown. Therefore, for all paroxysms, we assume the same size range of 8 × 10⁻⁴ to 26.1 cm to determine tephra concentrations and reflectivity-weighted mean diameters from V2B (Equations (3) and (4)). Similar to exit velocities in the SFA, the upper size limit might tend to reduce the variability of the V2B signal between weak and strong paroxysms. This is the reason why, unlike V2B-based NSA estimates, MWR-based mass parameters using NSA present large differences between the weak 2011 event and the strong 2013 event, similarly to MCA values (Table 1 and Table 2). Hence, without any further constraints on tephra sizes detected by V2B, SFA and Proxy methods should be preferred for V2B to NSA estimates.
Overall, it seems that all ground-based techniques capture very well the eruptive activity that occurs during the fountain-fed tephra plume activity (Phase II). The fact that most of the TEM is likely to be released during this phase (e.g., Figure 7 and [30]) induces that all masses retrieved by the ground-based sensors, hence excluding satellite and deposit data, are relatively close with mean values of 2.3 ± 1.7 × 10⁹ and 4.5 ± 1.2 × 10⁹ kg for the 10 April and the 23 November paroxysms, respectively. On the contrary, MER values are different and depend on the capacity of each sensor to monitor, in addition to phase II, either phase I (i.e., V2B, infrasound, ground-based infrared) or phase III (i.e., MWR and SEVIRI) (see Table 3).
TEM and MER based on tephra-fallout deposit analyses are one to two orders of magnitude less than all other ground-based techniques for the 10 April 2011 event but display similar values for the 23 November 2013 (Table 1 and Table 2). As already mentioned, both tephra-fallout deposits were not sampled over their full extent, either in proximal nor distal areas. The power-law fits of tephra deposits associated with Etna paroxysms should be typically >2 as they are representative of small-to-moderate eruptions, as it is, in fact, the case for the 23 November event [68]. The power-law exponent of the 10 April event is <2 because of poor deposit exposure, and, therefore, the associated volume should be considered as a minimum value [68].
Satellite-based mass values represent the very fine fraction below 20 µm erupted during both paroxysms. However, if particles coarser than 20 µm are present in the detected plume/cloud, their thermal signature would be the same as that of particles of 20 µm [50,51,83]. This could lead to an underestimation of TEM in the case of coarse ash in the plume/cloud. In addition, it is important to note that when ice is present in a volcanic cloud, as was the case for both paroxysms (see ice contents in Figure 6c,f and Table 1 and Table 2), the mass of ash retrieved from satellite-based infrared could also be underestimated [29,53]. Indeed, water and ice particles in the detected clouds have been shown to significantly affect the BTD and VPR procedures [7,29,53] (and references therein) and might reduce the signature of ash particles in satellite images. Taking into account the aforementioned observations, satellite-based mass estimates should be considered as minimum values for both paroxysms.

5. Conclusions

Near real-time determination of ESPs is key to the initialization of VATDMs used for near real-time forecasting of tephra dispersal and sedimentation. The comparison we made in this study between the weak 10 April 2011 and the strong 23 November 2013 paroxysms at Etna has helped to better interpret the results associated with existing approaches used to compute ESPs based on a variety of monitoring sensors (see Table 3 for a summary). In particular, this study suggests that:
(1)
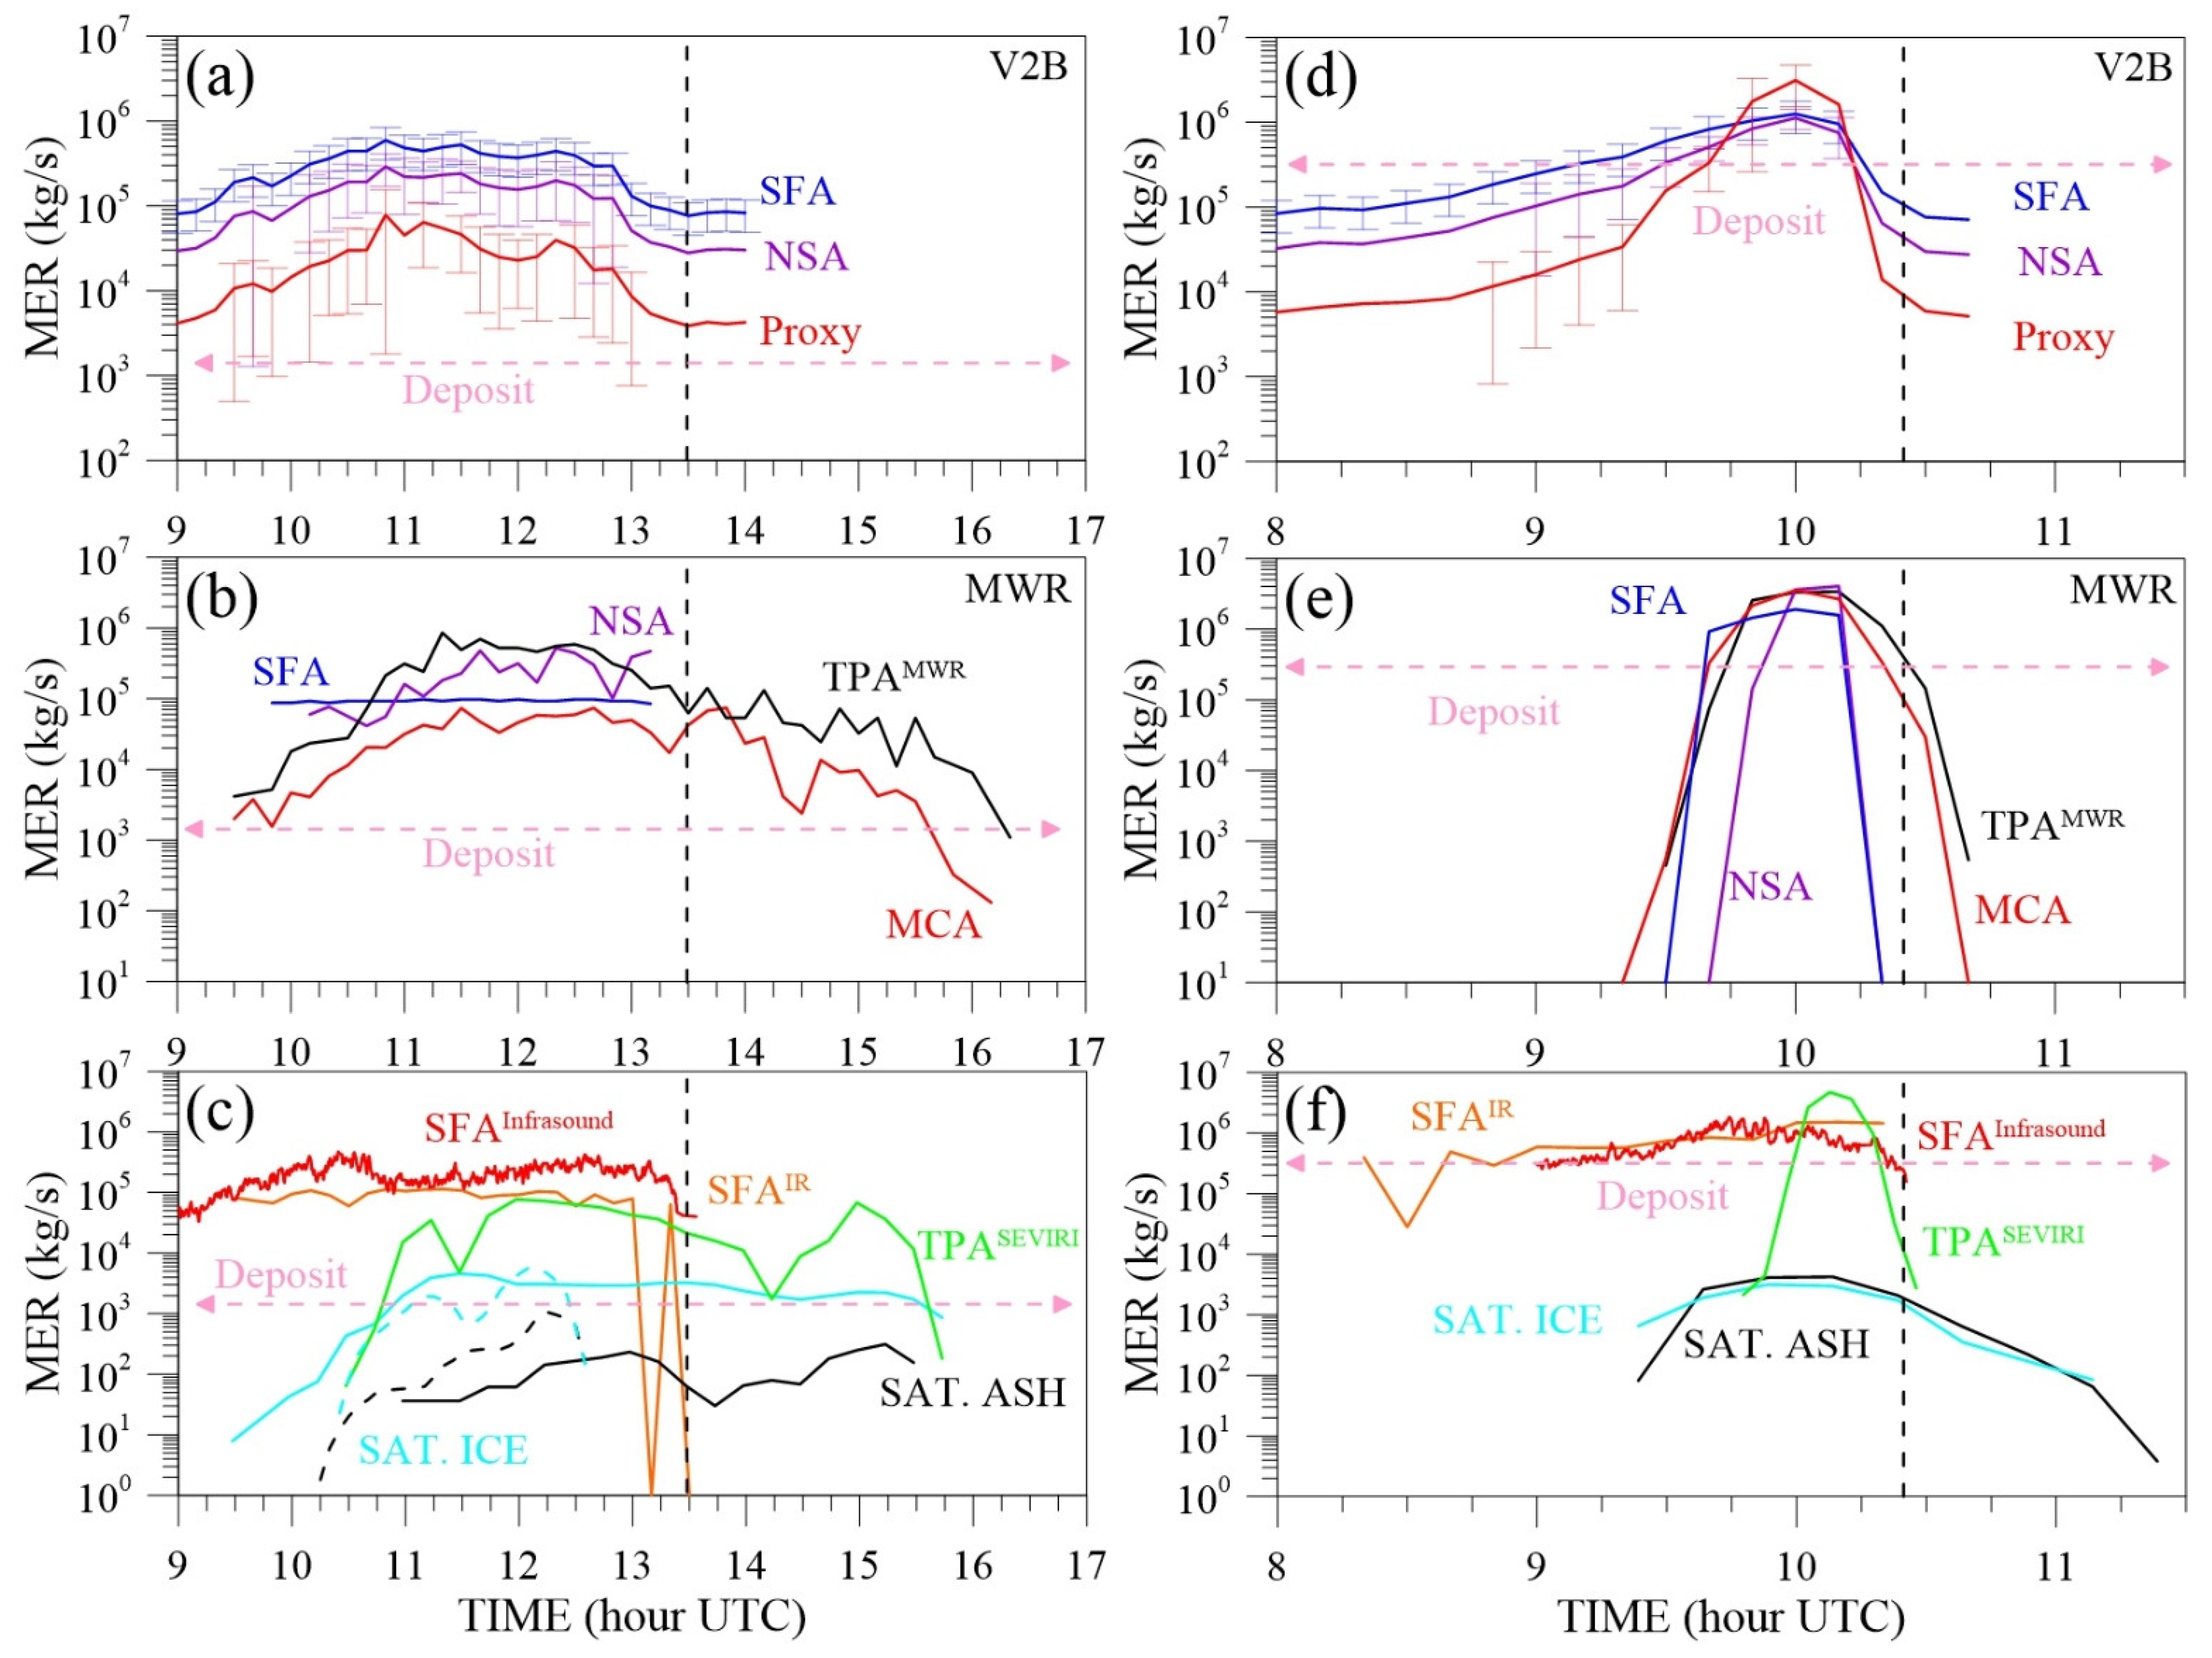
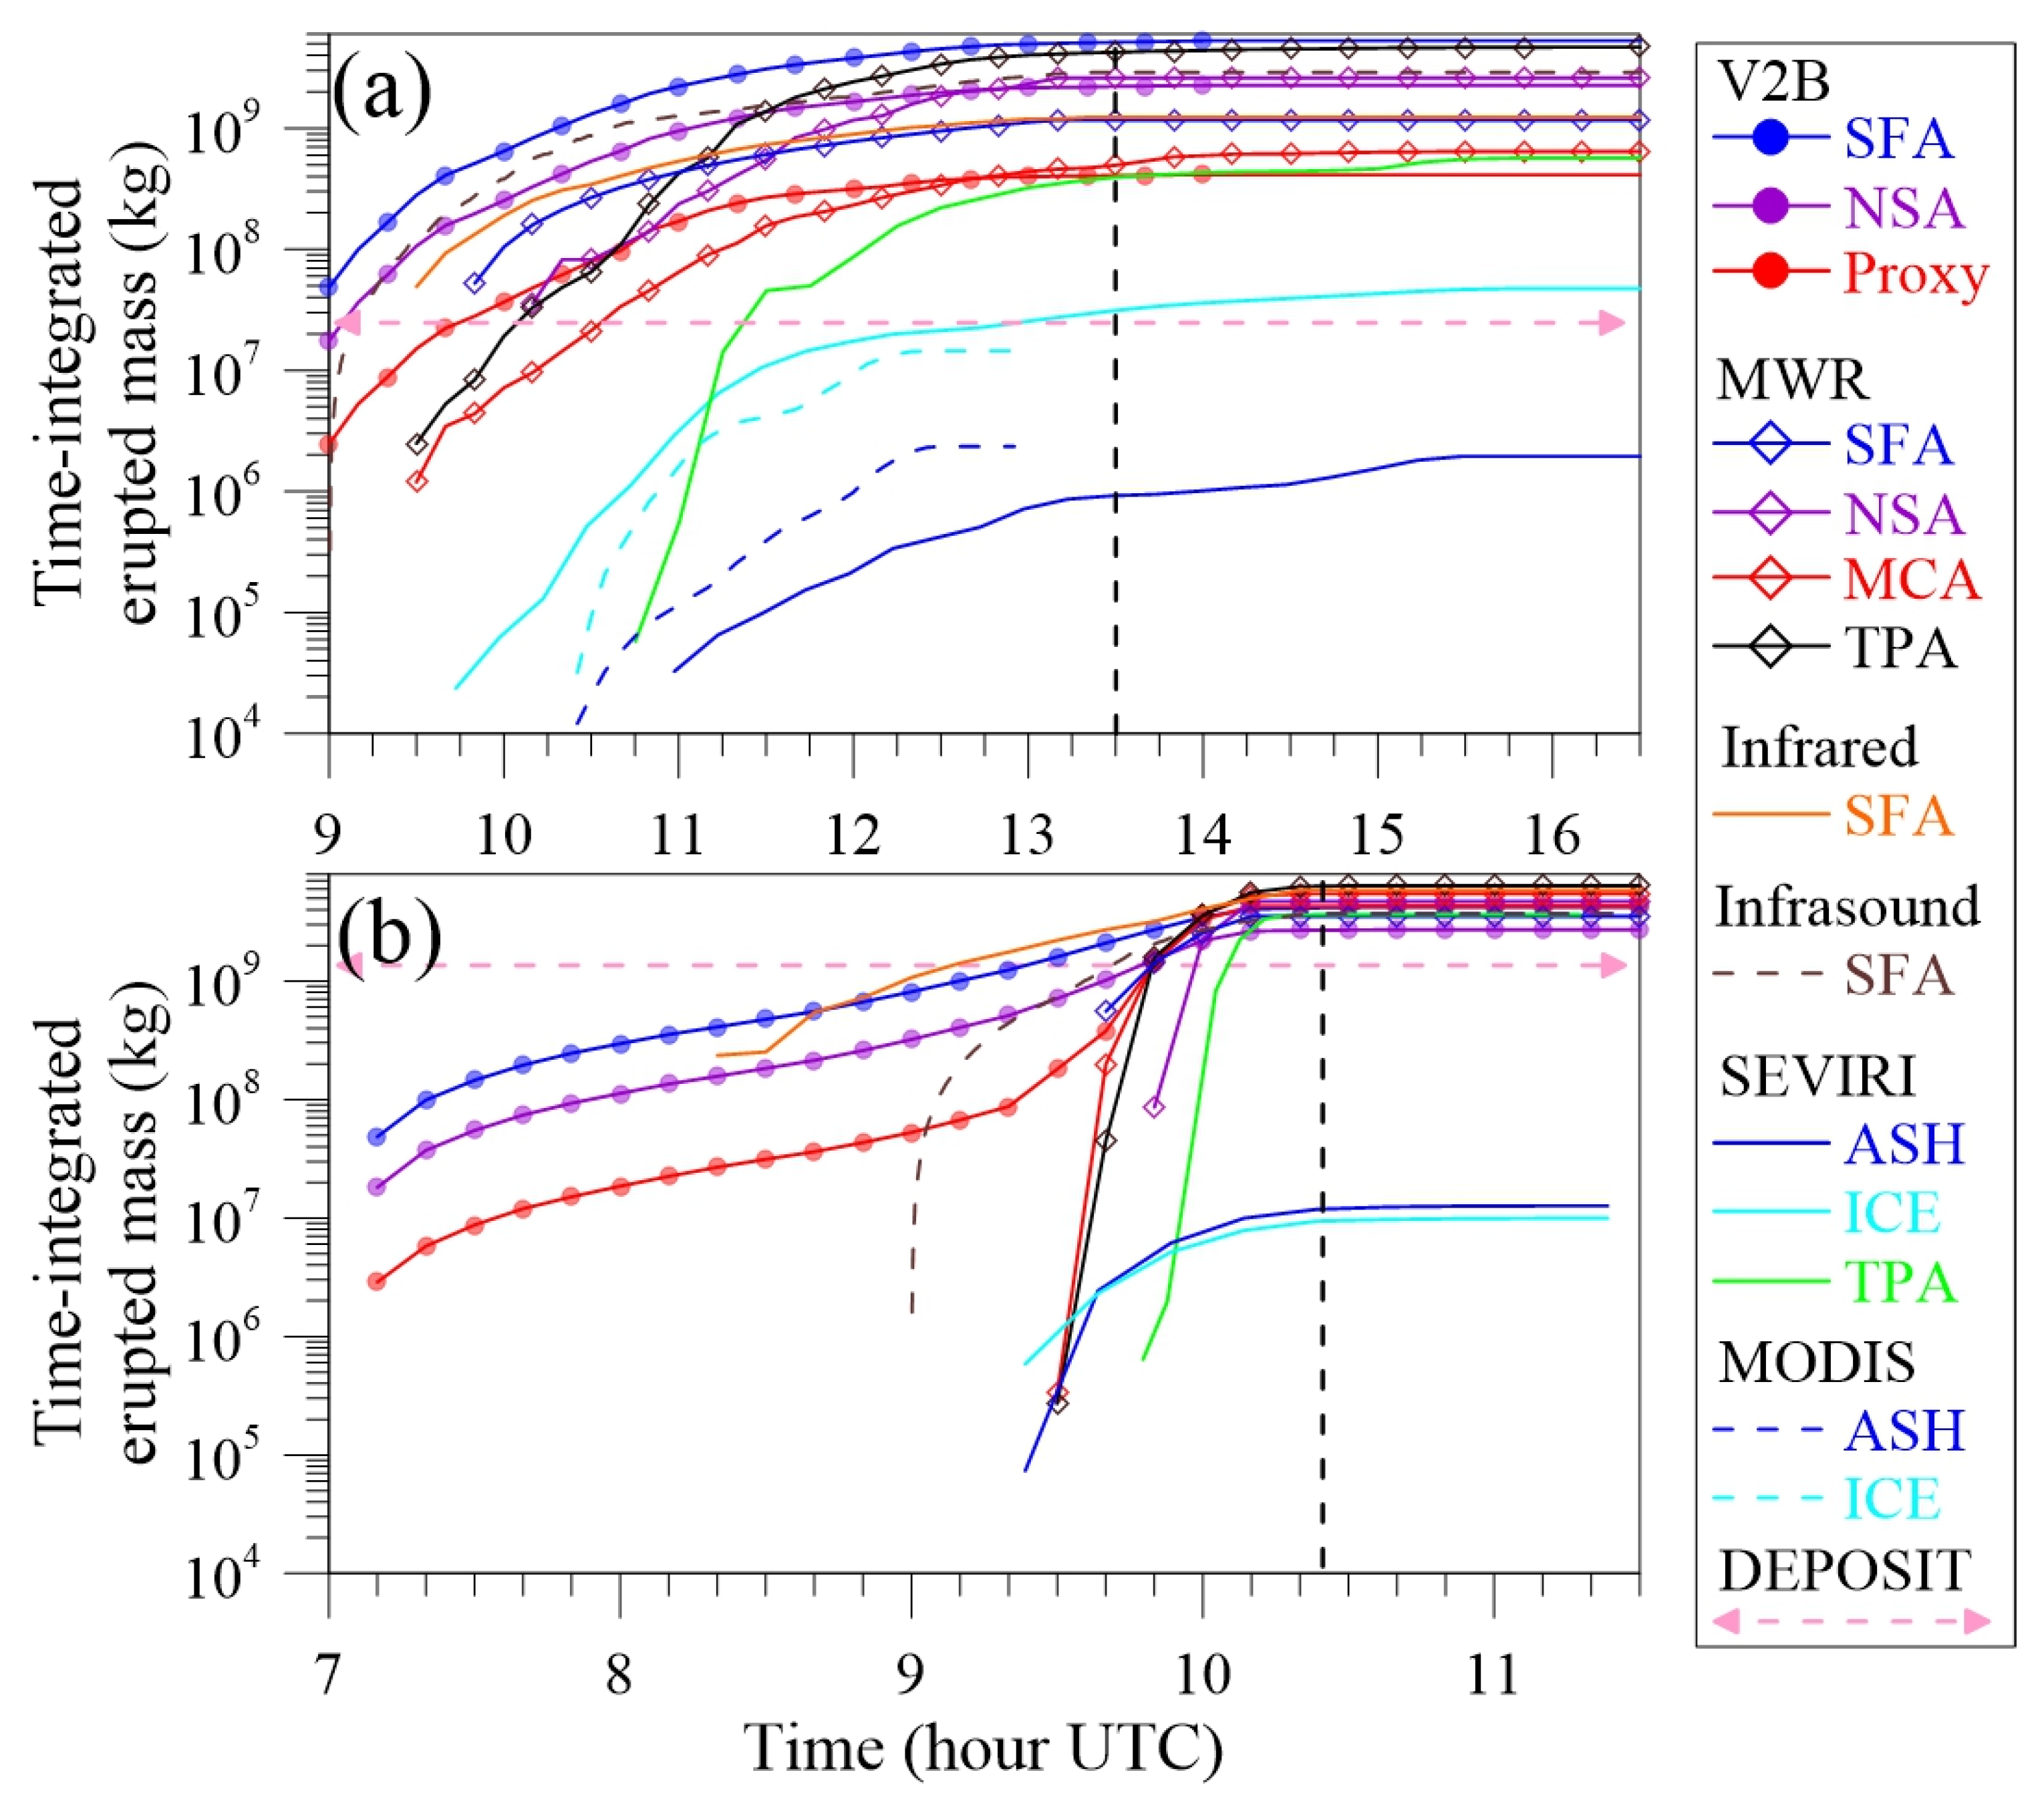
eruption duration, a critical parameter to convert the TEM in the MER and vice versa, is different among all sensors analyzed because it is associated with different phases of Etna’s paroxysms. V2B, infrared, and infrasound signals correspond to the starting and sustained activity of the paroxysm (Phase I, i.e., lava fountaining activity, and Phase II, i.e., lava fountain-fed tephra plume activity). In contrast, the MWR and satellite signals are associated with both Phase II and the final waning phase (Phase III) related to the subsequent expansion of plume and cloud in the atmosphere with little or no tephra emission from the source vent. As a result, the MER should be derived based on the TEM and duration associated with the same sensor. In the case of TEM derived from the tephra-fallout deposit, the duration used to calculate MERs should be that associated with Phase II and III (i.e., associated with MWR and satellite signals);
(2)
the three techniques currently used at Etna for the near real-time determination of HT (visible camera, MWR, and satellite-based thermal-infrared observations) operate at various time resolutions (i.e., 1 min to 15 min). A critical application of the three techniques, including the use of visible cameras at different locations [22], allows us to assess the best value of average HT as well as to evaluate the uncertainties associated with each remote sensor. In addition, it appears that satellite-based HT tend to be underestimated during weak and unstable paroxysmal activity;
(3)
exit velocities from V2B can be used in combination with exit velocities from infrasound to better constrain the vent radius used for MER calculations, based on the SFA. For Etna, a range of 10–13.5 m was found as the best estimate of the NSEC radius. A combination of V2B and infrared camera signal with the existing early warning system based on infrasonic data at Etna [16] has also the potential to better characterize the MER in real-time at the beginning of the paroxysmal activity, i.e., Phase I;
(4)
MER approaches are based on various parameters, e.g., radar echoes, exit velocities, or HT, and their accuracy strongly depends on the eruption intensity. Overall, approaches based on HT (e.g., SEVIRI-TPA, MWR-TPA) or signals proportional to the quantity of detected tephra (e.g., MWR-NSA, MWR-MCA, V2B-NSA) are better suited for computing MER in a large set of eruptive intensities. As an example, MER can be constrained at various time-resolution from 0.2 s (V2B) to 10 min (MWR) for a wide range of eruptive intensities and for all weather and light conditions. Instead, SFA methods (e.g., MWR-SFA, V2B-SFA, Infrasound-SFA, Ground-IR-SFA), based on exit velocities that do not vary significantly among paroxysms, might overestimate or underestimate the MER and TEM for weak and strong paroxysms, respectively;
(5)
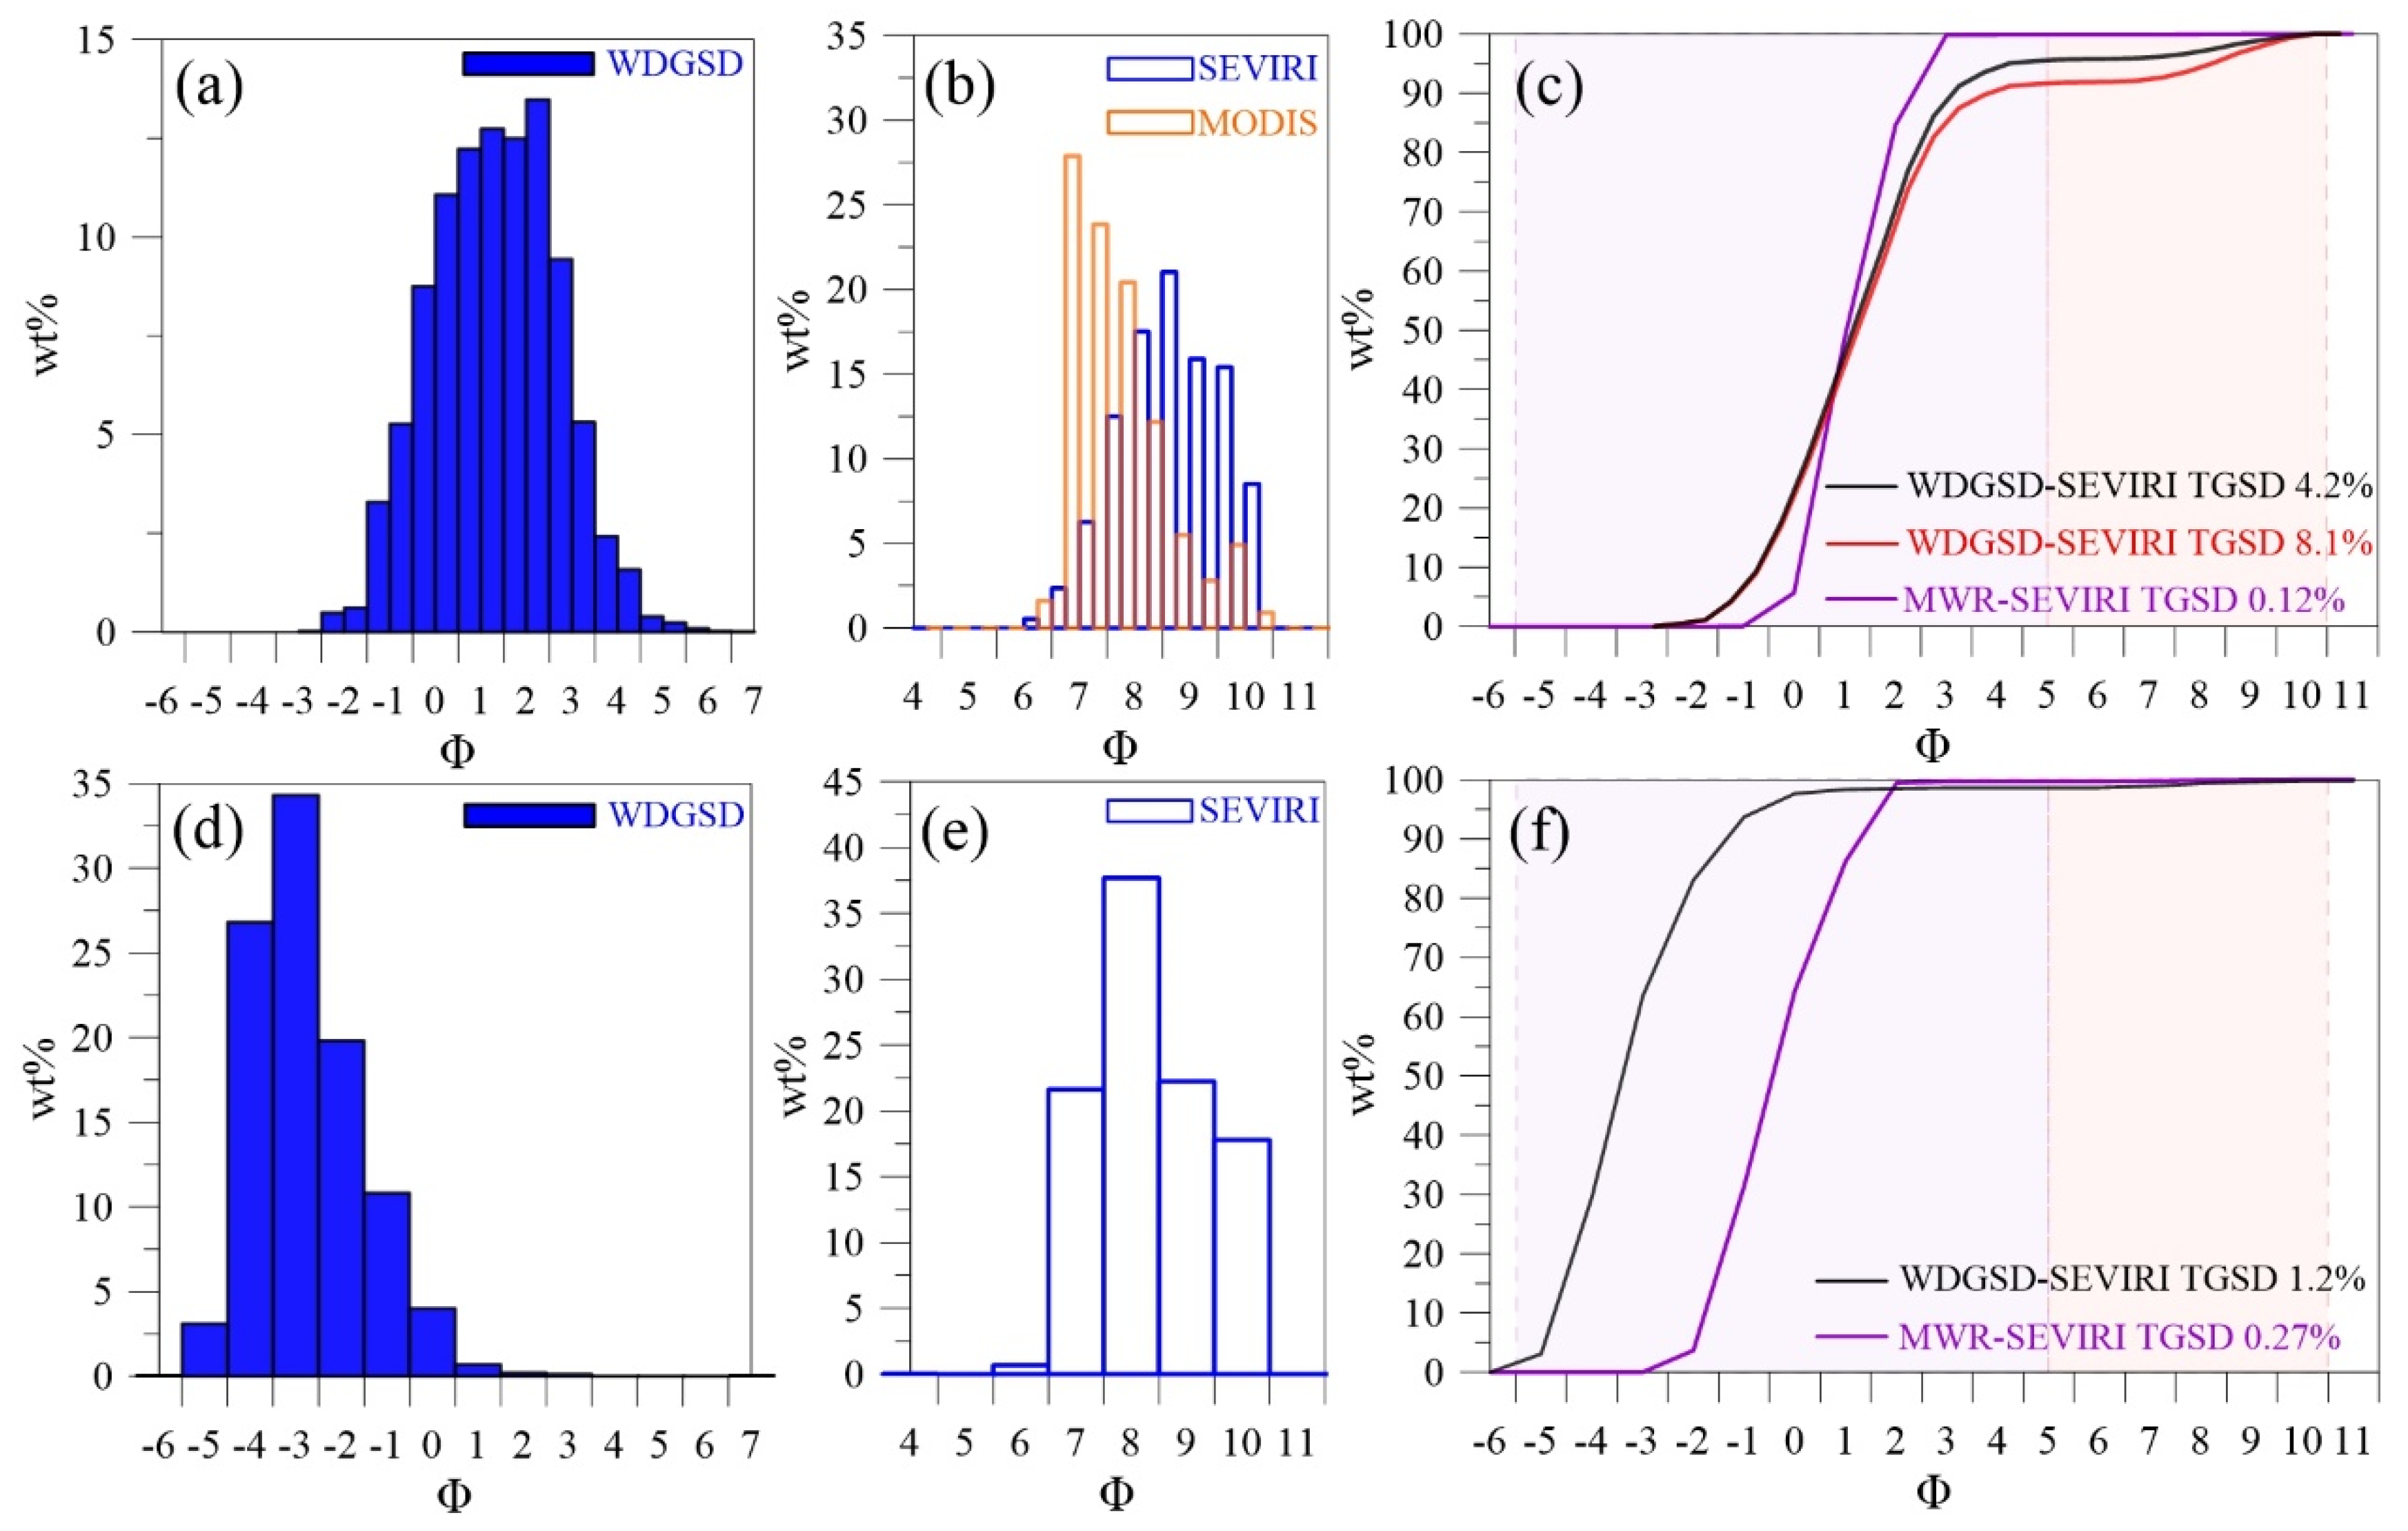
GSDMWR can be combined with GSDsat to provide a TGSD in near real-time, which is strongly affected by the determination of the relative TEMs. GSDMWR is representative of both the material contributing to the tephra-fallout deposit (contributing to the WDGSD) and to material that typically falls in the sea beyond the coastline (about 20 km from the vent in the case of Etna volcano). Nonetheless, a better constrain of the TEM associated with the two sensors and of the tails of the GSDs is required for operational use;
(6)
the combination of the WDGSD and GSDsat. can be used to validate the near real-time strategy described in the previous point as well as a proxy for near real-time tephra forecasting of future eruptions of similar intensity.
Our work represents a step forward in the understanding of multi-sensor strategies applied at very active explosive volcanoes such as Mount Etna. The next step will be to better assess individual sensor sensitivities to refine ESP estimate combinations. Additional information should be taken from other paroxysms, recorded by fewer instruments, to investigate their capacity to provide ESPs in comparison with both the well-recorded weak and strong paroxysms presented herein. Such a systematic determination of remote sensor advantages and limitations should always be carried out to build multi-sensor strategies that are reliable for a large set of eruptive conditions.

Author Contributions

Conceptualization, V.F.-L., C.B., S.C., F.D., F.S.M. and S.S.; methodology, V.F.-L., C.B, S.C., F.D., G.L., F.S.M. and S.S.; validation, V.F.-L., C.B, S.C., F.D., L.G., G.L., F.S.M. and S.S.; investigation, V.F.-L., C.B., S.C., F.D., L.G., G.L., F.S.M., L.M. (Luigi Mereu) and S.S.; tephra-fall deposit data treatment, V.F.-L., C.B. and S.S.; V2B data treatment, V.F.-L. and F.D.; MWR and infrared data treatment, L.M. (Luigi Mereu) and F.S.M.; visible imagery data treatment: S.S.; satellite data treatment, S.C., L.G., L.M. (Luca Merucci) and D.S.; infrasound data treatment, G.L. and M.R.; writing—original draft preparation, V.F.-L. and C.B.; writing—review and editing, All; supervision, C.B.; project administration, C.B.; funding acquisition, C.B. All authors have read and agreed to the published version of the manuscript.

Funding

This project has received funding from the European Union’s Horizon 2020 research and innovation program under grant agreement No 731070 (EUROVOLC). The work of SC, LG, DS and LM has been partially founded by the ESA project VISTA (Volcanic monItoring using SenTinel sensors by an integrated Approach), grant number 4000128399/19/I-DT, and from the INGV project Pianeta Dinamico. VOLDORAD 2B radar measurements on Etna are carried out in the frame of a collaborative research agreement between the Observatoire de Physique du Globe de Clermont-Ferrand (OPGC, Université Clermont Auvergne, Clermont-Ferrand, France), the French CNRS, and the INGV-OE. This study used the open-access Doppler radar data base of OPGC—Université Clermont Auvergne VOLDORAD (http://voldorad.opgc.fr/, accessed on 22 May 2021), also supported by EU EPOS and EUROVOLC programs and the French SNOV.

Institutional Review Board Statement

Not applicable.

Informed Consent Statement

Not applicable.

Data Availability Statement

The data presented in this study are available on request from the corresponding author.

Acknowledgments

We thank D. Lo Castro who collected tephra samples of the 10 April 2011 event together with S. Scollo. We also thank M. Prestifilippo who developed and maintains the visible calibrated camera monitoring system at INGV-OE with E. Biale, F. Ciancitto and E. Pecora. We thank M. Coltelli who was head of the volcanology team during both events studied in this paper. Samples were preserved at the sedimentology laboratory of INGV-OE thanks to the support of D. Andronico. We finally thank three anonymous reviewers who provided useful comments that helped us to greatly improved the manuscript.

Conflicts of Interest

The authors declare no conflict of interest.

Appendix A. Summary of Acronyms and Variables Used in This Study

AcronymTerm
ARPAAgenzia Regionale per la Protezione dell’Ambiente
BTDBrightness Temperature Difference
EBHDEtna Bronte High Definition camera
ECVEtna Catania Visible
ESPEruptive Source Parameter
ETNEtna
GSDGrain-Size Distribution
GSDsatGrain-Size Distribution derived from satellite retrievals
GSDMWRGrain-Size Distribution derived from X-band radar data
HYSPLITHybrid Single-Particle Lagrangian Integrated Trajectory Model
INGV-OEIstituto Nazionale di Geofisica e Vulcanologia-Osservatorio Etneo
TIRThermal InfraRed
ISInfraSound
MCAMass Continuity Approach
MODISModerate Resolution Imaging Spectroradiometer
MVTMonte Vetore
MWRMicrowave Weather Radar
NSANear Surface Approach
NASANational Aeronautics and Space Agency
NSECNew SouthEast Crater
SEVIRISpinning Enhances Visible and InfraRed Imager
SFASurface Flux Approach
TIRThermal InfraRed
TGSDTotal Grain-Size Distribution
TPATop Plume Approach
UTCUniversal Time Coordinated
VARRVolcanic Ash Radar Retrieval
VATDMVolcanic Ash Transport and Dispersal Model
VPRVolcanic Plume Retrieval
V2BVOLDORAD 2B
WDGSDWhole Deposit Grain-Size Distribution (i.e., GSD derived from tephra-fallout deposit)
SymbolVariable
AEntry Surface of volcanic jets in the radar beams (m2)
cSpeed of sound (m/s) [65]
CtTephra concentration (kg/m3) [15]
DnReflectivity-weighted mean radar diameter (m) [15]
HTPlume Top Height (km a.s.l.)
ILInsertion loss caused by topography (dB) [65]
kaProduct between the acoustic wave number k (m−1) and the vent radius a (m) [65]
MERMass Eruption Rate (kg/s)
qiVolumetric flux from infrasound (m3/s) [65]
|R|Acoustic reflectance [65]
ReEffective radius (m)
SEruptive vent surface (m2)
tTime (s)
TEMTotal Erupted Mass (kg)
ventryEntry velocity of particles in the radar beams (m/s)
vexitExit velocity (m/s) [12,30]
vrRadial velocity (m/s)
ZRadar Reflectivity factor (dBZ)
αDirectivity of the acoustic wave at 0° [65]
Β,γ,δ,εVARR Parameters to be used in Equations (3) and (4) [15]
θRadar beam elevation angle (°) [12,30]
ΔPPressure signal (Pa) [65]
λRadar wavelength (m)
ρAtmosphere density (kg/m3)
ρxMixture density (kg/m3) [15]
ΦPhi unit of particle sizes

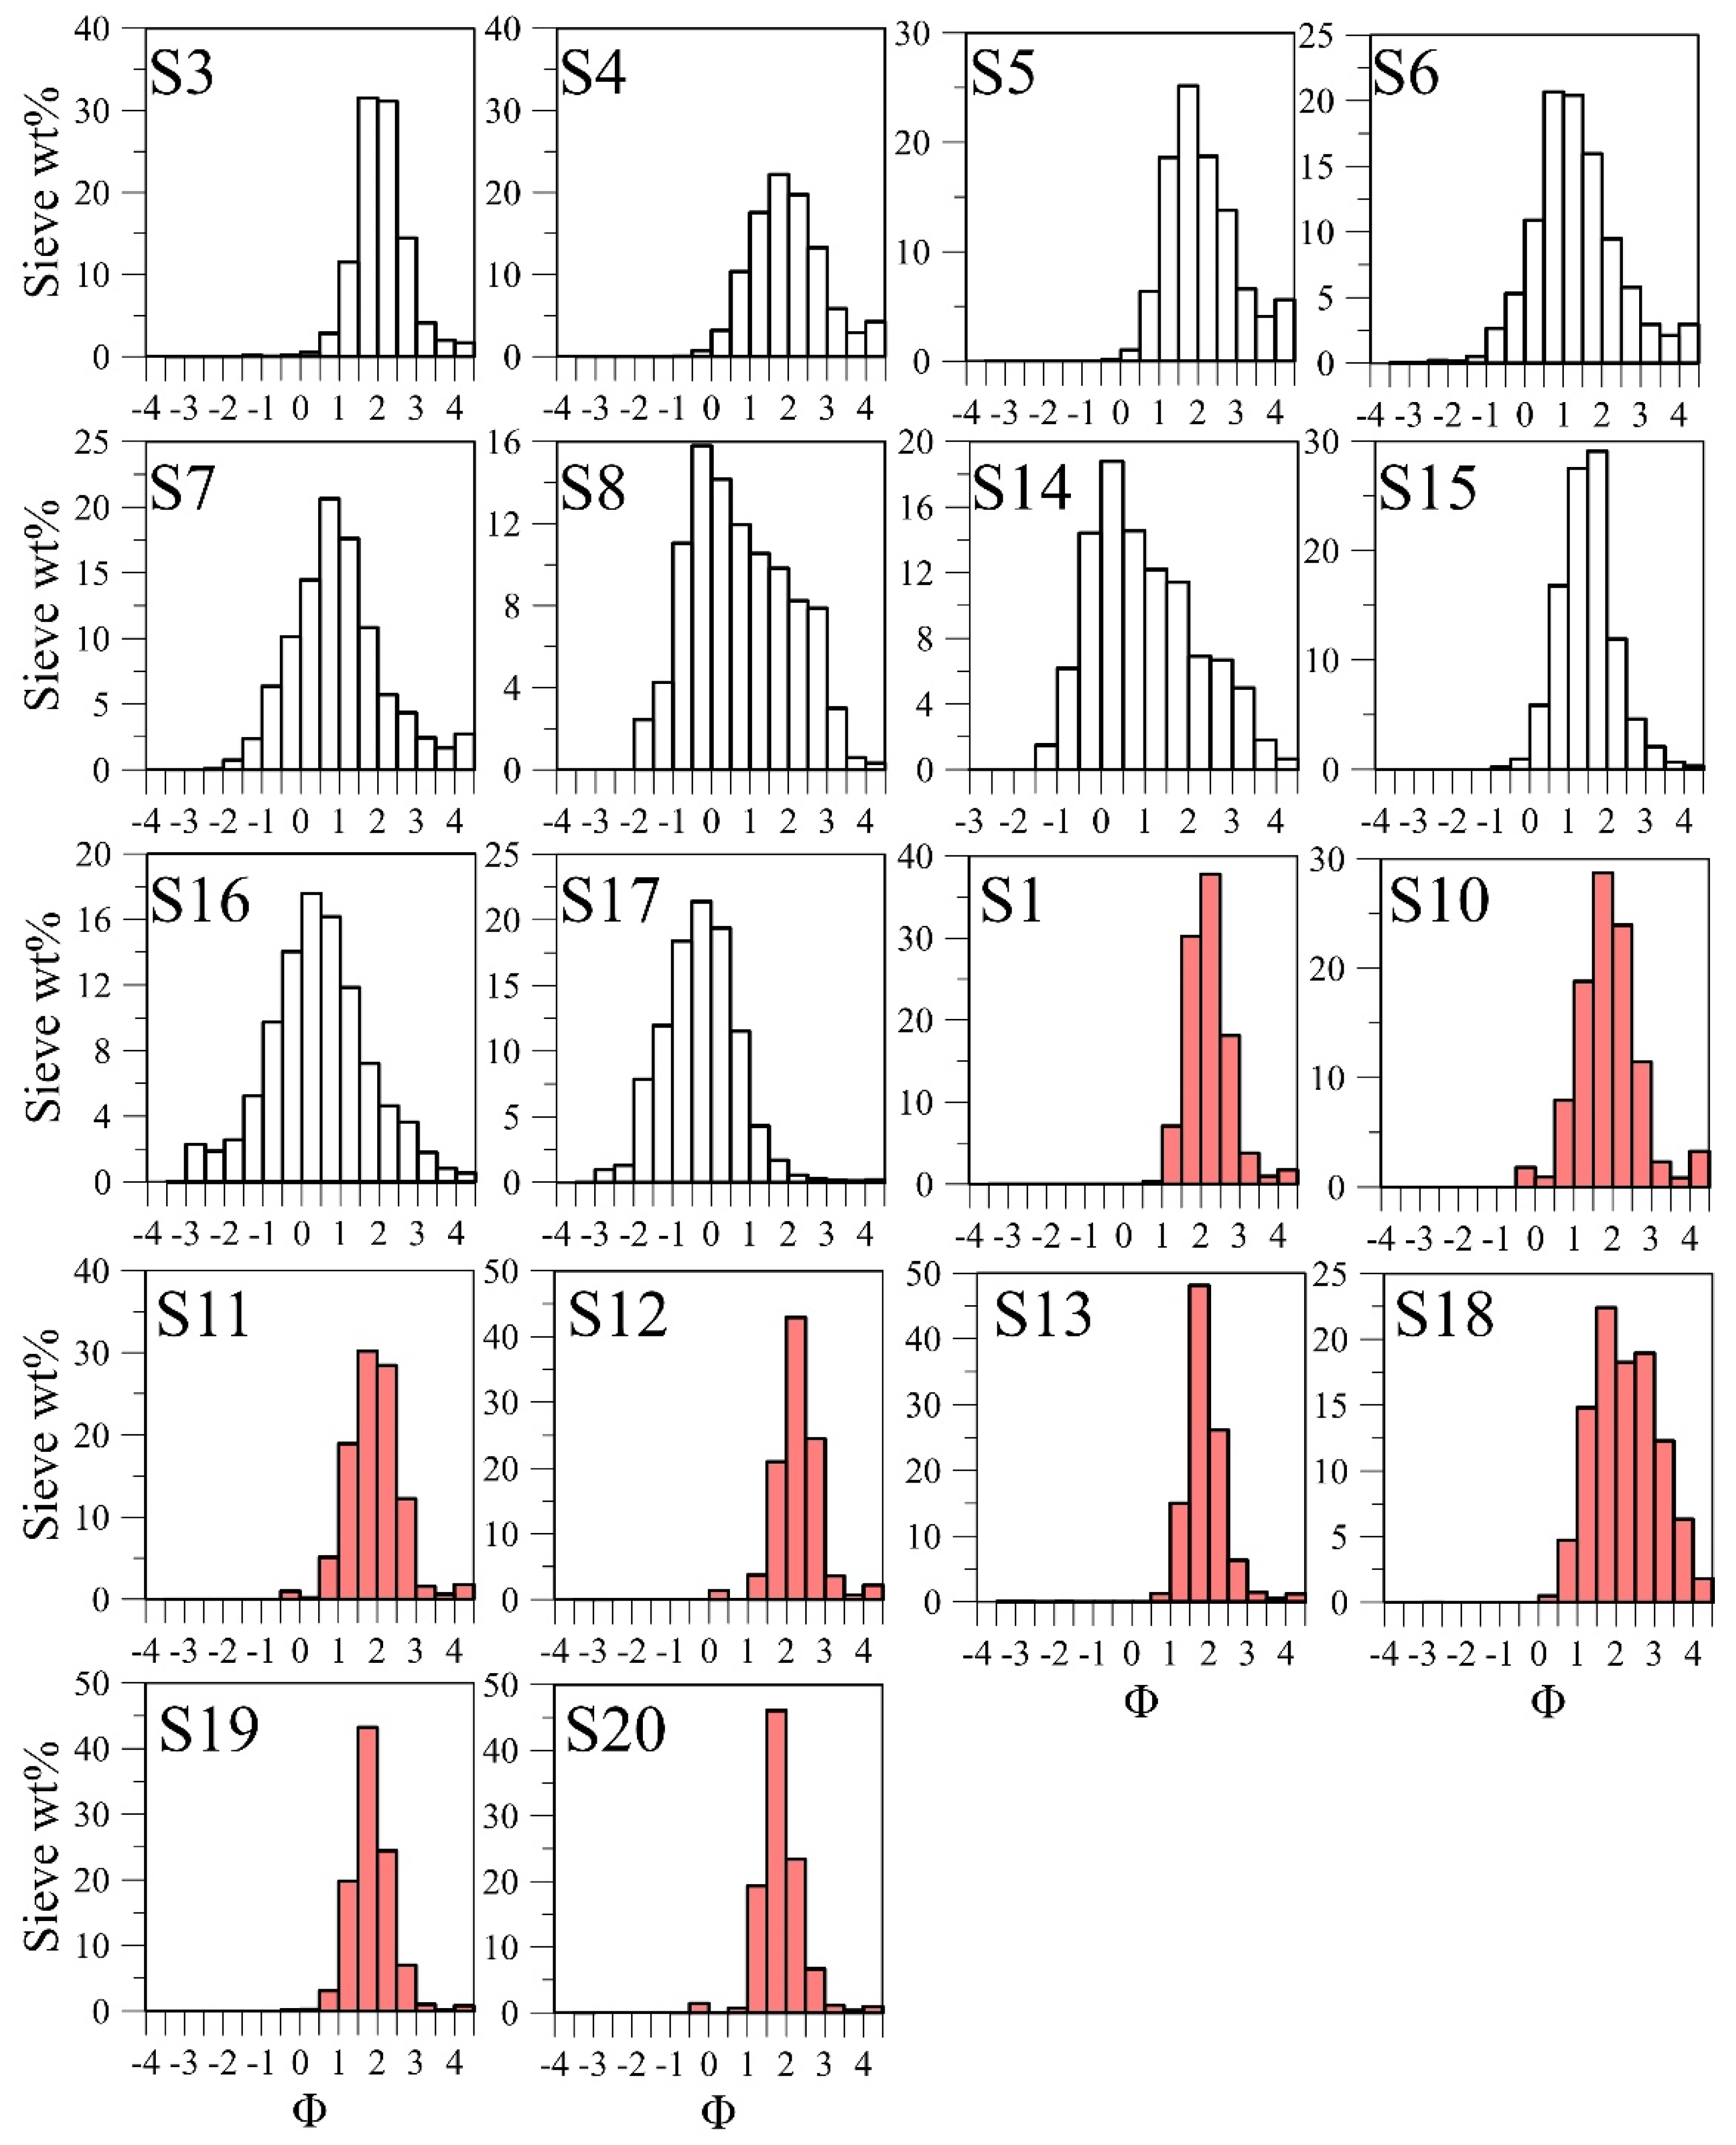
Appendix B. Grain-Size Data from the 29 August 2011 Tephra-Fallout Deposit

Figure A1. Individual GSDs obtained from sieving and using the BETTERSIZER morpho-grainsizer (red distributions). Sample names (i.e., from S1 to S20) are indicated on the top left of each plot.
Remotesensing 13 02097 g0a1

References

  1. Jenkins, S.F.; Wilson, T.; Magill, C.; Miller, V.; Stewart, C.; Blong, R.; Marzocchi, W.; Boulton, M.; Bonadonna, C.; Costa, A. Volcanic ash fall hazard and risk. In Global Volcanic Hazard and Risk; Loughlin, S.C., Sparks, S., Brown, S.K., Jenkins, S.F., Brown, C., Eds.; Cambridge University Press: Cambridge, UK, 2015; ISBN 978-1-107-11175-2. [Google Scholar]
  2. Wilson, T.M.; Jenkins, S.; Stewart, C. Impacts from volcanic ash fall. In Volcanic Hazards, Risk and Disasters; Papale, P., Ed.; Elsevier: Amsterdam, The Netherlands, 2015. [Google Scholar] [CrossRef]
  3. Calvari, S.; Salerno, G.G.; Spampinato, L.; Gouhier, M.; La Spina, A.; Pecora, E.; Harris, A.J.L.; Labazuy, P.; Biale, E.; Boschi, E. An unloading foam model to constrain Etna’s 11–13 January 2011 lava fountaining episode. J. Geophys. Res. 2011, 116, 1–18. [Google Scholar] [CrossRef]
  4. Calvari, S.; Cannavò, F.; Bonaccorso, A.; Spampinato, L.; Pellegrino, A.G. Paroxysmal Explosions, Lava Fountains and Ash plumes at Etna Volcano: Eruptive Processes and Hazard Implications. Front. Earth Sci. 2018, 6, 107. [Google Scholar] [CrossRef]
  5. Bonaccorso, A.; Caltabiano, T.; Currenti, G.; Del Negro, C.; Gambino, S.; Ganci, G.; Boschi, E. Dynamics of a lava fountain revealed by geophysical, geochemical and thermal satellite measurements: The case of the 10 April 2011 Mt Etna eruption. Geophys. Res. Lett. 2011, 38, 1–7. [Google Scholar] [CrossRef]
  6. Bonaccorso, A.; Calvari, S.; Linde, A.; Sacks, S. Eruptive processes leading to the most explosive lava fountain at Etna volcano: The 23 November 2013 episode. Geophys. Res. Lett. 2014, 41, 4912–4919. [Google Scholar] [CrossRef]
  7. Corradini, S.; Montopoli, M.; Guerrieri, L.; Ricci, M.; Scollo, S.; Merucci, L.; Marzano, F.S.; Pugnaghi, S.; Prestifilippo, M.; Ventress, L.J.; et al. A Multi-Sensor Approach for Volcanic Ash Cloud Retrieval and Eruption Characterization: The 23 November 2013 Etna Lava Fountain. Remote Sens. 2016, 8, 58. [Google Scholar] [CrossRef] [Green Version]
  8. Corradini, S.; Guerrieri, L.; Lombardo, V.; Merucci, L.; Musacchio, M.; Prestifilippo, M.; Scollo, S.; Silvestri, M.; Spata, G.; Stelitano, D. Proximal Monitoring of the 2011-2015 Etna Lava Fountains Using MSG-SEVIRI Data. Geosciences 2018, 8, 140. [Google Scholar] [CrossRef] [Green Version]
  9. Marzano, F.S.; Barbieri, S.; Vulpiani, G.; Rose, W.I. Volcanic cloud retrieval by ground-based microwave weather radar. IEEE Trans. Geosci. Rem. Sens. 2006, 44, 3235–3246. [Google Scholar] [CrossRef]
  10. Marzano, F.S.; Barbieri, S.; Picciotti, E.; Karlsdóttir, S. Monitoring subglacial Volcanic Eruption using Ground-Based C-Band Radar Imagery. IEEE Trans. Geosc. Remote Sens. 2010, 48, 403–414. [Google Scholar] [CrossRef]
  11. Donnadieu, F. Volcanological applications of Doppler radars: A review and examples from a transportable pulse radar in L-band. In Doppler Radar Observations—Weather Radar, Wind Profiler, Ionospheric Radar, and Other Advanced Applications; Bech, J., Chau, J.L., Eds.; In TechOpen: London, UK, 2012; pp. 409–446. ISBN 978-957-51-0496-4. [Google Scholar]
  12. Donnadieu, F.; Freville, P.; Hervier, C.; Coltelli, M.; Scollo, S.; Prestifilippo, M.; Valade, S.; Rivet, S.; Cacault, P. Near-source Doppler radar monitoring of tephra plumes at Etna. J. Volcanol. Geotherm. Res. 2016, 312, 26–39. [Google Scholar] [CrossRef]
  13. Montopoli, M. Velocity profiles inside volcanic clouds from three-dimensional scanning microwave dual polarization Doppler radars. J. Geophys. Res. Atmos. 2016, 121, 7881–7900. [Google Scholar] [CrossRef] [Green Version]
  14. Vulpiani, G.; Ripepe, M.; Valade, S. Mass discharge rate retrieval combining weather radar and thermal camera observations. J. Geophys. Res. Solid Earth 2016, 121, 5679–5695. [Google Scholar] [CrossRef] [Green Version]
  15. Marzano, F.S.; Mereu, L.; Scollo, S.; Donnadieu, F.; Bonadonna, C. Tephra Mass Eruption Rate from Ground-based X-Band and L-Band Microwave Radars during the 23 November 2013 Etna Paroxysm. IEEE Trans. Geosc. Remote Sens. 2020, 58, 3314–3327. [Google Scholar] [CrossRef]
  16. Ripepe, M.; Marchetti, E.; Delle Donne, D.; Genco, R.; Innocenti, L.; Lacanna, G.; Valade, S. Infrasonic Early Warning System for Explosive Eruption. J. Geophys. Res. Solid Earth 2018, 123, 9570–9585. [Google Scholar] [CrossRef]
  17. Sciotto, M.; Cannata, A.; Prestifilippo, M.; Scollo, S.; Fee, D.; Privitera, E. Unravelling the links between seismo-acoustic signals and eruptive parameters: Etna lava fountain case study. Sci. Rep. 2019, 9, 16417. [Google Scholar] [CrossRef] [PubMed] [Green Version]
  18. Scollo, S.; Boselli, A.; Coltelli, M.; Leto, G.; Pisani, G.; Spinelli, N.; Wang, X. Monitoring Etna volcanic plumes using a scanning lidar. Bull. Volcanol. 2012, 74, 2382–2395. [Google Scholar] [CrossRef]
  19. Scollo, S.; Boselli, A.; Coltelli, M.; Leto, G.; Pisani, G.; Prestifilippo, M.; Spinelli, N.; Wang, X. Volcanic ash concentration during the 12 August 2011 Etna eruption. Geophys. Res. Lett. 2015, 42, 2634–2641. [Google Scholar] [CrossRef]
  20. Scollo, S.; Prestifilippo, M.; Spata, G.; D’Agostino, M.; Coltelli, M. Monitoring and forecasting Etna volcanic plumes. Nat. Hazard Earth Syst. Sci. 2009, 9, 1573–1585. [Google Scholar] [CrossRef] [Green Version]
  21. Scollo, S.; Prestifilippo, M.; Pecora, E.; Corradini, S.; Merucci, L.; Spata, G.; Coltelli, M. Height estimation of the 2011–2013 Etna lava fountains. Ann. Geophys. 2014, 57, 0214. [Google Scholar] [CrossRef] [Green Version]
  22. Scollo, S.; Prestifilippo, M.; Bonadonna, C.; Cioni, R.; Corradini, S.; Degruyter, W.; Rossi, E.; Silvestri, M.; Biale, E.; Carparelli, G.; et al. Near-Real-Time Tephra Fallout Assessment at Mt. Etna, Italy. Remote Sens. 2019, 11, 2987. [Google Scholar] [CrossRef] [Green Version]
  23. Scollo, S.; Del Carlo, P.; Coltelli, M. Tephra fallout of 2001 Etna flank eruption: Analysis of the deposit and plume dispersion. J. Volcanol. Geotherm. Res. 2007, 160, 147–164. [Google Scholar] [CrossRef]
  24. Andronico, D.; Scollo, S.; Caruso, S.; Cristaldi, A. The 2002-03 Etna explosive activity: Tephra dispersal and features of the deposits. J. Geophys. Res. 2008, 113, B04209. [Google Scholar] [CrossRef] [Green Version]
  25. Andronico, D.; Scollo, S.; Cristaldi, A.; Ferrari, F. Monitoring ash emission episodes at Mt. Etna: The 16 november 2006 case study. J. Volcanol. Geotherm. Res. 2009, 180, 123–134. [Google Scholar] [CrossRef]
  26. Andronico, D.; Scollo, S.; Cristaldi, A.; Lo Castro, M.D. Representivity of incompletely sampled fall deposits in estimating eruption source parameters: A test using the 12–13 January 2011 lava fountain deposit from Mt. Etna volcano, Italy. Bull. Volcanol. 2014, 76, 861. [Google Scholar] [CrossRef]
  27. Andronico, D.; Scollo, S.; Cristaldi, A. Unexpected hazards from tephra fallouts at Mt Etna: The 23 November 2013 lava fountain. J. Volcanol. Geotherm. Res. 2015, 304, 118–125. [Google Scholar] [CrossRef]
  28. Marzano, F.S.; Lamantea, M.; Montopoli, M.; Herzog, M.; Graf, H.; Cimini, D. Microwave remote sensing of Plinian eruption due to the Grímsvötn Icelandic volcano on May 2011. Rem. Sens. Env. 2013, 129, 168–184. [Google Scholar] [CrossRef]
  29. Guerrieri, L.; Merucci, L.; Corradini, S.; Pugnaghi, S. Evolution of the 2011 Mt. Etna ash and SO2 lava fountain episodes using SEVIRI data and VPR retrieval approach. J. Volcanol. Geotherm. Res. 2015, 291, 63–71. [Google Scholar] [CrossRef]
  30. Freret-Lorgeril, V.; Donnadieu, F.; Scollo, S.; Provost, A.; Fréville, F.; Ghéhenneux, Y.; Hervier, C.; Prestifilippo, M.; Coltelli, M. Mass Eruption Rates of Tephra Plumes During the 2011-2015 Lava Fountain Paroxysms at Mt. Etna From Doppler Radar Retrievals. Front. Earth Sci. 2018, 6, 73. [Google Scholar] [CrossRef]
  31. Poret, M.; Corradini, S.; Merucci, L.; Costa, A.; Andronico, D.; Montopoli, M.; Vulpiani, G.; Freret-Lorgeril, V. Reconstructing volcanic plume evolution integrating satellite and ground-based data: Application to the 23 November 2013 Etna eruption. Atmos. Chem. Phys. 2018, 18, 4695–4714. [Google Scholar] [CrossRef] [Green Version]
  32. Poret, M.; Costa, A.; Andronico, D.; Scollo, S.; Gouhier, M.; Cristaldi, A. Modelling eruption source parameters by integrating field, ground-based and satellite-based data: The case of the 23rd February 2013 Etna paroxysm. J. Geophys. Res. Solid Earth 2018, 123, 5427–5450. [Google Scholar] [CrossRef]
  33. Mereu, L.; Scollo, S.; Bonadonna, C.; Freret-Lorgeril, V.; Marzano, F.S. Multisensor Characterization of the Incandescent Jet Region of Lava Fountain-Fed Tephra Plumes. Remote Sens. 2020, 12, 3629. [Google Scholar] [CrossRef]
  34. Scollo, S.; Boselli, A.; Corradini, S.; Leto, G.; Guerrieri, L.; Merucci, L.; Prestifilippo, M.; Sanchez, R.Z.; Sannino, A.; Stelitano, D. Multi-Sensor Analysis of a Weak and Long-Lasting Volcanic Plume Emission. Remote Sens. 2020, 12, 3866. [Google Scholar] [CrossRef]
  35. Behncke, B.; Branca, S.; Corsaro, R.A.; De Beni, E.; Miraglia, L.; Proietti, C. The 2011–2012 summit activity of Mount Etna: Birth, growth and products of the new SE crater. J. Volcanol. Geotherm. Res. 2014, 270, 10–21. [Google Scholar] [CrossRef]
  36. De Beni, E.; Behncke, B.; Branca, S.; Nicolosi, I.; Carluccio, R.; D’Ajello Caracciolo, F.; Chiappini, M. The continuing story of Etna’s New Southeast Crater (2012–2014): Evolution and volume calculations based on field surveys and aerophotogrammetry. J. Volcanol. Geotherm. Res. 2015, 303, 175–186. [Google Scholar] [CrossRef]
  37. Bonaccorso, A.; Calvari, S. A new approach to investigate an eruptive paroxysmal sequence using camera and strainmeter networks: Lessons from the 3–5 December 2015 activity at Etna volcano. Earth Planet. Sci. Lett. 2017, 475, 231–241. [Google Scholar] [CrossRef]
  38. Corsaro, R.A.; Andronico, D.; Behncke, B.; Branca, S.; Caltabiano, T.; Ciancitto, F.; Cristaldi, A.; De Beni, E.; La Spina, A.; Lodato, L.; et al. Monitoring the December 2015 summit eruption of Mt. Etna (Italy): Implications on eruptive dynamics. J. Volcanol. Geotherm. Res. 2017, 341, 53–69. [Google Scholar] [CrossRef]
  39. Boichu, M.; Clarisse, L.; Péré, J.C.; Herbin, H.; Goloub, P.; Thieuleux, F.; Ducos, F.; Clerbaux, C.; Tanré, C. Temporal variations of flux and altitude of sulfur dioxide emissions during volcanic eruptions: Implications for long-range dispersal of volcanic clouds. Atmos. Chem. Phys. 2015, 15, 8381–8400. [Google Scholar] [CrossRef] [Green Version]
  40. Pyle, D.M. The thickness, volume, and grainsize of tephra fall deposits. Bull. Volcanol. 1989, 51, 1–15. [Google Scholar] [CrossRef]
  41. Bonadonna, C.; Houghton, B.F. Total grain-size distribution and volume of tephra-fall deposits. Bull. Volcanol. 2005, 67, 441–456. [Google Scholar] [CrossRef]
  42. Bonadonna, C.; Costa, A. Estimating the volume of tephra deposits: A new simple strategy. Geology 2012, 40, 415–418. [Google Scholar] [CrossRef]
  43. Biass, S.; Bonadonna, C. A quantitative uncertainty assessment of eruptive parameters derived from tephra deposits: The example of two large eruptions of Cotopaxi volcano, Ecuador. Bull. Volcanol. 2011, 73, 73–90. [Google Scholar] [CrossRef] [Green Version]
  44. Donnadieu, F.; Freville, P.; Rivet, S.; Hervier, C.; Cacault, P. The Volcano Doppler radar data base of Etna (VOLDORAD 2B). Université Clermont Auvergne—CNRS. 2015. Available online: http://www.obs.univ-bpclermont.fr/SO/televolc/voldorad/bddtr.php (accessed on 22 May 2021).
  45. Marzano, F.S.; Picciotti, E.; Vulpiani, G.; Montopoli, M. Synthetic signatures of volcanic ash cloud particles from X-Band dual-polarization radar. IEEE Trans. Geosc. Remote Sens. 2012, 50, 193–211. [Google Scholar] [CrossRef]
  46. Mereu, L.; Marzano, F.S.; Montopoli, M.; Bonadonna, C. Retrieval of Tephra Size Spectra and Mass Flow Rate From C-Band Radar During the 2010 Eyjafjallajökull Eruption, Icelande. IEEE Trans. Geosc. Remote Sens. 2015, 53, 5644–5660. [Google Scholar] [CrossRef]
  47. Sauvageot, H. Radar Meteorology; Artech House: Boston, MA, USA, 1992; ISBN 0890063184. [Google Scholar]
  48. Degruyter, W.; Bonadonna, C. Improving on mass flow rate estimates of volcanic eruptions. Geophys. Res. Lett. 2012, 39, L16308. [Google Scholar] [CrossRef] [Green Version]
  49. Corradini, S.; Spinetti, C.; Carboni, E.; Tirelli, C.; Buongiorno, M.F.; Pugnaghi, S.; Gangale, G. Etna tropospheric ash retrieval and sensitivity analysis using Moderate Resolution Imaging Spectroradiometer measurements. J. Appl. Remote Sens. 2008, 2, 023550. [Google Scholar] [CrossRef]
  50. Gouhier, M.; Eychenne, J.; Azzaoui, N.; Guillin, A.; Deslandes, M.; Poret, M.; Costa, A.; Husson, P. Low efficiency of large volcanic eruptions in transporting very fine ash into the atmosphere. Sci. Rep. 2019, 9, 1449. [Google Scholar] [CrossRef] [PubMed]
  51. Prata, A.J.; Grant, I.F. Retrieval of microphysical and morphological properties of volcanic ash plumes from satellite data: Application to Mt. Ruapehu, New Zealand. Q. J. Royal Meteorol. Soc. 2001, 127, 2153–2179. [Google Scholar] [CrossRef]
  52. Corradini, S.; Guerrieri, L.; Stelitano, D.; Salerno, G.; Scollo, S.; Merucci, L.; Prestifilippo, M.; Musacchio, M.; Silvestri, M.; Lombardo, V.; et al. Near Real-Time Monitoring of the Christmas 2018 Etna Eruption Using SEVIRI and Products Validation. Remote Sens. 2020, 12, 1336. [Google Scholar] [CrossRef] [Green Version]
  53. Prata, A.J. Infrared radiative transfer calculations for volcanic ash clouds. Geophys. Res. Lett. 1989, 16, 1293–1296. [Google Scholar] [CrossRef]
  54. Pugnaghi, S.; Guerrieri, L.; Corradini, S.; Merucci, L.; Arvani, B. A new simplified procedure for the simultaneous SO2 and ash retrieval in a tropospheric volcanic cloud. Atmos. Meas. Tech. 2013, 6, 1315–1327. [Google Scholar] [CrossRef] [Green Version]
  55. Pugnaghi, S.; Guerrieri, L.; Corradini, S.; Merucci, L. Real time retrieval of volcanic cloud particles and SO2 by satellite using an improved simplified approach. Atmos. Meas. Tech. 2016, 9, 1–10. [Google Scholar] [CrossRef] [Green Version]
  56. Corradini, S.; Pugnaghi, S.; Pscini, A.; Guerrieri, L.; Merucci, L.; Picchiani, M.; Chini, M. Volcanic Ash and SO2 retrievals using synthetic MODIS TIR data: Comparison between inversion procedures and sensitivity analysis. Ann. Geophys. 2014, 57, 2. [Google Scholar]
  57. Wen, S.; Rose, W.I. Retrieval of sizes and total masses of particles in volcanic clouds using AVHRR bands 4 and 5. J. Geophys. Res. 1994, 99, 5421–5431. [Google Scholar] [CrossRef]
  58. Pugnaghi, S.; Gangale, G.; Corradini, S.; Buongiorno, M.F. Etna sulfur dioxide flux monitoring using ASTER-TIR data and atmospheric observations. J. Volcanol. Geotherm. Res. 2006, 152, 74–90. [Google Scholar] [CrossRef]
  59. Corradini, S.; Merucci, L.; Prata, A.J. Retrieval of SO2 from thermal infrared satellite measurements: Correction procedures for the effects of volcanic ash. Atmos. Meas. Tech. 2009, 2, 177–191. [Google Scholar] [CrossRef] [Green Version]
  60. Merucci, L.; Burton, M.; Corradini, S.; Salerno, G. Reconstruction of SO2 flux emission chronology from space-based measurements. J. Volcanol. Geotherm. Res. 2011, 206, 80–87. [Google Scholar] [CrossRef]
  61. Theys, N.; Campion, R.; Clarisse, L.; Brenot, H.; van Gent, J.; Dils, B.; Corradini, S.; Merucci, L.; Coheur, P.-F.; Van Roozendael, M.; et al. Volcanic SO2 Fluxes Derived from Satellite Data: A Survey Using OMI, GOME-2, IASI and MODIS. Atmos. Chem. Phys. 2013, 13, 5945–5968. [Google Scholar] [CrossRef] [Green Version]
  62. Ulivieri, G.; Ripepe, M.; Marchetti, E. Infrasound reveals transition to oscillatory discharge regime during lava fountaining: Implication for early warning. Geophys. Res. Lett. 2013, 40, 3008–3013. [Google Scholar] [CrossRef]
  63. Marchetti, E.; Ripepe, M.; Campus, P.; Le Pichon, A.; Vergoz, J.; Lacanna, G.; Mialle, P.; Héreil, P.; Husson, P. Long range infrasound monitoring of Etna volcano. Sci. Rep. 2019, 9, 18015. [Google Scholar] [CrossRef] [PubMed]
  64. Sanchez, C.; Ripepe, M.; Lacanna, G.; Poggi, P. Experimental modeling of mass eruption rates from acoustics wave. J. Acoust. Soc. Am. 2019, 146, 3076. [Google Scholar] [CrossRef]
  65. Lacanna, G.; Ripepe, M. Modeling the Acoustic Flux inside the Magmatic Conduit by 3D-FDTD Simulation. J. Geophys. Res. Solid Earth 2020, 125, e2019JB018849. [Google Scholar] [CrossRef]
  66. Ripepe, M.; Bonadonna, C.; Folch, A.; Delle Donne, D.; Lacanna, G.; Marchetti, E.; Hoskuldsson, A. Ash-plume dynamics and eruption source parameters by infrasound and thermal imagery. Earth Planet. Sci. Lett. 2013, 366, 112–121. [Google Scholar] [CrossRef] [Green Version]
  67. Carbone, D.; Zuccarello, L.; Messina, A.; Scollo, S.; Rymer, H. Balancing bulk gas accumulation and gas output before and during lava fountaining episodes at Mt. Etna. Sci Rep. 2015, 5, 18049. [Google Scholar] [CrossRef] [Green Version]
  68. Bonadonna, C.; Biass, S.; Costa, A. Physical characterization of explosive volcanic eruptions based on tephra deposits: Propagation of uncertainties and sensitivity analysis. J. Volcanol. Geotherm. Res. 2015, 296, 80–100. [Google Scholar] [CrossRef]
  69. Spanu, A.; de’ Michieli Vitturi, M.; Barsotti, S. Reconstructing eruptive source parameters from tephra deposit: A numerical study of medium-sized explosive eruptions at Etna volcano. Bull. Volcanol. 2016, 78, 1–19. [Google Scholar] [CrossRef] [Green Version]
  70. Inman, D.L. Measures for describing the size distribution of sediments. J. Sed. Petrol. 1952, 22, 125–145. [Google Scholar]
  71. Bonadonna, C.; Genco, R.; Gouhier, M.; Pistolesi, M.; Cioni, R.; Alfano, F.; Hoskuldsson, A.; Ripepe, M. Tephra sedimentation during the 2010 Eyjafjallajökull eruption (Iceland) from deposit, radar, and satellite observations. J. Geophys. Res. Lett. 2011, 116, B12202. [Google Scholar] [CrossRef]
  72. Petersen, G.N.; Bjornsson, H.; Arason, P.; von Löwis, S. Two weather radar time series of the altitude of the volcanic plume during the May 2011 eruption of Grímsvötn, Iceland. Earth Syst. Sci. Data 2012, 4, 121–127. [Google Scholar] [CrossRef] [Green Version]
  73. Folch, A. A review of tephra transport and dispersal models: Evolution, current status, and future perspectives. J. Volcanol. Geotherm. Res. 2012, 235–236, 96–115. [Google Scholar] [CrossRef]
  74. Witham, C. Assessment of the impact of radar height data on model forecasts for Grímsvötn 2011. In Statistical Assessment of Dispersion Model Sensitivity; Deliverable report D8.5 of the EU FUTUREVOLC project; Beckett, F., Witham, C., Devenish, B., Eds.; 2015; Available online: http://futurevolc.hi.is/sites/futurevolc.hi.is/files/Pdf/Deliverables/fv_d8_5_to_submit_low.pdf (accessed on 1 January 2020).
  75. Beckett, F.M.; Witham, C.S.; Leadbetter, S.J.; Crocker, R.; Webster, H.N.; Hort, M.C.; Jones, A.R.; Devenish, B.J.; Thomson, D.J. Atmospheric Dipersion Modelling at the London VACC: A review of Developments since the 2010 Eyjafjallajökull Volcano Ash Cloud. Atmosphere 2020, 11, 352. [Google Scholar] [CrossRef] [Green Version]
  76. Lacasse, C.; Karlsdóttir, S.; Larsen, G.; Soosalu, H.; Rose, W.I.; Ernst, G.G.J. Weather radar observations of the Hekla 2000 eruption cloud, Iceland. Bull. Volcanol. 2004, 66, 457–473. [Google Scholar] [CrossRef]
  77. Morton, B.; Taylor, G.; Turner, J. Gravitational turbulent convection from maintained and instantaneous sources. Proc. Math. Phys. Eng. Sci. 1956, 234, 1–23. [Google Scholar] [CrossRef]
  78. Sparks, R.S.J. The dimensions and dynamics of volcanic eruption columns. Bull. Volcanol. 1986, 48, 3–15. [Google Scholar] [CrossRef]
  79. Mastin, L.G. A user-friendly one-dimensional model for wet volcanic plumes. Geochem. Geophys. Geosys. 2007, 8, Q03014. [Google Scholar] [CrossRef]
  80. De’ Michieli Vitturi, M.; Neri, A.; Barsotti, S. PLUME-MoM 1.0: A new integral model of volcanic plumes based on the method of moments. Geosci. Model. Dev. 2015, 8, 2447–2463. [Google Scholar] [CrossRef] [Green Version]
  81. Snee, E.; Degruyter, W.; Bonadonna, C.; Scollo, S.; Rossi, E.; Freret-Lorgeril, V. A model for buoyant tephra plumes couples to lava fountains with an application to paroxysmal eruptions at Mount Etna, Italy. J. Geophys. Res. Solid Earth 2021, e2020JB021360. [Google Scholar] [CrossRef]
  82. Bonadonna, C.; Folch, A.; Loughlin, S.; Puempel, H. Future developments in modelling and monitoring of volcanic ash clouds: Outcomes from the first IAVCEI-WMO workshop on Ash Dispersal Forecast and Civil Aviation. Bull. Volcanol. 2012, 74, 1–10. [Google Scholar] [CrossRef] [Green Version]
  83. Stevenson, J.; Millington, S.; Beckett, F.M.; Swindles, G.; Thordarson, T. Understanding the discrepancy between tephrochronology and satellite infrared measurements of volcanic ash. Atmos. Meas. Tech. 2015, 8, 2069–2091. [Google Scholar] [CrossRef] [Green Version]
  84. Gouhier, M.; Donnadieu, F. Mass estimations of ejecta from Strombolian explosions by inversion of Doppler radar measurements. J. Geophys. Res. 2008, 113, B10202. [Google Scholar] [CrossRef] [Green Version]
  85. Alparone, S.; Andronico, D.; Lodato, L.; Sgroi, T. Relationship between tremor and volcanic activity during the Southeast Crater eruption of Mount Etna in early 2000. J. Geophys. Res. 2003, 108, 2241. [Google Scholar] [CrossRef] [Green Version]
  86. Carey, S.; Sparks, R.S.J. Quantitative models of the fallout and dispersal of tephra from volcanic eruption columns. Bull. Volcanol. 1986, 48, 109–125. [Google Scholar] [CrossRef]
  87. Rossi, E.; Bonadonna, C.; Degruyter, W. A new strategy for the estimation of plume height from clast dispersal in various atmospheric and eruptive conditions. Earth. Planet. Sci. Lett. 2019, 505, 1–12. [Google Scholar] [CrossRef]
Figure 1. (a) Location of all remote sensing systems considered in this work (VOLDORAD 2B: V2B, Thermal camera; X-band weather radar: MWR; visible camera: ECV; Infrasound arrays on Etna ETN and Monte Vettore MVT) as well as the extension of the tephra-fallout deposit associated with the 10 April 2011 event (black area; 1 g/m2 isomass line), and both the X-band (red area) and the satellite-derived plume/cloud margins (blue area). Note that V2B and the thermal camera have the same location. Inset: location of the remote sensors closed to the vent. (b) Observation from Catania visible camera (ECV) of the 10 April 2011 fountain-fed tephra plume.
Remotesensing 13 02097 g001
Figure 2. Isomass map of the 10 April 2011 tephra-fallout deposit. Individual sample values of ground accumulation (g/m2) are shown in white. Isoline values are displayed in yellow.
Remotesensing 13 02097 g002
Figure 3. Plume height estimates on10 April 2011 (a) and 23 November 2013 (b) from X-band radar (MWR, black line), MODIS at 12:30 UTC (green cross), SEVIRI (blue line), and ECV (red line). Red dashed line corresponds to ECV measurements when the plume starts to leave the field of view. The start and end time of the paroxysmal activity is derived from VOLDORAD 2B signal and indicated by the black arrow. Error bars are also shown for all sensors.
Remotesensing 13 02097 g003
Figure 4. Mixture exit velocities determined by onfrasound (black and blue lines) and L-band Doppler radar VOLDORAD 2B (V2B, orange and red lines) during (a) the 10 April 2011 and (b) the 23 November 2013 paroxysms. In particular, the determination of the exit velocity with the infrasound is based on a vent diameter of 10 m (black line) and 13.5 m (green line) as well as 20 m (blue line).
Remotesensing 13 02097 g004
Figure 5. Variation of mass/area as a function of the square root of associated contour areas from Figure 2 for the 10 April 2011 tephra deposit (a) and for the 23 November 2013 tephra deposit (data from Andronico et al. [27]) (b). Purple dashed line, red line and blue line represent the best Weibull fit, exponential fits, and power-law fit. The power-law fit equations are y = 1.11 x−1.55 in (a) and y = 408.14 x−2.49 in (b).
Remotesensing 13 02097 g005
Figure 6. MER time series of 10 April 2011 (left panels) and 23 November 2013 (right panels) paroxysms. (a–d): SFA (blue), NSA (purple), and proxy method (red line) using V2B signal; MER values are averaged over 10 min. (b–e): SFA (blue), NSA (purple), MCA (red) and TPA (black) methods using the MWR signal. (c–f): SFA MERs based on ground-based thermal data (orange) and infrasound data (red). MER of the plume for ash and ice contents are respectively shown in black and light blue lines for SEVIRI and dashed lines for MODIS. MERs based on satellite heights (TPA) are displayed in green. Vertical dashed lines indicate the end of the lava fountain activity as derived from V2B. The deposit-derived MERdep is indicated by the horizontal pink arrow (see Table 1 and Table 2 for more details).
Remotesensing 13 02097 g006
Figure 7. Time-integrated erupted mass detected by all remote sensors for the 10 April 2011 (a) and 23 November 2013 (b) paroxysms. The vertical black dashed line indicates the end of the lava fountain activity as derived from V2B. Note that each final value of time-integrated mass corresponds to each sensor TEM.
Remotesensing 13 02097 g007
Figure 8. (a) Whole deposit grain-size distribution (WDGSD) of the 10 April 2011 paroxysm. (b) VPR-derived GSDsat from SEVIRI (blue) and MODIS (orange) data. (c) Cumulative total grain-size distribution (TGSD) of the 10 April 2011 paroxysm; grey and red lines correspond to WDGSD-SEVIRI TGSDs obtained by considering a mass ratio of 4.2% and 8.1% between satellite and deposit TEMs, respectively (see main text for details). The purple line corresponds to the near real-time MWR-SEVIRI TGSD (see main text for details). The purple and red shaded areas correspond to the size detection limit of the MWR and SEVIRI, respectively. (df) Same results obtained for the 23 November 2013 paroxysm. The WDGSD in (d) is from Poret et al. [31].
Remotesensing 13 02097 g008
Table 1. 10 April 2011 paroxysm eruptive source parameters (ESPs) retrieved for all methodologies (in case of multiple strategies associated with individual sensors, mean values are indicated in bold). * duration from Calvari et al. [4]. ** Total erupted mass (TEM) derived with the power law strategy (averaged for distal integration limits of 100 and 400 km from vent). *** Mean duration from all microwave weather radar (MWR) and satellite approaches.
Mean Exit Velocity (m/s)Max HT (km a.s.l.)MethodDuration (min)TEM (kg)Averaged MER (kg/s)
ECV/>9ECV///
V2B43.7 ± 26.7/SFA2505.8 × 1092.8 ± 1.6 × 10⁵
NSA2502.2 × 1091.4 ± 1.2 × 10⁵
Proxy2504.0 × 1082.7 ± 3.5 × 10⁴
MEAN2502.8 ± 2.8 × 1091.5 ± 1.3 × 10⁵
MWR/8.9SFA2101.2 × 1099.3 ± 0.4 × 10⁴
NSA1902.6 × 1092.3 ± 1.7 × 10⁵
TPA4204.7 × 1091.9 ± 2.3 × 10⁵
MCA4106.4 × 1082.6 ± 2.4 × 10⁴
MEAN308 ± 1242.3 ± 1.8 × 1091.4 ± 0.9 × 10⁵
Infrasound42.6 ± 18.8/SFA2732.9 × 1092.0 ± 0.9 × 10⁵
Ground-IR//SFA240 *1.2 × 1098.6 ± 2.5 × 10⁴
SEVIRI/6.1TPA3156.0 × 1082.7 ± 2.5 × 10⁴
VPR-ASH2552.0 × 1061.2 ± 0.9 × 10²
VPR-ICE3704.9 × 1072.1 ± 1.3 × 10³
MODIS/7.9ASH1602.3 × 1062.6 ± 3.1 × 10²
ICE1701.4 × 1071.7 ± 1.7 × 10³
Deposit//Power-law **310 ± 94 ***4.7 ± 2.3 × 1072.5 ± 2.0 × 10³
Weibull 1.3 × 1070.7 × 103
Exponential 1.4 × 1070.8 × 103
MEAN 2.5 ± 1.9 × 1071.4 ± 1.1 × 10³
Table 2. 23 November 2013 paroxysm ESPs retrieved for all methodologies. * TEM derived with the power law strategy (averaged for distal integration limits of 100 and 400 km from vent). ** TEM derived by Andronico et al. [27]. *** Mean duration from all the MWR and satellite approaches.
Mean Exit Velocity (m/s)Max HT (km a.s.l.)MethodSignal Duration (min)TEM (kg)Averaged MER (kg/s)
ECV/>9////
V2B53.8 ± 63.7
(07:00–10:30)
101.1 ± 63.1
(09:00–10:30)
/SFA1934.2 × 1093.4 ± 3.8 × 10⁵
NSA1932.7 × 1092.3 ± 3.5 × 10⁵
Proxy1934.3 × 1093.6 ± 8.3 × 10⁵
MEAN1933.7 ± 0.9 × 1093.1 ± 0.7 × 10⁵
MWR/11.7SFA403.5 × 1091.5 ± 0.4 × 10⁶
NSA304.3 × 1092.6 ± 2.2 × 10⁶
TPA806.4 × 1091.3 ± 1.5 × 10⁶
MCA705.5 × 1091.3 ± 1.5 × 10⁶
MEAN55 ± 244.9 ± 1.3 × 1091.7 ± 0.6 × 10⁶
Infrasound129.2 ± 62.7
(09:00–10:30)
/SFA853.7 × 1097.4 ± 3.7 × 10⁵
Ground-IR//SFA1305.8 × 1097.5 ± 4.7 × 10⁵
SEVIRI/12.0TPA403.6 × 1091.4 ± 1.8 × 10⁶
VPR-ASH1201.3 × 1071.6 ± 1.8 × 10³
VPR-ICE1051.0 × 1071.4 ± 1.3 × 10³
Deposit//Power–Law *69 ± 35 ***1.4 ± 0.0 × 1093.4 ± 1.7 × 10⁵
Weibull **1.3 × 1093.1 × 105
Exponential1.2 × 1092.9 × 105
MEAN1.3 ± 0.1 × 1093.1 ± 0.3 × 10⁵
Table 3. Summary of all ESPs that can be obtained at Etna. Blue cells: direct measurements; Green cells: derived measurements; Orange cells: measurements needing additional models; Grey cells: parameter not provided. See main text for the description of Phase I, II, and III. * with the methods of Carey and Spark [86], Rossi et al. [87], and Bonadonna and Costa [42].
Sensor/MethodTime Resolution (s)Event DurationPlume Height HTTotal Erupted Mass TEMMass Eruption Rate MERTotal Grain-Size Distribution
L-band Doppler radar V2B0.2Phase I + IICalibration based on HT vs MER lawsBased on MER and durationSFA, NSA, PROXYBased on VARR model
Single value of Dn;
Detection of small lapilli to bomb/blocks (Lava fountain; Phase I and II)
X-band Doppler radar MWR600 Phase II + IIIHT ~12 km (a.s.l.) for plumes dispersed southeastwardlyBased on MER and durationSFA, NSA, MCA, TPAGSDMWR based on VARR model; Detection of fine ash to lapilli (Phase II and III).
Ground-based infrared60 Phase I + II
(no meteorological clouds)
Based on MER and durationSFA
Satellite-based infrared/visible (SEVIRI, MODIS)900Phase II + III
(no meteorological clouds)
Based on atmospheric temperature profileBased on MER and durationBased on Particle Re and AOD, TPAGSDsat
Resolved for particles ≤20 µm (i.e., 5.5 Φ) (Phase II and III)
Infrasound60 Phase I + IIBased on HT vs MER lawsBased on MER and durationSFA
Visible camera30–60 Phase II + III
(no meteorological clouds)
ECV: HT <9 km (a.s.l.)
EBHD: HT <15 km (a.s.l.)
(requires day light and no cloudy conditions)
Based on MER and durationBased on HT vs MER laws
Tephra-fallout depositafter the end of the eruptionBased on MdΦ and/or largest clasts data * Integration of best fit of mass/area vs. sqrt(area) trends (Exponential, Power-Law, Weibull)Based on TEM and duration (Phase II + III especially if sampled >0.5 km from the vent)WDGSD
Potentially whole size range from very fine ash to block and bombs; limited to coastline (typically <30 km from vent depending on plume dispersal)
Publisher’s Note: MDPI stays neutral with regard to jurisdictional claims in published maps and institutional affiliations.

