Article

UAV Remote Sensing Estimation of Rice Yield Based on Adaptive Spectral Endmembers and Bilinear Mixing Model

1
School of Remote Sensing and Information Engineering, Wuhan University, Wuhan 430079, China
2
Lab of Remote Sensing for Precision Phenomics of Hybrid Rice, Wuhan University, Wuhan 430079, China
3
Hubei Institute of Photogrammetry and Remote Sensing, Wuhan 430074, China
4
College of Life Sciences, Wuhan University, Wuhan 430079, China
*
Author to whom correspondence should be addressed.
Remote Sens. 2021, 13(11), 2190; https://0-doi-org.brum.beds.ac.uk/10.3390/rs13112190
Submission received: 21 April 2021 / Revised: 26 May 2021 / Accepted: 31 May 2021 / Published: 4 June 2021
(This article belongs to the Special Issue Advances in Remote Sensing for Crop Monitoring and Yield Estimation)

Abstract

:
The accurate estimation of rice yield using remote sensing (RS) technology is crucially important for agricultural decision-making. The rice yield estimation model based on the vegetation index (VI) is commonly used when working with RS methods, however, it is affected by irrelevant organs and background especially at heading stage. The spectral mixture analysis (SMA) can quantitatively obtain the abundance information and mitigate the impacts. Furthermore, according to the spectral variability and information complexity caused by the rice cropping system and canopy characteristics of reflection and scattering, in this study, the multi-endmember extraction by the pure pixel index (PPI) and the nonlinear unmixing method based on the bandwise generalized bilinear mixing model (NU-BGBM) were applied for SMA, and the VIE (VIs recalculated from endmember spectra) was integrated with abundance data to establish the yield estimation model at heading stage. In two paddy fields of different cultivation settings, multispectral images were collected by an unmanned aerial vehicle (UAV) at booting and heading stage. The correlation of several widely-used VIs and rice yield was tested and weaker at heading stage. In order to improve the yield estimation accuracy of rice at heading stage, the VIE and foreground abundances from SMA were combined to develop a linear yield estimation model. The results showed that VIE incorporated with abundances exhibited a better estimation ability than VI alone or the product of VI and abundances. In addition, when the structural difference of plants was obvious, the addition of the product of VIF (VIs recalculated from bilinear endmember spectra) and the corresponding bilinear abundances to the original product of VIE and abundances, enhanced model reliability. VIs using the near-infrared bands improved more significantly with the estimation error below 8.1%. This study verified the validation of the targeted SMA strategy while estimating crop yield by remotely sensed VI, especially for objects with obvious different spectra and complex structures.

1. Introduction

Rice (Oryza sativa L.) is one of the largest staple food crops in the world, and it feeds approximately half of the global population [1,2]. Accurate yield estimation can give references to the adjustment of the pattern of farming of the rice producing areas. Resorting to the remote sensing (RS) technique, such as unmanned aerial vehicle (UAV) images, the acquisition of yield in advance, non-destructively and cost-efficiently, benefits for coping with fluctuations of the grain trade market and ensuring state food security [3,4,5].
Vegetation indices (VIs), calculated from the remote sensing spectrum with mathematical methods, can reflect the vegetation growth situation as simple and empirical metrics [6,7]. Additionally, the changes of crops captured by spectral measures, directly determine their ultimate yield. Therefore, VIs have also exhibited good potential in remote estimation of crop yield especially at large scales [8,9]. Parametric regression models based on VIs are by far the oldest and largest group of variable estimation approaches [10], including simple linear functions and complex non-linear functions in general [11]. Linear regression between VIs and yield has been proposed to accurately estimate the yield of many cash crops, such as wheat [12], cotton [13], maize [14], rapeseed [15] etc. Among them, taking rice as the research objective, a series of studies have been developed to relate the rice spectra to its final yield. Swain [16] developed a linear regression model of normalized difference vegetation index (NDVI) of UAV images and rice yield with a 0.728 coefficient of determination (R2) and a 0.458 ton/ha root mean square error (RMSE) at panicle initiation stage. Siyal et al. [17] observed that there was a positive and strong relationship with a R2 of 0.940 between rice crop yield (2006 to 2013) and NDVI calculated from Landsat imagery at the peak of the growing season. Zhou et al. [18] found that the optimal vegetation index NDVI based on multispectral images showed a linear relationship with the grain yield and gained a higher R2 value (0.750). Indeed, developing a linear function based on VIs is a common and widely used approach to estimate rice yield.
However, the utilization of VIs, derived from individual pixels, is affected by background clutter and irrelevant organs to photosynthesis and production [15,19]. There may be a considerable discrepancy between pixel sizes of remote sensing images and much smaller sizes of crop plants, and pixels of interest are frequently a combination of numerous disparate ground objects [20]. In plant production systems, sensors can capture the entire canopy, grasses and soil, and VIs, calculated from the spectra of such mixed pixels, may encompass some unexpected information of the components not relevant to yield [21,22]. This negative influence is more remarkable for rice at heading stage. Paddy rice is the only crop that needs abundant water in the planting environment [23], and water body, as an extra ground object, still exists at heading stage and constitutes the background together with soil. Moreover, panicles of rice plants gradually distribute in the closed rice canopy at this stage. A range of previous studies have found that the uneven emergence of panicle is associated with poor estimation ability at heading stage [18,24,25]. As noted that spectral mixture analysis (SMA) can effectively provide complementary information up to the subpixel level and mitigate the impact of other ground objects, the need to quantitatively decompose or unmix, has been gradually recognized while establishing a VI-based rice yield estimation model [22,26].
Specifically, the vegetal state of rice in field cannot be neglected from estimating the yield, but there are rarely SMA approaches fitting rice characteristics at heading stage. In the actual production, there is not a uniform rice variety or farming practice as usual. Multi-variety cultivars and different managements indicate the great diversity of growth rate, morphological structure, physicochemical parameter, phenology, etc. in the same period [23,27,28], especially at the late growth stage, as shown in Figure 1. Inevitably, this makes identified differences in the spectra of rice plants in remote sensing images over wide areas. Consequently, the spectral variability of the foreground is enhanced and obvious in remote sensing images of paddy fields. In addition, rice plants inherently have high spectral complexity, owing to the complicated processes of electromagnetic propagation and their parameterization, which will finally bias the application of RS [29]. When rice steps into the heading stage, crisscrossed leaves cover water and soil partially or completely, however, due to the high transmission of rice leaves, mainly in the near-infrared (NIR) range, multiple reflection and scattering of light rays occur in the scene. Ray and Murray [30] and Prasad et al. [31] have confirmed that even near 100% plant cover, the background influences the observed spectra due to NIR light penetrating the canopy and interacting with the background. The data of sensor incoming light interacting with all the objects within inescapably contain complex information. Therefore, the unique reflectance characteristics of rice plants in remote sensing images, induced by the cropping system and complex space structure, demand to be considered in the process of SMA.
In view of the above-mentioned problem of paddy rice, we successively considered the two important steps of SMA. In the first step, a mixed pixel was decomposed into a collection of constituent spectra or endmembers, and there was a need to find endmembers which could effectively cope with the spectral variability and represent rice components. Normally, endmember extraction algorithms (EEAs) are employed in this step, which are more adaptive and dynamic than field measurement. Representative EEAs include the pure pixel index (PPI) [32], N-finder algorithm (N-FINDR) [33], vertex component analysis (VCA) [34], etc. Endmember extraction plays an important role in the two-step strategy, but the spectral-based EEAs without considering spectral variability usually result in unmixing errors [35]. To minimize the effect of spectral variability of the same objects, the multiple-endmember extraction strategy has been adopted in several fields, for example, the discrimination of tree species [36] and mineral detection [37]. In the second step, an appropriate unmixing model, developed for multiple reflection and scattering in paddy fields, was demanded to derive a set of corresponding fractions or abundances, that indicate the proportion of each endmember present in the pixel. There are two typical unmixing models, one is the linear mixing model (LMM), and the other is the nonlinear mixing model (NLMM). The LMM is a simple and widely used model, which assumes that the light reaching the pixel interacts with just one material [38]. Based on the LMM, the bilinear mixing model (BMM), one of NLMMs, further considers second interactions between components and is more applicable to multiple-level and hybrid scenes such as vegetated terrain, with low model complexity and scene parameter dependence [21]. A range of novel BMMs have been proposed and applied in SMA, and experiments on synthetic datasets or real spectral images have been conducted to demonstrate the efficiency and advantages of BMMs in some scenes, including forest/grassland ecotone [39], mining site [40], city [41], etc. Current researches have proved the combination of abundance data and VIs can improve the estimation of crop yield, but for rice, there is still room for improving the application effect of SMA [15,22]. So in this study, we integrated a multi-endmember extraction strategy and a BMM to investigate a novel method of rice yield estimation, according to the properties of paddy rice.
The motivation of this research was to assess what a complementary role subpixel information played on the spectral characteristics VIs reflected in yield estimation, according to the characteristics of rice at heading stage. After obtaining multi-band images by an UAV system at heading stage, this study explored to improve a VI-based approach for rice yield estimation by combining with adaptive endmember and abundance information acquired from the multi-endmember extraction strategy and a BMM. The feasibility of the approach was verified in two paddy fields of various settings, which represented the most probable situations of foreground variability in practice.

2. Materials and Methods
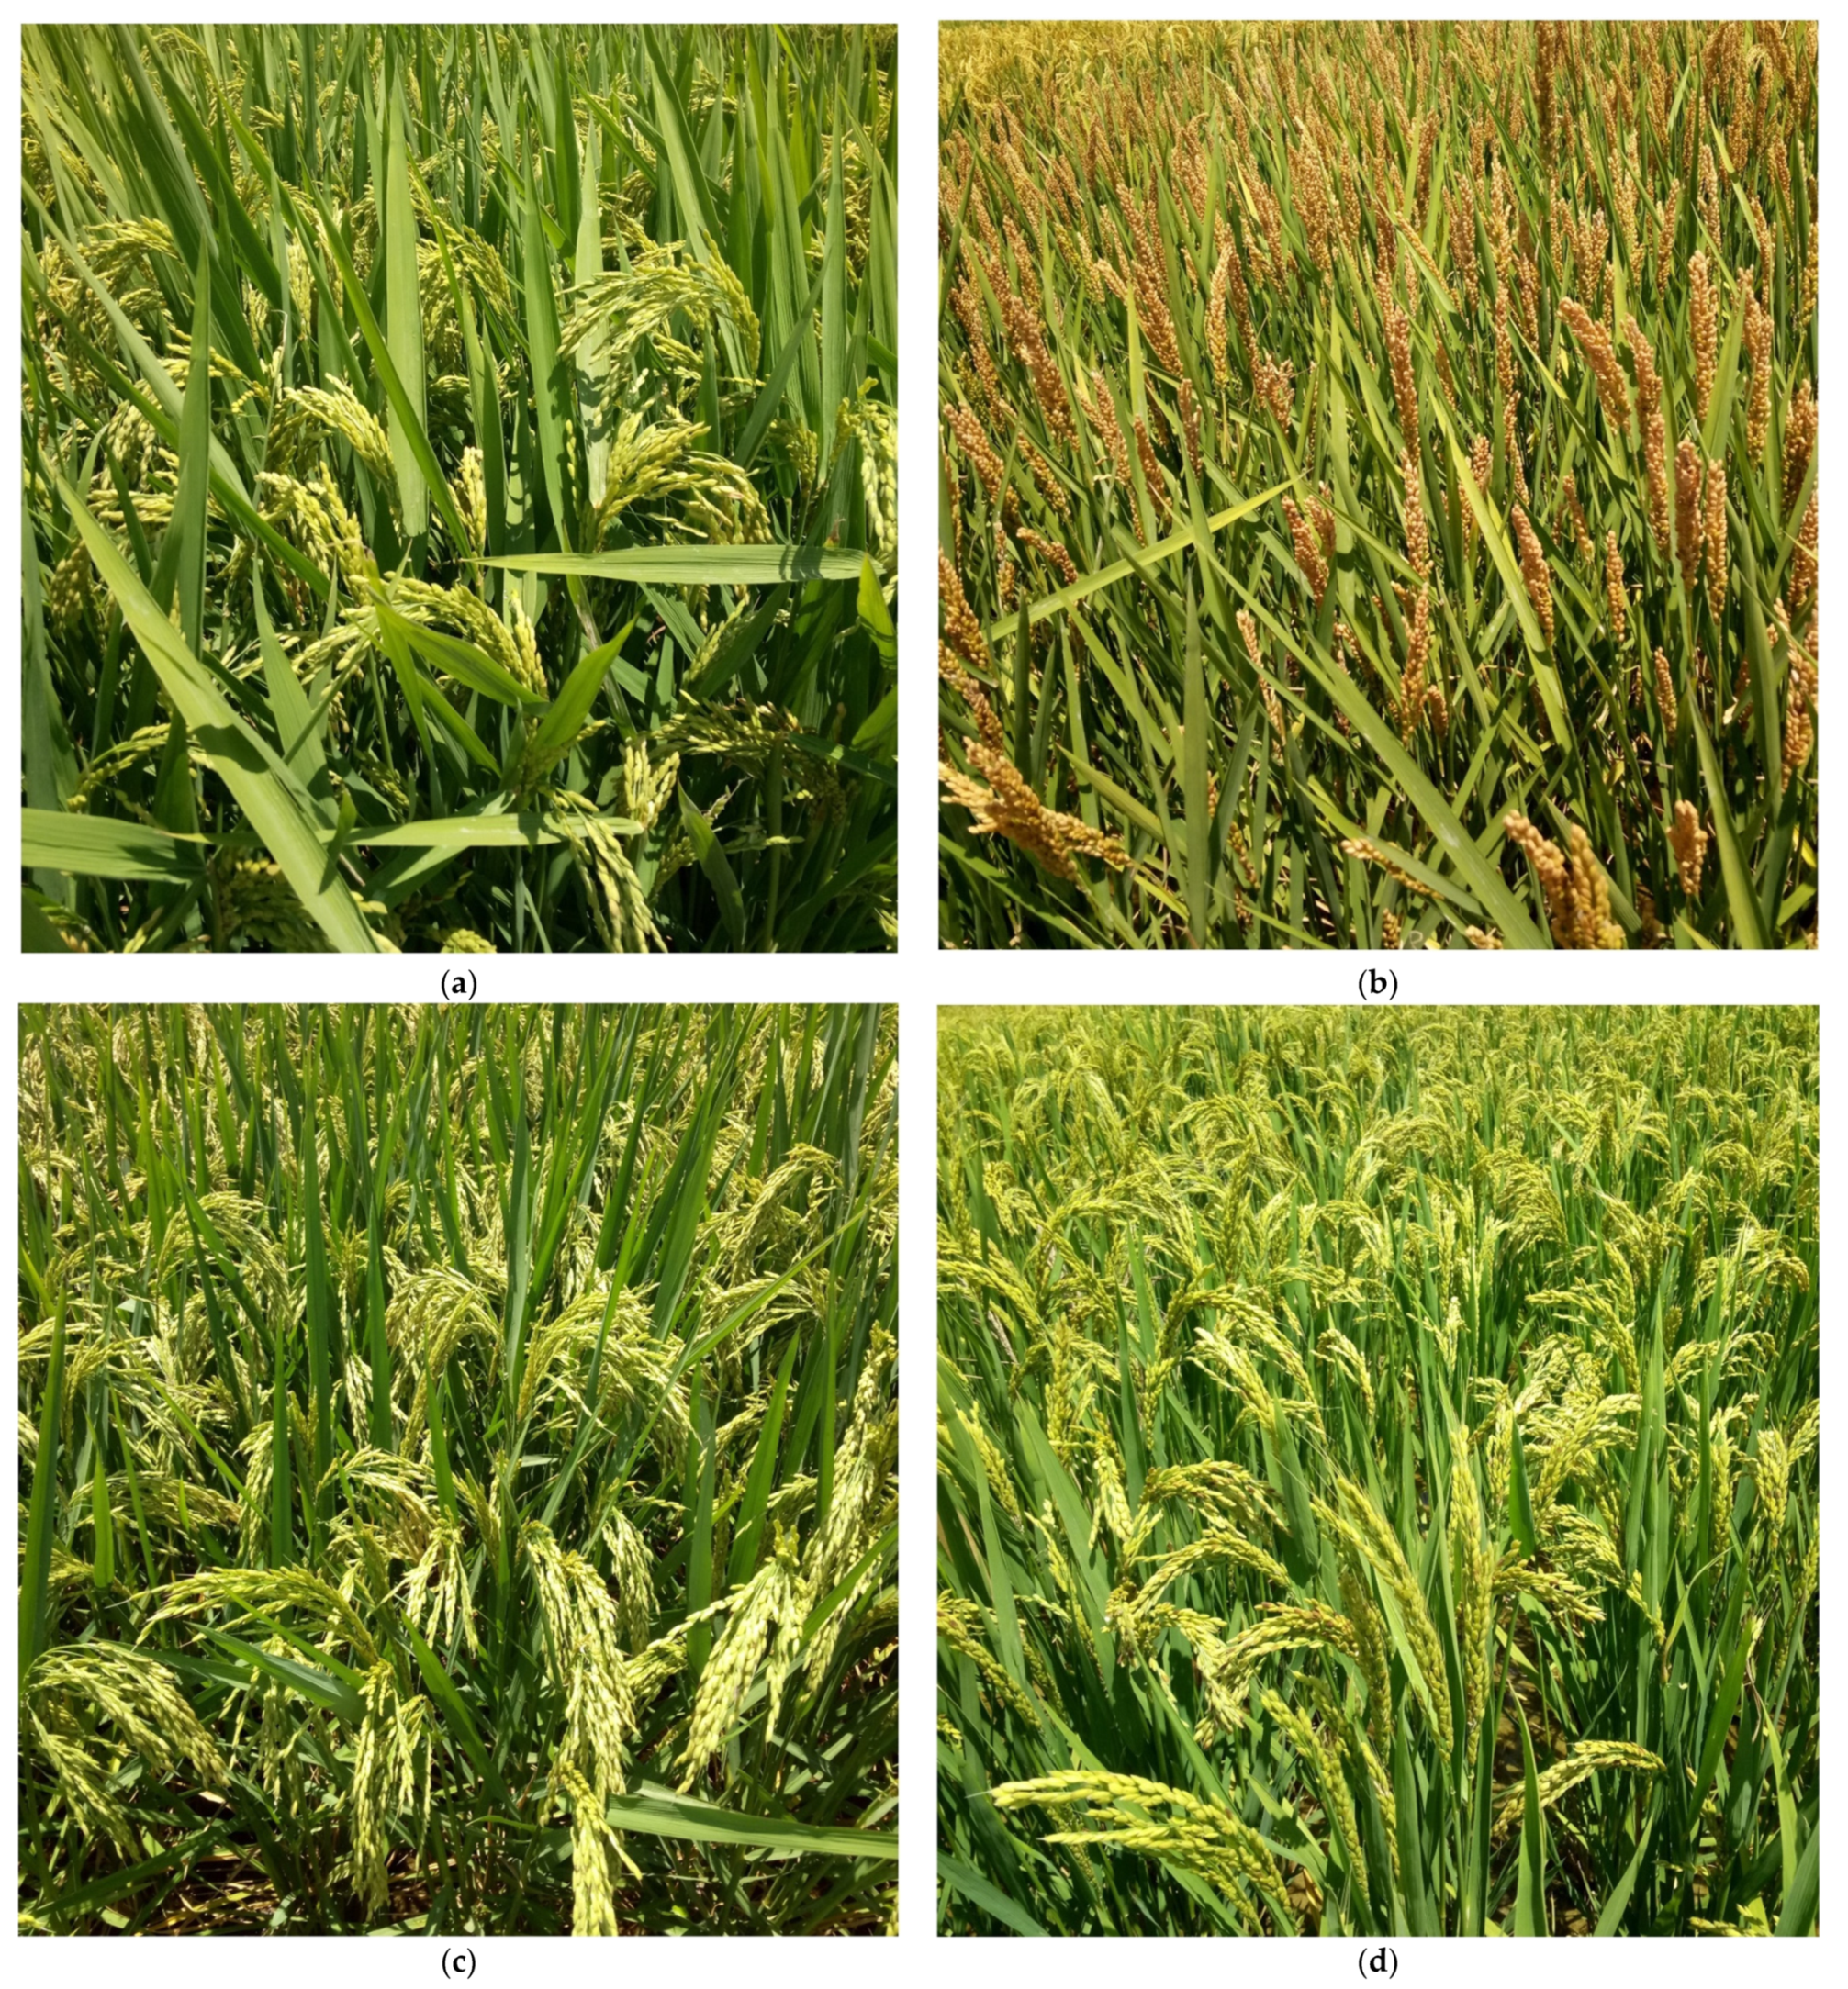
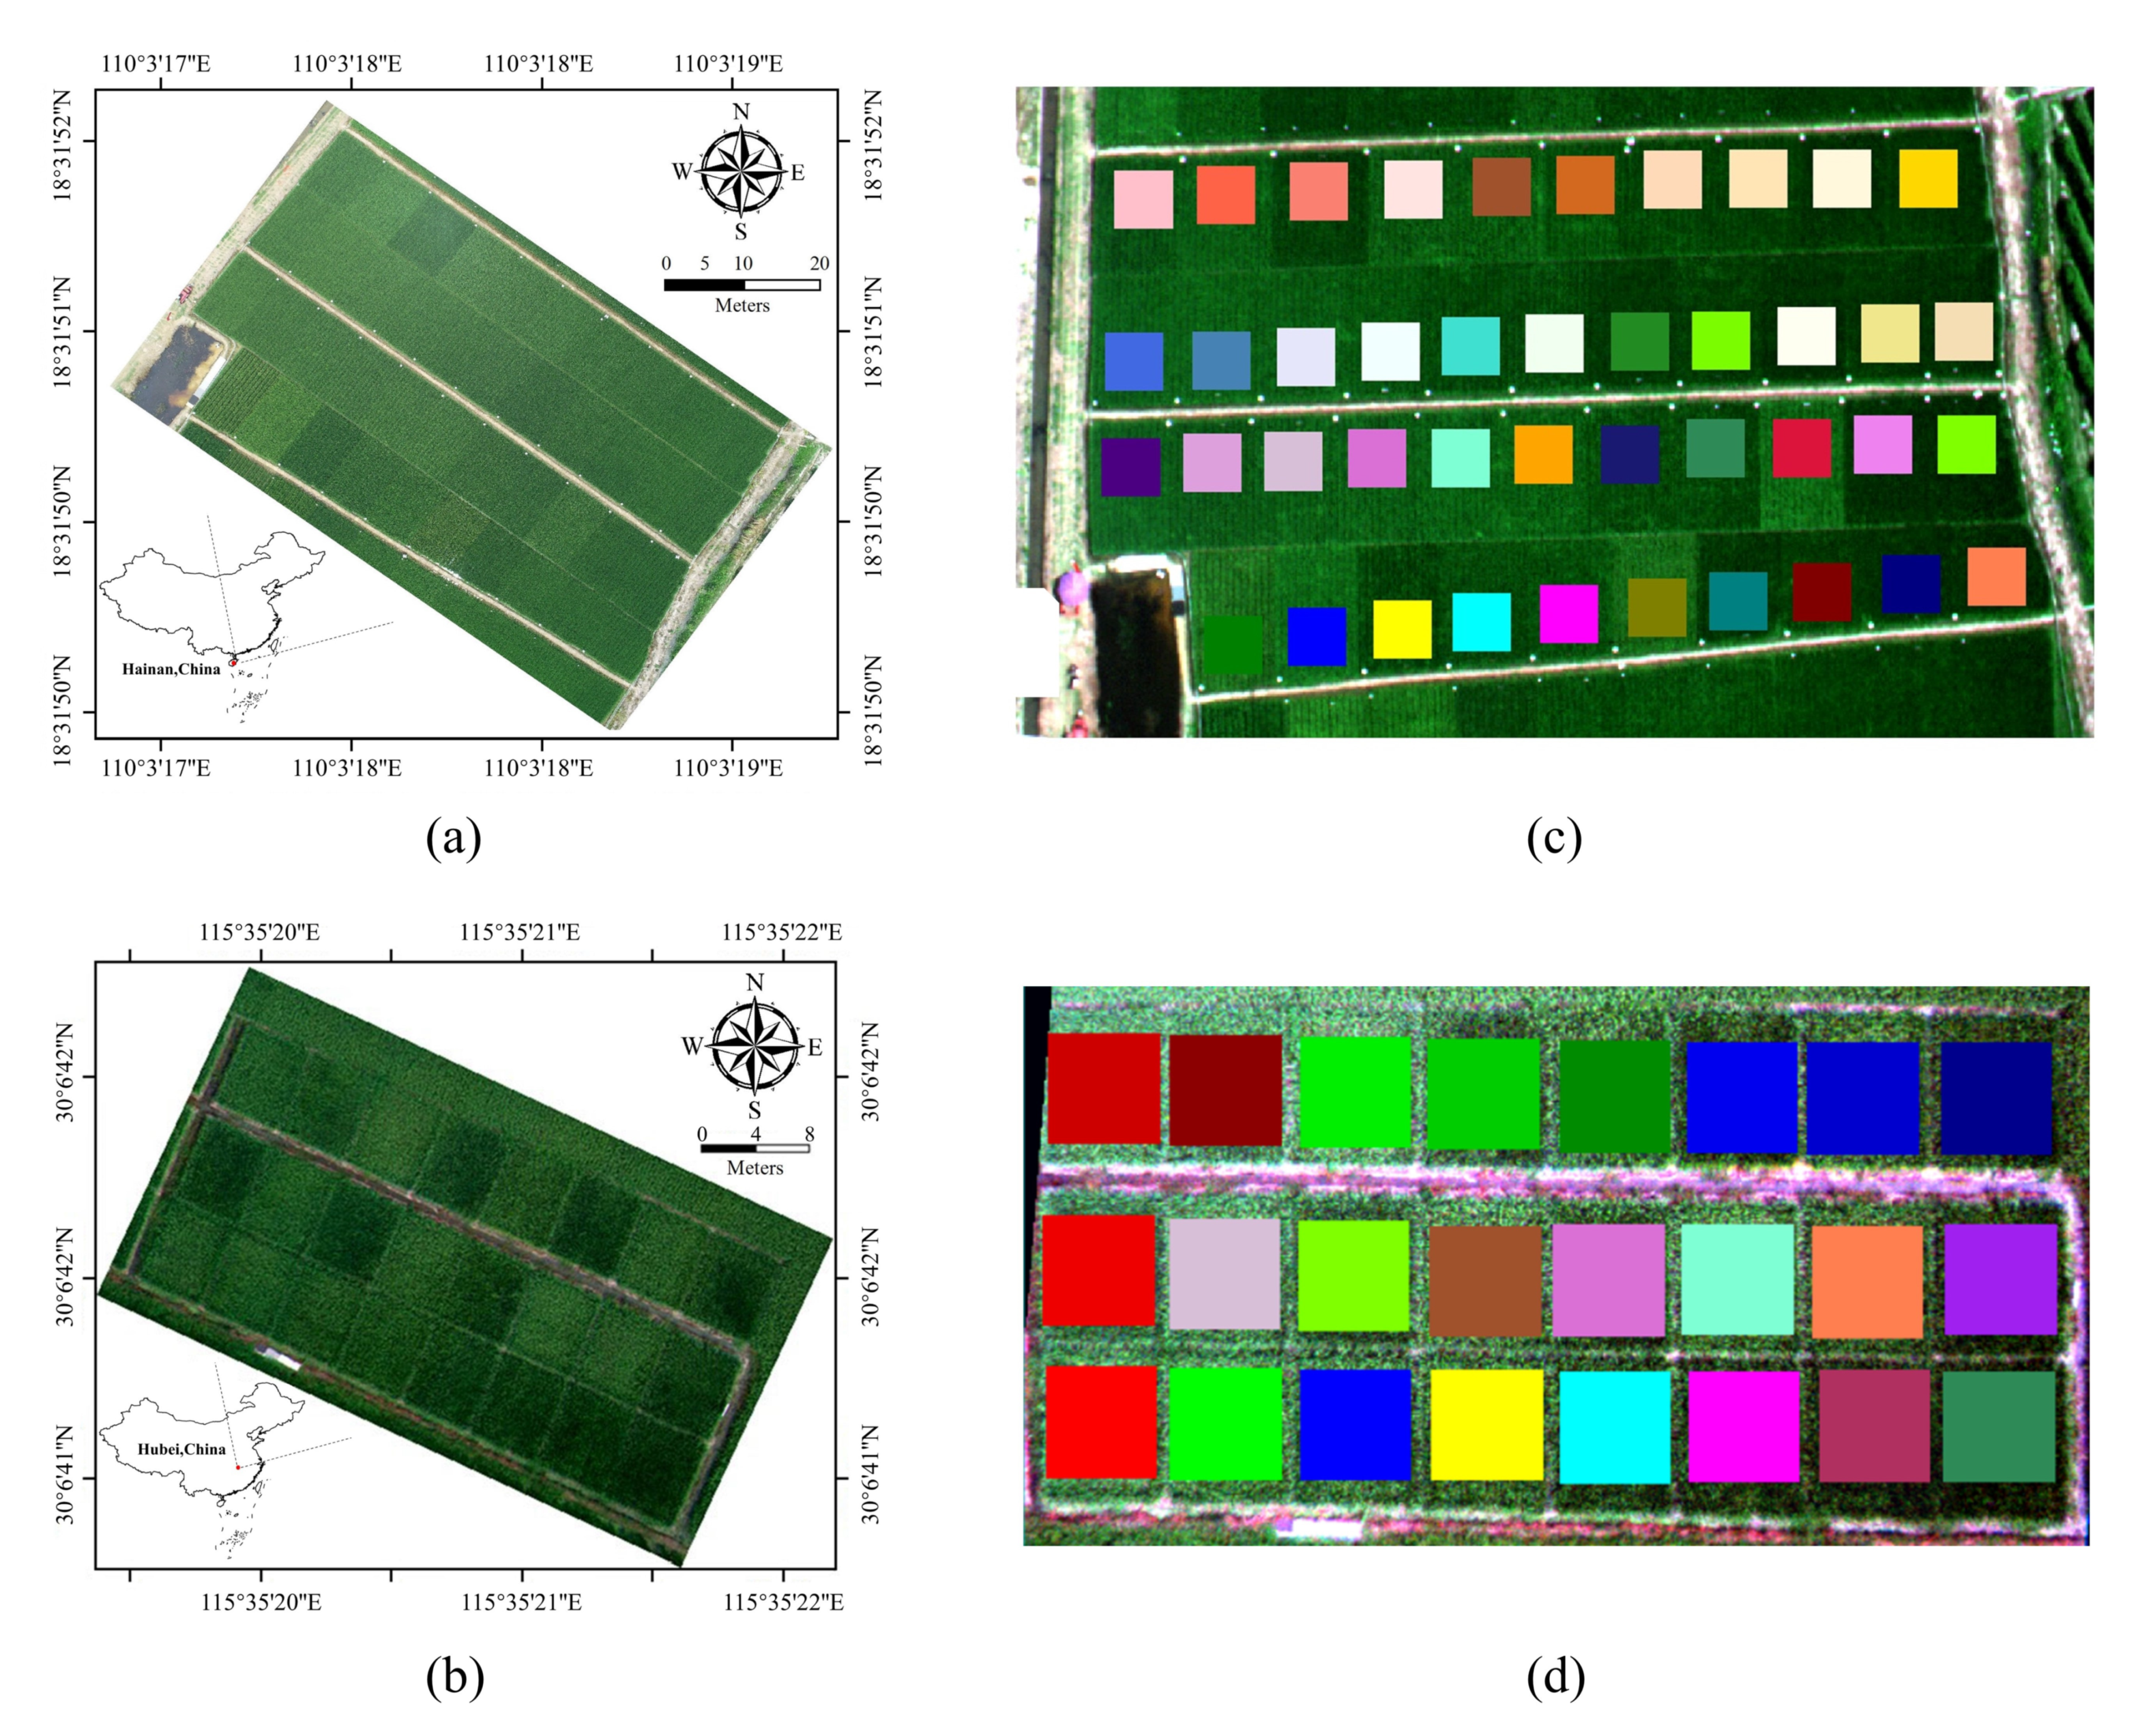
2.1. Study Area

The first study area was located in the Multi-Variety Hybrid Rice Experiment and Research Base of Wuhan University, in the southeast of Lingshui City, Hainan Province, China (18°31′47.1″N, 110°3′34.9″E), as shown in Figure 2a. Forty two varieties of hybrid rice were planted in the 42 plots and the size of each plot was about 70 m2. The varieties were typical cultivars in southern China, such as Luoyou-8, Hongyou-3348, Zhenyou-6, etc. In order to ensure that cultivars were the only variable in this study area, the field management for these plots was similar, including fertilizer supply (12 kg/ha) and planting density (around 20 plants/m2). In our study, the seedlings were transplanted on 5 January 2018, and UAV flights were conducted at booting stage (18 March 2018) and heading stage (1 April 2018) of rice growth. Each UAV flight was arranged to obtain the images of all rice plots between 10:00 and 14:00.
The second study area was located in the Rice Experiment and Research Base of Huazhong Agricultural University, Wuxue City, Hubei Province, China (30°6′42″N, 115°35′21″E), as shown in Figure 2c. At this paddy field, a single variety hybrid rice, Shenliangyou-584, was cultivated in 24 plots and the size of each plot was about 20 m2. The field management for these plots were similar except for the fertilizer supply. Eight levels of nitrogen fertilizer (0, 3, 5.5, 8.5, 11, 14, 16.5, and 19.5 kg/ha) were utilized, and the planting density was about 15 plants/m2. At booting stage (13 August 2015) and heading stage (29 August 2015), UAV flights were conducted to collect panoramic images of the study area between 10:00 and 14:00.

2.2. Yield Data Collection

At maturity, all the rice plants in each plot were harvested and determined the grain yield manually. After a series of treatments, including cleaning and drying, the seeds were dry enough whose weight did not change. Then, all the concerning data were measured to calculate the observed yield y:
y = 10 , 000 × ( 1 - I ) × W × D 15 × N
where I denotes the impurity content, W and D represent the total weight and plant density in kg, respectively, and N is the number of hills of weighted rice.

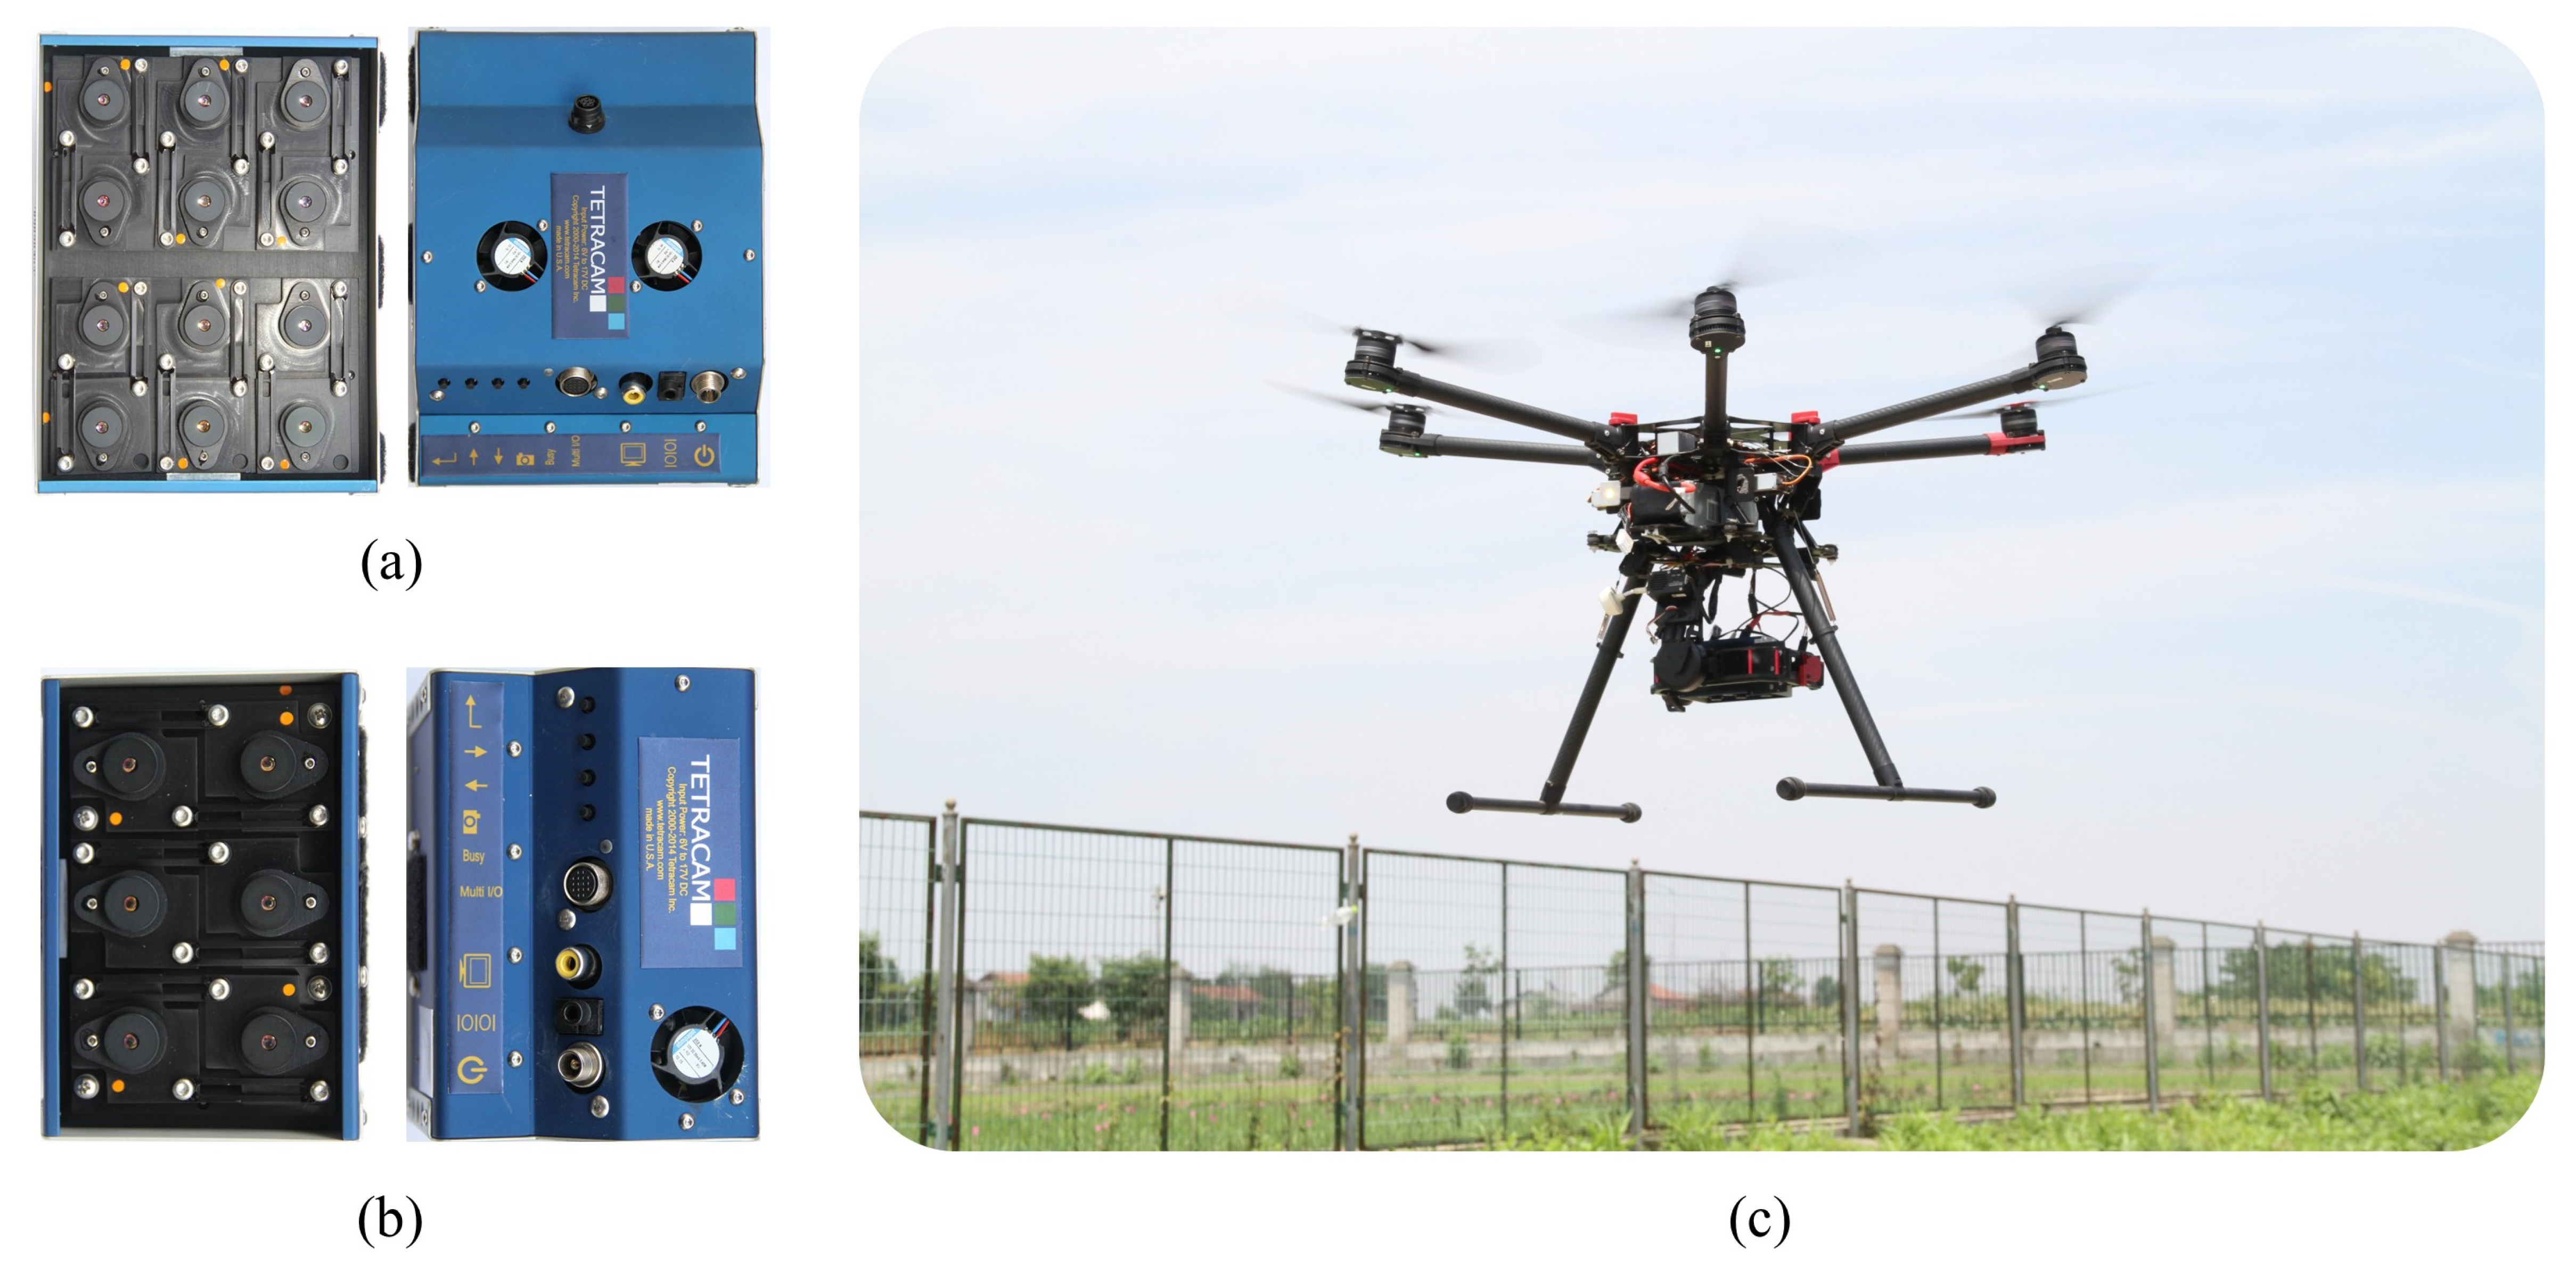
2.3. Surface Reflectance and Vegetation Index Derived from UAV Data

The multispectral images of the study area in Study Area 1 (Lingshui) were acquired with a Mini-MCA system (Mini-MCA 12, Tetracam, Inc., Chatsworth, CA, USA) on 18 March and 1 April 2018, which was displayed in Figure 3a. The light multispectral camera Mini-MCA consists of an array of twelve independent miniature image sensors. Each camera imager was equipped with a user-configurable bandpass filter centered at a wavelength of 490, 520, 550, 570, 670, 680, 700, 720, 800, 850, 900 or 950 nm, respectively, with a 10 nm bandwidth for the first 10 bands, 20 nm bandwidth for the 900 nm band and 40 nm bandwidth for the 950 nm band. Additionally, the multispectral images of Study Area 2 (Wuxue) were acquired with a Mini-MCA system (Mini-MCA 6, Tetracam, Inc., Chatsworth, CA, USA) on 13 and 19 August 2015, as shown in Figure 3b. The light multispectral camera Mini-MCA consists of an array of six independent miniature image sensors. The bandpass filter was centered at a wavelength of 490, 550, 670, 720, 800 or 900 nm, respectively, and the bandwidth was 10 nm. The images of different bands were co-registered to ensure the objects in the images of twelve or six channels were in a unified coordinate system and corresponded to the same pixel using the PixelWrench2 software (Tetracam Inc., Chatsworth, CA, USA).
The Mini-MCA was mounted on a UAV (S1000, SZ DJI Technology, Co., Ltd., Shenzhen, China) which flew between 10:00 and 14:00 when the changes in the solar zenith angle were minimal (Figure 3c). The flight was conducted at 200 m above the ground to capture images with a spatial resolution of 108.33 mm in Study Area 1 (Lingshui), while in Study Area 2 (Wuxue), the pixel size was around 30 mm for images taken at 60 m approximately. Images were taken under stable weather conditions during cloud-free periods.
Radiometric calibration was performed using multiple calibration panels with the relatively constant reflectance in visible to NIR wavelength range, which was 0.03, 0.12, 0.24, 0.36, 0.56 or 0.80, respectively in Study Area 1 (Lingshui) and 0.06, 0.24, 0.48 or 1 in Study Area 2 (Wuxue). The ground targets as a reference for calibration were set near the rice plots prior to the flight for simultaneous imaging with objects. By referring to the panels, an empirical linear correction method was applied to transform image digital numbers (DNs) into surface reflectance (ρ). The object reflectance can be calculated as:
ρ λ = Gain λ × DN λ + Offset λ
where ρλ and DNλ denote the surface reflectance and digital number, respectively, at wavelength λ; Gainλ and Offsetλ represent gain and bias coefficients of the camera at wavelength λ, respectively. Referring to the DNs in the UAV imagery and actual reflectance of calibration panels, Gainλ and Offsetλ can be calculated applying the least-square method and used in radiometric calibration at wavelength λ.
For each rice plot, we respectively defined a maximum rectangle same in shape and size as the region of interest (ROI) in the UAV image, as shown in Figure 2b,d. Each ROI included the same number of pixels, and the plot-level VI was retrieved by averaging all the per-pixel reflectance values within the rectangle. A total of 12 vegetation indices were selected from the literature as being the most used to characterize the vegetation status, as displayed in Table 1.

2.4. The Pure Pixel Index Endmember Extraction Method

In paddy fields, leaves, stems, and panicles constitute the canopy of rice as the foreground of the scene, and the background is mainly comprised of soil and water. Due to differences in the physicochemical property and spatial complexity, the pure components of the foreground and background show up as spectral variability and information complexity, even for the same object. In addition, multiple scattering inevitably occurs in rice fields. The propagation of light in paddy fields was briefly illustrated in Figure 4.
In this study, the PPI method was employed to implement the semi-automatic extraction of endmembers in ENVI 5.3 (Exelis Visual Information Solutions Inc., Boulder, CO, USA). It assumed that all mixed pixels were located inside a simplex while the endmembers were located at the vertex of the simplex [53]. With the intention of easing computational complexity, masking (Figure 5a) and dimension reduction were carried out successively. All the pixels in the data space were projected onto randomly generated unit vectors, and the endmembers were likely to be projected on both ends of the unit vectors. The number of times a data value resulted as an extremum point when projected onto both ends of the vector was recorded as the purity index. The higher the purity index of a pixel was, the greater probability the pixel had to be an endmember. The high PPI count pixels within the threshold were screened (Figure 5b) and enumerated in n-Dimensional Visualizer (Figure 5c). According to the clusters, the sample areas were delineated manually and the average spectrum of the pixels in a sample area was the spectrum of an endmember (Figure 5d).

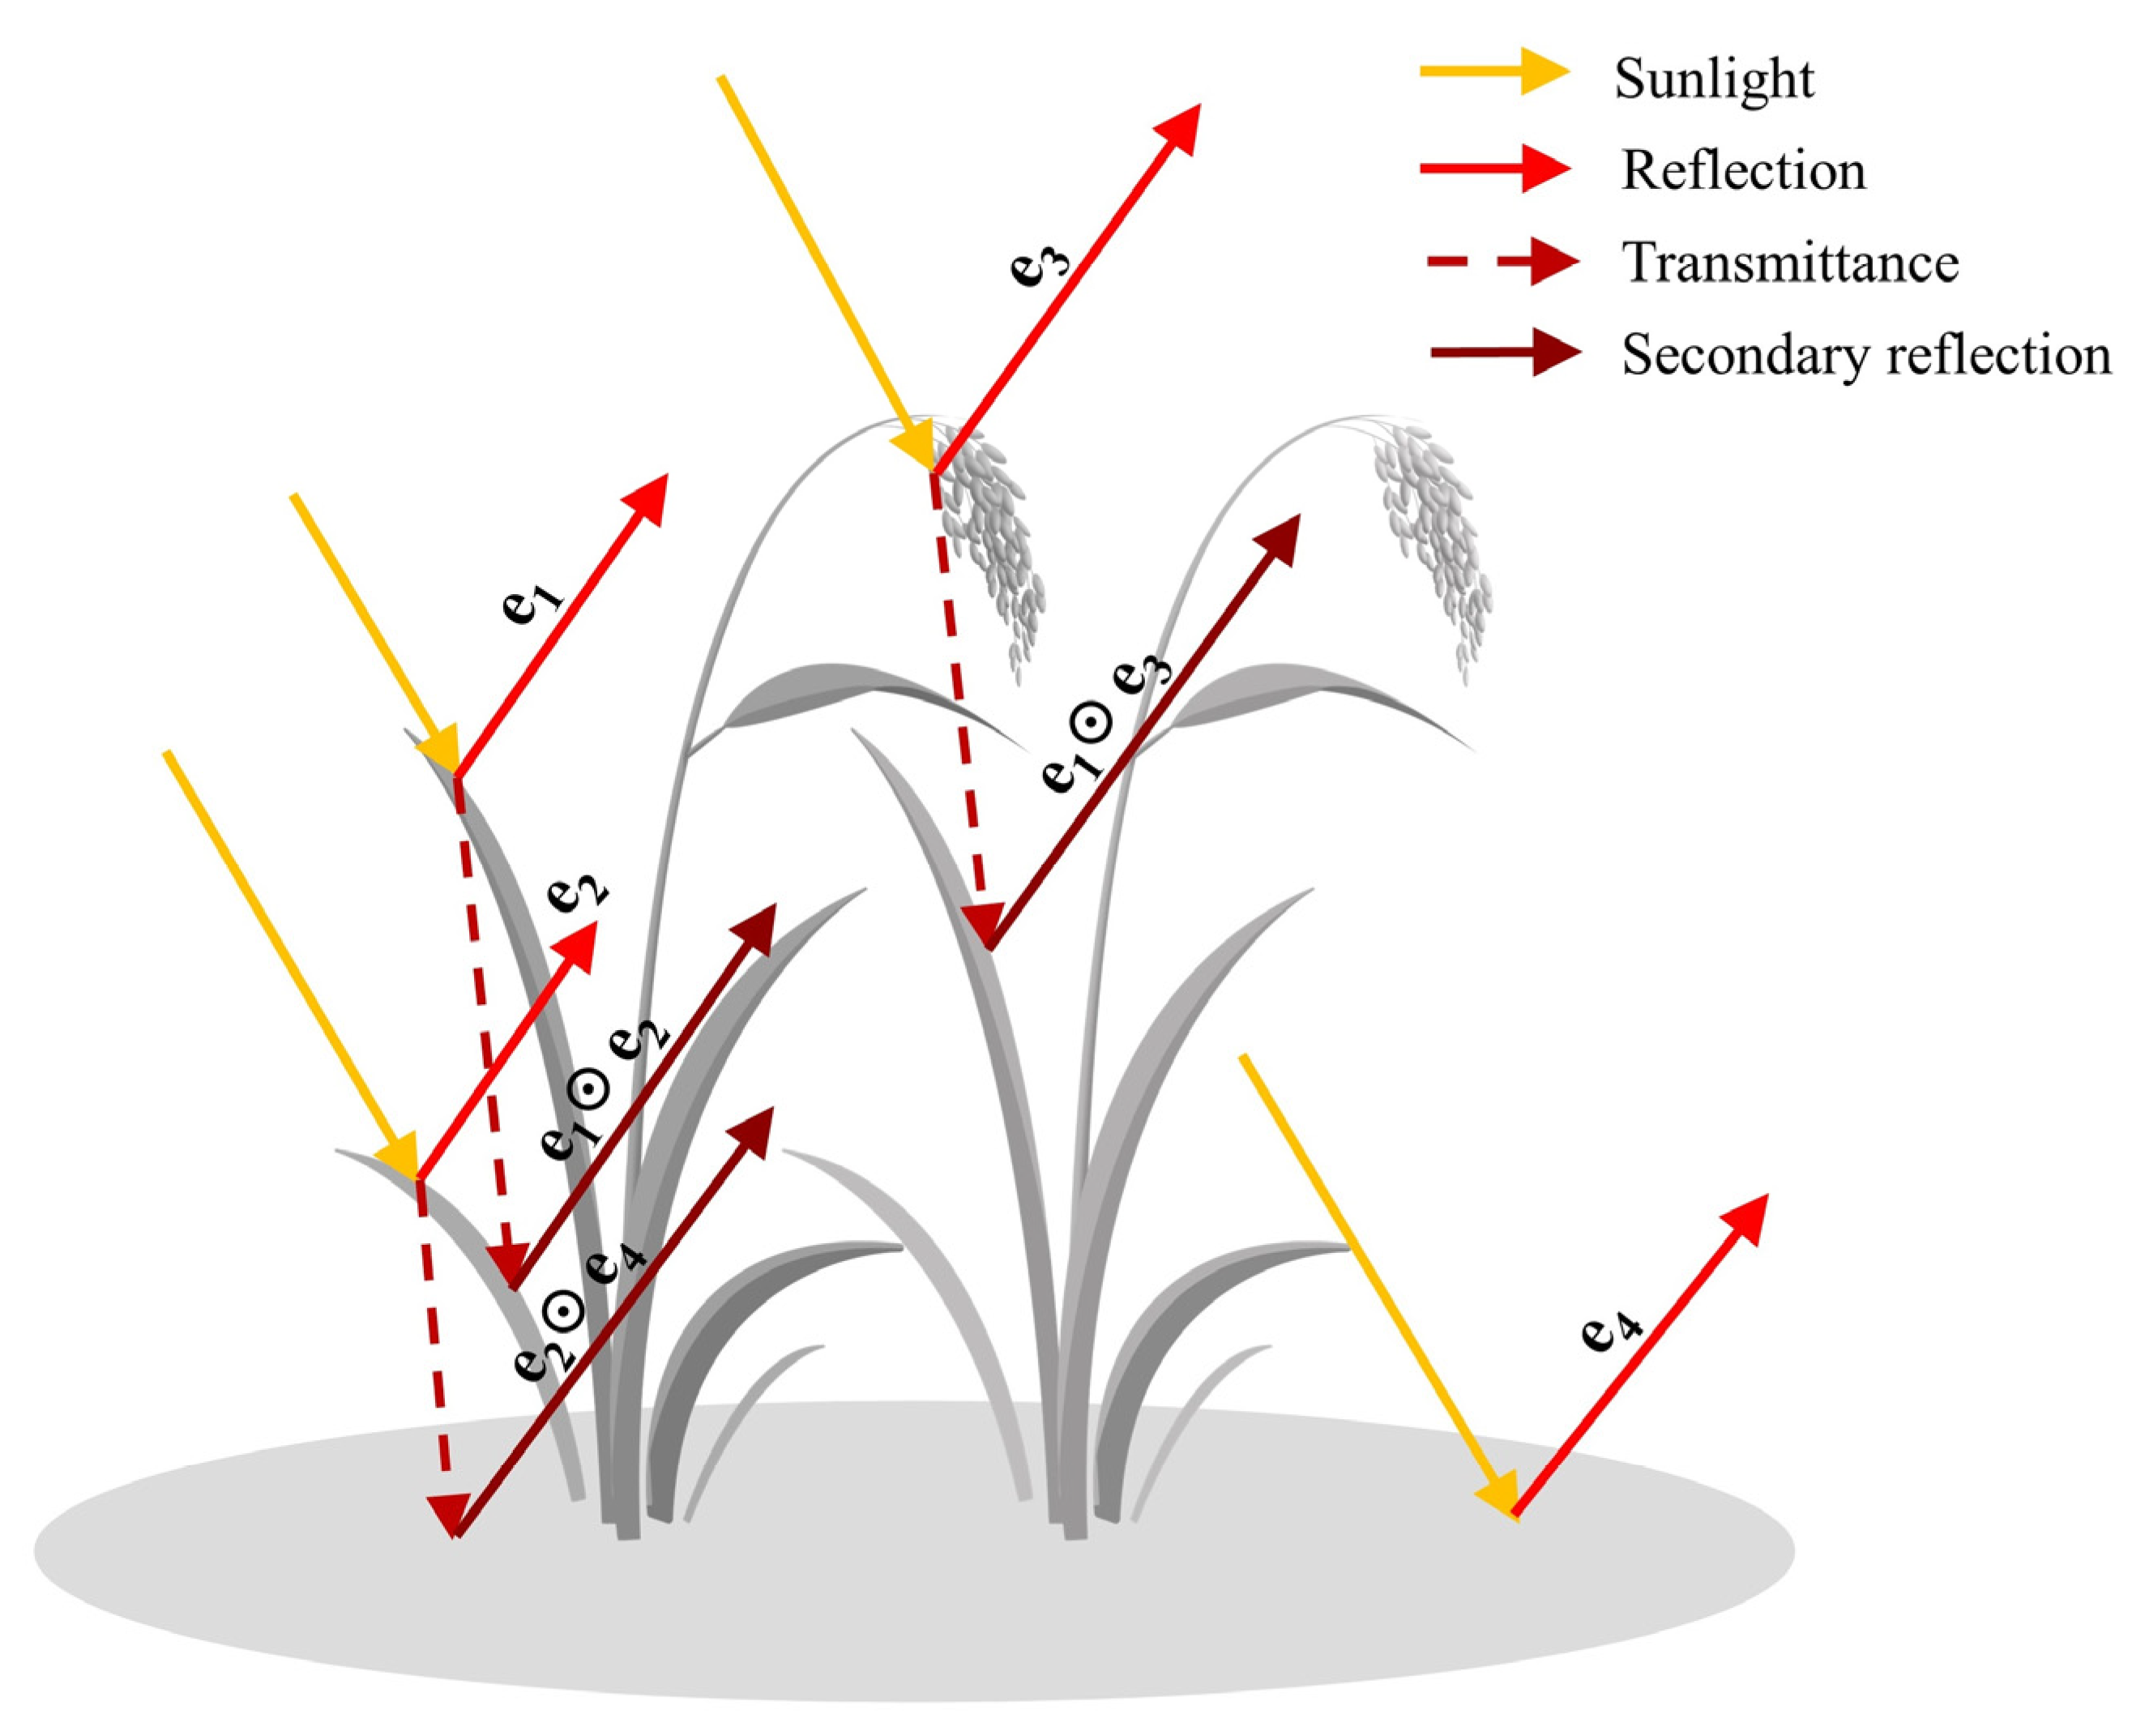
2.5. NU-BGBM Bilinear Spectral Mixture Analysis

In order to estimate the abundances of endmembers extracted in Section 2.4 in an image pixel, we used MATLAB (MATLAB 2016a, MathWorks, Inc., Natick, MA, USA) to derive a novel bilinear unmixing method, the nonlinear unmixing method based on the bandwise generalized bilinear model (NU-BGBM) [54].
The LMM assumes that the reflectance y of one pixel in the imagery is a linear combination of endmembers E with their relative proportions a. On this basis, the BMM takes second-order scattering between different endmembers into consideration, which means adding an additional second-order interaction term to the LMM as follows:
y = Ea + i = 1 M - 1 j = i + 1 M b i , j e i ʘ e j + n
where a is the abundance vector, bi,j is the number of nonlinearities between the endmember ei and ej, ʘ is the Hadamard product operation, M is the number of endmembers, and n denotes the noise in imagery.
The generalized bilinear model (GBM) sets the nonlinear coefficient bi,j = γi,jaiaj, and the constraints imposed on the GBM can be written as:
a i 0 , i = 1 , , M γ i , j = 0 , i , j = 1 , , M , i j 0 γ i , j 1 ,   i , j = 1 , , M , i < j
The real remote sensing image usually has strong signature variability [55], and the abundances may not meet the abundance sum-to-one constraint (ASC) in practice, so Li et al. [54] do not explicitly impose the condition for unmixing in NU-BGBM. Considering the fact that the remote sensing images in the real world are usually degraded by mixed noise [56], the NU-BGBM further subdivides the noise of imagery into the sparse noise S and dense Gaussian noise N, and solves with the alternative direction method of multipliers (ADMM). Mathematically, the NU-BGBM can be expressed as follows:
Y = EA + FB + S + N A 0 ,   0 B C
where Y denotes the pixel matrix with a total of P column vectors (the number of pixels in the image), E and F are the endmember matrix and the bilinear endmember matrix respectively, and correspondingly, A and B are the abundance matrix and the bilinear abundance matrix, C(i,j),k = Ai,kAj,k(k∈{1,…,P}), and S and N denote the two types of noise matrix.
In addition, to solve the matrix equation, the unmixing model limits of the number of endmembers must be less than or equal to the number of bands.
We applied the NU-BGBM to obtain abundance images of foreground and background, as shown in Figure 6, taking the endmembers extracted by the PPI method as input (Figure 5d). The average value of each ROI in the foreground abundance image (Figure 6a) represented the plot-level foreground abundance.

2.6. Data Analysis between UAV Data and Rice Yield

In this study, the correlations between the image data and the final yield were assessed and analyzed. We employed the Pearson correlation coefficient (r) to statistically analyze correlation and built linear models to compare R2 and RMSE. Firstly, a normal correlation analysis on the rice yield data and VIs at booting and heading stage was conducted. The difference between these two rice growth stages was discussed and analyzed. For improving the correlation of yield and VIs effectively, the relationship between (1) yield vs. VI, (2) yield vs. VI × A, (3) yield vs. VIE × A, (4) yield vs. (VIE × A + VIF × B) were evaluated successively, where VIE and VIF, respectively represented the VIs which were recalculated from endmember spectra and bilinear endmember spectra (the Hadamard product of endmember reflectance) obtained in Section 2.4 (Figure 5d), with the subscripts E and F specially marked.
VI × A is a common approach to combine abundances and VIs [15,22]. In this paper, from the point of view of physics, we considered that the spectral properties of a mixed pixel were determined by each component (VIE) and corresponding abundance fraction (A). Therefore, the spectral characteristic of the foreground in an image (VIforeground) could be described by VIEforeground and Aforeground, which respectively denoted the VIE and A of the foreground endmembers. The equation was as follows:
VI foreground = A foreground VI E foreground
From the point of view of mathematics, we regarded the BMM as a simple math calculation equation whose independent variable was e and dependent variable was y. Taking three endmembers as an example, Equation (5) could be rewritten as:
y i = a i 1 e 1 + a i 2 e 2 + a i 3 e 3 + b i 1 e 1 ʘ e 2 + b i 2 e 1 ʘ e 3 + b i 3 e 2 ʘ e 3 + s i + n i
where yi denoted the ith pixel and e1, e2, and e3 were the three endmember spectra within the instantaneous field of view (IFOV). We considered that the equation was also reasonable when the endmembers were replaced by the VIs calculated from it. Thus, VIyi could be calculated as follows:
VI y i = a i 1 VI e 1 + a i 2 VI e 2 + a i 3 VI e 3 + b i 1 VI e 1 ʘ e 2 + b i 2 VI e 1 ʘ e 3 + b i 3 VI e 2 ʘ e 3 + s i + n i
The equation represented the complex relationship between the spectral properties of mixed pixels and ground objects. In this case, the terms related to foreground were summed up as VIforeground:
VI foreground = A foreground VI E foreground + α × B foreground VI F foreground
where VIFforeground and Bforeground, respectively denoted the VIF and B of the foreground endmembers; α = 1, when Fforeground was the product of two foreground endmembers; and α = 0.5, when Fforeground was the product of one foreground endmember and one background endmember. In order to keep the simplicity of symbols, the A, VIE, and VIF in the text all represented data related to foreground endmembers.

2.7. Algorithm Establishment Using Leave One Out Cross-Validation

In view of the small number of experimental samples in this paper, we used a leave one out cross-validation method to establish the final yield estimation model. Leave one out cross-validation is one of the most widely applied cross validation methods in model establishment and validation for the full use of experimental data [57]. It selects one of the N samples as the verification set, and the remaining N-1 samples as the training set. The training and validating process is repeated N times, and the coefficients and accuracy of the final algorithm are produced as:
Coef = i = 1 N Coef i N ;   R 2 = i = 1 N R i 2 N ;   RMSE = i = 1 N E i 2 N
where Coef denotes the coefficients of the algorithm; R2 and RMSE are the average of coefficients of determination and estimation error (Ei), respectively; N = 42 in Lingshui City and N = 23 in Wuxue City (one of the rice yield data was obviously wrong).

3. Results

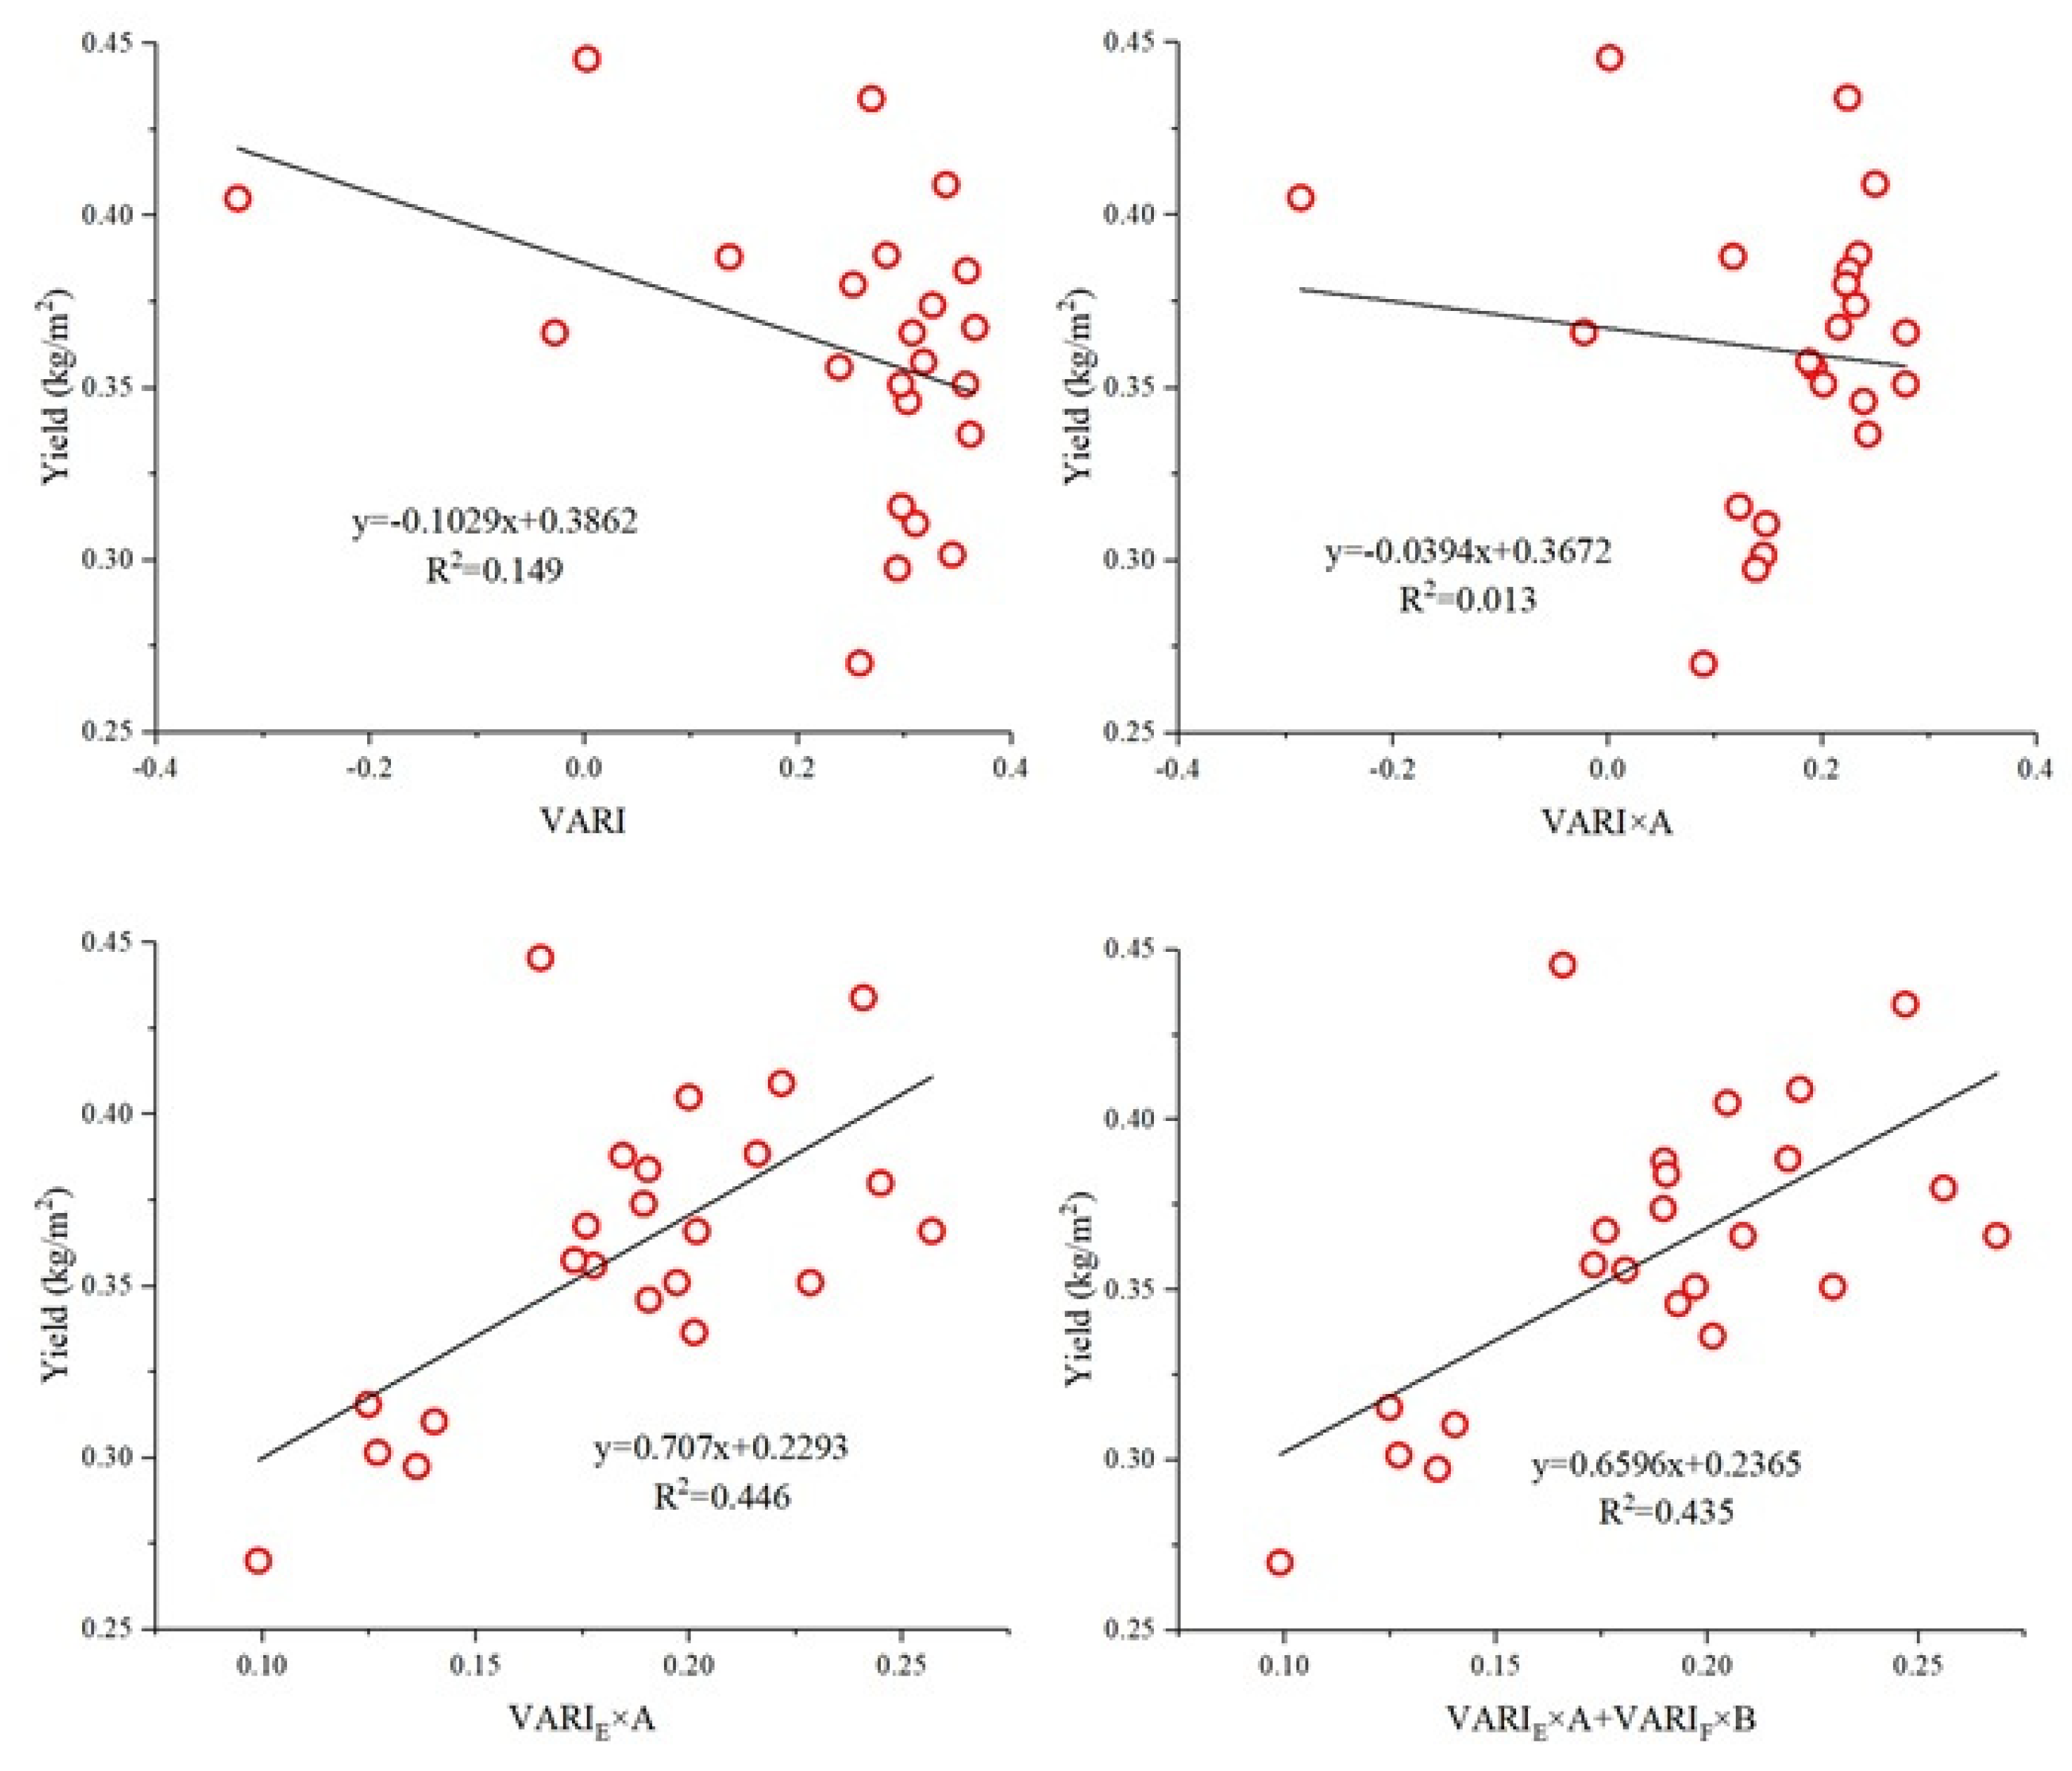
3.1. Correlations of Vegetation Index with Yield

In Table 2, the Pearson correlation coefficients of VIs with yield at heading stage were generally lower than that at booting stage in both of the two study areas. Among the tested indices, NDVI and GNDVI had relatively stable and high Pearson correlation coefficients. In Study Area 1 (Lingshui), all r values were less than 0.340 at heading stage, while at booting stage, most r values were more than 0.400. EVI and EVI2 showed an extremely weak correlation, and PRI had a negative correlation with yield. In Study Area 2 (Wuxue), PRI was not calculated owing to the lack of reflectance in 520 and 570 nm, and the Pearson correlation coefficient of VARI with yield at heading stage was abnormal. Except the two, most indices showed strong correlations with rice yield with r exceeding 0.700 at booting stage and below 0.700 at heading stage. On the whole, most VIs showed a weaker correlation with rice yield at heading stage than that at booting stage.

3.2. Relationship between Foreground Abundance Data and Rice Yield

As shown in Figure 5c, for the image of rice at heading stage, the high PPI pixels enumerated in the n-Dimensional Visualizer mainly belonged to two clusters—one was elongated and on a large scale, and the other was on the contrary. The larger cluster consisted of pixels with a higher probability of being foreground endmembers. There were significant spectral differences of pixels at both ends of the larger cluster. Thus, to alleviate the adverse effects of the differences, for data from Study Area 1 (Lingshui), we tried to manually delineate this scene component into one to six sample sections, as shown in Figure 7, clustering pixels with a more similar spectrum together. Correspondingly, we output one to six foreground endmembers and one background endmember, and the spectra were displayed in Figure 8.
The six results in Figure 8 were inputted in the NU-BGBM, respectively, and the sum of each foreground abundance fraction was regarded as the foreground abundance of the delineating sample strategy, designated as A1, A2, A3, A4, A5, and A6. We compared the Pearson correlation coefficients of the six abundance values with yield. Moreover, in the processing, a RMSE parameter calculated in NU-BGBM, which denoted the accuracy of unmixing, was also referenced. The two types of parameters were listed in Table 3. In Study Area 1 (Lingshui), at heading stage, while extracting five foreground endmembers, the unmixing accuracy reached the highest (RMSE was below 0.009 kg/m2) and the correlation of A5 and yield was the strongest (r was 0.474).
For Study Area 2 (Wuxue), we manually delineated the scene component into one to five sample sections, owing to the restrictive condition of the NU-BGBM, and then input the five results into the unmixing model. Table 3 also showed the Pearson correlation coefficients of yield and the foreground abundance and the accuracy of NU-BGBM under the five strategies. While extracting four foreground endmembers, the unmixing accuracy was the highest (RMSE = 0.027 kg/m2) and the correlation of A4 and yield was the strongest (r = 0.760).

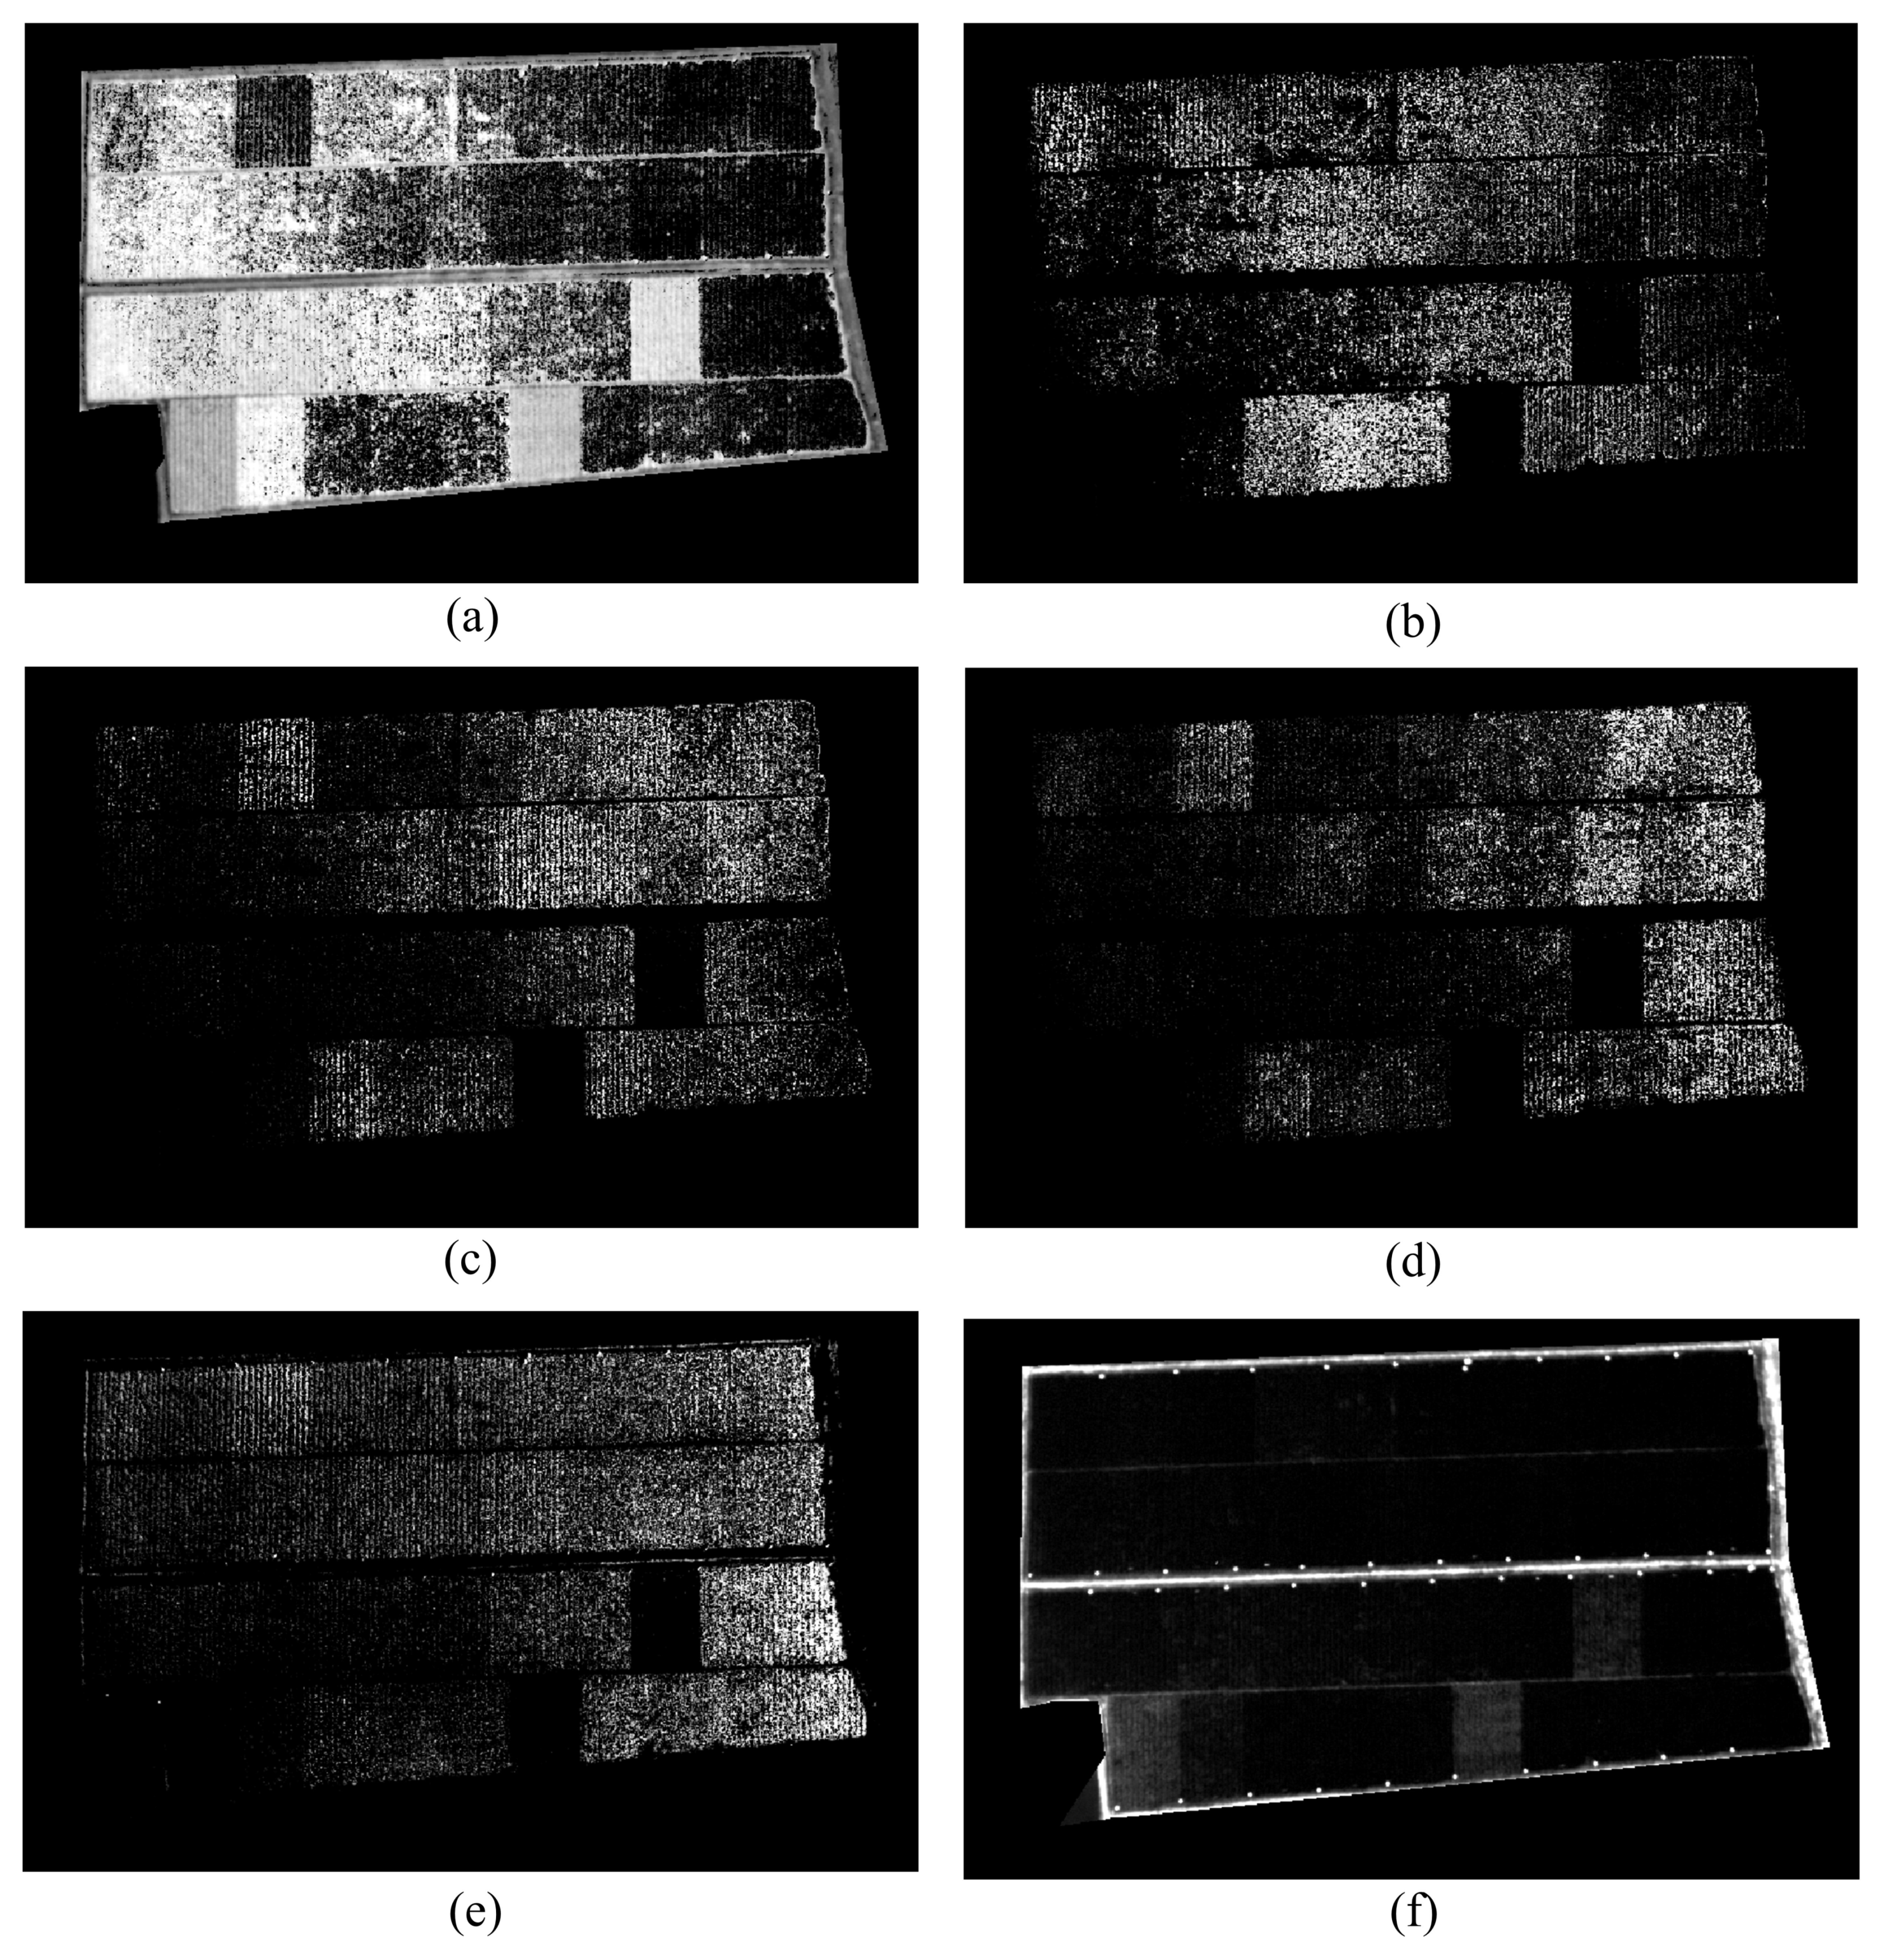
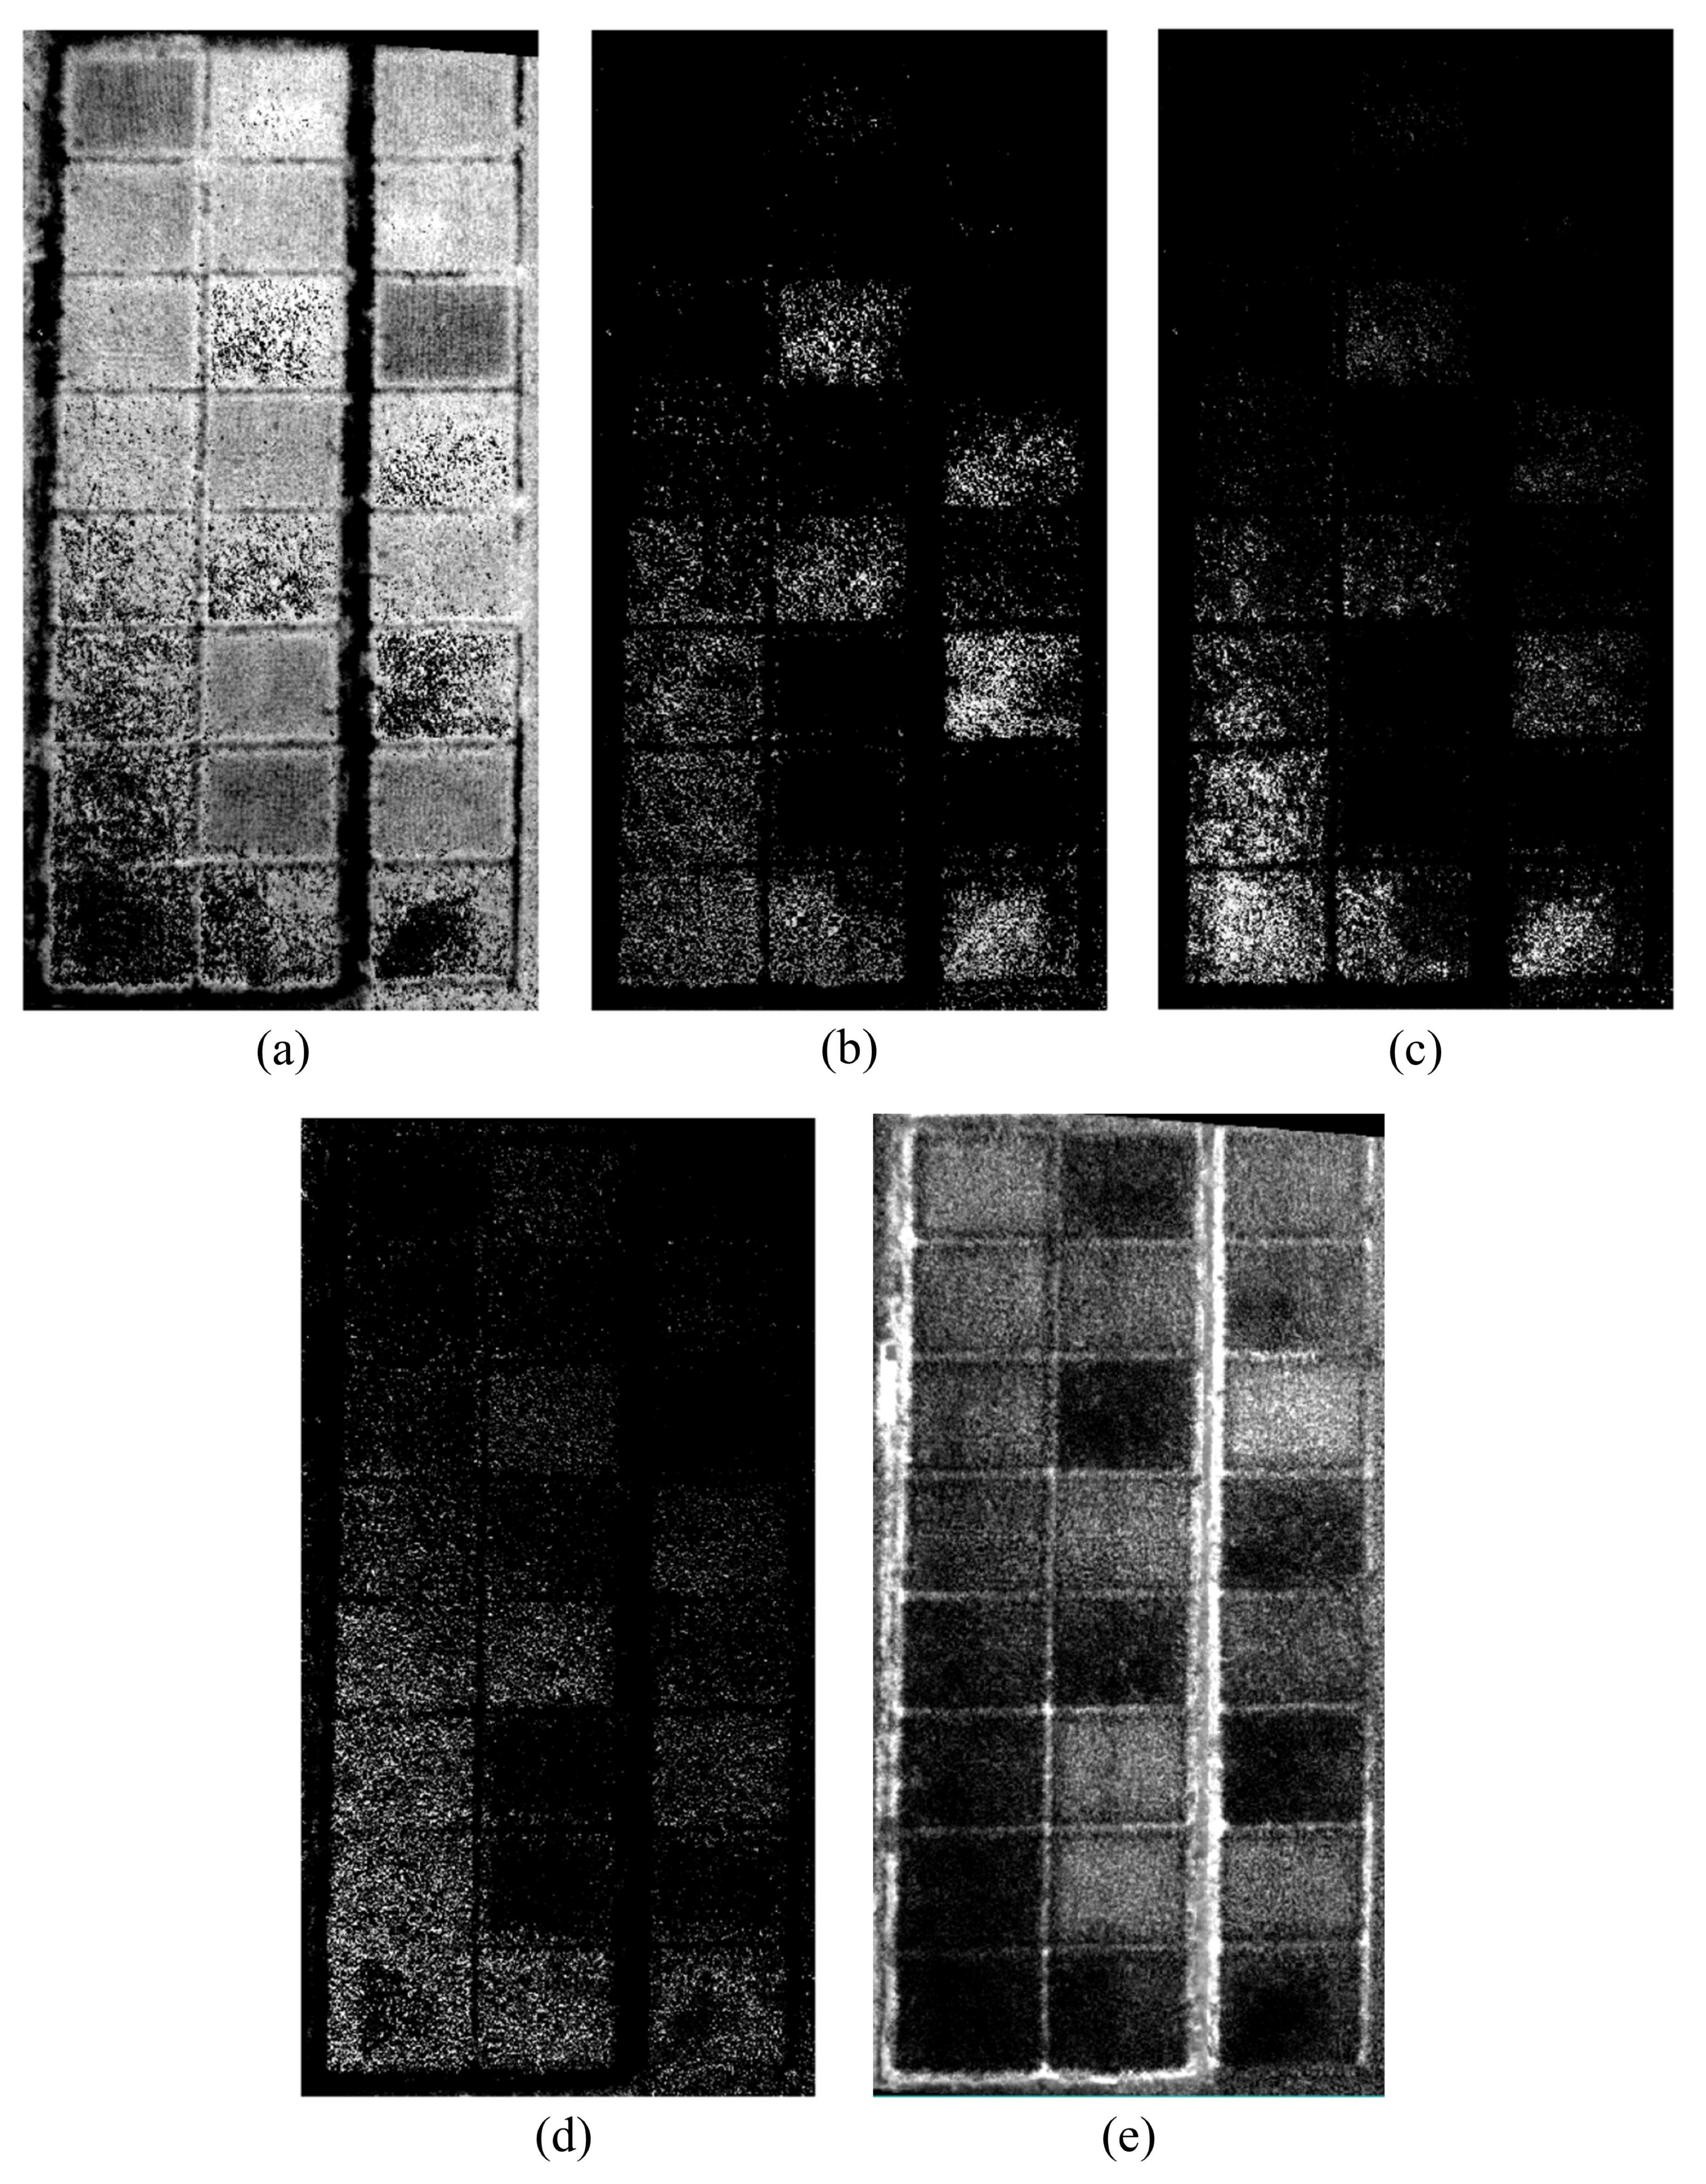
3.3. Spectral Mixture Analysis in Rice Field

According to Table 3, we chose the optimal endmember combination and output the final abundance images of both study areas using NU-BGBM, respectively in Figure 9 and Figure 10. There were evident spectral differences between foreground and background, and the input foreground endmembers had various reflectance, especially in Green, Red edge, and NIR range, as shown in Figure 8. Correspondingly, there were significant differences that existed in the abundance images of foreground and background. Each rice plot was bright to varying degrees in the foreground abundance images. Additionally, in the background abundance image, generally, pixels in rice plots had visibly lower values than that in the other region. However, pixels near the ridges in Figure 9a and in some plots in Figure 10e had a non-zero value, which indicated that the model might not unmix with an extremely ideal effect. In addition, the maximum value of background abundance was too large (about 35), while that of foreground abundance was near 1.5.

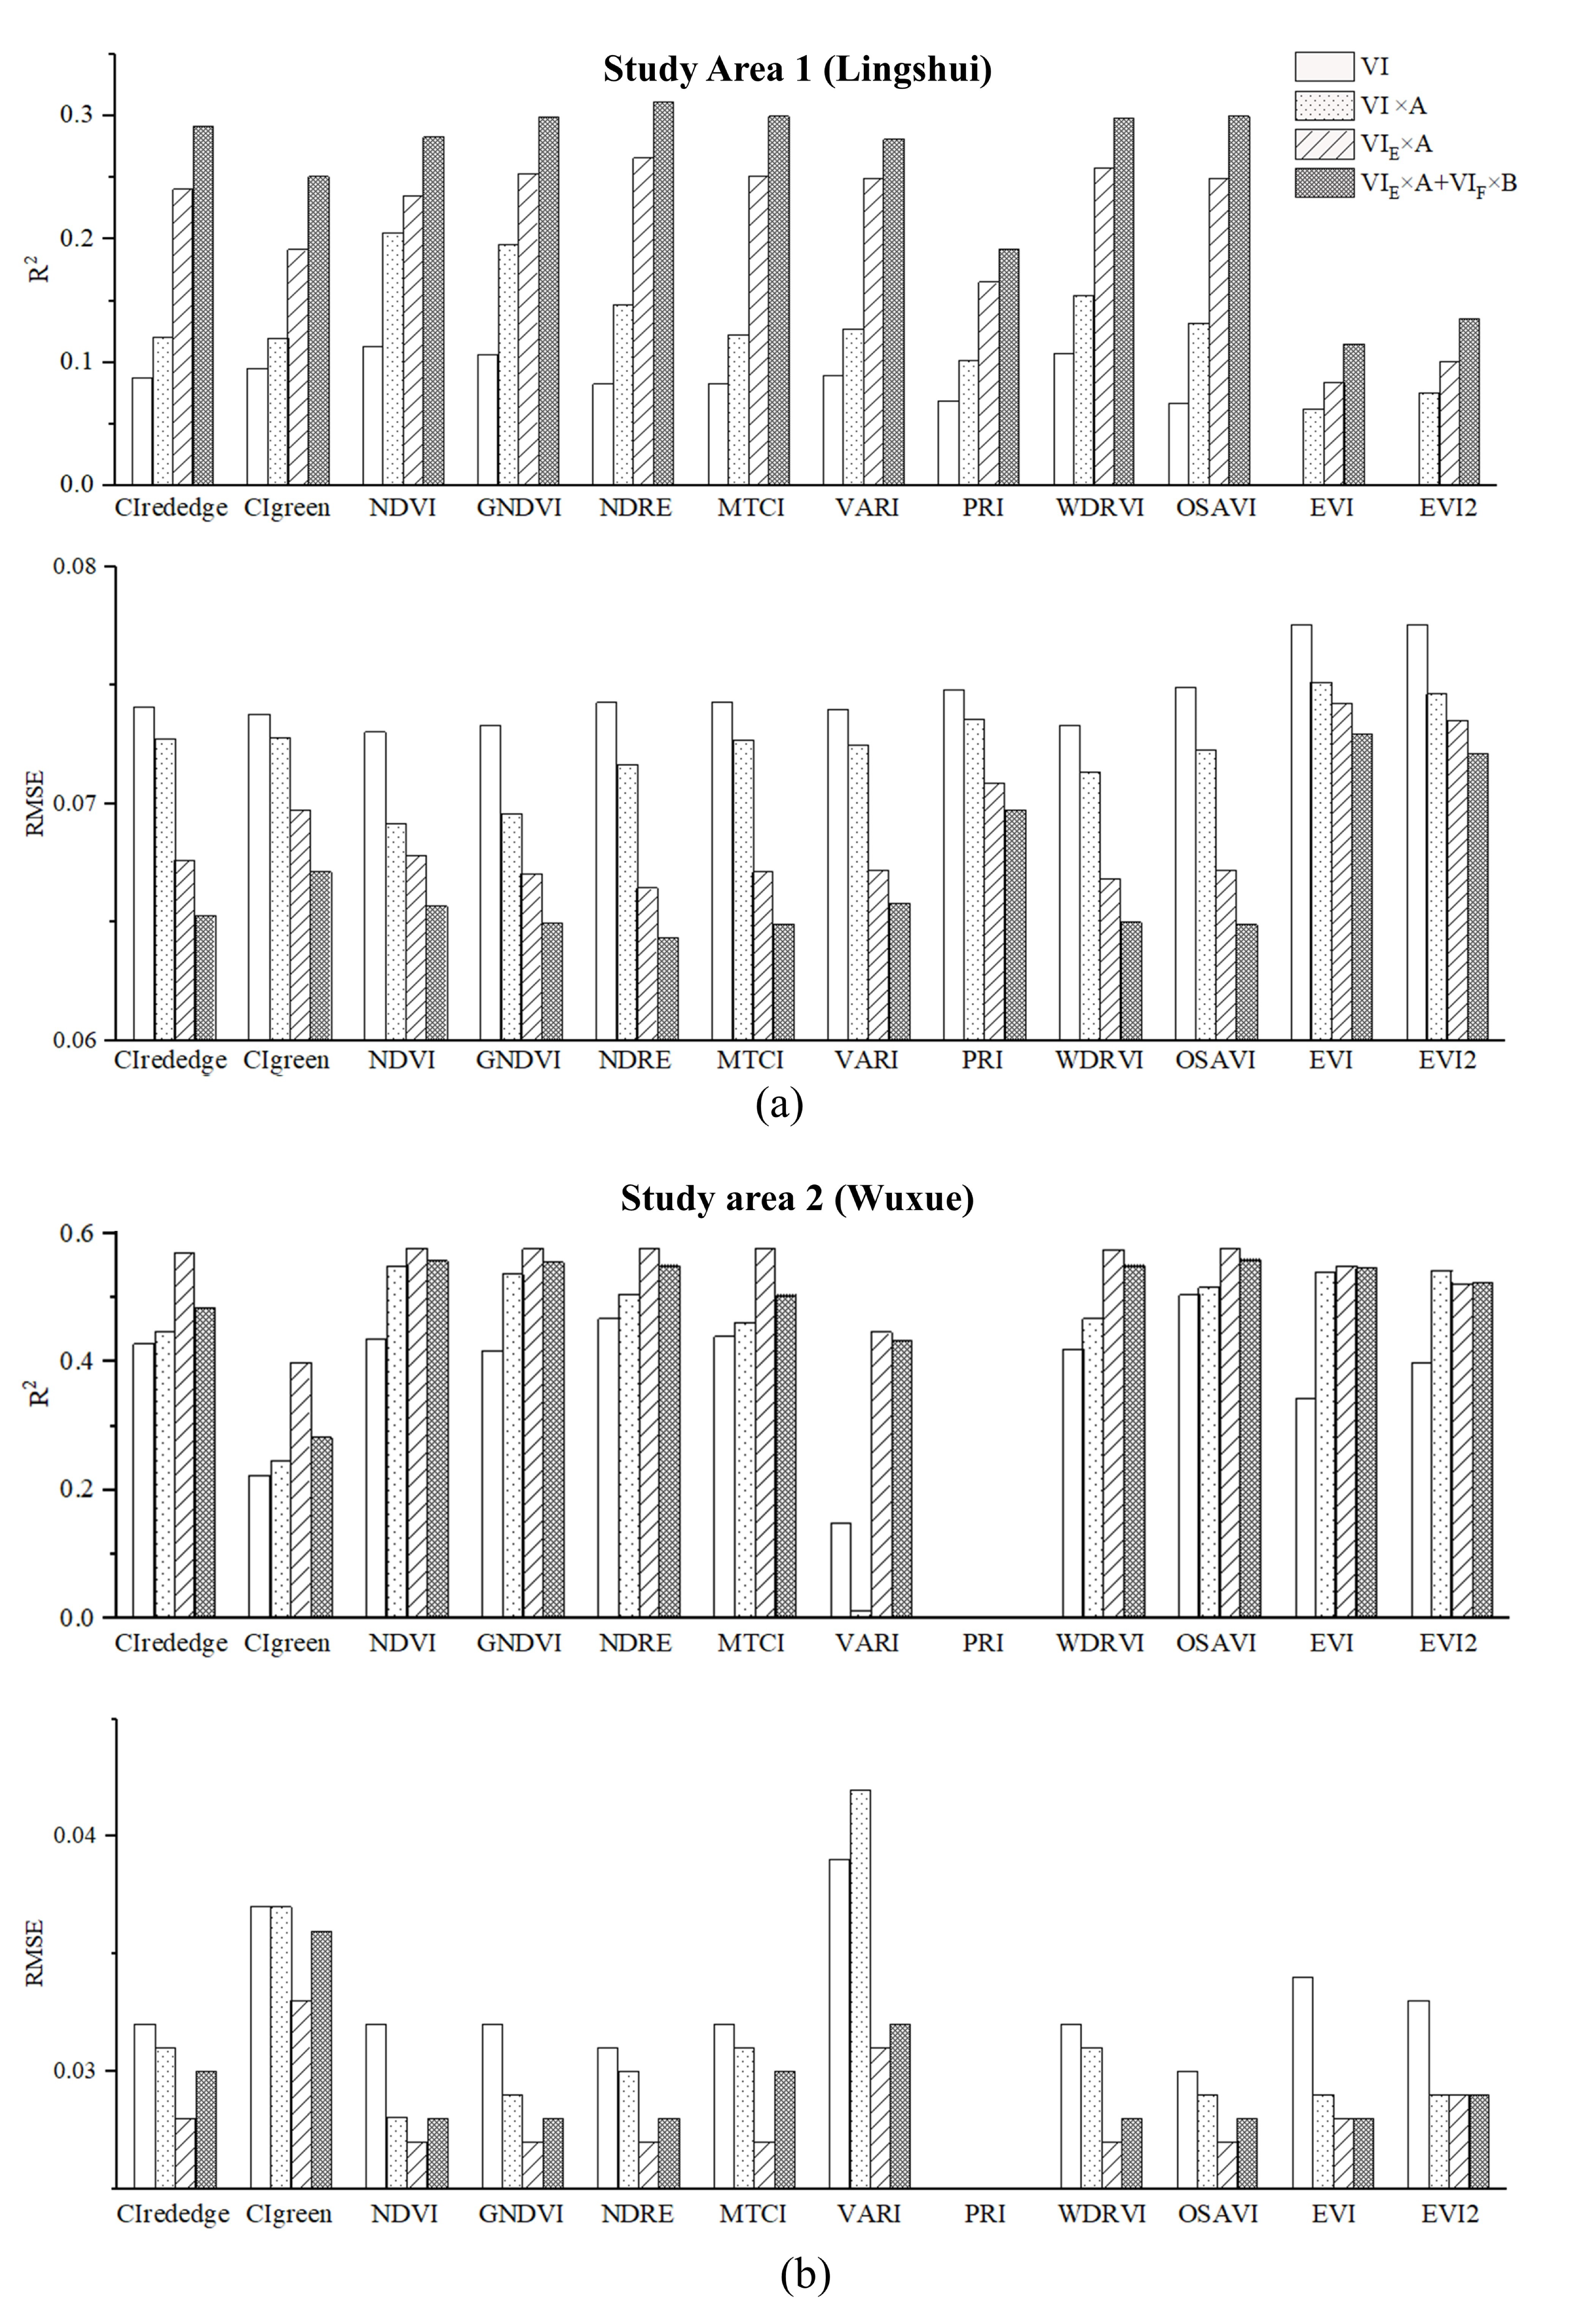
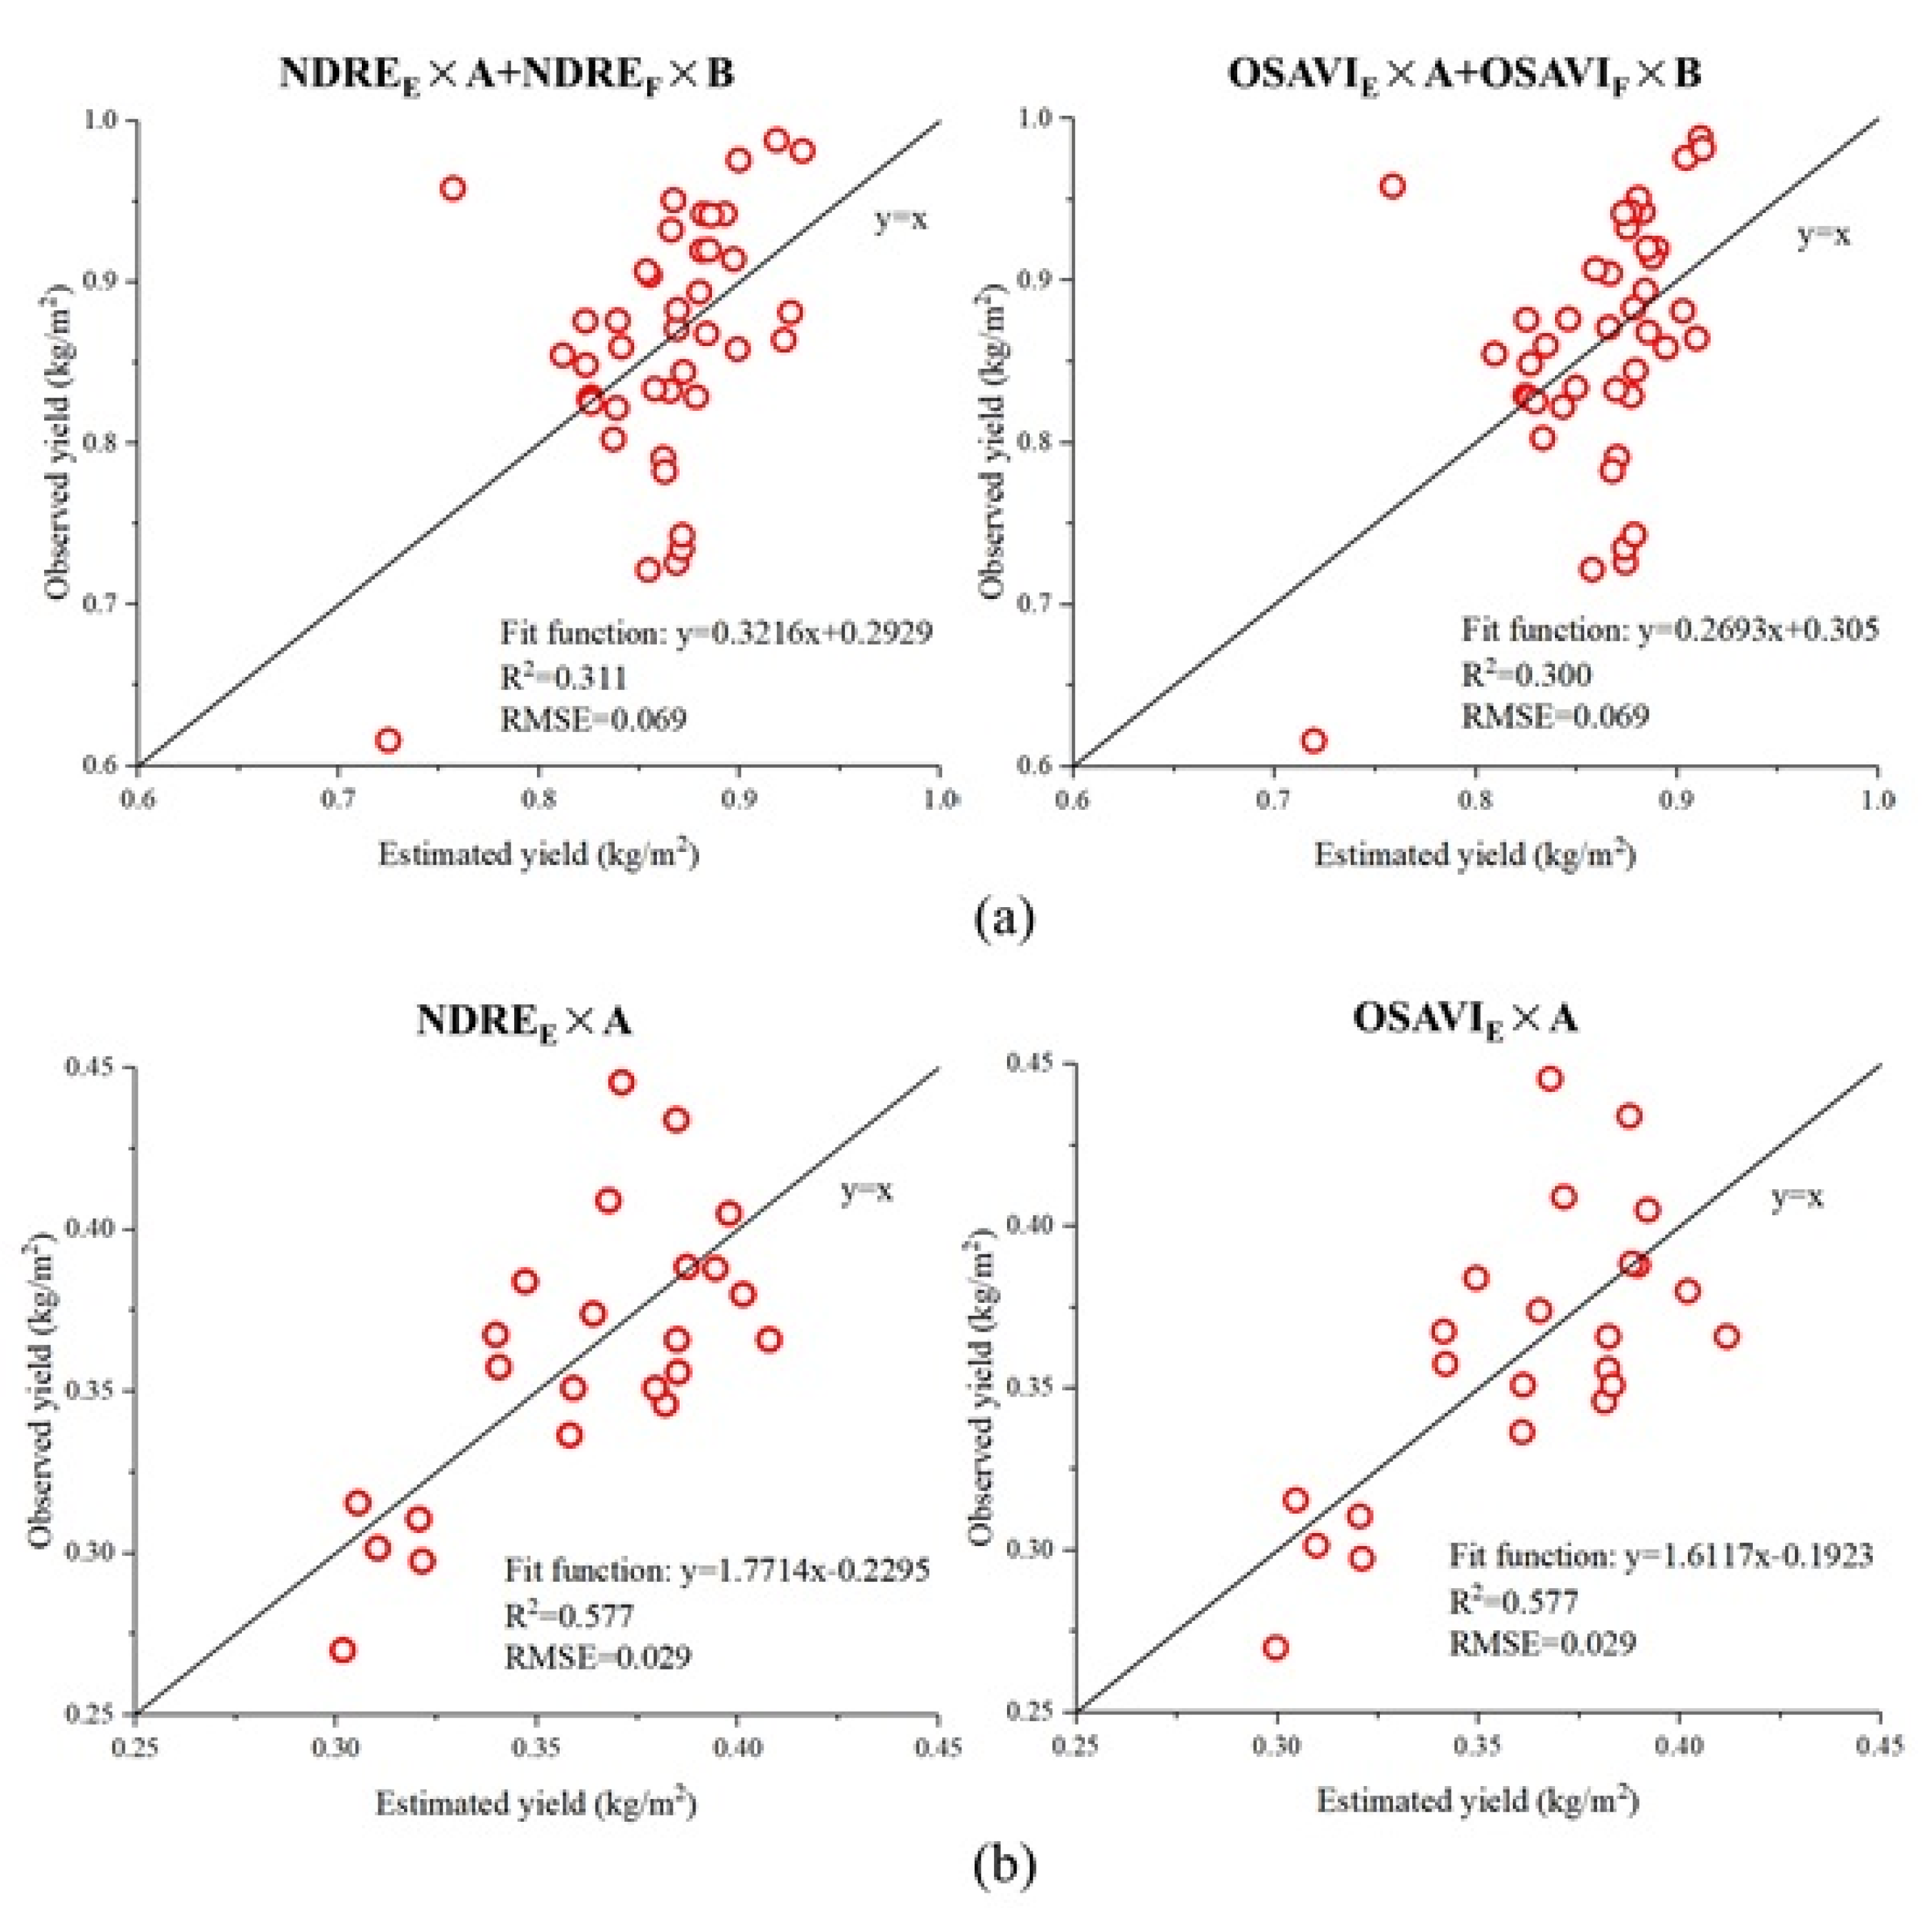
3.4. Rice Yield Estimation Using Vegetation Index and Abundance Data

To take full advantage of the endmember spectral variability and describe the contribution of different foreground components, we calculated VIE × A and (VIE × A + VIF × B) as new indices, further highlighting the foreground information at heading stage. The correlations with yield were compared to VI and VI × A, measured by the Pearson correlation coefficients, as shown in Table 4. During processing, in view of the non-singleness of foreground endmembers, the VI × A was the product sum of the VI and abundances of each foreground endmember, so were VIE × A and (VIE × A + VIF × B). As results, generally, after combined with abundances, twelve VIs produced relatively higher Pearson correlation coefficients than VIs alone. Of particular note was the more obvious improvement while using VIE than directly multiplying A by VI. For the rice yield of Study Area 1 (Lingshui), the (VIE × A + VIF × B) showed the strongest correlation among all four products, and the r value of (NDREE × A + NDREF × B) reached the highest (0.558), however, the r values of (VIE × A + VIF × B) and yield of Study Area 2 (Wuxue) were generally lower than that of VIE × A, and the maximum r value was 0.760 (NDVIE × A).
For further analysis, regression analysis had been used between yield and the four VI products and the results were shown in Figure 11. We developed four linear relationships using 42 and 23 samples, respectively and gained R2 and RMSE. Among the four independent variables, VIE × A showed more satisfactory fitting results in both two study areas, in stark contrast to VI. For all tested indices, using the product of NDREE, MTCIE, and OSAVIE, and abundances to regress with rice yield was more accurate with higher R2 values and lower RMSE.
The statistical results in Study Area 1 (Figure 11a) showed that it helped estimate the yield through taking the bilinear term into consideration. In addition, (NDREE × A + NDREF × B) had the best goodness of fit with yield (R2 was 0.312), and the biggest increase was on the R2 of OSAVI (from 0.067 to 0.300). The optimal RMSE decreased from 0.073 kg/m2 (VI) to 0.064 kg/m2 (VIE × A + VIF × B), which represented a reduction of 12%.
For the result in Study Area 2 (Figure 11b), the addition of VIF × B reduced the estimation ability of VIE × A. NDVIE × A, NDREE × A, and OSAVIE × A had the best fitting result with yield (R2 was 0.577), and R2 of VARI improved from 0.149 to 0.446 with a most extent. The RMSE decreased from 0.030 kg/m2 (VI) to 0.027 kg/m2 (VIE × A), with a reduction of 10%.
Using the optimal products of the two indices NDRE and OSAVI, the leave one out cross-validation was utilized to build the final rice yield estimation model. For the two study areas, the specific estimation formulas and the goodness of fit between the estimated yield and measured yield were obtained and respectively shown in Figure 12a,b.

4. Discussion

This study was carried out to improve the estimation ability of VIs for rice yield at heading stage based on remote sensing images. Using the quantity abundance information and qualitative spectral information of each mixed composition obtained from SMA, our results showed the development of the accuracy of rice yield estimated at heading stage.
In this study, there were 42 varieties of hybrid rice cultivated in the 42 plots with a similar field management in Study Area 1 (Lingshui), and in Study Area 2 (Wuxue), there were eight levels of nitrogen fertilizer of one single variety of rice. These two settings represented possible planting situations in daily life and productions, and multiple varieties might generate more significant spectral diversity, affecting the linear grain yield model [58,59]. We obtained the UAV data both at booting stage and heading stage. Results in Table 2 revealed the correlation between 12 representative VIs and the yield was weaker at heading stage than that at booting stage. The cause of this was probably that the emergence of panicle could lead to changes in canopy reflectance, and the VIs were also affected [18]. Reliably, the predictive ability for yield decreased during the heading stage based on UAV imagery data. Consequently, SMA was utilized to improve the predictive ability of VI in rice yield estimation at heading stage.
The spectral variability for rice plants was intuitively presented on one UAV imagery and direct-viewing as a large cluster in the PPI processing. It was noted that extracting only one single endmember spectrum for the scene component resulted in a poor correlation of foreground abundances with yield, as shown in Table 3. Additionally, highly correlated endmembers could cause error in spectral mixture models [60]. Therefore, the multiple endmember extraction based on the PPI approach was tested. We extracted multiple foreground endmembers depending on the value of RMSE in NU-BGBM. When the RMSE of unmixing model reached the minimum, the input endmembers and correspondingly output abundance images were selected and applied in our follow-up experiment.
In the process of unmixing, we used a bilinear mixing model NU-BGBM to account for the interaction of second scattering of photons over the multi-level and hybrid scene. Aimed at rice plants, with a complex three-dimensional structure and relatively high transmission [61,62], it was more suitable for unmixing by the BMM than the LMM, especially at heading stage, when the differences of rice characters were enlarged and the canopy closure caused the similar abundance values of foreground. The Pearson correlation coefficients had been also calculated from yield and the VI products derived from the results of the fully constrained least squares (FCLS) linear SMA [63], and were listed in Table 5. By comparison with Table 4, for multi-variety hybrid rice plots in Study Area 1 (Lingshui), significantly, the abundances obtained by the LMM did not play a supplementary role in the relationship between VI and yield, most likely due to the abundance saturation phenomenon under the ASC (the values were closed to 1). In contrast, the NU-BGBM relatively weakened the saturation and obtained higher Pearson correlation coefficients. Similarly, the NU-BGBM performed better for single plantation rice plots in Study Area 2 (Wuxue), while the FCLS also had a slight improvement. To have an integrative consideration, the NU-BGBM had a more profound physical meaning and higher precision, and owned obvious superiority in a multi-variety hybrid scene.
In addition to model errors, influence factors on the unmixing effect mainly include observation noise, environmental conditions, and input endmember spectra [38]. At heading stage, rice plants were in the utmost luxuriance and almost entirely covered the paddy field. With the restriction of spatial resolution, pixels near ridges were universally composed of soil and water and might be shaded by weeds and rice leaves, causing the unideal performance of unmixing in this region in Figure 9a. The situation was visibly alleviated in Study Area 2 (Wuxue) with a higher spatial resolution (Figure 10a). Moreover, areal fractions of bare soil could be overestimated in all unmixing models due to the increased radiance of bare soil resulting from side scattering of NIR radiation by adjacent plants [64]. In addition, there were suspected unmixing errors occurring in Figure 10e. To exclude the applicability of NU-BGBM, we output the background abundance image by FCLS and found that the image was similar to Figure 10e. Therefore, the reason for this was that the input endmembers were limited by the purity of pixels in the image and influenced the unmixing results, and the relatively high RMSEs of the NU-BGBM in Study Area 2 (Wuxue) in Table 3 also proved this. Without the limitation of ASC, it was normal for the NU-BGBM to output abundance values larger than 1. The exception values near 35 in background abundance images occurred near ridges. We compared the input background endmember spectrum and the image reflectance near ridges, and found that the spectral shapes of the two were similar but the values of the latter were higher. Considering the previous analysis, we thought it was the input background endmember that caused the unideal result of the background abundance images. Nevertheless, we paid more attention to the unmixing results of the rice plots in the foreground abundance images, which directly participated in subsequent processing. As shown in Figure 9 and Figure 10, the abundance images of the foreground were relatively reasonable. Different plots and different levels of canopies displayed obvious brightness heterogeneity, respectively. All the foreground components together constituted rice plants and contributed to the final rice spectrum.
Each pixel is composed of the reflectance of foreground and background in the paddy fields. VIs, directly derived from image spectra, always mix background information. In the purpose of eliminating the interference of background and making good use of the spectral difference of several foreground endmembers, VIE and VIF were proposed to combine with corresponding abundance data. VIE represented the spectral characteristics of every endmember, and VIF further reflected the information of bilinear interactions about foreground endmembers on the basis of VIE. In addition, each foreground component fraction, A and B, denoted the contribution of every endmember to the whole pixel reflectance. The product sums of VIE (VIF) and A (B) of all the foreground endmembers were the final synthetical parameter which depicted the pure spectral features and subpixel spatial information on rice plants, as Equations (6) and (9). Compared with the traditional combination method VI × A, the novel VIE × A and (VIE × A + VIF × B) provided better estimation results of yield apparently in Figure 11. Additionally, the utilization of VIE and VIF enhanced the stability of VI-based models as a safeguard against the abnormal spectrum from UAV, which was a conclusion drawn from VARI of Study Area 2 (Wuxue) at heading stage in Figure 13.
In the visible spectrum (400–700 nm), leaf reflectance is mainly affected by photosynthetic pigments, and in the NIR domain (700–1300 nm), the magnitude of reflectance is governed by the cell arrangement mode and vegetation structure [65]. Plants differently managed in terms of fertilization will change chlorophyll contents and reflectances more in red and green wavelengths [66], while the diversity of spatial structure and morphological character among rice cultivars is relatively more significant, as shown in Figure 1. Therefore, the spectral difference of canopy was mainly in the visible range for Study Area 2 (Wuxue), and in the NIR range for Study Area 1 (Lingshui), with the UAV spectral data as a reference. Primarily, second-scattering occurs in the NIR, with high transmittance of leaves, while nonlinear influences are minimal in the visible region [31,64]. The BMM, further taking second-order scattering into consideration, has the probability of achieving better results in multi-variety paddy plots. Additionally, the greater difference of spectral signature among rice varieties than that among rice at different fertile levels leads to a more significant spectral variability. Thus, the effects of our method, mainly based on the multi-endmember strategy and the BMM, varied in different experimental settings. The NU-BGBM further considered the spatial structure of rice plants and then gained the additional bilinear endmember vegetation index matrix VIF and abundance matrix B. What function of VIF × B had depended on the hierarchy and stereospecificity in the scene? It could be observed from Figure 11a that the addition of VIF × B helped estimate the rice yield in the complex space environment. In addition, for rice plots with a small structural difference in Study Area 2 (Figure 11b), the consideration of secondary reflections played an opposite role in the correlation of VIE × A and yield, inducing the model distortion. Therefore, it was considered that the more obvious the heterogeneity of rice plants was, which meant the more significant structural difference of plants was, the better effectiveness the NU-BGBM had.
The vast majority of VIs performed better goodness of fit in the relationship of the final VI product and yield. The obvious improvement could verify the effectiveness of the proposed method, with the increase of around 0.2 of R2 in the two study areas. Among them, the performance of VIs using spectral bands in the NIR enhanced most significantly. The products of NDRE and OSAVI produced stable and optimal estimation both in the two study areas, and then the one out cross-validation approach was utilized, as shown in Figure 12a,b. The combination of NDREE (OSAVIE) and abundances could more accurately estimate the rice yield at heading stage, increasing the R2 values to 0.3 from 0.1 in Study Area 1 and to 0.6 from 0.4 in Study Area 2. For the same rice plots in Study Area 2 (Wuxue), Duan et al. [22] used the product of VI and abundances calculated from field measured spectra to estimate the yield for rice at heading stage, and the R2 also reached 0.6.
For in-season rice grain assessment, the booting stage might be the optimal time using remote sensing data [18,61,67], and Table 2 also confirmed the opinion. To validate the effectiveness of our method, we processed and analyzed data at booting stage and gained the results. The optimal R2 of Study Area 1 (Lingshui) and Study Area 2 (Wuxue), respectively were 0.292 (NDREE × A + NDREF × B) and 0.558 (MTCIE × A), and the RMSEs of the two areas did not decline evidently (about 2%), which indicated that the method still improved the estimation ability of VIs at booting stage but was less effective than that at heading stage. With the insignificant difference of rice plants, the slight enhancement at this stage further confirmed the pertinence of our method, which aimed at the dynamic growth situation of various rice organs and the spectral variability and structural complexity of rice canopy. Apparently, after our processing of UAV images, the accuracy of yield estimation at the two stages was at the same level, and the discrimination of heading stage of paddy rice was easier on account of the relatively significant morphological features.
To be concluded, we extracted multiple foreground endmembers by PPI and then input endmember spectra in the NU-BGBM, directed against the spectral variability and complicated spatial structures of rice plants. In the process, the number of output foreground endmember was dependent on the minimal RMSE of the NU-BGBM. VIs were recalculated from endmember spectra, denoted by VIE, and multiplied with corresponding abundances (VIE × A) to further highlight the foreground. Similarly, VIF × B in (VIE × A + VIF × B) was calculated from bilinear endmember and abundances, and was selectively added when rice plants had a sophisticated spatial structure. The products finally used at heading stage could achieve a result for yield estimation as good as or better than that at booting stage. Among all the tested VIE, the products of NDRE and OSAVI had the highest R2 and the most consistent performances in the two tests. The whole processing was based on one UAV imagery acquired at heading stage, adaptively and effectively.

5. Conclusions

In this study, we developed a full UAV-based approach to improve the estimation of rice yield at heading stage using the vegetation index and abundance of multi-endmembers, with consideration of second-order scattering in paddy plots. Many factors, such as rice varieties, growth status, etc., result in the spectral variability. In addition, the potential of VIs for remote estimating yield is interfered obviously by the existence of background and irrelevant organs, and weakened more for rice with characteristics of strong transmission and complicated structure. Thus, the PPI was calculated to extract multiple endmembers and the NU-BGBM was applied to acquire the abundances of the foreground which were more approximate to the true value. In order to distinguish and amplify the spectral difference, we proposed a novel parameter VIE, which indicated VIs recalculated from an endmember spectrum, and then multiplied VIE by the corresponding abundance A. The simple linear function was established by the sum of VIE × A of every foreground spectrum and yield. Moreover, aimed at several cultivars, (VIE × A + VIF × B) would perform better in yield estimation in the complicated scene, where VIF and B denoted VIs recalculated from a bilinear endmember spectrum and the corresponding bilinear abundances. The integration of plot-level VIE (VIF) and abundance information could estimate rice yield more accurately than using VI alone or VI × A at heading stage. Moreover, the final estimating accuracy was as reliable as that at booting stage. Among all the test VIs, NDREE and OSAVIE combined with abundances were the most accurate for yield estimation of rice under multiple varieties scene or different nitrogen fertilizer treatments with estimation errors below 8.1%. The strategy of SMA, using multiple endmembers and the BMM, can improve the accuracy of VI-based rice yield estimation models especially when fields are under non-homogenous management, and provide a reference for the development of precision agriculture. In the follow-up study, the automation of the algorithms is worth considering and the potential of the SMA strategy proposed in this paper for improving the accuracy of the multi-stage rice yield estimation model is worth exploring.

Author Contributions

All authors have made significant contributions to this research. N.Y. performed the experiments, analyzed the data, and wrote the paper; Y.G. acquired the funding, designed the experiment, and reviewed the experiments; S.F. provided the equipment and environment; Y.L., B.D. and K.Y. collected the data and provided suggestions; X.W. and R.Z. offered advice based on agronomic perspectives. All authors have read and agreed to the published version of the manuscript.

Funding

This research was funded by the National Natural Science Foundation of China (41771381), Key R&D projects in Hubei Province (2020BBB058), and National Key R&D Program of China (2016YFD0101105).

Acknowledgments

We thank the Lab for Remote Sensing of Crop Phenotyping Institute, School of Remote Sensing and Information Engineering and the College of Life Sciences, Wuhan University, China, and College of Resource and Environment, Huazhong Agricultural University, China for providing the equipment and the use of facilities. We are grateful to the groups directed by Shenghui Fang, Renshan Zhu, and Shanqin Wang who worked hard on the field and lab work to provide us with valuable data. We also acknowledge the support of the Key R&D projects, Phenotype Analysis of Hybrid Rice, and Creation of New Varieties for using UAV remote sensing.

Conflicts of Interest

The authors declare no conflict of interest.

References

  1. Mosleh, M.K.; Hassan, Q.K.; Chowdhury, E.H. Application of Remote Sensors in Mapping Rice Area and Forecasting Its Production: A Review. Sensors 2015, 15, 769–791. [Google Scholar] [CrossRef] [Green Version]
  2. Zhu, A.-X.; Zhao, F.-H.; Pan, H.-B.; Liu, J.-Z. Mapping Rice Paddy Distribution Using Remote Sensing by Coupling Deep Learning with Phenological Characteristics. Remote Sens. 2021, 13, 1360. [Google Scholar] [CrossRef]
  3. Setiyono, T.D.; Quicho, E.D.; Holecz, F.H.; Khan, N.I.; Romuga, G.; Maunahan, A.; Garcia, C.; Rala, A.; Raviz, J.; Collivignarelli, F.; et al. Rice yield estimation using synthetic aperture radar (SAR) and the ORYZA crop growth model: Development and application of the system in South and South-east Asian countries. Int. J. Remote Sens. 2019, 40, 8093–8124. [Google Scholar] [CrossRef]
  4. Reza, N.; Na, I.S.; Baek, S.W.; Lee, K.-H. Rice yield estimation based on K-means clustering with graph-cut segmentation using low-altitude UAV images. Biosyst. Eng. 2019, 177, 109–121. [Google Scholar] [CrossRef]
  5. Ji, Z.; Pan, Y.; Zhu, X.; Wang, J.; Li, Q. Prediction of Crop Yield Using Phenological Information Extracted from Remote Sensing Vegetation Index. Sensors 2021, 21, 1406. [Google Scholar] [CrossRef] [PubMed]
  6. Xue, J.; Su, B. Significant Remote Sensing Vegetation Indices: A Review of Developments and Applications. J. Sens. 2017, 2017, 1–17. [Google Scholar] [CrossRef] [Green Version]
  7. Marino, S.; Alvino, A. Detection of homogeneous wheat areas using multi-temporal UAS images and ground truth data analyzed by cluster analysis. Eur. J. Remote Sens. 2018, 51, 266–275. [Google Scholar] [CrossRef] [Green Version]
  8. Kogan, F.; Yang, B.; Wei, G.; Zhiyuan, P.; Xianfeng, J. Modelling corn production in China using AVHRR-based vegetation health indices. Int. J. Remote Sens. 2005, 26, 2325–2336. [Google Scholar] [CrossRef]
  9. Sun, L.; Gao, F.; Anderson, M.C.; Kustas, W.P.; Alsina, M.M.; Sanchez, L.; Sams, B.; McKee, L.; Dulaney, W.; White, W.A.; et al. Daily Mapping of 30 m LAI and NDVI for Grape Yield Prediction in California Vineyards. Remote Sens. 2017, 9, 317. [Google Scholar] [CrossRef] [Green Version]
  10. Verrelst, J.; Malenovský, Z.; van der Tol, C.; Camps-Valls, G.; Gastellu-Etchegorry, J.-P.; Lewis, P.; North, P.; Moreno, J. Quantifying Vegetation Biophysical Variables from Imaging Spectroscopy Data: A Review on Retrieval Methods. Surv. Geophys. 2019, 40, 589–629. [Google Scholar] [CrossRef] [Green Version]
  11. Parke, M.E.; Hendershott, M.C. M2, S2, K1 models of the global ocean tide on an elastic earth. Mar. Geodesy 1980, 3, 379–408. [Google Scholar] [CrossRef]
  12. Mehdaoui, R.; Anane, M. Exploitation of the red-edge bands of Sentinel 2 to improve the estimation of durum wheat yield in Grombalia region (Northeastern Tunisia). Int. J. Remote Sens. 2020, 41, 8986–9008. [Google Scholar] [CrossRef]
  13. Feng, A.; Zhou, J.; Vories, E.D.; Sudduth, K.A.; Zhang, M. Yield estimation in cotton using UAV-based multi-sensor imagery. Biosyst. Eng. 2020, 193, 101–114. [Google Scholar] [CrossRef]
  14. Zhang, M.; Zhou, J.; Sudduth, K.A.; Kitchen, N.R. Estimation of maize yield and effects of variable-rate nitrogen application using UAV-based RGB imagery. Biosyst. Eng. 2020, 189, 24–35. [Google Scholar] [CrossRef]
  15. Gong, Y.; Duan, B.; Fang, S.; Zhu, R.; Wu, X.; Ma, Y.; Peng, Y. Remote estimation of rapeseed yield with unmanned aerial vehicle (UAV) imaging and spectral mixture analysis. Plant. Methods 2018, 14, 1–14. [Google Scholar] [CrossRef] [PubMed]
  16. Swain, K.C.; Thomson, S.J.; Jayasuriya, H.P.W. Adoption of an Unmanned Helicopter for Low-Altitude Remote Sensing to Estimate Yield and Total Biomass of a Rice Crop. Trans. ASABE 2010, 53, 21–27. [Google Scholar] [CrossRef] [Green Version]
  17. Siyal, A.A.; Dempewolf, J.; Becker-Reshef, I. Rice yield estimation using Landsat ETM + Data. J. Appl. Remote Sens. 2015, 9, 095986. [Google Scholar] [CrossRef]
  18. Zhou, X.; Zheng, H.; Xu, X.; He, J.; Ge, X.; Yao, X.; Cheng, T.; Zhu, Y.; Cao, W.; Tian, Y. Predicting grain yield in rice using multi-temporal vegetation indices from UAV-based multispectral and digital imagery. ISPRS J. Photogramm. Remote Sens. 2017, 130, 246–255. [Google Scholar] [CrossRef]
  19. Marino, S.; Alvino, A. Vegetation Indices Data Clustering for Dynamic Monitoring and Classification of Wheat Yield Crop Traits. Remote Sens. 2021, 13, 541. [Google Scholar] [CrossRef]
  20. Keshava, N.; Mustard, J.F. Spectral unmixing. IEEE Signal. Process. Mag. 2002, 19, 44–57. [Google Scholar] [CrossRef]
  21. Heylen, R.; Parente, M.; Gader, P. A Review of Nonlinear Hyperspectral Unmixing Methods. IEEE J. Sel. Top. Appl. Earth Obs. Remote Sens. 2014, 7, 1844–1868. [Google Scholar] [CrossRef]
  22. Duan, B.; Fang, S.; Zhu, R.; Wu, X.; Wang, S.; Gong, Y.; Peng, Y. Remote Estimation of Rice Yield With Unmanned Aerial Vehicle (UAV) Data and Spectral Mixture Analysis. Front. Plant. Sci. 2019, 10, 204. [Google Scholar] [CrossRef] [Green Version]
  23. Dong, J.; Xiao, X. Evolution of regional to global paddy rice mapping methods: A review. ISPRS J. Photogramm. Remote Sens. 2016, 119, 214–227. [Google Scholar] [CrossRef] [Green Version]
  24. Harrell, D.L.; Tubaña, B.S.; Walker, T.W.; Phillips, S.B. Estimating Rice Grain Yield Potential Using Normalized Difference Vegetation Index. Agron. J. 2011, 103, 1717–1723. [Google Scholar] [CrossRef]
  25. Sakamoto, T.; Shibayama, M.; Kimura, A.; Takada, E. Assessment of digital camera-derived vegetation indices in quantitative monitoring of seasonal rice growth. ISPRS J. Photogramm. Remote Sens. 2011, 66, 872–882. [Google Scholar] [CrossRef]
  26. Somers, B.; Asner, G.P.; Tits, L.; Coppin, P. Endmember variability in Spectral Mixture Analysis: A review. Remote Sens. Environ. 2011, 115, 1603–1616. [Google Scholar] [CrossRef]
  27. Song, S.; Gong, W.; Zhu, B.; Huang, X. Wavelength selection and spectral discrimination for paddy rice, with laboratory measurements of hyperspectral leaf reflectance. ISPRS J. Photogramm. Remote Sens. 2011, 66, 672–682. [Google Scholar] [CrossRef]
  28. Feng, Z.; Qin, T.; Du, X.; Sheng, F.; Li, C. Effects of irrigation regime and rice variety on greenhouse gas emissions and grain yields from paddy fields in central China. Agric. Water Manag. 2021, 250, 106830. [Google Scholar] [CrossRef]
  29. Sun, Q.; Jiao, Q.; Qian, X.; Liu, L.; Liu, X.; Dai, H. Improving the Retrieval of Crop Canopy Chlorophyll Content Using Vegetation Index Combinations. Remote Sens. 2021, 13, 470. [Google Scholar] [CrossRef]
  30. Ray, T.W.; Murray, B.C. Nonlinear spectral mixing in desert vegetation. Remote Sens. Environ. 1996, 55, 59–64. [Google Scholar] [CrossRef]
  31. Thenkabail, P.S.; Smith, R.B.; De Pauw, E. Hyperspectral Vegetation Indices and Their Relationships with Agricultural Crop Characteristics. Remote Sens. Environ. 2000, 71, 158–182. [Google Scholar] [CrossRef]
  32. Boardman, J. Automating Spectral Unmixing of AVIRIS Data Using Convex Geometry Concepts. In Proceedings of the 4th Annual JPL Airborne Geoscience Workshop, Arlington, VA, USA, 25–29 October 1993; Volume 1, pp. 11–14. [Google Scholar]
  33. Winter, M.E. N-FINDR: An algorithm for fast autonomous spectral end-member determination in hyperspectral data. In Proceedings of the Imaging Spectrometry V. International Society for Optics and Photonics, Denver, CO, USA, 18–23 July 1999; Volume 3753, pp. 266–275. [Google Scholar] [CrossRef]
  34. Nascimento, J.; Bioucas-Dias, J. Vertex component analysis: A fast algorithm to unmix hyperspectral data. IEEE Trans. Geosci. Remote Sens. 2005, 43, 898–910. [Google Scholar] [CrossRef] [Green Version]
  35. Cheng, X.; Cai, Z.; Li, J.; Wen, M.; Wang, Y.; Zeng, D. A spatial-spectral clustering-based algorithm for endmember extraction and hyperspectral unmixing. Int. J. Remote Sens. 2021, 42, 1948–1972. [Google Scholar] [CrossRef]
  36. Cho, M.A.; Debba, P.; Mathieu, R.; Naidoo, L.; Van Aardt, J.; Asner, G.P. Improving Discrimination of Savanna Tree Species Through a Multiple-Endmember Spectral Angle Mapper Approach: Canopy-Level Analysis. IEEE Trans. Geosci. Remote Sens. 2010, 48, 4133–4142. [Google Scholar] [CrossRef]
  37. Murphy, R.J.; Monteiro, S.T.; Schneider, S. Evaluating Classification Techniques for Mapping Vertical Geology Using Field-Based Hyperspectral Sensors. IEEE Trans. Geosci. Remote Sens. 2012, 50, 3066–3080. [Google Scholar] [CrossRef]
  38. Bioucas-Dias, J.; Plaza, A.; Dobigeon, N.; Parente, M.; Du, Q.; Gader, P.; Chanussot, J. Hyperspectral Unmixing Overview: Geometrical, Statistical, and Sparse Regression-Based Approaches. IEEE J. Sel. Top. Appl. Earth Obs. Remote Sens. 2012, 5, 354–379. [Google Scholar] [CrossRef] [Green Version]
  39. Zhang, L.; Li, D.; Tong, Q.; Zheng, L. Study of the spectral mixture model of soil and vegetation in PoYang Lake area, China. Int. J. Remote Sens. 1998, 19, 2077–2084. [Google Scholar] [CrossRef]
  40. Halimi, A.; Altmann, Y.; Dobigeon, N.; Tourneret, J.-Y. Nonlinear Unmixing of Hyperspectral Images Using a Generalized Bilinear Model. IEEE Trans. Geosci. Remote Sens. 2011, 49, 4153–4162. [Google Scholar] [CrossRef] [Green Version]
  41. Niranjani, K.; Vani, K. Unsupervised Nonlinear Spectral Unmixing of Satellite Images Using the Modified Bilinear Model. J. Indian Soc. Remote Sens. 2018, 47, 573–584. [Google Scholar] [CrossRef]
  42. Gitelson, A.A.; Viña, A.; Ciganda, V.; Rundquist, D.C.; Arkebauer, T.J. Remote estimation of canopy chlorophyll content in crops. Geophys. Res. Lett. 2005, 32, 93–114. [Google Scholar] [CrossRef] [Green Version]
  43. Rouse, J.W.; Haas, R.H.; Schell, J.A.; Deering, D.W. Monitoring vegetation system in the great plains with ERTS. In Proceedings of the Third Earth Resources Technology Satellite-1 Symposium, Greenbelt, MD, USA, 1 January 1974; Volume 1, pp. 3010–3017. [Google Scholar]
  44. Gitelson, A.A.; Kaufman, Y.J.; Merzlyak, M.N. Use of a green channel in remote sensing of global vegetation from EOS-MODIS. Remote Sens. Environ. 1996, 58, 289–298. [Google Scholar] [CrossRef]
  45. Fitzgerald, G.; Rodriguez, D.; O’Leary, G. Measuring and predicting canopy nitrogen nutrition in wheat using a spectral index—The canopy chlorophyll content index (CCCI). Field Crop. Res. 2010, 116, 318–324. [Google Scholar] [CrossRef]
  46. Dash, J.; Curran, P.J. The MERIS terrestrial chlorophyll index. Int. J. Remote Sens. 2004, 25, 5403–5413. [Google Scholar] [CrossRef]
  47. Gitelson, A.A.; Kaufman, Y.J.; Stark, R.; Rundquist, D. Novel algorithms for remote estimation of vegetation fraction. Remote Sens. Environ. 2002, 80, 76–87. [Google Scholar] [CrossRef] [Green Version]
  48. Gamon, J.; Penuelas, J.; Field, C. A narrow-waveband spectral index that tracks diurnal changes in photosynthetic efficiency. Remote Sens. Environ. 1992, 41, 35–44. [Google Scholar] [CrossRef]
  49. Gitelson, A.A. Wide Dynamic Range Vegetation Index for Remote Quantification of Biophysical Characteristics of Vegetation. J. Plant. Physiol. 2004, 161, 165–173. [Google Scholar] [CrossRef] [Green Version]
  50. Steven, M.D. The Sensitivity of the OSAVI Vegetation Index to Observational Parameters. Remote Sens. Environ. 1998, 63, 49–60. [Google Scholar] [CrossRef]
  51. Liu, H.Q.; Huete, A. A feedback based modification of the NDVI to minimize canopy background and atmospheric noise. IEEE Trans. Geosci. Remote Sens. 1995, 33, 457–465. [Google Scholar] [CrossRef]
  52. Jiang, Z.; Huete, A.R.; Didan, K.; Miura, T. Development of a two-band enhanced vegetation index without a blue band. Remote Sens. Environ. 2008, 112, 3833–3845. [Google Scholar] [CrossRef]
  53. Boardman, J.W.; Kruse, F.A.; Green, R.O. Mapping target signatures via partial unmixing of AVIRIS data. In In Proceedings of the Summaries of the Fifth JPL Airborne Earth Science Workshop, Pasadena, CA, USA, 23 January 1995; Volume 1, pp. 23–26. [Google Scholar]
  54. Li, C.; Liu, Y.; Cheng, J.; Song, R.; Peng, H.; Chen, Q.; Chen, X. Hyperspectral Unmixing with Bandwise Generalized Bilinear Model. Remote Sens. 2018, 10, 1600. [Google Scholar] [CrossRef] [Green Version]
  55. Iordache, M.-D.; Bioucas-Dias, J.; Plaza, A. Sparse Unmixing of Hyperspectral Data. IEEE Trans. Geosci. Remote Sens. 2011, 49, 2014–2039. [Google Scholar] [CrossRef] [Green Version]
  56. Fan, H.; Li, C.; Guo, Y.; Kuang, G.; Ma, J. Spatial–Spectral Total Variation Regularized Low-Rank Tensor Decomposition for Hyperspectral Image Denoising. IEEE Trans. Geosci. Remote Sens. 2018, 56, 6196–6213. [Google Scholar] [CrossRef]
  57. Fielding, A.H.; Bell, J.F. A review of methods for the assessment of prediction errors in conservation presence/absence models. Environ. Conserv. 1997, 24, 38–49. [Google Scholar] [CrossRef]
  58. Kanke, Y.; Tubaña, B.; Dalen, M.; Harrell, D. Evaluation of red and red-edge reflectance-based vegetation indices for rice biomass and grain yield prediction models in paddy fields. Precis. Agric. 2016, 17, 507–530. [Google Scholar] [CrossRef]
  59. Darvishsefat, A.A.; Abbasi, M.; Schaepman, M.E. Evaluation of Spectral Reflectance of Seven Iranian Rice Varieties Canopies. J. Agric. Sci. Technol.-Iran. 2011, 13, 1091–1104. [Google Scholar] [CrossRef]
  60. Theseira, M.A.; Thomas, G.; Sannier, C.A.D. An evaluation of spectral mixture modelling applied to a semi-arid environment. Int. J. Remote Sens. 2002, 23, 687–700. [Google Scholar] [CrossRef]
  61. Wang, F.; Wang, F.; Zhang, Y.; Hu, J.; Huang, J.; Xie, J. Rice Yield Estimation Using Parcel-Level Relative Spectral Variables From UAV-Based Hyperspectral Imagery. Front. Plant. Sci. 2019, 10, 453. [Google Scholar] [CrossRef] [Green Version]
  62. Zhang, J.; Han, C.; Li, D. New Vegetation Index Monitoring Rice Chlorophyll Concentration Using Leaf Transmittance Spectra. Sens. Lett. 2010, 8, 16–21. [Google Scholar] [CrossRef]
  63. Heinz, D.; Chang, C.-I. Fully constrained least squares linear spectral mixture analysis method for material quantification in hyperspectral imagery. IEEE Trans. Geosci. Remote Sens. 2001, 39, 529–545. [Google Scholar] [CrossRef] [Green Version]
  64. Chen, X.; Vierling, L. Spectral mixture analyses of hyperspectral data acquired using a tethered balloon. Remote Sens. Environ. 2006, 103, 338–350. [Google Scholar] [CrossRef]
  65. Penuelas, J.; Filella, I. Visible and near-infrared reflectance techniques for diagnosing plant physiological status. Trends Plant Sci. 1998, 3, 151–156. [Google Scholar] [CrossRef]
  66. Venancio, L.P.; Mantovani, E.C.; Amaral, C.H.D.; Neale, C.M.U.; Gonçalves, I.Z.; Filgueiras, R.; Eugenio, F.C. Potential of using spectral vegetation indices for corn green biomass estimation based on their relationship with the photosynthetic vegetation sub-pixel fraction. Agric. Water Manag. 2020, 236, 106155. [Google Scholar] [CrossRef]
  67. Kawamura, K.; Ikeura, H.; Phongchanmaixay, S.; Khanthavong, P. Canopy Hyperspectral Sensing of Paddy Fields at the Booting Stage and PLS Regression can Assess Grain Yield. Remote Sens. 2018, 10, 1249. [Google Scholar] [CrossRef] [Green Version]
Figure 1. The field images of different rice varieties at heading stage: (a) Longyou-518; (b) Tianlong-660; (c) Liangyou-1128; and (d) unnamed cultivar.
Remotesensing 13 02190 g001
Figure 2. The location of the study site and the regions of interest in each plot. (a,b) Study Area 1 Lingshui and (c,d) Study Area 2 Wuxue.
Remotesensing 13 02190 g002
Figure 3. The illustration of (a) mini-MCA 12, (b) mini-MCA 6, and (c) UAV.
Remotesensing 13 02190 g003
Figure 4. Schematic representation of the multilayer characteristics of paddy rice spectra.
Remotesensing 13 02190 g004
Figure 5. The procedure of PPI: (a) Masking; (b) setting threshold; (c) enumerating pixels in n-Dimensional Visualizer; and (d) outputting endmember spectra.
Remotesensing 13 02190 g005
Figure 6. The abundance images of (a) foreground and (b) background.
Remotesensing 13 02190 g006
Figure 7. The sketch images of the six kinds of delineating sample strategies in the n-Dimensional Visualizer. (a) One foreground and one background; (b) two foregrounds and one background; (c) three foregrounds and one background; (d) four foregrounds and one background; (e) five foregrounds and one background; and (f) six foregrounds and one background.
Remotesensing 13 02190 g007
Figure 8. The output endmember spectra of the six strategies. (a) One foreground and one background; (b) two foregrounds and one background; (c) three foregrounds and one background; (d) four foregrounds and one background; (e) five foregrounds and one background; and (f) six foregrounds and one background.
Remotesensing 13 02190 g008
Figure 9. The abundance images of (ae) five foreground and (f) one background endmembers of Study Area 1.
Remotesensing 13 02190 g009
Figure 10. The abundance images of (ad) five foreground and (e) one background endmembers of Study Area 2.
Remotesensing 13 02190 g010
Figure 11. The R2 and RMSE of yield with VI, VI × A, VIE × A, and (VIE × A + VIF × B) of (a) Study Area 1 Lingshui and (b) Study Area 2 Wuxue at heading stage.
Remotesensing 13 02190 g011
Figure 12. The linear regression results of optimal indices. (a) Estimated yield vs. observed yield in Study Area 1 Lingshui, and (b) estimated yield vs. observed yield in Study Area 2 Wuxue.
Remotesensing 13 02190 g012
Figure 13. The linear regression results of yield and the four products of VARI in Study Area 2 Wuxue.
Remotesensing 13 02190 g013
Table 1. Vegetation indices tested in this study.
Vegetation IndicesFormulaReference
Red-edge Chlorophyll Index (CIrededge)ρ800720 − 1[42]
Green Chlorophyll Index (CIgreen)ρ800550 − 1[42]
Normalized Difference Vegetation Index (NDVI)800 − ρ670)/(ρ800 + ρ670)[43]
Green Normalized Difference Vegetation Index (GNDVI)800 − ρ550)/(ρ800 + ρ550)[44]
Normalized Difference Red Edge Vegetation Index (NDRE)800 − ρ720)/(ρ800 + ρ720)[45]
MERIS Terrestrial Chlorophyll Index (MTCI)800 − ρ720)/(ρ720 − ρ670)[46]
Visible Atmospherically Resistant Index (VARI)550 − ρ670)/(ρ550 + ρ670)[47]
Photochemical Reflectance Index (PRI)520 − ρ570)/(ρ520 + ρ570)[48]
Wide Dynamic Range Vegetation Index (WDRVI)(α × ρ800 − ρ670)/(α × ρ800 + ρ670) α = 0.2[49]
Optimized Soil Adjusted Vegetation Index (OSAVI)(1 + 0.16) (ρ800 − ρ720)/(ρ800 + ρ720 + 0.16)[50]
Enhanced Vegetation Index (EVI)2.5(ρ800 − ρ670)/(ρ800 + 6ρ670 − 7.5ρ490 + 1)[51]
Two-band Enhanced Vegetation Index (EVI2)2.5(ρ800 − ρ670)/(ρ800 + 2.4ρ670 + 1)[52]
Table 2. The Pearson correlation coefficients of VI with yield at booting stage and heading stage.
Growth StageStudy Area 1 (Lingshui)Study Area 2 (Wuxue)
Booting StageHeading StageBooting StageHeading Stage
CIrededge0.4040.2960.7470.654
CIgreen0.5150.3080.7000.473
NDVI0.4860.3360.7410.661
GNDVI0.5270.3260.7460.645
NDRE0.4010.2880.7450.684
MTCI0.4040.2880.7470.663
VARI0.4820.2990.497−0.385
PRI−0.275−0.263--
WDRVI0.4860.3270.7370.648
OSAVI0.4690.2590.7340.710
EVI0.258−0.0190.6510.587
EVI20.3490.0160.6600.631
Table 3. The Pearson correlation coefficients of yield and the foreground abundances and the accuracy of NU-BGBM under different inputs.
Number of Foreground EndmemberStudy Area 1 (Lingshui)Study Area 2 (Wuxue)
Pearson Correlation CoefficientsRMSE
(kg/m2)
Pearson Correlation CoefficientsRMSE
(kg/m2)
One−0.0980.01070.691 0.0288
Two0.2080.00930.759 0.0276
Three0.1710.00910.756 0.0280
Four0.1910.00900.760 0.0271
Five0.4740.00870.752 0.0280
Six0.1790.0088--
Table 4. The Pearson correlation coefficients of yield with VI, VI × A, VIE × A, and (VIE × A + VIF × B) at heading stage.
Study Area 1 (Lingshui)Study Area 2 (Wuxue)
VIVI × AVIE × AVIE × A + VIF × BVIVI × AVIE × AVIE × A + VIF × B
CIrededge0.2960.3460.4900.5400.6540.6700.7550.696
CIgreen0.3080.3450.4370.5010.4730.4970.6320.532
NDVI0.3360.4530.4850.5320.6610.7420.7600.748
GNDVI0.3260.4420.5030.5470.6450.7340.7590.746
NDRE0.2880.3830.5160.5580.6840.7120.7590.743
MTCI0.2880.3490.5010.5470.6630.6810.7590.710
VARI0.2990.3560.5000.530−0.385−0.1140.6680.660
PRI−0.263−0.317−0.406−0.438----
WDRVI0.3270.3930.5080.5460.6480.6840.7580.743
OSAVI0.2590.3630.4990.5480.7100.7190.7590.749
EVI−0.0190.2480.2900.3390.5870.7350.7410.740
EVI20.0160.2720.3180.3670.6310.7370.7230.725
Table 5. The Pearson correlation coefficients of yield with VI and VI × A at heading stage.
Study Area 1 (Lingshui)Study Area 2 (Wuxue)
VIVI × AVIVI × A
CIrededge0.2960.252 0.6540.677
CIgreen0.3080.284 0.4730.504
NDVI0.3360.069 0.6610.612
GNDVI0.3260.150 0.6450.737
NDRE0.2880.196 0.6840.714
MTCI0.2880.239 0.6630.689
VARI0.2990.254 −0.385−0.298
PRI−0.263−0.262 --
WDRVI0.3270.224 0.6480.668
OSAVI0.2590.154 0.7100.712
EVI−0.019−0.037 0.5870.538
EVI20.016−0.020 0.6310.568
Publisher’s Note: MDPI stays neutral with regard to jurisdictional claims in published maps and institutional affiliations.

