Article

Sensitivity of C-Band SAR Polarimetric Variables to the Directionality of Surface Roughness Parameters

Department of Geography, Environment and Geomatics, University of Guelph, Guelph, ON N1G 2W1, Canada
*
Author to whom correspondence should be addressed.
Remote Sens. 2021, 13(11), 2210; https://0-doi-org.brum.beds.ac.uk/10.3390/rs13112210
Submission received: 30 January 2021 / Revised: 24 May 2021 / Accepted: 31 May 2021 / Published: 5 June 2021

Abstract

:
Surface roughness is an important factor in many soil moisture retrieval models. Therefore, any mischaracterization of surface roughness parameters (root mean square height, RMSH, and correlation length, ʅ) may result in unreliable predictions and soil moisture estimations. In many environments, but particularly in agricultural settings, surface roughness parameters may show different behaviours with respect to the orientation or azimuth. Consequently, the relationship between SAR polarimetric variables and surface roughness parameters may vary depending on measurement orientation. Generally, roughness obtained for many SAR-based studies is estimated using pin profilers that may, or may not, be collected with careful attention to orientation to the satellite look angle. In this study, we characterized surface roughness parameters in multi-azimuth mode using a terrestrial laser scanner (TLS). We characterized the surface roughness parameters in different orientations and then examined the sensitivity between polarimetric variables and surface roughness parameters; further, we compared these results to roughness profiles obtained using traditional pin profilers. The results showed that the polarimetric variables were more sensitive to the surface roughness parameters at higher incidence angles (θ). Moreover, when surface roughness measurements were conducted at the look angle of RADARSAT-2, more significant correlations were observed between polarimetric variables and surface roughness parameters. Our results also indicated that TLS can represent more reliable results than pin profiler in the measurement of the surface roughness parameters.

1. Introduction

The characterization of soil surface roughness is a significant issue for the modelling of surface and near-surface water flow, sediment and nutrient transport, and hydrological erosion, particularly in agricultural systems. In the agricultural context, the parameterization of surface roughness plays an important role in soil moisture retrieval using synthetic aperture radar (SAR). Interpretation of SAR backscatter, particularly from longer wavelengths in the C or L band, permits high-resolution retrieval of soil moisture through characterization of the transmitted energy, or backscatter, from the surface. However, retrieval approaches have been challenging due to the complicating factors of surface roughness and vegetation [1,2]. The contribution of surface roughness to the soil moisture estimation is assessed through the backscattering models, which are usually used to analyze the relationship between surface soil moisture and SAR backscatters. It is well known that the SAR backscattered signal primarily depends on the radar parameters (wavelength, polarization, and incidence angle [θ]) and surface parameters (dielectric constant or soil moisture, vegetation, and roughness) [3]. In some cases, surface roughness has a stronger impact on radar backscatter than that of soil moisture [4] and it is often the most important factor contributing to SAR backscatter response at higher incidence angles and in bare soils [4,5]. Surface roughness may also present challenges for downscaling passive microwave soil moisture retrievals using a much higher resolution of SAR backscatter data [6,7] as the sensitivity of backscatter to surface roughness is different when observed from passive microwave satellites or when using combinations of active (radar) and passive (radiometer) systems, operating at constant or various incidence angles. Therefore, for the improved estimation of soil moisture, the accurate characterization of surface roughness is of great importance [8,9,10], and mischaracterization may cause unreliable results in the estimation of soil moisture conditions or inaccurate characterization of agricultural management.
For the application of SAR products, surface roughness is characterized using the two most common parameters: the root mean square height (RMSH) and correlation length (ʅ). RMSH, which is also defined as the standard deviation of the surface height, describes the vertical variation in surface elevation. While RMSH specifies the vertical scale of the roughness, correlation length represents the horizontal scale [11] and is identified as the maximum distance over which the correlation exists between profile surface heights [12]. In other words, ʅ shows the uniformity of profile surface heights [13]. A large ʅ corresponds to more consistent heights and patterns, while small ʅ corresponds to more fluctuations in surface height in space [14].
RMSH and correlation length can be measured using a range of manual or in situ techniques and remote sensing measurements. The most common in situ technique to measure the parameters of surface roughness is the use of a pin profiler [9,15,16,17,18]. This technique is simple to set up in the field. Moreover, it has the capability of joining 1 m profiles to create a longer profile [19]. However, several limitations are associated with the application of pin profiler in the field. The main disadvantage of the method is that the pins can impact the surface under observation [20,21,22]. Data collection and processing are time-consuming [13,23] and labour-intensive to obtain in the field [24]. Moreover, it is difficult to use this method across large areas, particularly in the fields with row soil structures created by cultivation [25]. Also, the measurements are collected along the one-dimensional and limited-length profile (typically 1 m; although often joined together for a longer profile) [21]. This inconsistency in the characterization of surface roughness parameters can result in significant errors and unreliable results in soil moisture retrievals [26].
Terrestrial light detection and ranging (LiDAR) offers a potential solution for some of the above limitations [23,24]. LiDAR technology uses eye-safe laser beams to produce high-resolution and three-dimensional surface representations of surveyed environments by analyzing the two-way travel time of the reflected light from the object [27,28]. Terrestrial laser scanning (TLS) is a common method for LiDAR data collection. The LiDAR unit is typically mounted on tripods and used to survey the surface with spatial resolutions from several millimetres up to several centimetres [11]. The application of LiDAR allows for the fast operation speeds and the cost-effective assessment of surface structure at the landscape scale, this technology also provides a dense measurement of an object. However, issues of shadowing, which refers to the non-detection of areas due to the shadow effect [29]; miscalculation of off-terrain objects [30]; and processing times for large high-resolution datasets [31] may present mathematical and computational challenges in the TLS approaches.
To retrieve surface roughness and soil moisture parameters from SAR data, polarimetric scattering models [32], retrieval models [33], or sensitivity analyses [34] have been applied to understand or characterize the microwave scattering properties of a target. The intensity or magnitude of radar backscatter is dependent on how the radar energy interacts with the surface. Generally, rougher surfaces scatter more of the incident energy away from the specular direction than a smoother surface would, resulting in a higher backscatter coefficient [24]. Throughout the literature evaluated, surface roughness measurements and, therefore, the sensitivity analysis of surface roughness parameters to radar polarimetric variables have been conducted within a variety of specific directions or azimuths. For example, [34,35] evaluated the sensitivity of C-band SAR polarimetric variables to surface roughness measured at look angle. Rakotoarivony et al. [36] investigated radar backscattering responses to anisotropic surfaces using electromagnetic models (IEM and Kong’s model) over bare agricultural fields and evaluated the sensitivity of radar measurements to surface parameters (soil moisture and surface roughness) measured at the radar look angle and measured parallel and perpendicular to the row direction. In other studies, such as [5], the measured roughness parameters were measured either parallel or perpendicular to the field furrows for the retrieving of surface soil moisture using Sentinel-1 SAR data based on calibrated IEM and Dubois models. Similarly, [37] evaluated the effect of surface roughness sample size (20 profiles 1-m long per 10 fields) on SAR backscattering in agricultural soils with different tillage treatments. Surface roughness measurements were performed throughout the fields parallel to the tillage direction. In other studies, the authors have not mentioned in which direction surface roughness was measured [38,39,40]. A common characteristic of these previous studies is that surface roughness measurements were conducted using pin profilers, restricting roughness measurements to specific azimuths. What is unknown is the sensitivity of radar parameters to surface roughness with respect to the orientation or azimuth in which it was collected. Given that surface roughness is a key factor in many soil moisture retrieval models and is likely very sensitive to the profile orientation [13], the overall objective of this study was to analyze the sensitivity of SAR polarimetric variables to the surface roughness parameters at four different incidence angles when the surface roughness measurements were obtained at different azimuths.
The specific objectives of the study were to:
(1)
Identify which polarimetric variables are more sensitive with respect to different incidence angles and various orientations of surface roughness measurements;
(2)
Evaluate the characterization of surface roughness by pin profiler and TLS and assess how they may contribute to the mischaracterization of surface roughness.

2. Materials and Methods

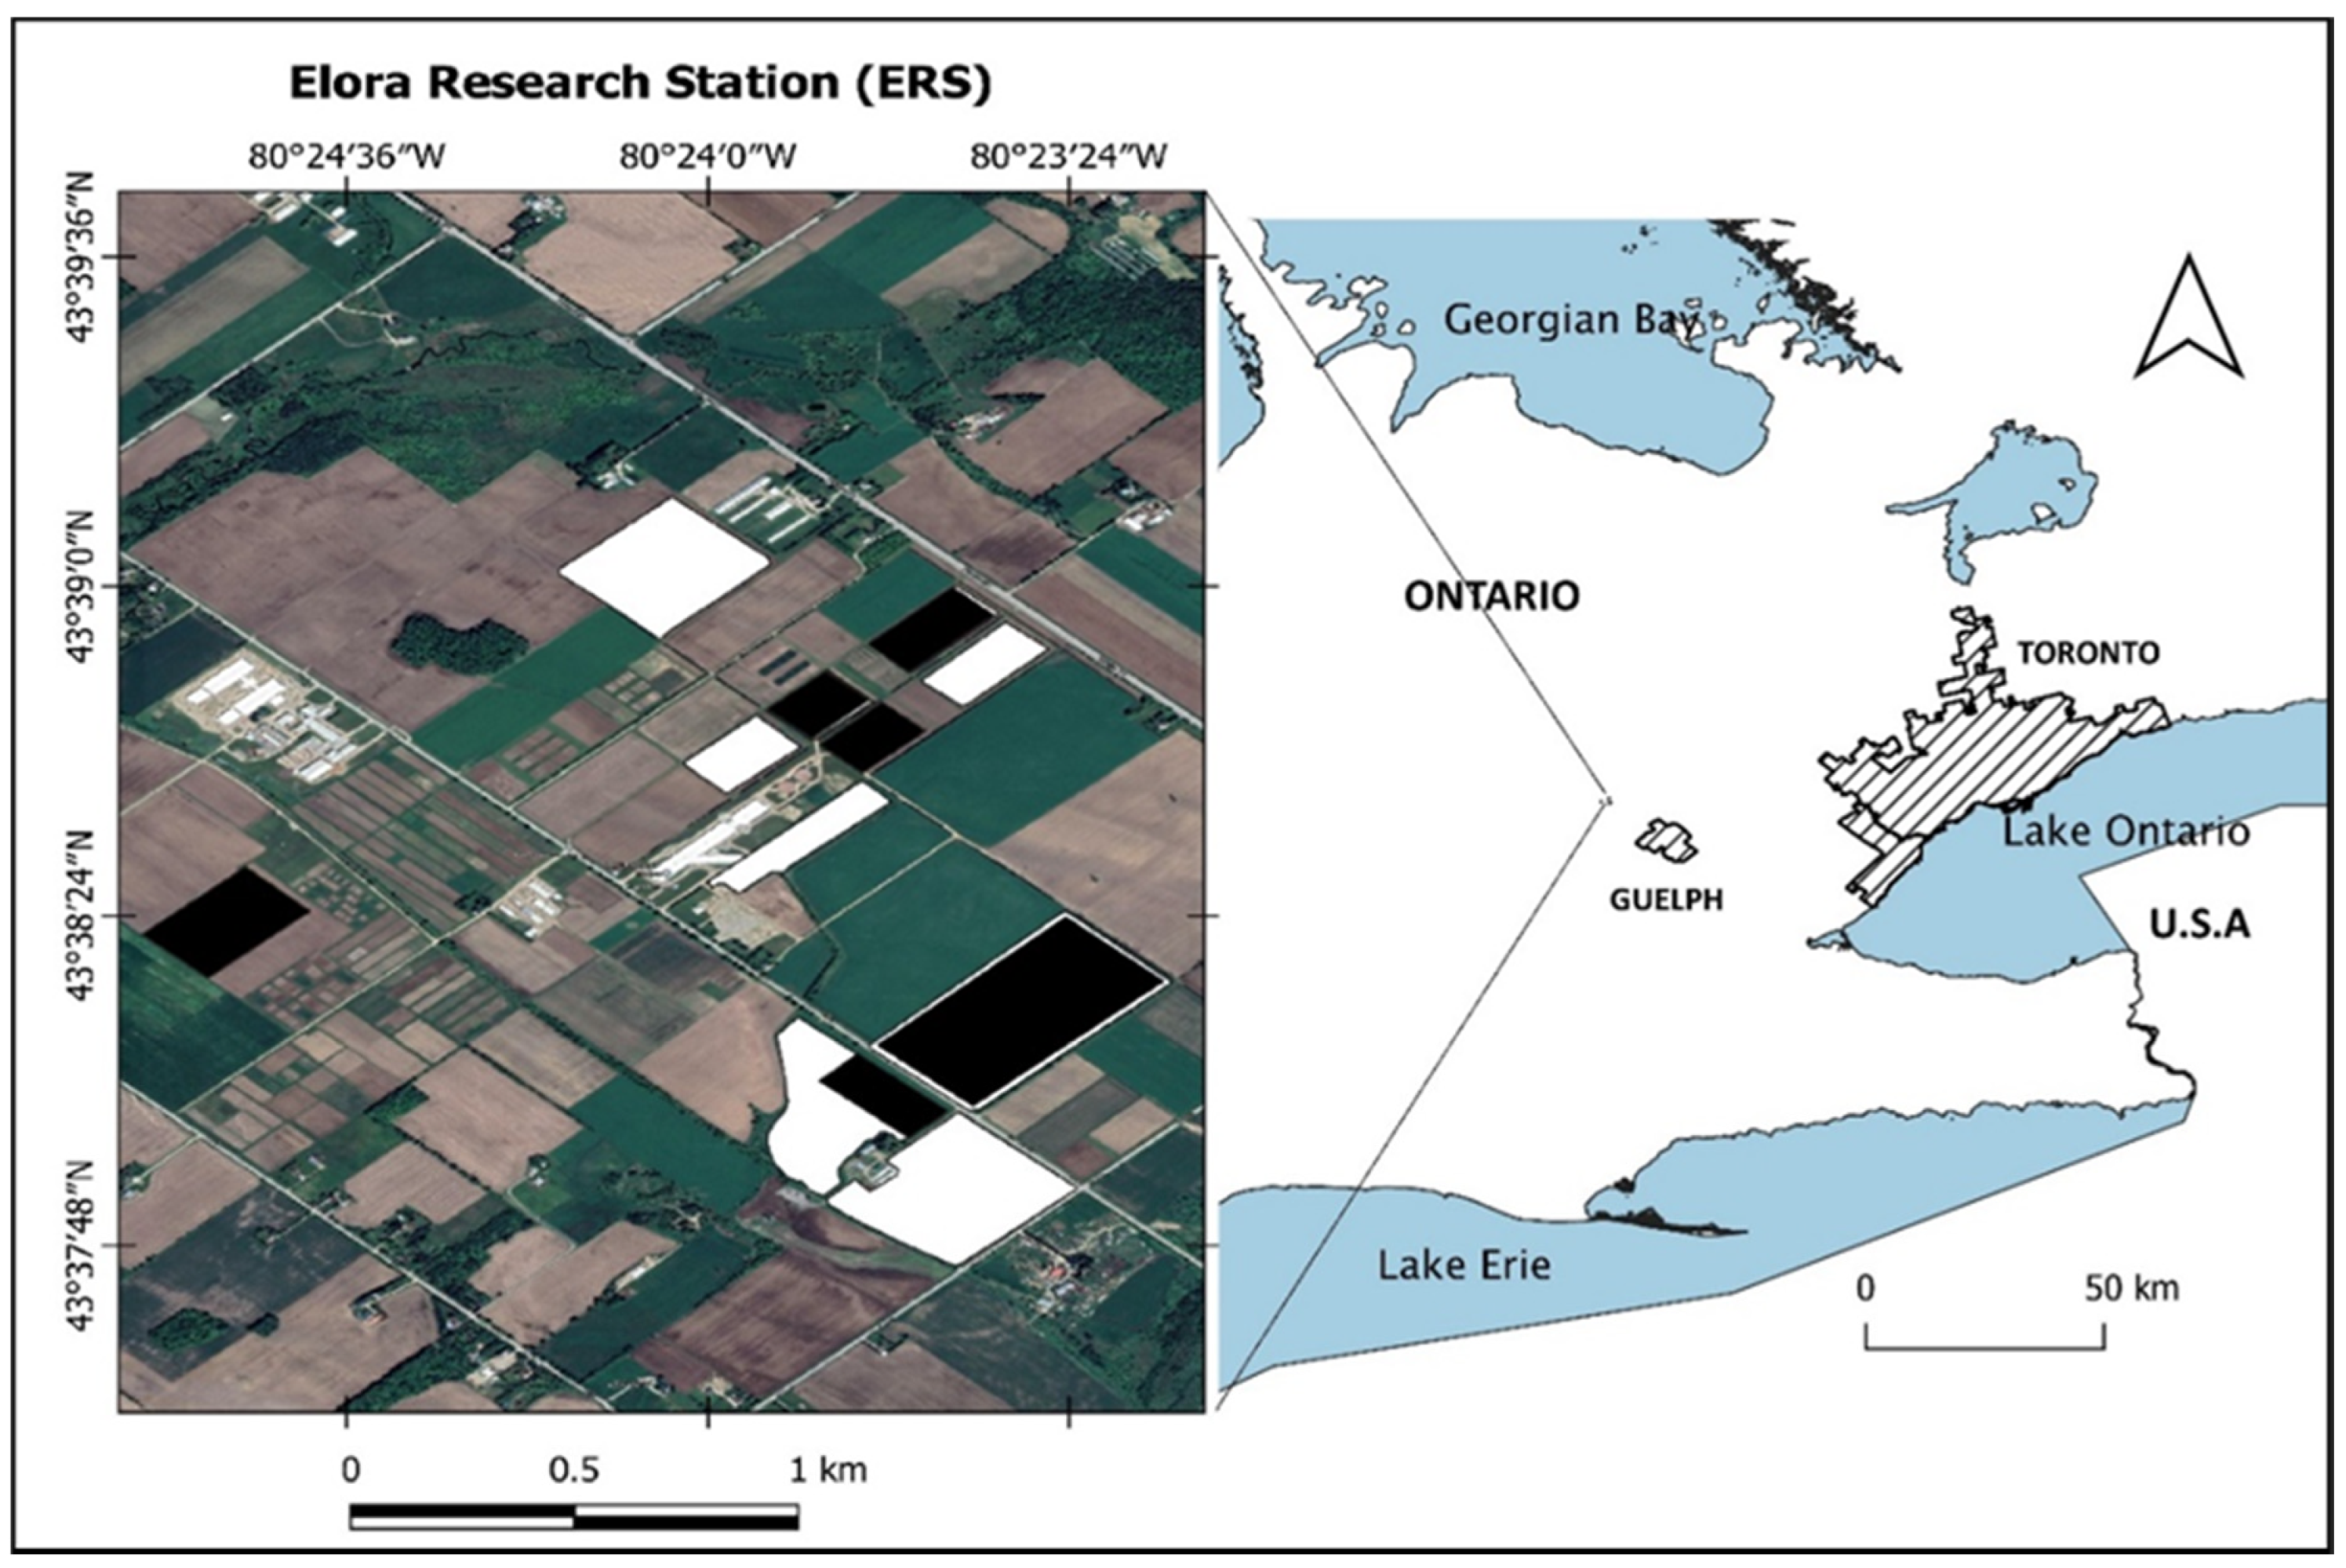
2.1. Site Description

The study included a number of agricultural fields within the Elora Research Station (ERS). The ERS is located south of the village of Elora (49°38′ N, 80°24′ W), Ontario, Canada and is operated by the University of Guelph (Figure 1).
The soil of the area belongs to the Luvisolic order, which is gray-brown soil typically developed under deciduous or mixed forest vegetation according to the Canadian System of Soil Classification [41]. Among the approximately 650 hectares of the Elora station, numerous fields are under cultivation for crop research. The major crops include cereals (corn, wheat, and barley), oilseeds (soybeans and canola), and edible beans (white and coloured). However, for this study, we focused on the non-growing season with field measurements conducted in May and November 2015. The field data were collected as near to coincident with RADARSAT-2 acquisition as possible (generally within a maximum of three days of the overpass). Fields were selected based on the presence of little or no vegetation/residue cover and were selected to provide a range of roughness variations in tillage conditions. The aim was to eliminate the effect of vegetation on the parameterization of surface roughness since the ability of LiDAR to scan the soil surface is hindered by vegetation. Moreover, in the presence of crops, the pin profiler mistakenly measures vegetation as surface height, affecting the comparison of obtained surface roughness parameters by LiDAR and the pin profiler. Please refer to Chabot et al. [13] for field photos taken during the experiment (particularly Figure 2 in [13]).

2.2. Surface Roughness Data Collection and Processing

For each field, three scans with an approximate distance of 25 m were taken using TLS. The LiDAR point clouds were taken using a Leica C10 ScanStation (Leica, Heerbrugg, Switzerland). The scans were collected using a full 360° horizontal and 270° vertical field of view. Within the range of 1–50 m, the collected points have 6 mm positional accuracy and a 4 mm distance accuracy, as reported in [30]. The three scans were co-registered using tie-points to provide a larger sampling region. The TLS was conducted before the pin profiler to avoid disturbing the surface due to the compression effect by the pin profiler and disruption by people accessing the field. Accurate geographic coordinates were captured for each scan using a real-time kinematic global positioning system (GPS). LiDAR point clouds were analyzed in a plug-in tool named Roughness from Point Cloud Profiles ([13]; RPCP) and implemented in Whitebox Geospatial Analysis Tools (GAT) software version 3.4.0 [42] to extract the RMSH and ʅ in interquartile ranges (IQRs) for each field. Within the RPCP, the distance between profiles and profile sampling were set at 0.5 m and 1 cm, respectively, to match pin profiler measurements. The de-trending polynomial was applied to remove the effects of a slope from the roughness measurements, and the roughness statistic was derived in multi-azimuth mode, to collect measurements along profiles every 0.5° from 0° to 360° azimuth.
Pin profiler measurements were taken in the centre of three TLS scans using a 1-m pin profiler (with pins 1-cm apart) in the east–west and north–south directions as described by Chabot et al. [13]. The surface’s profile was recorded with a camera mounted on the pin profiler and then processed using a MATLAB graphical user interface to extract surface elevation points and calculate roughness statistics [13]. To obtain RMSH and correlation length statistics from the pin profiler, three 1 m profiles in each azimuth were added together (e.g., 6 profiles taken per field).

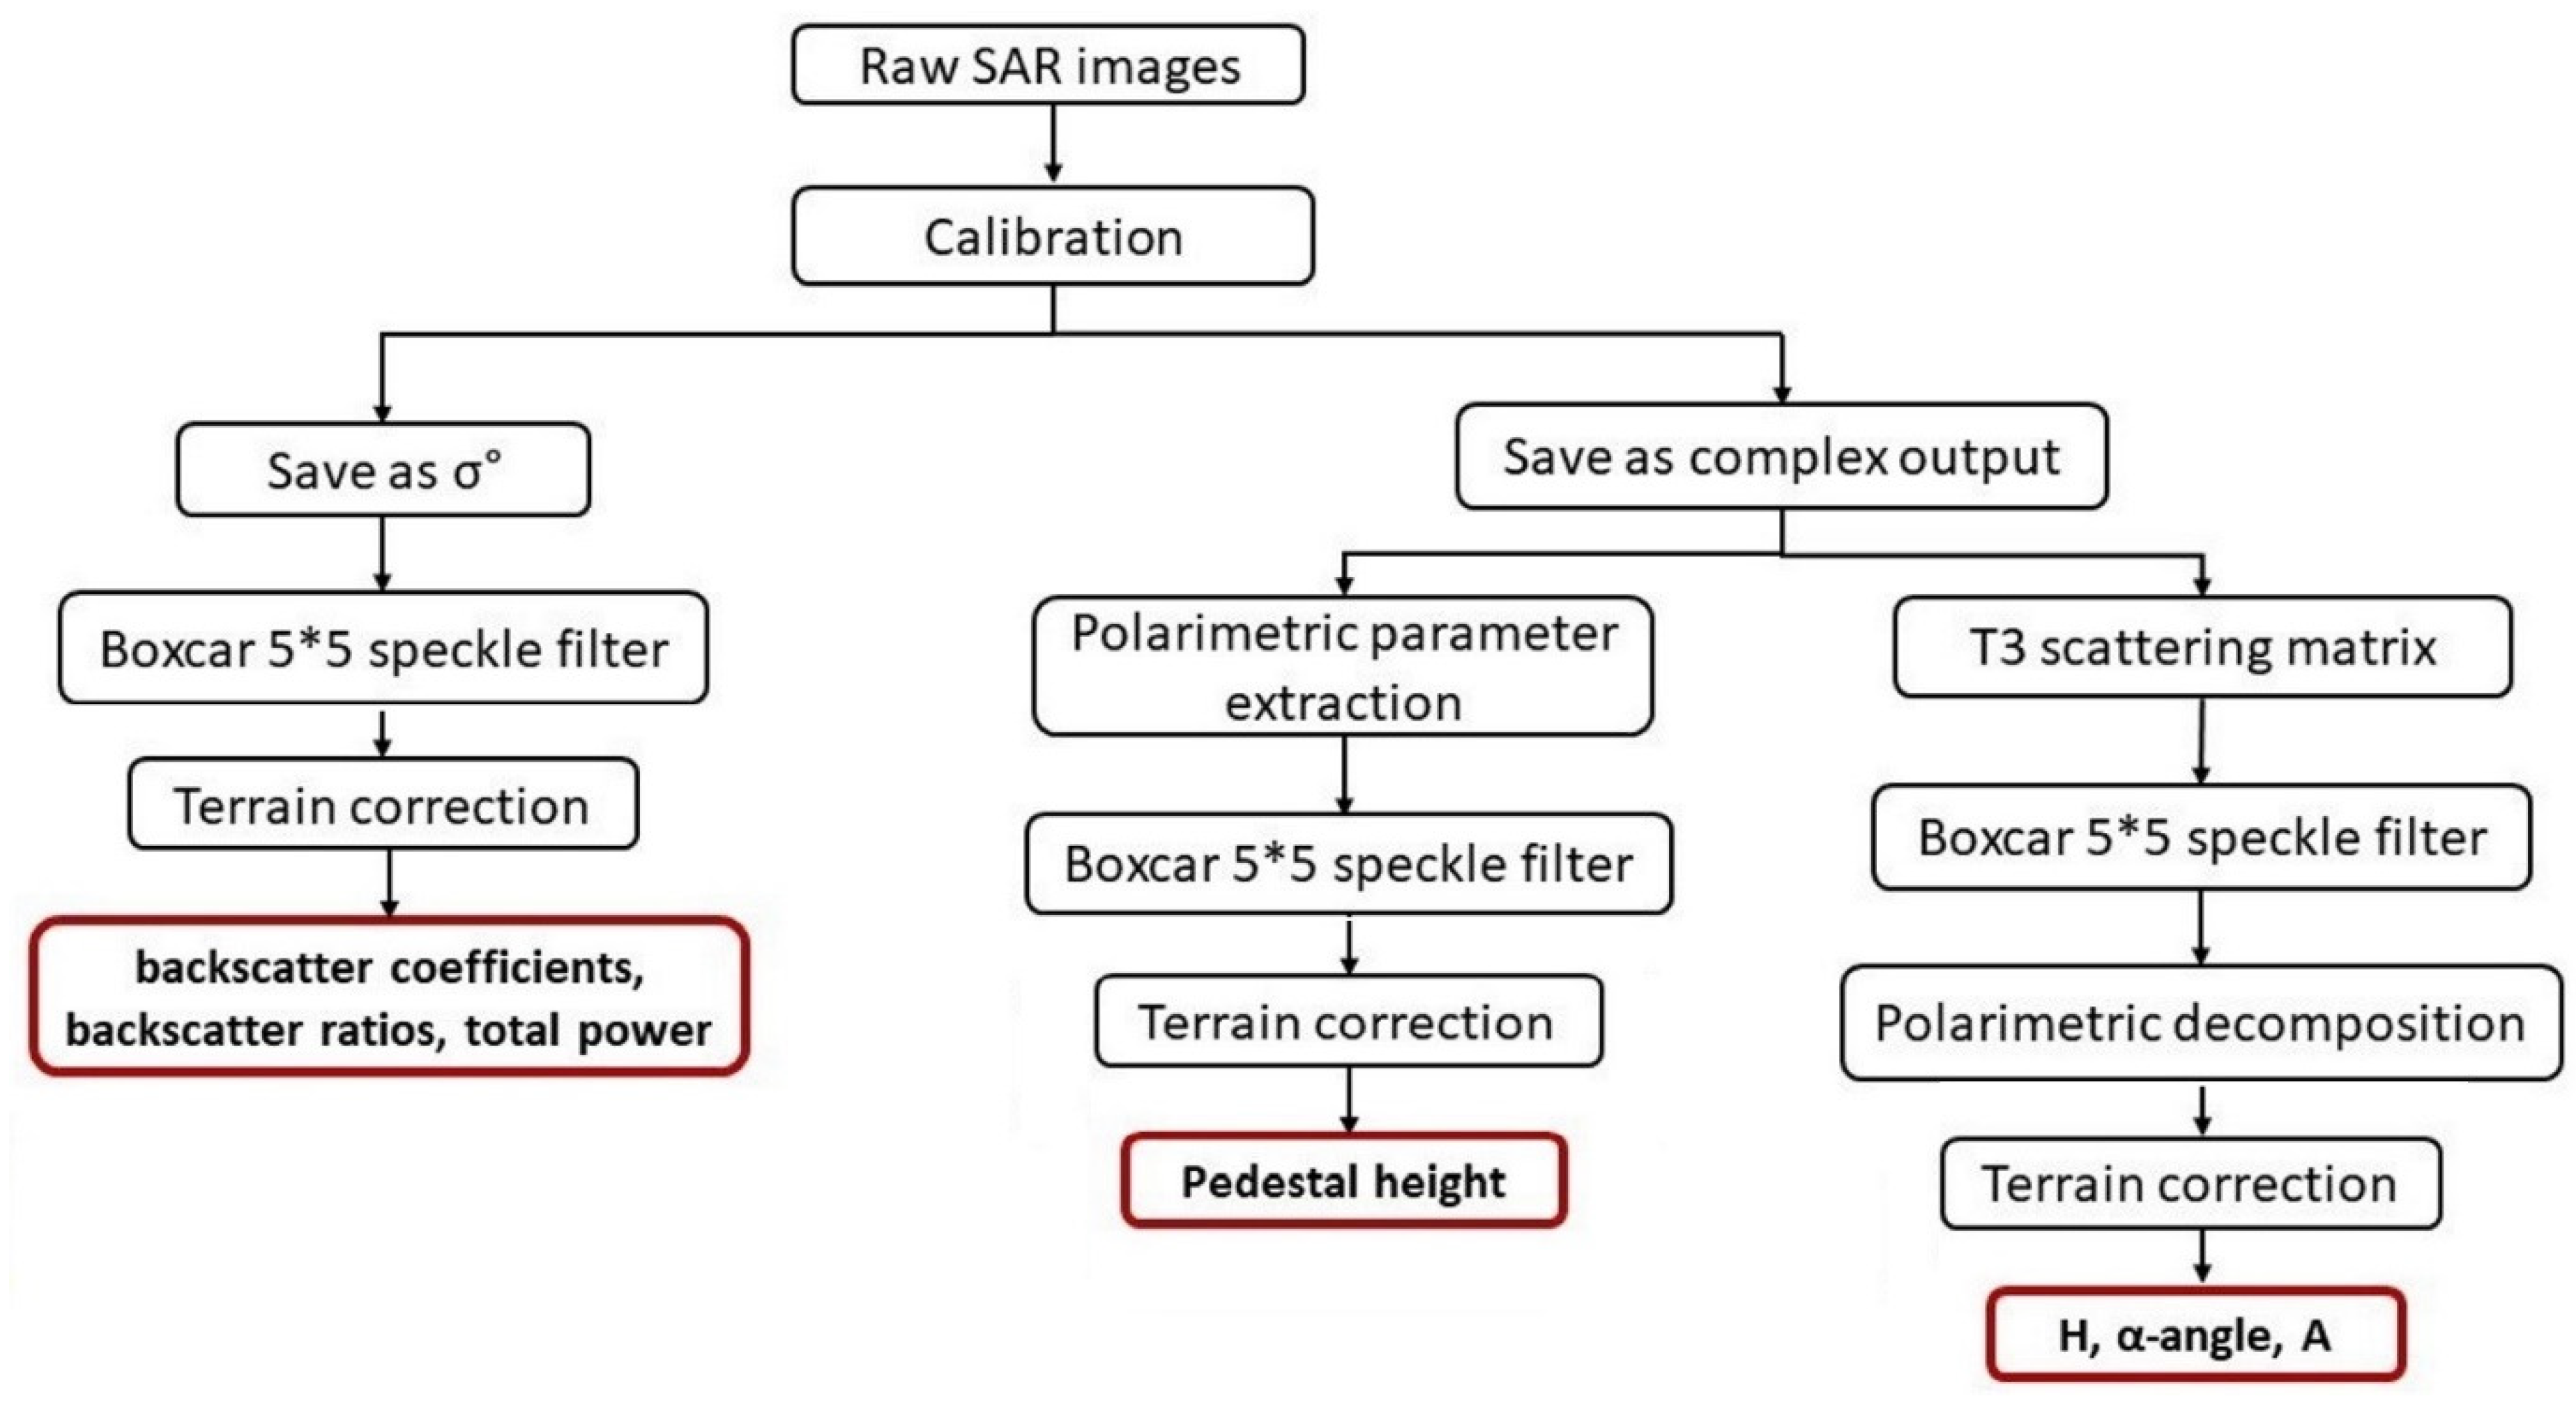
2.3. SAR Image Acquisition and Processing

Four RADARSAT-2 images were acquired using fine quad-mode polarization and different incidence angles in May and November 2015, as shown in Table 1. Common polarimetric parameters were selected for analysis and extracted using the steps shown in Figure 2. Some of the common polarimetric parameters extracted included pedestal height, which is a variable that shows the degree of polarization. The larger pedestal height corresponds to multiple and volume scattering, while the smaller pedestal height shows the surface scattering (e.g., [43]). We also used the Cloude–Pottier decomposition variables including the H, α-angle, and A, which describe and classify the scattering mechanism of a target [44]. H (entropy) measures the randomness of the scattering and ranges from 0 to 1. Values close to 1 indicate that depolarization has happened and there is no longer a single-scattering mechanism, instead, there should be multiple scattering, while values close to 0 represent the surface scattering. A (anisotropy) measures the importance of the dominant scattering and ranges from 0 to 1. Greater values of A indicate the dominance of one scattering mechanism, while lower values show the contribution of secondary and tertiary scattering. α-angle estimates the dominant scattering source and varies from 0° to 90°. It would be close to 0° for surface scattering, close to 45° for volume scattering, and close to 90° for double-bounce scattering [44].
Image processing and radiometric and geometric corrections were conducted using the Sentinels Application Platform (SNAP) software version 7.0.3 (freely available software developed by the European Space Agency (ESA) [45]. First, the DN values of raw products were converted to σ° using radiometric calibration. Then, speckle filtering was applied using a 5 × 5 Boxcar filter to reduce noise. Finally, the ground ranged images were geometrically corrected using the terrain correction algorithm [46]. However, some images still suffered from the spatial displacement. The orthorectification was then performed manually in ArcMap (10.6) using the georeferencing tool, with reference targets selected from georeferenced images, field polygons files, and road vector data. The final images had a root mean square error (RMSE) of less than two pixels. All final RADARSAT-2 images had a pixel spacing of 9.45 m. For polarimetric decomposition extraction, a T3 matrix generation was performed before terrain correction [47,48]. The linear intensity and polarimetric variables for the pixels of each field were extracted by creating a mask for each field. Over the region where the TLS station was measured, a 20-m buffer mask was created for each field, regardless of the actual size of the field. Then, each mask was overlaid on SAR images in SNAP, and polarimetric variables were extracted by exporting mask pixels. The average and mean value of parameters were then calculated for the subset region.

2.4. Statistical Analysis
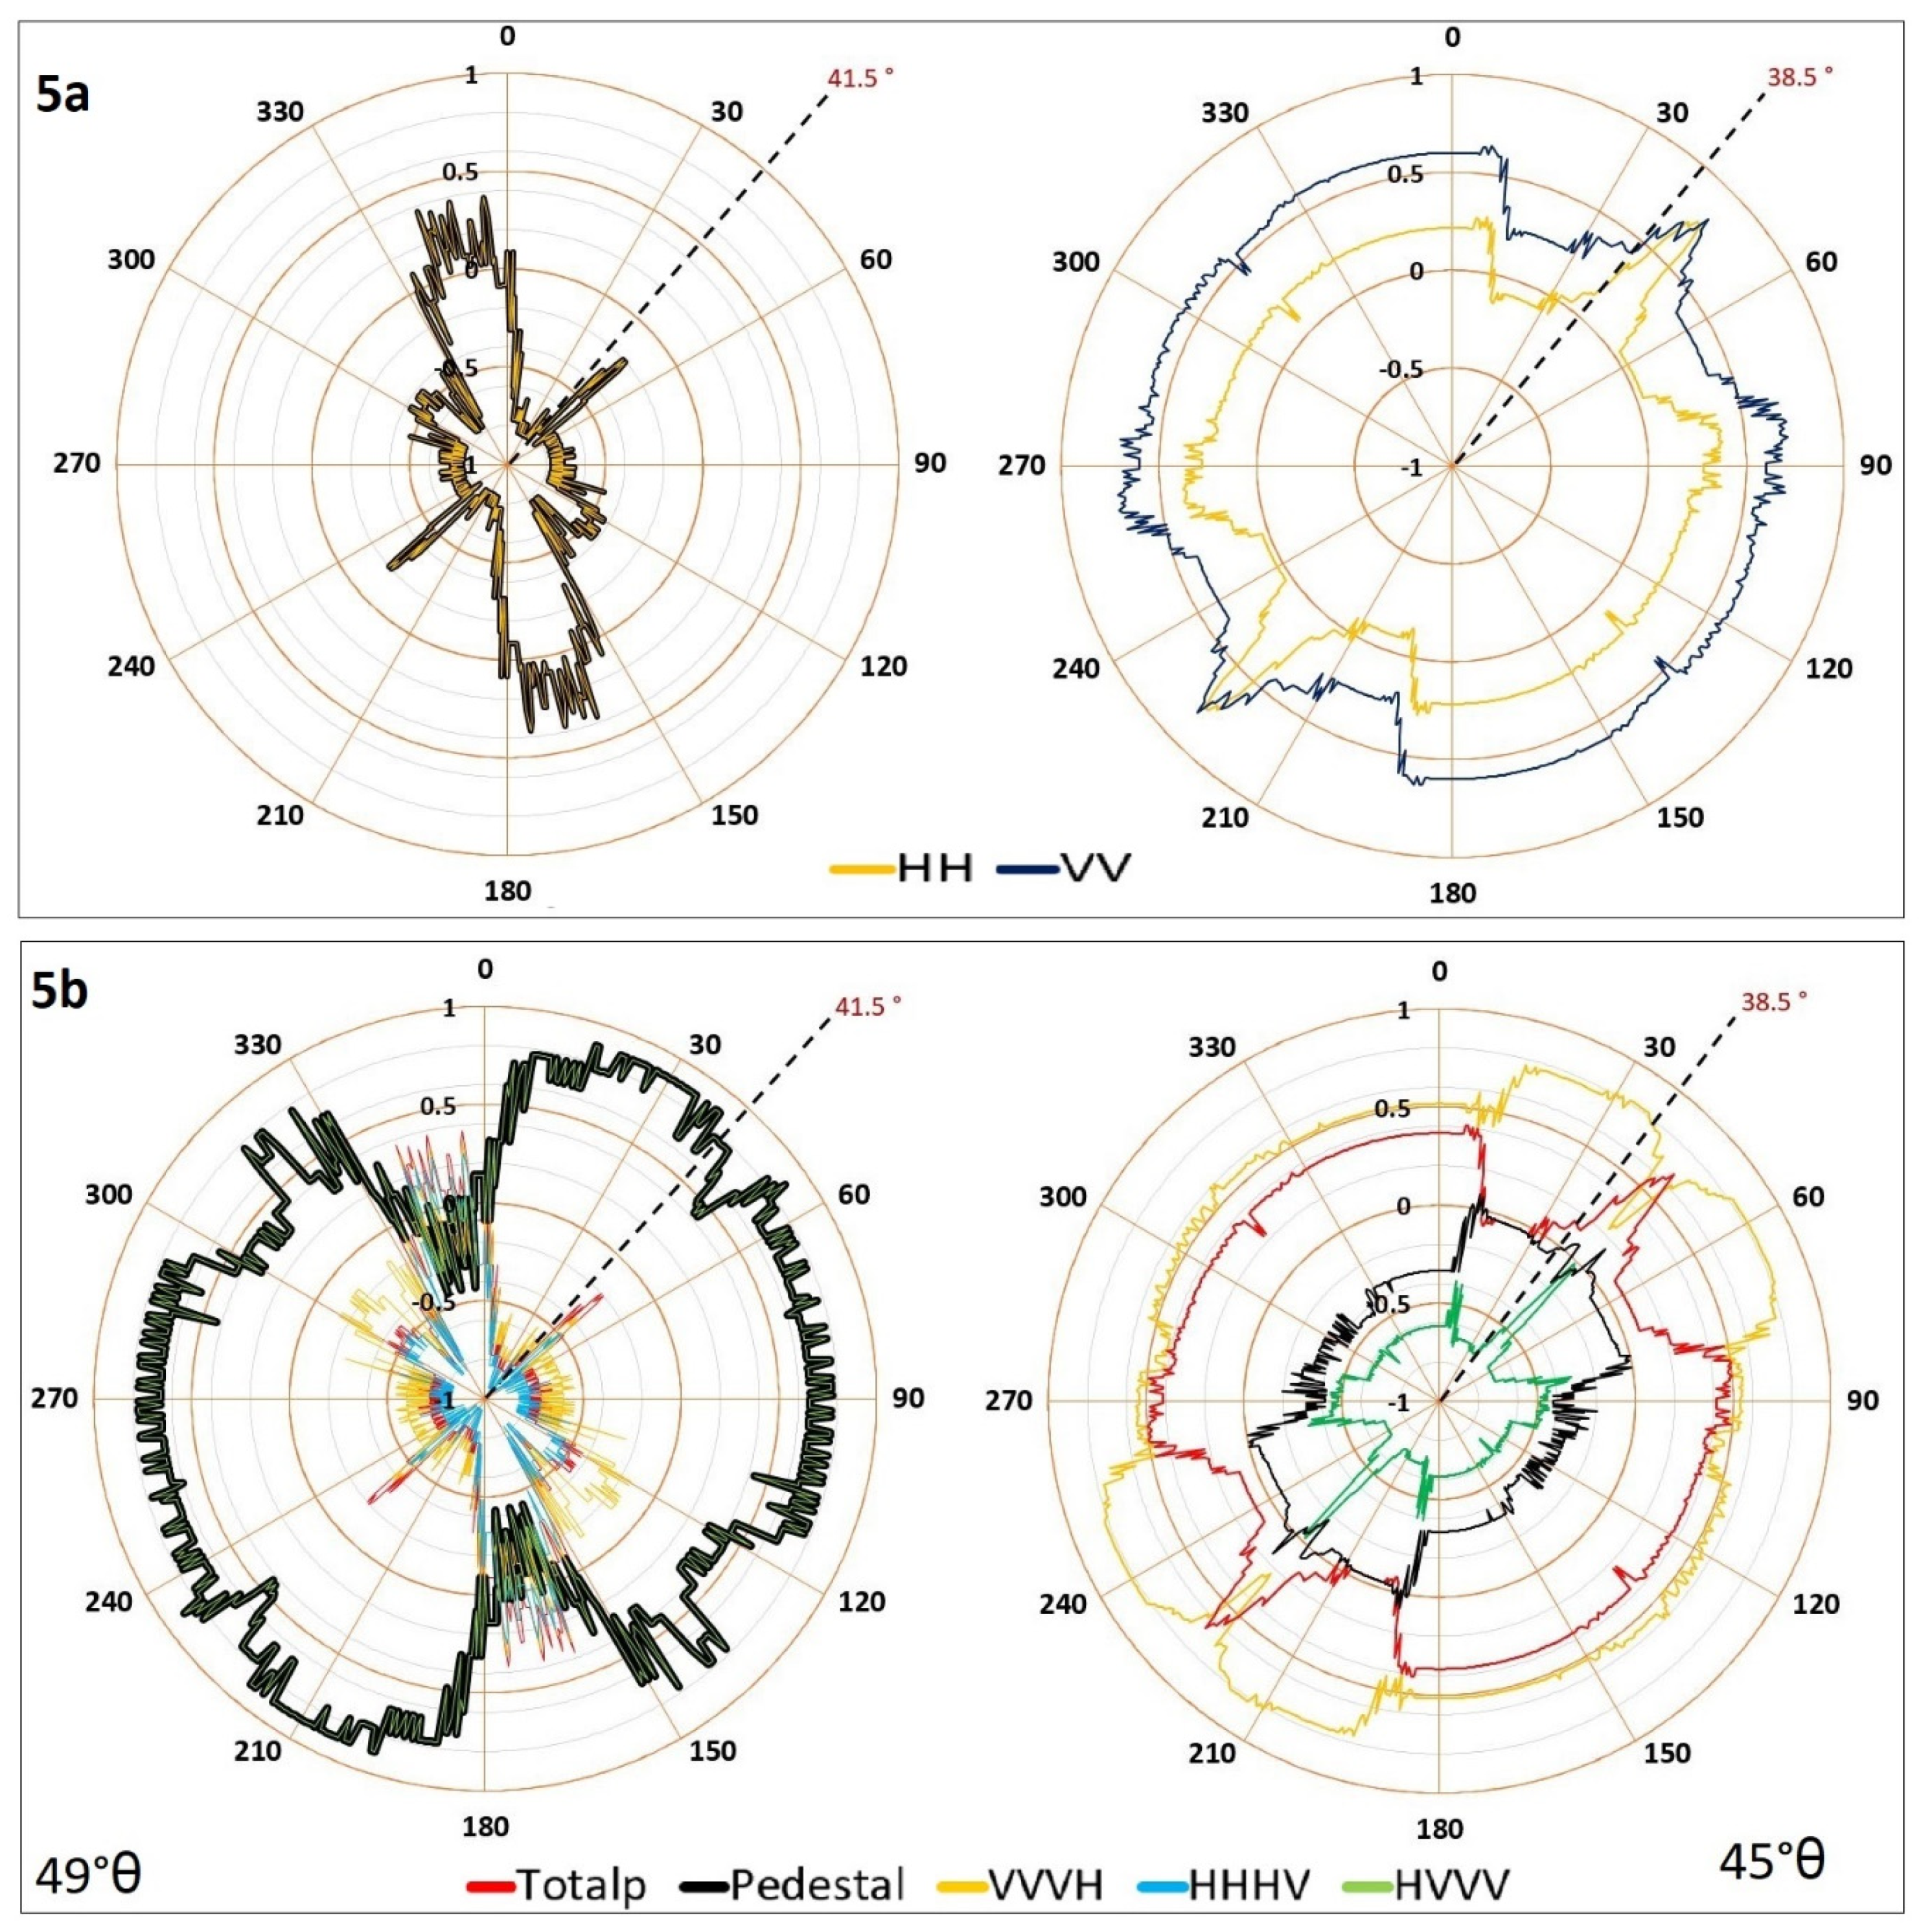
Descriptive statistical analysis was conducted using SPSS software (version 26) to check the linearity and normality of data. According to de Winter et al. [49], the Spearman correlation is more robust than, and preferred to, the Pearson correlation in small sample size datasets with non-normal distribution and the presence of outliers. For this study, the Spearman rank correlation (p value) was conducted to analyze the association between mean RMSH measured by TLS and mean radar parameters for different orientations, and results were shown using a polar graphical approach. These polar charts were prepared using SAR parameters obtained from pixels within the fields where the TLS data were obtained.
The Spearman correlation was also used to compare pin measurements at the east–west and north–south orientations and the field average results obtained with the TLS method with the SAR polarimetric variables. The aim was to determine the differences in results between pin profiler and TLS, and how much each method may contribute to the mischaracterization of surface roughness. The RMSH (collected using pin boards and the TLS approach) and the associate polarimetric variables were averaged within the region of the field covered by the TLS. The Spearman correlations reported used the field scale data (15 fields total).

3. Results

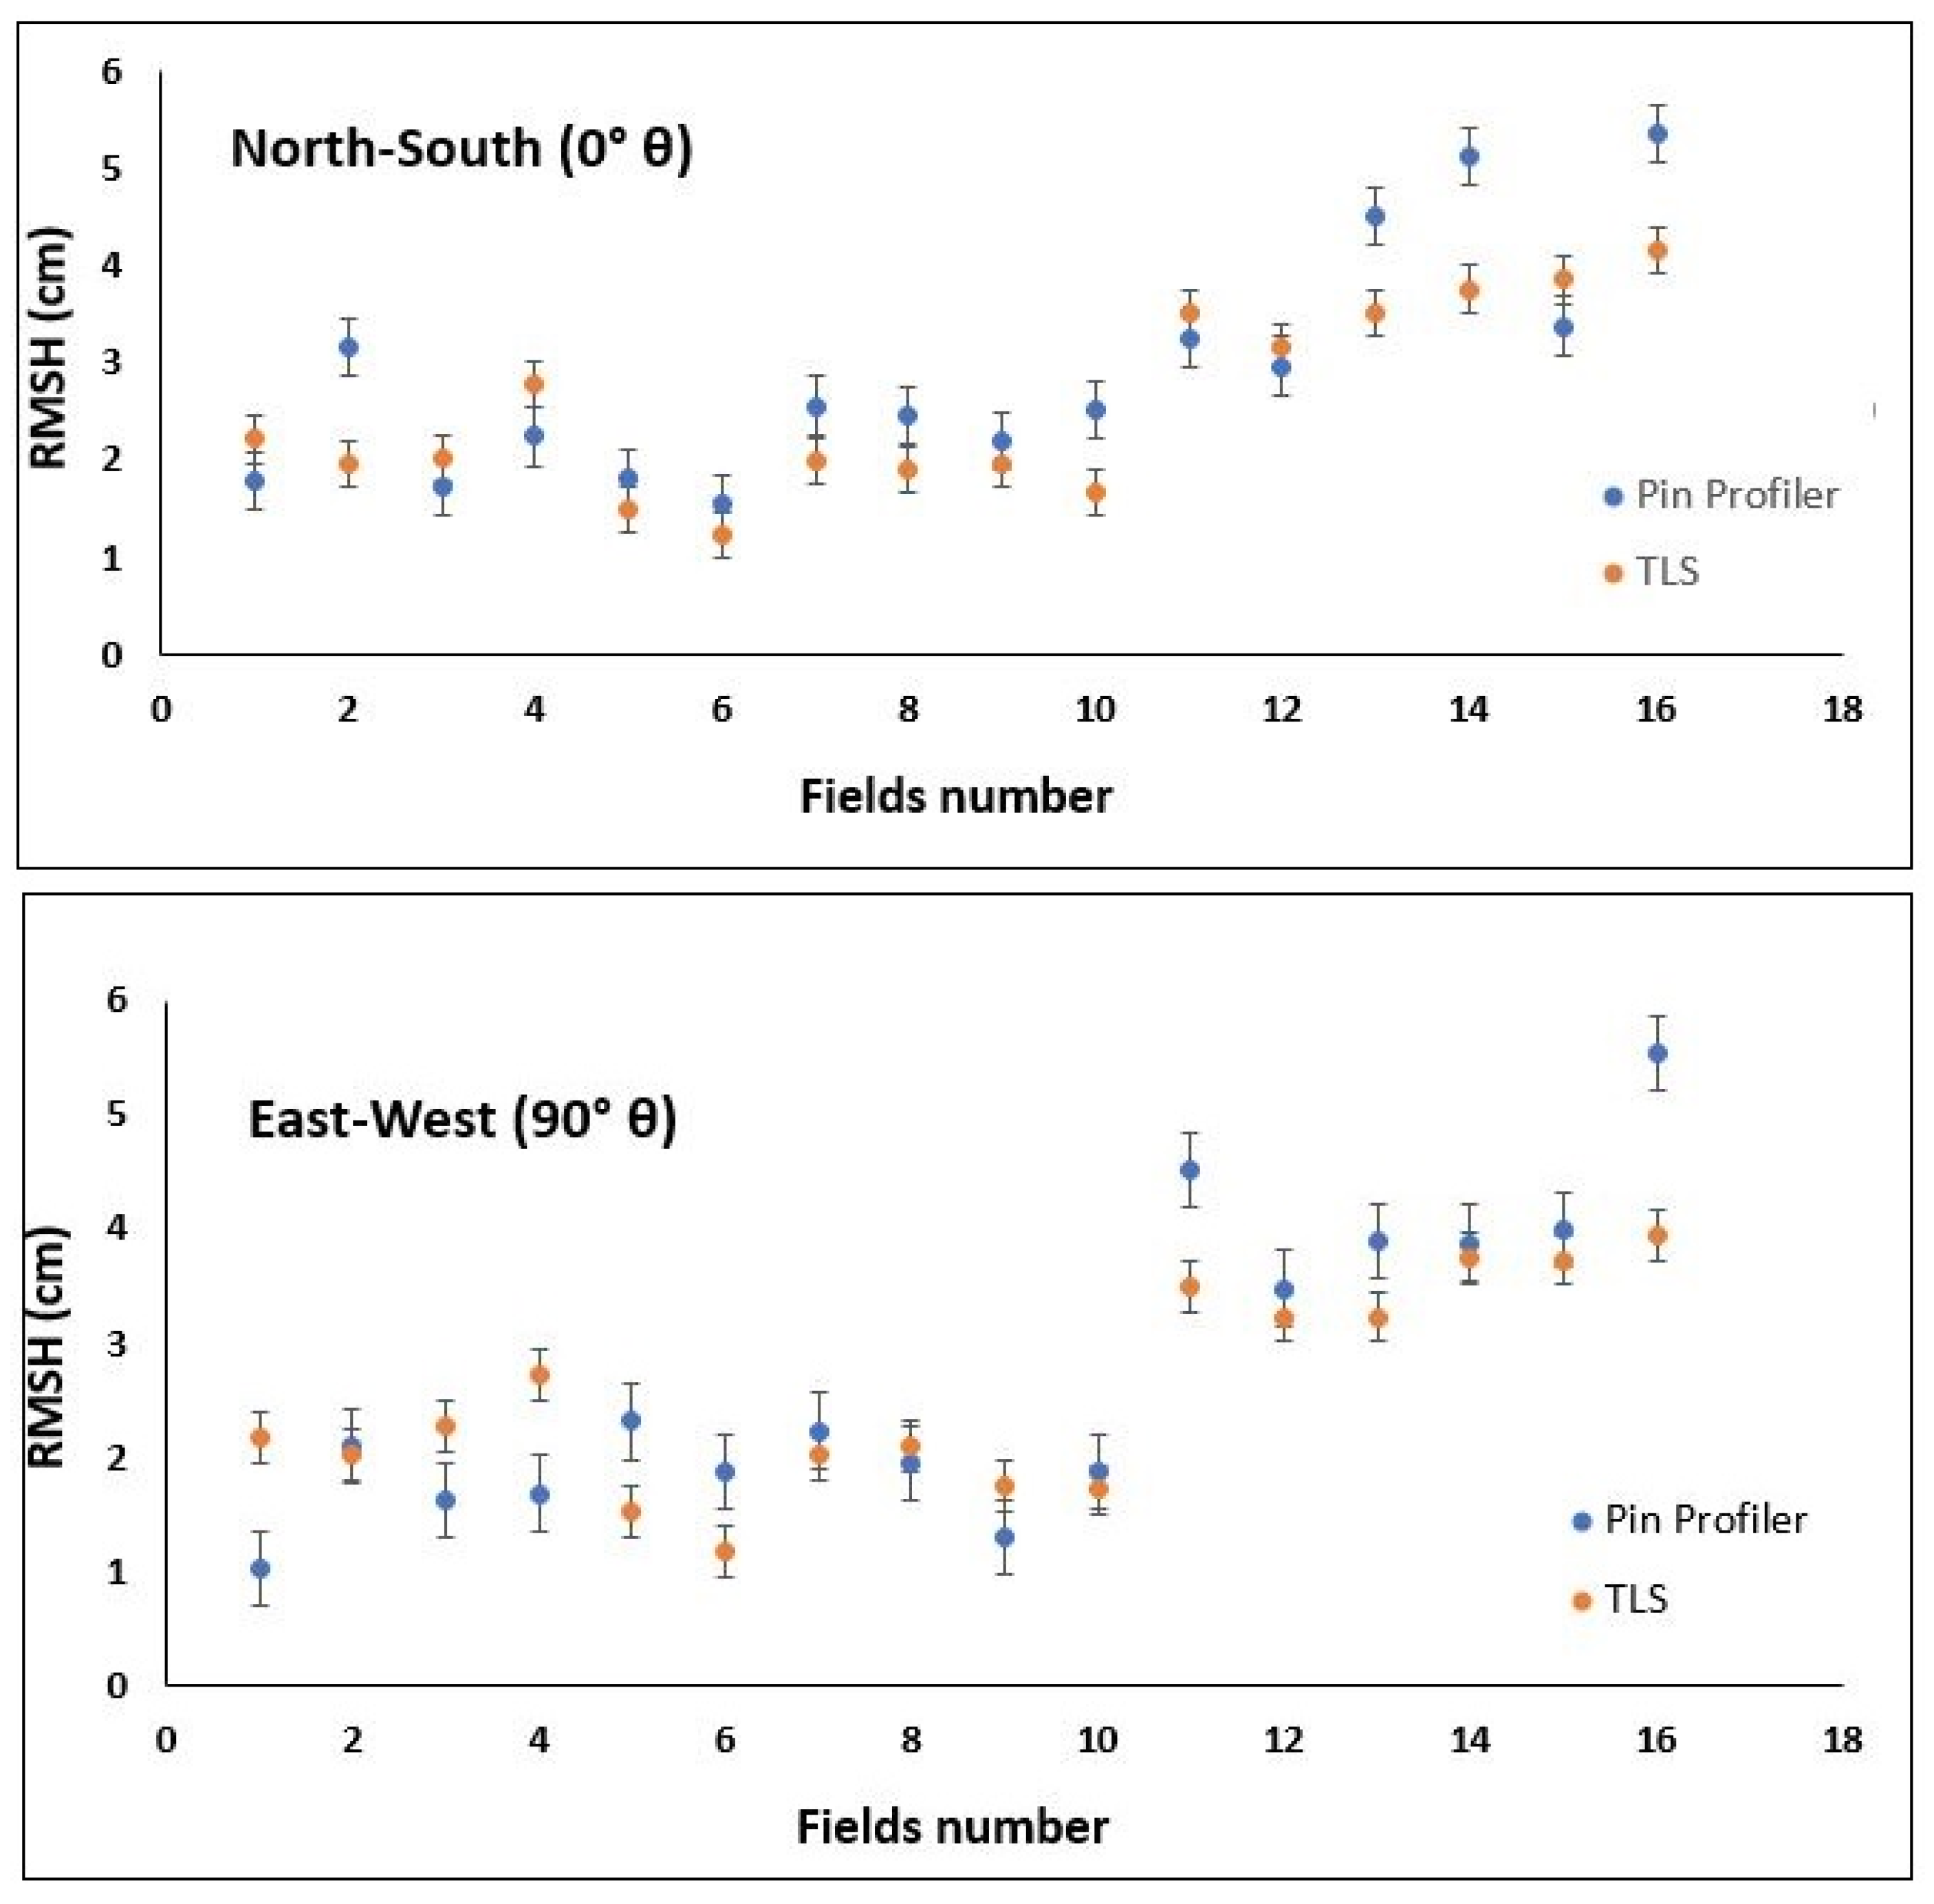
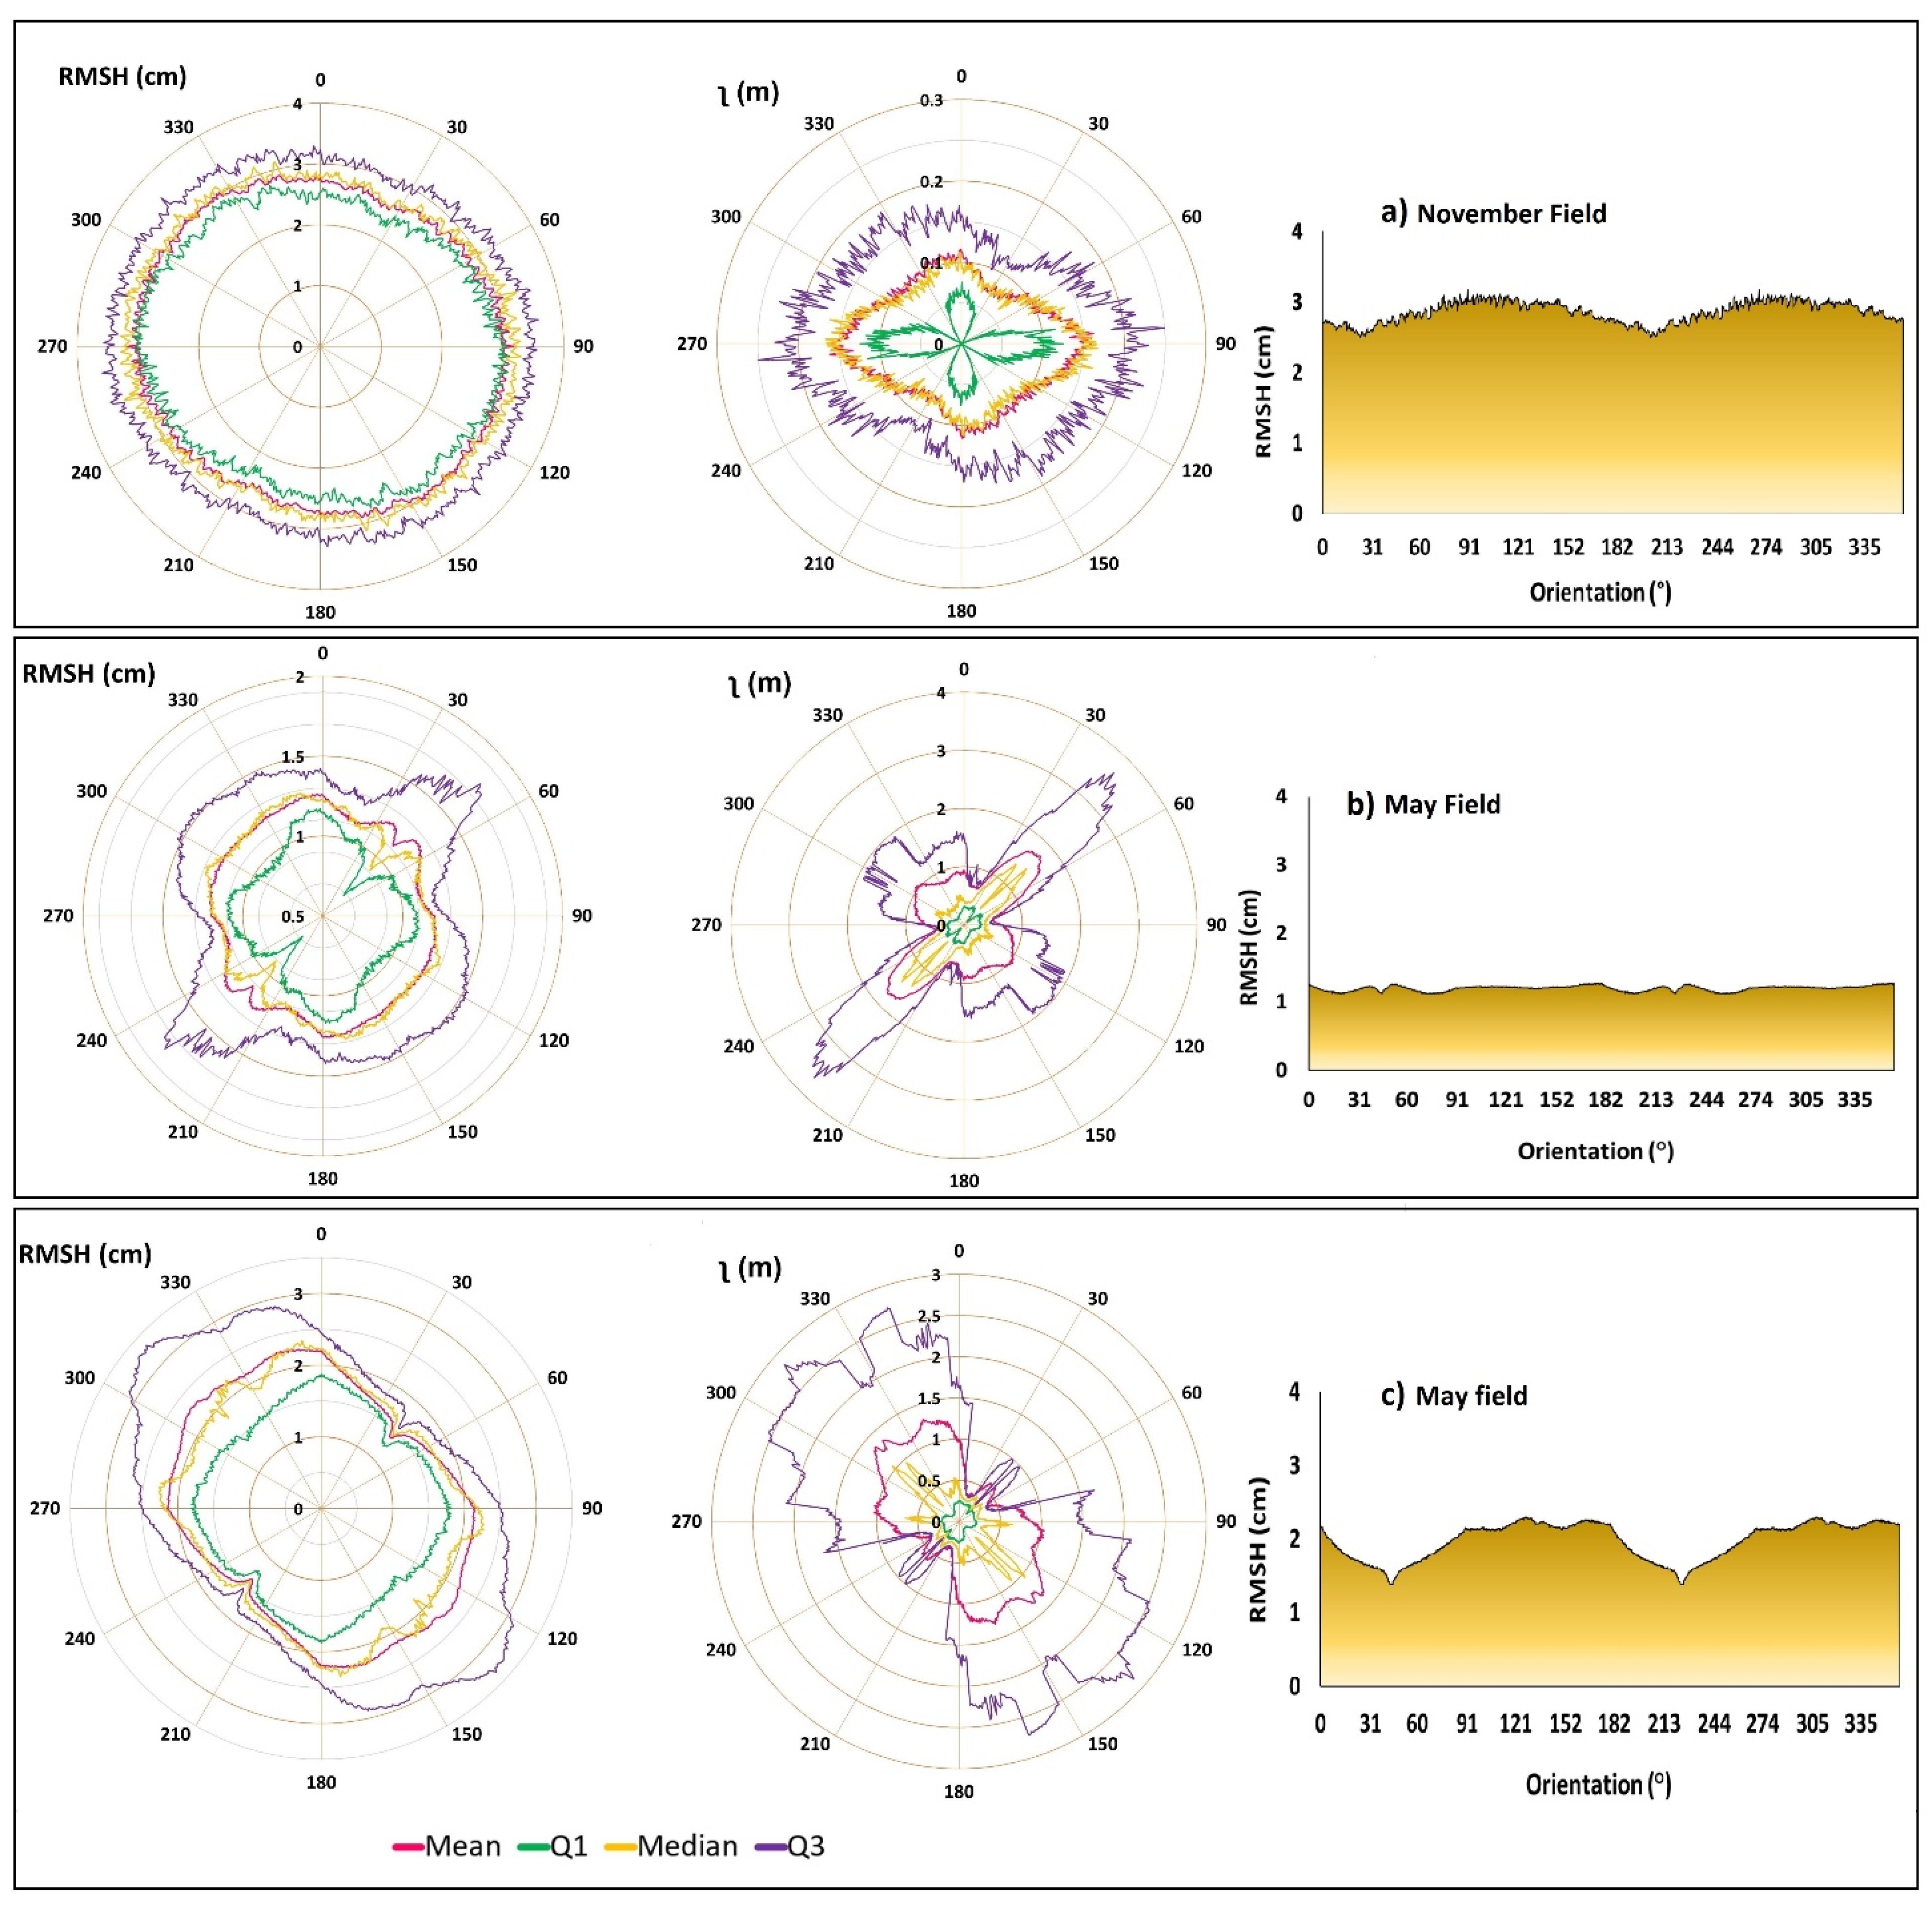
3.1. Surface Roughness Characteristics with Respect to the Orientation

The value of RMSH varied between the November and May surface acquisitions, as summarized in Table 2. In May, greater heterogeneity was observed with larger variation of mean RMSH and ʅ in all orientations among fields. In November, several fields were rougher with respect to the absolute value of mean RMSH; however, there was a lower range in roughness variations observed among fields.
Three representative fields with different roughness situations were selected to demonstrate the sensitivity of surface roughness characteristics with respect to the orientation using a polar graph (Figure 3). The selection was based on the variation of mean RMSH and ʅ and the difference between the highest and the lowest RMSH value in the field. In general, the shape of the polar graphs depends on the main elements of roughness, such as the direction of tillage, crop residue, and soil clods [13].
Figure 3a (TLS completed during the November study period) represents a relatively homogenous rough field as it has a low variability of surface roughness across all orientations. In addition to some low directional variability of surface roughness, this area had the smallest IQRs in the scanned area of the field. Moreover, the difference between the highest RMSH and the lowest RMSH was small. This indicates that this field was bare, with no significant directional tillage and no distinct ridges or furrows, but with the soil clod orientation having no directional preference.
Figure 3b, with the lowest values of RMSH, represents a relatively smooth field. As this figure shows, the RMSH and ʅ had large variability across the orientations, in particular for the third quartile. The RMSH had an abrupt drop close to 45° and 225°; however, the ʅ increased in these azimuths. The sharper shape of the ʅ was due to its higher directional sensitivity compared to the RMSH [10]. Moreover, the difference between the lowest and the highest RMSH was considerable. It can be concluded that the sharp decrease in the RMSH, which was close to 45° and 225°, resulted from the tillage direction, which aligned with the measuring of surface roughness parameters. In addition, in other parts of the field, the crop residue and soil clods contributed to the variation of surface roughness.
Similarly to the previous field, Figure 3c shows the large variability of surface roughness parameters across the orientation. However, over the whole field, the variation of this area was larger and more distinct than that of Figure 3b. Moreover, the difference between the lowest and the highest RMSH was large. It can be said that the surface roughness elements (tillage direction, crop residue, and soil clods) were more dominant and the alignment was more apparent in this field. In this case, the field was characterized by deeper furrows than those observed at the other study sites.

3.2. Sensitivity of RADARSAT-2 Parameters to the Surface Roughness Parameters

Results of the Spearman rank correlation (p value) between measured mean RMSH (by TLS and pin profiler) and mean radar parameters for two different orientations and look angles are presented in Table 3 and Table 4, respectively. Since the surface roughness measurements using the pin profiler were not conducted in the RADARSAT-2 look angles, the sensitivity analysis of radar parameters to the RMSH at the look angle presented in this study only applies to the TLS. As demonstrated, the radar parameters show different sensitivity to the directionality of RMSH. This difference in the correlation results between radar parameters at different incidence angles and surface roughness measurements at different orientations was observed using the two methods of measuring surface roughness (TLS and pin profiler). At azimuth 0°, and in the lower incidence angles (24° incidence angle), significant relationships were found between surface roughness measured by TLS and radar parameters (σ° VV, σ° HH/VV, total power, and α-angle). At 45° incidence angle, significant relationships with HH and HV (by pin profiler) and VV (by TLS) were observed from roughness measurements at azimuth 0°. At a higher incidence angle (49° incidence angle), generally weak relationships were observed in this azimuth (using TLS). Similarly, the pin profiler (north–south direction) showed higher relationships at the same incidence angles, however, with different parameters.
The pin profiler showed different behaviours than TLS in the azimuth 90° or east–west orientation. At three different incidence angles (30°, 45°, 49°), the pin profiler showed approximately the same level of significance between radar parameters and RMSH. Among all parameters, σ° HH and total power were the only parameters with the same behaviour with respect to the RMSH obtained by the pin profiler in the east–west direction at the three incidence angles. Moreover, at incidence angles 30° and 45°, the pin profiler results showed far more sensitivity (with respect to the p value of the correlation analysis) compared to the TLS. This may be related to the observation that the pin profile measurements were higher in value than the TLS measurements in most fields with greater variation observed between fields (Figure 4). This is perhaps related to the sampling technique. Whereas TLS point clouds provide the surface roughness measurements from numerous transects, the pin profiler sampling is based on a single 3-m transect within the fields (although taken along different orientations). The lower measurement values by TLS may be impacted by shadowing effects in the TLS point clouds. Potentially, a furrow mound could block the view of the ground beyond it, thus the TLS point cloud will not have any points at the bottom of the furrow beyond. We attempted to minimize this effect through multiple scans; however, in future studies, this may be minimized through the adoption of a higher station viewpoint. For the purpose of this study, it may have resulted in the reduction of local ranges in elevation (missing bottoms) and reduction of the RMSH.
In contrast to roughness measurements taken along pre-determined azimuths (0°, 45°, 90°), we also examined the relationship between radar parameters and surface roughness characteristics at the look angle. According to Table 4, this relationship increases with increasing the incidence angle (as well established in previous research e.g., [34]). Very strong correlations, some positive and some negative, were observed between most of the parameters at satellite look angles. This agrees with Van Der Wal et al. [50] who stated that the look angle of a sensor affects the relationship between radar parameters and surface roughness. At incidence angle 49°, σ° HH/HV has the most significant correlation, then σ° HH, σ° VV, σ° HV/VV, pedestal height, and total power.
To further demonstrate the effect of surface roughness directionality on radar parameters observed over the fields, in Figure 5 we examined the sensitivity between radar parameters and mean RMSH obtained by TLS using a polar graph. In this graph, the Spearman correlation between radar parameters and mean RMSH for all fields is illustrated in every 0.5° orientation from 0° to 360°. Since radar backscatter signal is more sensitive to higher incidence angles, we show several radar parameters shown to be sensitive to roughness only at the higher incidence angles (45° and 49°). This figure suggests that the radar parameters show different behaviours at different incidence angles with respect to the azimuth orientation, demonstrating the sensitivity of roughness measurements in agricultural fields to the direction that is observed.

4. Discussion

In many SAR studies, surface roughness measurements were reported to be conducted at the look angle of SAR images [34,35,51]. However, there are also several studies in which the orientation of the roughness measurements was not mentioned [38,39] or was taken to capture key roughness elements of the field, such as perpendicular to the field furrows [5,52]. While the results of this study confirm that radar parameters are more sensitive to surface roughness at higher incidence angles [33,40,53], an important result suggests that the sensitivity between radar parameters and surface roughness can change depending on the orientation at which the roughness is measured. To further demonstrate this impact, in Figure 5a we show the changes in correlation observed in both σ° HH and σ° VV at the 45° and 49° incidence angle as a function of the azimuth over which the roughness was observed. At 49° incidence angle the correlations observed between σ° HH and σ° VV were in close agreement, whereas at 45° incidence angle, VV was far more sensitive to roughness at all orientations. As previously discussed, as the incidence angle decreases, the contribution of soil moisture to SAR backscatter becomes much higher than that of surface roughness. Likely, at 45° θ, both soil moisture and surface roughness have a significant impact on the backscattered signal; however, the HH polarization likely has higher sensitivity to soil moisture than to surface roughness [54]. This may explain why σ° HH showed a lower sensitivity to the mean RMSH at 45° θ than at 49° θ (as shown in Table 4). At 49° θ, SAR backscatters were dominantly affected by surface roughness leading to regions of both positive and negative correlation between roughness and radar parameters for both polarizations (at a specific orientation), and statistically significant correlations to roughness were observed at look angle, as presented in Table 4. At 49° incidence angle, it should be noted that there were very rapid changes in the significance of the correlations that occurred at various orientations, including a very rapid change in correlation and correlation sign near orientations 0° and 180° (given the symmetry observed in Figure 5).
At 45° incidence angle, the σ° in VV was far more sensitive to roughness (higher correlations) at orientations 0° and 90°; however, at look angle, the correlations observed were not statistically significant. As depicted in Figure 5, there is a potential anomaly (apparent spike in correlation) in the sensitivity analysis in σ° HH and σ° VV at the 45° incidence angle. This is perhaps due to the fact that the overall tillage direction (when present on a field) was closely parallel (45°) to this azimuth, leading to some spikes in the sensitivity analysis. It is interesting to note that if roughness was observed at orientations between 75° to 185°, correlations for σ° VV would have been considered statistically significant (as observed at orientation 0° in Table 2). This further demonstrates the importance of ensuring that the roughness measurement orientation is in line with the satellite look angle.
Similar to Figure 5a, in Figure 5b we show the sensitivity of correlation between field-measured RMSH at a variety of orientations to total power (Totalp), pedestal height (pedestal), and cross-polarized ratios (VVVH, HHHV, and HVVV) at 45° incidence angle and 49° incidence angle. As expected, more significant correlations were observed at the higher incidence angle (at 49°); however, similarly to the relationships observed in Figure 5a, there was significant sensitivity to the orientation of the measurement.
An important contribution of this work suggests that the lack of precision in the characterization of roughness measurement orientation may result in the misinterpretation of SAR sensitivity to surface roughness. Due to the fact that surface roughness is a crucial factor in many soil moisture retrieval models, any mischaracterization of this surface parameter may lead to unreliable results in agricultural modelling and monitoring. Yet, soil moisture estimation using retrieval models is challenging because of the complexity of surface roughness characterization. A t limitation of retrieval models is that the sensitivity of SAR responses to surface roughness can be greater than that of soil moisture [55]. Generally, most microwave scattering models describe surface roughness as a single scale, stationary, Gaussian, and random process [3,56], which is not the case of the natural agricultural fields. Furthermore, the characterized surface roughness is not constant throughout the fields and may change with small variations in azimuth (Figure 5). Therefore, it is of great importance to report at which orientation or azimuth the surface roughness measurements are taken, as this study demonstrates that the periodic structure of agricultural surfaces provides significant ranges in roughness values, with respect to orientations.
Another important aspect of this work is the comparison between TLS-derived measures of RMSH versus those derived using pin boards. In many cases (Table 2) the correlations observed using the TLS were not observed using the pin board. We suggest that this may be related to a sampling bias associated with the pin boards. Over most of our measured agricultural fields, lower variability was observed in RMSH. Lower variability was observed both within and between fields when using the TLS approach. This is likely due to the ability of TLS to capture thousands of potential profiles versus only the three measurements of pin profiler (3 × 1 × 3 m profiles). As demonstrated in Chabot et al. [13], significant sampling bias between these approaches can result due to incomplete characterization. In general, the majority of studies highlighting the importance and sensitivity of radar parameters to roughness have been conducted using roughness measurement approaches derived from the pin board technique; however, we anticipate that further development of these roughness parameterizations and characterizations will result from the more detailed measurement of the surface, as available from TLS.

5. Conclusions

This research analyzed the sensitivity of RADARSAT-2 polarimetric variables according to the direction in which surface roughness parameters are characterized. For this purpose, surface roughness measurements were conducted by a pin profiler at the east–west and north–south directions, and by TLS in multi-azimuth mode (by 0.5° from 0° to 360°). Both measurements were correlated to the polarimetric variables at those orientations. Moreover, the study area was divided into three representative fields with roughness attributes, and roughness parameters were evaluated for these fields. The results demonstrated that surface roughness parameters behave differently with respect to orientation. Consequently, the polarimetric variables showed different correlations with surface roughness parameters at different orientations, and most were sensitive to surface roughness at higher incidence angles. Furthermore, the sensitivity analyses were more significant when both surface roughness and radar parameters were within the look angle.
Moreover, our results showed that TLS performed more reliably than the pin profiler for the measurements of the surface roughness parameters at two orientations (east–west and north–south). Unfortunately, there is a lack of clarity in the directionality of the measurement of surface roughness parameters in some studies. So far, many studies have reported that surface roughness measurements were conducted in the look angle of SAR sensors, or parallel or perpendicular to the tillage direction or field furrow. Since surface roughness is a key factor in many soil moisture retrieval models, any mischaracterization of that will lead to unreliable results in agricultural modelling and monitoring. Therefore, it is of great importance to consider aspects of surface roughness variations due to orientation.

Author Contributions

Conceptualization, A.B., T.R., and J.L., methodology, J.L., M.C. Z.A.; software, J.L., M.C., Z.A., formal analysis, Z.A., M.C. investigation, Z.A. resources, A.B., J.L.; data curation, T.R., A.B., J.L., M.C.; writing—original draft preparation, Z.A.; writing—review and editing, Z.A. A.B., J.L., M.C.; visualization, Z.A.; supervision, A.B., project administration, A.B.; funding acquisition, A.B. All authors have read and agreed to the published version of the manuscript.

Funding

Canada First Research Excellence Fund: Food from Thought.

Conflicts of Interest

The authors declare no conflict of interest.

References

  1. Kim, S.-B.; Van Zyl, J.J.; Johnson, J.T.; Moghaddam, M.; Tsang, L.; Colliander, A.; Dunbar, R.S.; Jackson, T.J.; Jaruwatanadilok, S.; West, R.; et al. Surface Soil Moisture Retrieval Using the L-Band Synthetic Aperture Radar Onboard the Soil Moisture Active–Passive Satellite and Evaluation at Core Validation Sites. IEEE Trans. Geosci. Remote Sens. 2017, 55, 1897–1914. [Google Scholar] [CrossRef]
  2. Zwieback, S.; Berg, A.A. Fine-Scale SAR Soil Moisture Estimation in the Subarctic Tundra. IEEE Trans. Geosci. Remote Sens. 2019, 57, 4898–4912. [Google Scholar] [CrossRef]
  3. Fung, A.; Li, Z.; Chen, K. Backscattering from a randomly rough dielectric surface. IEEE Trans. Geosci. Remote Sens. 1992, 30, 356–369. [Google Scholar] [CrossRef]
  4. Bryant, R.; Moran, M.S.; Thoma, D.P.; Collins, C.D.H.; Skirvin, S.; Rahman, M.; Slocum, K.; Starks, P.; Bosch, D.; Gonzalez-Dugo, M.P. Measuring Surface Roughness Height to Parameterize Radar Backscatter Models for Retrieval of Surface Soil Moisture. IEEE Geosci. Remote Sens. Lett. 2007, 4, 137–141. [Google Scholar] [CrossRef]
  5. Mirsoleimani, H.R.; Sahebi, M.R.; Baghdadi, N.; El Hajj, M. Bare Soil Surface Moisture Retrieval from Sentinel-1 SAR Data Based on the Calibrated IEM and Dubois Models Using Neural Networks. Sensors 2019, 19, 3209. [Google Scholar] [CrossRef] [Green Version]
  6. Guo, P.; Zhao, T.; Shi, J.; Xu, H.; Li, X.; Niu, S. Assessing the active-passive approach at variant incidence angles for microwave brightness temperature downscaling. Int. J. Digit. Earth 2021, 1–21. [Google Scholar] [CrossRef]
  7. Das, N.N.; Entekhabi, D.; Dunbar, R.S.; Chaubell, M.J.; Colliander, A.; Yueh, S.; Jagdhuber, T.; Chen, F.; Crow, W.; O’Neill, P.E.; et al. The SMAP and Copernicus Sentinel 1A/B microwave active-passive high resolution surface soil moisture product. Remote Sens. Environ. 2019, 233, 111380. [Google Scholar] [CrossRef]
  8. Aubert, M.; Baghdadi, N.N.; Zribi, M.; Ose, K.; El Hajj, M.; Vaudour, E.; Gonzalez-Sosa, E. Toward an Operational Bare Soil Moisture Mapping Using TerraSAR-X Data Acquired Over Agricultural Areas. IEEE J. Sel. Top. Appl. Earth Obs. Remote Sens. 2012, 6, 900–916. [Google Scholar] [CrossRef]
  9. Merzouki, A.; McNairn, H.; Pacheco, A. Mapping Soil Moisture Using RADARSAT-2 Data and Local Autocorrelation Statistics. IEEE J. Sel. Top. Appl. Earth Obs. Remote Sens. 2011, 4, 128–137. [Google Scholar] [CrossRef]
  10. Sekertekin, A.; Marangoz, A.M.; Abdikan, S. ALOS-2 and Sentinel-1 SAR data sensitivity analysis to surface soil moisture over bare and vegetated agricultural fields. Comput. Electron. Agric. 2020, 171, 105303. [Google Scholar] [CrossRef]
  11. Baghdadi, N.; Paillou, P.; Grandjean, G.; Dubois, P.; Davidson, M. Relationship between profile length and roughness variables for natural surfaces. Int. J. Remote Sens. 2000, 21, 3375–3381. [Google Scholar] [CrossRef]
  12. Gupta, V.K.; Jangid, R.A. Microwave Response of Rough Surfaces with Auto-Correlation Functions, RMS Heights and Correlation Lengths Using Active Remote Sensing. IJRSP 2011, 40, 136–146. [Google Scholar]
  13. Chabot, M.; Lindsay, J.; Rowlandson, T.; Berg, A.A. Comparing the Use of Terrestrial LiDAR Scanners and Pin Profilers for Deriving Agricultural Roughness Statistics. Can. J. Remote Sens. 2018, 44, 153–168. [Google Scholar] [CrossRef]
  14. Zhixiong, L.; Nan, C.; Perdok, U.; Hoogmoed, W. Characterisation of Soil Profile Roughness. Biosyst. Eng. 2005, 91, 369–377. [Google Scholar] [CrossRef]
  15. Hajnsek, I.; Pottier, E.; Cloude, S. Inversion of surface parameters from polarimetric SAR. IEEE Trans. Geosci. Remote Sens. 2003, 41, 727–744. [Google Scholar] [CrossRef]
  16. Le Morvan, A.; Zribi, M.; Baghdadi, N.; Chanzy, A. Soil Moisture Profile Effect on Radar Signal Measurement. Sensors 2008, 8, 256–270. [Google Scholar] [CrossRef] [Green Version]
  17. McNairn, H.; Merzouki, A.; Pacheco, A.; Fitzmaurice, J. Monitoring Soil Moisture to Support Risk Reduction for the Agriculture Sector Using RADARSAT-2. IEEE J. Sel. Top. Appl. Earth Obs. Remote Sens. 2012, 5, 824–834. [Google Scholar] [CrossRef]
  18. Zheng, X.; Li, L.; Chen, S.; Jiang, T.; Li, X.; Zhao, K. Temporal evolution characteristics and prediction methods of spatial correlation function shape of rough soil surfaces. Soil Tillage Res. 2019, 195, 104417. [Google Scholar] [CrossRef]
  19. Trudel, M.; Charbonneau, F.; Avendano, F.; Leconte, R. Quick Profiler (QuiP): A friendly tool to extract roughness statistical parameters using a needle profiler. Can. J. Remote Sens. 2010, 36, 391–396. [Google Scholar] [CrossRef]
  20. Jester, W.; Klik, A. Soil surface roughness measurement—Methods, applicability, and surface representation. Catena 2005, 64, 174–192. [Google Scholar] [CrossRef]
  21. Landy, J.C.; Isleifson, D.; Komarov, A.; Barber, D.G. Parameterization of Centimeter-Scale Sea Ice Surface Roughness Using Terrestrial LiDAR. IEEE Trans. Geosci. Remote Sens. 2014, 53, 1271–1286. [Google Scholar] [CrossRef]
  22. Moreno, R.G.; Álvarez, M.D.; Alonso, A.T.; Barrington, S.; Requejo, A.S. Tillage and soil type effects on soil surface roughness at semiarid climatic conditions. Soil Tillage Res. 2008, 98, 35–44. [Google Scholar] [CrossRef]
  23. Gharechelou, S.; Tateishi, R.; Johnson, B.A. A Simple Method for the Parameterization of Surface Roughness from Microwave Remote Sensing. Remote Sens. 2018, 10, 1711. [Google Scholar] [CrossRef] [Green Version]
  24. Turner, R.; Panciera, R.; Tanase, M.A.; Lowell, K.; Hacker, J.M.; Walker, J.P. Estimation of soil surface roughness of agricultural soils using airborne LiDAR. Remote Sens. Environ. 2014, 140, 107–117. [Google Scholar] [CrossRef]
  25. Blaes, X.; Defourny, P. Characterizing Bidimensional Roughness of Agricultural Soil Surfaces for SAR Modeling. IEEE Trans. Geosci. Remote Sens. 2008, 46, 4050–4061. [Google Scholar] [CrossRef]
  26. Verhoest, N.E.; Lievens, H.; Wagner, W.; Álvarez-Mozos, J.; Moran, M.S.; Mattia, F. On the Soil Roughness Parameterization Problem in Soil Moisture Retrieval of Bare Surfaces from Synthetic Aperture Radar. Sensors 2008, 8, 4213–4248. [Google Scholar] [CrossRef] [Green Version]
  27. Pollyea, R.M.; Fairley, J.P. Estimating Surface Roughness of Terrestrial Laser Scan Data Using Orthogonal Distance Regression. Geology 2011, 39, 623–626. [Google Scholar] [CrossRef]
  28. Telling, J.; Lyda, A.; Hartzell, P.; Glennie, C. Review of Earth Science Research Using Terrestrial Laser Scanning. Earth-Sci. Rev. 2017, 169, 35–68. [Google Scholar] [CrossRef] [Green Version]
  29. Seidel, D.; Ammer, C. Efficient Measurements of Basal Area in Short Rotation Forests Based on Terrestrial Laser Scanning under Special Consideration of Shadowing. iForest-Biogeosciences For. 2014, 7, 227. [Google Scholar] [CrossRef] [Green Version]
  30. Roberts, K.C.; Lindsay, J.B.; Berg, A.A. An Analysis of Ground-Point Classifiers for Terrestrial Lidar. Remote Sens. 2019, 11, 1915. [Google Scholar] [CrossRef] [Green Version]
  31. Rychkov, I.; Brasington, J.; Vericat, D. Computational and Methodological Aspects of Terrestrial Surface Analysis Based on Point Clouds. Comput. Geosci. 2012, 42, 64–70. [Google Scholar] [CrossRef]
  32. Oh, Y.; Sarabandi, K.; Ulaby, F.T. Semi-Empirical Model of the Ensemble-Averaged Differential Mueller Matrix for Microwave Backscattering from Bare Soil Surfaces. IEEE Trans. Geosci. Remote Sens. 2002, 40, 1348–1355. [Google Scholar] [CrossRef] [Green Version]
  33. Oh, Y. Quantitative Retrieval of Soil Moisture Content and Surface Roughness from Multipolarized Radar Observations of Bare Soil Surfaces. IEEE Trans. Geosci. Remote Sens. 2004, 42, 596–601. [Google Scholar] [CrossRef]
  34. Adams, J.R.; Berg, A.A.; McNairn, H.; Merzouki, A. Sensitivity of C-Band SAR Polarimetric Variables to Unvegetated Agricultural Fields. Can. J. Remote Sens. 2013, 39, 1–16. [Google Scholar] [CrossRef]
  35. Wiseman, G.; McNairn, H.; Homayouni, S.; Shang, J. RADARSAT-2 Polarimetric SAR Response to Crop Biomass for Agricultural Production Monitoring. IEEE J. Sel. Top. Appl. Earth Obs. Remote Sens. 2014, 7, 4461–4471. [Google Scholar] [CrossRef]
  36. Rakotoarivony, L.; Taconet, O.; Vidal-Madjar, D.; Bellemain, P.; Benallegue, M. Radar Backscattering over Agricultural Bare Soils. J. Electromagn. Waves Appl. 1996, 10, 187–209. [Google Scholar] [CrossRef]
  37. Martinez-Agirre, A.; Alvarez-Mozos, J.; Lievens, H.; Verhoest, N.E.C.; Gimenez, R. Influence of Surface Roughness Sample Size for C-Band SAR Backscatter Applications on Agricultural Soils. IEEE Geosci. Remote Sens. Lett. 2017, 14, 2300–2304. [Google Scholar] [CrossRef] [Green Version]
  38. Merzouki, A.; McNairn, H. A Hybrid (Multi-Angle and Multipolarization) Approach to Soil Moisture Retrieval Using the Integral Equation Model: Preparing for the RADARSAT Constellation Mission. Can. J. Remote Sens. 2015, 41, 349–362. [Google Scholar] [CrossRef]
  39. Baghdadi, N.; Cresson, R.; Pottier, E.; Aubert, M.; Mehrez, M.; Jacome, A.; Benabdallah, S. A Potential Use for the C-Band Polarimetric SAR Parameters to Characterize the Soil Surface Over Bare Agriculture Fields. IEEE Trans. Geosci. Remote Sens. 2012, 50, 3844–3858. [Google Scholar] [CrossRef]
  40. Baghdadi, N.; Dubois-Fernandez, P.; Dupuis, X.; Zribi, M. Sensitivity of Main Polarimetric Parameters of Multifrequency Polarimetric SAR Data to Soil Moisture and Surface Roughness Over Bare Agricultural Soils. IEEE Geosci. Remote Sens. Lett. 2013, 10, 731–735. [Google Scholar] [CrossRef] [Green Version]
  41. Agriculture and Agri-Food Canada. The Canadian System of Soil Classification, 3rd ed.; NRC Research Press: Ottawa, ON, Canada, 1998; p. 188. [Google Scholar]
  42. Lindsay, J.B. Whitebox GAT: A Case Study in Geomorphometric Analysis. Comput. Geosci. 2016, 95, 75–84. [Google Scholar] [CrossRef]
  43. Boerner, W.; Mott, M.; Luneburg, H.; Livingstone, E.; Brisco, B.; Brown, R.J.; Paterson, J.S. Polarimetry in radar remote sensing: Basic and applied concepts. In Principles and Applications of Imaging Radar, Manual of Remote Sensing, 3rd ed.; Henderson, F.M., Lewis, A.J., Eds.; John Wiley & Sons, Inc.: New York, NY, USA, 1998; Volume 2, pp. 271–357. [Google Scholar]
  44. Cloude, S.R.; Pottier, E. An Entropy Based Classification Scheme for Land Applications of Polarimetric SAR. IEEE Trans. Geosci. Remote Sens. 1997, 35, 68–78. [Google Scholar] [CrossRef]
  45. Zuhlke, M.; Fomferra, N.; Brockmann, C.; Peters, M.; Veci, L.; Malik, J.; Regner, P. SNAP (Sentinel Application Platform) and the ESA Sentinel 3 Toolbox. Sentinel-3 Sci. Workshop 2015, 734, 21. [Google Scholar]
  46. Filipponi, F. Sentinel-1 GRD Preprocessing Workflow. Proceedings 2019, 18, 11. [Google Scholar] [CrossRef] [Green Version]
  47. Ustuner, M.; Sanli, F.B.; Abdikan, S.; Esetlili, M.T.; Bilgin, G. An Application of Roll-Invariant Polarimetric Features for Crop Classification from Multi-Temporal Radarsat-2 Sar Data. Int. Arch. Photogramm. Remote Sens. Spat. Inf. Sci. 2018, XLII-1, 451–456. [Google Scholar] [CrossRef]
  48. Mandal, D.; Vaka, D.S.; Bhogapurapu, N.R.; Vanama, V.S.K.; Kumar, V.; Rao, Y.S.; Bhattacharya, A. Sentinel-1 SLC Preprocessing Workflow for Polarimetric Applications: A Generic Practice for Generating Dual-Pol Covariance Matrix Elements in SNAP S-1 Toolbox. Preprints 2019, 9. [Google Scholar] [CrossRef] [Green Version]
  49. de Winter, J.C.F.; Gosling, S.D.; Potter, J. Comparing the Pearson and Spearman Correlation Coefficients across Distributions and Sample Sizes: A Tutorial Using Simulations and Empirical Data. Psychol. Methods 2016, 21, 273. [Google Scholar] [CrossRef] [PubMed]
  50. Van Der Wal, D.; Herman, P.M.; Wielemaker-van Den Dool, A. Characterisation of Surface Roughness and Sediment Texture of Intertidal Flats Using ERS SAR Imagery. Remote Sens. Environ. 2005, 98, 96–109. [Google Scholar] [CrossRef]
  51. Ulaby, F.T.; Bradley, G.A.; Dobson, M.C. Microwave Backscatter Dependence on Surface Roughness, Soil Moisture, and Soil Texture: Part II-Vegetation-Covered Soil. IEEE Trans. Geosci. Electron. 1979, 17, 33–40. [Google Scholar] [CrossRef]
  52. Baghdadi, N.; Holah, N.; Zribi, M. Soil Moisture Estimation Using Multi-Incidence and Multi-Polarization ASAR Data. Int. J. Remote Sens. 2006, 27, 1907–1920. [Google Scholar] [CrossRef]
  53. Holah, N.; Baghdadi, N.; Zribi, M.; Bruand, A.; King, C. Potential of ASAR/ENVISAT for the Characterization of Soil Surface Parameters over Bare Agricultural Fields. Remote Sens. Environ. 2005, 96, 78–86. [Google Scholar] [CrossRef] [Green Version]
  54. Li, J.; Wang, S. Using SAR-Derived Vegetation Descriptors in a Water Cloud Model to Improve Soil Moisture Retrieval. Remote Sens. 2018, 10, 1370. [Google Scholar] [CrossRef] [Green Version]
  55. Moran, M.S.; Peters-Lidard, C.D.; Watts, J.M.; McElroy, S. Estimating Soil Moisture at the Watershed Scale with Satellite-Based Radar and Land Surface Models. Can. J. Remote Sens. 2004, 30, 22. [Google Scholar] [CrossRef] [Green Version]
  56. Diaz, J.C.F.; Judge, J.; Slatton, K.C.; Shrestha, R.; Carter, W.E.; Bloomquist, D. Characterization of full surface roughness in agricultural soils using groundbased LiDAR. In Proceedings of the 2010 IEEE International Geoscience and Remote Sensing Symposium, Honolulu, HI, USA, 25–30 July 2010; pp. 4442–4445. [Google Scholar]
Figure 1. The location of the Elora Research Station (ERS) in Ontario, Canada. The white polygons on the left image indicate the fields of study in May, and the black polygons indicate the November fields.
Remotesensing 13 02210 g001
Figure 2. The flowchart of RADARSAT-2 image processing steps.
Remotesensing 13 02210 g002
Figure 3. Variation of surface roughness characteristics across orientations for three representative fields (Figure 3a–c). (a) A homogenous field with low variations in RMSH and correlation length in the whole field. (b) A moderately smooth field with some distinct variability across some orientations and more ridges and furrows than field Figure 3a. (c) A rough field with the highest variability of RMSH and correlation length and more distinct ridges and furrows across orientations.
Remotesensing 13 02210 g003
Figure 4. The comparison of mean RMSH measured by TLS and pin profiler at two different orientations.
Remotesensing 13 02210 g004
Figure 5. Sensitivity of RADARSAT-2 parameters with respect to the orientation of mean RMSH at incidence angle 45° and 49°, with look angles 38.5° and 41.5°, respectively. (a) The sensitivity of linear backscatter coefficients (σ° HH and σ° VV) to the directionality of RMSH at incidence angles 45° and 49°. (b) The sensitivity of cross-polarized ratios (VV/VH, HH/HV, HV/VV), total power and pedestal height with respect to the RMSH orientation at both incidence angles.
Remotesensing 13 02210 g005
Table 1. Radar characteristics of RADARSAT-2 fine quad-mode polarization images of the study area.
In Situ
Measurement Date
RADAR
Acquisition
Acquisition ModeOrbit (or Pass)Incidence Angle (°)
(Average)
Look Angle (°)
(Average)
13–14 May 201516 May 2015FQP *Ascending4538.5
13–14 May 201517 May 2015FQPDescending3026
16–17 November 201517 November 2015FQPAscending4941.5
16–17 November 201518 November 2015FQPDescending2421
* fine quad polarization.
Table 2. The range of surface roughness variations in terms of mean RMSH and mean ʅ for all fields.
FieldMaximum ValueMinimum ValueDifference
RMSHʅRMSHʅRMSHʅ
November3.970.162.870.091.10.07
May2.410.941.190.21.220.74
Table 3. Comparing the Spearman correlation coefficients (p value) between averaged polarimetric variables and mean RMSH obtained with TLS and pin profiler in different orientations.
Terrestrial Laser Scanner (Azimuth 90°)Pin Profiler (East–West Direction)
Incidence angle24°30°45°49°24°30°45°49°
Look angle21°26°38.5°41.5°21°26°38.5°41.5°
σ° HH−0.200.430.28−0.710.26−0.62 *−0.66 *−0.77 *
σ° VV−0.310.66 *0.60 *−0.710.09−0.79 **−0.85 **−0.26
σ° HV−0.200.40−0.13−0.370.26−0.57−0.23−0.26
σ° HH/VV0.54−0.23−0.180.77 *0.430.410.150.82 *
σ° HH/HV−0.31−0.200.57−0.77 *−0.370.29−0.12−0.54
σ° VV/VH−0.31−0.120.53−0.60−0.370.16−0.11−0.66
σ° HV/VV0.310.22−0.480.660.37−0.390.150.60
Pedestal height0.60−0.22−0.420.660.37−0.10.280.60
Total power−0.370.550.42−0.710.14−0.71 *−0.77 **−0.77 *
H0.31−0.48−0.470.600.370.150.380.71
A0.03−0.38−0.42−0.03−0.090.310.75 **−0.09
α-angle0.60−0.48−0.320.600.310.150.150.71
Terrestrial Laser Scanner (azimuth 0°)Pin profiler (North–South direction)
σ° HH−0.600.330.220.09−0.54−0.45−0.63 *−0.09
σ° VV−0.88 **0.550.60 *0.09−0.37−0.40−0.45−0.31
σ° HV−0.200.43−0.170.260.03−0.13−0.65 *−0.31
σ° HH/VV0.77 *−0.30−0.400.370.710.00−0.12−0.31
σ° HH/HV−0.71−0.270.53−0.14−0.77 *0.000.380.03
σ° VV/VH−0.71−0.180.52−0.03−0.77 *−0.070.450.26
σ° HV/VV0.710.27−0.61 *−0.090.77 *0.02−0.380.37
Pedestal height0.66−0.23−0.33−0.090.77 *0.080.08−0.31
Total power−0.77 *0.500.370.09−0.43−0.28−0.71 *−0.09
H0.71−0.48−0.35−0.200.77 *0.130.18−0.14
A0.60−0.38−0.38−0.140.370.120.480.37
α-angle0.88 **−0.48−0.20−0.200.540.13−0.05−0.14
* Correlation is significant at the 0.05 level. ** Correlation is significant at the 0.01 level.
Table 4. The Spearman correlation coefficients (p value) between averaged polarimetric variables and mean RMSH obtained by TLS at the look angle.
Terrestrial Laser Scanner (Look Angle)
Incidence angle24°30°45°49°
Look angle21°26°38.5°41.5°
σ° HH−0.090.130.13−0.77 *
σ° VV−0.200.300.42−0.77 *
σ° HV−0.370.33−0.33−0.43
σ° HH/VV0.260.00−0.100.66
σ° HH/HV−0.03−0.220.66 *−0.88 **
σ° VV/VH−0.03−0.130.76 **−0.66
σ° HV/VV0.030.27−0.63 *0.77 *
Pedestal height0.31−0.080.000.77 *
Total power−0.260.300.13−0.77 *
H0.03−0.230.020.71
A0.09−0.230.070.14
α-angle0.37−0.2300.71
* Correlation is significant at the 0.05 level. ** Correlation is significant at the 0.01 level.
Publisher’s Note: MDPI stays neutral with regard to jurisdictional claims in published maps and institutional affiliations.

