Article

A Spatial-Scale Evaluation of Soil Consolidation Concerning Land Subsidence and Integrated Mechanism Analysis at Macro-, and Micro-Scale: A Case Study in Chongming East Shoal Reclamation Area, Shanghai, China

1
College of Construction Engineering, Jilin University, Changchun 130026, China
2
Key Laboratory of Land Subsidence Monitoring and Prevention, Ministry of Natural Resources, Shanghai 200072, China
3
College of New Energy and Environment, Jilin University, Changchun 130021, China
4
Shanghai Institute of Geological Survey, Shanghai 200072, China
5
School of Geological Engineering and Geomatics, Chang’an University, Xi’an 710064, China
6
College of Geo-Exploration Science and Technology, Jilin University, Changchun 130026, China
*
Author to whom correspondence should be addressed.
Remote Sens. 2021, 13(12), 2418; https://0-doi-org.brum.beds.ac.uk/10.3390/rs13122418
Submission received: 13 April 2021 / Revised: 3 June 2021 / Accepted: 15 June 2021 / Published: 21 June 2021
(This article belongs to the Special Issue Applications of Remote Sensing in Geological Engineering)

Abstract

:
Land reclamation has been increasingly employed in many coastal cities to resolve issues associated with land scarcity and natural hazards. Especially, land subsidence is a non-negligible environmental geological problem in reclamation areas, which is essentially caused by soil consolidation. However, spatial-scale evaluation on the average degree of consolidation (ADC) of soil layers and the effects of soil consolidation on land subsidence have rarely been reported. This study aims to carry out the integrated analysis on soil consolidation and subsidence mechanism in Chongming East Shoal (CES) reclamation area, Shanghai, at spatial-, macro-, and micro-scale so that appropriate guides can be provided to resist the potential environmental hazards. The interferometric synthetic aperture radar (InSAR) technique was utilized to retrieve the settlement curves of the selected onshore (Ra) and offshore (Rb) areas. Then, the hyperbolic (HP) model and three-point modified exponential (TME) model were combined applied to predict the ultimate settlement and to determine the range of ADC rather than a single pattern. With two boreholes Ba and Bb set within Ra and Rb, conventional tests, MIP test, and SEM test were conducted on the collected undisturbed soil to clarify the geological features of exposed soil layers and the micro-scale pore and structure characteristics of representative compression layer. The preliminary results showed that the ADC in Rb (93.1–94.1%) was considerably higher than that in Ra (60.8–78.7%); the clay layer was distinguished as the representative compression layer; on micro-scale, the poor permeability conditions contributed to the low consolidation efficiency and slight subsidence in Rb, although there was more compression space. During urbanization, the offshore area may suffer from potential subsidence when it is subjected to an increasing ground load, which requires special attention.

1. Introduction

Worldwide, human civilization tends to be concentrated in coastal areas [1,2], resulting in increasing pressures on coastal living spaces. Hence, many coastal countries and regions [3,4,5,6] have reclaimed substantial land resources in recent decades, contributing considerably to the economic growth and urbanization process [7]. Shanghai, China, is located on a deltaic deposit near the estuary of the Yangtze River, which was developed in the interactive environment of the river and ocean. The sediments carried by the Yangtze River are deposited due to the combined effects of the widened river (Figure 1a), seawater support, and the flocculation phenomenon [8] (Figure 1b), contributing to the expansion of the coastal lands (Figure 1c). Nevertheless, the uplifted riverbeds of channels are not conducive for large vessels (Figure 1d). Therefore, dredging channel and hydraulic reclamation (Figure 1e) are the key measures to maintain the effective depth of water channels, to settle the dredged waste soil, to reap abundant reserve land resources, and to protect the marine and biological environments.
Within this framework, Shanghai has the largest newly reclaimed land in China’s coastal areas [9]. However, the widespread dredger load covers the original estuarine and littoral depositions in the whole reclamation area (Figure 1f), which can not only produce large deformation in dredger fill but can also cause varying degrees of consolidation deformations in underlying soft soil layers [10]. The deformations of multiple soil layers could result in a slow but continuous reduction of ground elevation, that is, land subsidence [11]. Land subsidence has been one of the nonnegligible topics attracting international attention, especially in reclamation areas [12], posing a series of environmental geological hazards such as ground fissures, ground collapse, saltwater intrusion, and may cause damages to farmland, infrastructures above and below ground [13,14,15].
The causes of land subsidence are complex [16]. When tectonic activity is insignificant, soil consolidation is the main cause of subsidence regardless of natural or man-induced causes [17,18,19]. Hence, it is pivotal to monitor land subsidence steadily and to evaluate the soil consolidation towards better construction planning for the follow-up civil works. Traditional in situ measurements such as leveling and Global Positioning System (GPS) can provide high-precision sparse point subsidence information but with low spatial resolution and high cost [20,21]. Furthermore, the in situ measurements are often not sufficient for newly reclaimed lands; the consolidation caused by the large-area coverage of dredger fill often has spatial characteristics. As a result, it is necessary to evaluate the soil consolidation from a newly larger scale than before. Within this framework, the InSAR technique, based on the exploitation of SAR acquisition sequences collected over large periods, allows providing useful deformation information on both the spatial and the temporal patterns with low operational cost, wide spatial coverage, and high spatial resolution [22,23,24,25].
With that, many scholars applied the InSAR technique to obtain large-scale subsidence information, and their deformation results were well-explained by soil consolidation. Jiang et al. [12] carried out the combined analysis of SAR interferometric and geological features to retrieve the long-term reclamation settlement of Chek Lap Kok Airport, suggesting that a still active primary consolidation contributed to the relatively fast settlement; Wang et al. [17] declared that the significant subsidence recognized in undeveloped reclaimed lands resulted from the consolidation of soft soil through the combined applications of persistent and distributed scatterers; Yang et al. [26] presented the spatio-temporal evolution pattern of Lin’gang New City reclaimed areas using InSAR methods and analyzed the deformation results based on historical reclamation activities, geological features, and soil compression mechanisms; Yu et al. [27] preliminarily explored the geological mechanism of differential land subsidence in Chongming East Shoal multi-phase reclamation area based on SBAS-InSAR algorithm and various indoor tests. Thus, land subsidence is closely related to the consolidation of loose soil. In particular, for land subsidence that occurred in reclamation areas, creep within the dredger fill, primary consolidation, and long-term secondary consolidation of alluvial clay deposits beneath the dredger fill are often considered as the three mechanisms in previous studies [12,28]. In fact, the above three mechanisms occur simultaneously, and the corresponding consolidation and deformation are difficult for traditional methods to evaluate and distinguish.
Hence, integrated analysis of the InSAR technique and geotechnical models were further applied to facilitate an understanding of the quantitative relationship between the ground deformation and the consolidation process. Kim and Won [29] analyzed the soil deformation by DInSAR, magnetic probe extensometer, and the hyperbolic model, whose results demonstrated that the combined analysis of the DInSAR and a prediction model was useful for geotechnical applications; Kim et al. [30] presented the measurements and predictions of subsidence using persistent scatterer (PS) InSAR and a hyperbolic model, whose result also declared that the hyperbolic model can effectively reflect the nonlinear subsidence (relative to time) caused by the stage of soil consolidation; Zhao et al. [31] jointly exploited PS and small baseline approaches to investigate the ground deformation in ocean-reclaimed areas of the Nanhui New City of Shanghai, China, and further estimated the future consolidation time based on geotechnical-derived models; Hu et al. [32] revealed the long-term exponentially decaying subsidence and predicted the subsidence trend in the near future based on the nearly decadal InSAR measurements and geotechnical consolidation model; Ciampalini et al. [33] suggested that the deformation velocities drop over time following a time-dependent trend that approximates the typical consolidation curve for compressible soils and further clarify the presence of a 15 m thick clay layer with poor geotechnical characteristics; Park et al. [34] used a hyperbolic model to relate the three independent time series and to estimate the nonlinear behavior of consolidation-triggered subsidence within coastal reclaimed land, whose results also indicate that although almost 20 years have passed since the completion of the reclamation project, the land subsidence is still ongoing.
Previous research has made substantial progress in the mechanism interpretation of the InSAR-derived subsidence information from the perspective of soil consolidation. Nevertheless, the InSAR technique is rarely used to analyze the degree of soil consolidation from a spatial scale, especially when in situ monitoring is not enough; also, affected by multi-phase reclamations, soil layers within different phase reclamation areas may show various consolidation efficiency, while the comparative analysis of the differential subsidence and consolidation characteristics in different reclamation area is dramatically insufficient; besides, the research on the multi-scale correlation mechanism of soil consolidation and ground deformation combined with remote sensing monitoring and various indoor test methods still needs further exploration.
Therefore, based on the previous study [27], the overview of the study area and the obtained map of ground deformation distribution are introduced first. Then the field investigations and macro-scale experiments are conducted to clarify the stratigraphic structure, to identify the present compression layers that contribute to the land subsidence, and to reveal the compressibility and permeability of multiple soil layers. Afterward, combined with the hyperbolic (HP) model commonly used in the above literature, the three-point modified exponential (TME) model is also utilized to estimate the average degree of consolidation (ADC) at the spatial scale. The “average” here is embodied in two aspects: one is to model based on the cumulative deformation of multi-layer soil, and the other is to not deliberately distinguish between primary consolidation and secondary consolidation. Furthermore, the macro geological features were measured to clarify the macro permeability-consolidation characteristics and to identify the representative compression layer that contributes to the observed land subsidence. Moreover, the microscopic pore and structure tests were also applied because they could facilitate an understanding of the mechanism of differential consolidation characteristics and further verify the rationality of the estimated spatial-scale ADC. Hence, the correlations between the land subsidence and permeability-consolidation characteristics and micro-scale pores and structural parameters could be revealed. The results and conclusions obtained in this study can serve as valuable references and have important meaning when evaluating the soil consolidation characteristic at multi-scale and analyzing the corresponding risks of potential land subsidence worldwide.

2. Materials and Methods

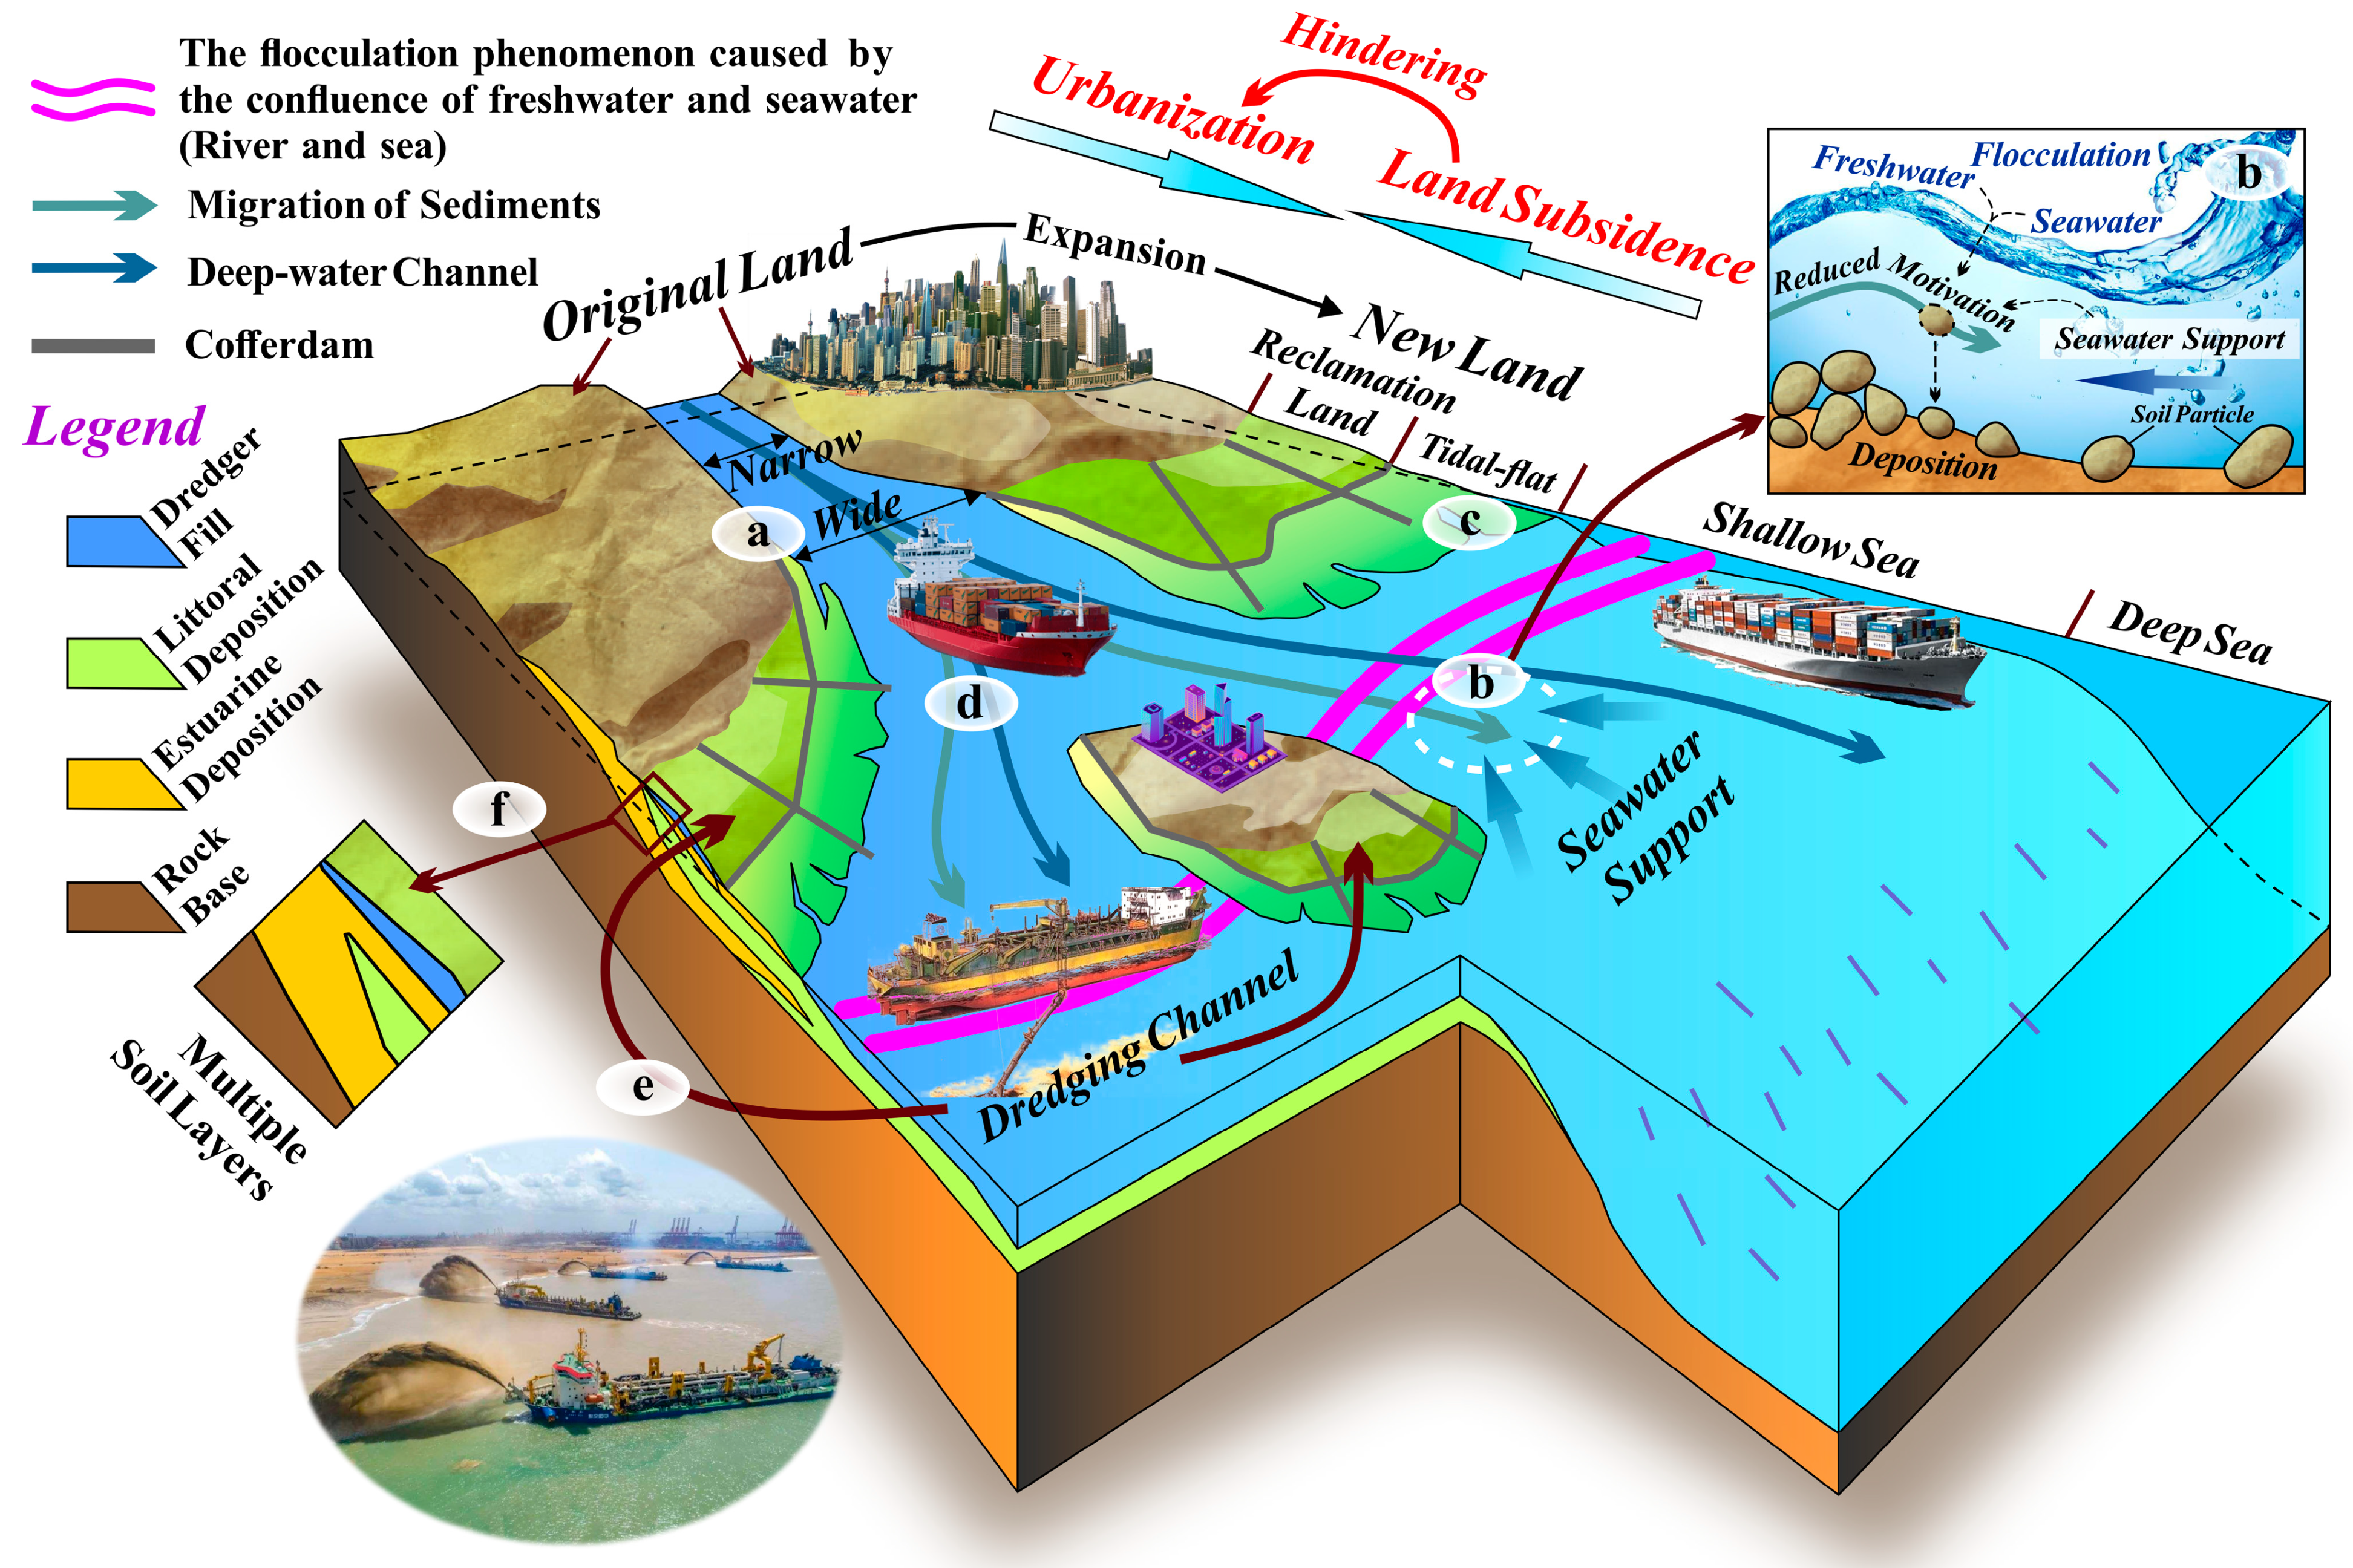
2.1. Study Area and Ground Deformation

2.1.1. Chongming East Shoal

Since 1984, more than 400 km2 of land was successfully reclaimed in Shanghai, mainly including Pudong Side Shoal, Hengsha East Shoal, and Chongming East Shoal (Figure 2a). Among them, the Chongming East Shoal (CES) is geographically located at the north-eastern corner of Shanghai, consisting of multi-phase reclamation projects from onshore to offshore lands (Figure 2b). The whole reclamation area was bounded by five cofferdams that were built in 1949, 1964, 1976, 1990, and 1998. Consequently, the more eastward the reclamation area was, the later the “new land” was finished. The thickness of the Quaternary strata in Shanghai is about 250–300 m, under which there are many structural faults arranged in an echelon pattern. However, the faults are all small in scale. Moreover, the maximum activity rate was only 0.06–0.08 mm/y [35], so the overall activity of the faults in CES is not strong. The lithology of the rock base is dominated by relatively hard massive-thick bedded intermediate-acid lava and tuff and a small amount of intermediate-acid dyke rocks; this structure type has no land subsidence effect [36].
Moreover, groundwater overexploitation in Shanghai has been effectively controlled [37], and the deformation caused by soil consolidation is becoming more and more prominent. The land subsidence effect of engineering construction is gradually prominent, which has become one of the new constraints of Shanghai’s land subsidence in recent years [13]. Although the reclaimed lands in CES are mainly used for agriculture, many construction lands have been being planned (Figure 2c), indicating accelerating urbanization. Meanwhile, the construction of the Chongming Metro line will surely drive future development and construction, wherein land subsidence is therefore attracting increasing attention.
In particular, the northeastern part of the CES was reclaimed late (about 2015) and therefore subsided fast. The northeastern part has not been fully utilized yet. Meanwhile, the southeast part is still a tidal flat without a reclamation project, and the increasing ground elevation is induced by sediment accumulation. The ground deformation in these two areas has nothing to do with the current urbanization [27]. Therefore, this paper chooses the reclamation area (Figure 2c) in the east of Hu-Shan Expressway (G40) and the west of the cofferdam built in 1998 as the key study area.

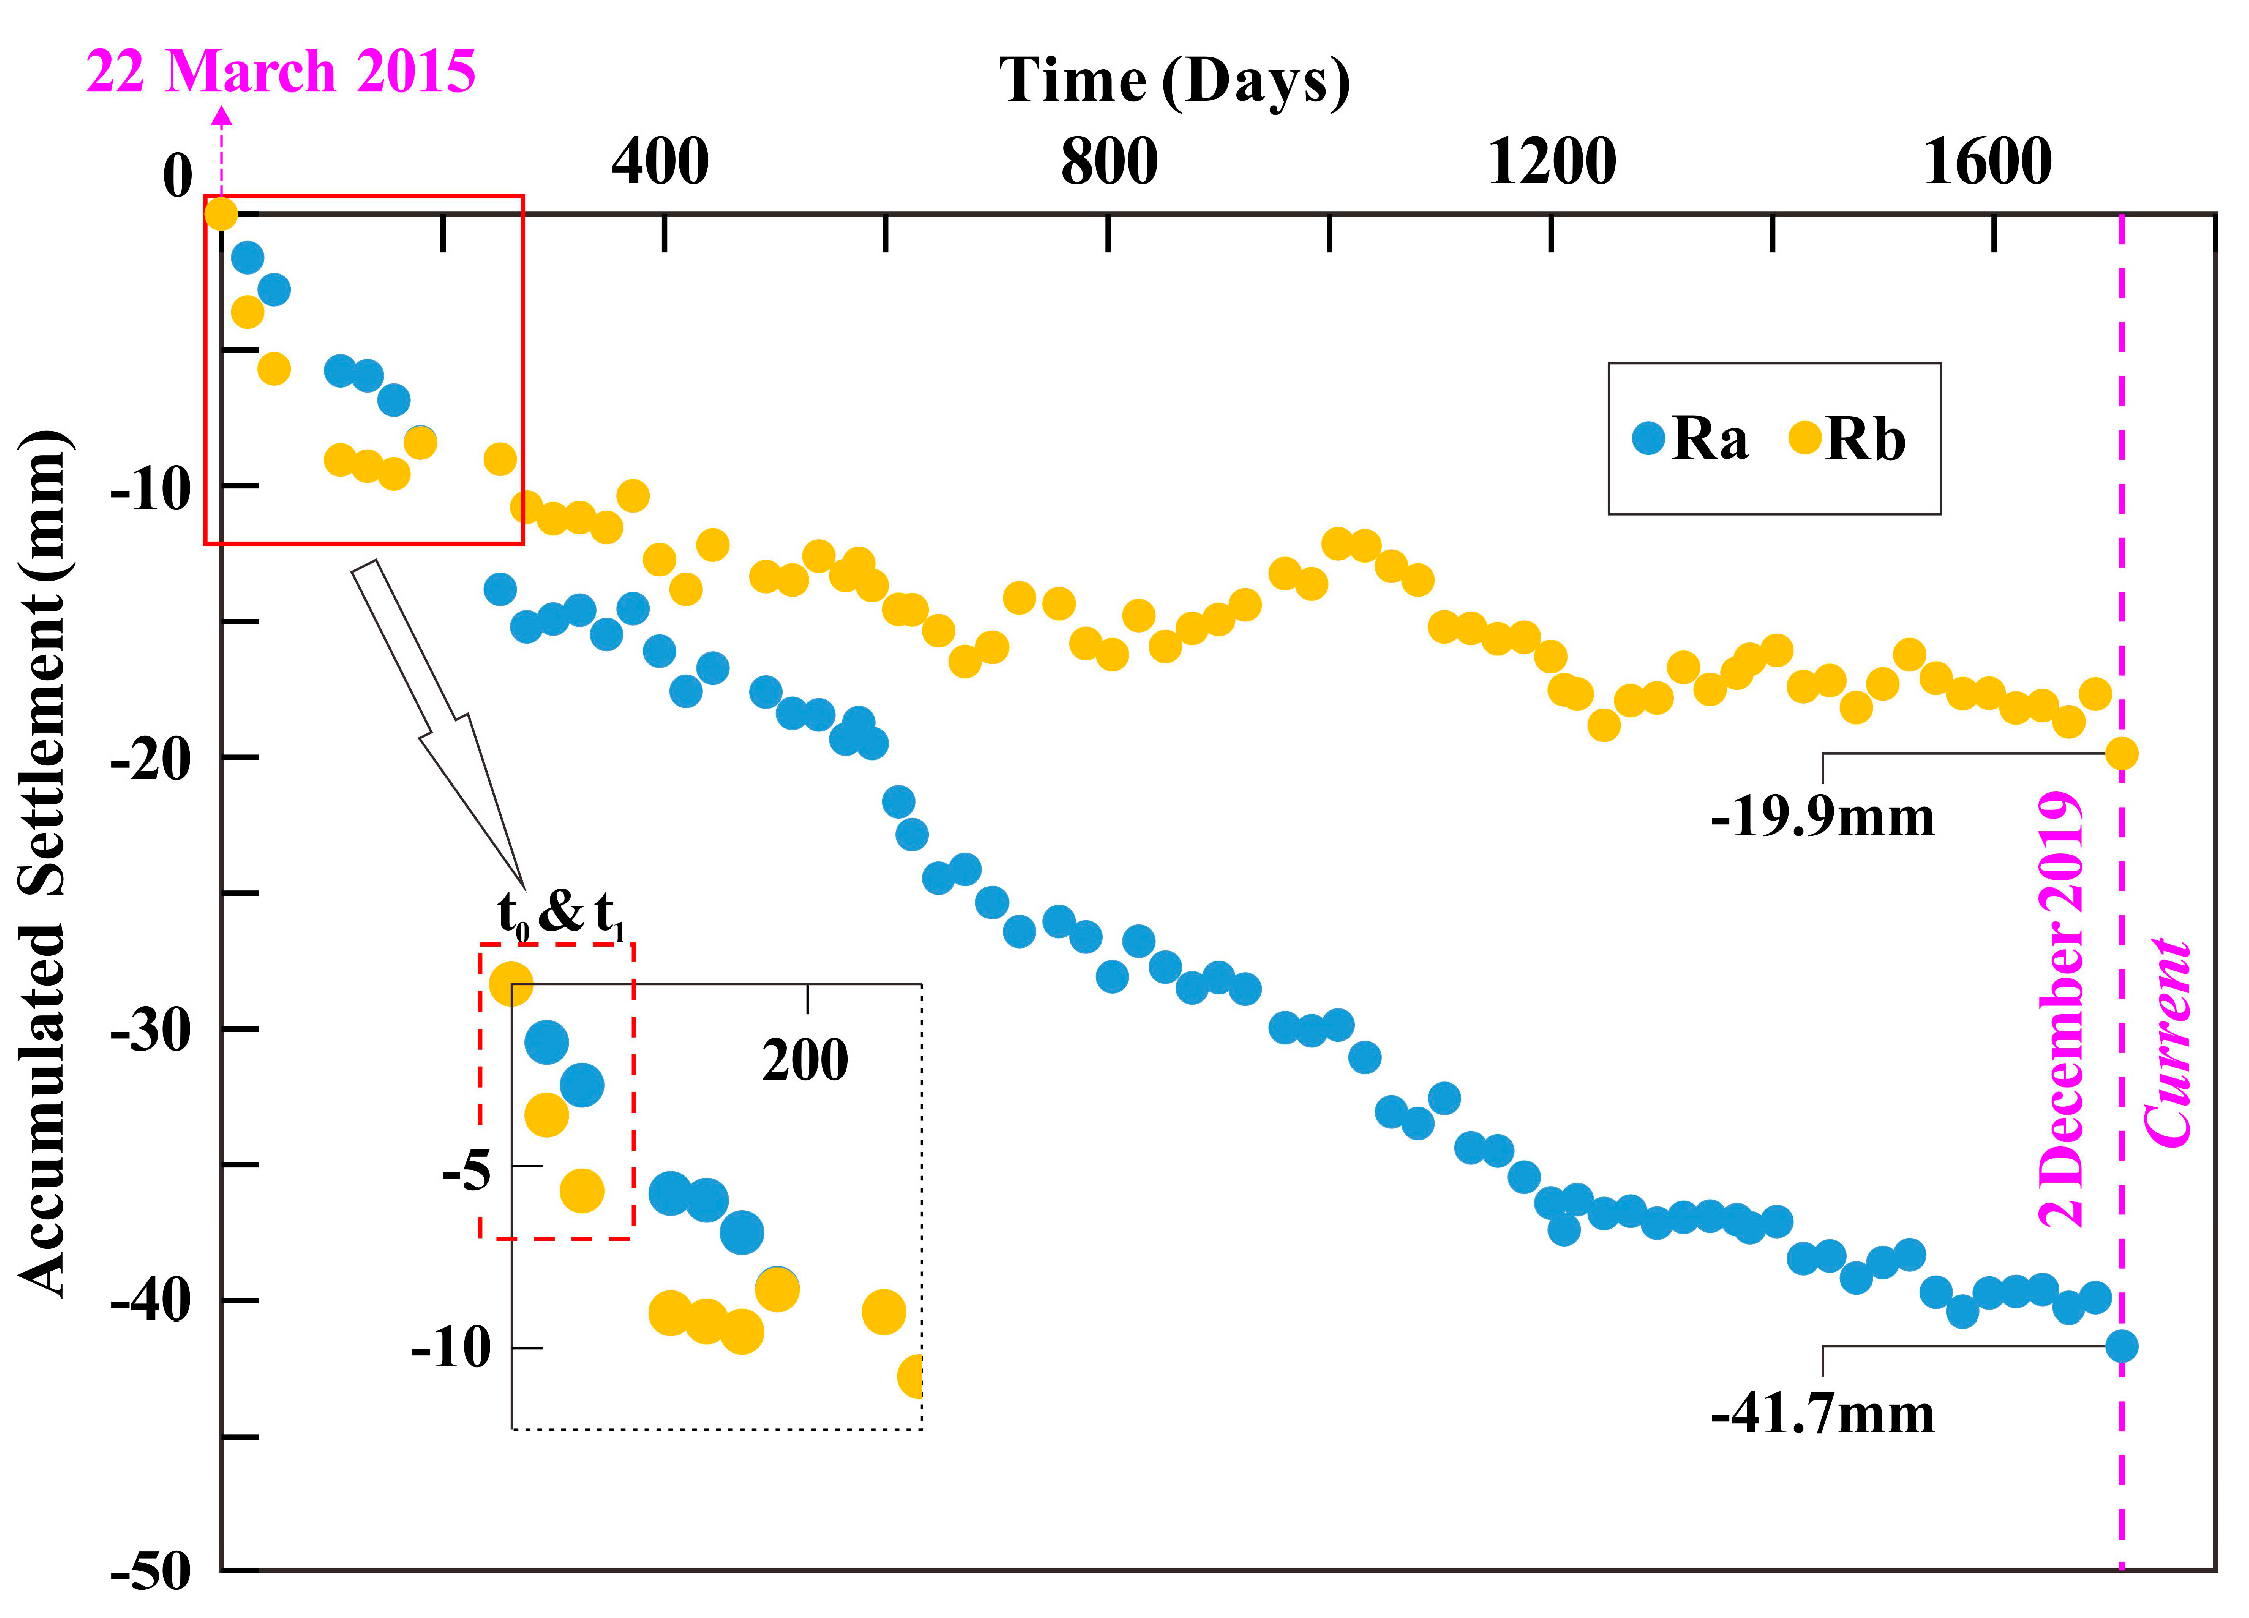
2.1.2. SBAS-Insar-Based Deformation Extraction

For semi-urbanized and agricultural environments, the small baseline subset (SBAS) InSAR [38,39,40] is commonly used to detect long-term ground deformation at a relatively large spatial scale [12], so it is not appropriate for analyzing local deformations that may affect, e.g., single buildings or structures [39,41]. Therefore, the SBAS-InSAR could be used in CES to monitor deformations occurring in reclamation areas. The SBAS algorithm generates numerous interferograms of the SAR images covering the study area at different periods, the core idea of which is to minimize the geometric decorrelation of the interferograms through small baselines [42,43]. For a certain interference image pair (generated by two images A and B), its composition of the phase differences (∆ϕA − B) can be given by
Δ ϕ A B = Δ ϕ d e f + Δ ϕ t o p o + Δ ϕ o r b + Δ ϕ a t m + Δ ϕ n o i s e
where ∆ϕdef, ∆ϕtopo, ∆ϕorb, ∆ϕatm, and ∆ϕnoise represent the phase difference caused by the deformation, topography, orbital errors, atmospheric disturbance, and other noises, respectively. The ∆ϕdef can be obtained when the residual components are removed from the interferometric phase. The deformation velocity can by calculated when the least square or singular value decomposition methods are performed on all of the generated interferograms.
In the previous study [27], SBAS-InSAR was used to process 70 Sentinel-1 SAR images covering CES and to derive the ground deformations (Figure 2d) during the period of 22 March 2015 to 2 December 2019. The study of the land subsidence in CES is in its infancy; although the in situ monitoring points have been widely arranged, there is no abundant available data at present. Within this framework, only one leveling point (Figure 2d), provided by the Shanghai Institute of Geological Survey (SIGS), measured in 1996, 2002, 2007, 2012, and 2017, can be utilized to validate the deformation results. The height differences between two adjacent measurements were converted into yearly velocities in the periods of 1997–2001, 2002–2006, 2007–2011, and 2012–2016. Afterward, as shown in Figure 2e, the estimated velocities of each period were plotted and fitted to obtain the predicted velocity from 2017 to 2021 (labeled as νL, νL = –2.0 mm/y). The leveling site was located on the side of the road, indicating a reliable coherence. For the same location, the SBAS-derived deformation velocity (labeled as νS, νS = –2.1 mm/y), showed reasonable consistency with the fitted velocity (νL). Therefore, considering that the data source and deformation process are consistent [23], the SBAS method could yield relatively reliable deformations in CES. Within cofferdam 1998, the widespread crops and some paddy fields (Figure 2c) in western reclamation area could weaken the coherence, resulting in increasing content of mixed pixels (uplift and subsidence). The mixed pixels may interfere with time-series deformation to a certain extent. Therefore, based on the existing deformation map (Figure 2d), two rectangular regions of interest (ROIs) labeled as Ra (0.75 × 0.95 km2) and Rb (1.0 × 1.7 km2), with uniformly distributed subsidence pixels, along expansion direction of CES, were selected (Figure 2d) in this work. Ra stands for western early-reclaimed land while Rb represents the eastern late one. The selections of Ra and Rb could enhance the contrast of the spatial-, macro-, and micro-scale consolidation characteristics in different reclaimed phases. With the ROIs determined, the “subset data from ROIs” tool embedded in ENVI and SARscape could count all the pixels that were included in Ra and Rb to obtain the regional time series deformation. Time series deformation derived by SBAS is relative to the initial acquisition time (22 March 2015), the time unit of which was converted from the acquisition dates of SAR image to days for a time-continuous settlement curve.

2.1.3. Field Investigations and Stratigraphic Structure

Typical strata in CES are characterized by a very thick Holocene clayey deposition, which differs from the urban center. Field investigations were conducted with two 55 m-deep boreholes Ba and Bb, whose locations are involved in the two ROIs of Ra and Rb (Figure 2c), for collecting undisturbed soil samples in various horizons. As shown in Figure 3, four common engineering geological layers that include ①3-2 dredger fill (DF), ②2-3 sandy silt (SS), ⑤1-1 clay (CL), and ⑤1-2 silty clay (SC) divided by their geological ages, soil behaviors, and physical and mechanical properties [26,44,45] were the focuses of this study. In particular, the thickness of both the CL and the SC accounts for about 60% of the borehole depth. Due to the shallow depth of groundwater (<2 m), the collected undisturbed soil samples were very moist. When the surface of the soil sample is scraped (Figure 3), it is clear that the surface of the CL is the most delicate, while the other soil layers are relatively rough.

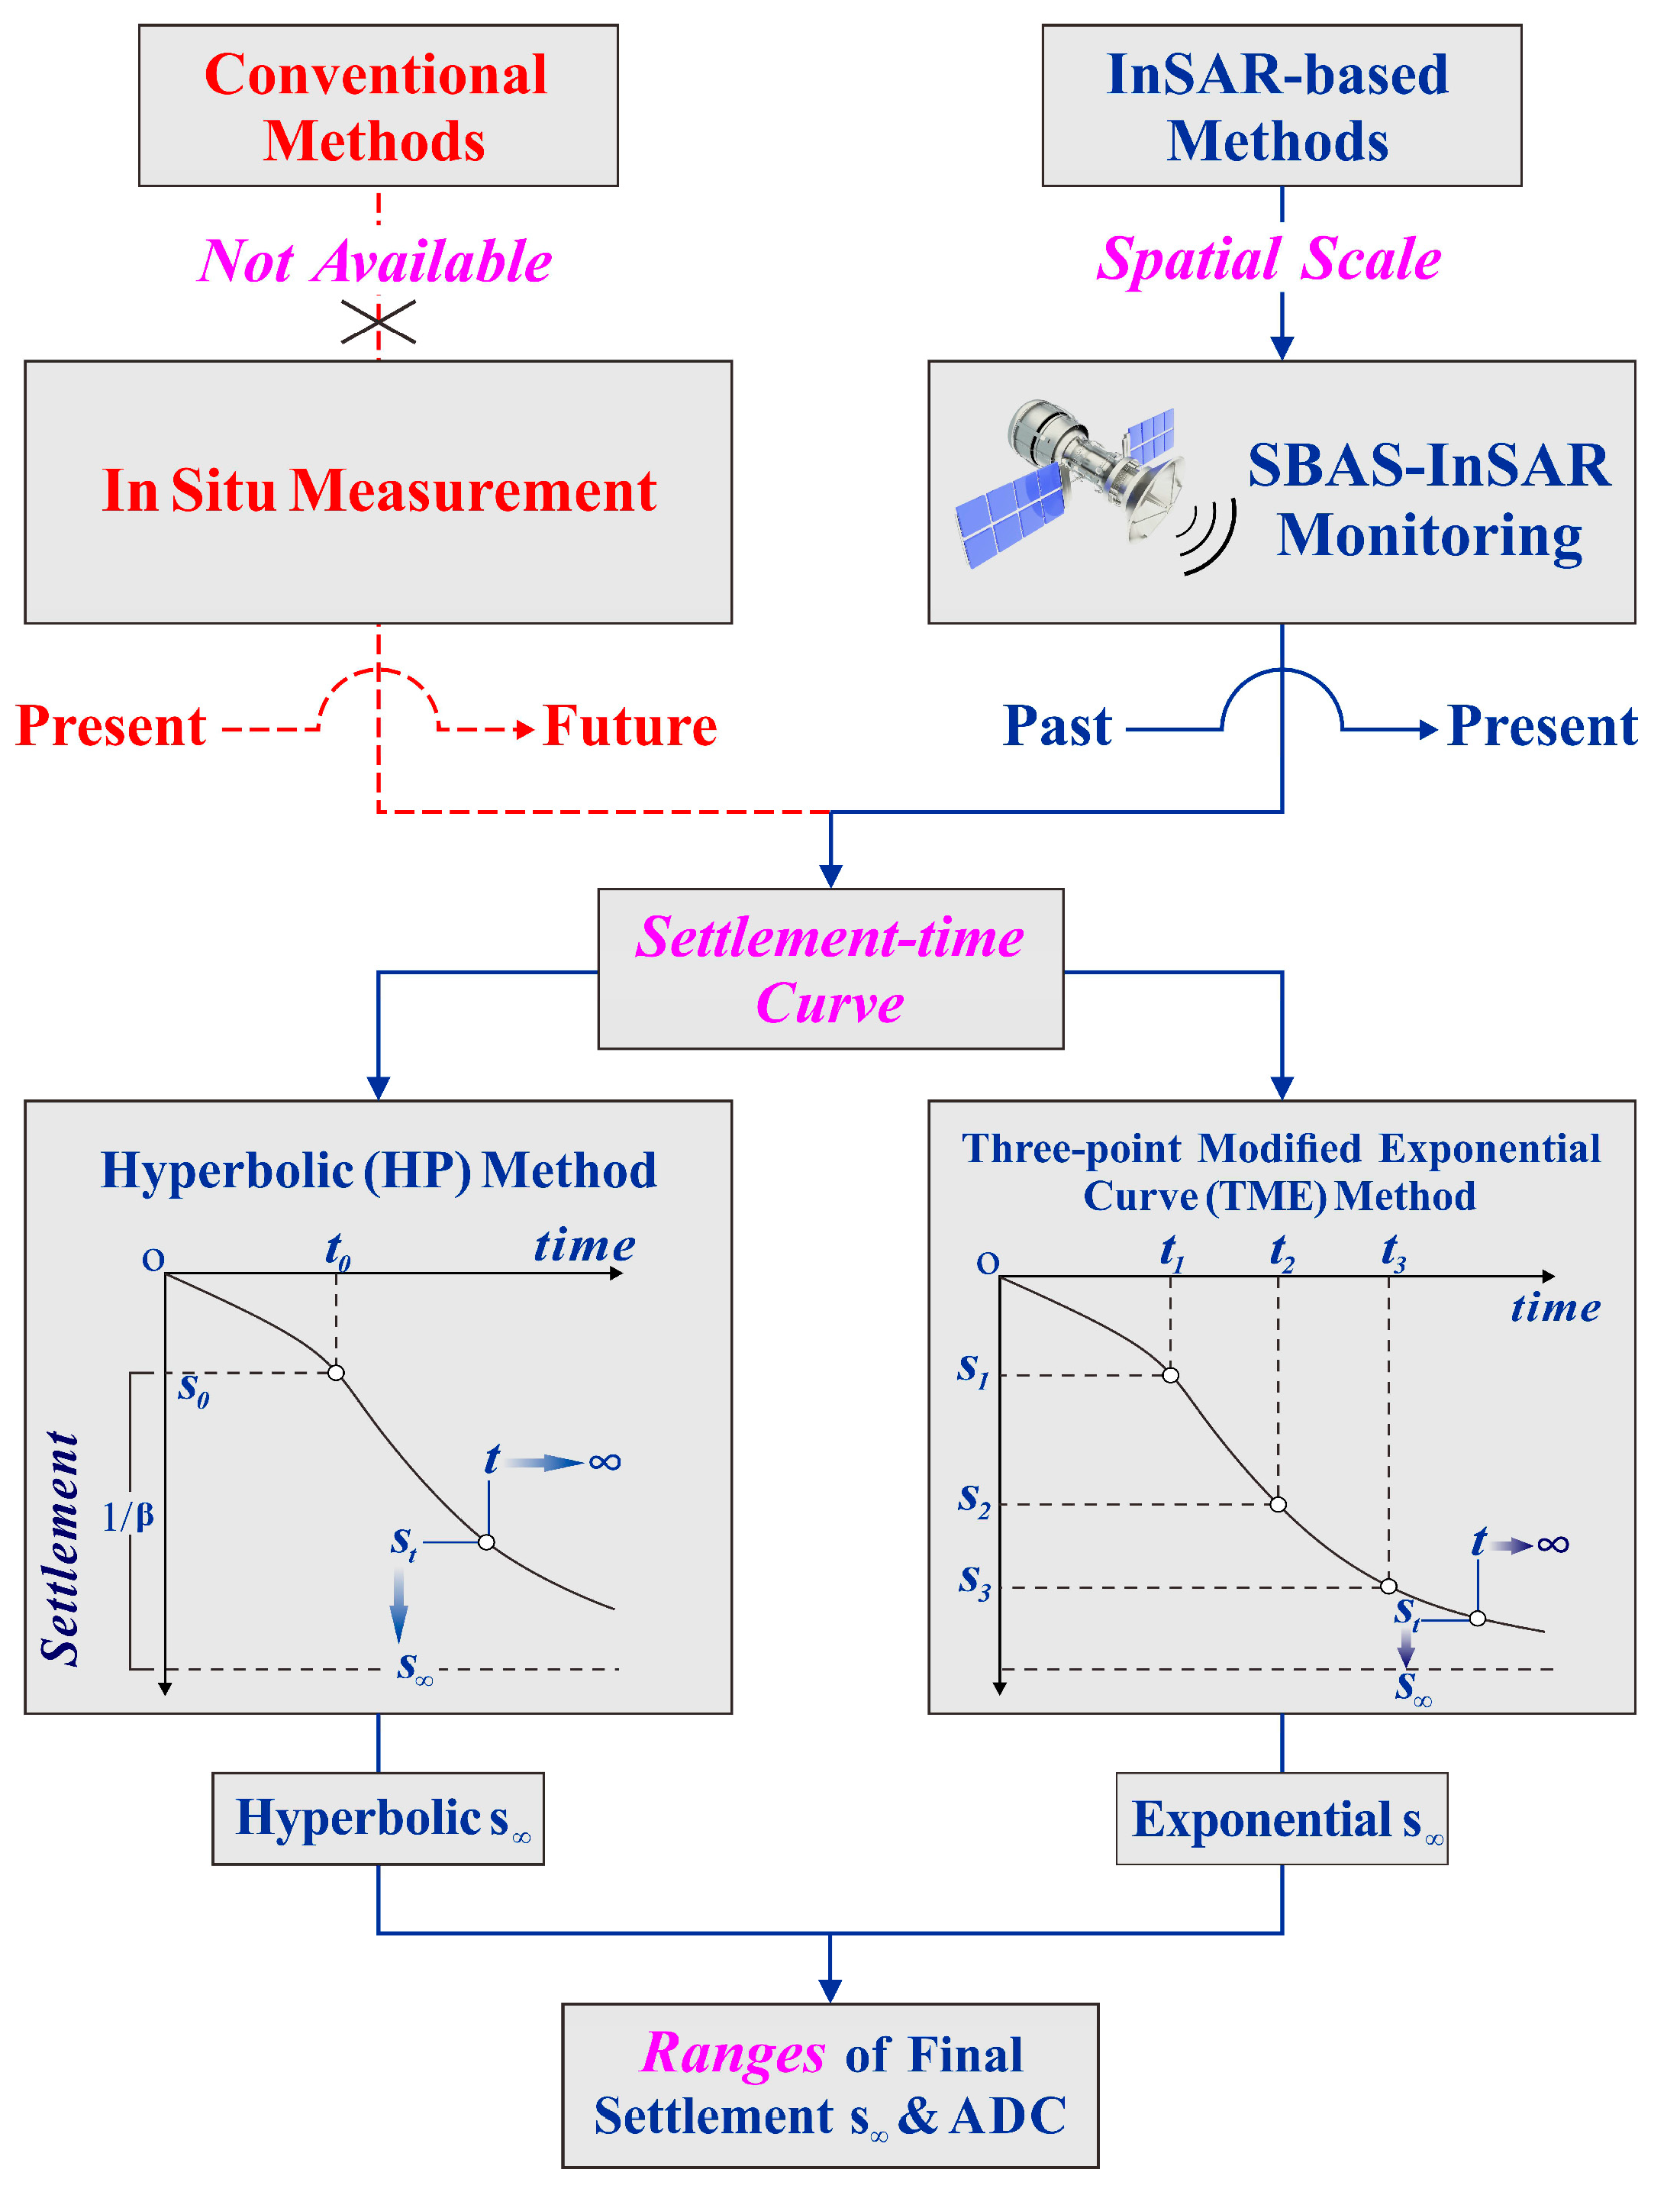
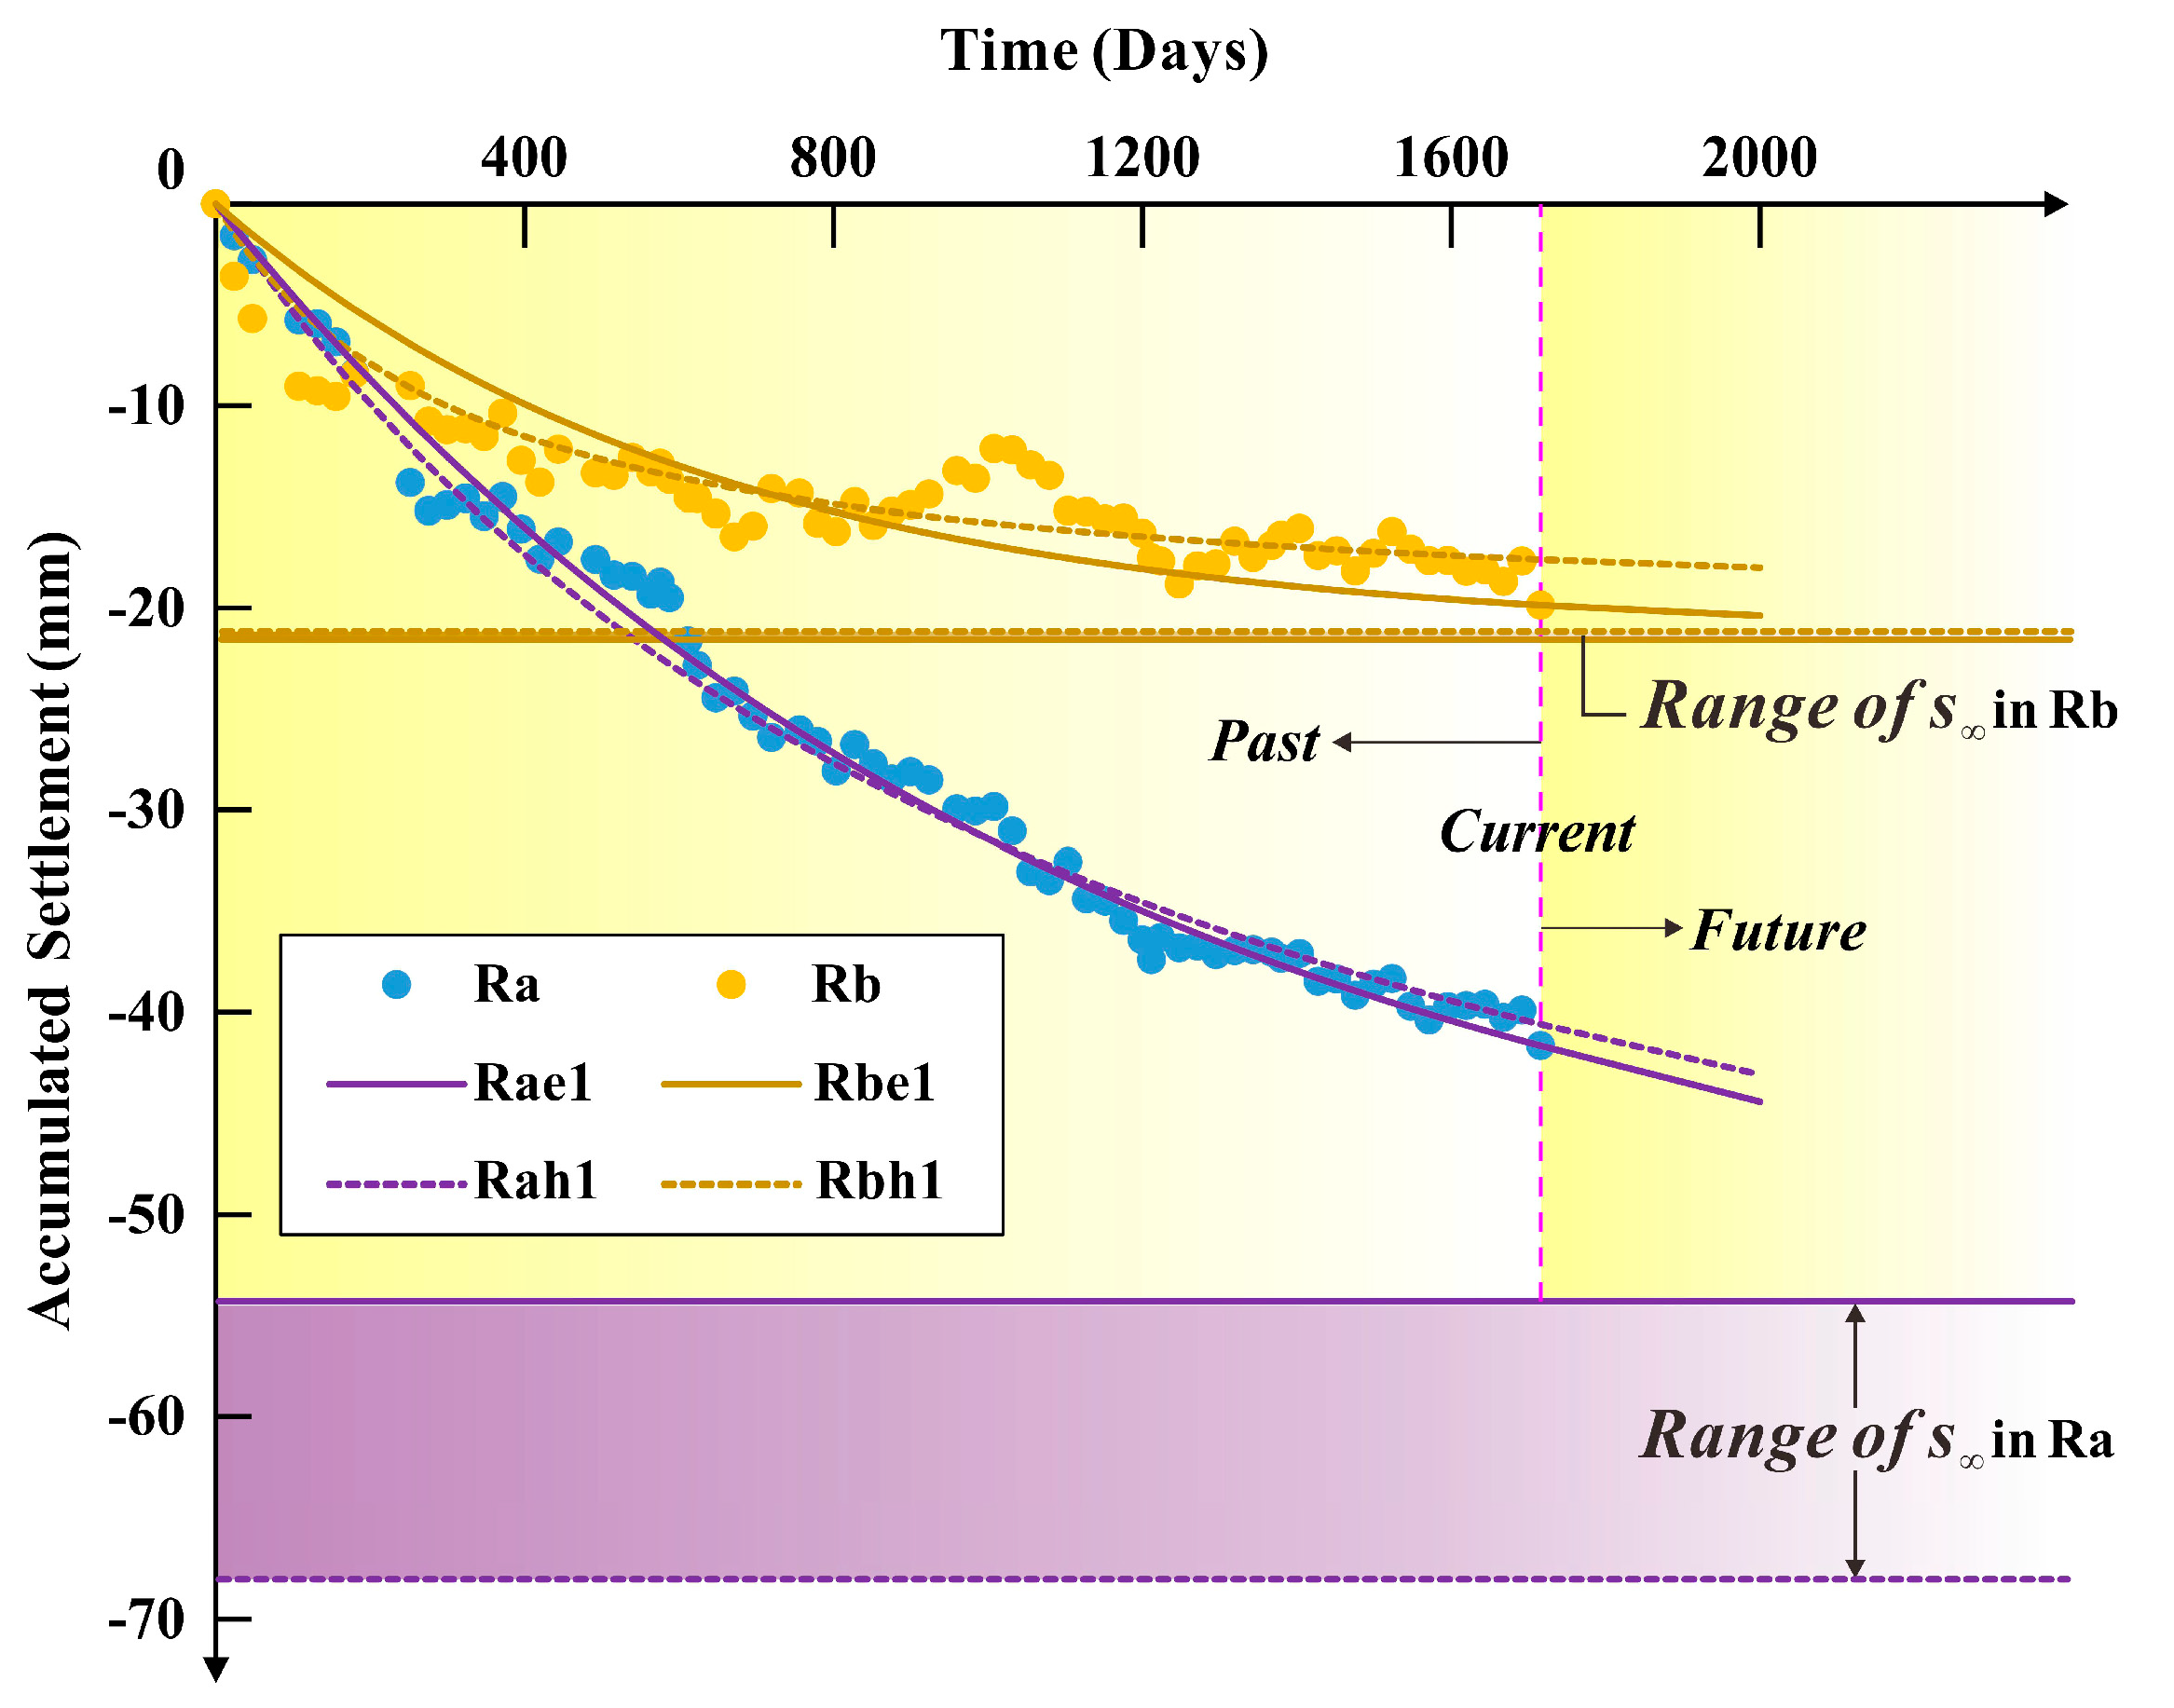
2.2. Combined Application of HY and TME Methods

Soil consolidation associated with land subsidence is a dynamic process. In practice, the analysis and prediction of consolidation subsidence are often difficult due to the complexity of the actual ground conditions [46]. The ADC, capable of effectively facilitating an understanding of the consolidation development within multiple soil layers under a certain pressure, can be calculated separately by stress or strain. In this study, the ADC was defined by strain [47]:
U t = s t s 100 %
where the st is the settlement at a certain time t, and the s is the potential ultimate settlement. Accordingly, the Ut is the ADC at time t. However, the s is unknown and has to be reliably estimated. At present, there are roughly two types of soil settlement prediction methods: one is theoretical calculation method and numerical simulation method; the other is nonlinear method and curve fitting method. The former contains certain assumptions and simplified conditions, and the calculation process is dependent on extensive soil parameters; the latter is based on the measured deformation data, which not only has a certain theoretical basis but also can make full use of the field measured data, and the operation is relatively simple. Furthermore, compared with the nonlinear method, the curve fitting method is more intuitive, so it is easy to popularize in engineering. Within this framework, the HP method and exponential curve method, as typical curve fitting methods, have proved to be effective in deriving reasonable s caused by various types of consolidation [47,48,49,50]. However, the traditional exponential curve model is relatively strict to the monotonicity of observed settlement data, presenting bad performance when the settlement magnitude is small and the monitoring curve is relatively fluctuated [51]. Therefore, the TME method was chosen. As shown in Figure 4, due to the limited in situ measurement, it is difficult to evaluate the soil consolidation characteristics at the spatial-scale, while the InSAR technique provides a new avenue to obtain the settlement-time curve from the past to the present. On this basis, the HY method and TME method can be applied. We here provide simplified theories of the two methods.

2.2.1. HY Method

For the HY method (Figure 4), the st after the point (t0, s0) can be given by
s t = s 0 + t t 0 α + β ( t t 0 ) ,   t > t 0
where α and β are undetermined coefficients. Equation (3) can be rewritten as
t t 0 s t s 0 = α + β ( t t 0 )
Taking (tt0) as X and (tt0)/(sts0) as Y, a plane rectangular coordinate system can be established with the following vectors:
{ X = [ ( t 1 t 0 ) , ( t 2 t 0 ) , ( t 3 t 0 ) , , ( t n t 0 ) ] Y = [ t 1 t 0 s 1 s 0 , t 2 t 0 s 2 s 0 , t 3 t 0 s 3 s 0 , , t n t 0 s n s 0 ]
The slope β and intercept α can be estimated by a linear regression line. The st can be obtained by substituting α and β back to Equation (3). When t tends to infinity, the s is
s = lim t s t = lim t [ s 0 + t t 0 α + β ( t t 0 ) ] = s 0 + 1 β

2.2.2. TME Method

The TME method assumes that the settlement velocity after the point (t0, s0) varies at a negative exponential pattern (Figure 4):
d ( s t s 0 ) d t = θ e t t 0 η ( θ > 0 , η > 0 , t > t 0 )
where θ and η are undetermined coefficients. Both sides of Equation (7) are integrated with (tt0) as follows:
s t s 0 = t 0 t θ e t t 0 η d t = θ η ( 1 e t t 0 η )
When t tends to infinity, the s is
lim t ( s t s 0 ) = lim t [ θ η ( 1 e t t 0 η ) ] s s 0 = θ η
In such a case, st can be determined by combining Equations (8) and (9):
s t = s ( s s 0 ) e t t 0 η
Select three points (t1, s1), (t2, s2), and (t3, s3) from the settlement–time curve, where t1 < t2 < t3, t3t2 = t2t1 = ∆t, s1 > s2 > s3, s2s1 < s3s2 (s < 0), and let t1 = t0; substitute the selected these three points into Equation (10):
s = s 2 2 s 1 s 3 2 s 2 s 1 s 3
η = Δ t ln s s 1 s s 2
Note that when there is no corresponding settlement for t2, the s2 can be obtained by linear interpolation between two adjacent points. Moreover, the ∆t should be long enough to improve the accuracy of the TME method by weakening the local contingency.

2.2.3. Joint Determination of ADC

As soil mass is a complex and heterogeneous geological aggregate, using a single ADC to evaluate soil consolidation partly increases the uncertainty of the results. Moreover, land subsidence is often nonlinear. Hence, ranges of s and ADC at time t are determined by Equation (13) instead of a comparison of the two prediction methods.
{ s = [ max ( Hyperbolic   s , Exponential   s ) , min ( Hyperbolic   s , Exponential   s ) ] U t = [ min ( Hyperbolic   s t Hyperbolic   s , Exponential   s t Exponential   s ) , max ( Hyperbolic   s t Hyperbolic   s , Exponential   s t Exponential   s ) ] s t , s < 0

2.3. Conventional Tests

Conventional tests were conducted to obtain macro-scale geological features following relevant guidance and literature [52,53]. The sieving and hydrometer methods were carried out to obtain the granulometric compositions of soil including sand (2–0.075 mm), silt (0.075–0.005 mm), and clay (<0.005 mm) [54]. Water content was determined gravimetrically by oven drying at 105 °C over 8 h; a standard cutting ring was used to measure bulk density; particle density of soil was obtained by the pycnometer method because of the small particle diameter (<5 mm). Moreover, saturation and porosity were indirectly calculated from the above parameters [10]. The cation exchange capacity was determined by the ferric ammonium EDTA method.
A KTG-GY automatic consolidation apparatus that can automatically load and record data was utilized for laterally constrained compression with a pressure order of 0.0125, 0.025, 0.05, 0.1, 0.2, 0.4, 0.8, and 1.6 MPa. Then, the compression index, pre-consolidation pressure, and self-weight pressure were calculated for each soil so that the over-consolidated ratio (OCR) could be determined to identify the compression layer as there are no sufficient borehole extensometer or other in situ measurements.
The variable head permeation test was carried out to measure the vertical hydraulic conductivity (kv), considering that the stratum in this work is horizontally distributed. The utilized automatic permeation-pressure tester (LFTD-1406) could automatically collect data and select the stable permeation period to calculate the kv:
k V = 2.3 aL A t Log h 1 + P h / 0.1 γ ω h 2 + P h / 0.1 γ ω
where a is the cross-sectional area of the measuring tube, a = 0.785 cm2; L is the permeation path (the height of the soil sample), L = 2 cm; A is the area of the soil sample, A = 30 cm2; t is the elapsed time (s); h1 and h2 are the initial water head and the end water head (cm), respectively; γω is the density of water, γω=1 g/cm3; Ph refers to the applied head pressure (kPa), which was determined by pre-tests to avoid the soil sample being eroded under a relatively high Ph or the test extremely time-consuming with a relatively low Ph [55]. An appropriate Ph could produce slow and stable seepage. Finally, the Ph of DF, SS, CL, and SC was set as 2 kPa, 2 kPa, 20 kPa, and 14 kPa, respectively. The h1 was uniformly 50 cm. A test was finished when the water head drops 3 to 5 cm, after which the water head would be restored to 50 cm. Three to five parallel tests were carried out on each soil sample, and the average of them was taken as the final kv of the corresponding soil layer.

2.4. Microscopic Pore and Structure Tests

The microscopic pore and structure tests are conducted to clarify the mechanism of differential consolidation characteristics and to verify the rationality of the estimated spatial-scale ADC. In this work, the freeze-drying method was used to prepare soil samples with undamaged structures. The core operation consisted of two parts: the first step was to put the wet soil sample into liquid nitrogen (−196 °C) for freezing treatment, so that the water in the soil pores could be condensed into nonexpanding amorphous ice; the second step was to vacuum the frozen soil sample at −50 °C for more than 15 h using a freeze dryer (Beijing Boyikang Experimental Instrument Co. Ltd., Beijing, China), so that the amorphous ice in the soil could sublimate directly. Hence, without destroying the original structure, the dry microscopic soil samples were obtained.

2.4.1. MIP Test

The pore characteristics of soil are important to reflect the soil structure. The mercury intrusion porosimetry (MIP) test was conducted on a representative compression layer to clarify the micro-scale pore distribution. The used AUTO-PORE 9500 (Micromeritics Instrument Corp., Norcross, GA, USA) can measure the pore diameter in the range of 0.003–360.000 μm. The measured pores were classified as micropores (<0.04 μm), small pores (0.04–0.4 μm), mesopores (0.4–4 μm), and macropores (>4 μm) [56] to directly analyze the contents of pores with various ranges of diameter.
Fractal theory-based [57] morphological fractal dimension was calculated to reflect the distribution characteristics of pores in three-dimensional space [58]. The higher the value of the fractal dimension is, the rougher the pore surface is, and the more complex the pore space morphology is. First, the relationship between cumulative pore volume V (mL/g), pressure P (Pisa), and morphological fractal dimension D is as follows [59]:
d V d P = k P D 4
where k is a constant. Then, take the logarithm of both sides of the Equation (15) to get:
log d V d P = log k + ( D 4 ) log P
Finally, using log(dV/dP) as the ordinate and logP as the abscissa to establish a plane rectangular coordinate system, the fractal dimension D could be obtained by linear fitting with the least square method.

2.4.2. SEM Test

The scanning electron microscopy (SEM) analysis was conducted on a representative compression layer to observe the microstructure and particle arrangement [60] based on Phenom ProX (Generation 5) apparatus. Both single soil particle and aggregates could be considered as structural units (SUs) at micro-scale. The WD-5 image processing system was used to binarize the SEM images and then to separate the SUs and the pores from SEM images based on the selected threshold. During binarization, the grey value of each SEM image was transformed into the value corresponding to the mean value of the normal distribution, which was chosen as the threshold value [61]. Furthermore, the relationship between soil microstructure and consolidation was quantitatively analyzed from the aspects of size, shape, and arrangement of structural units based on the measurements of the following parameters [62]:
D = 2 A π , R = A A , F = P L
A D = i = 1 n D i n , A R = i = 1 n R i n , A F = i = 1 n F i n
F ( α ) = n α n , σ F ( α ) = i = 0 18 ( F ( α ) F ( α ) ¯ ) 2 18 1
For a certain SU (Equation (17)), the equivalent diameter (D), used to describe the size of the SU, refers to the diameter of the circle whose area is equal to the actual area of the SU (A); roundness (R) could describe the degree to which the shape of SU approaches the circle. A’ is the area of the circumscribed circle of the SUs. The value of R is in the range [0,1]. When the R-value is higher, the circumscribed circle is filled more fully by SU, so the shape of the corresponding SU is closer to the circle; shape factor (F) is utilized to describe the variation in the shape of the SU. P represents the perimeter of a circle with an equal area while L refers to the actual perimeter. The value of F ranges from 0 to 1. The larger the value of F, the more complex the shape of the SU.
In practice, there are n SUs in an SEM image. Hence, the average value of D, R, and F overall SUs are taken as the AD, AR, and AF (Equation (18)) to represent the whole microstructure characteristics. The subscript i refers to the i-th SU among n SUs. Finally, the directional frequency (F(α)) shown in Equation (19) is a parameter that can reflect the directional arrangement of SUs. With a directional angular density of Δα = 10°, 180° can be divided into 18 directional angle intervals (αi = i × 10°, i = 0, 1, 2, …, 18). nα represents the number of the orientation angle which is in the range [αi−1, αi] (1 ≤ i ≤ 18). Moreover, the standard deviation of F(α) (σF(α)) was calculated to quantitatively measure the directionality. The greater the σF(α) is, the higher the fluctuation degree of the Fi(α) distribution is, which means that more SUs are concentrated in one or several angle intervals, resulting in better directionality.

3. Results and Discussion

3.1. Spatial-Scale Estimation of ADC within Multiple Soil Layers

The SBAS-based settlement-time curve was shown in Figure 5. The settlement curves in Ra and Rb are not strictly monotonic; especially, the settlement in Rb presents a larger degree of fluctuation than that in Ra, which may be derived from the following two aspects. On the one hand, the widespread crops in Rb could reduce the temporal coherence due to the physical changes in the surface over the period between observations [43] and weaken the reflection efficiency of the radar signal, resulting in a relatively lower deformation accuracy; on the other hand, the Rb also contains a small number of uplifted pixels, which could also intensify the fluctuation of the settlement data to a certain extent. Nevertheless, the convergence trend of settlement is unequivocal. Compared with the local fluctuation of the settlement curve, we pay more attention to the overall deformation trend of multiple soil layers. Consequently, it is appropriate to choose the TME method [51] so that the slight fluctuation of data could be mitigated.
As there is no obvious inflection point on the two curves, the initial 3 points (t0 = 0, 24, and 48 days) are selected in turn as the t0 in HY method and as the t1 in the TME method (Figure 3a) to involve more monitoring data as much as possible. The settlements at 1716 days were set as the present settlement during ADC estimation. For the TME method, let t1 = t0, t3 = 1716 so that the ∆t could be long enough. The prediction results are shown in Table 1.
For Ra, both the HY method and TME method show an excellent fitting effect (R2 > 0.98); the average s and ADC of the three prediction models that were established by the HY method are −68.4 mm and 60.9% in Ra, and they are −54.3 mm and 76.7% derived by TME method; Ra underwent a relatively rapid settlement during the monitoring period, the residual subsidence of which will continue over future years but with decreasing velocities.
For Rb, a fairly good fitting effect with settlement could be observed (R2 > 0.81); HY method derived average s∞ (−21.2 mm) and ADC (93.8%) are extremely close with those derived by the TME method, −21.6 mm and 92.2%. As the ADC in Rb is more than 90%, the settlement here is relatively stable, indicating that when land-use type does not change a lot, and only slight subsidence can occur in the future.
Table 1 also shows that, with t0 (HY method) or t1 (TME method) ranging from 0 to 48 days, the fitting effects tend to be worse in Ra and Rb. As a result, when there is no obvious inflection point in the settlement–time curve, the prediction model with the initial point selected may have the best fitting effect because all monitoring points can be used for modeling. Within this framework, the representative prediction models, established by the HY method (t0 = 0) and TME method (t1 = 0), respectively, are drawn in Figure 6. It can be found that, under the premise of a similar fitting effect, the two methods may have different convergence rates when fitting the same monitoring data. The development patterns of land subsidence should also be various, especially where relatively severe land subsidence could be observed. Furthermore, according to Equation (13), the ADCs in Ra and Rb are 60.8–78.7% and 93.1–94.1%, respectively. For a certain area, as time goes on, the available historical SAR images will become increasingly abundant. Accordingly, the modeling results can also be continuously improved.
This work takes CES as an example to provide basic considerations and ideas for acquiring the settlement curve and estimating the ADC from SBAS-InSAR. Actually, as an outstanding air-to-surface observation technology, the InSAR algorithm is developing continuously [63]. Other types of InSAR techniques, such as persistent scatterer (PS) InSAR [64,65] and temporarily coherent point (TCP) InSAR [66,67], could also be involved. In theory, the proposed InSAR-based methodology can provide a long-term retrospective evaluation of ADCs for any area covered by SAR images.

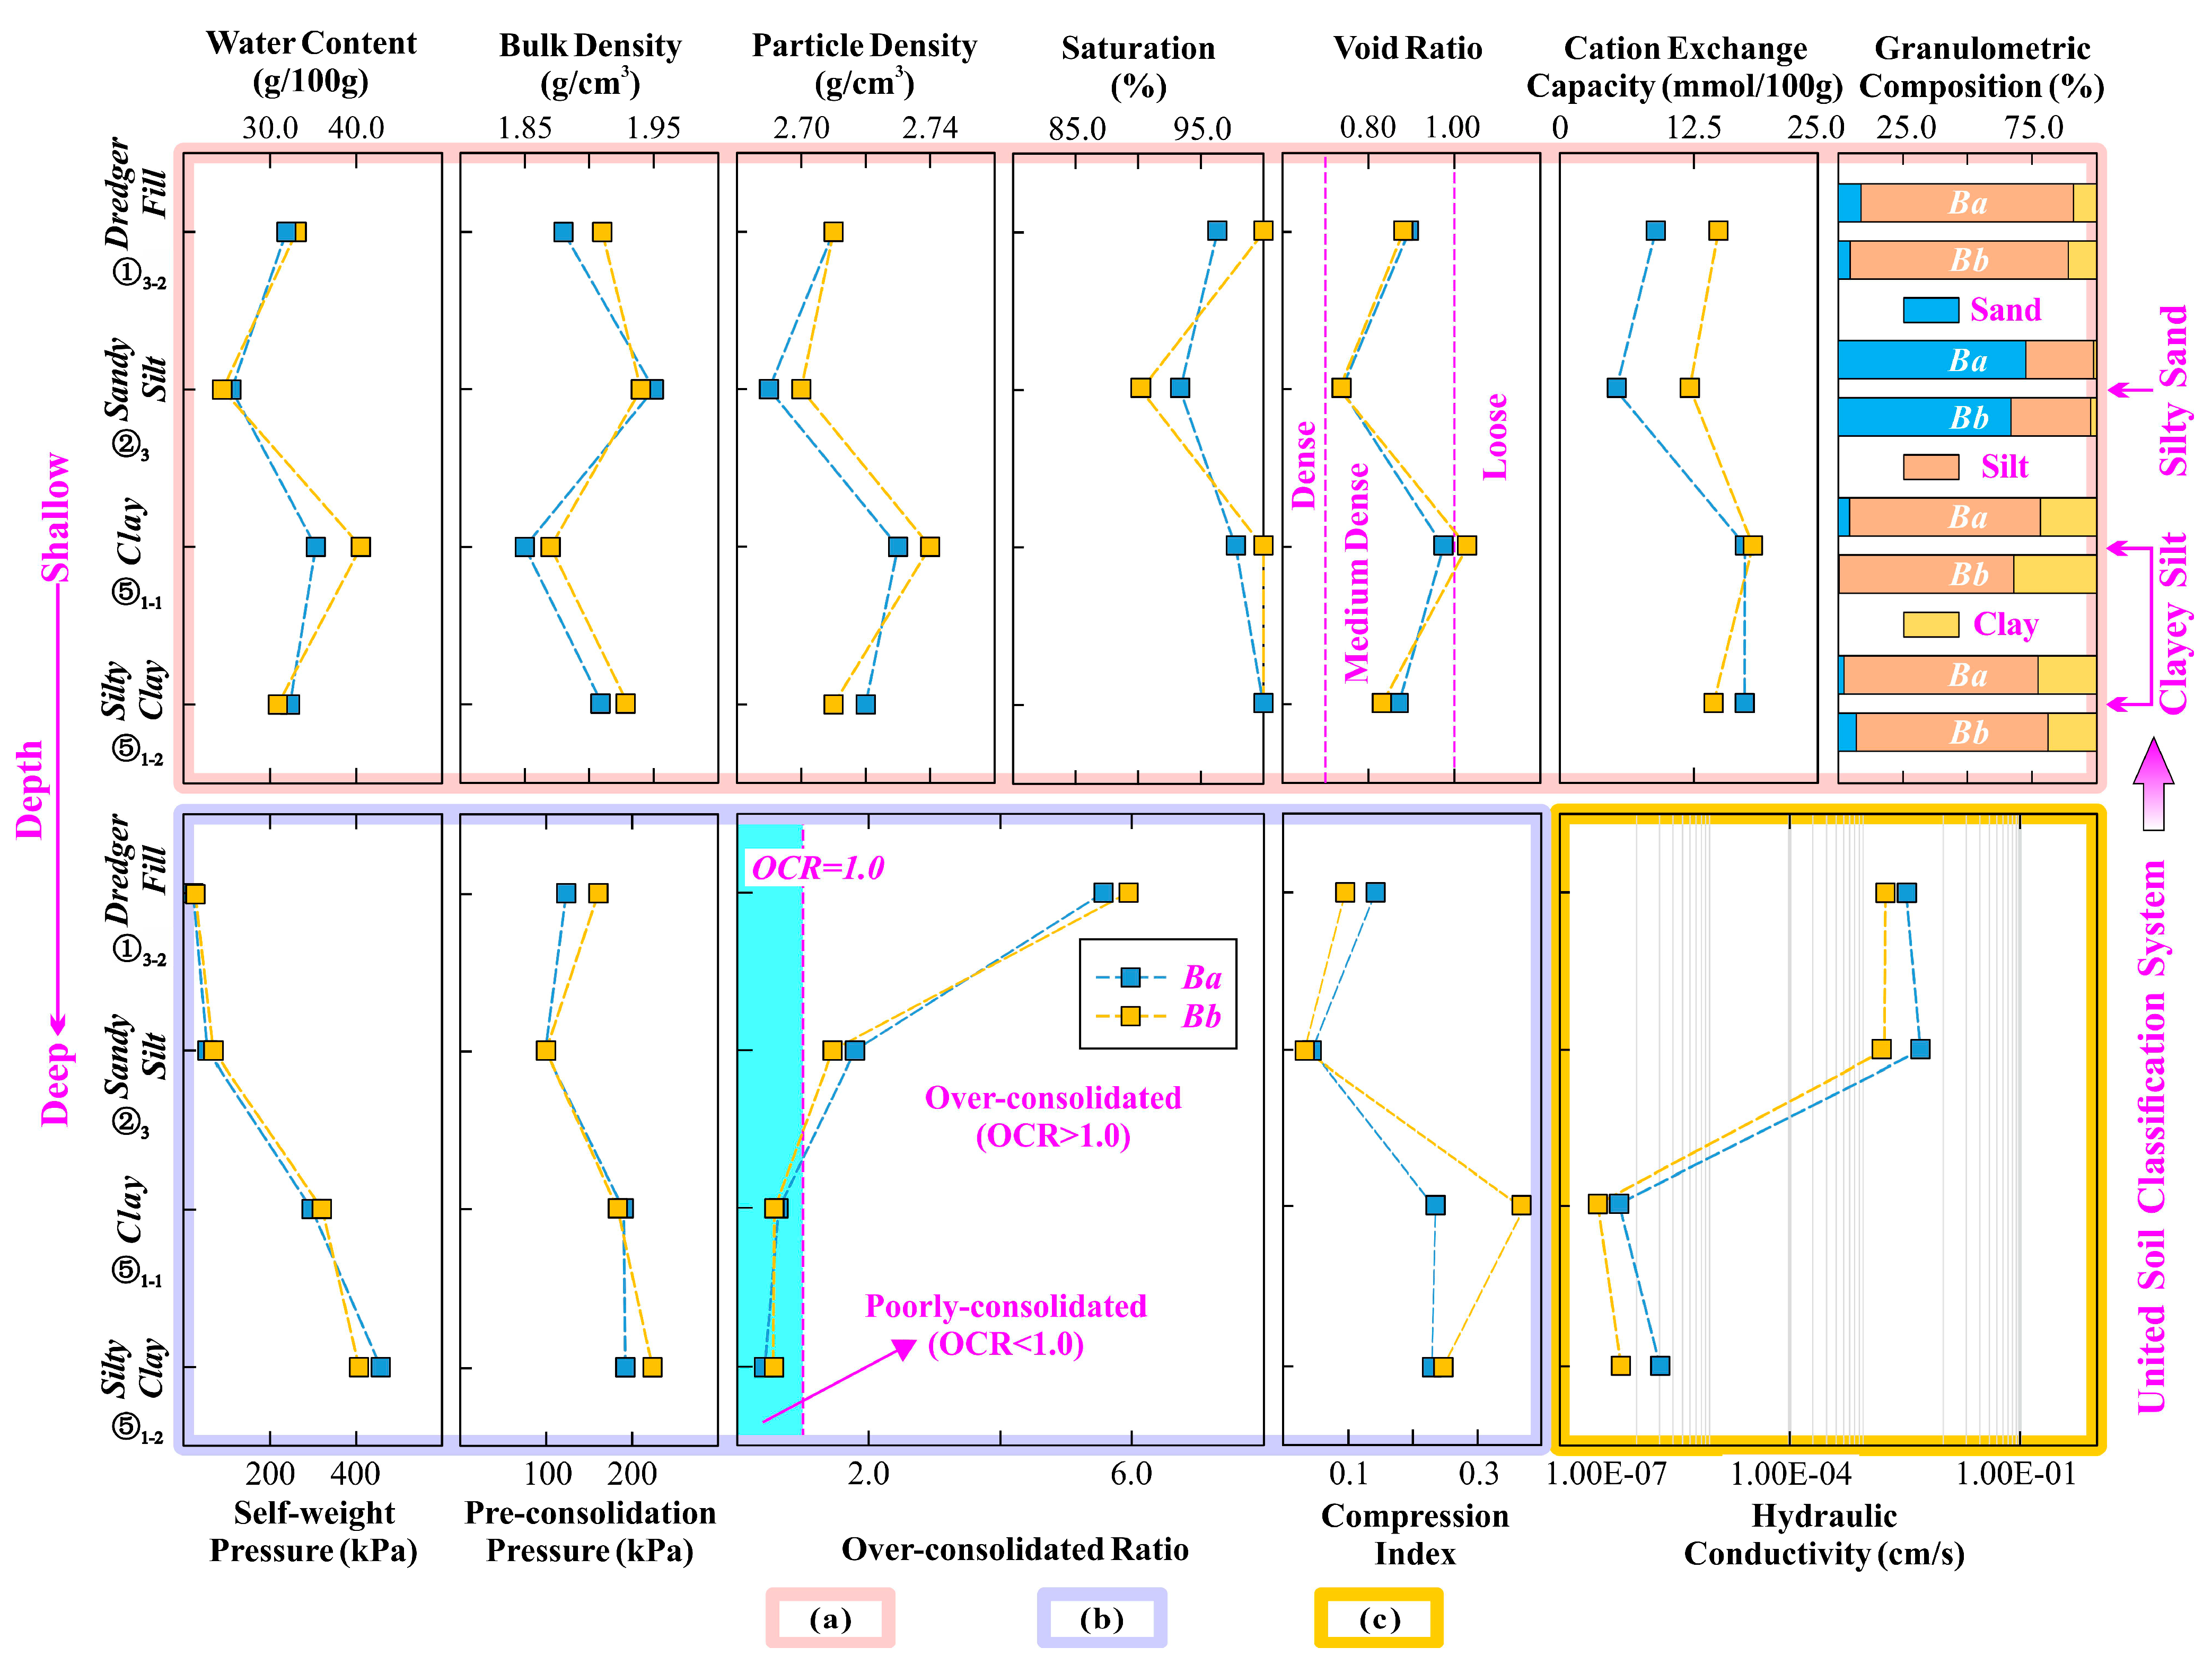
3.2. Macro-Scale Geological Features and Compression Layer

The macro geological features as established by the conventional tests detailed herein are summarized in Figure 7. In general, natural soil consists of a solid particle skeleton, a liquid phase, and a gas phase [68]. Figure 7a shows that the exposed soil layers are saturated considering the saturation degree of more than 80% [52]. Hence, the gas phase could be ignored.
The OCR results (Figure 7b) proves that DF and SS are characterized by over consolidated (OCR>1). This is because the pre-consolidation pressure of DF and SS was strengthened by the structural strength, which was resulted from the surface evaporation and frequent human activities [69]. The generated structural strength could make the soil skeleton more stable than before, resulting in a denser arrangement or stronger cementation. The over-consolidated phenomenon caused by structural strength could be named structural over-consolidation, which differs from before. Nevertheless, the common effort of the structural over-consolidation and the traditional over-consolidation is that the soil skeleton is strengthened, and the OCR could be greater than 1. DF often has a large settlement within a few years since the completion of the reclamation project. However, in this study, the reclaimed land within the cofferdam 1998 has been undergoing a long-term (>20 years) residual settlement process driven by self-weight consolidation without obvious change in land use type. As a result, the present DF could be relatively fully compressed and was not characterized as high-water content and high compressibility as the conventional dredger fill [27,70]. In contrast, CL and SC are under-consolidated (OCR < 1). In relevant literature [26,71], the clayey layer is often regarded as the main compression layer under external load in Shanghai. In CES, the artificial dredger fill layer further raised the load of underlying natural soil layer and therefore aggravated the poorly consolidated degree of clay layer to a certain extent. When the soil layer is over-consolidated, the compression deformation is so small that can be ignored while large compression deformation could be generated for the under-consolidated soil layer [52]. Consequently, CL and SC layers are the main compression layers in CES.
As shown in Figure 7a, silt and clay particles are the most frequent components of soil layers except SS. The SS shows the highest sand content (66.9% and 72.7%); CL and SC present higher clay content than other types of soil, resulting in much stronger hydrophilicity. Accordingly, the CL and SC show a higher value of cation exchange capacity (Figure 7a) and a correspondingly thicker hydration film than DF and SS. It is difficult for the CL and SC to be compacted during consolidation. Furthermore, probably all the soil layers involved in this study are medium dense (Figure 7a) with a void ratio ranging from 0.7 to 1.0, except that the CL layer is nearly loose arranged with larger pore space. Accordingly, the CL layer has not been fully compressed because of the highest compression index, which is considered the representative compression layer.
In the horizontal direction, the CL around Bb (CLBB) shows a significantly higher void ratio and compressibility than those of the clay around Ba (CLBA), indicating that the offshore CL layer could have been further compressed. However, the calculated ADCs present that the subsidence in the offshore reclamation area (Rb) is stable (ADC > 90%), which seems to contradict the geological features. For saturated soils, the discharge of water mainly contributed to the consolidation process. As shown in Figure 7c, the hydraulic conductivities of DF and SS remain at a high level (with a magnitude of 1.0 × 10⁻³ cm/s), while those of CL and SC are significantly reduced to the magnitude of 1.0 × 10⁻⁷ cm/s. This means that the drainage and consolidation efficiency of the clayey soil layer is low, and the excess pore water pressure could be tough to dissipate for a long time, especially considering the thickness of the CL layer of tens of meters. Moreover, it can be found that the hydraulic conductivities of the onshore soil layers are generally higher than those of the offshore soil layers; especially for the representative compression layer (CL), the hydraulic conductivity of CLBA (5.67 × 107 cm/s) is almost twice that of the CLBB (3.01 × 107 cm/s). The offshore land suffers from limited consolidation efficiency and presents a relatively stable ground deformation. As a result, on the spatial scale, the estimated ADC of offshore multiple soil layers can become higher than onshore multiple soil layers; the corresponding mechanism needs to be further discussed from the micro perspective.

3.3. Micro-Scale Analysis on the Representative Compression Layer

The CL was deposited in a freshwater and seawater delta environment (Figure 1), leading to a weak alkaline status [45] with a thick hydration film around fine soil particles. Meanwhile, the CLBA and CLBB show close content of cation exchange capacity (Figure 7a). The thickness of the hydration film of the CLBA and CLBB is close, so the permeability and consolidation depend on the spatial distribution of the solid–liquid two phases.

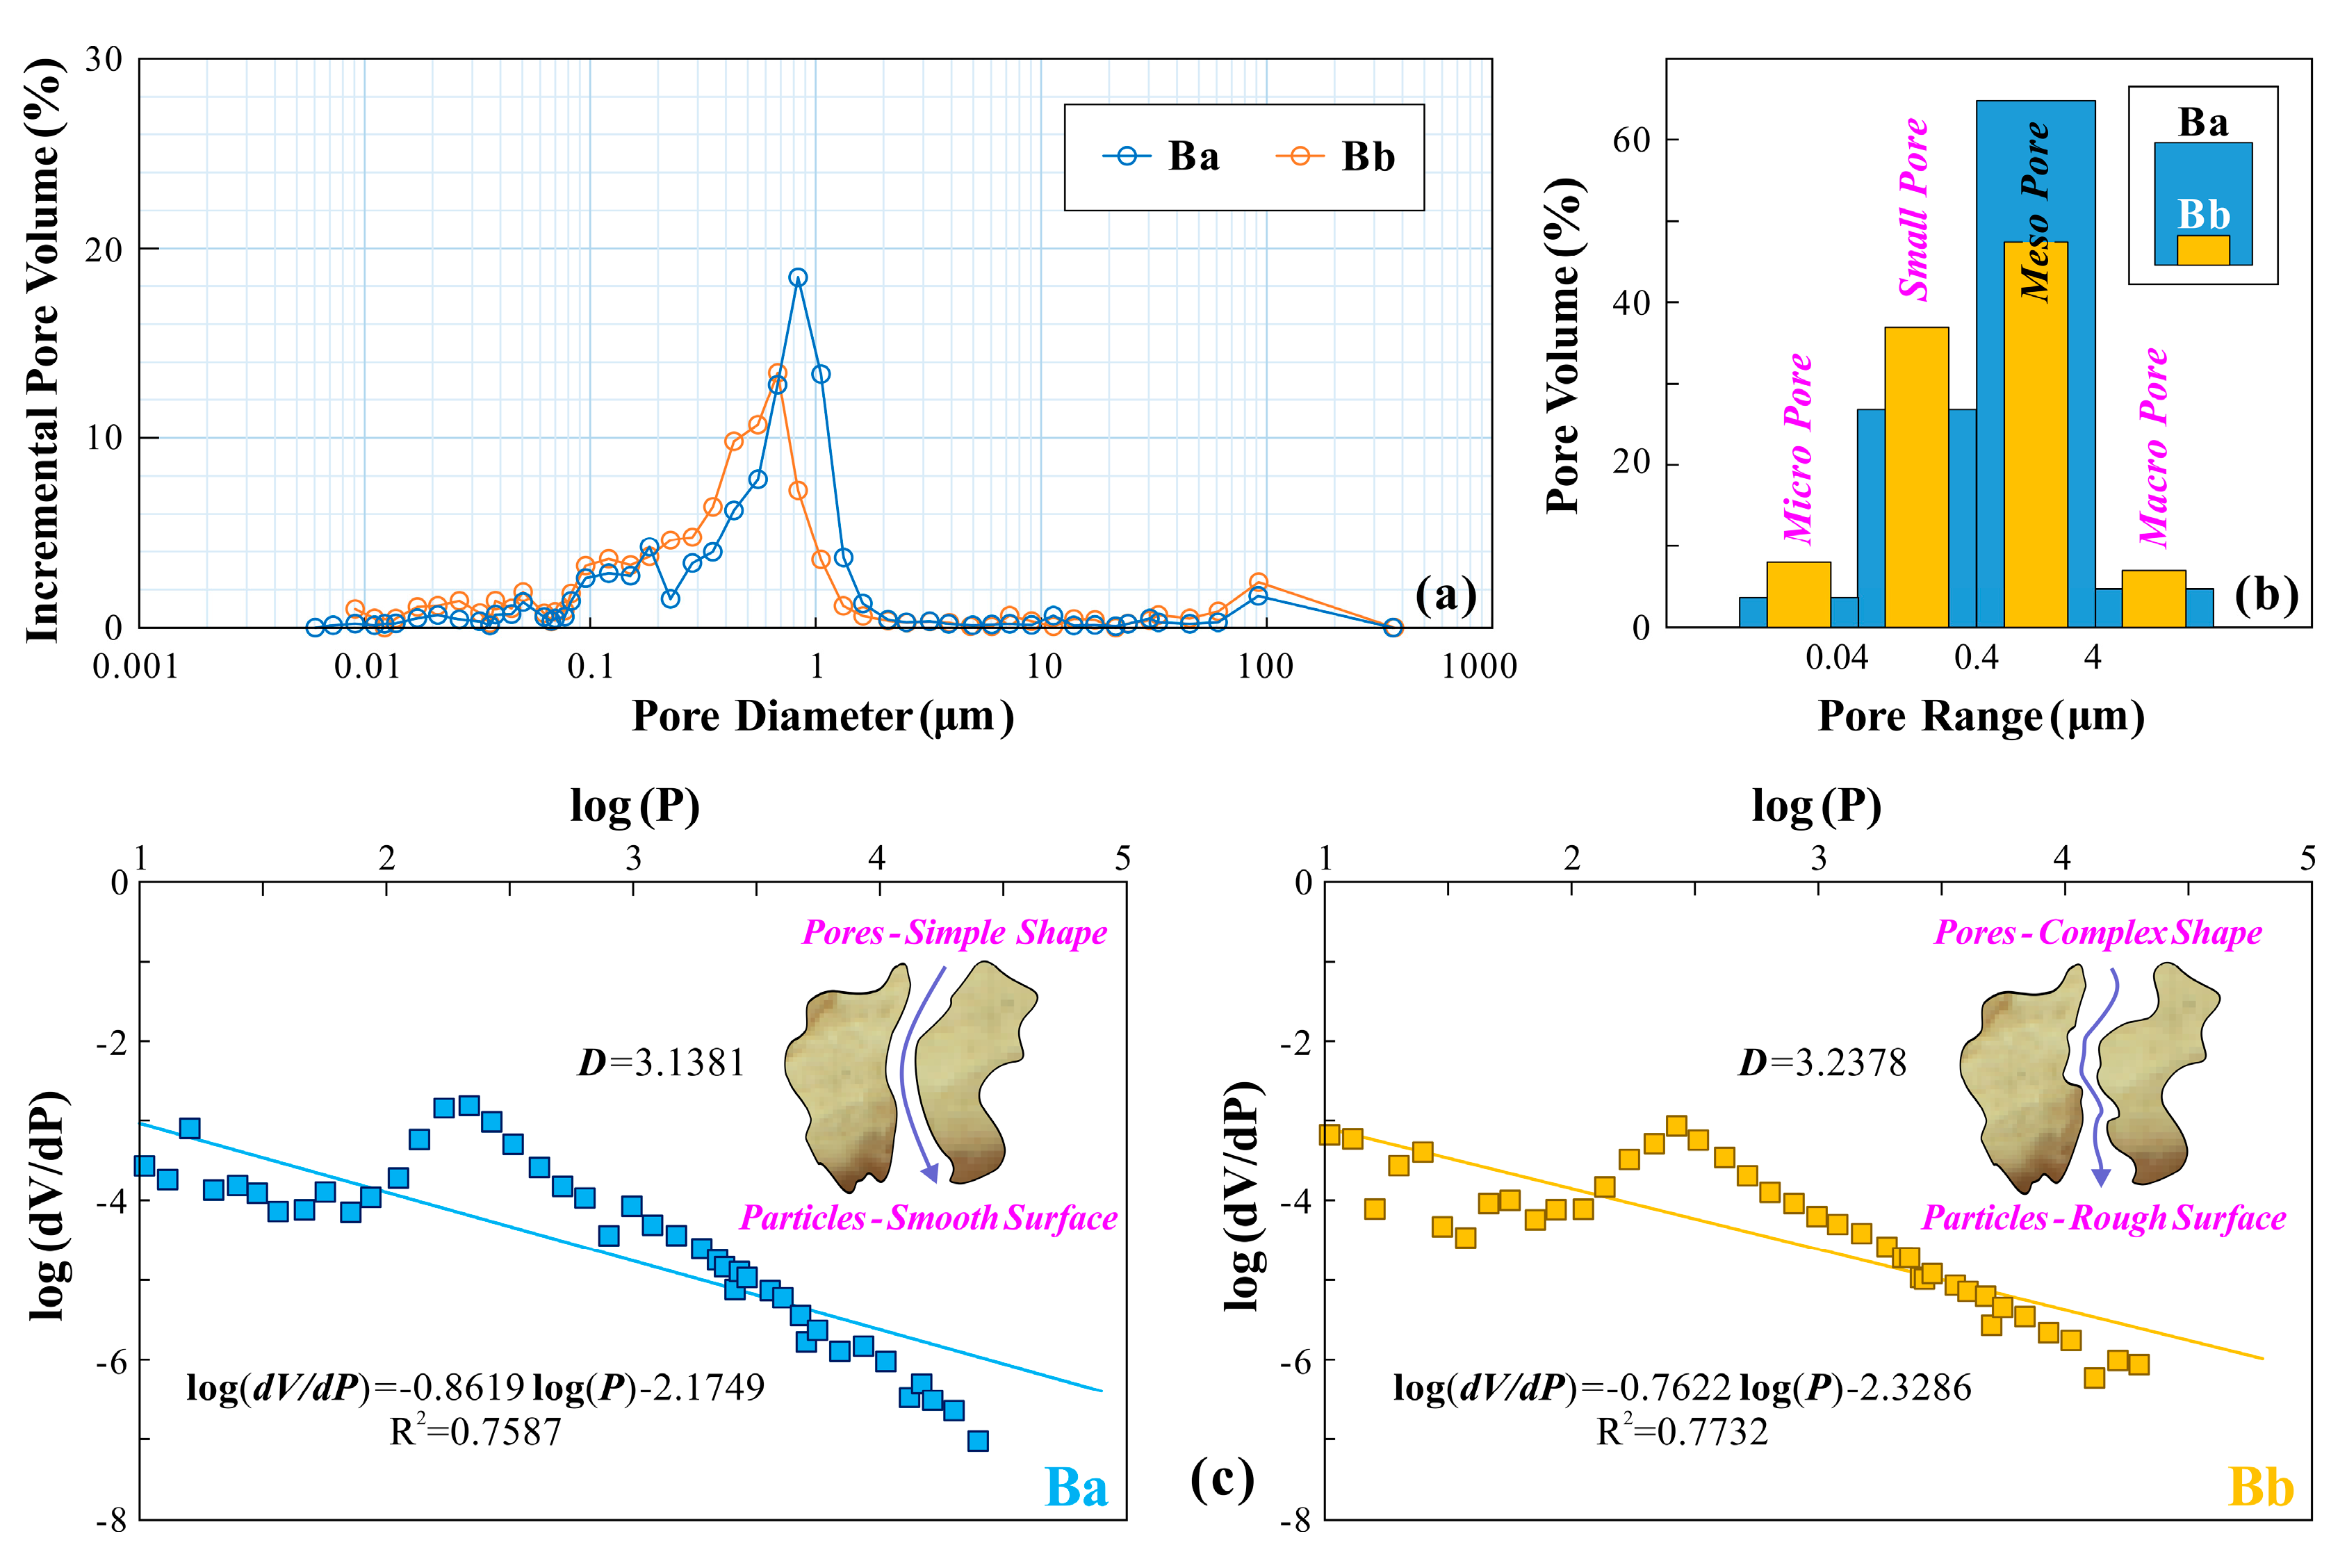
3.3.1. Pore Distribution

As shown in Figure 8a, the pore distribution curves of both CLBA and CLBB show “unimodal”, indicating the existence of dominant pore size. CLBA has a peak pore content of 18.45%, corresponding to a pore diameter of 0.8354 μm, while CLBB presents a peak content (13.44%) at a pore size of 0.6784 μm. It is explicit that there is a relatively greater large pore content in CLBA than that in CLBB. Further, Figure 8b presents that the mesopore content of CLBA is 17.12% higher than that of CLBB, while the content of micropores, small pores, and large pores in CLBA is universally lower than those in CLBB. With that, micro pores and small pores are more easily affected by the hydration film, and the electrostatic attraction that needs to be overcome is relatively greater when water is discharged from these two pores. Therefore, a higher content of these two pores could impair the ability of soil to drain water during consolidation.
Meanwhile, as shown in Figure 8c, the D of CLBB is 3.2378, while it is 3.1381 for CLBA, indicating that the pore space of CLBB is more complex; the seepage channel may be more tortuous. This is tantamount to lengthening the seepage path and expanding the specific surface area on the micro-scale, which not only indirectly reduces the hydraulic gradient but also increases the range of the hydration film. Under a certain water head, the permeate flow rate could be slowed down and the consolidation process is therefore delayed.

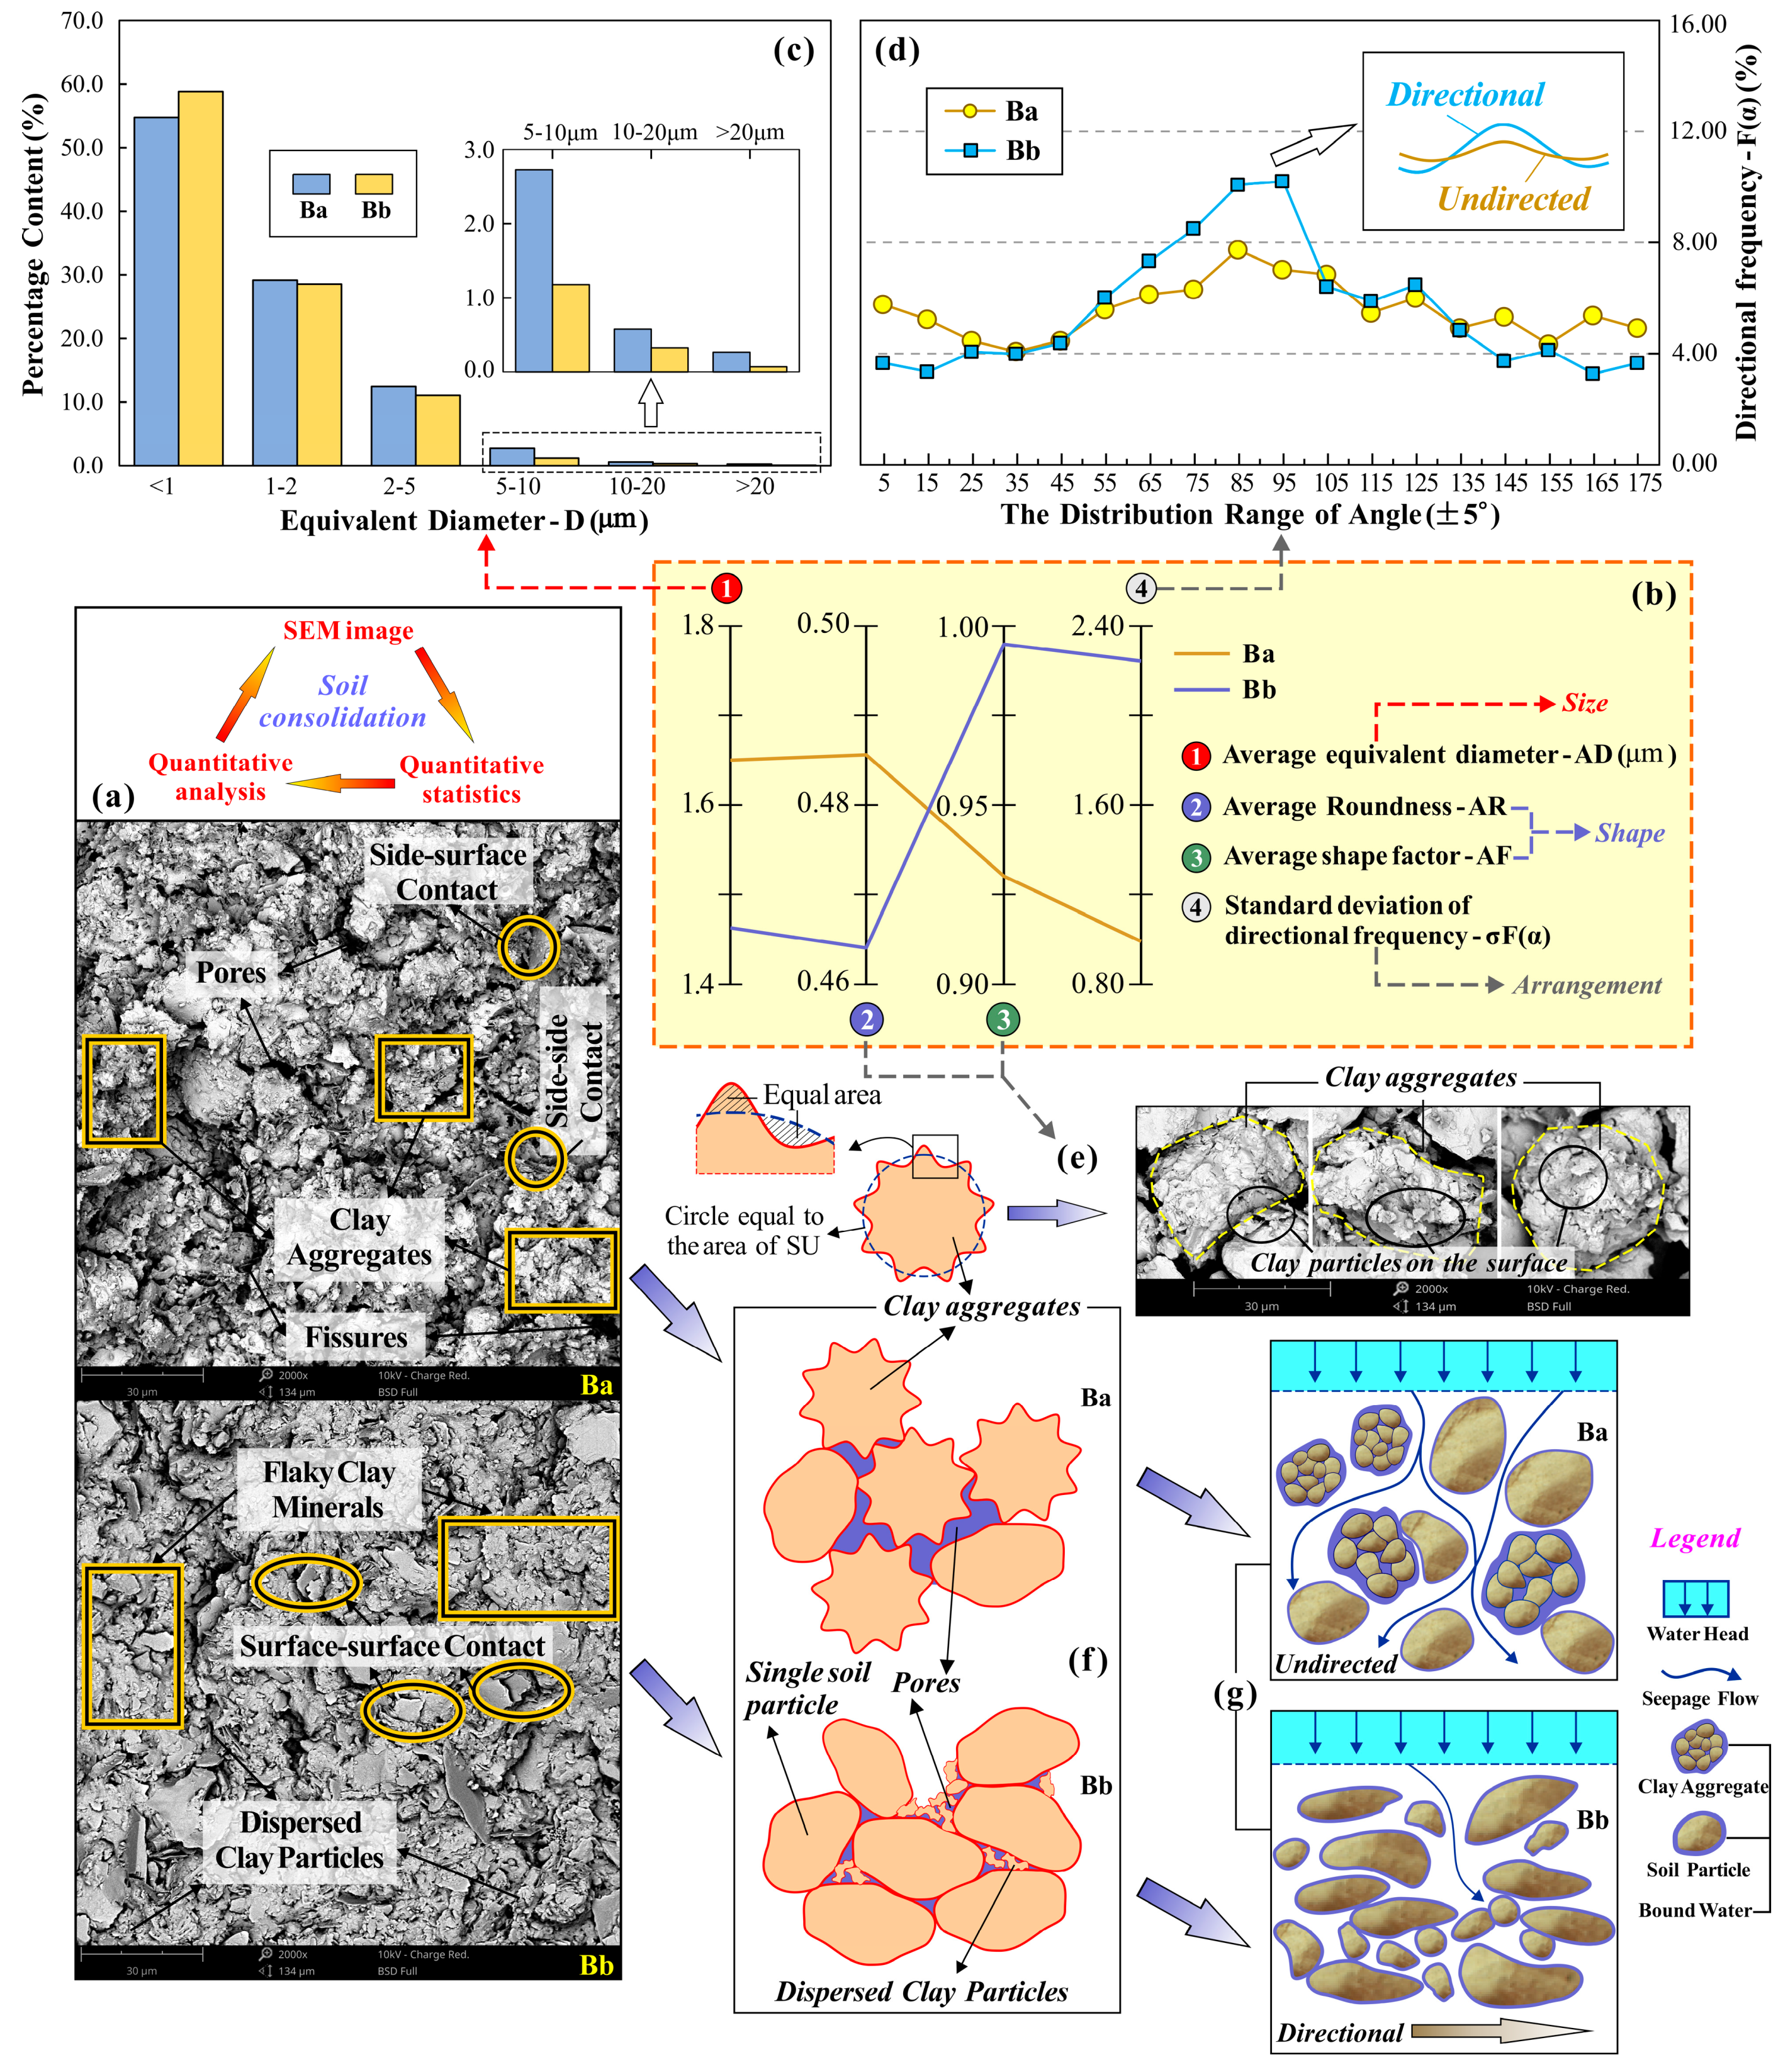
3.3.2. Microstructure

During the permeation process, the SUs may move or rotate [62], which may promote or hinder the following consolidation. The evaluation of soil microstructure starts from SEM images, through statistics and analysis, and then returns to SEM images (Figure 9a). Further, by quantitatively analyzing the microscopic parameters (Figure 9b), the relationship between soil consolidation and microstructure could be clarified. It can be seen that the AD of CLBB (1.46 μm) is significantly lower than that of CLBA (1.65 μm). The SEM-based AD is in good agreement with the granulometric composition. Figure 9c also demonstrates that the content of SUs less than 1μm of CLBB is 58.84%, which is higher than that of CLBA (54.81%); the contents of SUs in other divided intervals (>1 μm) of CLBB are lower than those of CLBA. As a result, the water in the pores of CLBB may suffer from a stronger binding effect derived from hydration film because of more small SUs during the process of consolidation and drainage.
The AR of the CLBA is higher (0.4864), and the AF is lower (0.9321) than those in CLBB (Figure 9b), which leads to the result that the onshore SUs are more complex in shape and closer to spherical. The suborbicular SU with complex shape characteristics can be considered clay aggregates (Figure 9e). The clay particles of CLBA usually take the form of clay aggregates (increasing the AD of SUs), while the clay particles of CLBB are often evenly dispersed in pores (Figure 9a). Meanwhile, the gathered clay particles can reduce the specific surface area of all soil particles so that the thinner hydration film may be formed than the case for dispersed clay particles, which is more conducive to extrude water during consolidation. In addition, the clay particles on the surface (Figure 9e) of clay aggregates complicate the shape of SUs and support and connect other SUs. Hence, the structure units cannot be closely fitted, and then, the overhead pores can be more likely to generate (Figure 9f), enhancing the connectivity of pores among SUs and the efficiencies of permeability and consolidation. Figure 9a shows that the pores of CLBA are more developed than that in CLBB, with certain connectivity; meanwhile, the pores of CLBB are usually filled by dispersed clay particles (Figure 9f).
The SUs of CLBB present a better directionality than that of CLBA (Figure 9b) because of their higher value of σF(α) (2.24). Figure 5d illustrated that the SUs of CLBA possess variable orientation characteristics, where the max F(α) is less than 8.0% and the min F(α) is more than 4.0%; while the SUs of CLBB show a certain directional trend with the max F(α) over 10.0% and the min F(α) less than 4.0%. As shown in Figure 9a, side–side contact and side–surface contact of soil particles can be observed of CLBA while the soil particles of CLBB are mainly contacted by surface–surface; the soil particles of CLBA are relatively distributed at random while there are many flaky mineral particles distributed in the parallel observation field of CLBB, resulting in a better directionality. Relatively speaking, under the same water head, the CLBA is easier to generate multi-directional seepage flows than the CLBB because of its undirected SUs and pores (Figure 9g).

3.4. Engineering Construction and Potential Risk of Land Subsidence

It is well known that the change of land use type always accompanies urbanization, during which the increasing ground loads could raise the effective stress within soil layers. Accordingly, the soil particles can be rearranged, resulting in a possibly smooth seepage channel; the proportion of primary and secondary consolidation could be adjusted, thus accelerating the soil consolidation and causing a new round of land subsidence.
According to the above analysis, the CLBB could be more difficult to compress during drainage and consolidation than CLBA, resulting in a high ADC in offshore land. Furthermore, for other undeveloped areas, the InSAR-derived high ADC can illustrate that the ground deformation is relatively stable in its present state. However, with the advancement of engineering construction, ground deformation may face two situations: one is that the local soil layers possess good drainage conditions, and they can be fully consolidated, reflecting a stable stratigraphic structure with low subsidence risk; the other is that the consolidation behavior suffers from the limitation of poor drainage conditions, leading to long-term consolidation deformation and potential ground subsidence risks. Therefore, it is of wide applicability and practical environmental significance to comprehensively evaluate soil consolidation characteristics at various scales.

4. Conclusions

This paper chose the typical multi-phase reclaimed lands, Chongming East Shoal (CES), Shanghai, as the study area. Two sets of time-series deformations in selected onshore and offshore reclamation areas were obtained; the geological features of multiple soil layers were experimentally investigated; the micro properties of representative compression layer were quantitatively analyzed. Further, the average degree of consolidation (ADC), hydraulic conductivity (kv), and micro-scale pore and structure parameters were jointly discussed from the perspective of soil consolidation and subsidence mechanisms. The main conclusions can be summarized as follows:
1. The InSAR-based method could open a newly optional avenue for deriving the ADC of multiple soil layers at a spatial-scale. The reclaimed lands often lack sufficiently historical in situ measurements. The InSAR technique is capable of extracting the settlement-time data on a relatively large scale to estimate the potential ultimate settlement and to indirectly evaluate the consolidation behavior. The combined application of the hyperbolic (HP) model and the three-point modified exponential (TME) model can yield a reasonable range of ADC instead of a single pattern. The range of ADC is relatively low (60.8–78.7%) in onshore lands, while that for offshore lands is between 93.1% and 94.1%.
2. On the macro-scale, low subsidence velocity or ADC may possess a corresponding relationship with the low hydraulic conductivity of the representative compression layer. In the vertical direction, the under-consolidated clay layer is considered as the most representative compression layer that contributes to the land subsidence; the dredger fill, characterized as structural over-consolidated, does not show high compressibility as usual due to its long-term (>20 years) self-weight consolidation and fine permeability. In the horizontal direction, the kv of offshore soil layers is considerably lower than that of onshore soil layers. The offshore soil layers with low consolidation efficiency and light subsidence present a high spatial ADC.
3. The various drainage and consolidation behaviors are controlled by the differential soil micro-scale pore and structure. The onshore clay shows a higher content of comparatively large pores and a simpler pore space than offshore clay, leading to a smoother seepage. Moreover, larger average equivalent diameter, stronger aggregation, and weaker directionality of soil structural units could be observed in onshore clay, promoting the development of pores; while the drainage channel of offshore clay is easily blocked, resulting in a slow consolidation process.
Many worldwide coastal lands, especially in reclamation areas, suffer from the risks of land subsidence without enough in situ measurements, and also have been subjected to the accelerated engineering construction. Present stable ground deformation can also lead to future potential land subsidence. Therefore, the integrated applications of InSAR measurements, geotechnical models, and quantitative analysis of soil microstructure are not limited to the CES but can also contribute to the multi-scale evaluation of soil consolidation in other regions.

Author Contributions

Conceptualization, Q.Y.; formal analysis, Q.Y. and K.Z.; funding acquisition, X.Y., Q.W., and T.Y.; investigation, M.Y., J.D. and C.N.; project administration, Q.W. and X.H.; validation, X.Y. and T.Y.; writing—original draft, Q.Y.; writing—review and editing, Q.W., J.Z. and W.L. All authors have read and agreed to the published version of the manuscript.

Funding

The research work herein was supported by the Key Laboratory of Land Subsidence Monitoring and Prevention, Ministry of Natural Resources (Grant No. 2021(D)-004(F)-01); the Key Program of International (Regional) Cooperation and Exchange of National Natural Science Foundation (Grant No. 41820104001); the National Key Research and Development Plan (Grant No. 2018YFC1505301; Grant No. 2018YFC1505304); the UNESCO-IUGS project (Grant No. IGCP 663).

Informed Consent Statement

Not applicable.

Data Availability Statement

The used Sentinel-1 data in this study are openly available from European Space Agency (ESA) through the Copernicus Open Access Hub at https://scihub.copernicus.eu/dhus/#/home (accessed on 6 March 2020). In the process of InSAR processing, the determined parameters, deformation map and corresponding validation are available in the previous study (reference number [27]) at https://0-doi-org.brum.beds.ac.uk/10.3390/rs12061016 (accessed on 6 March 2020).

Acknowledgments

All the authors are grateful for the data support from European Space Agency (ESA), National Aeronautics and Space Administration (NASA), Google Earth, and Shanghai Institute of Geological Survey (SIGS) in the process of remote sensing analysis and verification. In addition, we sincerely thank the editors and all anonymous reviewers for their constructive and excellent reviews on our work.

Conflicts of Interest

The authors declare no conflict of interest.

References

  1. Feng, L.; He, J.; Ai, J.; Sun, X.; Bian, F.; Zhu, X. Evaluation for coastal reclamation feasibility using a comprehensive hydro-dynamic framework: A case study in Haizhou Bay. Mar. Pollut. Bull. 2015, 100, 182–190. [Google Scholar] [CrossRef]
  2. McGranahan, G.; Balk, D.; Anderson, B. The rising tide: Assessing the risks of climate change and human settlements in low elevation coastal zones. Environ. Urban. 2007, 19, 17–37. [Google Scholar] [CrossRef]
  3. VanKoningsveld, M.; Mulder, J.P.M.; Stive, M.J.F.; VanDerValk, L.; VanDerWeck, A.W. Living with Sea-Level Rise and Climate Change: A Case Study of the Netherlands. J. Coast. Res. 2008, 24, 367–379. [Google Scholar] [CrossRef] [Green Version]
  4. Breber, P.; Povilanskas, R.; Armaitienė, A. Recent evolution of fishery and land reclamation in Curonian and Lesina lagoons. Hydrobiologia 2008, 611, 105–114. [Google Scholar] [CrossRef]
  5. Suzuki, T. Economic and geographic backgrounds of land reclamation in Japanese ports. Mar. Pollut. Bull. 2003, 47, 226–229. [Google Scholar] [CrossRef]
  6. Glaser, R.; Haberzettl, P.; Walsh, R.P.D. Land Reclamation in Singapore, Hong Kong and Macau. GeoJournal 1991, 24, 365–373. [Google Scholar] [CrossRef]
  7. Wang, W.; Liu, H.; Li, Y.; Su, J. Development and management of land reclamation in China. Ocean Coast Manag. 2014, 102, 415–425. [Google Scholar] [CrossRef]
  8. Jiang, G.; Yao, Y.; Tang, Z. Analysis of influencing factors on fine sediment flocculation in the Changjiang Estuary. Acta Oceanol. Sin. 2002, 21, 385–394. [Google Scholar]
  9. Wu, L.; Wang, J.; Zhou, J.; Yang, T.; Xu, N. Multi-scale geotechnical features of dredger fills and subsidence risk evaluation in reclaimed land using BN. Mar. Georesour. Geotechnol. 2019, 1–23. [Google Scholar] [CrossRef]
  10. Yu, Q.; Yan, X.; Wang, Q.; Yang, T.; Kong, Y.; Huang, X.; Mehmood, Q. X-ray computed tomography-based evaluation of the physical properties and compressibility of soil in a reclamation area. Geoderma 2020, 375, 114524. [Google Scholar] [CrossRef]
  11. Zhou, L.; Guo, J.; Hu, J.; Li, J.; Xu, Y.; Pan, Y.; Shi, M. Wuhan surface subsidence analysis in 2015–2016 based on Sentinel-1A data by SBAS-InSAR. Remote Sens. 2017, 9, 982. [Google Scholar] [CrossRef] [Green Version]
  12. Jiang, L.; Lin, H. Integrated analysis of SAR interferometric and geological data for investigating long-term reclamation settlement of Chek Lap Kok Airport, Hong Kong. Eng. Geol. 2010, 110, 77–92. [Google Scholar] [CrossRef]
  13. Dong, S.; Samsonov, S.; Yin, H.; Ye, S.; Cao, Y. Time-series analysis of subsidence associated with rapid urbanization in Shanghai, China measured with SBAS InSAR method. Environ. Earth Sci. 2013, 72, 677–691. [Google Scholar] [CrossRef]
  14. Ding, J.; Zhao, Q.; Tang, M.; Calò, F.; Zamparelli, V.; Falabella, F.; Liu, M.; Pepe, A. On the characterization and forecasting of ground displacements of ocean-reclaimed lands. Remote Sens. 2020, 12, 2971. [Google Scholar] [CrossRef]
  15. Peduto, D.; Nicodemo, G.; Maccabiani, J.; Ferlisi, S. Multi-scale analysis of settlement-induced building damage using damage surveys and DInSAR data: A case study in The Netherlands. Eng. Geol. 2017, 218, 117–133. [Google Scholar] [CrossRef]
  16. Liu, Y.; Li, J.; Fasullo, J.; Galloway, D.L. Land subsidence contributions to relative sea level rise at tide gauge Galveston Pier 21, Texas. Sci. Rep. 2020, 10, 17905. [Google Scholar] [CrossRef]
  17. Wang, M.; Li, T.; Jiang, L. Monitoring reclaimed lands subsidence in Hong Kong with InSAR technique by persistent and distributed scatterers. Nat. Hazards 2016, 82, 531–543. [Google Scholar] [CrossRef]
  18. Ma, P.; Wang, W.; Zhang, B.; Wang, J.; Shi, G.; Huang, G.; Chen, F.; Jiang, L.; Lin, H. Remotely sensing large- and small-scale ground subsidence: A case study of the Guangdong–Hong Kong–Macao Greater Bay Area of China. Remote Sens. Environ. 2019, 232, 111282. [Google Scholar] [CrossRef]
  19. Cui, Z.; Yang, J.; Yuan, L. Land subsidence caused by the interaction of high-rise buildings in soft soil areas. Nat. Hazards 2015, 79, 1199–1217. [Google Scholar] [CrossRef]
  20. Bonì, R.; Herrera, G.; Meisina, C.; Notti, D.; Béjar-Pizarro, M.; Zucca, F.; González, P.J.; Palano, M.; Tomás, R.; Fernández, J.; et al. Twenty-year advanced DInSAR analysis of severe land subsidence: The Alto Guadalentín Basin (Spain) case study. Eng. Geol. 2015, 198, 40–52. [Google Scholar] [CrossRef] [Green Version]
  21. Scifoni, S.; Bonano, M.; Marsella, M.; Sonnessa, A.; Tagliafierro, V.; Manunta, M.; Lanari, R.; Ojha, C.; Sciotti, M. On the joint exploitation of long-term DInSAR time series and geological information for the investigation of ground settlements in the town of Roma (Italy). Remote Sens. Environ. 2016, 182, 113–127. [Google Scholar] [CrossRef]
  22. López-Quiroz, P.; Doin, M.-P.; Tupin, F.; Briole, P.; Nicolas, J.-M. Time series analysis of Mexico City subsidence constrained by radar interferometry. J. Appl. Geophys. 2009, 69, 1–15. [Google Scholar] [CrossRef]
  23. Hu, J.; Li, Z.W.; Ding, X.L.; Zhu, J.J.; Zhang, L.; Sun, Q. Resolving three-dimensional surface displacements from InSAR measurements: A review. Earth Sci. Rev. 2014, 133, 1–17. [Google Scholar] [CrossRef]
  24. Figueroa-Miranda, S.; Hernández-Madrigal, V.M.; Tuxpan-Vargas, J.; Villaseñor-Reyes, C.I. Evolution assessment of structurally-controlled differential subsidence using SBAS and PS interferometry in an emblematic case in Central Mexico. Eng. Geol. 2020, 279, 105860. [Google Scholar] [CrossRef]
  25. Li, Z.; Wang, Q.; Zhou, F.; Li, Y.; Han, X.; Mehmood, Q.; Cao, C.; Gu, F.; Han, M.; Chen, J. Integrating an interferometric synthetic aperture radar technique and numerical simulation to investigate the Tongmai old deposit along the Sichuan-Tibet Railway. Geomorphology 2021, 377, 107586. [Google Scholar] [CrossRef]
  26. Yang, M.; Yang, T.; Zhang, L.; Lin, J.; Qin, X.; Liao, M. Spatio-temporal characterization of a reclamation settlement in the Shanghai coastal area with time series analyses of X-, C-, and L-Band SAR datasets. Remote Sens. 2018, 10, 329. [Google Scholar] [CrossRef] [Green Version]
  27. Yu, Q.B.; Wang, Q.; Yan, X.X.; Yang, T.L.; Song, S.Y.; Yao, M.; Zhou, K.; Huang, X.L. Ground deformation of the Chongming East Shoal reclamation area in Shanghai based on SBAS-InSAR and laboratory tests. Remote Sens. 2020, 12, 1016. [Google Scholar] [CrossRef] [Green Version]
  28. Plant, G.W.; Covil, C.S.; Publishing, T.T.J.C. Site Preparation for the New Hong Kong International Airport—the Design, Construction and Performance of the Airport Platform; Thomas Telford: London, UK, 1998. [Google Scholar]
  29. Kim, S.W.; Won, J.S. Measurements of soil compaction rate by using JERS-1 SAR and a prediction model. IEEE Trans. Geosci. Remote 2003, 41, 2683–2686. [Google Scholar] [CrossRef]
  30. Kim, S.W.; Wdowinski, S.; Dixon, T.H.; Amelung, F.; Kim, J.W.; Won, J.S. Measurements and predictions of subsidence induced by soil consolidation using persistent scatterer InSAR and a hyperbolic model. Geophys. Res. Lett. 2010, 37. [Google Scholar] [CrossRef] [Green Version]
  31. Zhao, Q.; Pepe, A.; Gao, W.; Lu, Z.; Bonano, M.; He, M.L.; Wang, J.; Tang, X. A DInSAR investigation of the ground settlement time evolution of ocean-reclaimed lands in Shanghai. IEEE J. STARS 2015, 8, 1763–1781. [Google Scholar] [CrossRef]
  32. Hu, X.; Oommen, T.; Lu, Z.; Wang, T.; Kim, J.-W. Consolidation settlement of Salt Lake County tailings impoundment revealed by time-series InSAR observations from multiple radar satellites. Remote Sens. Environ. 2017, 202, 199–209. [Google Scholar] [CrossRef]
  33. Ciampalini, A.; Solari, L.; Giannecchini, R.; Galanti, Y.; Moretti, S. Evaluation of subsidence induced by long-lasting buildings load using InSAR technique and geotechnical data: The case study of a Freight Terminal (Tuscany, Italy). Int. J. Appl. Earth Obs. 2019, 82. [Google Scholar] [CrossRef]
  34. Park, S.W.; Hong, S.H. Nonlinear modeling of subsidence from a decade of InSAR time series. Geophys. Res. Lett. 2021, 48. [Google Scholar] [CrossRef]
  35. Zhang, Z.; Liu, C.; Wang, F. Preliminary study on relation of fault activity and seismicity in the Shanghai region. Earthq. Res. China 2004, 20, 143–151. [Google Scholar] [CrossRef]
  36. Xu, Y. Evaluation of the Behaviour of Groundwater Seepage and Land Subsidence via Considering Infrastructures Penetrated into Aquifers. Ph.D. Thesis, Shanghai Jiao Tong University, Shanghai, China, 2010. [Google Scholar]
  37. He, X.-C.; Yang, T.-L.; Shen, S.-L.; Xu, Y.-S.; Arulrajah, A. Land subsidence control zone and policy for the environmental protection of Shanghai. Int. J. Environ. Res. Public Health 2019, 16, 2729. [Google Scholar] [CrossRef] [Green Version]
  38. Berardino, P.; Fornaro, G.; Lanari, R.; Sansosti, E. A new algorithm for surface deformation monitoring based on small baseline differential SAR interferograms. IEEE Trans. Geosci. Remote 2002, 40, 2375–2383. [Google Scholar] [CrossRef] [Green Version]
  39. Lanari, R.; Mora, O.; Manunta, M.; Mallorqui, J.J.; Berardino, P.; Sansosti, E. A small-baseline approach for investigating deformations on full-resolution differential SAR interferograms. IEEE Trans. Geosci. Remote 2004, 42, 1377–1386. [Google Scholar] [CrossRef]
  40. Zhu, K.; Xu, P.; Cao, C.; Zheng, L.; Liu, Y.; Dong, X. Preliminary identification of geological hazards from Songpinggou to Feihong in Mao County along the Minjiang River using SBAS-InSAR technique integrated multiple spatial analysis methods. Sustainability 2021, 13, 1017. [Google Scholar] [CrossRef]
  41. Yang, H.-L.; Peng, J.-H. Monitoring urban subsidence with multi-master radar interferometry based on coherent targets. J. Indian Soc. Remote 2015, 43, 529–538. [Google Scholar] [CrossRef]
  42. Hooper, A. A multi-temporal InSAR method incorporating both persistent scatterer and small baseline approaches. Geophys. Res. Lett. 2008, 35, L16302. [Google Scholar] [CrossRef] [Green Version]
  43. Zebker, H.A.; Villasenor, J. Decorrelation in interferometric radar echoes. IEEE Trans. Geosci. Remote 1992, 30, 950–959. [Google Scholar] [CrossRef] [Green Version]
  44. Xu, Y.S.; Wu, H.N.; Wang, B.Z.-F.; Yang, T.L. Dewatering induced subsidence during excavation in a Shanghai soft deposit. Environ. Earth Sci. 2017, 76, 351. [Google Scholar] [CrossRef]
  45. Ye, G.-L.; Lin, N.; Bao, X.-H.; Gu, L.; Yadav, S.K. Effect of Quaternary transgression and regression on the engineering properties of Shanghai soft clays. Eng. Geol. 2018, 239, 321–329. [Google Scholar] [CrossRef]
  46. Yastika, P.E.; Shimizu, N.; Abidin, H.Z. Monitoring of long-term land subsidence from 2003 to 2017 in coastal area of Semarang, Indonesia by SBAS DInSAR analyses using Envisat-ASAR, ALOS-PALSAR, and Sentinel-1A SAR data. Adv. Space Res. 2019, 63, 1719–1736. [Google Scholar] [CrossRef]
  47. Yuan, X.Q.; Wang, Q.; Lu, W.X.; Zhang, W.; Chen, H.E.; Zhang, Y. Indoor simulation test of step vacuum preloading for high-clay content dredger fill. Mar. Georesour. Geotec. 2017, 36, 1–8. [Google Scholar] [CrossRef]
  48. Tan, T.-S.; Inoue, T.; Lee, S.-L. Hyperbolic Method for Consolidation Analysis. J. Geotech. Eng. 1991, 117, 1723–1737. [Google Scholar] [CrossRef]
  49. Rao, S.N.; Kodandaramaswamy, K. The prediction of settlements and heave in clays. Can. Geotech. J. 1980, 17, 623–631. [Google Scholar] [CrossRef]
  50. Gao, Y.; Mo, Z.; Wei, J. Optimization and application of exponential curve method in soft soil foundation settlement prediction. J. Transp. Sci. Eng. 2011, 4–8. (In Chinese) [Google Scholar] [CrossRef]
  51. Chen, S.; Wang, X.; Xu, X.; Yu, F.; Qin, S. Three-point modified exponential curve method for predicting subgrade settlements. Rock Soil Mech. 2011, 032, 3355–3360. (In Chinese) [Google Scholar] [CrossRef]
  52. Tang, D.X.; Sun, S.W. (Eds.) Science of Engineering Rock and Soil; Geological Publishing House: Beijing, China, 1999. (In Chinese) [Google Scholar]
  53. Ministry of Housing and Urban-Rural Development of the People’s Republic of China (MOHURD). Standard for Soil Test Methods (GB/T 50123-2019); China Planning Press: Beijing, China, 2019. (In Chinese)
  54. Zhan, J.; Wang, Q.; Zhang, W.; Shangguan, Y.; Song, S.; Chen, J. Soil-engineering properties and failure mechanisms of shallow landslides in soft-rock materials. Catena 2019, 181, 104093. [Google Scholar] [CrossRef]
  55. Han, Y.; Wang, Q.; Xia, W.; Liu, J.; Wang, J.; Chen, Y.; Shen, J. Experimental study on the hydraulic conductivity of unsaturated dispersive soil with different salinities subjected to freeze-thaw. J. Hydrol. 2019, 583, 124297. [Google Scholar] [CrossRef]
  56. Wang, J.; Wang, Q.; Kong, Y.; Han, Y.; Cheng, S. Analysis of the pore structure characteristics of freeze-thawed saline soil with different salinities based on mercury intrusion porosimetry. Environ. Earth Sci. 2020, 79. [Google Scholar] [CrossRef]
  57. Mandelbrot, B. How long is the coast of Britain? Statistical self-similarity and fractional dimension. Science 1967, 156, 636–638. [Google Scholar] [CrossRef] [Green Version]
  58. Wang, F.; Yang, K.; You, J.; Lei, X. Analysis of pore size distribution and fractal dimension in tight sandstone with mercury intrusion porosimetry. Results Phys. 2019. [Google Scholar] [CrossRef]
  59. Friesen, W.I.; Mikula, R.J. Fractal dimensions of coal particles. J. Colloid Interf. Sci. 1987, 120, 263–271. [Google Scholar] [CrossRef]
  60. Wu, Y.; Xu, Y.; Zhang, X.; Lu, Y.; Chen, G.; Wang, X.; Song, B. Experimental study on vacuum preloading consolidation of landfill sludge conditioned by Fenton’s reagent under varying filter pore size. Geotext. Geomembr. 2021, 49, 109–121. [Google Scholar] [CrossRef]
  61. Chen, H.; Jiang, Y.; Niu, C.; Leng, G.; Tian, G. Dynamic characteristics of saturated loess under different confining pressures: A microscopic analysis. B. Eng. Geol. Environ. 2017, 78, 931–944. [Google Scholar] [CrossRef]
  62. Wang, Q.; Sun, M.; Sun, T.; Sun, T. Microstructure Features for Dredger Fill by Different Solidified Technologies. J. Tongji Univ. Nat. Sci. Ed. 2013, 1286–1292. (In Chinese) [Google Scholar] [CrossRef]
  63. Zhang, L.; Jia, H.; Lu, Z.; Liang, H.; Ding, X.; Li, X. Minimizing height effects in MTInSAR for deformation detection over built areas. IEEE Trans. Geosci. Remote 2019, 57, 9167–9176. [Google Scholar] [CrossRef]
  64. Osmanoǧlu, B.; Dixon, T.H.; Wdowinski, S.; Cabral-Cano, E.; Jiang, Y. Mexico City subsidence observed with persistent scatterer InSAR. Int. J. Appl. Earth Obs. 2011, 13, 1–12. [Google Scholar] [CrossRef]
  65. Liu, G.; Jia, H.; Zhang, R.; Zhang, H.; Jia, H.; Yu, B.; Sang, M. Exploration of Subsidence Estimation by Persistent Scatterer InSAR on Time Series of High Resolution TerraSAR-X Images. IEEE J. STARS 2011, 4, 159–170. [Google Scholar] [CrossRef]
  66. Zhang, L.; Lu, Z.; Ding, X.; Jung, H.S.; Feng, G.; Lee, C.W. Mapping ground surface deformation using temporarily coherent point SAR interferometry: Application to Los Angeles Basin. Remote Sens. Environ. 2012, 117, 429–439. [Google Scholar] [CrossRef]
  67. Zhang, L.; Ding, X.; Lu, Z. Ground settlement monitoring based on temporarily coherent points between two SAR acquisitions. ISPRS J. Photogramm. 2011, 66, 146–152. [Google Scholar] [CrossRef]
  68. Zhang, X.; Wu, Y.; Zhai, E.; Ye, P. Coupling analysis of the heat-water dynamics and frozen depth in a seasonally frozen zone. J. Hydrol. 2020, 593, 125603. [Google Scholar] [CrossRef]
  69. Wang, Q.; Kong, Y.; Zhang, X.; Ruan, Y.; Chen, Z. Mechanical Effect of Pre-consolidation Pressure of Structural Behavior Soil. J. Southwest Jiaotong Univ. 2016, 51, 987–994. (In Chinese) [Google Scholar] [CrossRef]
  70. Yan, H.; Wang, Q.; Sun, D.Y. Experiment study of dredger fill using different consolidation methods. Adv. Mater. Res. 2014, 960–961, 513–516. [Google Scholar] [CrossRef]
  71. Gong, S.L.; Li, C.; Yang, S.L. The microscopic characteristics of Shanghai soft clay and its effect on soil body deformation and land subsidence. Environ. Geol. 2009, 56, 1051–1056. [Google Scholar] [CrossRef]
Figure 1. A sketch of the expansion of Shanghai’s coastal land. (a) The widened Yangtze River; (b) the joint effects of seawater support and flocculation; (c) the expanding new lands; (d) the vessels on the voyage; (e) hydraulic reclamation; (f) multiple soil layers.
Remotesensing 13 02418 g001
Figure 2. Google Earth-based overview of Chongming East Shoal (CES). (a) The main reclamation areas in Shanghai; (b) the advancement of multi-phase reclamation projects in CES since the 1990s; (c) site environment and land use; (d) SBAS-derived vertical deformation map from 22 March 2015 to 2 December 2019 (data from Reference [27]); (e) comparison of SBAS-derived deformation velocity (νS) and fitting leveling data (νL) at the leveling location (data from Reference [27]). (Note that the leveling measurement followed the specification of the second-order leveling with an error of 2 mm, based on the Chinese national height data from 1985).
Remotesensing 13 02418 g002
Figure 3. Stratigraphic structure of boreholes Ba and Bb, with the sampling horizons marked.
Remotesensing 13 02418 g003
Figure 4. Diagram of the settlement curve acquisition and prediction method in this study.
Remotesensing 13 02418 g004
Figure 5. Time-continuous settlement curve in Ra and Rb during the monitoring period of 22 March 2015 to 2 December 2019.
Remotesensing 13 02418 g005
Figure 6. The predicted settlement curves derived from the three-point modified exponential (TME) method (t1 = 0; prediction models in Ra and Rb are labeled as Rae1 and Rbe1) and hyperbolic (HY) method (t0 = 0; prediction models in Ra and Rb are labeled as Rah1 and Rbh1).
Remotesensing 13 02418 g006
Figure 7. The geological features of the soil layers around Ba and Bb boreholes. (a) Basic Properties, (b) compressibility, and (c) permeability. Note that according to the United Soil Classification System, the ②3 Sandy Silt, ⑤1-1 Clay, and ⑤1-2 Silty Clay could also be named as silty sand, clayey silt, and clayey silt, respectively. In order to ensure the consistency of soil layers and to facilitate the description, the soil classification in the results and discussion section still uses the soil type (Figure 3) that was determined by the geological age, soil behavior, and physical and mechanical properties.
Remotesensing 13 02418 g007
Figure 8. The micro-scale pore characteristics of the clay around the Ba (CLBA) and clay around Bb (CLBB). (a) Pore distribution, (b) pore type, and (c) morphological fractal dimension.
Remotesensing 13 02418 g008
Figure 9. Quantitative description of microstructure for clay around Ba (CLBA) and clay around Bb (CLBB). (a) SEM images of clay in 2000× and micro-scale analysis process; (b) statistical microscopic parameters; distributions of (c) equivalent diameter and (d) directional frequency; (e) diagram of the suborbicular structural unit (SU) with complex shape and clay aggregates in 2000×; diagrams of (f) shape and (g) arrangement characteristics of SUs.
Remotesensing 13 02418 g009
Table 1. Prediction results of hyperbolic (HP) model and three-point modified exponential (TME) model. α, β and η are undetermined parameters.
Region of Interest HP   Model   : s t   =   s 0 + t t 0 α + β ( t t 0 ) R2s
(mm)
ADC   ( % ) :   U 1716   =   s 1716 s
(t0, s0)αβ
Ra(0, 0)−17.216−0.01460.9872−68.560.8
(24, −1.6)−17.957−0.01520.9859−67.461.8
(48, −2.8)−19.088−0.0150.9859−69.560.0
Rb(0, 0)−16.188−0.04730.867−21.194.1
(24, −3.6)−25.688−0.05650.8436−21.393.4
(48, −5.7)−34.392−0.06450.8174−21.293.9
Region of Interest TME   Model :   s t   =   s ( s s 0 ) t t 0 η ηR2s
(mm)
ADC   ( % ) :   U 1716   =   s 1716 s
Note: Let t1 = t0, t3 = 1716
(t1, s1)(t2, s2)(t3, s3)
Ra(0, 0)(858, −28.5)(1716, −41.7)1110.360.99−52.978.7
(24, −1.6)(870, −28.3)1221.840.9893−55.075.7
(48, −2.8)(882, −28.6)1224.9930.9884−55.075.7
Rb(0, 0)(858, −15.8)(1716, −19.9)642.16630.8355−21.493.1
(24, −3.6)(870, −16.1)712.70170.8298−21.692.2
(48, −5.7)(882, −16.3)783.03270.8131−21.891.2
Publisher’s Note: MDPI stays neutral with regard to jurisdictional claims in published maps and institutional affiliations.

