
Extracting Information on Rocky Desertification from Satellite Images: A Comparative Study


1
School of Earth Sciences, Yunnan University, Kunming 650500, China
2
Institute of International Rivers & Eco-Security, Yunnan University, Kunming 650500, China
3
Department of Geography and the Environment, University of North Texas, Denton, TX 76203, USA
*
Author to whom correspondence should be addressed.
Remote Sens. 2021, 13(13), 2497; https://0-doi-org.brum.beds.ac.uk/10.3390/rs13132497
Submission received: 7 June 2021
/
Revised: 21 June 2021
/
Accepted: 22 June 2021
/
Published: 26 June 2021
(This article belongs to the Special Issue Advances of Remote Sensing in Environmental Geoscience)
Abstract
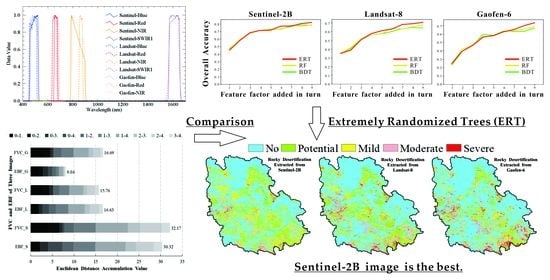
:Rocky desertification occurs in many karst terrains of the world and poses major challenges for regional sustainable development. Remotely sensed data can provide important information on rocky desertification. In this study, three common open-access satellite image datasets (Sentinel-2B, Landsat-8, and Gaofen-6) were used for extracting information on rocky desertification in a typical karst region (Guangnan County, Yunnan) of southwest China, using three machine-learning algorithms implemented in the Python programming language: random forest (RF), bagged decision tree (BDT), and extremely randomized trees (ERT). Comparative analyses of the three data sources and three algorithms show that: (1) The Sentinel-2B image has the best capability for extracting rocky desertification information, with an overall accuracy (OA) of 85.21% using the ERT method. This can be attributed to the higher spatial resolution of the Sentinel-2B image than that of Landsat-8 and Gaofen-6 images and Gaofen-6’s lack of the shortwave infrared (SWIR) bands suitable for mapping carbonate rocks. (2) The ERT method has the best classification results of rocky desertification. Compared with the RF and BDT methods, the ERT method has stronger randomness in modeling and can effectively identify important feature factors for extracting information on rocky desertification. (3) The combination of the Sentinel-2B images and the ERT method provides an effective, efficient, and free approach to information extraction for mapping rocky desertification. The study can provide a useful reference for effective mapping of rocky desertification in similar karst environments of the world, in terms of both satellite image sources and classification algorithms. It also provides important information on the total area and spatial distribution of different levels of rocky desertification in the study area to support decision making by local governments for sustainable development.
1. Introduction
Karst areas cover approximately 22 million km² and are an important part of Earth’s surface system, accounting for 15% of the Earth’s land area [1,2]. Karst areas are ecologically fragile and susceptible to land degradation [3]. Rocky desertification is an extreme manifestation of land degradation in karst areas that results in vegetation deterioration, soil erosion, and bedrock exposure, under the dual action of natural processes and human interference [4,5]. Accurate mapping of rocky desertification is essential for controlling land degradation in karst areas.
While the geomorphological/hydrological characteristics, geological causes, and development processes of karst areas have been well investigated, studies on rocky desertification are relatively new [4,6,7,8,9,10]. Information on the degree and spatial distribution of rocky desertification is essential for creating a baseline for sustainable land management in karst areas. Although traditional ground surveying and mapping can accurately obtain information about rocky desertification, field observation is usually costly, time consuming, and labor intensive, especially for multi-temporal large-scale monitoring [11]. Satellite remote sensing provides a synoptic view for studying Earth surface features and phenomena covering large areas [12,13,14,15]. However, most remotely sensed datasets are not freely available.
Since 2008, the National Aeronautics and Space Administration (NASA) and the U.S. Geological Survey (USGS) have been providing open access to Landsat series data [16], which has greatly facilitated the application of satellite images in many fields. The Landsat series image data, with long time span and medium spatial resolution, are one of the most widely used remotely sensed images in recent decades, including studies on rocky desertification [4,15,17]. Other remote sensing platforms have been used for mapping rocky desertification, including unmanned aerial vehicles (UAV) [18], SPOT satellites [19], ALOS satellite [20], and Earth Observing (EO) satellites [21]. These platforms provide high spatial resolution images and can better support the identification of rocky desertification in karst areas. However, UAV images, as well as most commercial high-resolution satellite images, often come at a high cost [22], especially for large study areas. In addition, compared with open-access satellite image data, commercial images are relatively difficult to obtain. Thus, in studies of rocky desertification, the application of high-resolution images is still limited, and medium-resolution satellite images are still the main data source.
In November 2019, the China National Space Administration (CNSA) started sharing the wide-field-of-view (WFV) sensor data on board the Gaofen-1 and Gaofen-6 satellites (http://www.cnsageo.com/#/), with a spatial resolution of 16m. Since the Gaofen series images are relatively new, few studies have been conducted on extracting rocky desertification from Gaofen satellite images [23]. In addition, the European Space Agency (ESA) has been sharing image data since the operation of the Sentinel series of satellites in 2014. The Sentinel images have a relatively high spatial resolution of 10m and a short reentry period [24]. As a new source of the open-access satellite image data, the Sentinel images have demonstrated the capabilities of mapping ground features, such as vegetation, coastal zone, and land cover [25,26]. However, the application of Sentinel images for mapping rocky desertification has not been reported previously rather than at the time of writing. Like the assessments of open-access image data for precision agriculture [27] and biodiversity conservation [28], it is believed that evaluation of open-access image data such as Landsat, Gaofen, and Sentinel images for extracting information on rocky desertification can provide helpful recommendations for the research community.
In addition to comparative analyses of open-access image data for mapping rocky desertification, it is worthwhile to compare the performance of different information extraction methods applied to the image data. Similar to other applications of remote sensing, traditional manual image interpretation has been used for mapping rocky desertification [6,29]. However, visual interpretation is a time-consuming process that requires a great deal of expert knowledge [30]. Some quantitative and efficient methods have been employed, such as spectral mixture analysis (SMA) [21], dimidiate pixel model (DPM) [20], maximum likelihood classification (MLC) [17], and decision tree (DT) [31]. The SMA and DPM methods can effectively reduce the influence of terrain on satellite images and improve the accuracy of information extraction in uneven and rugged terrains. The karst areas are characterized by high levels of landscape heterogeneity, and one pixel usually contains mixed spectral information of vegetation, bedrock, and bare soil [20]. However, the results on mapping rocky desertification are usually of low accuracy in karst areas when using the SMA and DPM alone, because the surface color of rocks may vary depending on the intensity of human disturbance and the degree of weathering erosion. The MLC and DT methods are parameterized and non-parameterized, respectively, and have good performance and widespread application [17,32]. However, the MLC method needs a lot of time in the process of supervised classification, while the DT method does not take into account the relationships between attribute data [33]. Random forest (RF) and bagged decision tree (BDT) were proposed to strengthen the function of DT and achieve machine integrated learning [34,35]. However, both the RF and BDT algorithms use the bagging algorithm; therefore, their threshold values in classification are not obtained completely randomly, resulting in a large variance [36].
The extremely randomized trees (ERT) algorithm has been increasingly applied to solving classification and regression problems [37]. It is a new tree-based classification and regression method. Based on many DT models, ERT conducts classification in a holistic and random way, with smaller variance and more stable prediction results [38]. The ERT algorithm can obtain and integrate variable knowledge in many aspects and enhance the randomness of classification operation. It has the advantages of RF and BDT and seems to be suitable for classification of objects with complex heterogeneity [39]. As a typical classification and regression method, the ERT model is mainly applied to medical science, biology, and atmospheric science [40,41,42]. At present, the model has not been used for the classification of Earth surface features. From the perspective of remote sensing, it is only used in the study of air pollution identification and prediction [43]. The ERT model is worthy of further exploration and discussion for ground object identification. Therefore, a comparative analysis of the performance of RF, BDT, and ERT for extracting rocky desertification would be desirable.
Located in the center of East Asia, the karst area in southwest China is one of the three largest karst regions in the world, with a total area of 540,000 km2 and a population of over 220 million [44,45]. Its rocky desertification is extremely serious, becoming the third biggest ecological problem in China after the desertification in northwest China and soil erosion in the Loess Plateau [46]. This paper presents a comparative analysis of open-access satellite images for extracting information on rocky desertification, in terms of both data and methods, in a typical karst area in southwest China. The objectives are: (1) evaluating the capabilities of three open-access satellite image datasets (Sentinel-2, Landsat-8, and Gaofen-6) for mapping karst rocky desertification; (2) comparing the performance of three machine-learning algorithms (RF, BDT, and ERT) for extracting information on rocky desertification; (3) discussing the advantages and limitations of the three open-access image datasets and the machine-learning algorithms for extracting information on rocky desertification in karst areas.
2. Study Area and Data
2.1. Study Area
The study area, Guangnan County with an area of 7730 km2, Yunnan Province, southwest China (104°31′~105°39′E, 23°29′~24°28′N), is a typical region with karst rocky desertification (Figure 1). Carbonate rocks (karst) are distributed in most regions of the county, with shale and clastic rocks in the north and mid-east regions. The mountainous region accounts for 94.7% of the total area of the county, and the flat region accounts for 5.3%, with an average altitude of 1280 m. The county is characterized by a subtropical plateau monsoon climate, with an annual average sunshine of 1857 h, an annual average temperature of 16 °C, and an annual average rainfall of 1057 mm. There are significant differences between dry and rainy seasons.
The county also has a prominent problem of impoverishment. For a long time, it has been in a vicious cycle of “fragile ecology → extensive development → rocky desertification → enhanced poverty” [47]. Due to the wide distribution of rocky desertification, Guangnan County was listed as the pilot county of China’s comprehensive control of rocky desertification in 2008. Meanwhile, the per capita net income of the county was about RMB 8700 in 2018, only 30 percent of the national average of the same year, making it one of the most important counties for poverty alleviation in China. Through the implementation of various projects on ecological control and targeted poverty alleviation, rocky desertification in isolated parts of the study area has been alleviated in recent years. Nonetheless, deforestation, overgrazing, and other ecologically destructive behaviors remain a challenge. Thus, the overall situation of rocky desertification in the study area has not been fundamentally reversed.
2.2. Satellite Image Data and Other Data
Three open-access satellite image datasets (Sentinel-2B, Landsat-8, and Gaofen-6) are used in this study, representing products from three remote sensing satellite series. Six Sentinel-2B L2A images acquired in March 2019 were downloaded from the data sharing site (Copernicus Open Access Hub) of the European Space Agency (ESA) (Table 1). The L2A products of Sentinel-2B have undergone radiometric calibration, atmospheric correction, geometric correction, and orthorectification. Therefore, the L2A products of Sentinel-2B are the bottom-of-atmosphere corrected reflectance data. Then, a mosaic of six images was created using the SNAP software, and it was clipped by the vector boundary of Guangnan County.
Four Landsat-8 L1T images acquired in March 2019 were downloaded from the USGS data sharing site (Earth Explorer) (Table 1). The L1T products of Landsat-8 were created after radiometric calibration and geometric precision correction. The atmospheric correction and orthorectification were carried out using the ENVI 5.3 software, to obtain the bottom-of-atmosphere corrected reflectance of Landsat-8. Then, a mosaic of four images was produced using the ENVI 5.3 software, and the image was clipped by the vector boundary of Guangnan County.
One Gaofen-6 L1T image acquired in February 2019 was downloaded from the CNSA data sharing site (CNSA-GEO) (Table 1), as the wide-format camera (800km) equipped with the Gaofen-6 can directly cover the study area with one image. The Gaofen-6 image is an uncorrected basic satellite imagery product. We used the “Domestic Satellite Support Tool of China” plug-in of the ENVI 5.3 software to load the image and completed the radiometric calibration, atmospheric correction, geometric precision correction, and orthorectification, to obtain the bottom-of-atmosphere corrected reflectance. Then, the Gaofen-6 image was clipped by the vector boundary of Guangnan County using the ENVI5.3 software.
The multispectral image data of the study area during the dry season in the first half of 2019 were obtained through downloading and preprocessing the images of open-access Sentinel-2B, Landsat-8, and Gaofen-6 satellites. The open-access image data and other datasets are listed in Table 1. The relevant parameters of the image data are shown in Table 2.
The main factors affecting rocky desertification include vegetation coverage, exposed rocks, topography, and lithology [18,31]. Additional factors may include land use, soil type, soil thickness, and human activities [48,49]. These factors were mainly obtained through processing the other auxiliary data, including NASA DEM, Rocky Types, Land Use Database, and Soil Data (Table 1).
3. Methods
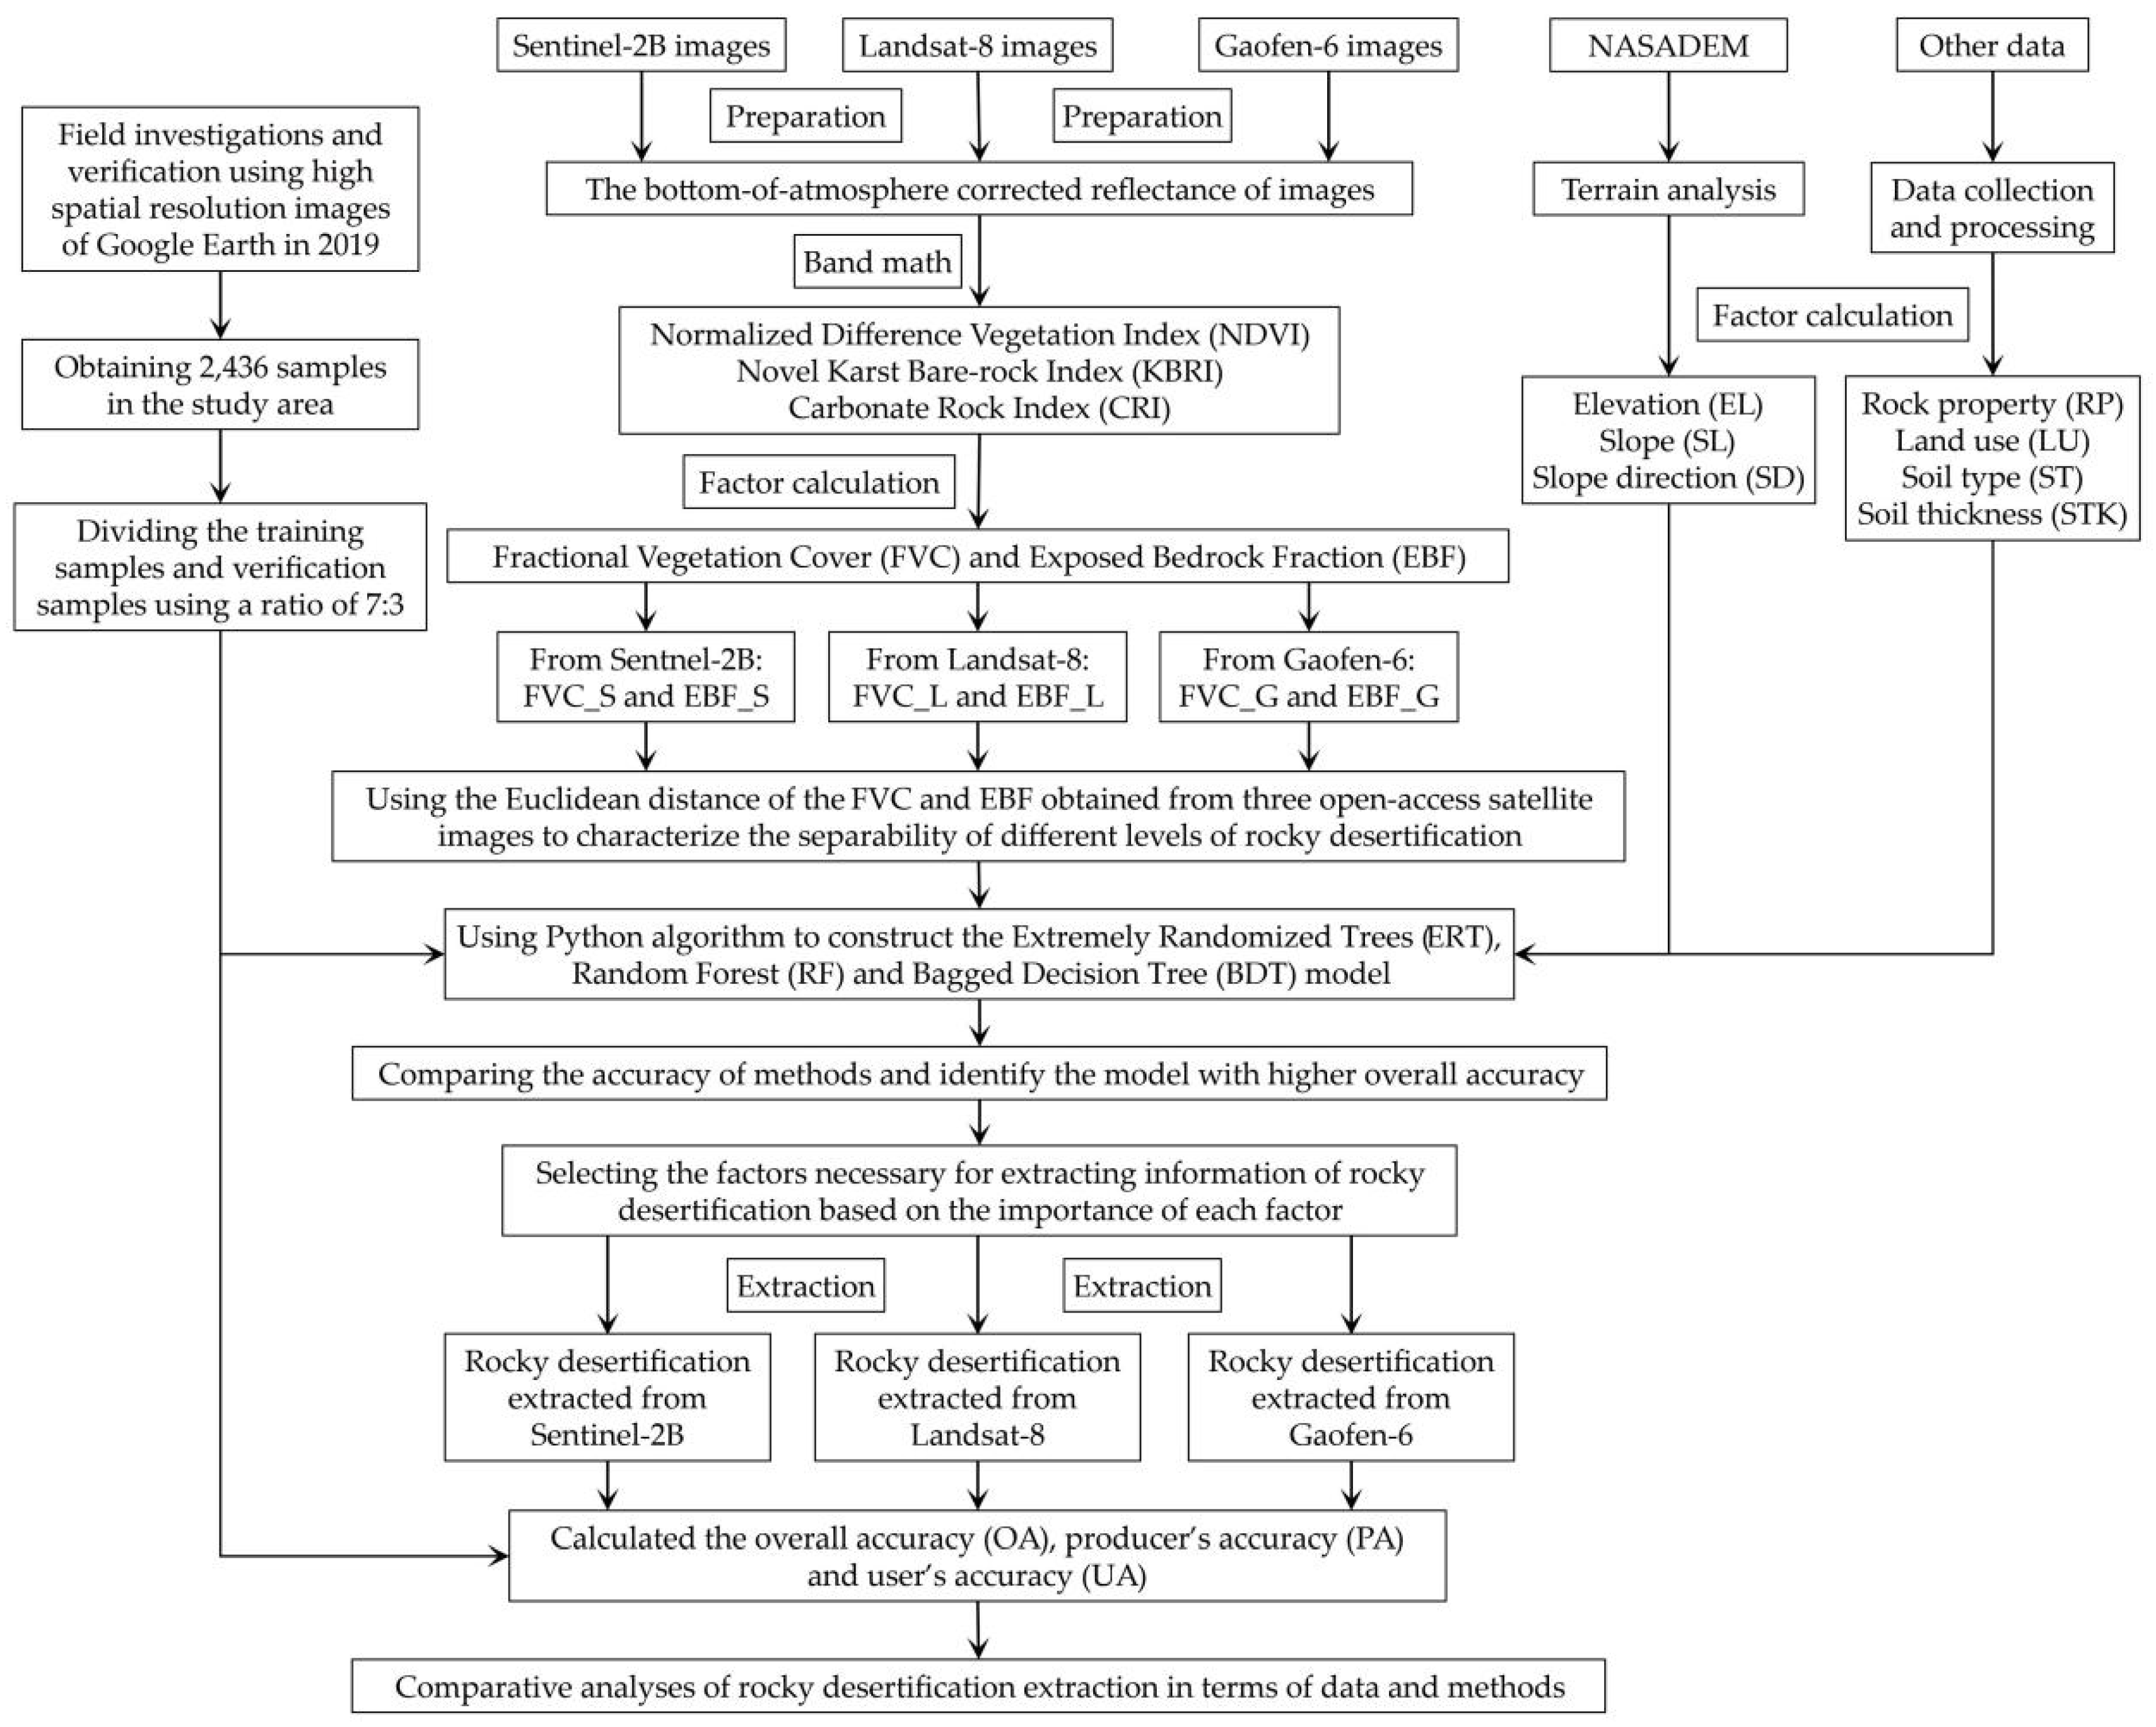
First, after downloading and pre-processing remotely sensed data and ancillary data, we calculated the factors required for information extraction of rocky desertification. Then, we compared the separability of the fractional vegetation cover (FVC) and exposed bedrock fraction (EBF) obtained by three types of images (Sentinel-2B, Landsat-8, and Gaofen-6) on distinguishing rocky desertification by Euclidean distance. Finally, we built ERT, RF, and BDT models through the Python programming language and selected the best model based on their performance in extracting rocky desertification from the three types of images. The methodology flowchart is shown in Figure 2, and some major components of the flowchart are described in the following sections.
3.1. Calculation of Factors
3.1.1. Calculation of Remotely Sensed Factors
After image preprocessing, the Normalized Difference Vegetation Index (NDVI) of three types of image data was obtained through the “band math” tool of ENVI5.3 software.
where NDVIg and NDVI0 denote the maximum NDVI and minimum NDVI, respectively; KBRIr and KBRI0 denote the maximum KBRI and minimum KBRI, respectively; CRIr and CRI0 denote the maximum CRI and minimum CRI, respectively; NIR, Red, Blue, and SWIR1 refer to the near-infrared band, red band, blue band, and the 1st shortwave infrared band of the multispectral image data.
The FVC in the study area was obtained by using NDVI (Equations (1) and (2)). Pei et al. proposed a Karst Bare-Rock Index (KBRI) (Equation (3)), which showed better extraction capability of exposed rocks compared with the previous Normalized Difference Rock Index (NDRI) [4]. For Sentinel-2B and Landsat-8 satellite images, we calculated KBRI to represent surface rock features. However, as the Gaofen-6 image does not contain shortwave infrared (SWIR) bands, the KBRI cannot be calculated for the Gaofen-6 image. The Carbonate Rock Index (CRI) proposed by Xie et al. [50] (Equation (4)) was obtained from the Gaofen-6 image instead. Then, the KBRI or CRI were used to obtain the EBF of study area (Equation (5)). The Sentinel-2B images were processed using the SNAP software, and the Landsat-8 and Gaofen-6 images were processed using the ENVI 5.3 software (Exelis Visual Information Solutions, USA).
3.1.2. Calculation of Other Factors
Some other factors that may be needed for extracting rocky desertification information have been selected based on field investigation and existing studies [18,31,48,49]. They include the elevation (EL), slope (SL), slope aspect (SP), lithology (RP), land use (LU), soil type (ST), and soil thickness (STK) in the study area. We downloaded the latest NASADEM data (spatial resolution: 12.5 m) to extract the EL, SL, and SP of the study area. The data of RP, LU, ST, and STK were obtained from the Bureau of Natural Resources and Bureau of Agricultural Technology of Guangnan County (Table 1). They were also used for information extraction of rocky desertification after rasterization.
3.2. Method for Comparing Separability
Euclidean distance is a parameter based on the sample similarity to express the aggregation extent of similar samples and the separability of different samples.
where di,j is the Euclidean distance between the i-th and j-th level of rocky desertification; xi and xj are the average value of the i-th and j-th level; σ2 is the variance of the samples.
The greater the Euclidean distance between the two levels, the stronger the separability between the levels; conversely, the smaller the Euclidean distance between the two levels, the weaker the separability between the levels (Equation (6)). In this study, the Euclidean distance between different levels of rocky desertification is used to characterize the separability of the EBF and FVC indexes obtained from the three open-access satellite images. The capability of information extraction is obtained by comparing the available remotely sensed indexes.
3.3. Model Construction for Information Extraction
Extremely randomized trees (ERT), an integrated learning prediction algorithm based on decision tree (DT), was proposed by Geurts in 2006 [38]. Based on the classic top-down approach, a series of “free-growing” DT sets are randomly constructed. The characteristic of the ERT is that the selection of the bifurcation values is completely random, and each tree uses all the training samples. Random forest (RF) and bagged decision tree (BDT) are classifiers that are trained and predicted based on the bagging algorithm [34,35]. We implemented the ERT, RF, and BDT classifiers using ExtraTreesClassifer, RandomForestClassifer, and BaggingClassifer algorithms from the Sklearn.ensemble package of Python under the Anaconda environment. The following are the major steps for the ERT, RF, and BDT classification:
(1) Based on research literature on rocky desertification [20,31,51], the degree of rocky desertification in the study area was divided into five levels: no rocky desertification, potential rocky desertification, mild rocky desertification, moderate rocky desertification, and severe rocky desertification. Sample data were collected during field surveys (Table 3), and the ERT, RF, and BDT models were constructed using the Python programming language.
(2) All feature factors were extracted from remotely sensed data and ancillary data and saved as text or table files, which were brought into the ERT, RF, and BDT classification models.
(3) Iterative operations of sampling and tree building were carried out to identify the best-performing model. Our test results suggest that the classification accuracy appears to be stable when the number of DTs is over 10,000. Thus, 10,000 was set as the number of DTs in the ERT, RF, and BDT models in this study.
(4) The prediction results of all the base classifiers are counted, and the final classification results are produced by the voting decision method. The generated ERT, RF, and BDT results are tested with the validation samples (Table 3).
(5) We selected the better model by the accuracy comparison. Additionally, we selected the factors needed to extract the information of rocky desertification according to the importance of each factor during operation. We carried out 100 times iterative operation of the algorithm and selected the operation result with the optimal precision. The selected result is the classification result of rocky desertification.
(6) Through importing the classification result into the study area, the final area and spatial distribution map of rocky desertification are obtained.
3.4. Accuracy Assessment
Accuracy assessment is an important step after classification [40,52]. Through extensive field investigations and analyses of 2019 Google Earth high-resolution images, we collected 2436 samples that are evenly distributed in the study area (Figure 1), covering all levels of rocky desertification. The samples were randomly divided into training samples and validation samples according to a ratio of approximately 7:3, which were used for information extraction and accuracy assessment after classification (Table 3). The overall accuracy (OA), producer’s accuracy (PA), and user’s accuracy (UA) were used to measure the performance of the open-access satellite data and classification methods.
4. Results
4.1. Information Analysis of Three Types of Images
4.1.1. Contrast of Spectral Reflection Information
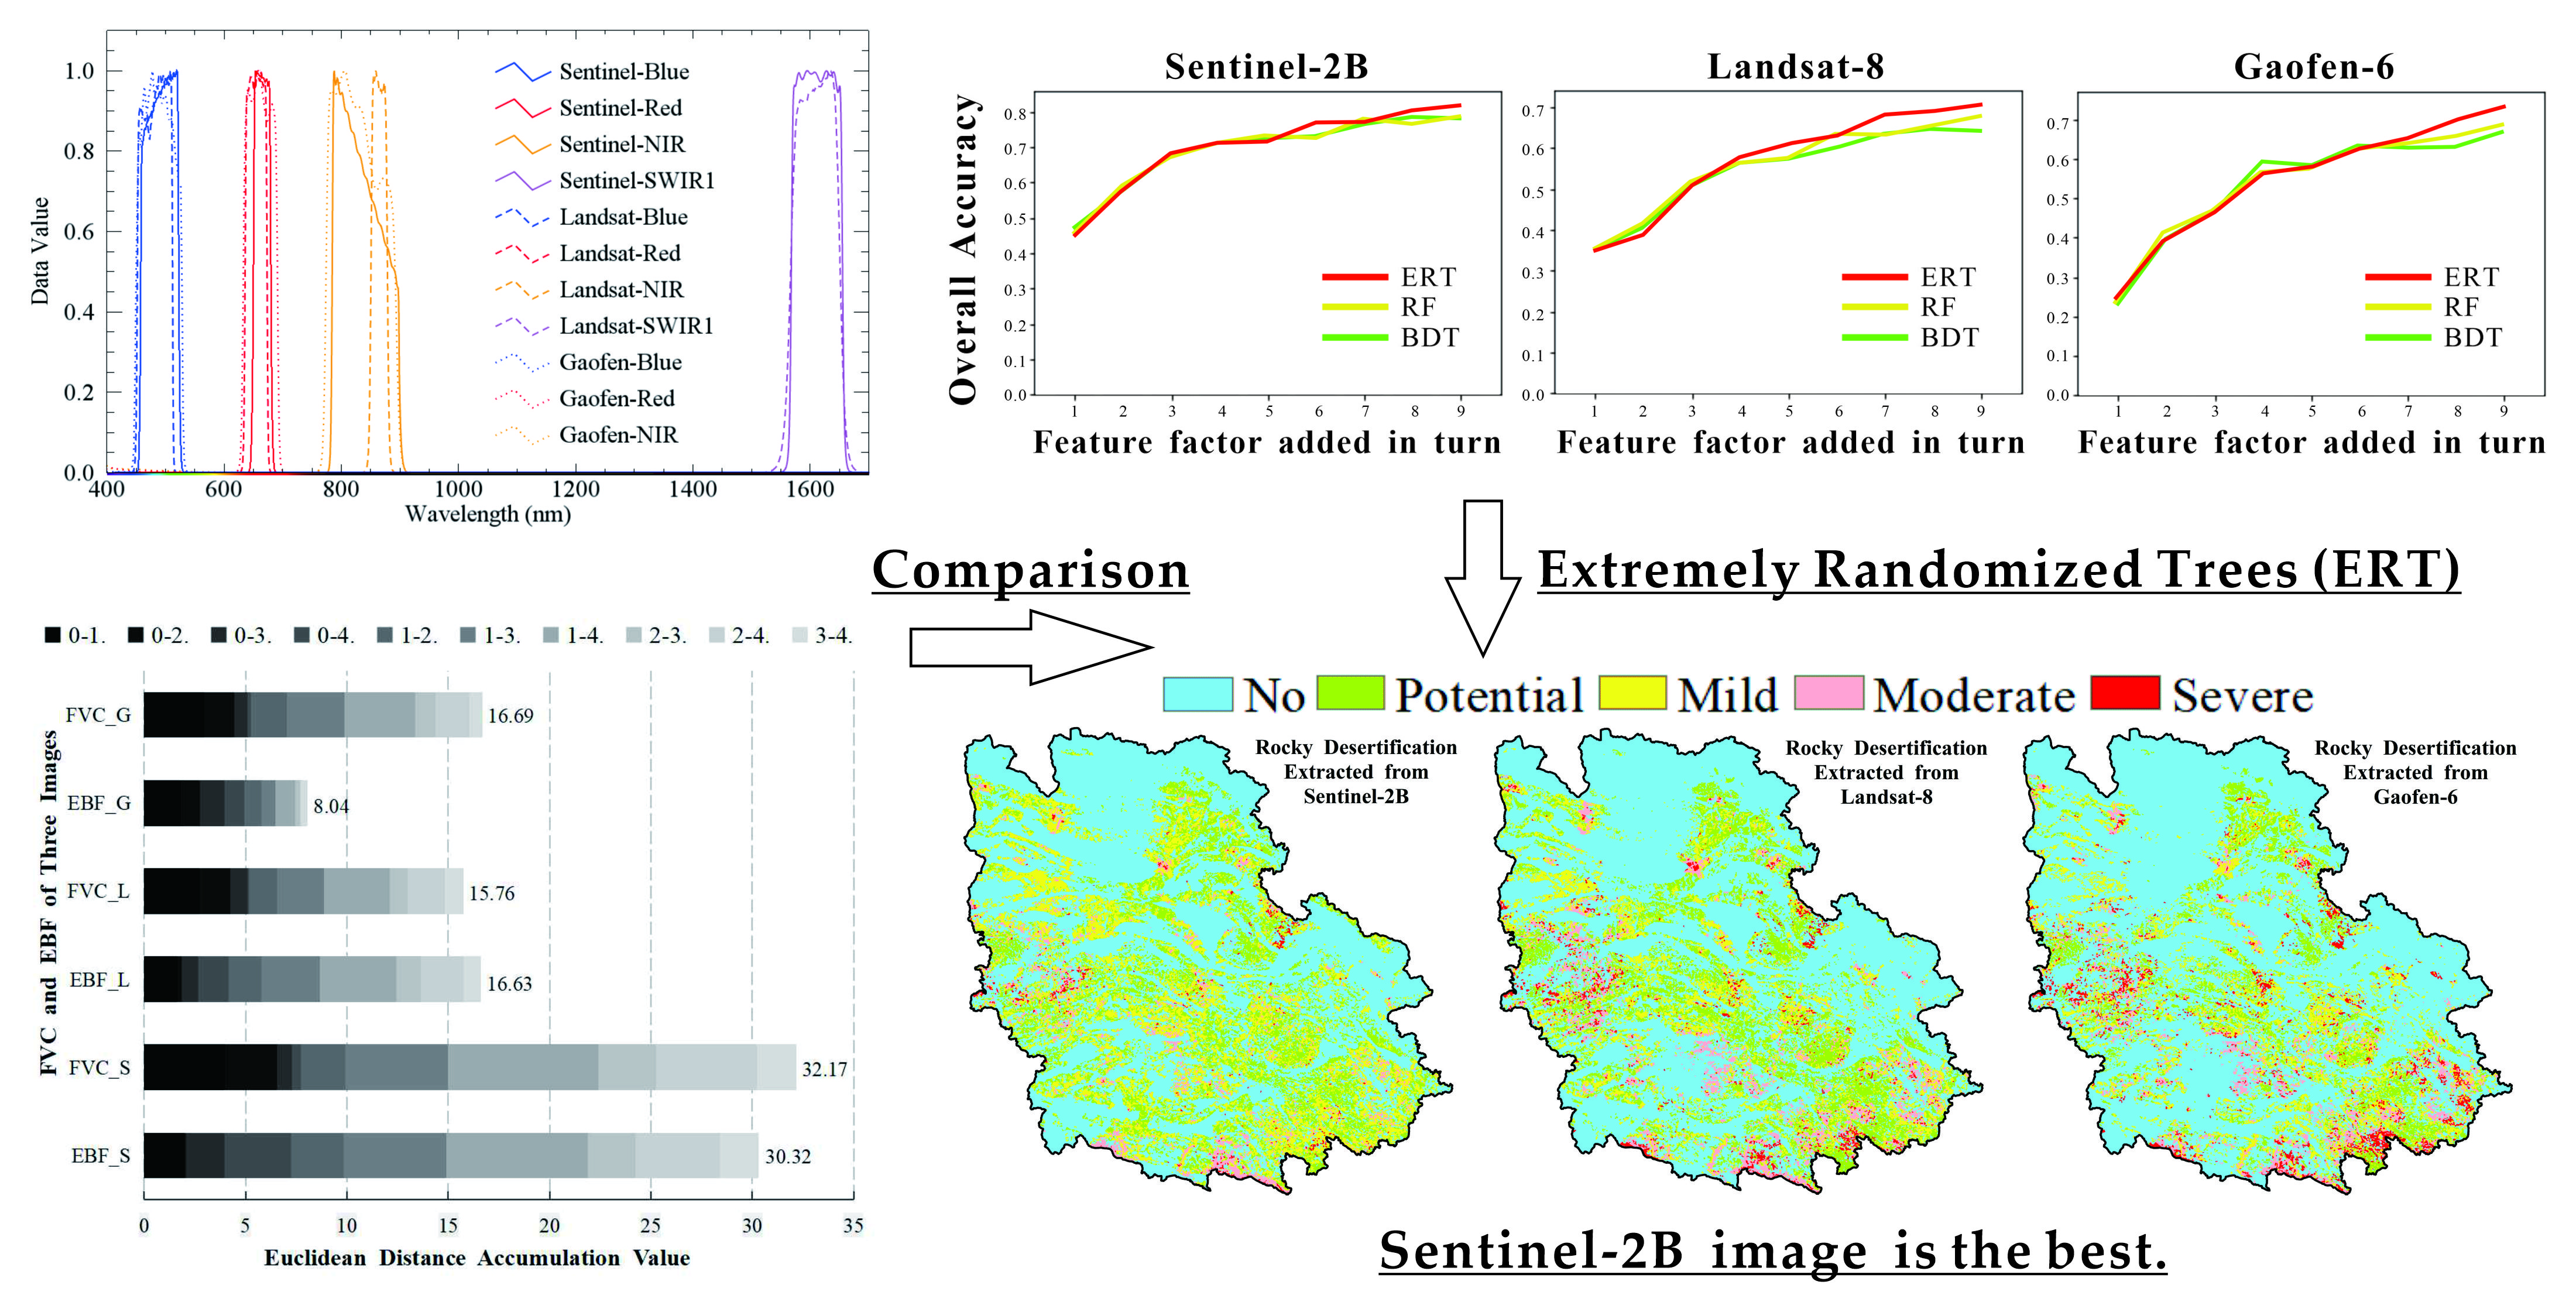
According to the calculation equations of EBF and FVC, the bands that can be used to extract rocky desertification information in Sentinel-2B, Landsat-8, and Gaofen-6 images mainly include the Blue band, Red band, NIR band, and SWIR1 band. The spectral ranges of the three types of images are similar in the Blue band and Red band, but there are significant differences in the NIR band and SWIR1 band (Table 4). The NIR band of Landsat-8 eliminates the water vapor absorption characteristic at 825 nm and is obviously narrower than that of Sentinel-2B and Gaofen-6, with fluctuation phenomenon [23]. The NIR bands of Sentinel-2B and Gaofen-6 have a wide range, covering the most important “red-edge” band in the vegetation spectrum recognition and rising sharply with the increase in wavelength between 760 and 790 nm. There is no significant difference between the SWIR1 bands of Sentinel-2B and Landsat-8, while Geofen-6 does not have a SWIR band. The spectral reflectance value of Sentinel-2B has serrated fluctuation, while Landsat-8 gradually increased. These four bands are important for calculating EBF and FVC, and their differences also indicate that the three open-access images worth comparing for information extraction of rocky desertification.
4.1.2. Separability of FVC and EBF for Rocky Desertification
Through image processing methods described earlier, the spatial distribution map of FVC and EBF of three types of satellite images were obtained (Figure 3). For the FVC, there is not much difference in the results (FVC_S, FVC_L, and FVC_G), except some differences in the northern parts of the study area. Since the FVC and EBF represent vegetation and rock (non-vegetation) coverage, respectively, they show opposite characteristics in the results of Sentinel-2B and Landsat-8. That is, the areas with high FVC have lower EBF, and vice versa. However, due to the inconsistent calculation method, the EBF of Gaofen-6 is not the same as that of the other two satellites, and most of the EBF raster from Gaofen-6 have low values, so it is not effective for extracting rocky desertification.
The Euclidean distances were calculated to compare the capability of detecting rocky desertification using the six remotely sensed indexes (FVC_S, FVC_L, FVC_G, EBF_S, EBF_L, and EBF_G), as expressed in the Euclidean distance accumulation histogram by superimposing the Euclidean distances of different levels of rocky desertification (Figure 4). First, the separability of FVC extracted from the Sentinel-2B image is the highest, with a superimposed Euclidean distance of 32.17. Moreover, it has advantages in distinguishing different levels of rocky desertification between “no” to “potential” (0–1), “potential” to “moderate” (1–3), “potential” to “severe” (1–4), and “mild” to “severe” (2–4). The EBF extracted from Sentinel-2B image has also a good separability, whose superimposed Euclidean distance is 30.32. It has advantages in distinguishing different levels of rocky desertification between “potential” to “moderate” (1–3), “potential” to “severe” (1–4), and “mild” to “severe” (2–4). Second, the FVC extracted from Gaofen-6 and the EBF and FVC extracted from Landsat-8 have similar separability, whose superimposed Euclidean distance are 16.69, 16.63, and 15.76, respectively. They also have advantages in distinguishing different levels of rocky desertification between “no” to “potential” (0–1), “potential” to “moderate” (1–3), “potential” to “severe” (1–4), and “mild” to “severe” (2–4). However, since a different equation was used for calculating EBF from Gaofen-6 (see Equation (5)), the separability of EBF_G for rocky desertification is lower than other indexes, with the superimposed Euclidean distance of only 8.04. In general, compared with the FVC, the EBF has a lower classification capability on different levels of rocky desertification between “no” to “potential” (0–1) and “no” to “mild” (0–2) levels of rocky desertification, but a stronger capability to classify different levels between “no” to “moderate” (0–3) and “no” to “severe” (0–4). The classification capability of FVC and EBF is similar for other levels (Figure 4).
4.2. Extraction Results of Rocky Desertification
4.2.1. Comparison of the Classification Accuracy of Three Methods
We added the nine feature factors, calculated in the earlier stage, into the ERT, RF and BDT algorithms successively (among which, the addition order of ERT and RF is determined by the importance of the analyzed factor in the model; the BDT algorithm fails to recognize the factors’ importance and uses the addition order of the ERT model). From the perspective of classification stability, the OA of ERT model increases with the addition of feature factors. Although the OA of RF and BDT models is also increasing overall, there is occasionally a slight decrease in the middle (Figure 5). When the classification accuracy of three models reached the maximum, the OA of ERT is the highest. Its accuracy of Sentinel-2B, Landsat-8, and Gaofen-6 images for information extraction of rocky desertification are 85.21%, 74.15%, and 73.60%, respectively. The ERT model uses all training samples and provides a better classification stability and accuracy. However, the OA of other two models is relatively lower. Since the RF and BDT models adopt a bagging algorithm for random sampling rather than use all the training samples, they have the weaker classification stability and accuracy. The OA of RF are 80.85%, 70.86%, and 72.64% from three types of images, respectively, about 2.87% lower than those obtained by ERT on average. The OA of BDT are 78.93%, 68.40%, and 70.31%, respectively, about 5.11% lower than those obtained by ERT.
By comparing the stability and accuracy of the three models, it can be seen that ERT has certain advantages on information extraction of rocky desertification in karst areas. This is consistent with our expected hypothesis. In karst areas with strong landscape heterogeneity, ERT has a higher robustness and a better classification capability for information extraction of rocky desertification. Thus, the extraction results of rocky desertification obtained by ERT were used for subsequent analysis.
4.2.2. Comparison of Classification Results Based on Factors Selection
The ERT algorithm is used to analyze and evaluate the importance of each feature factor (Figure 5), so as to select the feature factors to improve the accuracy of classification, and to reduce data redundancy. The higher the importance score, the greater the contribution of the factor for the classification (sum to 1 of all factors).
For Sentinel-2B, the importance of EBF_S on information extraction of rocky desertification is the highest (importance = 0.28), playing the strongest role in classification. The OA reaches 45% when use the EBF_S factor alone. The importance of FVC_S is also high (importance = 0.18). These two factors play a strong role in rocky desertification classification. The OA reaches 62% when considering these two factors. The importance of other feature factors is less than or equal to 0.10, with weaker effects on classification. In particular, SP, ST, and RP have no obvious effect on classification.
For Landsat-8, although the EBF_L and FVC_L have the higher importance on rocky desertification classification (importance = 0.17 and 0.14), the importance values are less than those derived from Sentinel-2B images. When using EBF_L and FVC_L alone, the OA of rocky desertification classification is only 38% (24% lower than the Sentinel-2B image). Therefore, it is also important that other feature factors are taken into account in the ERT model of Landsat-8. The importance values of SL, STK, EL, and LU are all around 0.12, while the importance values of SP, ST, and RP are lower than 0.10. When the number of feature factors is gradually increased, the classification accuracy of Landsat-8 images is significantly improved compared with the ERT model of Sentinel-2B images.
For the Gaofen-6 image, the most important feature factor of rocky desertification classification is FVC_G (importance = 0.16). Even so, the classification accuracy is only 24% when using this factor alone. The three factors of SL, STK, and EL have similar importance (between 0.12 and 0.14). After employing these three factors, the OA is improved significantly. However, in the ERT model of the Gaofen-6 image, EBF_G has a lower importance (0.12) and a lower ranking, indicating that it plays a small role in the rocky desertification classification. The importance of other factors is lower than 0.14, and the ST and RP have the lowest importance.
Based on the analysis of the factors’ importance and classification accuracy in the ERT model constructed by three types of open-access satellite images, it can be seen that the feature factors with higher importance contribute more to classification. Therefore, factors can be grouped and screened by importance. The indexes of EBF and FVC (except EBF_G) have the highest contribution on extracting rocky desertification, followed by the factors of LU, SL, EL, and STK, while the contributions of SP, ST, and RP are the lowest. Therefore, we divided the feature factors into three groups on the basis of the importance values and further built the ERT model for extracting rocky desertification from the images. The first group includes EBF and FVC factors (ET1), to clarify the situation of information extraction of rocky desertification when only remote sensing factors are considered. The second group adds LU, SL, EL, and STK factors (ET2) to the first group (ET1), since the importance of these factors is at the intermediate level. Additionally, the third group adds SP, ST, and RP factors with lower importance (ET3) to the first two groups.
4.2.3. Accuracy Evaluation of Extraction Results
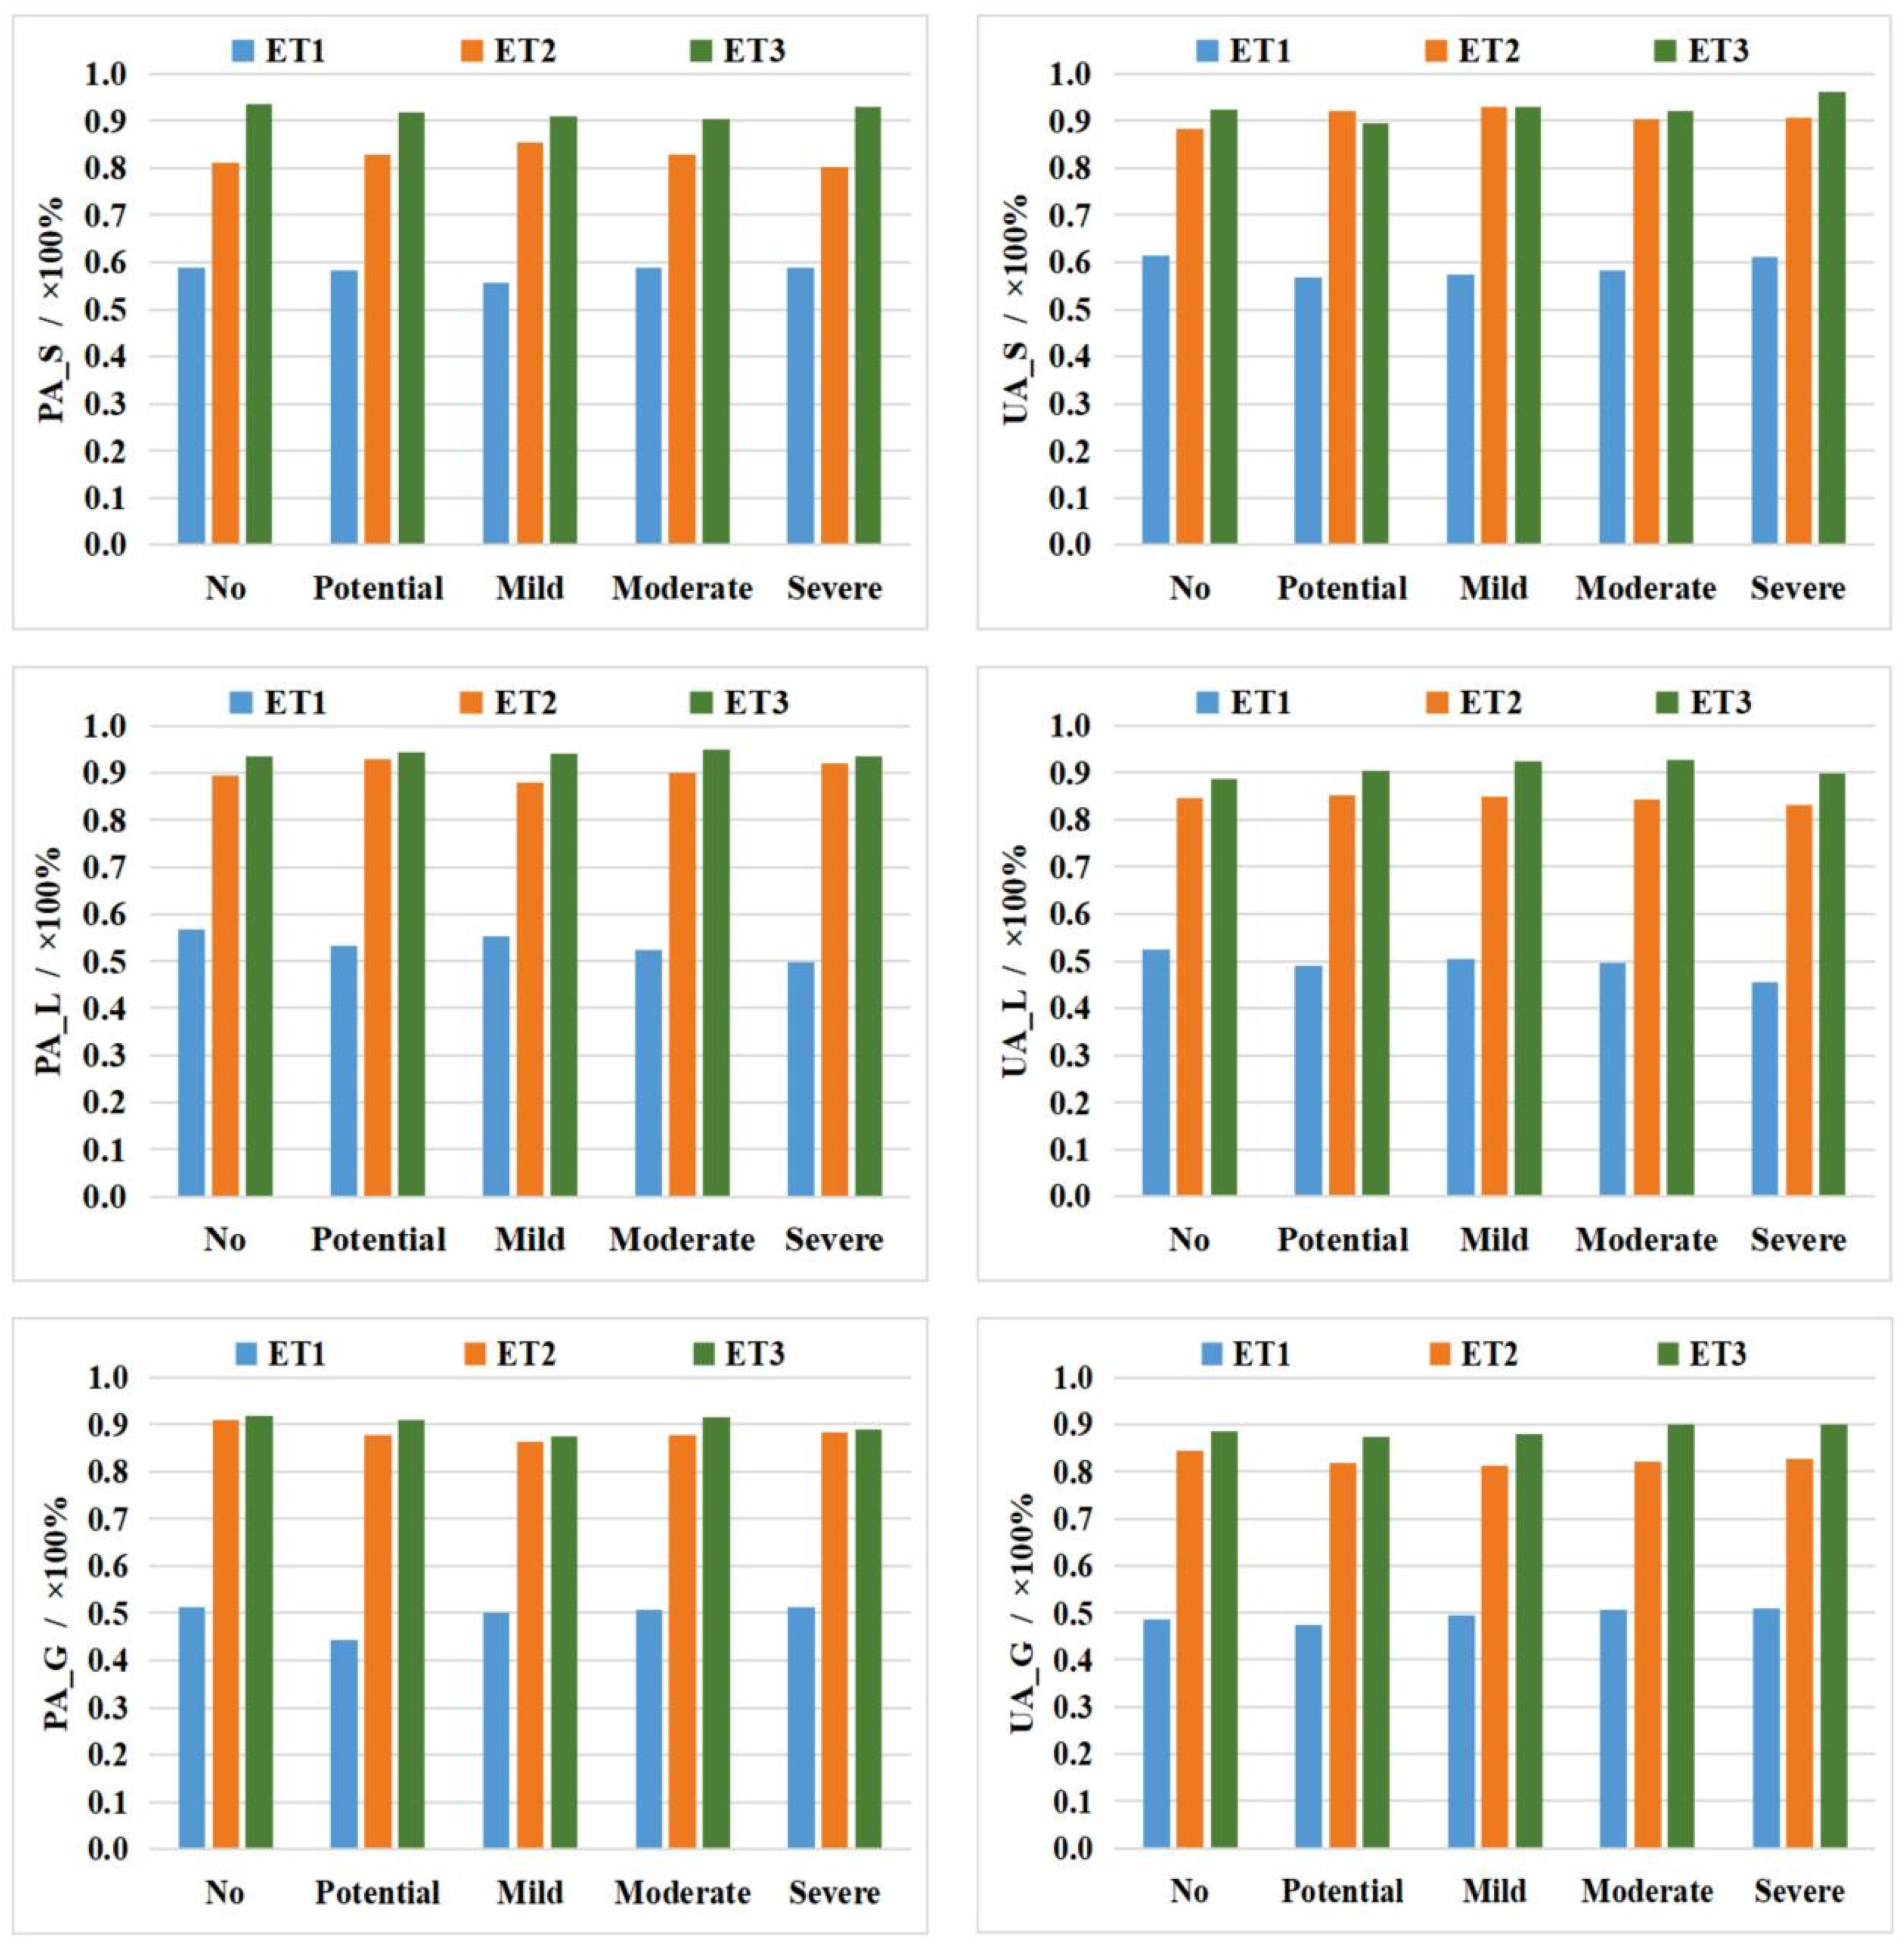
We mainly analyzed the accuracy of extraction results in ET1, ET2, and ET3, since there was no significant difference in OA between different levels of rocky desertification (Figure 6). In ET1, because only two factors of EBF and FVC are used, the producer’s accuracy and user’s accuracy are not very high. The producer’s accuracy and user’s accuracy can reach about 60% in the extraction results of Sentinel-2B, while the accuracies from Landsat-8 and Gaofen-6 images are slightly lower. In the results of ET2 and ET3, the producer’s accuracy and user’s accuracy of the three models are improved, indicating that the accuracy of information extraction of rocky desertification can be effectively improved after incorporating the feature factors such as topography, soil, and lithology. The information of rocky desertification can be better extracted by adding other feature factors, which are related to the occurrence of exposed rocky desertification, such as topographic, lithologic, and soil factors. Therefore, combining with the changes in the OA, producer’s accuracy, and user’s accuracy, we selected all nine feature factors to extract the information of rocky desertification. After extracting information of rocky desertification by using nine feature factors, the results are consistent with the previous results of Euclidean distance analysis.
4.2.4. Comparison of Extraction Results of Rocky Desertification
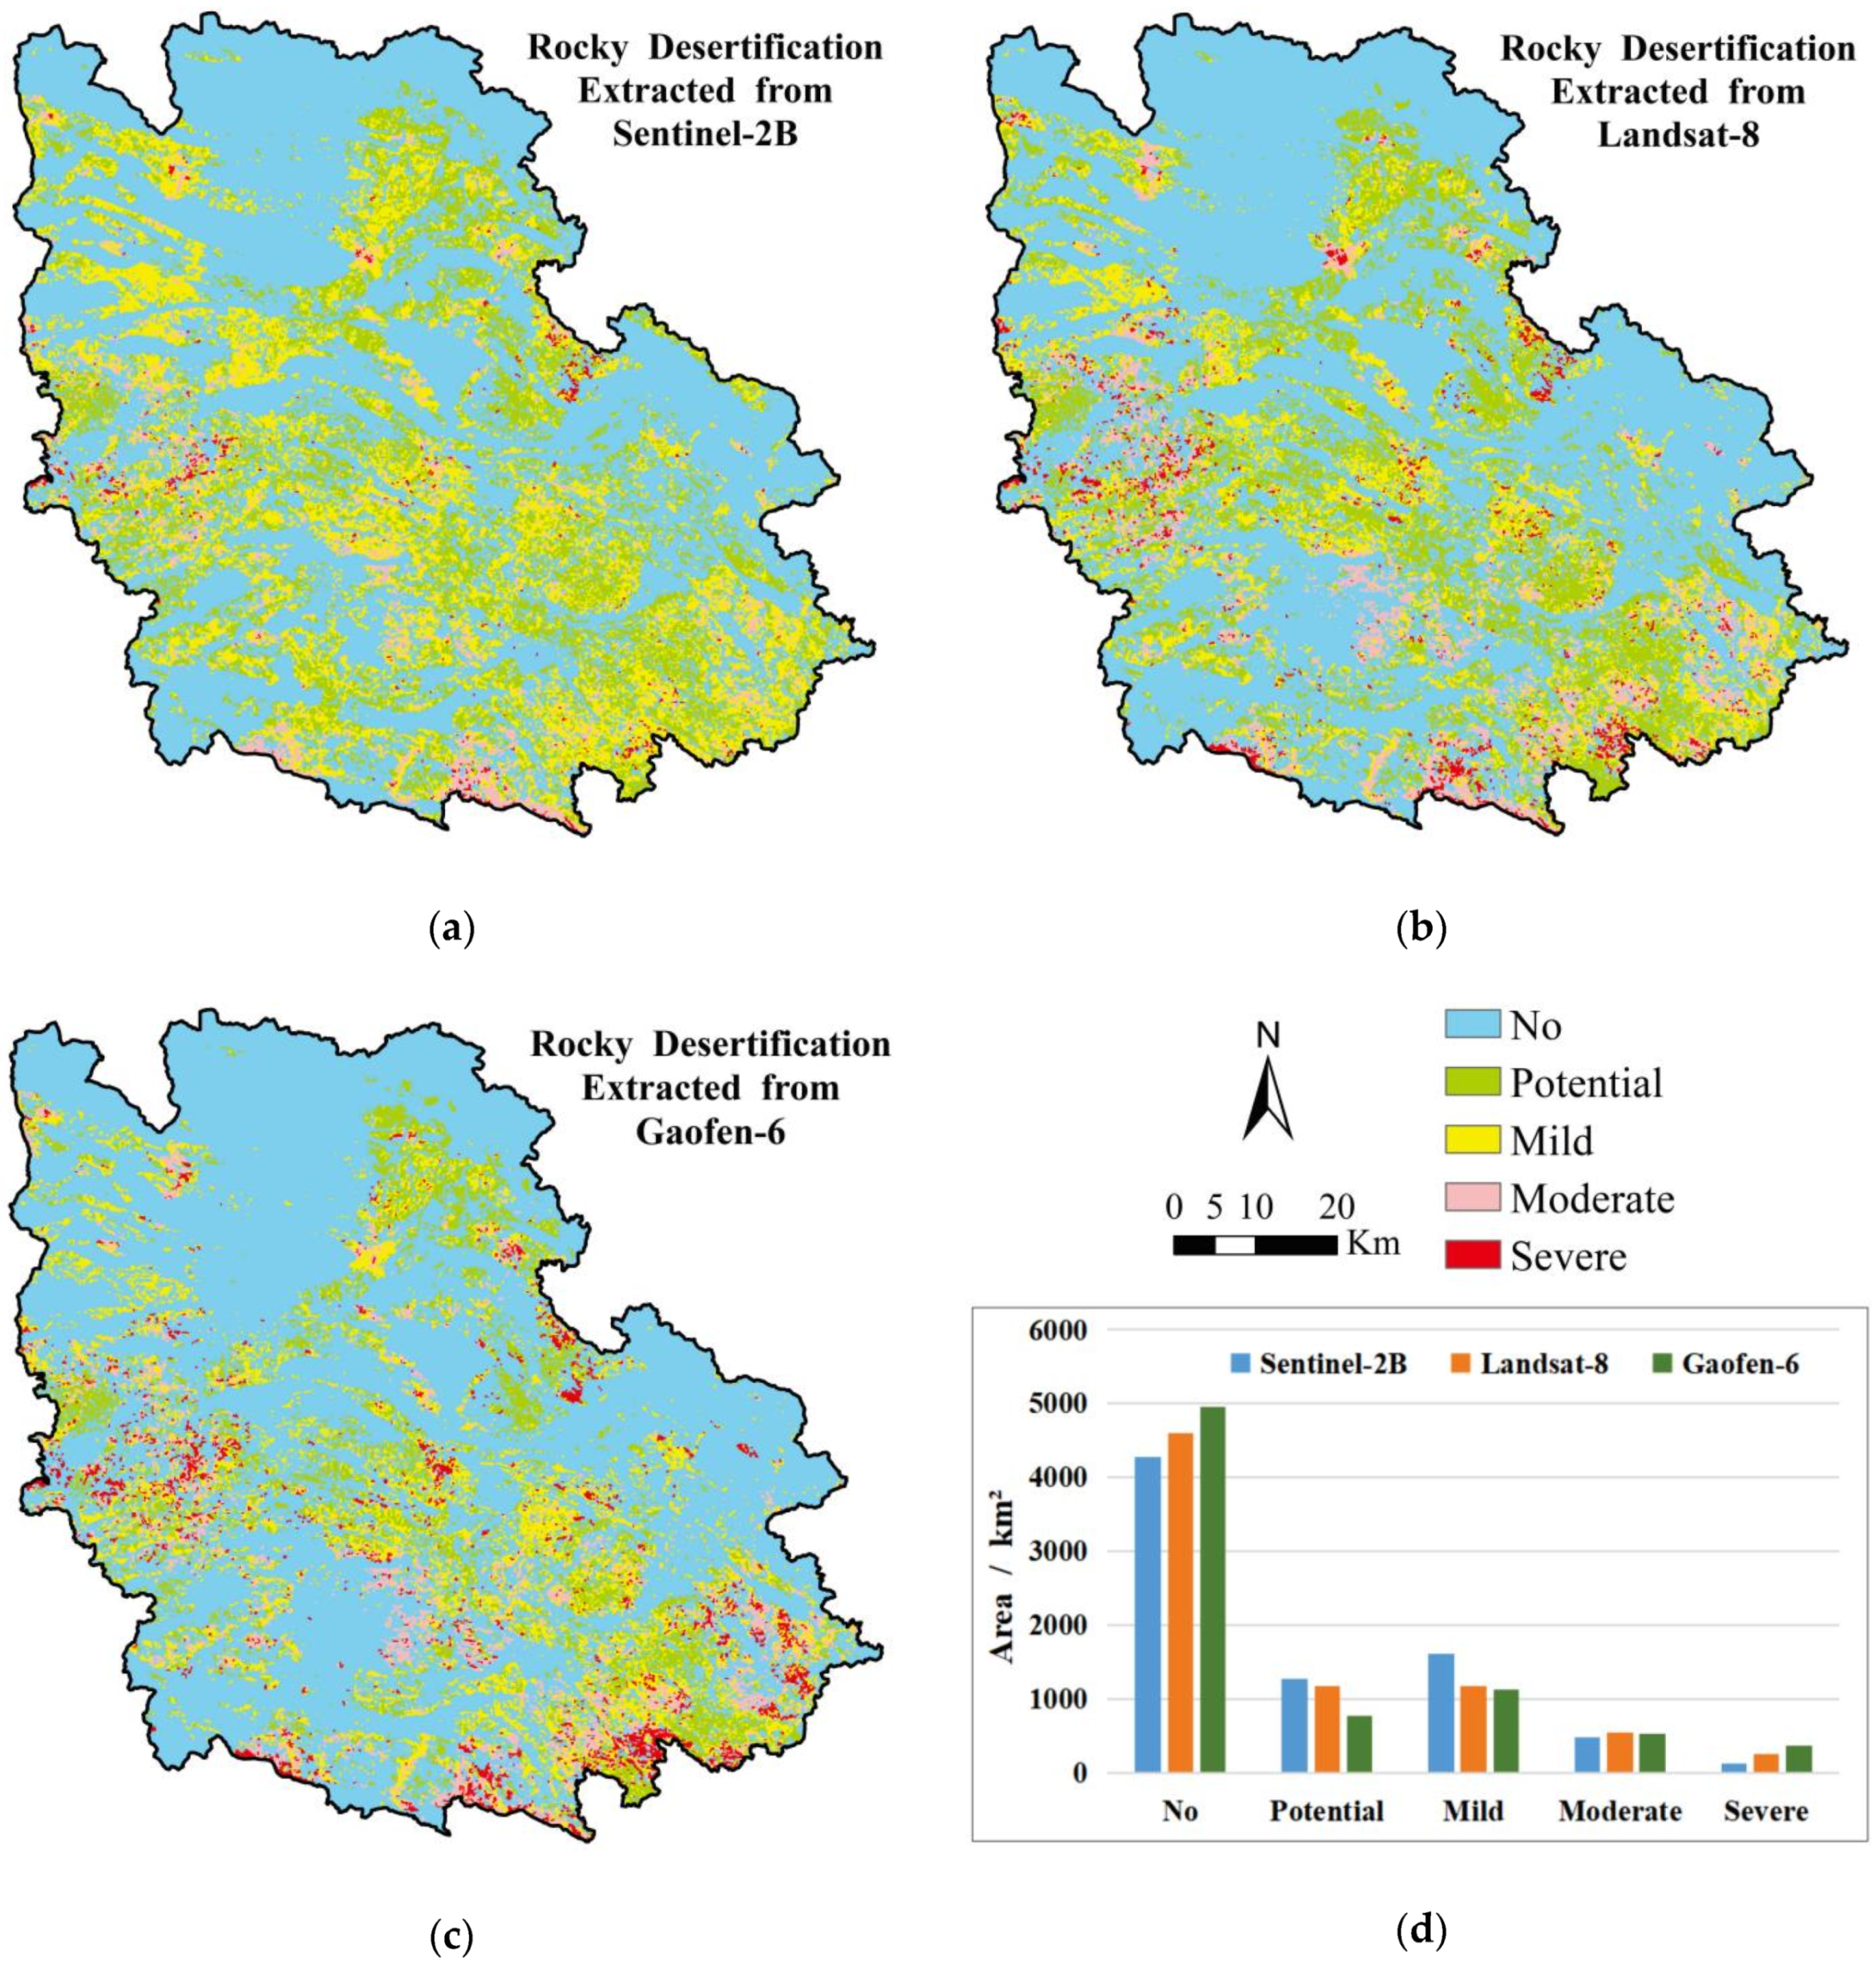
Using all nine feature factors, the spatial distributions of each level of rocky desertification are finally classified (Figure 7). The Sentinel-2B image revealed the largest area (3,469 km2) of rocky desertification, followed by Landsat-8 image (3137 km2) and Gaofen-6 image (2790 km2). Among the rocky desertification levels extracted from the three images, the areas of the moderate rocky desertification are not much different, while the areas of the other levels are different. For no rocky desertification and severe rocky desertification, the order of the areas extracted from the three images is Sentinel-2B < Landsat-8 < Gaofen-6, while the order of potential rocky desertification and mild rocky desertification is opposite: Sentinel-2B > Landsat-8 > Gaofen-6 (Figure 7d).
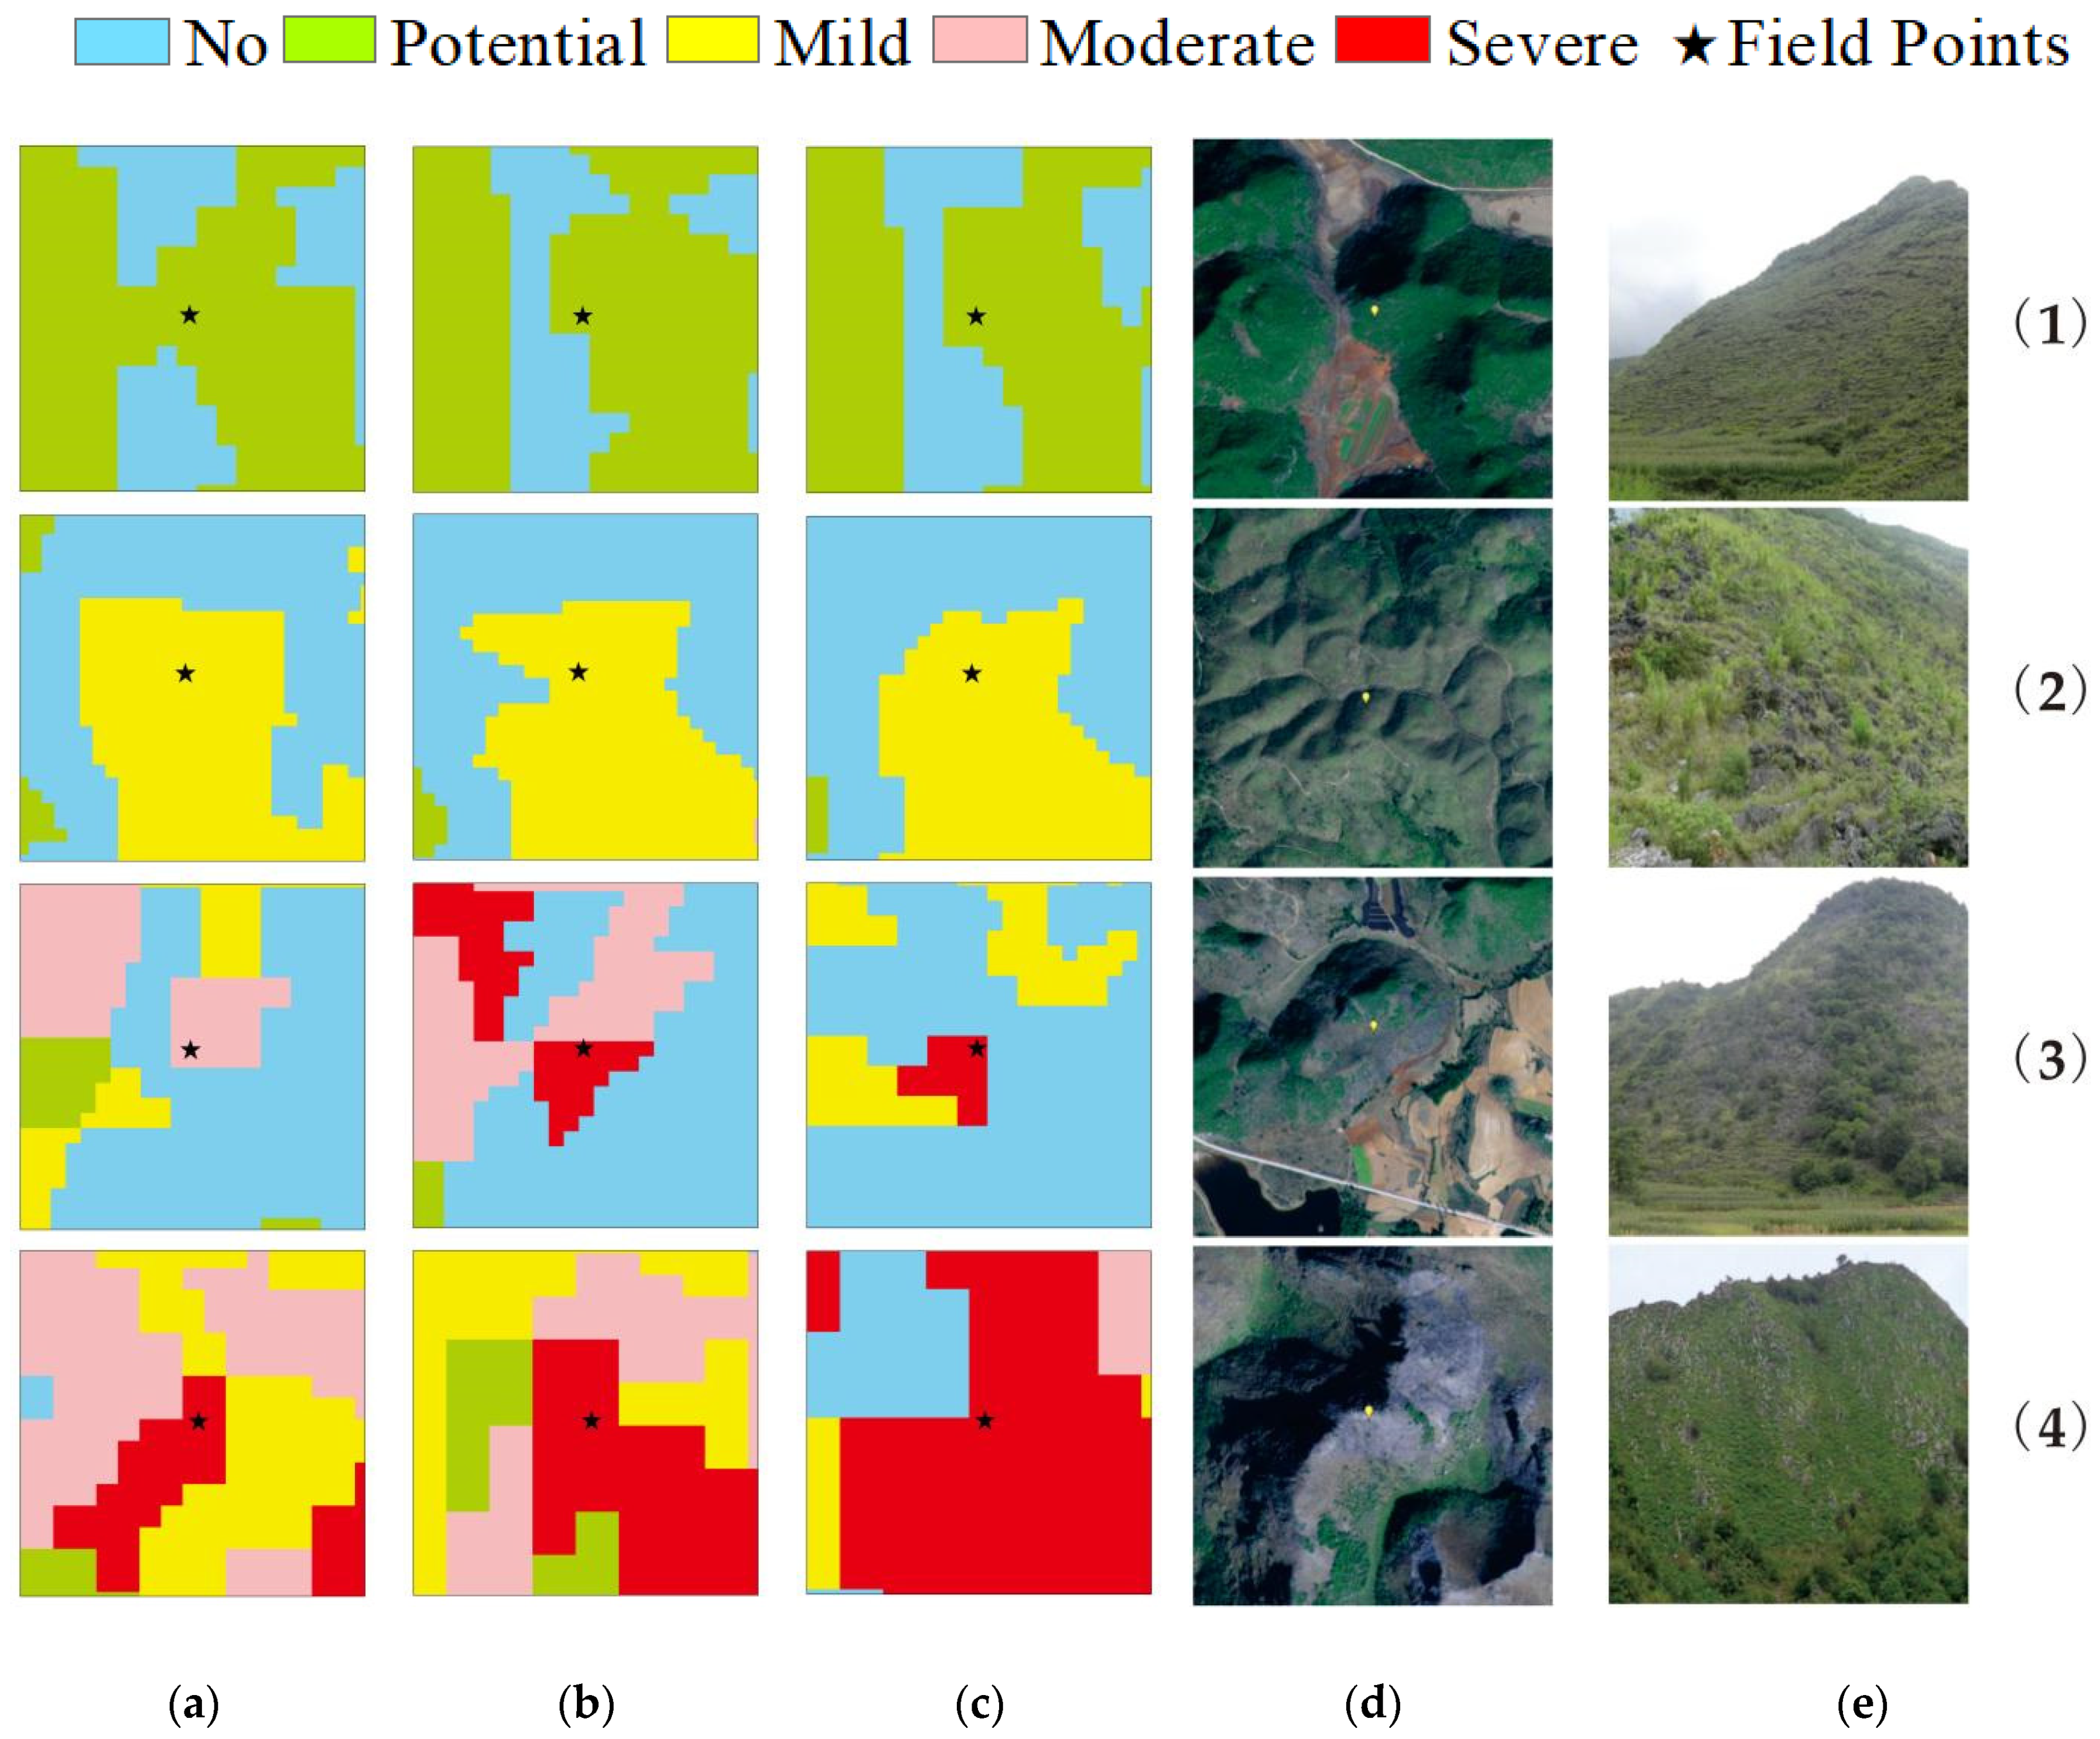
Using the photos from typical field locations, the actual situation of different levels of rocky desertification extracted from the three images of Sentinel-2B, Landsat-8, and Gaofen-6 were compared and analyzed (Figure 8). There are some subtle differences between the potential rocky desertification and mild rocky desertification extracted from the three images. The classification of moderate and severe rocky desertification and the surrounding areas is quite different. The results extracted from Sentinel-2B image are more detailed and can more accurately reflect the actual range of moderate and severe rocky desertification. The classification results of the other two images are relatively less accurate.
In general, the rocky desertification is mainly distributed in the karst areas in Guangnan County (Figure 1 and Figure 8). The severe and moderate rocky desertification levels are mainly distributed in the southern, mid-west, and mid-east regions. The mid-east parts are prone to rocky desertification mainly due to the natural conditions such as high mountains and steep slopes, while the southern and mid-west parts are prone to rocky desertification due to the long-term unreasonable human activities such as deforestation and overgrazing. On the whole, the distribution of rocky desertification extracted from the three images is consistent with the actual distribution of rocky desertification in the field survey in study area. In particular, the rocky desertification information extracted from Sentinel-2B images is more reliable than that from the other two images.
5. Discussion
5.1. Accuracy of Information Extraction from Three Types of Images
The rocky desertification extracted from Landsat-8 and Gaofen-6 are of similar accuracy. Zhu et al. evaluated the capability of rocky desertification identification of Gaofen-1 and Landsat-8 satellite images and reported that the separability of Landsat-8 image is slightly better than Gaofen-1 on rocky desertification classification [23]. The same satellites series, Gaofen-1 and Gaofen-6, have similar effective spectral bands for information extraction of rocky desertification. The results of Zhu et al. [23] are similar to our study, proving that Landsat-8 and Gaofen-6 images have similar separability of rocky desertification. The classification accuracy of rocky desertification is also consistent with the separability results. The Landsat-8 image is mainly limited by 30 m spatial resolution, and the Gaofen-6 image lacks the ideal calculation result of EBF due to the absence of SWIR1 band, which affected the accuracy of information extraction of rocky desertification [53,54,55]. The Sentinel-2B image has significant advantages in this regard. On the one hand, spatial resolution is important to determine the accuracy of ground object identification [56]. Especially, in the field investigation, we found that most of the exposed rocks in the karst region show characteristics of small area, dotted shapes on image, and dense distribution (Figure 1 and Figure 8). The situation has also been reported in a previous study [57]. Therefore, the high spatial resolution of satellite images may provide more accurate identification of the small areas of exposed rocks, as reflected in the classification capability of EBF (Figure 4 and Figure 5). On the other hand, as shown in Table 4, the “red-edge” band of Sentinel-2B image data is spectrally more continuous than that of Landsat-8 [23], which is the basis for the accurate calculation of FVC [25], indirectly leading to more accurate mapping of rocky desertification. Although the Gaofen-6 image also included the “red-edge” band, it has lower spatial resolution than the Sentinel 2B image and lacks the SWIR1 band where carbonate rocks usually have higher reflectance than in the blue band [58].
In the ERT classification model, EBF and FVC extracted from Sentinel-2B and Landsat-8, as well as FVC extracted from Gaofen-6, are of the highest importance. It shows that the surface information obtained by remotely sensed images plays the key role for the classification of rocky desertification [16,59]. With a good separability of the EBF and FVC of Sentinel-2B on rocky desertification, the other feature factors are less important. Since the separability of EBF and FVC extracted from Landsat-8 and Gaofen-6 is slightly poor, it would be necessary to add other factors to assist the extraction of rocky desertification information. On the whole, since the rocky desertification is a complex phenomenon caused by multiple factors [8,10], it is still not straightforward to extract rocky desertification information only by traditional remotely sensed indexes. When the terrain, soil, and lithology of the study area are integrated with remotely sensed factors, the information of rocky desertification might be extracted more accurately [21,31].
5.2. Applicability of ERT for Extracting Information of Rocky Desertification
The structure of the ERT algorithm is similar to that of RF and BDT and is composed in parallel of multiple DTs [26]. The major difference is that RF and BDT use the bagging algorithm for sampling, whereas ERT uses all the sample data for modeling [60]. In addition, the threshold of bifurcation in DT of ERT is randomly selected, so each tree’s final classification feature is completely random [38]. Therefore, the comprehensive results of multiple DTs increase the objectivity of classification, which can be better and more stable than the results from RF and BDT [39]. However, the ERT algorithm also puts forward higher requirements for samples. Only when samples and feature factors are accurately obtained can the results be superior to other classification models [36]. In this study, the classification accuracy of ERT on rocky desertification information is higher than 70% and is better than the results from the RF and BDT models. It should be noted that only two out of nine feature factors are remotely sensed factors. If more related feature factors are used, the classification accuracy could be further improved. This is also one of the areas we need to follow up in the future.
5.3. Study Limitations
We conducted comparative analyses regarding the capabilities of three types of open-access satellite images and three machine-learning algorithms for extracting rocky desertification information. Some limitations of the study are presented below.
First, the inherent landscape heterogeneity in each pixel of remotely sensed images usually leads to uncertainty in indexes such as EBF and FVC. In particular, the landscape features in karst rocky desertification regions are very fragmented [20]. The unreasonable land use in the last century caused more serious landscape heterogeneity in the study area [61], which reduces the classification accuracy of rocky desertification. To better address the mixed pixel problem, the combination of object-based method and ERT model might be able to reduce the uncertainty caused by landscape heterogeneity [61]. Second, because there are great differences in the karst terrains in the study area, and Guangnan County is located near the Tropic of Cancer, the sunrays are often unable to illuminate vertically, especially in the dry seasons. As a result, the images acquired in February and March used in this study have a certain solar oblique angle, which forms a backlit region (i.e., the shadowed region) on the Earth’s surface [21,62]. It affects the extraction result of rocky desertification and needs to be considered in the future [20]. Third, due to the constraints of topography and weather in the karst rocky desertification region, it is difficult to obtain a large number of field samples during investigation [63], which brings difficulties for classification assessment and accuracy control. Fourth, it is an experiment that used the ERT model to investigate the information extraction of ground objects. However, the classification accuracy for rocky desertification by the ERT model needs to be improved. Factors that play roles in extracting information have not been fully tapped and need further investigation.
6. Conclusions
Based on the comparative analyses of three open-access satellite image datasets (Sentinel-2B, Landsat-8, and Gaofen-6) and three machine-learning algorithms (random forest, bagged decision tree, and extremely randomized trees) implemented in the Python programming language for extracting information on rocky desertification in a typical karst region of southwest China, the following conclusions are drawn:
(1) The Sentinel-2B image has the best capability for extracting rocky desertification information in the three open-access satellite images of Sentinel-2B, Landsat-8, and Gaofen-6, and its OA in the ERT model reaches 85.21%. This can be attributed to the higher spatial resolution of the Sentinel-2B image than that of Landsat-8 and Gaofen-6 images, and Gaofen-6’s lack of the shortwave infrared (SWIR) bands suitable for mapping carbonate rocks.
(2) Among the three models of ERT, RF, and BDT, the ERT model has the best classification results of rocky desertification information. Compared with the RF and BDT models, the ERT model has stronger randomness in modeling and can effectively identify important feature factors for the extraction information on rocky desertification. Therefore, the results from ERT have less variance, better stability, and higher accuracy.
(3) The combination of the Sentinel-2B images and the ERT method provides an effective, efficient, and free approach to information extraction for mapping rocky desertification. The study can provide useful reference for effective mapping of rocky desertification in similar karst environments of the world, in terms of both satellite image sources and classification algorithms.
(4) The study provides important information on the total area and spatial distribution of different levels of rocky desertification in the study area. The total rocky desertification area in Guangnan County is 3469 km². The more serious rocky desertification levels such as severe and moderate levels are mainly distributed in the southern, mid-west, and mid-east parts of the county. These results can be used to support decision making by local governments for sustainable development.
Author Contributions
Conceptualization, J.P. and X.Z.; methodology, J.P. and Q.Y.; software, J.P.; validation, X.Z., P.D. and J.P.; formal analysis, J.P.; investigation, J.P. and Q.W.; resources, J.P. and X.Z.; data curation, P.D. and X.Z.; writing—original draft preparation, J.P., Q.W. and X.Z.; writing—review and editing, P.D., X.Z. and J.P.; visualization, J.P. and P.D.; supervision, X.Z. and P.D.; project administration, X.Z. and J.P.; funding acquisition, X.Z. and J.P. All authors have read and agreed to the published version of the manuscript.
Funding
The research was funded by [National Natural Science Foundation of China] grant number [42061052, 41361020, 40961031]; [Joint Fund of Yunnan Provincial Science and Technology Department and Yunnan University] grant number [2018FY001(-017)]; [Project of Innovative Talents Cultivation for Graduate Students of Yunnan University] grant number [C176230200]; [Science Research Fund of Yunnan Provincial Education Department in 2020: Postgraduate] grant number [2020Y0030].
Institutional Review Board Statement
Not applicable.
Informed Consent Statement
Not applicable.
Data Availability Statement
The image data of Sentinel-2B, Landsat-8, and Gaofen-6 satellites are downloaded from the official websites https://scihub.copernicus.eu/ (accessed on 20 March 2019), https://earthexplorer.usgs.gov/ (accessed on 22 March 2019) and http://www.cnsageo.com/#/ (accessed on 7 February 2019). The DEM data are downloaded from the website https://earthdata.nasa.gov/esds/competitive-programs/measures/nasadem (accessed on 27 March 2019). The rocky types data are downloaded from the website http://www.resdc.cn/ (accessed on 3 February 2019). The other data, such as land use database and soil data, are obtained from the local governments in the study area. The collocations are available from the corresponding author by request.
Conflicts of Interest
The authors declare no conflict of interest.
References
- Beynen, P.E. Karst Management; Springer: Dordrecht, The Netherlands, 2011. [Google Scholar]
- Zhang, M.; Wang, K.; Liu, H.; Zhang, C.; Yue, Y.; Qi, X. Effect of ecological engineering projects on ecosystem services in a karst region: A case study of northwest Guangxi, China. J. Clean. Prod. 2018, 183, 831–842. [Google Scholar] [CrossRef]
- Cheng, F.; Lu, H.; Ren, H.; Zhou, L.; Zhang, L.; Li, J.; Lu, X.; Huang, D.; Zhao, D. Integrated emergy and economic evaluation of three typical rocky desertification control modes in karst areas of Guizhou Province, China. J. Clean. Prod. 2017, 161, 1104–1128. [Google Scholar] [CrossRef]
- Pei, J.; Wang, L.; Huang, N.; Geng, J.; Cao, J.; Niu, Z. Analysis of Landsat-8 OLI Imagery for Estimating Exposed Bedrock Fractions in Typical Karst Regions of Southwest China Using a Karst Bare-Rock Index. Remote Sens. 2018, 10, 1321. [Google Scholar] [CrossRef] [Green Version]
- Peng, X.; Dai, Q.; Ding, G.; Shi, D.; Li, C. Impact of vegetation restoration on soil properties in near-surface fissures located in karst rocky desertification regions. Soil Tillage Res. 2020, 200, 104620. [Google Scholar] [CrossRef]
- Hu, Y.; Han, Y.; Zhang, Y. Information Extraction and Spatial Distribution of Research Hot Regions on Rocky Desertification in China. Appl. Sci. 2018, 8, 2075. [Google Scholar] [CrossRef] [Green Version]
- Sandhu, D.; Singh, A.; Wang, D. Can we infer the age of karst conduit from the profile of potentiometric surface? J. Hydrol. 2020, 584, 124679. [Google Scholar] [CrossRef]
- Yan, Y.; Dai, Q.; Hu, G.; Jiao, Q.; Mei, L.; Fu, W. Effects of vegetation type on the microbial characteristics of the fissure soil-plant systems in karst rocky desertification regions of SW China. Sci. Total Environ. 2020, 712, 136543. [Google Scholar] [CrossRef]
- Tang, J.; Tang, X.; Qin, Y.; He, Q.; Yi, Y.; Ji, Z. Karst rocky desertification progress: Soil calcium as a possible driving force. Sci. Total Environ. 2019, 649, 1250–1259. [Google Scholar] [CrossRef] [PubMed]
- Jiang, Z.; Lian, Y.; Qin, X. Rocky desertification in Southwest China: Impacts, causes, and restoration. Earth Sci. Rev. 2014, 132, 1–12. [Google Scholar] [CrossRef]
- Tong, X.; Wang, K.; Yue, Y.; Brandt, M.; Liu, B.; Zhang, C.; Liao, C.; Fensholt, R. Quantifying the effectiveness of ecological restoration projects on long-term vegetation dynamics in the karst regions of Southwest China. Int. J. Appl. Earth Obs. 2017, 54, 105–113. [Google Scholar] [CrossRef] [Green Version]
- Sathyendranath, S.; Platt, T.; Horne, E.P.W.; Harrison, W.G.; Ulloa, O.; Outerbridge, R.; Hoepffner, N. Estimation of new production in the ocean by compound remote sensing. Nature 1991, 353, 129–133. [Google Scholar] [CrossRef]
- Paul, C.K.; Mascarenhas, A.C. Remote Sensing in Development. Science 1981, 214, 139–145. [Google Scholar] [CrossRef]
- Li, J.; Pei, Y.; Zhao, S.; Xiao, R.; Sang, X.; Zhang, C. A Review of Remote Sensing for Environmental Monitoring in China. Remote Sens. 2020, 12, 1130. [Google Scholar] [CrossRef] [Green Version]
- Ajaj, Q.M.; Pradhan, B.; Noori, A.M.; Jebur, M.N. Spatial Monitoring of Desertification Extent in Western Iraq using Landsat Images and GIS. Land Degrad. Dev. 2017, 28, 2418–2431. [Google Scholar] [CrossRef]
- Wulder, M.A.; White, J.C.; Loveland, T.R.; Woodcock, C.E.; Belward, A.S.; Cohen, W.B.; Fosnight, E.A.; Shaw, J.; Masek, J.G.; Roy, D.P. The global Landsat archive: Status, consolidation, and direction. Remote Sens. Environ. 2016, 185, 271–283. [Google Scholar] [CrossRef] [Green Version]
- Li, S.; Wu, H. Mapping karst rocky desertification using Landsat 8 images. Remote Sens. Lett. 2015, 6, 657–666. [Google Scholar] [CrossRef]
- Wang, H.; Li, Q.; Du, X.; Zhao, L. Quantitative extraction of the bedrock exposure rate based on unmanned aerial vehicle data and Landsat-8 OLI image in a karst environment. Front. Earth Sci. 2017, 12, 481–490. [Google Scholar] [CrossRef]
- Chen, L.; Lin, H.; Sun, H. Studies on space and time evolution of karst rocky desertifi cation area in Lengshuijiang city based on SPOT-5 images. J. Cen. South Uni. Tech. 2012, 32, 22–27. (In Chinese) [Google Scholar] [CrossRef]
- Qi, X.; Zhang, C.; Wang, K. Comparing Remote Sensing Methods for Monitoring Karst Rocky Desertification at Sub-pixel Scales in a Highly Heterogeneous Karst Region. Sci. Rep. 2019, 9, 1–12. [Google Scholar] [CrossRef] [PubMed] [Green Version]
- Yue, Y.; Wang, K.; Liu, B.; Li, R.; Zhang, B.; Chen, H.; Zhang, M. Development of new remote sensing methods for mapping green vegetation and exposed bedrock fractions within heterogeneous landscapes. Int. J. Remote Sens. 2013, 34, 5136–5153. [Google Scholar] [CrossRef]
- Birk, R.J.; Stanley, T.; Snyder, G.I.; Hennig, T.A.; Fladeland, M.M.; Policelli, F. Government programs for research and operational uses of commercial remote sensing data. Remote Sens. Environ. 2003, 88, 3–16. [Google Scholar] [CrossRef]
- Zhu, D.Y.; Xiong, K.N.; Xiao, H.; Lan, J.C. Comparison of Rocky Desertification Detection Ability of GF-1 and Landsat-OLI Based on Vegetation Index. J. Nat. Res. 2016, 31, 1949–1957. (In Chinese) [Google Scholar] [CrossRef]
- Drusch, M.; Del Bello, U.; Carlier, S.; Colin, O.; Fernandez, V.; Gascon, F.; Hoersch, B.; Isola, C.; Laberinti, P.; Martimort, P.; et al. Sentinel-2: ESA’s Optical High-Resolution Mission for GMES Operational Services. Remote Sens. Environ. 2012, 120, 25–36. [Google Scholar] [CrossRef]
- Meyer, L.H.; Heurich, M.; Beudert, B.; Premier, J.; Pflugmacher, D. Comparison of Landsat-8 and Sentinel-2 Data for Estimation of Leaf Area Index in Temperate Forests. Remote Sens. 2019, 11, 1160. [Google Scholar] [CrossRef] [Green Version]
- Akbari, E.; Boloorani, A.D.; Samany, N.N.; Hamzeh, S.; Soufizadeh, S.; Pignatti, S. Crop Mapping Using Random Forest and Particle Swarm Optimization based on Multi-Temporal Sentinel-2. Remote Sens. 2020, 12, 1449. [Google Scholar] [CrossRef]
- Kpienbaareh, D.; Kansanga, M.; Luginaah, I. Examining the potential of open source remote sensing for building effective decision support systems for precision agriculture in resource-poor settings. GeoJournal 2018, 84, 1481–1497. [Google Scholar] [CrossRef]
- Turner, W.; Rondinini, C.; Pettorelli, N.; Mora, B.; Leidner, A.; Szantoi, Z.; Buchanan, G.; Dech, S.; Dwyer, J.; Herold, M.; et al. Free and open-access satellite data are key to biodiversity conservation. Biol. Conserv. 2015, 182, 173–176. [Google Scholar] [CrossRef] [Green Version]
- Yao, M.; Zhou, G.; Wang, W.; Wu, Z.; Huang, Y.; Huang, X. Study on karst information identification of qiandongnan prefecture based on RS and GIS technology. Remote Sens. Spat. Inf. Sci. 2018, XLII-3, 2121–2125. [Google Scholar] [CrossRef] [Green Version]
- Xia, G.-S.; Wang, Z.; Xiong, C.; Zhang, L. Accurate Annotation of Remote Sensing Images via Active Spectral Clustering with Little Expert Knowledge. Remote Sens. 2015, 7, 15014–15045. [Google Scholar] [CrossRef] [Green Version]
- Su, C.J.; Yue, T.; Jiang, L.; Li, X.M.; Wang, W.G. Karst rocky desertification information extraction based on the decision tree. Remote Sens. Spat. Inf. Sci. 2020, XLII-3/W10, 367–373. [Google Scholar] [CrossRef] [Green Version]
- Liu, K.; Shi, W.; Zhang, H. A fuzzy topology-based maximum likelihood classification. ISPRS J. Photogramm. Remote Sens. 2011, 66, 103–114. [Google Scholar] [CrossRef]
- Zhou, G.; Wang, L. Co-location decision tree for enhancing decision-making of pavement maintenance and rehabilitation. Transp. Res. Part C Emerg. Technol. 2012, 21, 287–305. [Google Scholar] [CrossRef] [Green Version]
- Huang, P.; Peng, L.; Pan, H. Linking the Random Forests Model and GIS to Assess Geo-Hazards Risk: A Case Study in Shifang County, China. IEEE Access 2020, 8, 28033–28042. [Google Scholar] [CrossRef]
- Ellenson, A.; Pei, Y.; Wilson, G.; Özkan-Haller, H.T.; Fern, X. An application of a machine learning algorithm to determine and describe error patterns within wave model output. Coast. Eng. 2020, 157, 103595. [Google Scholar] [CrossRef]
- Julian, D. Designing Machine Learning Systems with Python; Packt: Birmingham, UK, 2016. [Google Scholar]
- Xu, Y.; Zhao, X.; Chen, Y.; Yang, Z. Research on a Mixed Gas Classification Algorithm Based on Extreme Random Tree. Appl. Sci. 2019, 9, 1728. [Google Scholar] [CrossRef] [Green Version]
- Geurts, P.; Ernst, D.; Wehenkel, L. Extremely randomized trees. Mach. Learn. 2006, 63, 3–42. [Google Scholar] [CrossRef] [Green Version]
- Shang, K.; Yao, Y.; Li, Y.; Yang, J.; Jia, K.; Zhang, X.; Chen, X.; Bei, X.; Guo, X. Fusion of Five Satellite-Derived Products Using Extremely Randomized Trees to Estimate Terrestrial Latent Heat Flux over Europe. Remote Sens. 2020, 12, 687. [Google Scholar] [CrossRef] [Green Version]
- Rahmati, O.; Mohammadi, F.; Ghiasi, S.S.; Tiefenbacher, J.; Moghaddam, D.D.; Coulon, F.; Nalivan, O.A.; Bui, D.T. Identifying sources of dust aerosol using a new framework based on remote sensing and modelling. Sci. Total Environ. 2020, 737, 139508. [Google Scholar] [CrossRef] [PubMed]
- Ebrahimy, H.; Feizizadeh, B.; Salmani, S.; Azadi, H. A comparative study of land subsidence susceptibility mapping of Tasuj plane, Iran, using boosted regression tree, random forest and classification and regression tree methods. Environ. Earth Sci. 2020, 79, 1–12. [Google Scholar] [CrossRef]
- Paul, A.; Furmanchuk, A.; Liao, W.; Choudhary, A.; Agrawal, A. Property Prediction of Organic Donor Molecules for Photovoltaic Applications Using Extremely Randomized Trees. Mol. Inf. 2019, 38, e1900038. [Google Scholar] [CrossRef] [PubMed]
- Wei, J.; Li, Z.; Cribb, M.; Huang, W.; Xue, W.; Sun, L.; Guo, J.; Peng, Y.; Li, J.; Lyapustin, A.; et al. Improved 1 km resolution PM2.5 estimates across China using enhanced space–time extremely randomized trees. Atm. Chem. Phys. Discuss. 2020, 20, 3273–3289. [Google Scholar] [CrossRef] [Green Version]
- Wang, S.-J.; Liu, Q.-M.; Zhang, D.-F. Karst rocky desertification in southwestern China: Geomorphology, landuse, impact and rehabilitation. Land Degrad. Dev. 2004, 15, 115–121. [Google Scholar] [CrossRef]
- Sweeting, M.M. Karst in China: Its Geomorphology and Environment; Springer: Berlin/Heidelberg, Germany, 1995. [Google Scholar]
- Yue, Y.; Wang, K.; Zhang, B.; Jiao, Q.; Liu, B.; Zhang, M. Remote sensing of fractional cover of vegetation and exposed bedrock for karst rocky desertification assessment. Procedia Environ. Sci. 2012, 13, 847–853. [Google Scholar] [CrossRef] [Green Version]
- Pu, J.-W.; Zhao, X.-Q.; Miao, P.-P.; Li, S.-N.; Tan, K.; Wang, Q.; Tang, W. Integrating multisource RS data and GIS techniques to assist the evaluation of resource-environment carrying capacity in karst mountainous area. J. Mt. Sci. 2020, 17, 2528–2547. [Google Scholar] [CrossRef]
- Gan, S.; Yuan, X.P.; Sun, G.; Zhang, X.L.; Li, Y. Karst Rocky Desertification Remote Sensing Monitoring by Integrating Land Use Diagnoses in Southeast of Yunnan Province. Appl. Mech. Mater. 2013, 444–445, 869–873. [Google Scholar] [CrossRef]
- Zhang, Z.; Xu, W.; Zhou, W.; Zhang, L.; Xiao, Y.; Ou, X.; Ouyang, Z. Integrating remote sensing with GIS-based multi-criteria evaluation approach for Karst rocky desertification assessment in Southwest of China. IOP Conf. Ser. Earth Environ. Sci. 2014, 18, 012038. [Google Scholar] [CrossRef] [Green Version]
- Xie, X.; Du, P.; Xia, J.; Luo, J. Spectral Indices for Estimating Exposed Carbonate Rock Fraction in Karst Areas of Southwest China. IEEE Geosci. Remote Sens. Lett. 2015, 12, 1988–1992. [Google Scholar] [CrossRef]
- Zhong, S.; Li, Y.; Wu, C.; Lu, W.; Yang, X. TM and ETM Image Based Monitoring on Rocky Desertification in Region of the Return Farmland Pasture or Forest in Tiandong County Guangxi Province, China. Sens. Lett. 2012, 10, 301–308. [Google Scholar] [CrossRef]
- Abdi, A.M. Land cover and land use classification performance of machine learning algorithms in a boreal landscape using Sentinel-2 data. GIScience Remote Sens. 2020, 57, 1–20. [Google Scholar] [CrossRef] [Green Version]
- Wang, D.; Wan, B.; Qiu, P.; Su, Y.; Guo, Q.; Wang, R.; Sun, F.; Wu, X. Evaluating the Performance of Sentinel-2, Landsat 8 and Pléiades-1 in Mapping Mangrove Extent and Species. Remote Sens. 2018, 10, 1468. [Google Scholar] [CrossRef] [Green Version]
- Mancino, G.; Ferrara, A.; Padula, A.; Nolè, A. Cross-Comparison between Landsat 8 (OLI) and Landsat 7 (ETM+) Derived Vegetation Indices in a Mediterranean Environment. Remote Sens. 2020, 12, 291. [Google Scholar] [CrossRef] [Green Version]
- Yang, A.; Zhong, B.; Hu, L.; Wu, S.; Xu, Z.; Wu, H.; Wu, J.; Gong, X.; Wang, H.; Liu, Q. Radiometric Cross-Calibration of the Wide Field View Camera Onboard GaoFen-6 in Multispectral Bands. Remote Sens. 2020, 12, 1037. [Google Scholar] [CrossRef] [Green Version]
- Mondal, P.; McDermid, S.S.; Qadir, A. A reporting framework for Sustainable Development Goal 15: Multi-scale monitoring of forest degradation using MODIS, Landsat and Sentinel data. Remote Sens. Environ. 2020, 237, 111592. [Google Scholar] [CrossRef]
- Zhang, M.; Wang, K.; Liu, H.; Zhang, C.; Wang, J.; Yue, Y.; Qi, X. How ecological restoration alters ecosystem services: An analysis of vegetation carbon sequestration in the karst area of northwest Guangxi, China. Environ. Earth Sci. 2015, 74, 5307–5317. [Google Scholar] [CrossRef]
- Imanian, A.; Tangestani, M.H.; Asadi, A. Investigation of spectral characteristics of carbonate rocks—a case study on Posht Moleh Mountain in Iran. Remote Sens. Spat. Inf. Sci. 2019, XLII-4/W18, 553–557. [Google Scholar] [CrossRef] [Green Version]
- Gorelick, N.; Hancher, M.; Dixon, M.; Ilyushchenko, S.; Thau, D.; Moore, R. Google Earth Engine: Planetary-scale geospatial analysis for everyone. Remote Sens. Environ. 2017, 202, 18–27. [Google Scholar] [CrossRef]
- Gupta, S.; Arango-Argoty, G.; Zhang, L.; Pruden, A.; Vikesland, P. Identification of discriminatory antibiotic resistance genes among environmental resistomes using extremely randomized tree algorithm. Microbiome 2019, 7, 1–15. [Google Scholar] [CrossRef] [PubMed]
- Hou, W.; Gao, J.; Wu, S.; Dai, E. Interannual Variations in Growing-Season NDVI and Its Correlation with Climate Variables in the Southwestern Karst Region of China. Remote Sens. 2015, 7, 11105–11124. [Google Scholar] [CrossRef] [Green Version]
- Xu, E.; Zhang, H.; Li, M. Object-Based Mapping of Karst Rocky Desertification using a Support Vector Machine. Land Degrad. Dev. 2012, 26, 158–167. [Google Scholar] [CrossRef]
- Lu, D.; Weng, Q. A survey of image classification methods and techniques for improving classification performance. Int. J. Remote Sens. 2007, 28, 823–870. [Google Scholar] [CrossRef]
Figure 1.
Location of study area and sample pictures: most of the exposed rocks in the karst region show characteristics of small area, dotted shapes on image, and dense distribution.
Figure 1.
Location of study area and sample pictures: most of the exposed rocks in the karst region show characteristics of small area, dotted shapes on image, and dense distribution.
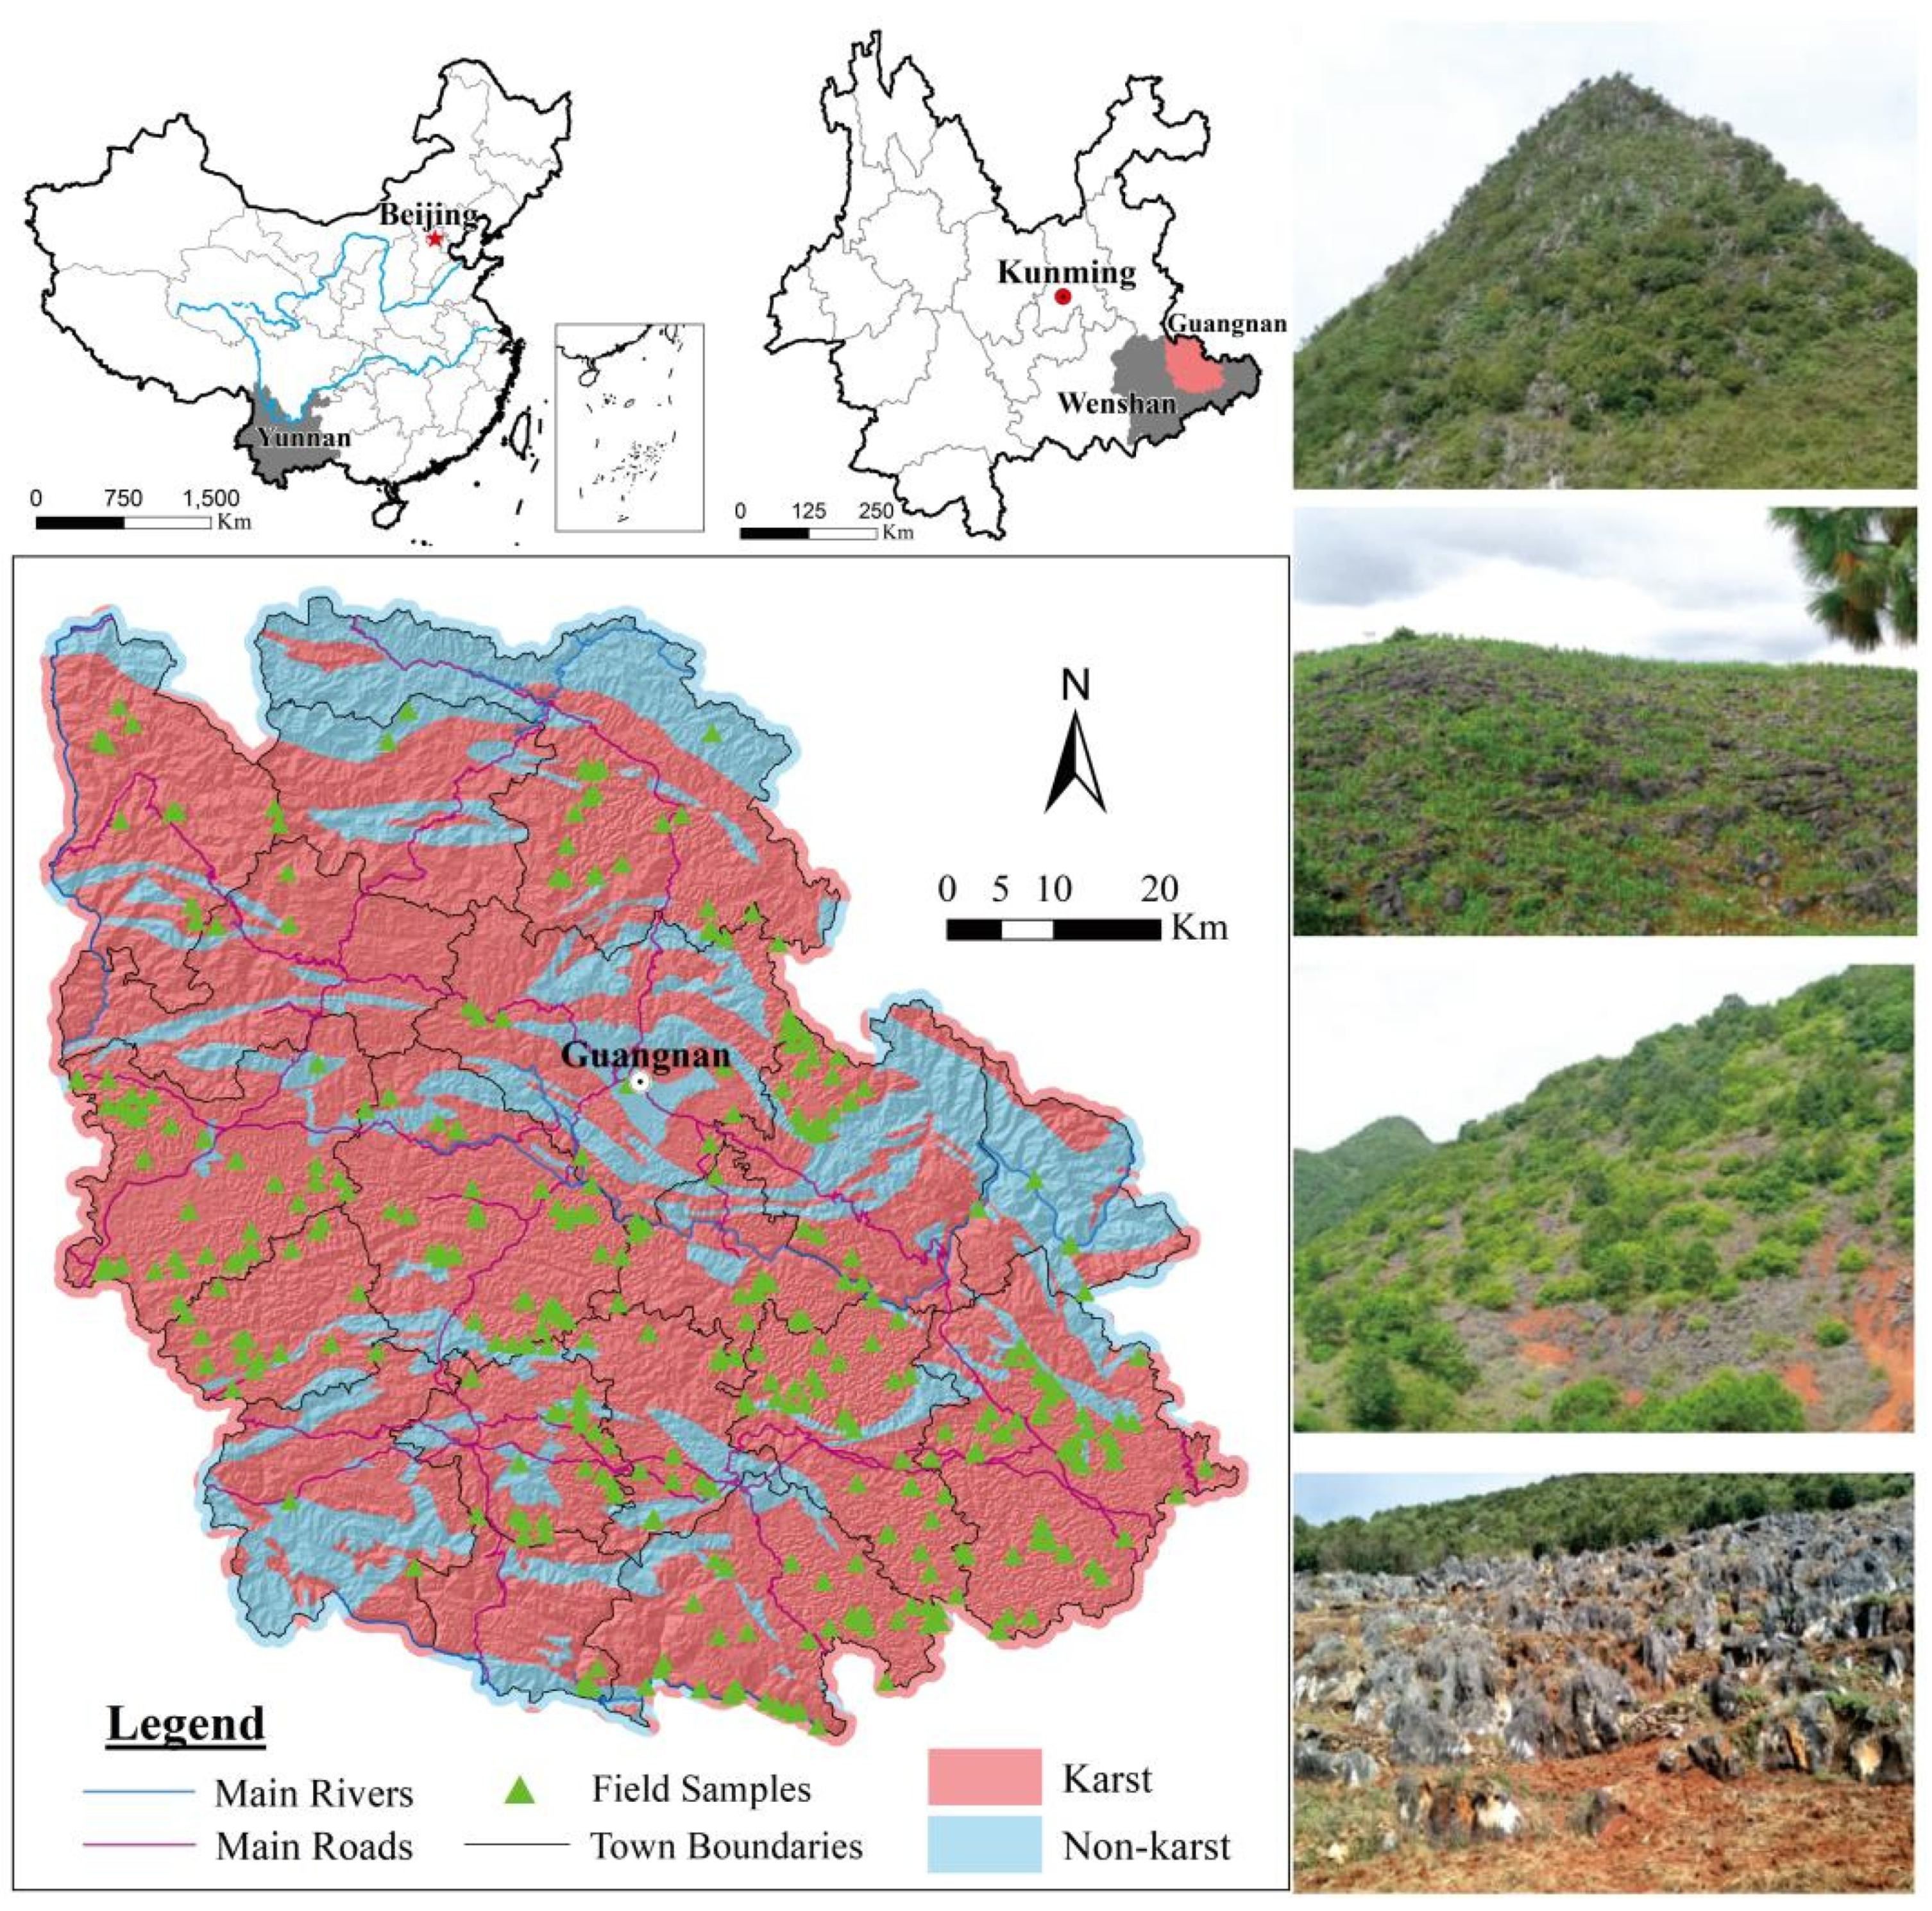
Figure 2.
Methodology flowchart of the comparative study.

Figure 3.
FVC and EBF information extracted from three image data (“S”, “L”, and “G” represent the remotely sensed indexes extracted from Sentinel-2B, Landsat-8, and Gaofen-6, respectively. For example, the “EBF_S” represents the EBF result generated by the Sentinel-2B image.).
Figure 3.
FVC and EBF information extracted from three image data (“S”, “L”, and “G” represent the remotely sensed indexes extracted from Sentinel-2B, Landsat-8, and Gaofen-6, respectively. For example, the “EBF_S” represents the EBF result generated by the Sentinel-2B image.).

Figure 4.
Euclidean distance accumulation histogram of five indices for classification of rocky desertification (“S”, “L”, and “G” represent three types of images of Sentinel-2B, Landsat-8, and Gaofen-6; 0, 1, 2, 3, and 4 represent no rocky desertification, potential level, mild level, moderate level, and severe level, respectively. For example, “3–4” is the Euclidean distance between moderate and severe rocky desertification.).
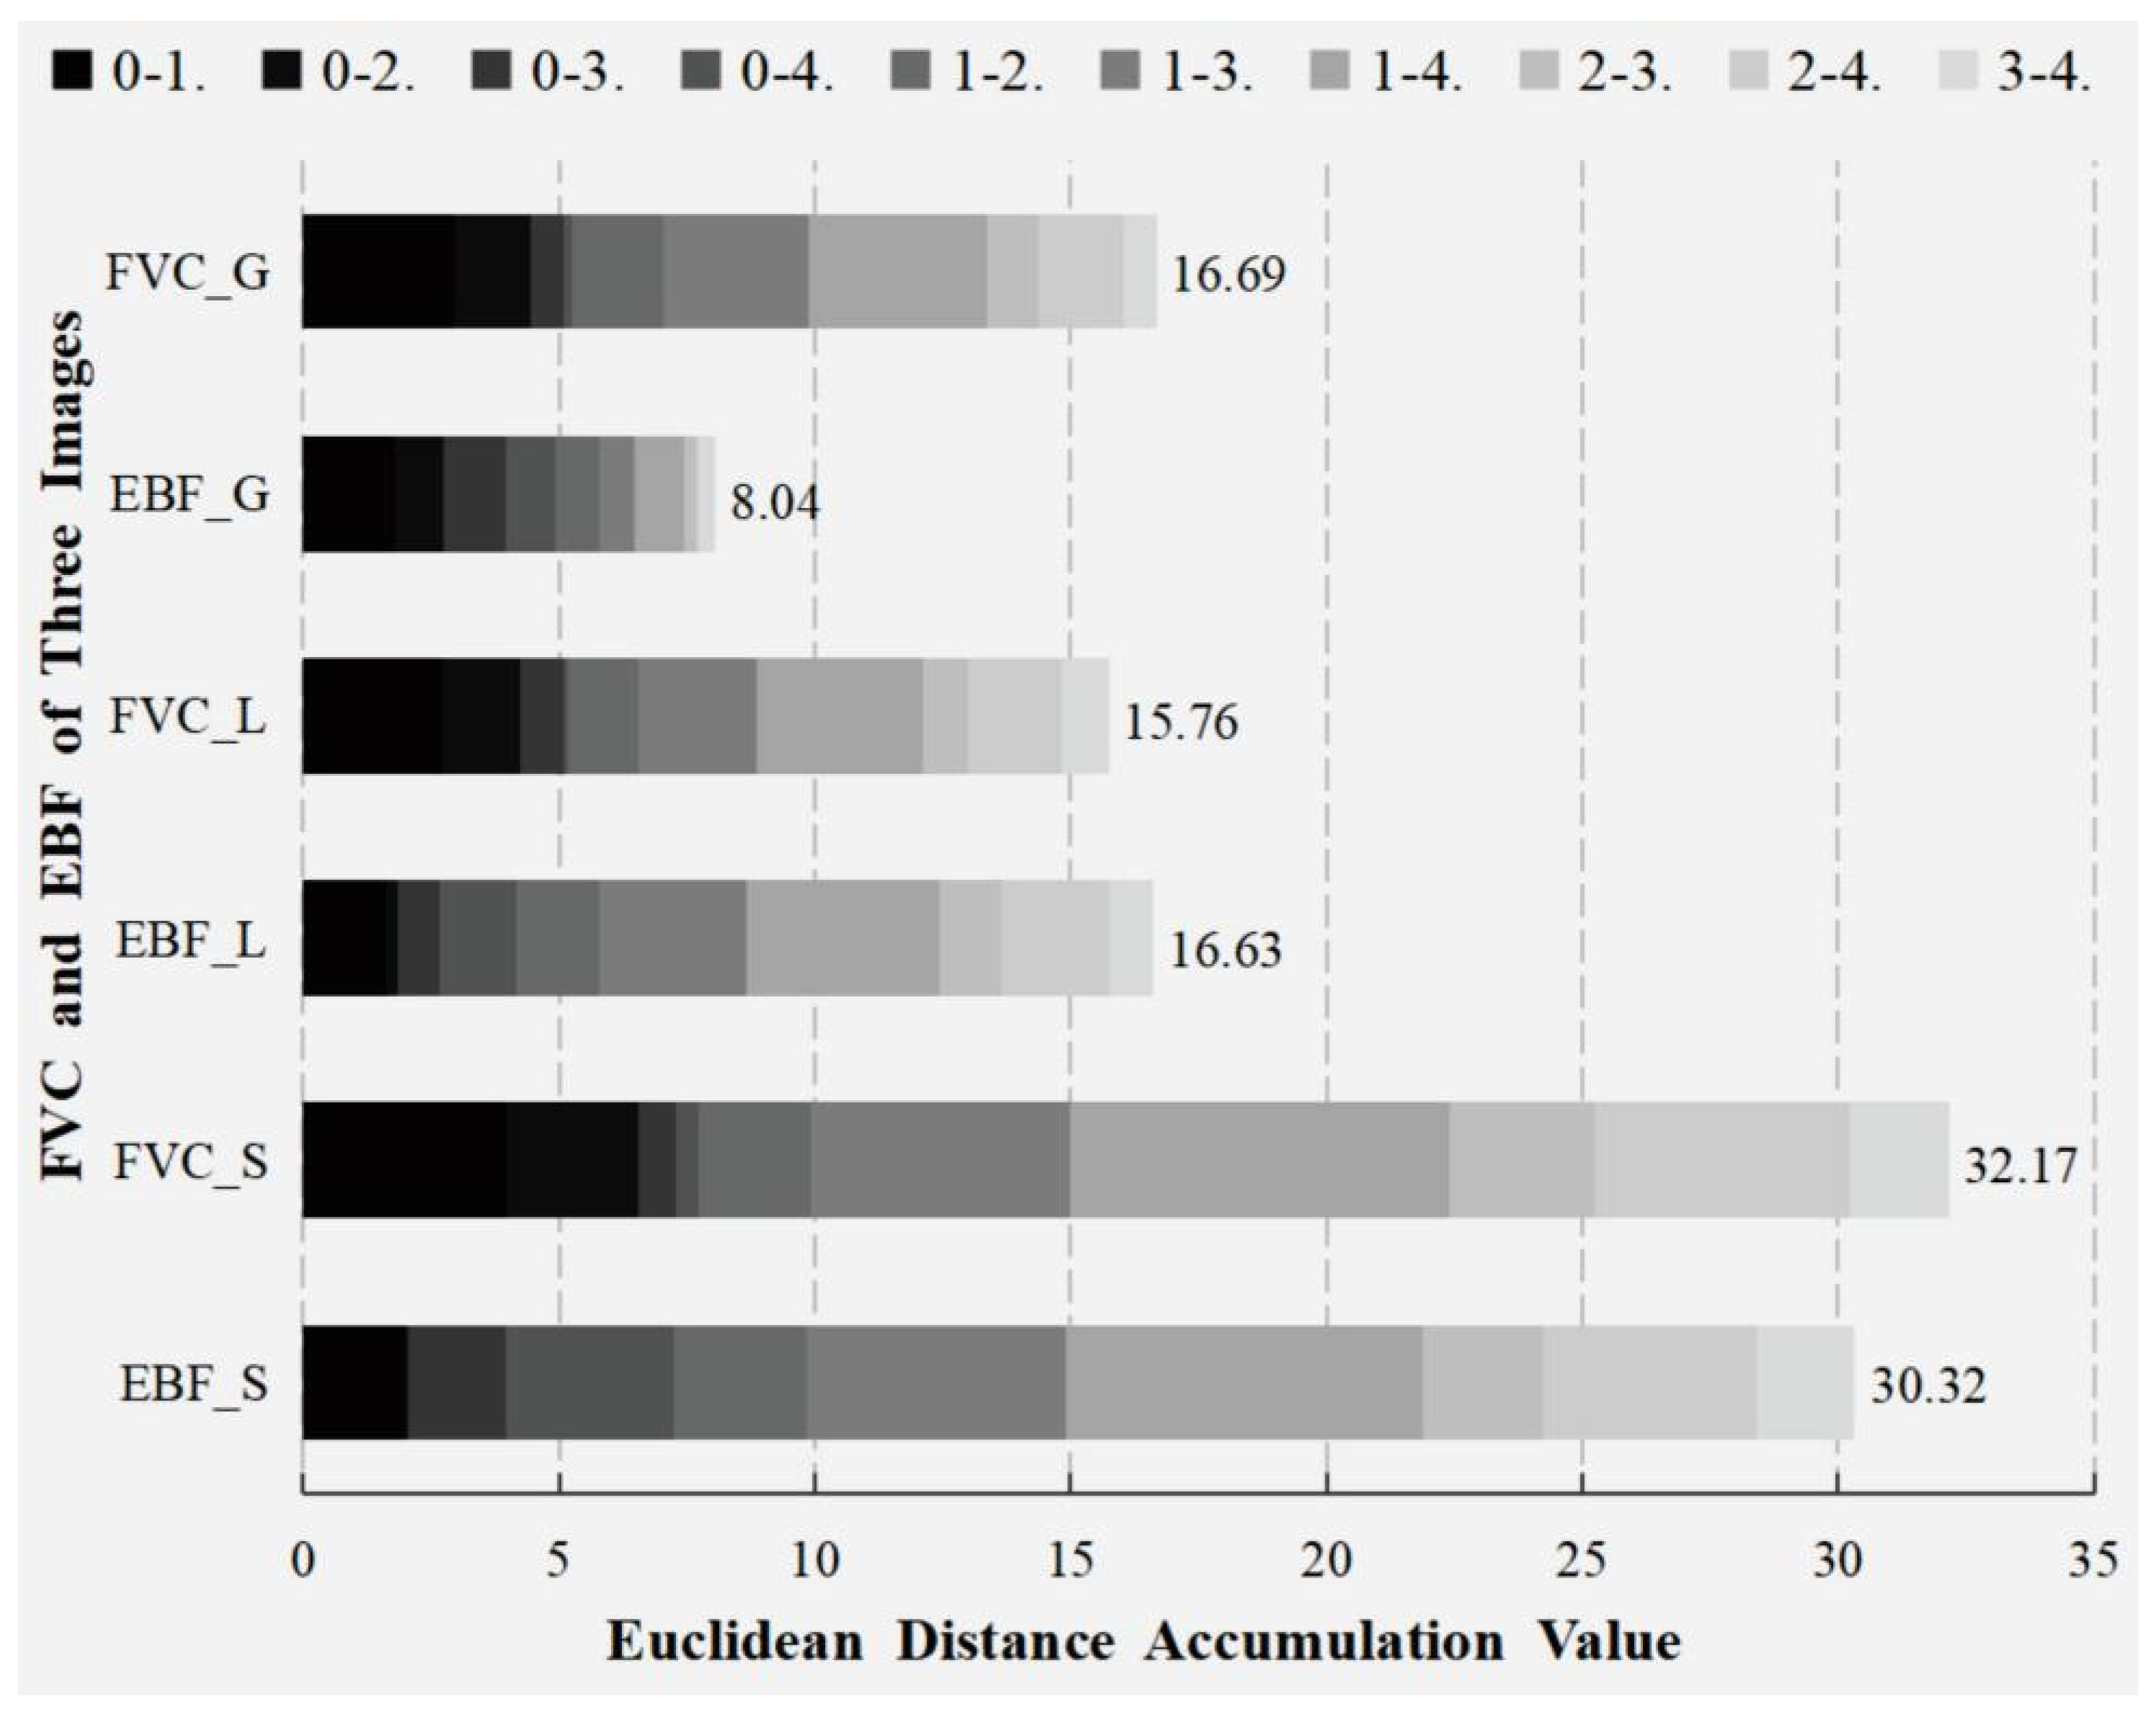
Figure 5.
The importance of factor and its relationship with classification accuracy (“S”, “L”, and “G” represent three types of images of Sentinel-2B, Landsat-8, and Gaofen-6. Since the BDT model cannot determine the importance of factors, it adds feature factors in turn according to the addition order of the ERT model).

Figure 6.
Producer’s accuracy (PA) and user’s accuracy (UA) for extraction results of different levels of rocky desertification (“S”, “L”, and “G” represent three types of images of Sentinel-2B, Landsat-8, and Gaofen-6.).
Figure 6.
Producer’s accuracy (PA) and user’s accuracy (UA) for extraction results of different levels of rocky desertification (“S”, “L”, and “G” represent three types of images of Sentinel-2B, Landsat-8, and Gaofen-6.).

Figure 7.
Extraction results of rocky desertification: (a) rocky desertification results extracted from Sentinel-2B images; (b) rocky desertification results extracted from Landsat-8 images; (c) rocky desertification results extracted from Gaofen-6 images; (d) the legend and the area of different levels of rocky desertification extracted from three types of images.

Figure 8.
Comparison of classification results of rocky desertification in field sampling sites: (a) rocky desertification results extracted from Sentinel-2B images; (b) rocky desertification results extracted from Landsat-8 images; (c) rocky desertification results extracted from Gaofen-6 images; (d) Google Earth images; (e) field photographs: (1) potential rocky desertification; (2) mild rocky desertification; (3) moderate rocky desertification; (4) severe rocky desertification.


Table 1.
Data sources and descriptions.
| No. | Name | Type | Sources | Descriptions |
|---|---|---|---|---|
| 1 | Sentinel-2B Satellite Image Data | Raster data | https://scihub.copernicus.eu/, accessed on 20 March 2019 | After pre-processing, these images were used for information extraction of rocky desertification. All images were taken during the dry season and have a cloud cover of less than 1% in study area. |
| 2 | Landsat-8 Satellite Image Data | https://earthexplorer.usgs.gov/, accessed on 22 March 2019 | ||
| 3 | Gaofen-6 Satellite Image Data | http://www.cnsageo.com/#/, accessed on 7 February 2019 | ||
| 4 | NASA DEM | https://earthdata.nasa.gov/esds/competitive-programs/measures/nasadem, accessed on 27 March 2019 | The digital elevation model (DEM) data have a spatial resolution of 12.5m and were used for extracting topographic factors, such as elevation, slope, and aspect of the study area. | |
| 5 | Rock types | Vector data | http://www.resdc.cn/, accessed on 3 February 2019 | Rock types of Guangnan County were used as one of the factors in information extraction of rocky desertification. |
| 6 | Land use database in 2019 of Guangnan County | Bureau of Nature Resources of Guangnan County | Land use data in the study area and the administrative boundary. | |
| 7 | Soil data of Guangnan County | Bureau of Agricultural Technology of Guangnan County | The data were used to extract types and thickness of soil as factors assessing the status of rocky desertification. |
Table 2.
Major parameters of three open-access satellite images.
| Data Type | Optical Instrument | Bands | Radiometric Resolution | Spatial Resolution | Temporal Resolution | Time Range |
|---|---|---|---|---|---|---|
| Sentinel-2 | Multispectral Instrument (MSI) | Band 1 (Coastal Aerosol) Band 2 (Blue) Band 3 (Green) Band 4 (Red) Band 5 (Red Edge 1) Band 6 (Red Edge 2) Band 7 (Red Edge 3) Band 8 (NIR) Band 8a (Narrow NIR) Band 9 (Water Vapour) Band 10 (SWIR) Band 11 (SWIR 1) Band 12 (SWIR 2) | 430–457 nm 440–538 nm 537–582 nm 646–684 nm 694–713 nm 713–749 nm 769–797 nm 760–908 nm 848–881 nm 932–958 nm 1337–1412 nm 1539–1682 nm 2017–2320 nm | 60 m 10 m 10 m 10 m 20 m 20 m 20 m 10 m 20 m 60 m 60 m 20 m 20 m | 10 days with one satellite, 5 days with two satellites | From January 2015 (Sentinel-2A) From March 2017 (Sentinel-2B) |
| Landsat-8 | Operational Land Imager (OLI) | Band 1 (Coastal) Band 2 (Blue) Band 3 (Green) Band 4 (Red) Band 5 (NIR) Band 6 (SWIR 1) Band 7 (SWIR 2) Band 9 (Cirrus) | 433–453 nm 450–515 nm 525–600 nm 630–680 nm 845–885 nm 1560–1660 nm 2100–2300 nm 1360–1390 nm | 30 m | 16 days | From February 2013 |
| Gaofen-6 | Wide Field of View Multispectral Imager (WFV) | Band 1 (Blue) Band 2 (Green) Band 3 (Red) Band 4 (NIR) Band 5 (Red Edge 1) Band 6 (Red Edge 2) Band 7 (Coast Blue) Band 8 (Yellow) | 450–528 nm 520–600 nm 633–691 nm 774–892 nm 685–723 nm 731–773 nm 405–456 nm 591–631 nm | 16 m | 4 days | From June 2018 |
Table 3.
Samples and descriptions of rocky desertification levels.
| Rocky Desertification Levels | Training Samples | Validation Samples | Total Samples | Descriptions [20,31,51] |
|---|---|---|---|---|
| No Rocky Desertification | 447 | 191 | 638 | There is no rocky desertification. |
| Potential Level | 169 | 72 | 241 | The proportion of exposed rock is less than 30%. |
| Mild Level | 319 | 136 | 455 | The proportion of exposed rock is between 30% and 50%. |
| Moderate Level | 377 | 161 | 538 | The proportion of exposed rock is between 50% and 70%. |
| Severe Level | 395 | 169 | 564 | The proportion of exposed rock is more than 70%. |
| Total | 1707 | 729 | 2436 | / |
Table 4.
Comparison of important bands on information extraction of rocky desertification.
| Satellites | Blue Band | Red Band | NIR Band | SWIR1 Band |
|---|---|---|---|---|
| Sentinel-2B | √ Band range: 440–538 nm | √ Band range: 646–684 nm | √ Band range: 760–908 nm | √ Band range: 1539–1682 nm |
| Landsat-8 | √ Band range: 450–515 nm | √ Band range: 630–680 nm | √ Band range: 845–885 nm | √ Band range: 1560–1660 nm |
| Gaofen-6 | √ Band range: 450–528 nm | √ Band range: 633–691 nm | √ Band range: 774–892 nm | × |
| Similarities and differences | The band range is not very different. | The band range is not very different. | The band range of Landsat-8 is relatively narrow, ignoring the “red-edge” band of 760 –690 nm, which is an important range for vegetation detection. The other two satellites have “red-edge” bands, with similar wavelength ranges. | There is not much difference between Sentinel-2B and Landsat-8, while the Gaofen-6 is missing this band. |
Note: “√” means that the spectral band is carried in the satellite; “×” means that the band is not carried.
Publisher’s Note: MDPI stays neutral with regard to jurisdictional claims in published maps and institutional affiliations. |
© 2021 by the authors. Licensee MDPI, Basel, Switzerland. This article is an open access article distributed under the terms and conditions of the Creative Commons Attribution (CC BY) license (https://creativecommons.org/licenses/by/4.0/).
Share and Cite
MDPI and ACS Style
Pu, J.; Zhao, X.; Dong, P.; Wang, Q.; Yue, Q. Extracting Information on Rocky Desertification from Satellite Images: A Comparative Study. Remote Sens. 2021, 13, 2497. https://0-doi-org.brum.beds.ac.uk/10.3390/rs13132497
AMA Style
Pu J, Zhao X, Dong P, Wang Q, Yue Q. Extracting Information on Rocky Desertification from Satellite Images: A Comparative Study. Remote Sensing. 2021; 13(13):2497. https://0-doi-org.brum.beds.ac.uk/10.3390/rs13132497
Chicago/Turabian StylePu, Junwei, Xiaoqing Zhao, Pinliang Dong, Qian Wang, and Qifa Yue. 2021. "Extracting Information on Rocky Desertification from Satellite Images: A Comparative Study" Remote Sensing 13, no. 13: 2497. https://0-doi-org.brum.beds.ac.uk/10.3390/rs13132497
Note that from the first issue of 2016, this journal uses article numbers instead of page numbers. See further details here.