
Assessment of Drought Impact on Net Primary Productivity in the Terrestrial Ecosystems of Mongolia from 2003 to 2018

 ,
,  , and
, and
Abstract
:1. Introduction
2. Data and Methods
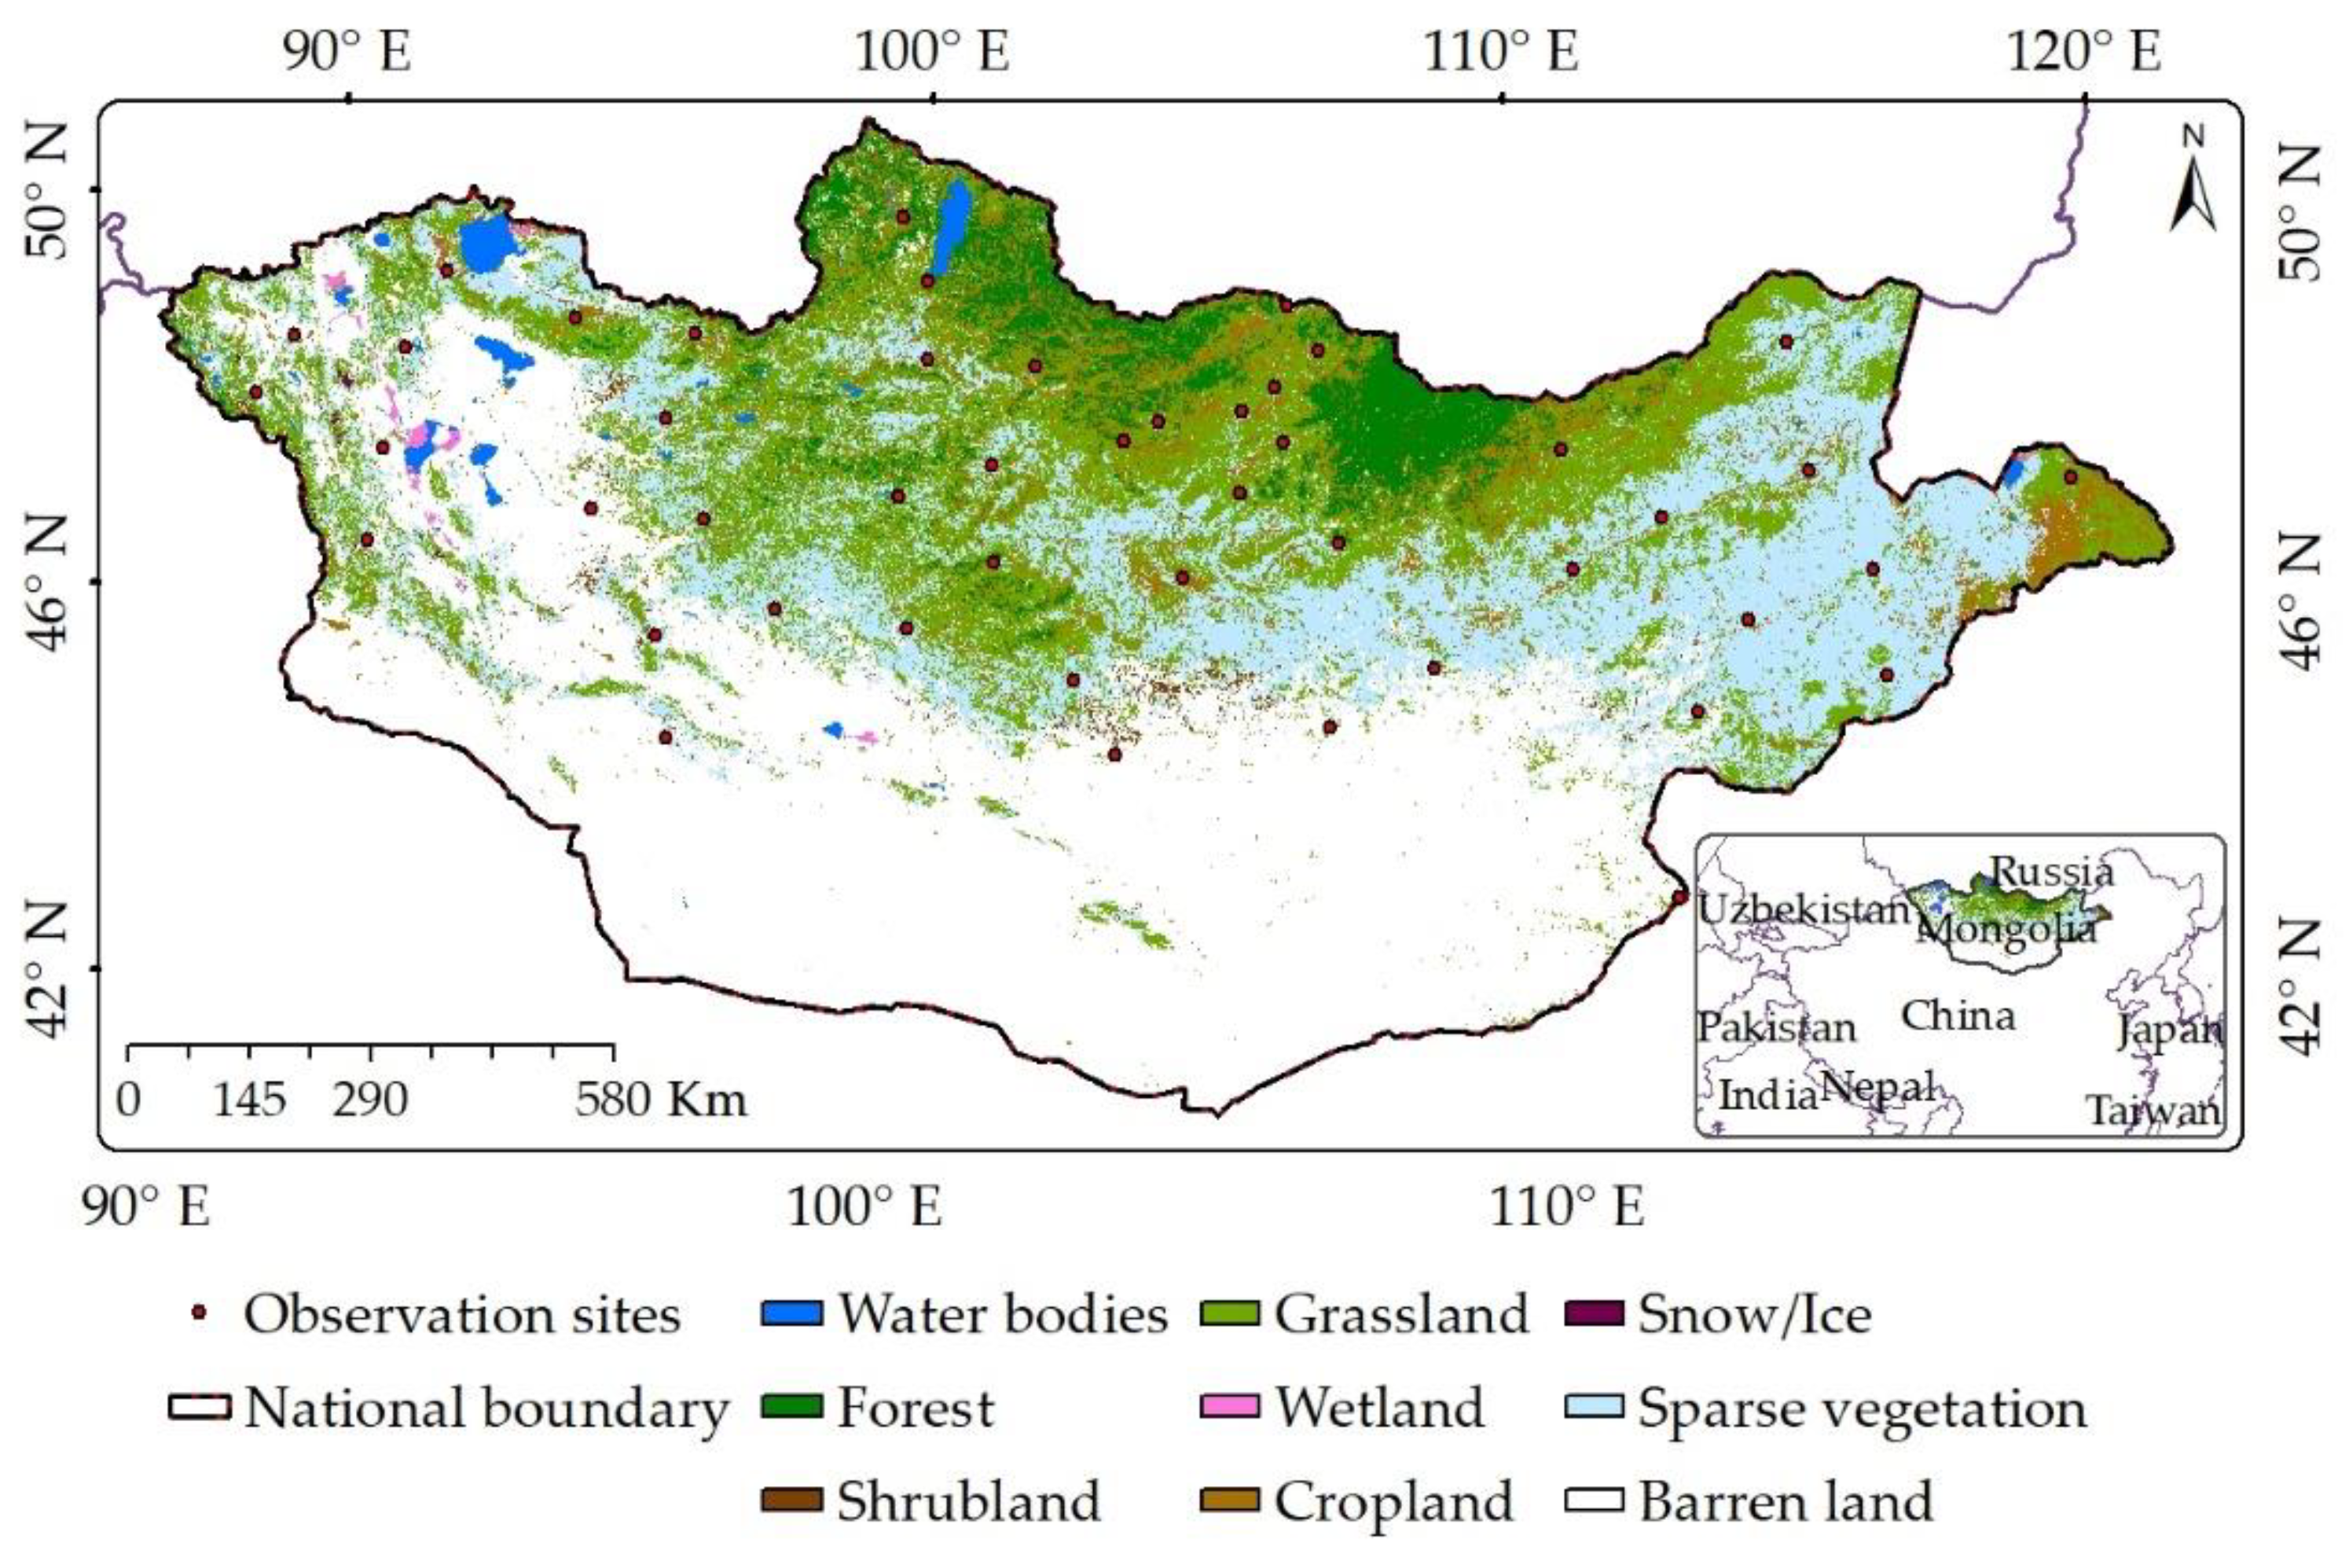
2.1. Study Area
2.2. Data Processing Method
2.2.1. NDVI Anomaly as the Indicator of Droughts
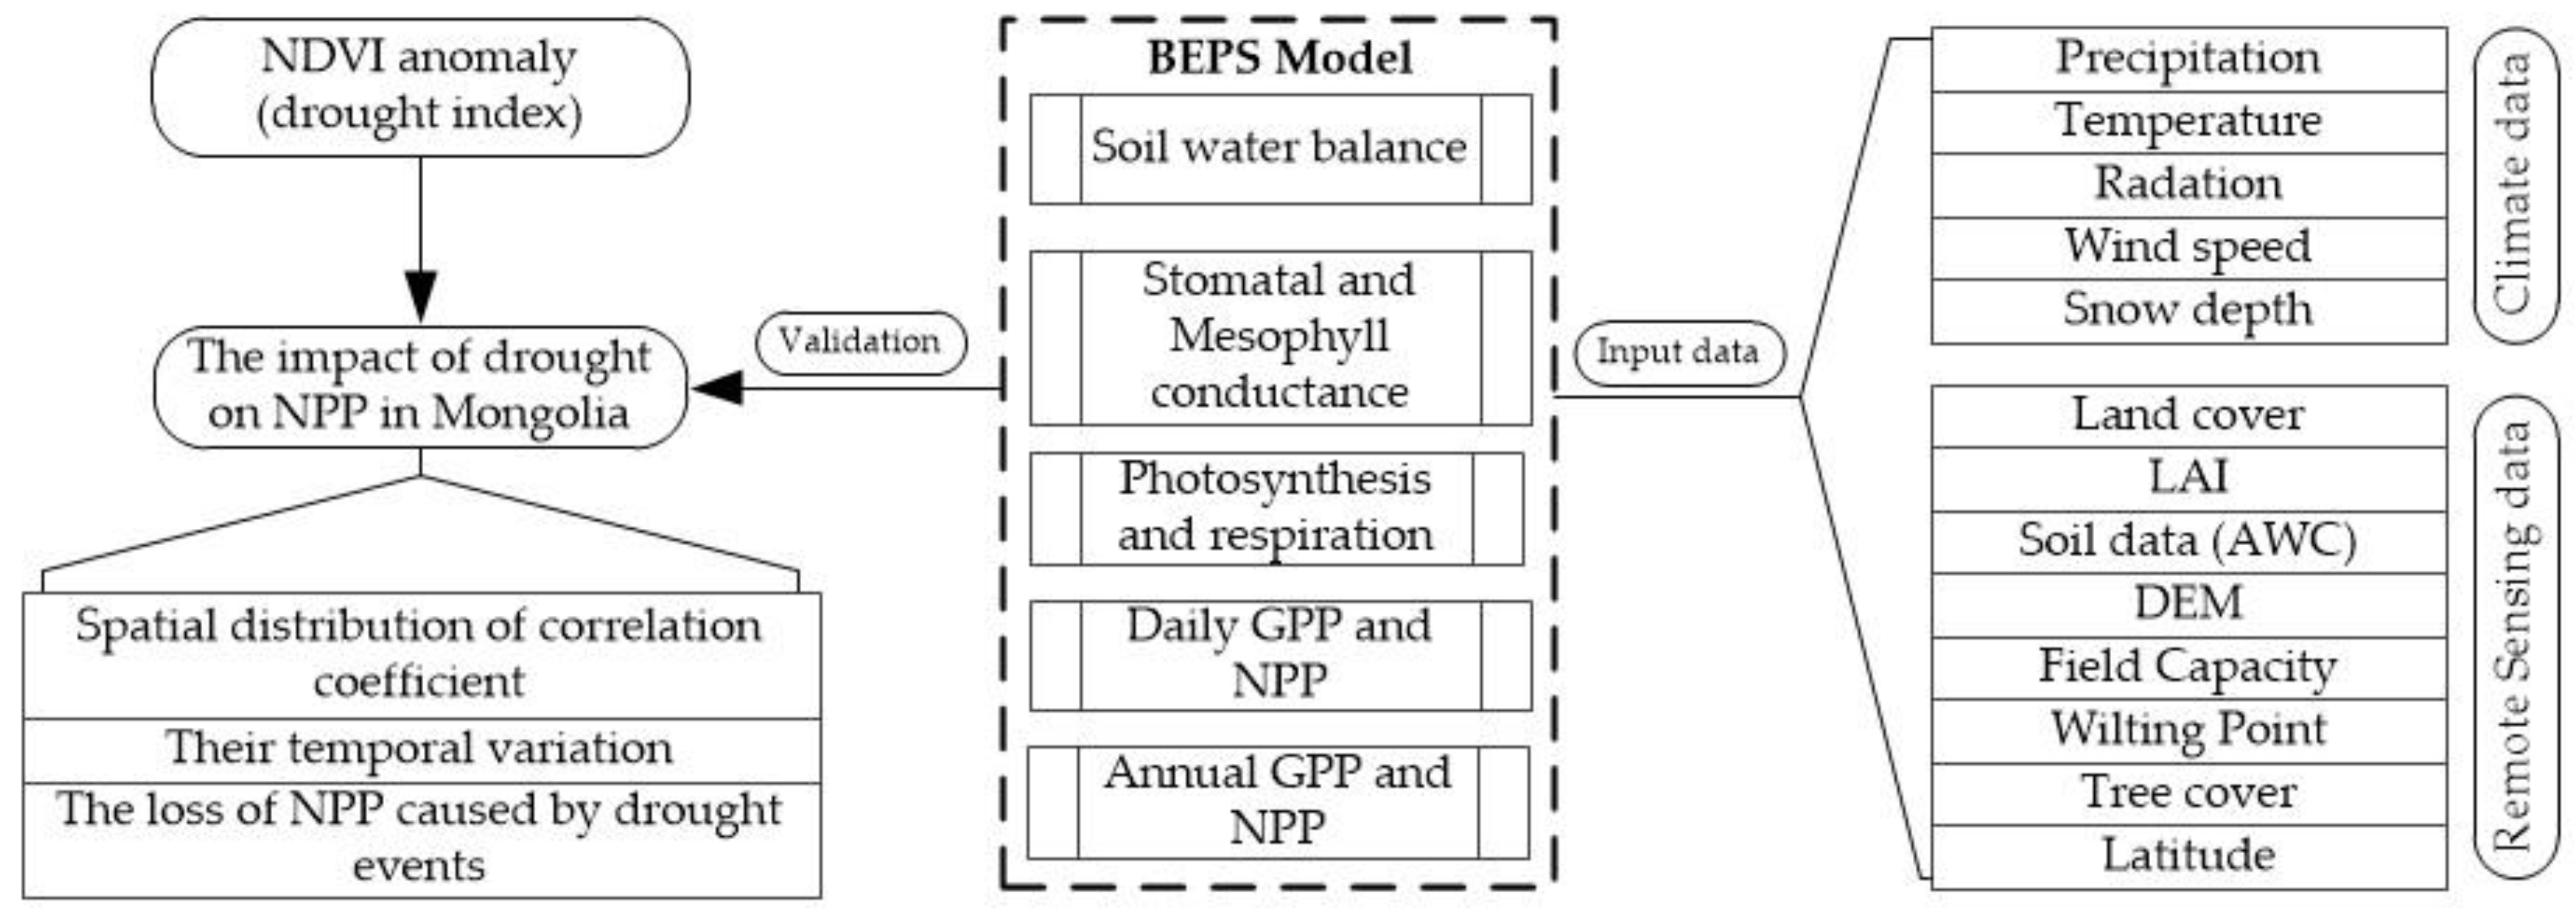
2.2.2. BEPS for the Calculations of NPP
2.2.3. Data Acquisition and Preparation
3. Results
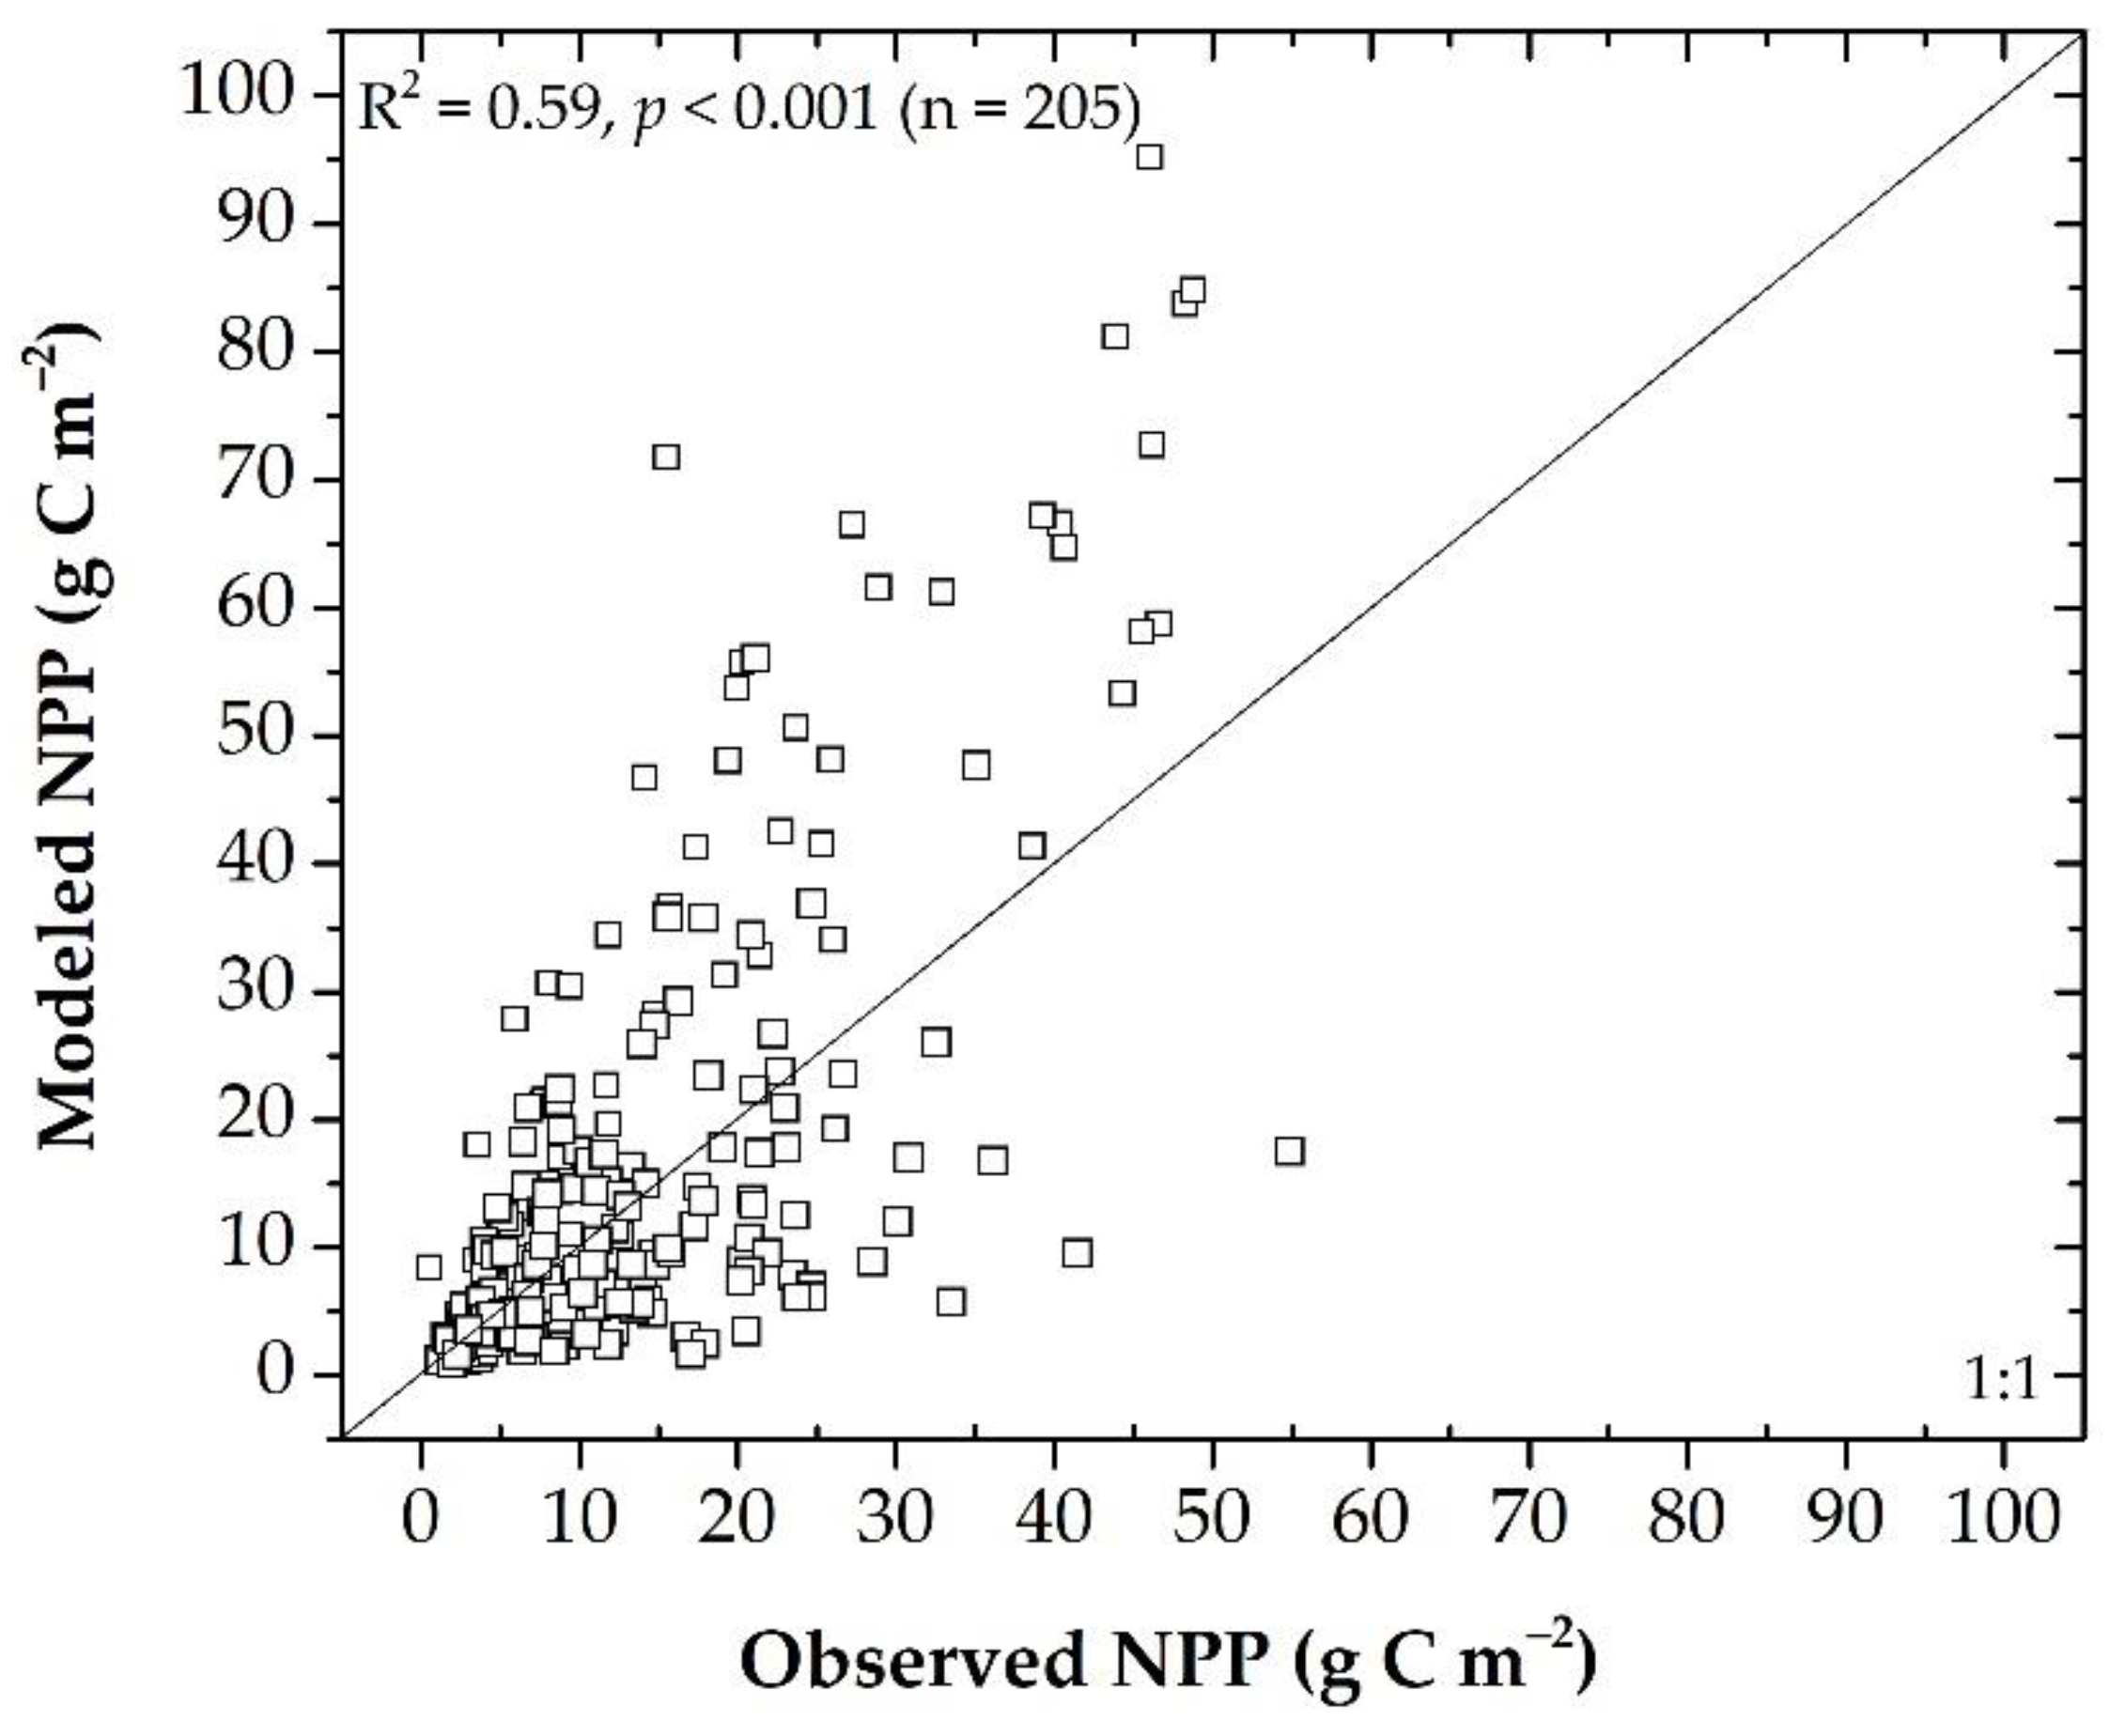
3.1. Validation of the NPP Calculation
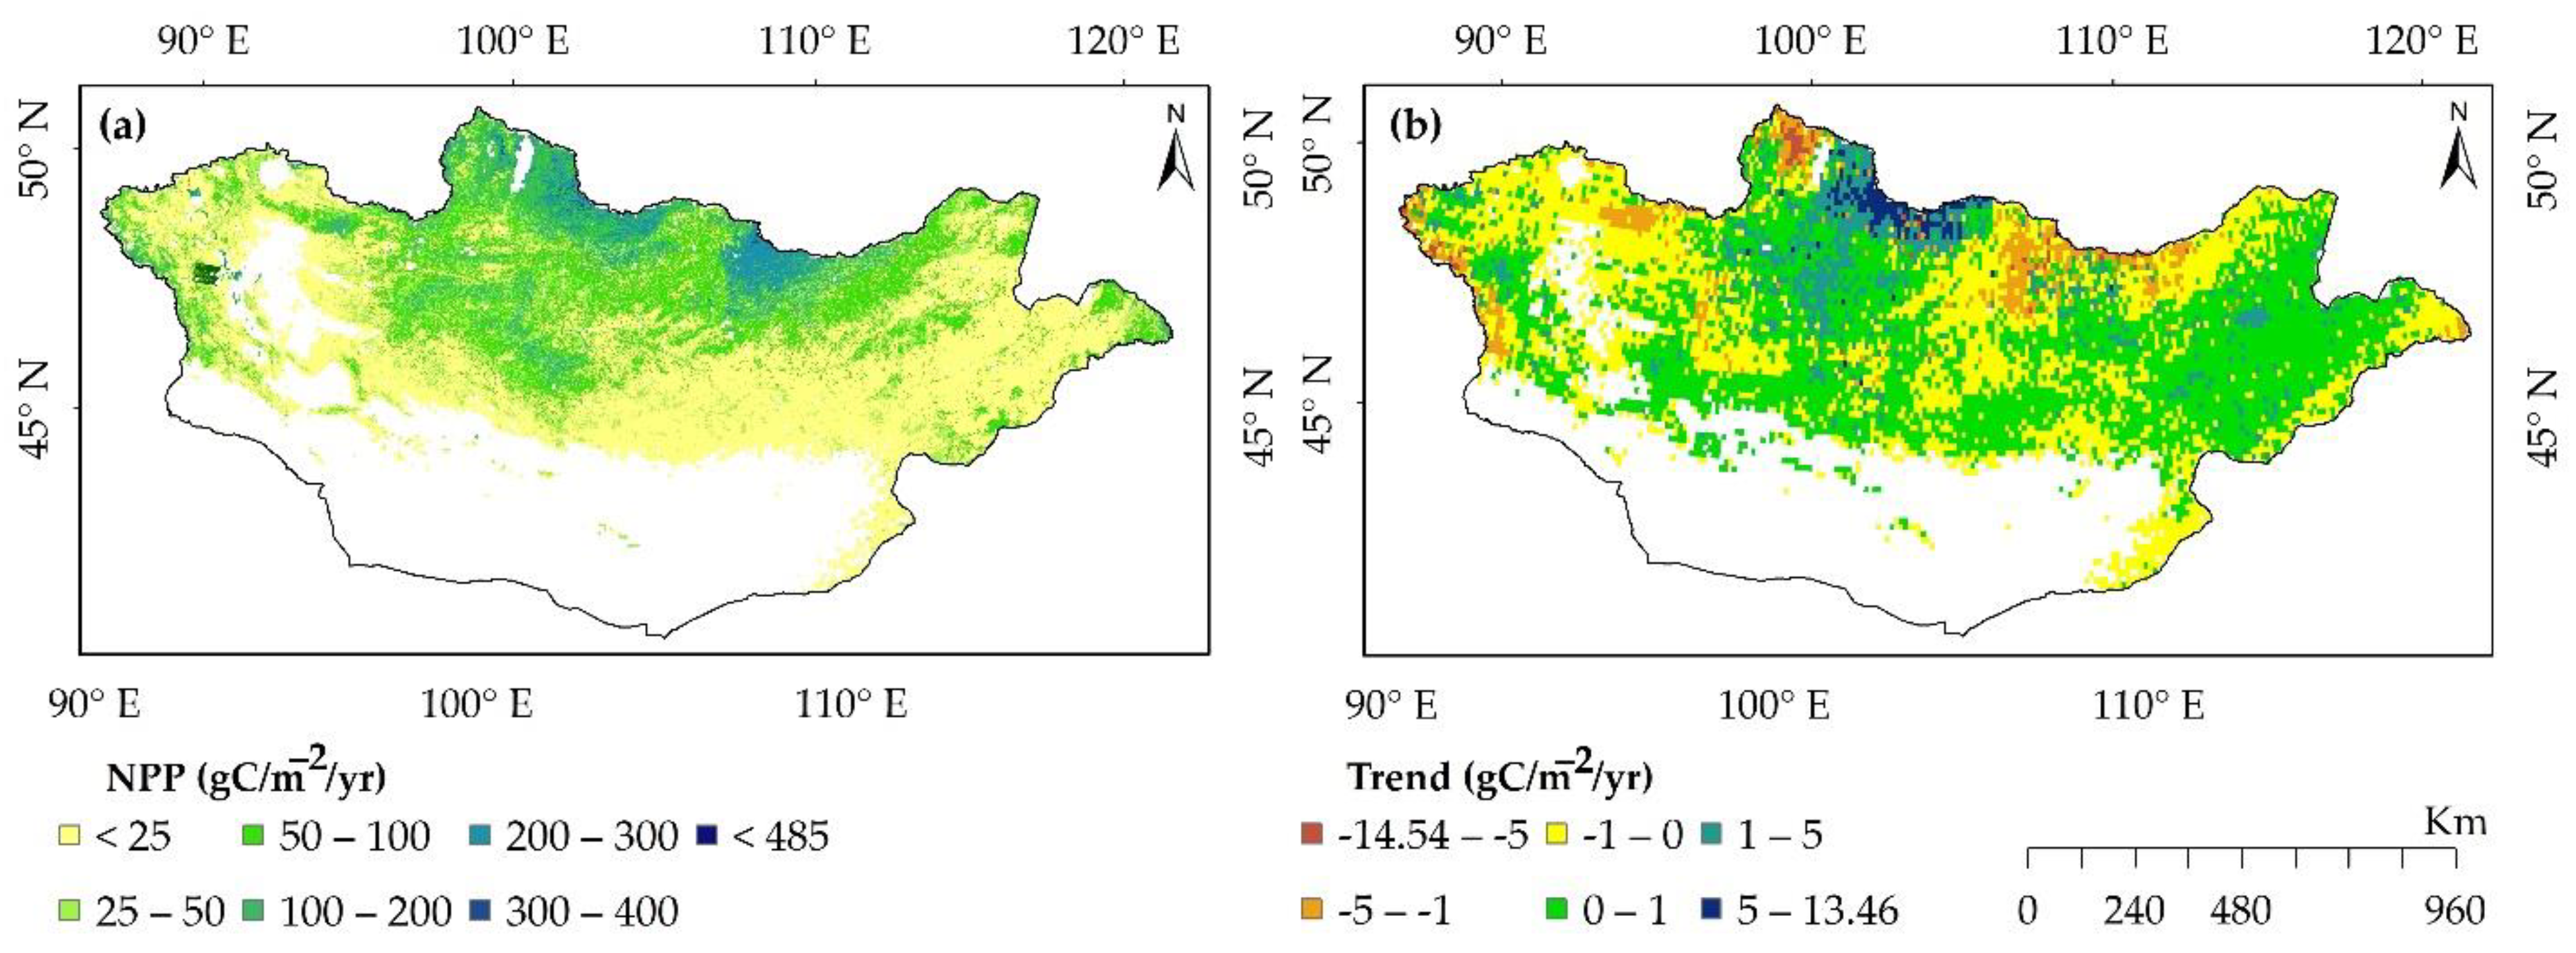
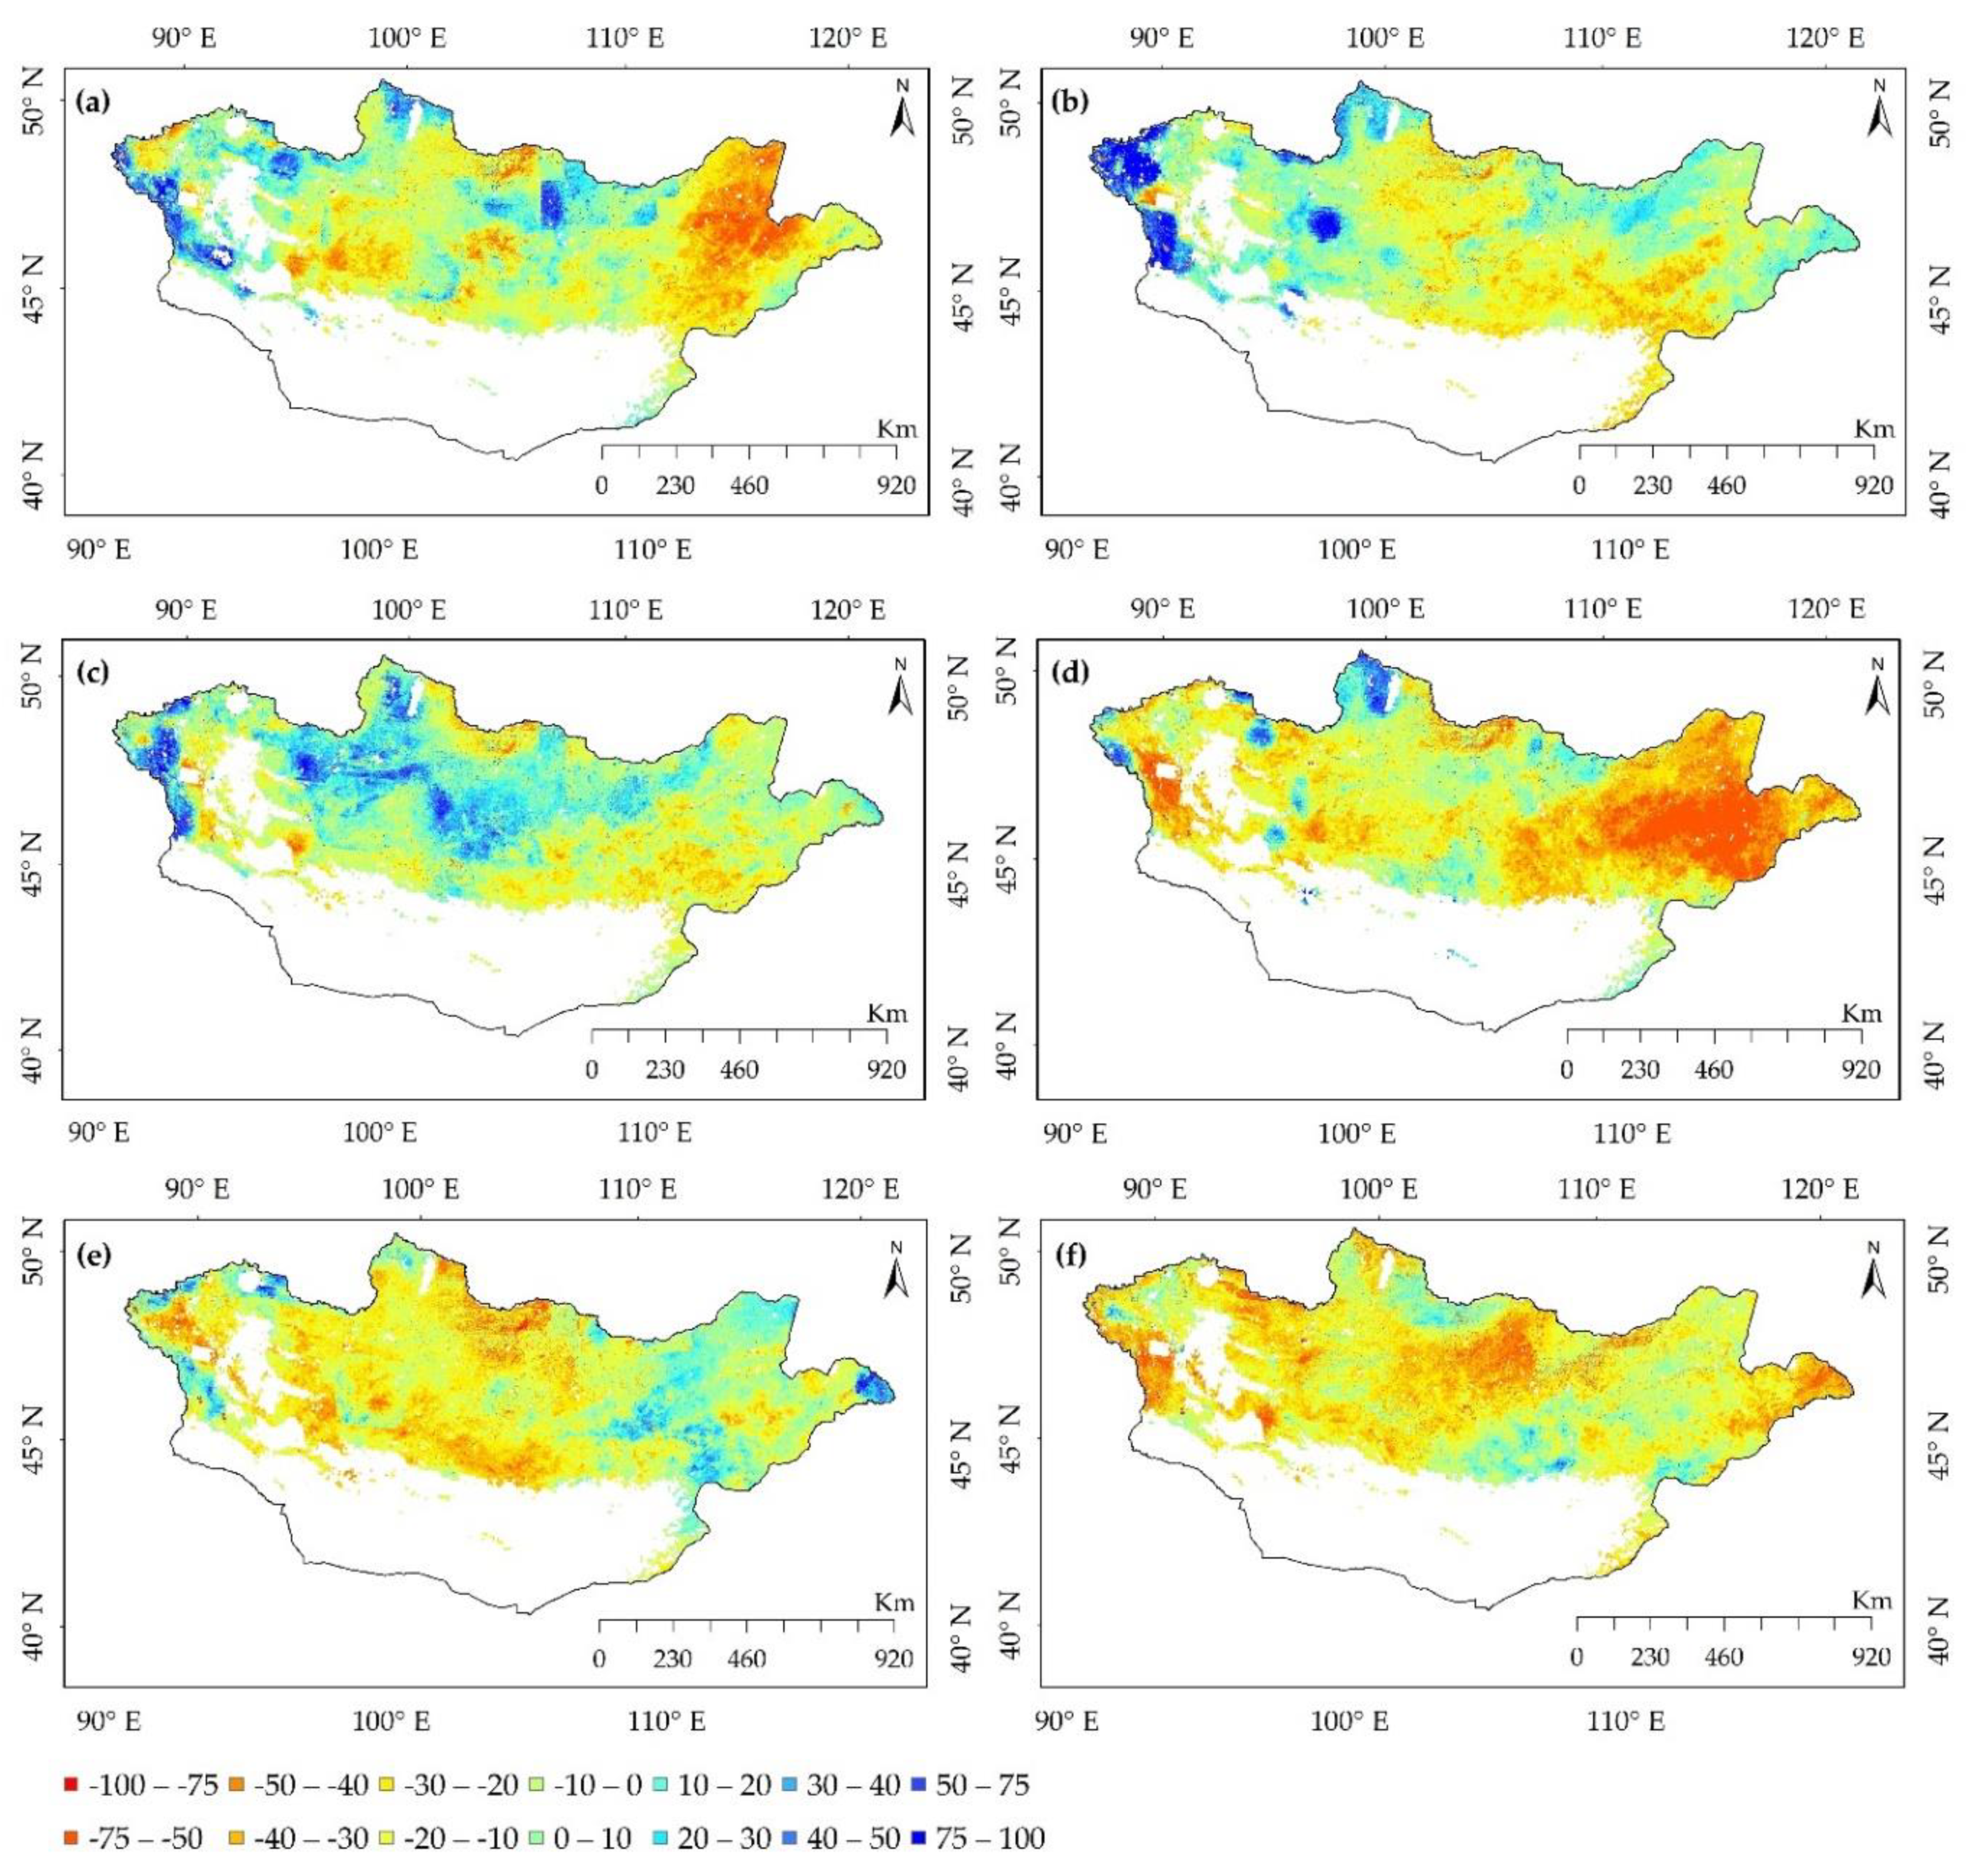
3.2. Spatiotemporal Trends of NPP
3.3. The Impact of Drought on NPP
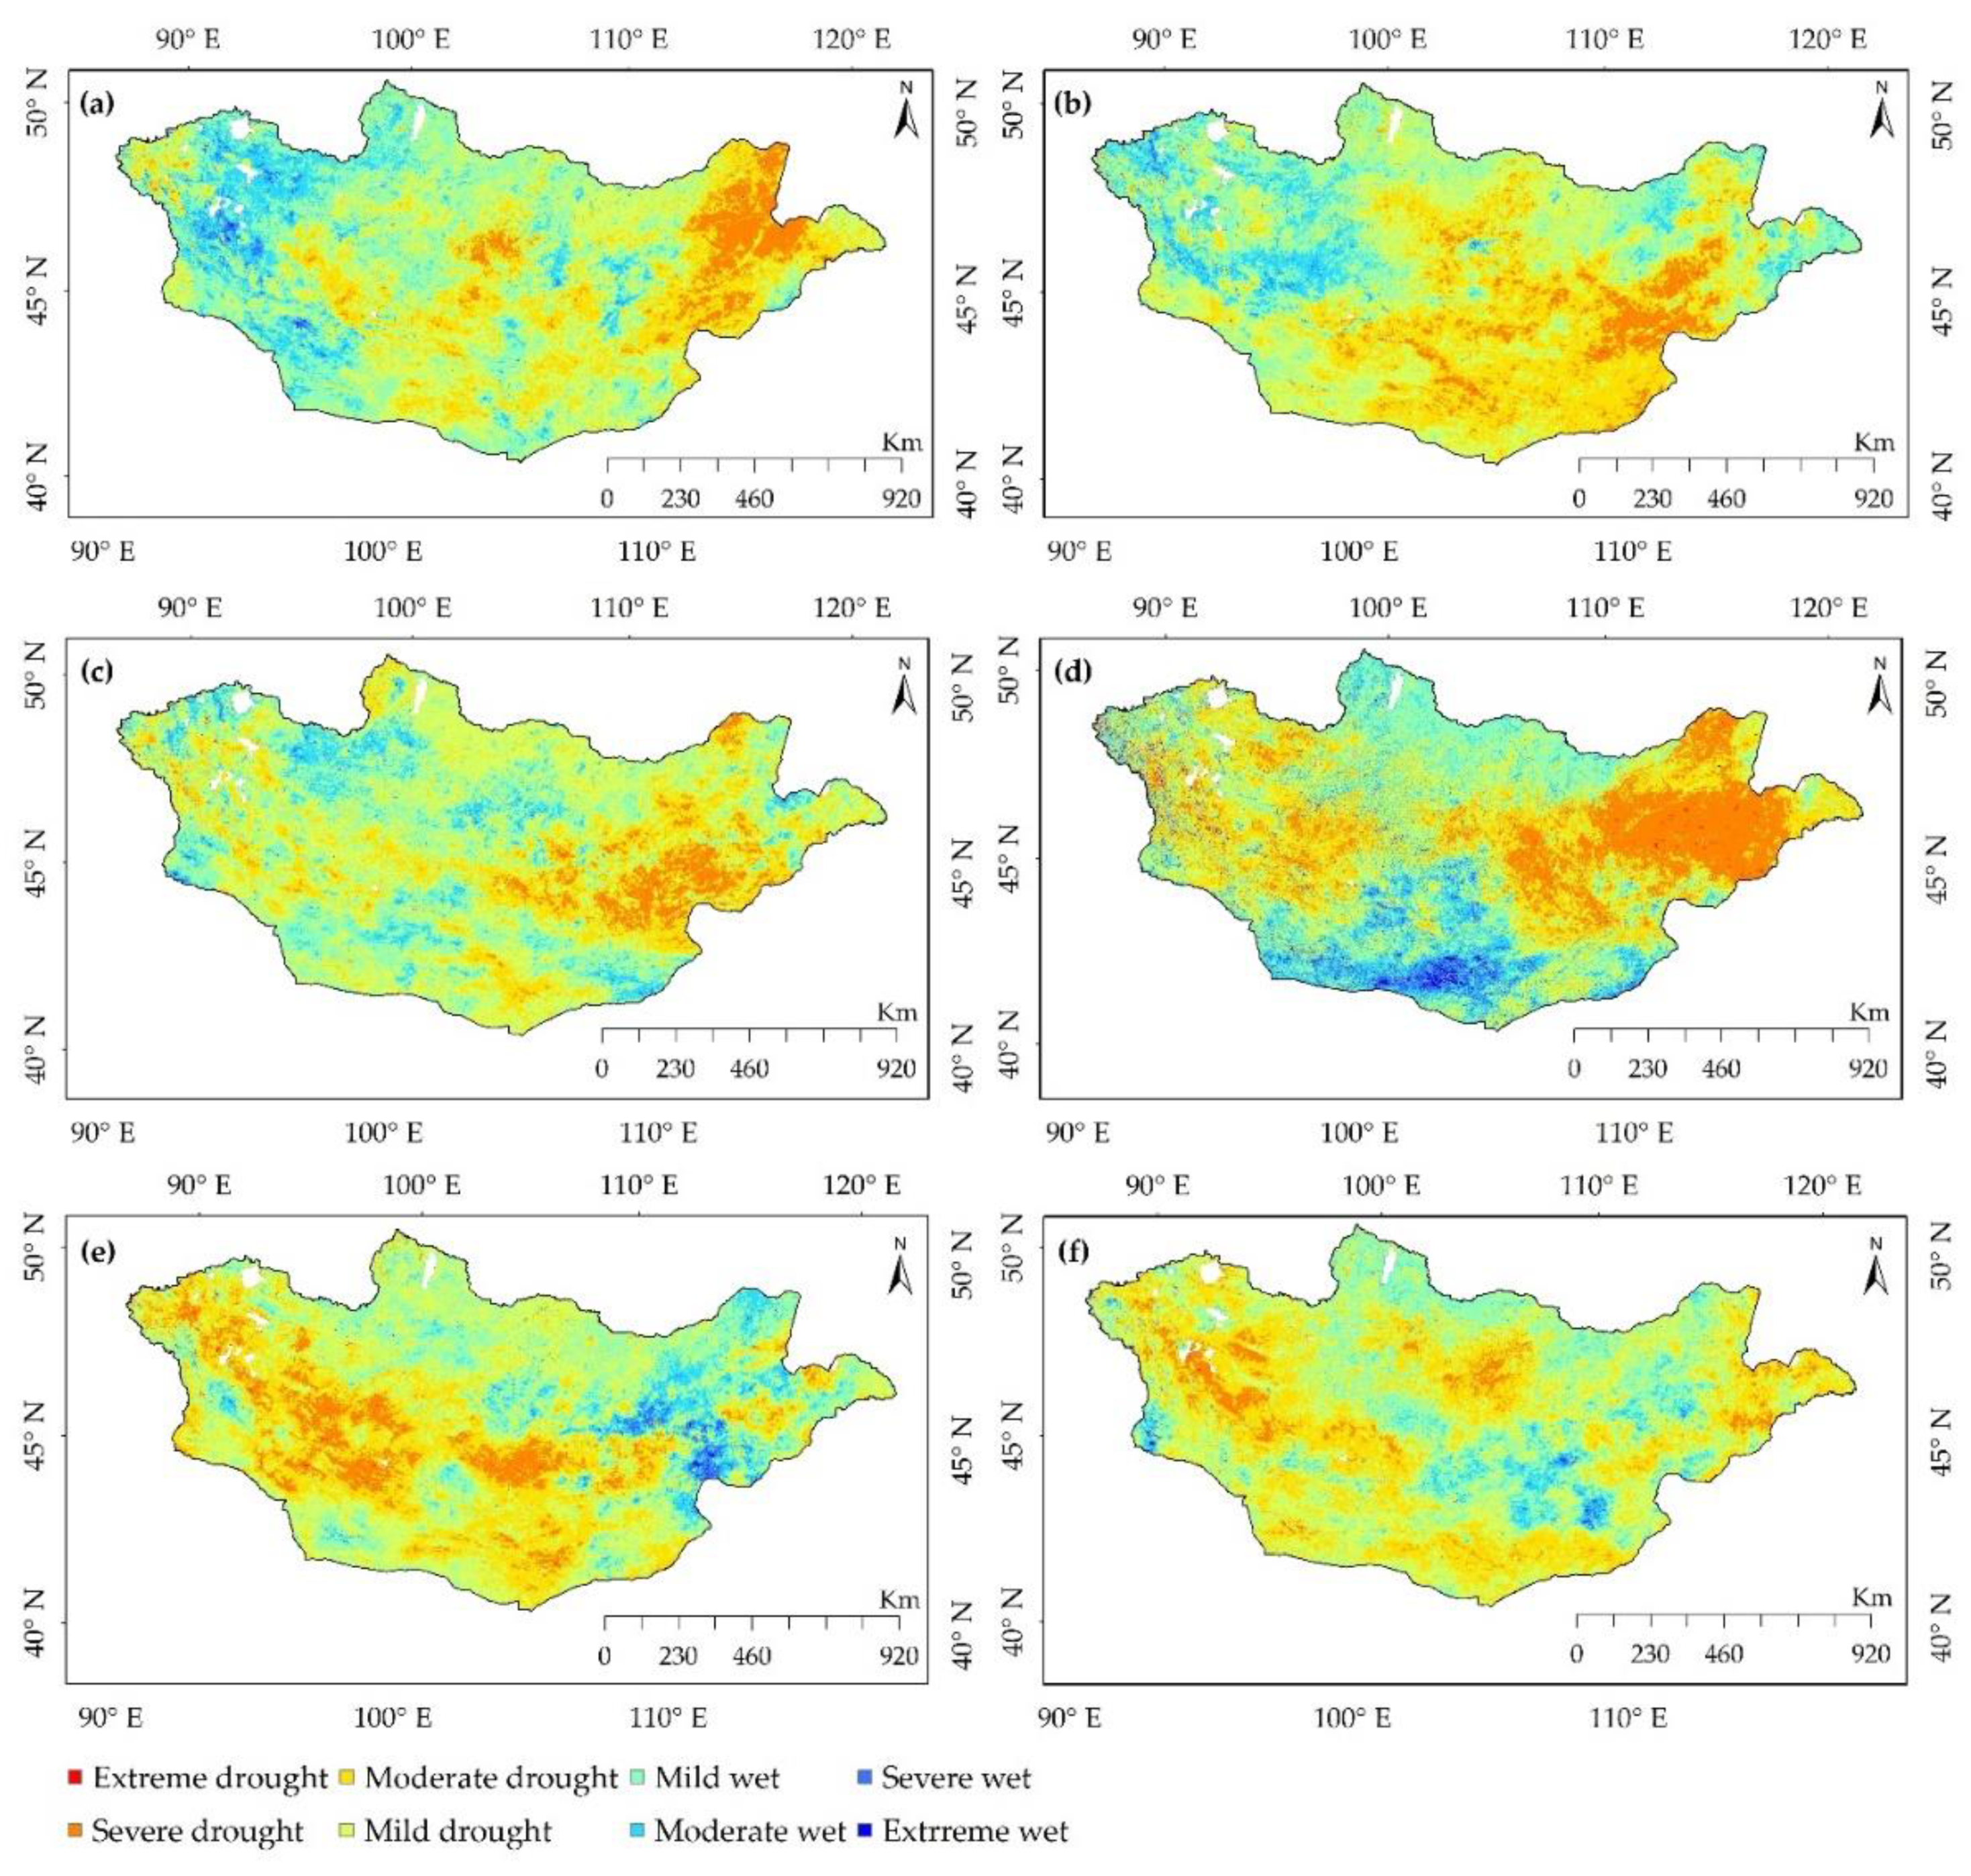
3.3.1. Characteristics of Drought
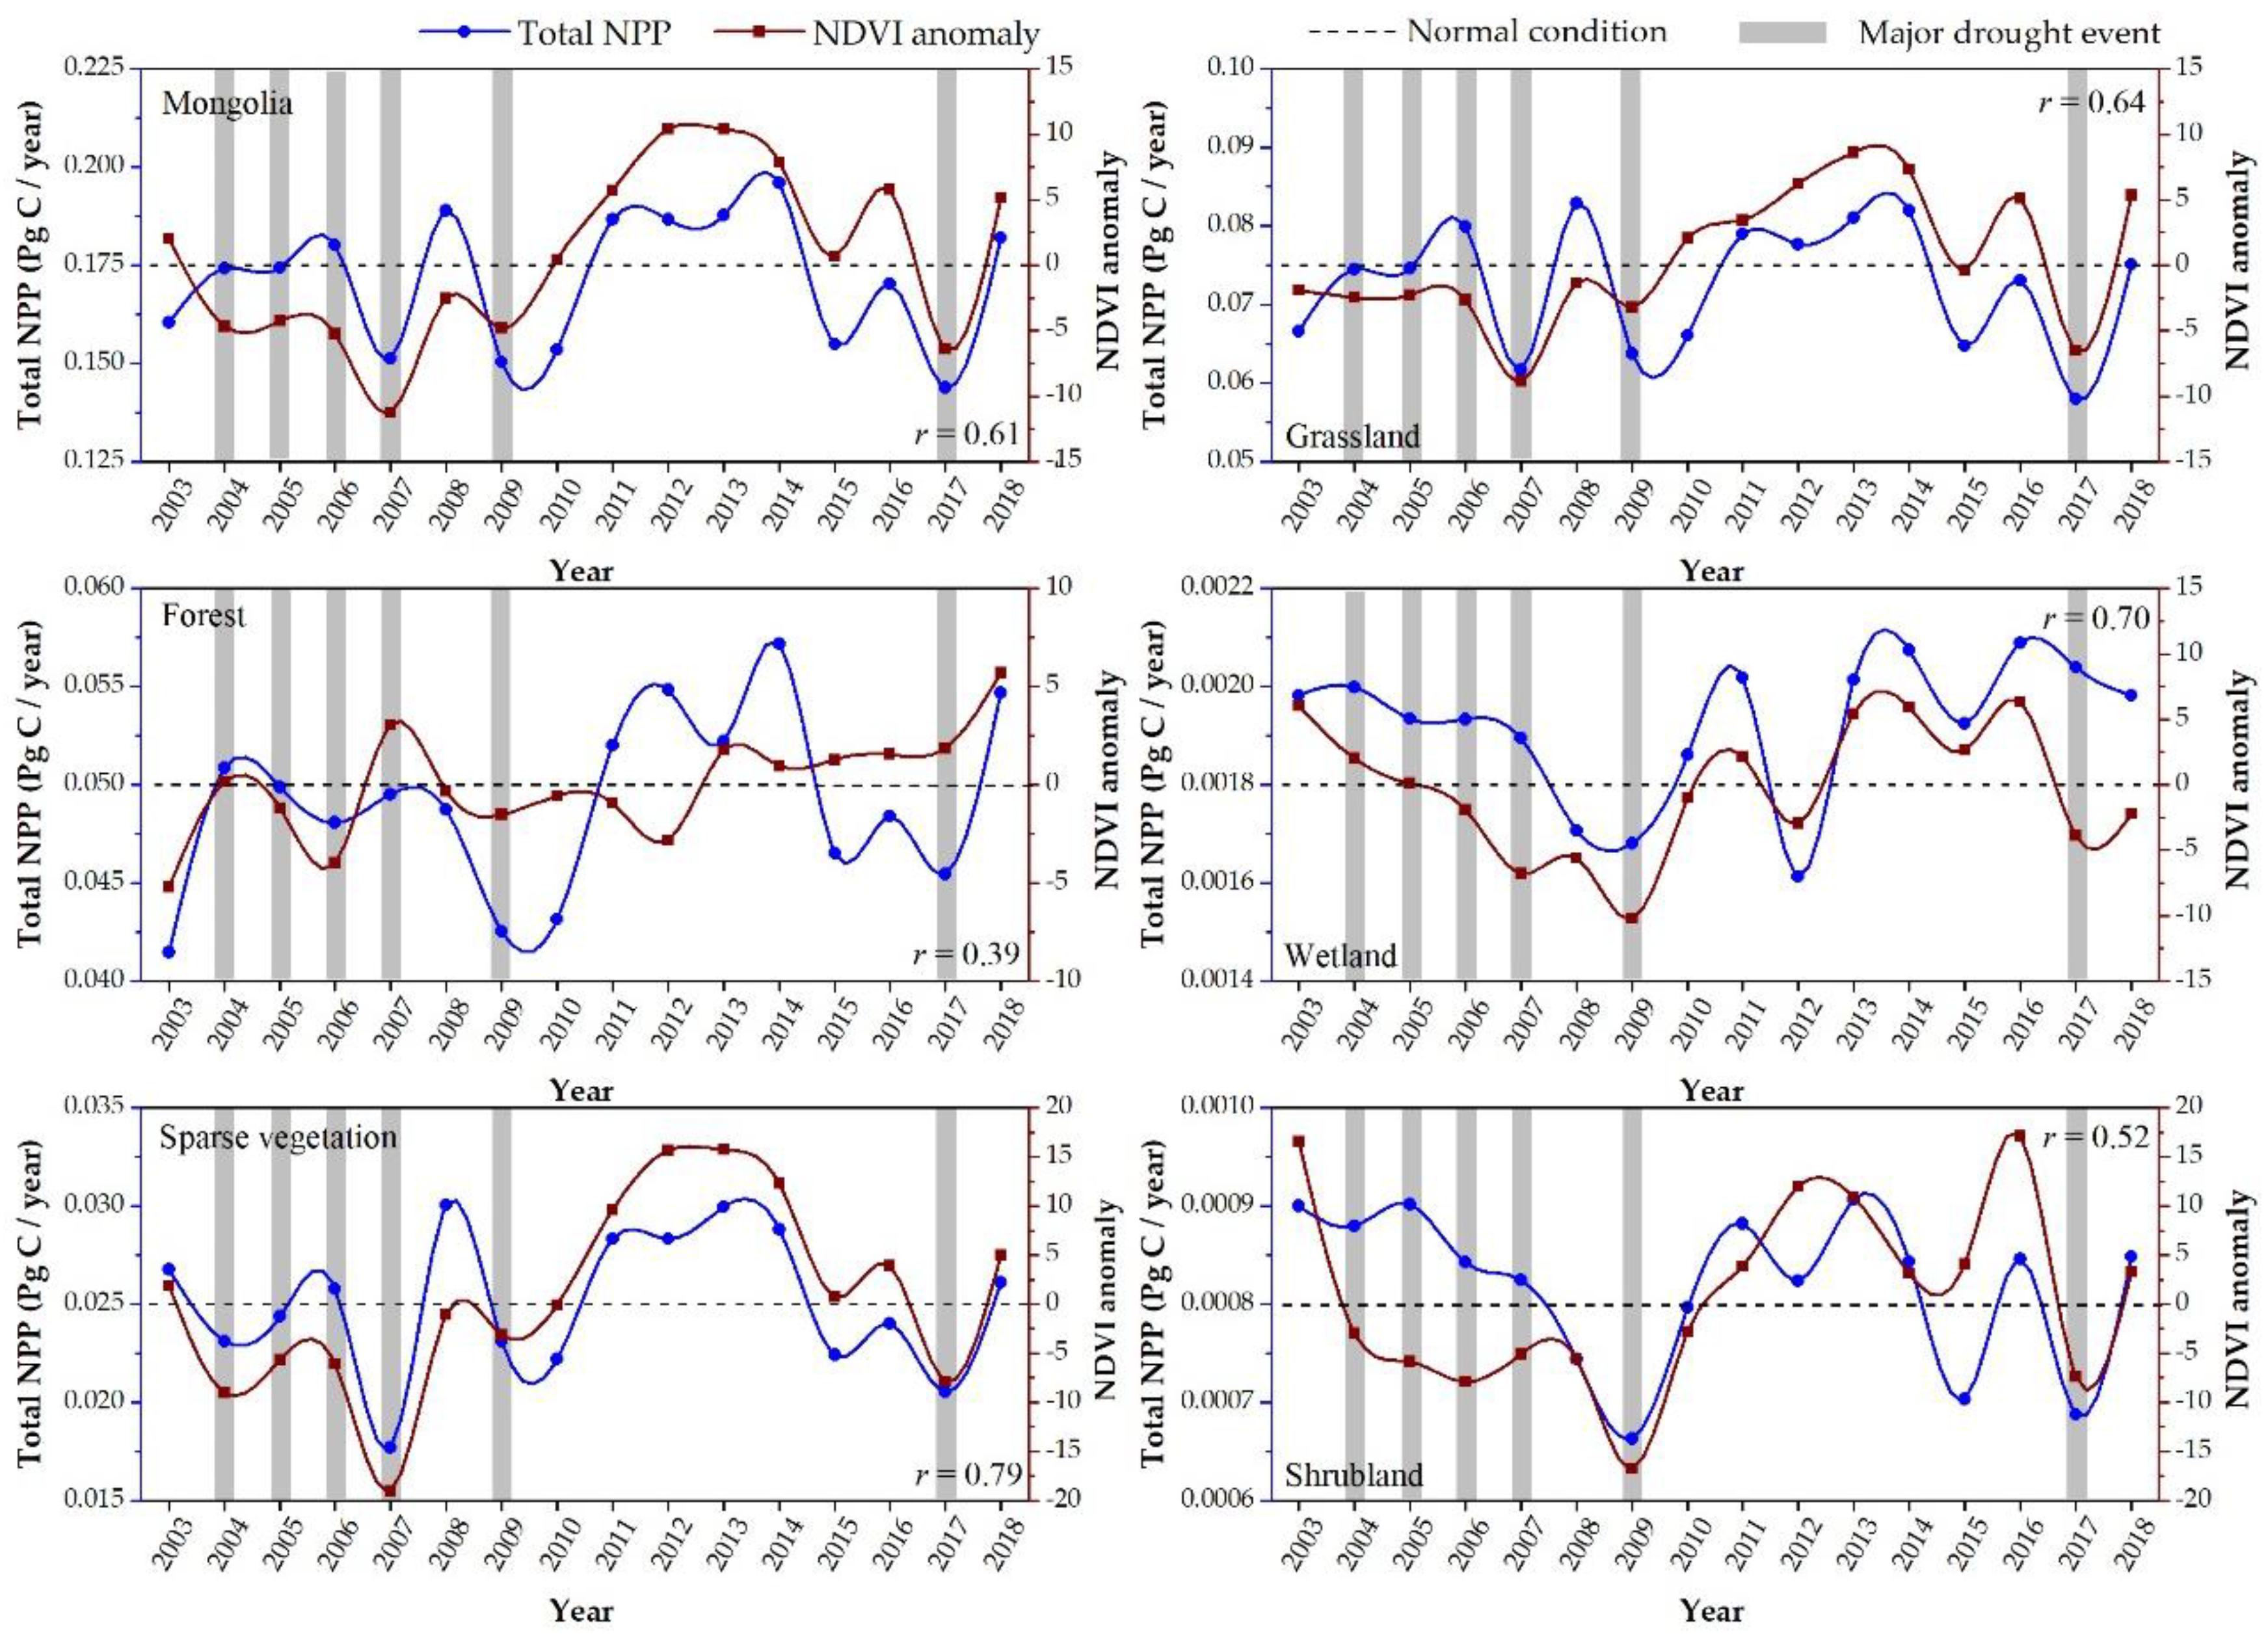
3.3.2. NPP Variation during Drought Events
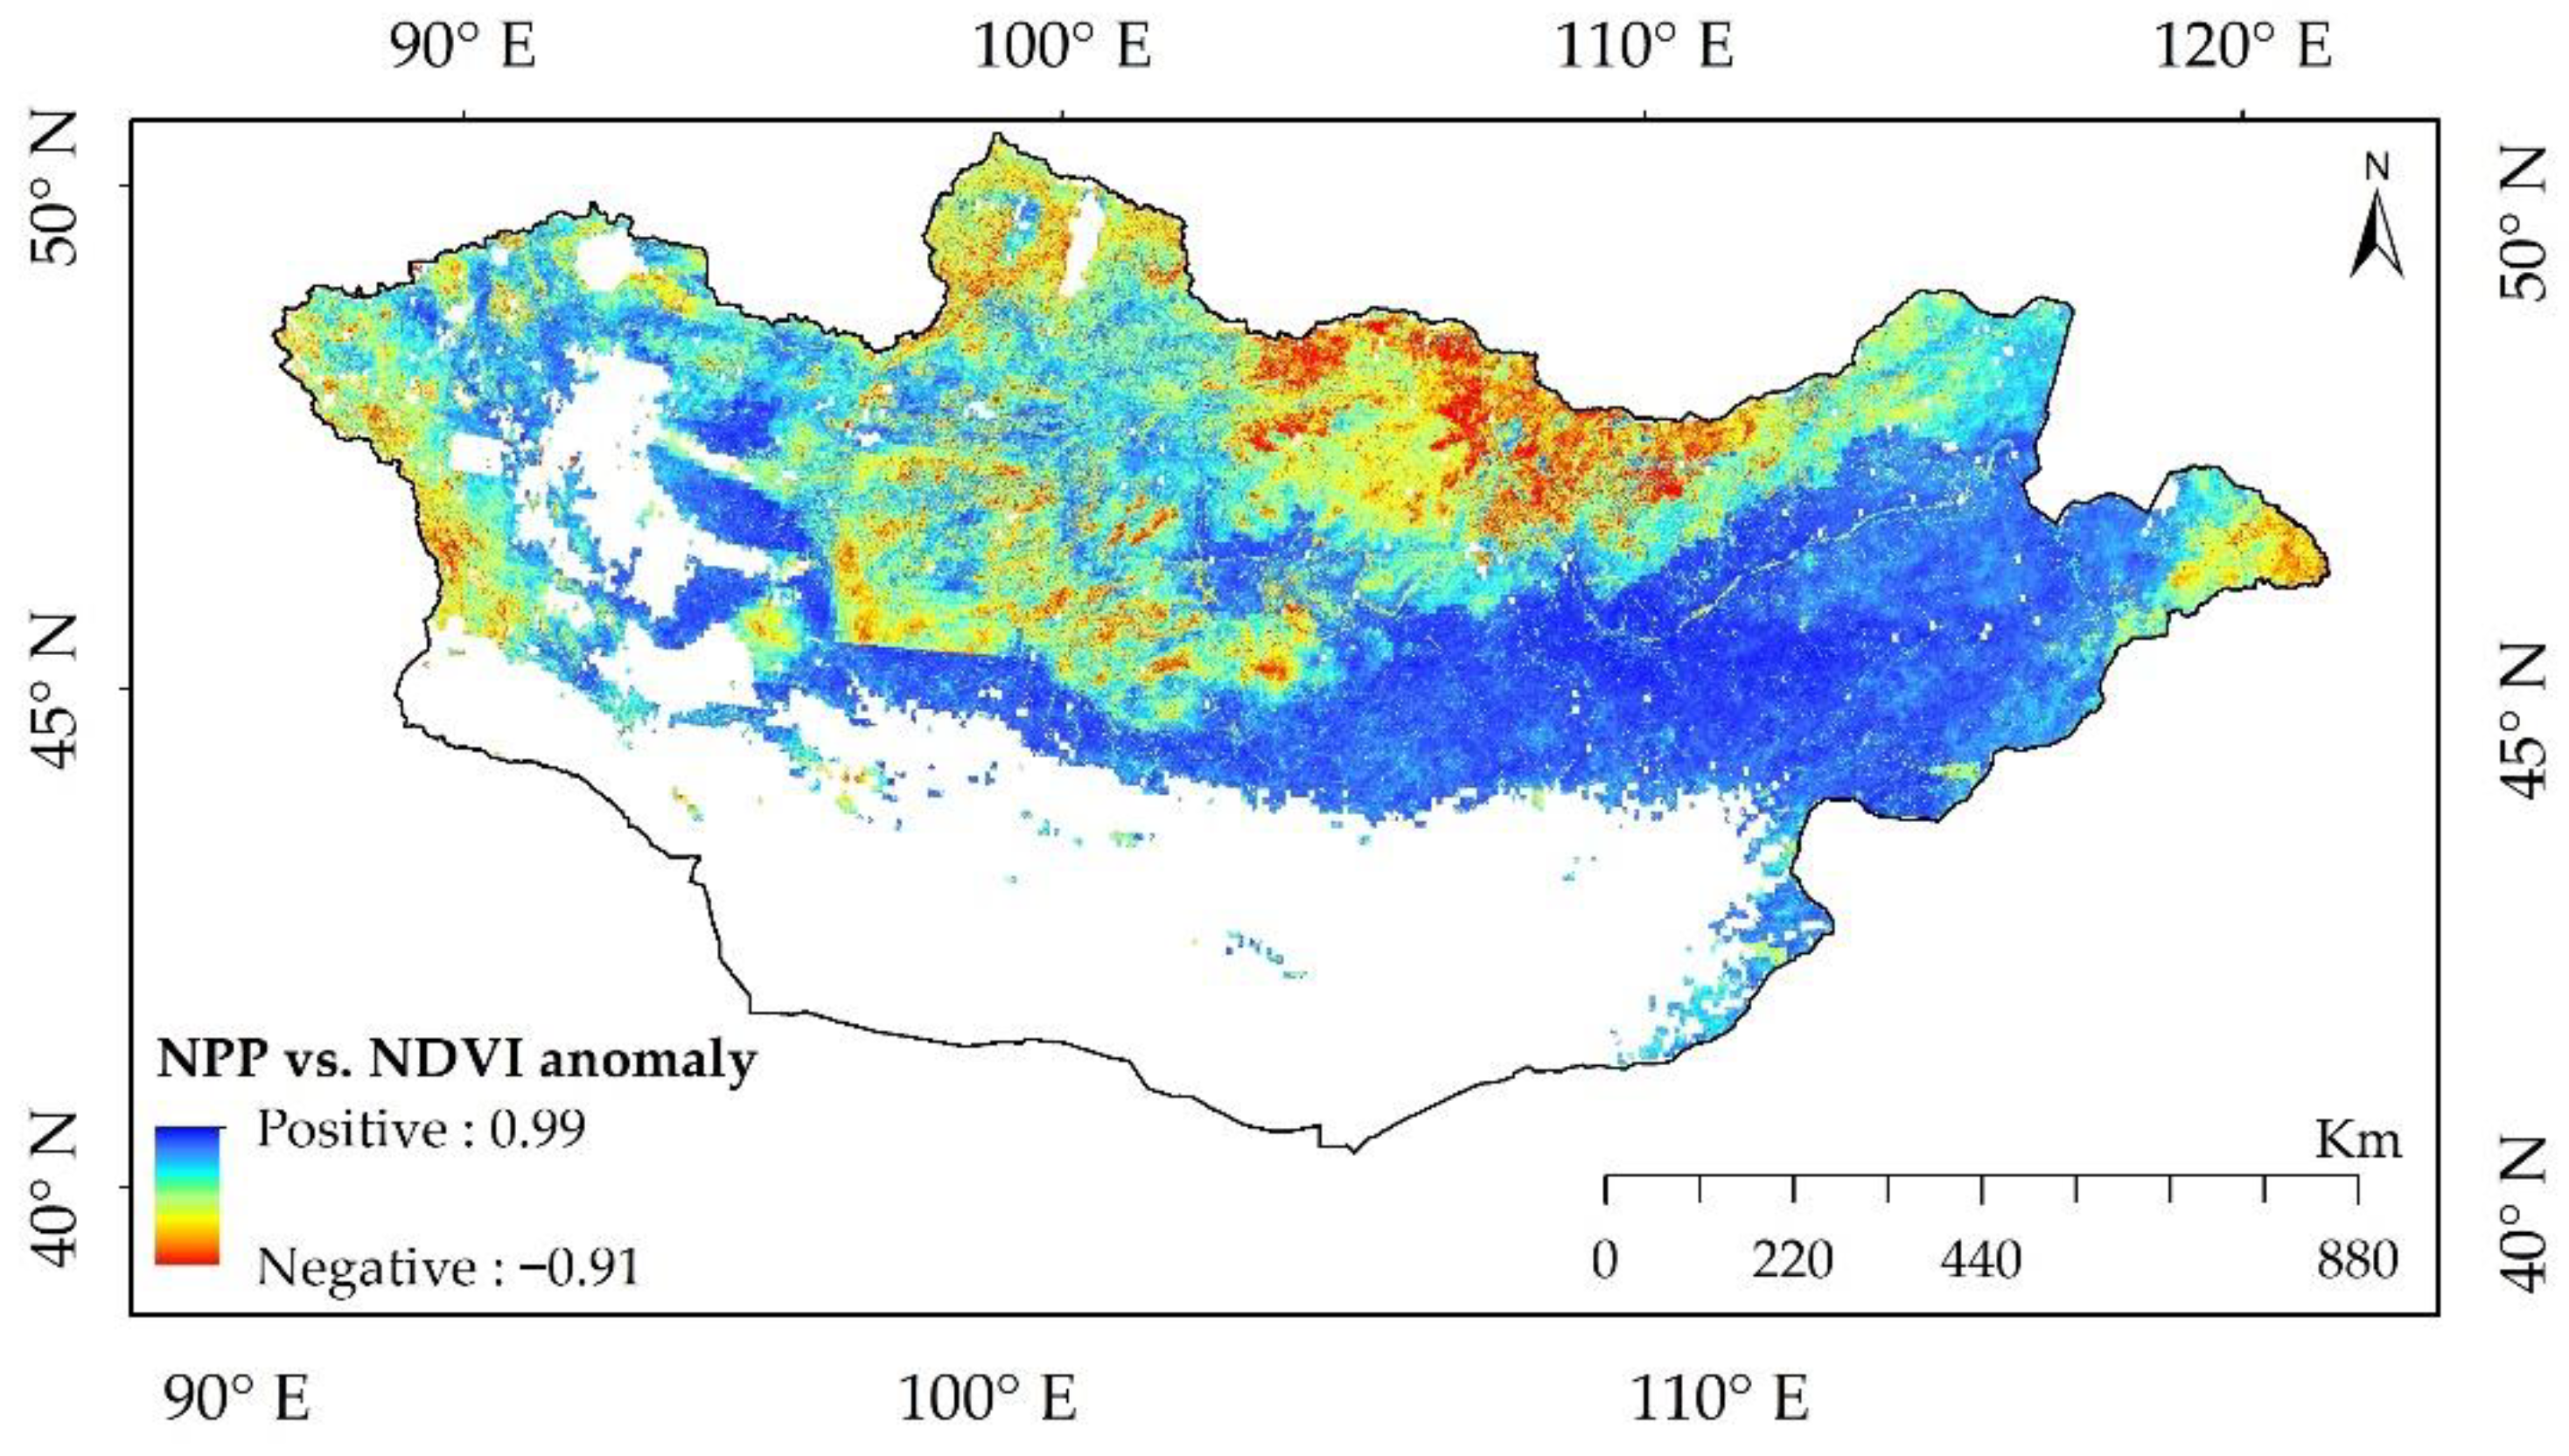
3.3.3. Relationship between NPP and Drought
4. Discussion
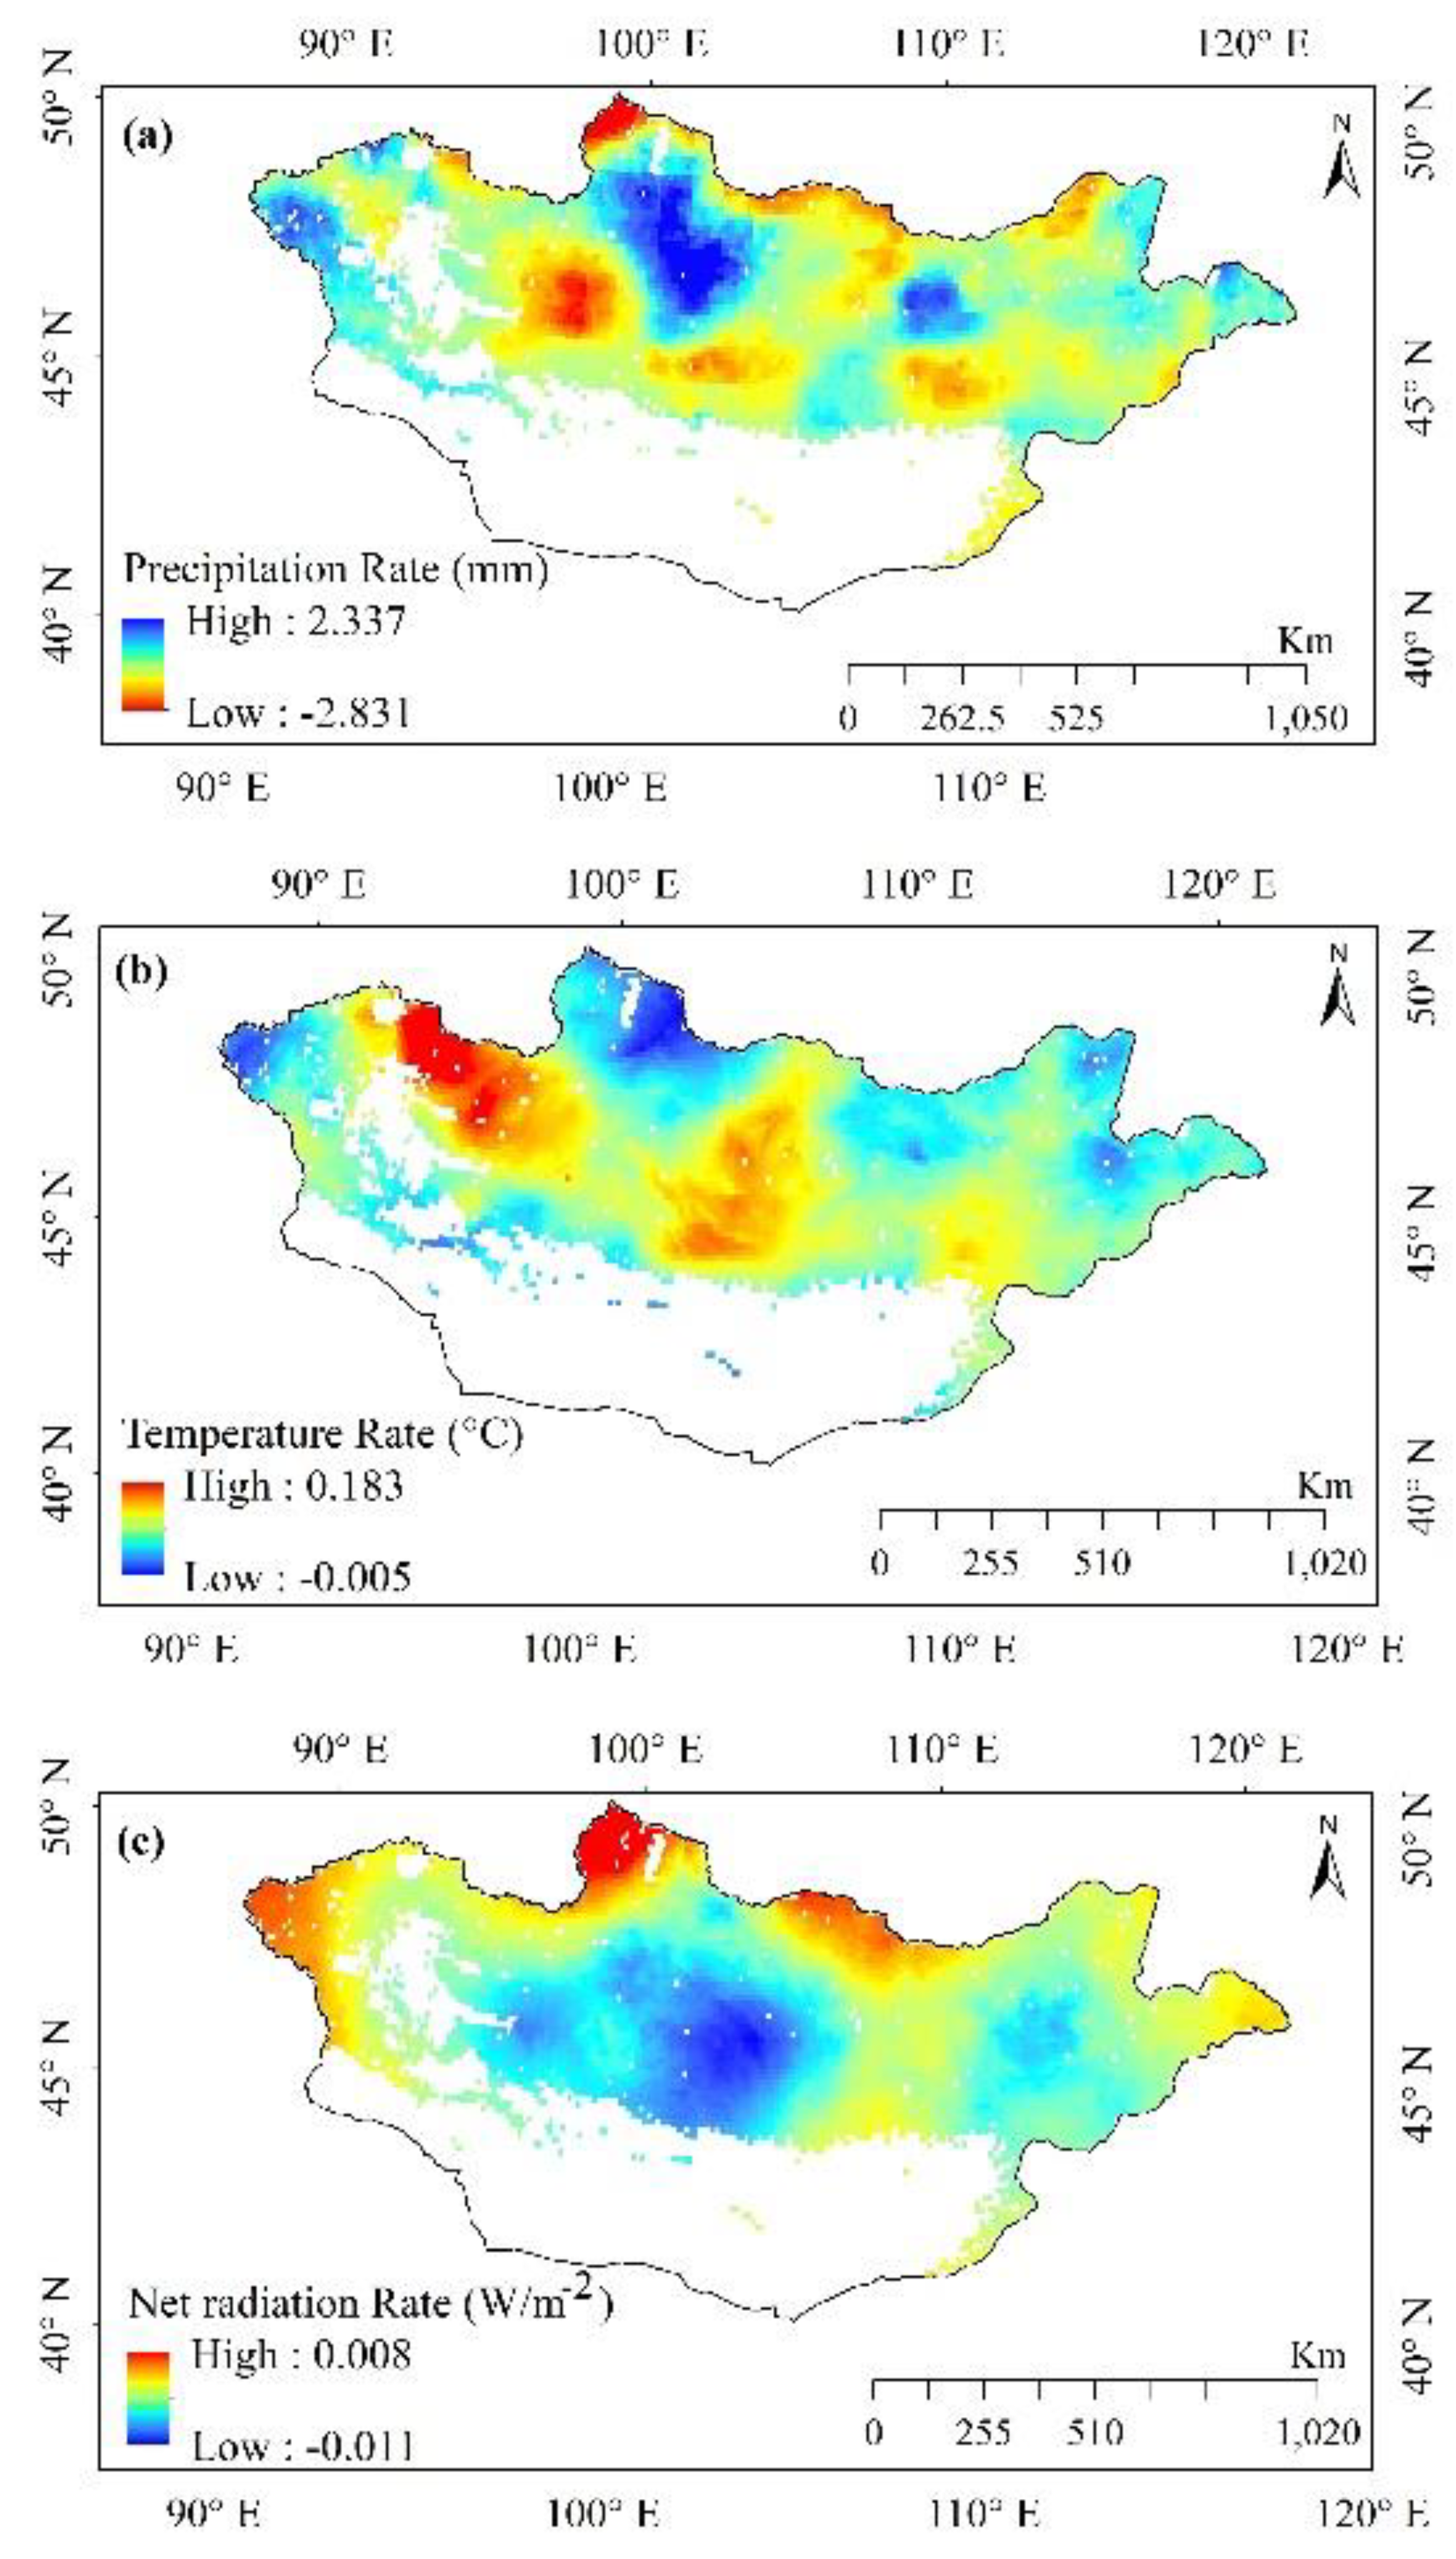
4.1. Impact of Climatic Variables on NPP Trend
4.2. NPP Response to Drought Events
5. Conclusions
- The study indicated that the BEPS model could predict terrestrial NPP in Mongolia. The growing season NPP was increased in 56.37% of the vegetated lands, whereas 43.63% of areas showed a decreasing trend from 2003 to 2018. Overall, the variation of NPP exhibited a slightly increasing trend over the entire study period.
- Whilst the NPP trend was partly influenced by various climatic variables, drought events played a key role in NPP variations in the Mongolian rangeland. A 10–50% drop in NPP was observed for mild and moderately drought-affected areas of the county, while the NPP in severe drought areas, mainly in the eastern regions, declined by approximately 10–75% during the six major drought events.
- The response of the NPP to drought conditions for different vegetation types was diverse due to variation in their drought resistance ability. The forests were generally more drought resistant than shrubland, while sparse vegetation exhibited extreme sensitivity to drought followed by wetland and grassland.
- The model and data used in this study identified the major drought events in Mongolia and highlighted vegetation types that would most likely be sensitive to future drought events. Therefore, our results suggest that this methodology could be applied to assess the impacts of drought on NPP for arid and semiarid regions, which is the basis for drought preparedness strategies.
Author Contributions
Funding
Institutional Review Board Statement
Informed Consent Statement
Acknowledgments
Conflicts of Interest
Appendix A

References
- Arnell, N.W.; Lowe, J.A.; Challinor, A.J.; Osborn, T.J. Global and regional impacts of climate change at different levels of global temperature increase. Clim. Chang. 2019, 155, 377–391. [Google Scholar] [CrossRef] [Green Version]
- Moss, R.H.; Edmonds, J.A.; Hibbard, K.A.; Manning, M.R.; Rose, S.K.; Van Vuuren, D.P.; Carter, T.R.; Emori, S.; Kainuma, M.; Kram, T.; et al. The next generation of scenarios for climate change research and assessment. Nature 2010, 463, 747–756. [Google Scholar] [CrossRef] [PubMed]
- Van Vuuren, D.P.; Meinshausen, M.; Plattner, G.K.; Joos, F.; Strassmann, K.M.; Smith, S.J.; Wigley, T.M.L.; Raper, S.C.B.; Riahi, K.; De La Chesnaye, F.; et al. Temperature increase of 21st century mitigation scenarios. Proc. Natl. Acad. Sci. USA 2008, 105, 15258–15262. [Google Scholar] [CrossRef] [PubMed] [Green Version]
- Field, C.B.; Barros, V.; Stocker, T.F.; Dahe, Q.; Jon Dokken, D.; Ebi, K.L.; Mastrandrea, M.D.; Mach, K.J.; Plattner, G.K.; Allen, S.K.; et al. Managing the Risks of Extreme Events and Disasters to Advance Climate Change Adaptation: Special Report of the Intergovernmental Panel on Climate Change; Cambridge University Press: Cambridge, UK, 2012; ISBN 9781107025066. [Google Scholar]
- Mccollum, D.W.; Tanaka, J.A.; Morgan, J.A.; Mitchell, J.E.; Fox, W.E.; Maczko, K.A.; Hidinger, L.; Duke, C.S.; Kreuter, U.P. Climate change effects on rangelands and rangeland management: Affirming the need for monitoring. Ecosyst. Heal. Sustain. 2017, 3, e01264. [Google Scholar] [CrossRef] [Green Version]
- Nemani, R.R.; Keeling, C.D.; Hashimoto, H.; Jolly, W.M.; Piper, S.C.; Tucker, C.J.; Myneni, R.B.; Running, S.W. Climate-driven increases in global terrestrial net primary production from 1982 to 1999. Science 2003, 300, 1560–1563. [Google Scholar] [CrossRef] [PubMed] [Green Version]
- Zhao, M.; Running, S.W. Drought-induced reduction in global terrestrial net primary production from 2000 through 2009. Science 2010, 329, 940–943. [Google Scholar] [CrossRef] [PubMed] [Green Version]
- Cao, M.; Woodward, F.I. Dynamic responses of terrestrial ecosystem carbon cycling to global climate change. Nature 1998, 393. [Google Scholar] [CrossRef]
- Churkina, G.; Running, S.W. Contrasting climatic controls on the estimated productivity of global terrestrial biomes. Ecosystems 1998, 1, 206–215. [Google Scholar] [CrossRef]
- Nanzad, L.; Zhang, J.; Batdelger, G.; Prasad, T.; Sharma, P.; Koju, U.A.; Wang, J.; Nabil, M. Analyzing NPP Response of Different Rangeland Types to Climatic Parameters over Mongolia. Agronomy 2021, 11, 647. [Google Scholar] [CrossRef]
- Bao, G.; Tuya, A.; Bayarsaikhan, S.; Dorjsuren, A.; Mandakh, U.; Bao, Y.; Li, C.; Vanchindorj, B. Variations and climate constraints of terrestrial net primary productivity over Mongolia. Quat. Int. 2020, 537, 112–125. [Google Scholar] [CrossRef]
- Le Houérou, H.N. Climate change, drought and desertification. J. Arid Environ. 1996, 34, 133–185. [Google Scholar] [CrossRef] [Green Version]
- Shiirevdamba, T. Biological Diversity in MONGOLIA (First National Report); Ministry for Nature and the Environment: Ulaanbaatar, Mongolia, 1998. [Google Scholar]
- Nanzad, L.; Zhang, J.; Tuvdendorj, B.; Nabil, M.; Zhang, S.; Bai, Y. NDVI anomaly for drought monitoring and its correlation with climate factors over Mongolia from 2000 to 2016. J. Arid Environ. 2019, 164, 69–77. [Google Scholar] [CrossRef]
- Harmeling, S. Global Climate Risk Index 2010: Who is the Most Vulnerable? Weather-Related Loss Events Since 1990 and How Copenhagen Needs to Responds.; Germanwatch: Bonn, Germany, 2010. [Google Scholar]
- Eckstein, D.; Künzel, V.; Schäfer, L.; Winges, M. Global Climate Risk Index 2020 Who Suffers Most from Extreme Weather Events? Germanwatch: Bonn, Germany, 2020; ISBN 9783943704778. [Google Scholar]
- Sohoulande Djebou, D.C. Bridging drought and climate aridity. J. Arid Environ. 2017, 144. [Google Scholar] [CrossRef]
- Gavrilov, M.B.; An, W.; Xu, C.; Radaković, M.G.; Hao, Q.; Yang, F.; Guo, Z.; Perić, Z.; Gavrilov, G.; Marković, S.B. Independent aridity and drought pieces of evidence based on meteorological data and tree ring data in Southeast Banat, Vojvodina, Serbia. Atmosphere 2019, 10, 586. [Google Scholar] [CrossRef] [Green Version]
- Zhang, L.; Zhou, T. Drought over East Asia: A review. J. Clim. 2015, 28. [Google Scholar] [CrossRef]
- Wang, Q.; Yang, Y.; Liu, Y.; Tong, L.; Zhang, Q.-p.; Li, J. Assessing the Impacts of Drought on Grassland Net Primary Production at the Global Scale. Sci. Rep. 2019, 9. [Google Scholar] [CrossRef] [PubMed] [Green Version]
- Ciais, P.; Reichstein, M.; Viovy, N.; Granier, A.; Ogée, J.; Allard, V.; Aubinet, M.; Buchmann, N.; Bernhofer, C.; Carrara, A.; et al. Europe-wide reduction in primary productivity caused by the heat and drought in 2003. Nature 2005, 437. [Google Scholar] [CrossRef]
- Peng, D.; Zhang, B.; Wu, C.; Huete, A.R.; Gonsamo, A.; Lei, L.; Ponce-Campos, G.E.; Liu, X.; Wu, Y. Country-level net primary production distribution and response to drought and land cover change. Sci. Total Environ. 2017, 574, 65–77. [Google Scholar] [CrossRef]
- Smith, M.D. The ecological role of climate extremes: Current understanding and future prospects. J. Ecol. 2011, 99, 651–655. [Google Scholar] [CrossRef]
- Scott, R.L.; Hamerlynck, E.P.; Jenerette, G.D.; Moran, M.S.; Barron-Gafford, G.A. Carbon dioxide exchange in a semidesert grassland through drought-induced vegetation change. J. Geophys. Res. Biogeosci. 2010, 115. [Google Scholar] [CrossRef]
- Kreyling, J.; Beierkuhnlein, C.; Elmer, M.; Pritsch, K.; Radovski, M.; Schloter, M.; Wöllecke, J.; Jentsch, A. Soil biotic processes remain remarkably stable after 100-year extreme weather events in experimental grassland and heath. Plant Soil 2008, 308, 175–188. [Google Scholar] [CrossRef]
- The Ministry of Environment and Tourism. Third National Communication Under the United Nations Framework Convention on Climate Change; The Ministry of Environment and Tourism: Ulaanbaatar, Mongolia, 2018. [Google Scholar]
- Wu, X.; Kang, X.; Liu, W.; Cui, X.; Hao, Y.; Wang, Y. Using the DNDC model to simulate the potential of carbon budget in the meadow and desert steppes in Inner Mongolia, China. J. Soils Sediments 2018, 18, 63–75. [Google Scholar] [CrossRef]
- Vicente-Serrano, S.M. Evaluating the impact of drought using remote sensing in a Mediterranean, Semi-arid Region. Nat. Hazards 2007, 40. [Google Scholar] [CrossRef]
- Running, S.W.; Thornton, P.E.; Nemani, R.; Glassy, J.M. Global Terrestrial Gross and Net Primary Productivity from the Earth Observing System. In Methods in Ecosystem Science; Springer: New York, NY, USA, 2000; pp. 44–57. [Google Scholar]
- Vicente-Serrano, S.M.; Beguería, S.; López-Moreno, J.I. A multiscalar drought index sensitive to global warming: The standardized precipitation evapotranspiration index. J. Clim. 2010, 23, 1696–1718. [Google Scholar] [CrossRef] [Green Version]
- Palmer, W.C. Meteorological Drought; Research Paper No. 45; U.S Department of Commerce, Weather Bureau: Washington, DC, USA, 1965.
- Mckee, T.B.; Doesken, N.J.; Kleist, J. The relationship of drought frequency and duration to time scales. In Proceedings of the 8th Conference on Applied Climatology, 17–22 January, Anaheim, CA, USA; 1993; pp. 179–184. [Google Scholar]
- Huang, S.; Wang, L.; Wang, H.; Huang, Q.; Leng, G.; Fang, W.; Zhang, Y. Spatio-temporal characteristics of drought structure across China using an integrated drought index. Agric. Water Manag. 2019, 218, 182–192. [Google Scholar] [CrossRef]
- Ji, L.; Peters, A.J. Assessing vegetation response to drought in the northern Great Plains using vegetation and drought indices. Remote Sens. Environ. 2003, 87, 85–98. [Google Scholar] [CrossRef]
- Shi, Z.; Thomey, M.L.; Mowll, W.; Litvak, M.; Brunsell, N.A.; Collins, S.L.; Pockman, W.T.; Smith, M.D.; Knapp, A.K.; Luo, Y. Differential effects of extreme drought on production and respiration: Synthesis and modeling analysis. Biogeosciences 2014, 11, 621–633. [Google Scholar] [CrossRef] [Green Version]
- Bloor, J.M.G.; Bardgett, R.D. Stability of above-ground and below-ground processes to extreme drought in model grassland ecosystems: Interactions with plant species diversity and soil nitrogen availability. Perspect. Plant Ecol. Evol. Syst. 2012, 14, 193–204. [Google Scholar] [CrossRef]
- Huang, L.; He, B.; Chen, A.; Wang, H.; Liu, J.; Lu, A.; Chen, Z. Drought dominates the interannual variability in global terrestrial net primary production by controlling semi-arid ecosystems. Sci. Rep. 2016, 6. [Google Scholar] [CrossRef] [Green Version]
- Liu, J.; Chen, J.M.; Cihlar, J.; Park, W.M. A process-based boreal ecosystem productivity simulator using remote sensing inputs. Remote Sens. Environ. 1997, 62, 158–175. [Google Scholar] [CrossRef]
- Nandintsetseg, B.; Scott, J.; Goulden, C.E. Trends in extreme daily precipitation and temperature near Lake Hövsgöl, Mongolia. Int. J. Clim. 2007, 27, 341–347. [Google Scholar] [CrossRef]
- Johnson, D.A.; Sheehy, D.P.; Miller, D.; Damiran, D. Mongolian rangelands in transition. Sécheresse 2006, 17, 133–141. [Google Scholar]
- Urgamal, M.; Gundegmaa, V.; Sh, B.; Oyuntsetseg, B.; Darikhand, D.; Munkh-Erdene, T. Additions to the vascular flora of Mongolia—IV. Proc. Mong. Acad. Sci. 2019. [Google Scholar] [CrossRef] [Green Version]
- Anyamba, A.; Tucker, C.J. Historical perspectives on AVHRR NDVI and vegetation drought monitoring. In Remote Sensing of Drought: Innovative Monitoring Approaches; NASA Publications: Washington, DC, USA, 2012; pp. 23–49. [Google Scholar]
- Chopra, P. Drought Risk Assessment Using Remote Sensing and GIS: A Case Study of Gujarat; ITC: Enschede, The Netherlands, 2006. [Google Scholar]
- Anyamba, A.; Tucker, C.J.; Eastman, J.R. NDVI anomaly patterns over Africa during the 1997/98 ENSO warm event. Int. J. Remote Sens. 2001, 22, 1847–1859. [Google Scholar] [CrossRef]
- Vaani, N.; Porchelvan, P. Assessment of long term agricultural drought in Tamilnadu, India using NDVI anomaly. Disaster Adv. 2017, 10, 1–10. [Google Scholar]
- Zhou, W.; Li, J.; Yue, T. Remote Sensing Monitoring and Evaluation of Degraded Grassland in China Accounting of Grassland Carbon Source and Carbon Sink; Springer Nature Singapore Pte Ltd.: Singapore, 2020; ISBN 9789813293816. [Google Scholar]
- Chen, J.M.; Liu, J.; Cihlar, J.; Goulden, M.L. Daily canopy photosynthesis model through temporal and spatial scaling for remote sensing applications. Ecol. Modell. 1999, 124, 99–119. [Google Scholar] [CrossRef] [Green Version]
- Liu, J.; Chen, J.M.; Cihlar, J.; Chen, W. Net primary productivity mapped for Canada at 1-km resolution. Glob. Ecol. Biogeogr. 2002, 11, 115–129. [Google Scholar] [CrossRef] [Green Version]
- Ryan, M.G.; Lavigne, M.B.; Gower, S.T. Annual carbon cost of autotrophic respiration in boreal forest ecosystems in relation to species and climate. J. Geophys. Res. Atmos. 1997, 102, 28871–28883. [Google Scholar] [CrossRef] [Green Version]
- Ryan, M.G. A simple method for estimating gross carbon budgets for vegetation in forest ecosystems. Tree Physiol. 1991, 9, 255–266. [Google Scholar] [CrossRef]
- Lai, C.; Li, J.; Wang, Z.; Wu, X.; Zeng, Z.; Chen, X.; Lian, Y.; Yu, H.; Wang, P.; Bai, X. Drought-induced reduction in net primary productivity across mainland China from 1982 to 2015. Remote Sens. 2018, 10, 1433. [Google Scholar] [CrossRef] [Green Version]
- Berrisford, P.; Dee, D.P.; Poli, P.; Brugge, R.; Fielding, K.; Fuentes, M.; Kållberg, P.; Kobayashi, S.; Uppala, S.; Simmons, A. The ERA-Interim Archive Version 2.0; ERA Report; ECMWF: Reading, UK, 2011. [Google Scholar]
- Myneni, R.; Knyazikhin, Y.; Park, T. MCD15A3H MODIS/Terra+Aqua Leaf Area Index/FPAR 4-day L4 Global 500m SIN Grid V006 [Data set]. Available online: https://lpdaac.usgs.gov/products/mcd15a3hv006/ (accessed on 18 September 2019).
- Defourny, P.; Bontemps, S.; Lamarche, C.; Brockmann, C.; Boettcher, M.; Wevers, J.; Kirches, G.; Santoro, M.; ESA. Land Cover CCI Product User Guide—Version 2.0; UCL-Geomatics: Louvain-La-Neuve, Belgium, 2017. [Google Scholar]
- Nasa Land Processes Distributed Active Archive Center. NASA-JPL NASA Shuttle Radar Topography Mission Global 1 Arc Second Number; NASA Land Processes Distributed Active Archive Center: Sioux Falls, DS, USA, 2013.
- Dimiceli, C.; Carroll, M.; Sohlberg, R.; Kim, D.H.; Kelly, M.; Townshend, J.R.G. MOD44B MODIS/Terra Vegetation Continuous Fields Yearly L3 Global 250m SIN Grid V006; NASA EOSDIS L. Process. DAAC; NASA: Sioux Falls, DS, USA, 2015. [Google Scholar] [CrossRef]
- Group Global Soil Data Task Global Gridded Surfaces of Selected Soil Characteristics (IGBP-DIS); ORNL Distributed Active Archive Center: Oak Ridge, TN, USA, 2000.
- Raich, J.W.; Rastetter, E.B.; Melillo, J.M.; Kicklighter, D.W.; Steudler, P.A.; Grace, A.L.; III, B.M.; Vörösmarty, C.J. Potential net primary productivity in South America: Application of a global model. Ecol. Appl. 1991, 1, 399–429. [Google Scholar] [CrossRef] [Green Version]
- Lin, C.; Dugarsuren, N. Deriving the Spatiotemporal NPP Pattern in Terrestrial Ecosystems of Mongolia Using MODIS Imagery. Photogramm. Eng. Remote Sens. 2015, 81, 587–598. [Google Scholar] [CrossRef]
- Mann, H.B. Non-Parametric Test Against Trend. Econometrica 1945, 13, 245–259. [Google Scholar] [CrossRef]
- Dorjsuren, M.; Liou, Y.A.; Cheng, C.H. Time series MODIS and in situ data analysis for Mongolia drought. Remote Sens. 2016, 8, 509. [Google Scholar] [CrossRef] [Green Version]
- Chang, S.; Wu, B.; Yan, N.; Davdai, B.; Nasanbat, E. Suitability assessment of satellite-derived drought indices for Mongolian grassland. Remote Sens. 2017, 9, 650. [Google Scholar] [CrossRef] [Green Version]
- Li, Z.; Chen, Y.; Wang, Y.; Fang, G. Dynamic changes in terrestrial net primary production and their effects on evapotranspiration. Hydrol. Earth Syst. Sci. 2016, 20, 2169–2178. [Google Scholar] [CrossRef] [Green Version]
- Polley, H.W.; Bailey, D.W.; Nowak, R.S.; Stafford-Smith, M. Ecological Consequences of Climate Change on Rangelands; University of Nevada, Reno: Reno, NV, USA, 2017. [Google Scholar]
- Bao, G.; Chen, J.; Chopping, M.; Bao, Y.; Bayarsaikhan, S.; Dorjsuren, A.; Tuya, A.; Jirigala, B.; Qin, Z. Dynamics of net primary productivity on the Mongolian Plateau: Joint regulations of phenology and drought. Int. J. Appl. Earth Obs. Geoinf. 2019, 81, 85–97. [Google Scholar] [CrossRef]
- Wang, J.; Wei, H.; Cheng, K.; Ochir, A.; Davaasuren, D.; Li, P.; Shun Chan, F.K.; Nasanbat, E. Spatio-Temporal Pattern of Land Degradation from 1990 to 2015 in Mongolia. Environ. Dev. 2020, 34, 100497. [Google Scholar] [CrossRef]
- Taylor, P.G.; Cleveland, C.C.; Wieder, W.R.; Sullivan, B.W.; Doughty, C.E.; Dobrowski, S.Z.; Townsend, A.R. Temperature and rainfall interact to control carbon cycling in tropical forests. Ecol. Lett. 2017, 20, 779–788. [Google Scholar] [CrossRef] [Green Version]
- Zhang, J.; Zhang, Y.; Qin, S.; Wu, B.; Wu, X.; Zhu, Y.; Shao, Y.; Gao, Y.; Jin, Q.; Lai, Z. Effects of seasonal variability of climatic factors on vegetation coverage across drylands in northern China. L. Degrad. Dev. 2018, 29. [Google Scholar] [CrossRef]
- Chen, G.; Tian, H.; Zhang, C.; Liu, M.; Ren, W.; Zhu, W.; Chappelka, A.H.; Prior, S.A.; Lockaby, G.B. Drought in the Southern United States over the 20th century: Variability and its impacts on terrestrial ecosystem productivity and carbon storage. Clim. Chang. 2012, 114, 379–397. [Google Scholar] [CrossRef]


| Category | NDVI Anomaly Values (%) | Category | NDVI Anomaly Values (%) |
|---|---|---|---|
| Extreme drought | Below −50 | Mild wet | 0 to 10 |
| Severe drought | −25 to −50 | Moderate wet | 10 to 25 |
| Moderate drought | −10 to −25 | Severe wet | 25 to 50 |
| Mild drought | 0 to −10 | Extreme wet | Above 50 |
| S.N. | Complete Name | Format | Units | Source | Spatial Resolution | Temporal Resolution | Reference |
|---|---|---|---|---|---|---|---|
| 1 | Precipitation | img | mm | ECMWF | 12.5 km | Twice per day | [52] |
| 2 | Net solar radiation | img | W·m−2 | ECMWF | 12.5 km | Twice per day | [52] |
| 3 | Net thermal radiation | img | W·m−2 | ECMWF | 12.5 km | Twice per day | [52] |
| 4 | Temperature | img | °C | ECMWF | 12.5 km | Twice per day | [52] |
| 5 | Snow depth | img | mm | ECMWF | 12.5 km | Twice per day | [52] |
| 6 | Net solar radiation Downward | img | W·m−2 | ECMWF | 12.5 km | Twice per day | [52] |
| 7 | Dew point temperature | img | °C | ECMWF | 12.5 km | Twice per day | [52] |
| 8 | Wind speed | img | ms−1 | ECMWF | 12.5 km | Twice per day | [52] |
| 10 | Leaf area index | tiff | NA | MODIS | 500 m | Twice per day | [53] |
| 11 | Vegetation type (C3) | tiff | NA | ESA | 300 m | Annual | [54] |
| 12 | Land cover | tiff | NA | ESA | 300 m | Annual | [54] |
| 13 | DEM | tiff | m | SRTM | 30 m | One | [55] |
| 14 | Latitude | tiff | °(Degree) | SRTM | 30 m | One | [55] |
| 15 | Tree cover | tiff | % | MODIS | 250 m | Yearly | [56] |
| 16 | Field capacity | tiff | KPA kg−1 | DAAC | 8 km | One | [57] |
| 17 | Wilting point | tiff | KPA kg−1 | DAAC | 8 km | One | [57] |
| Variable | Nonsignificant Increase (%) | Significant Increase (%, p < 0.05) | Nonsignificant Decrease (%) | Significant Decrease (%, p < 0.05) |
|---|---|---|---|---|
| NPP | 56.37 | 7.23 | 46.63 | 2.60 |
| Precipitation | 51.15 | 0.07 | 48.85 | 1.39 |
| Temperature | 99.88 | 20.60 | 0.12 | - |
| Net radiation | 9.13 | - | 90.86 | 59.14 |
| Year | Normal | Mild | Moderate | Severe | Extreme |
|---|---|---|---|---|---|
| 2003 | 58.95 | 26.23 | 13.24 | 1.41 | 0.16 |
| 2004 | 39.99 | 33.59 | 20.20 | 6.12 | 0.09 |
| 2005 | 31.63 | 32.21 | 29.34 | 6.70 | 0.12 |
| 2006 | 33.01 | 40.19 | 21.58 | 5.08 | 0.14 |
| 2007 | 36.58 | 20.96 | 25.04 | 17.01 | 0.41 |
| 2008 | 45.48 | 31.25 | 18.47 | 4.67 | 0.14 |
| 2009 | 28.48 | 35.57 | 27.43 | 8.34 | 0.19 |
| 2010 | 49.62 | 32.87 | 15.15 | 2.24 | 0.12 |
| 2011 | 66.86 | 25.70 | 6.83 | 0.50 | 0.11 |
| 2012 | 72.81 | 22.06 | 4.64 | 0.37 | 0.13 |
| 2013 | 73.64 | 20.64 | 5.19 | 0.37 | 0.16 |
| 2014 | 71.27 | 21.43 | 6.89 | 0.30 | 0.11 |
| 2015 | 58.81 | 28.42 | 11.74 | 0.92 | 0.12 |
| 2016 | 74.69 | 14.97 | 7.94 | 2.30 | 0.11 |
| 2017 | 27.56 | 36.32 | 31.33 | 4.72 | 0.06 |
| 2018 | 64.59 | 21.39 | 11.98 | 1.92 | 0.11 |
Publisher’s Note: MDPI stays neutral with regard to jurisdictional claims in published maps and institutional affiliations. |
© 2021 by the authors. Licensee MDPI, Basel, Switzerland. This article is an open access article distributed under the terms and conditions of the Creative Commons Attribution (CC BY) license (https://creativecommons.org/licenses/by/4.0/).
Share and Cite
Nanzad, L.; Zhang, J.; Tuvdendorj, B.; Yang, S.; Rinzin, S.; Prodhan, F.A.; Sharma, T.P.P. Assessment of Drought Impact on Net Primary Productivity in the Terrestrial Ecosystems of Mongolia from 2003 to 2018. Remote Sens. 2021, 13, 2522. https://0-doi-org.brum.beds.ac.uk/10.3390/rs13132522
Nanzad L, Zhang J, Tuvdendorj B, Yang S, Rinzin S, Prodhan FA, Sharma TPP. Assessment of Drought Impact on Net Primary Productivity in the Terrestrial Ecosystems of Mongolia from 2003 to 2018. Remote Sensing. 2021; 13(13):2522. https://0-doi-org.brum.beds.ac.uk/10.3390/rs13132522
Chicago/Turabian StyleNanzad, Lkhagvadorj, Jiahua Zhang, Battsetseg Tuvdendorj, Shanshan Yang, Sonam Rinzin, Foyez Ahmed Prodhan, and Til Prasad Pangali Sharma. 2021. "Assessment of Drought Impact on Net Primary Productivity in the Terrestrial Ecosystems of Mongolia from 2003 to 2018" Remote Sensing 13, no. 13: 2522. https://0-doi-org.brum.beds.ac.uk/10.3390/rs13132522