
Understanding the Influence of Building Loads on Surface Settlement: A Case Study in the Central Business District of Beijing Combining Multi-Source Data

 ,
,
Abstract
:
1. Introduction
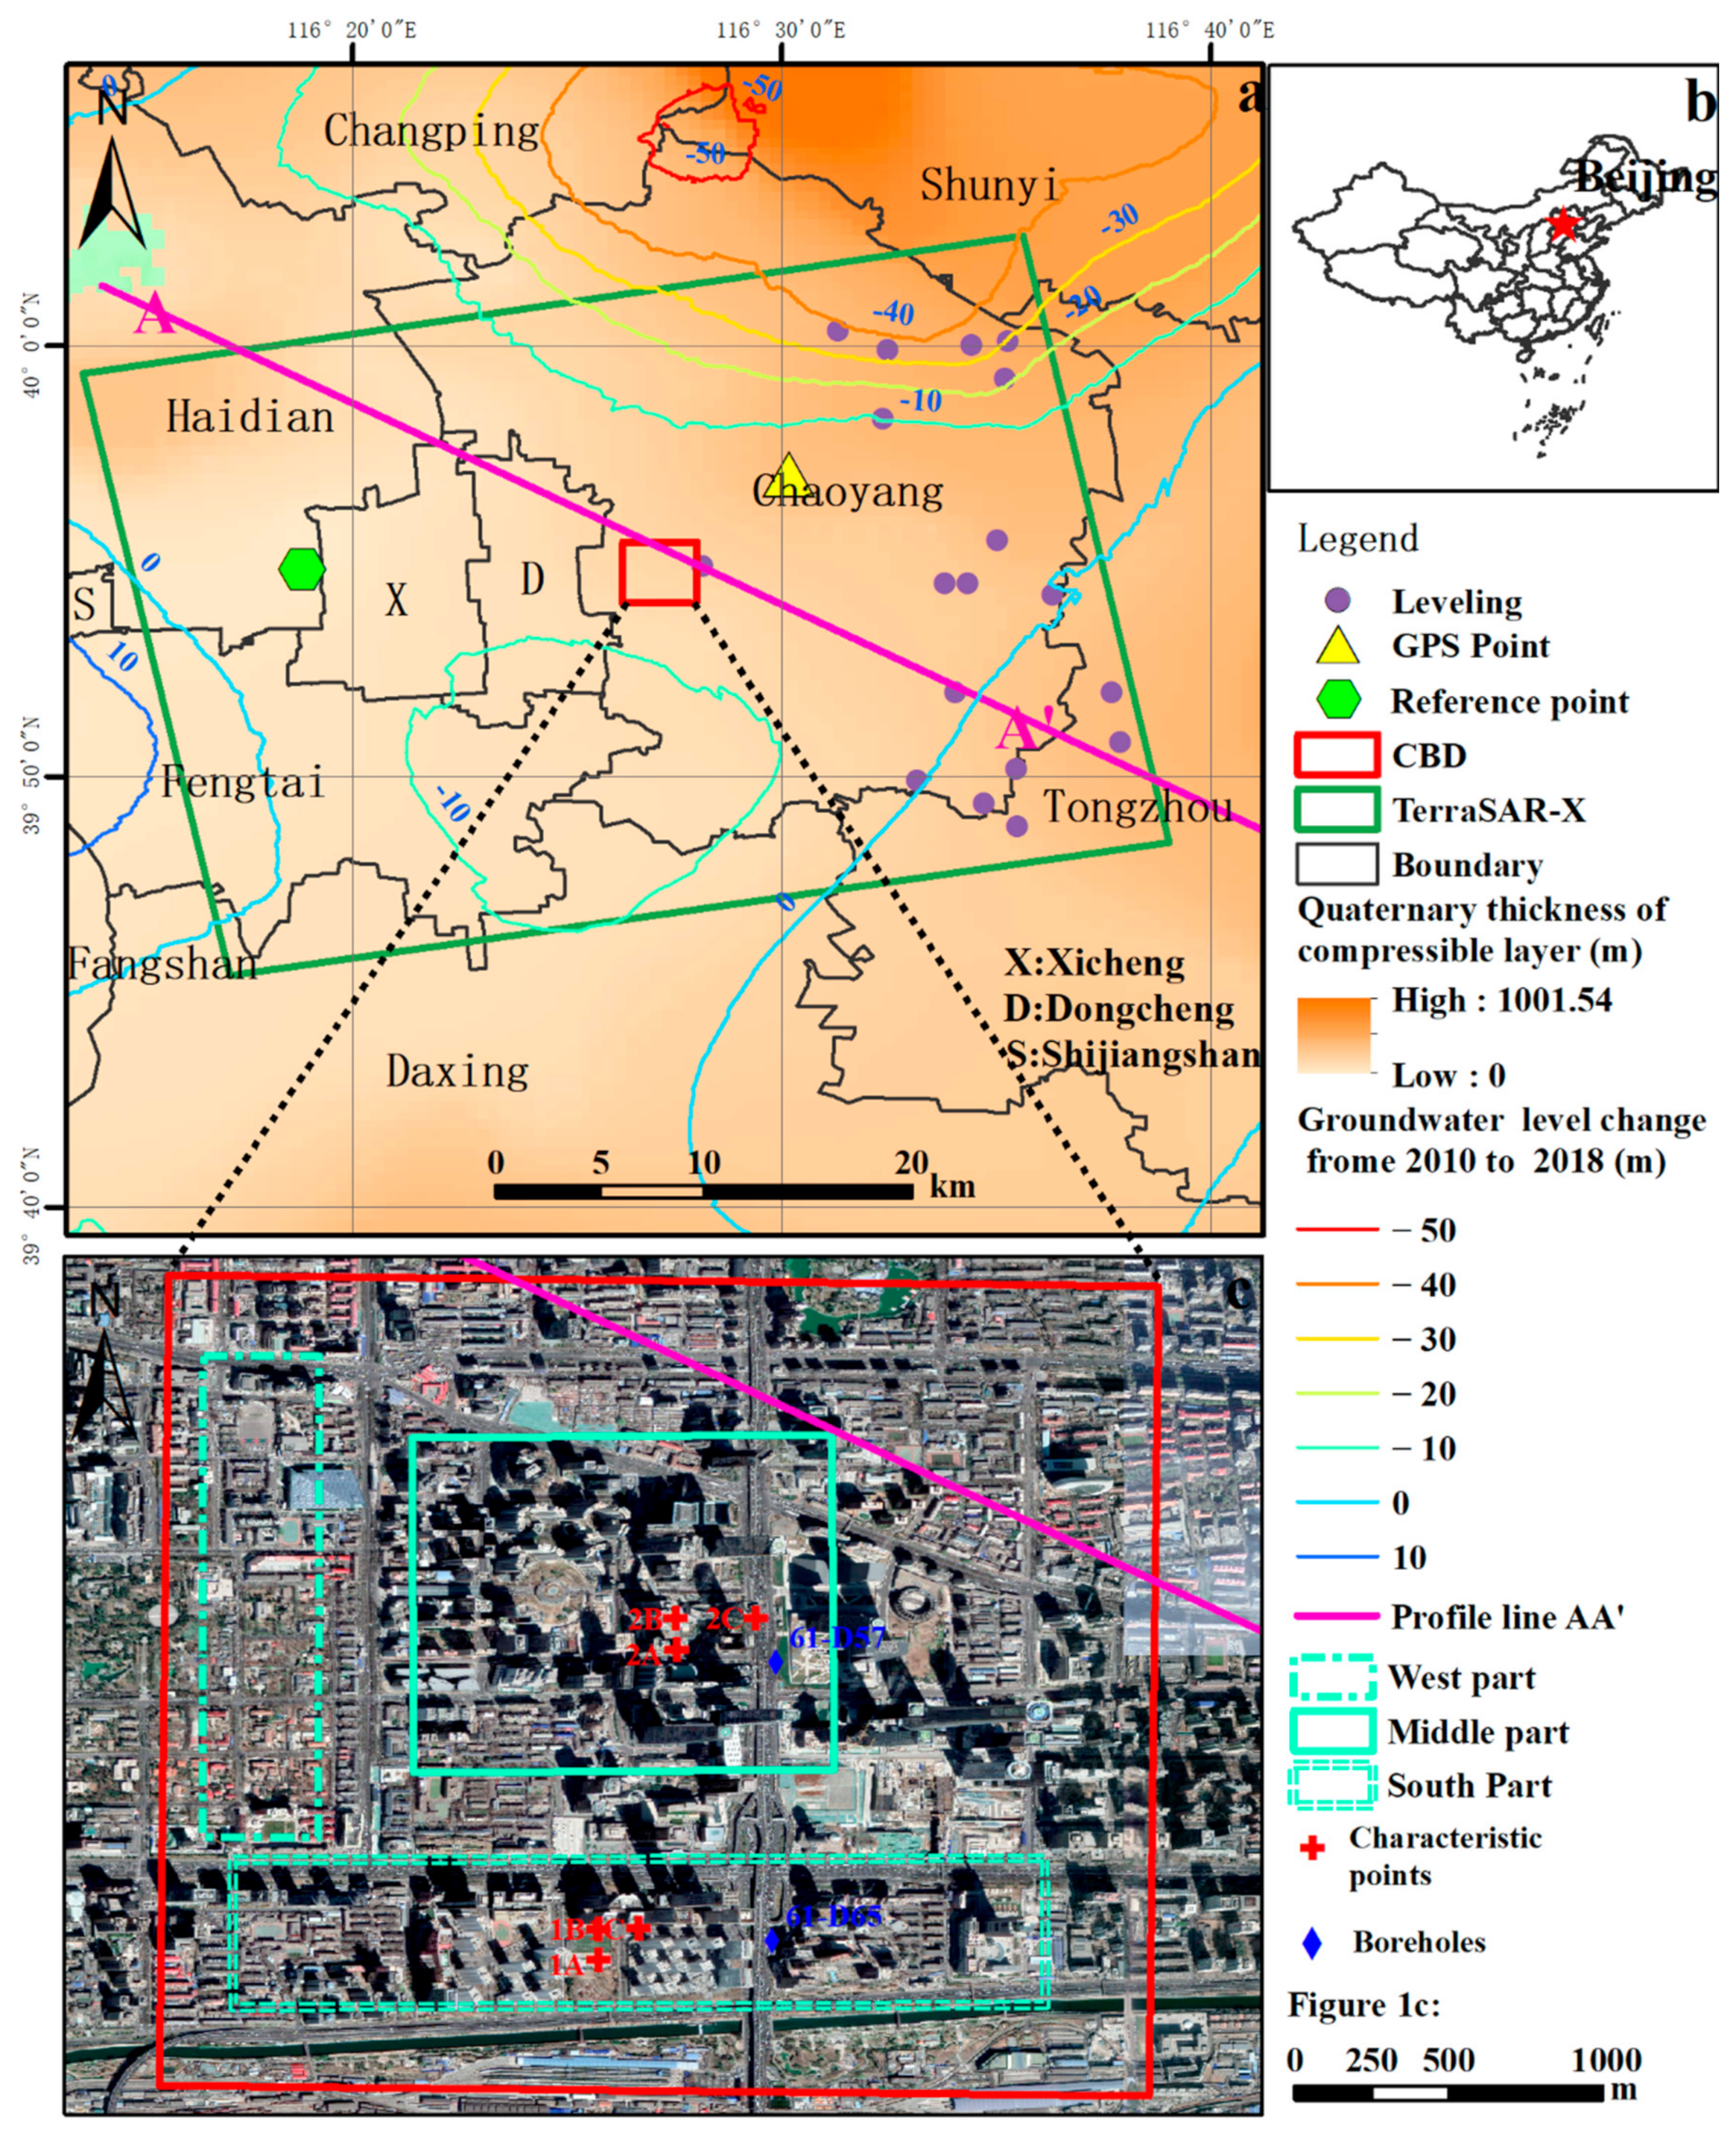
2. Study Area
3. Methodology and Data
3.1. Data Source
3.2. SARPROZ Software Processing of the TerraSAR-X Dataset
3.3. Calculation of Additional Stress Generated by Building Loads
3.4. Calculating the Foundation Settlement Caused by Additional Stress Generated by Building Loads by Using Layered Summation Method
4. Results
4.1. Surface Settlement Measured by PS-InSAR
4.2. Accuracy Verification of PS-InSAR Results
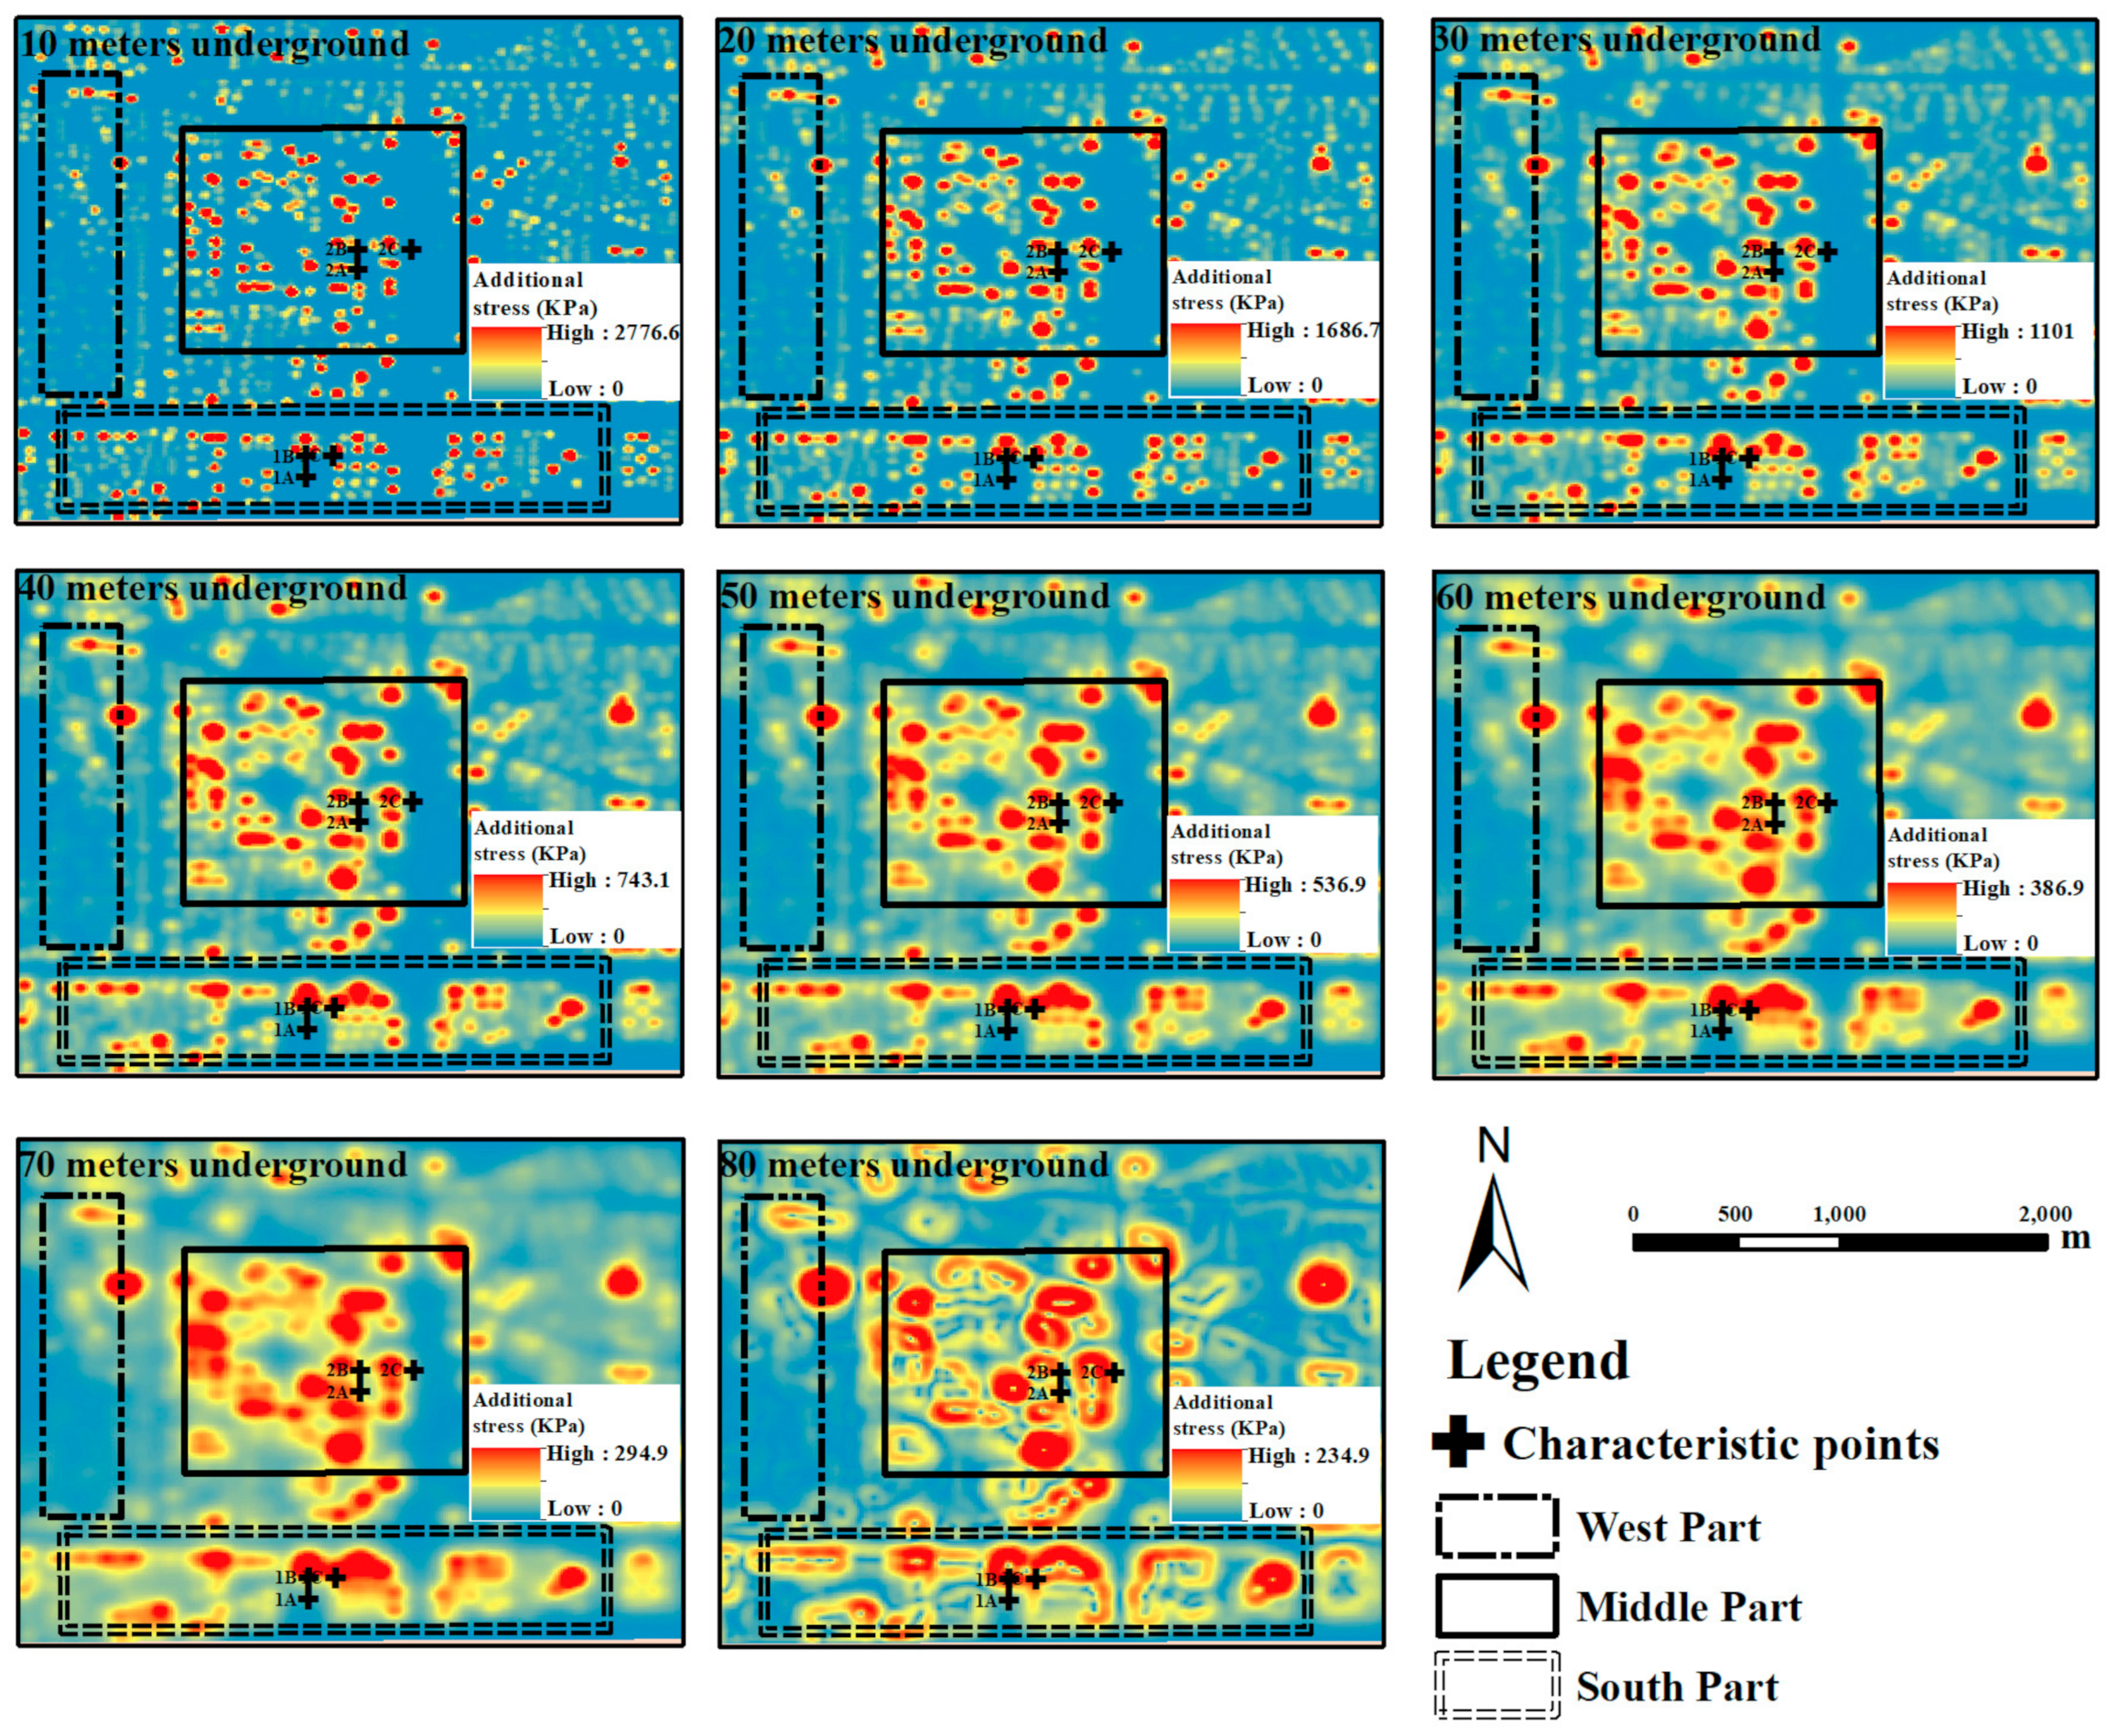
4.3. Additional Stresses Induced by Building Loads
5. Discussion
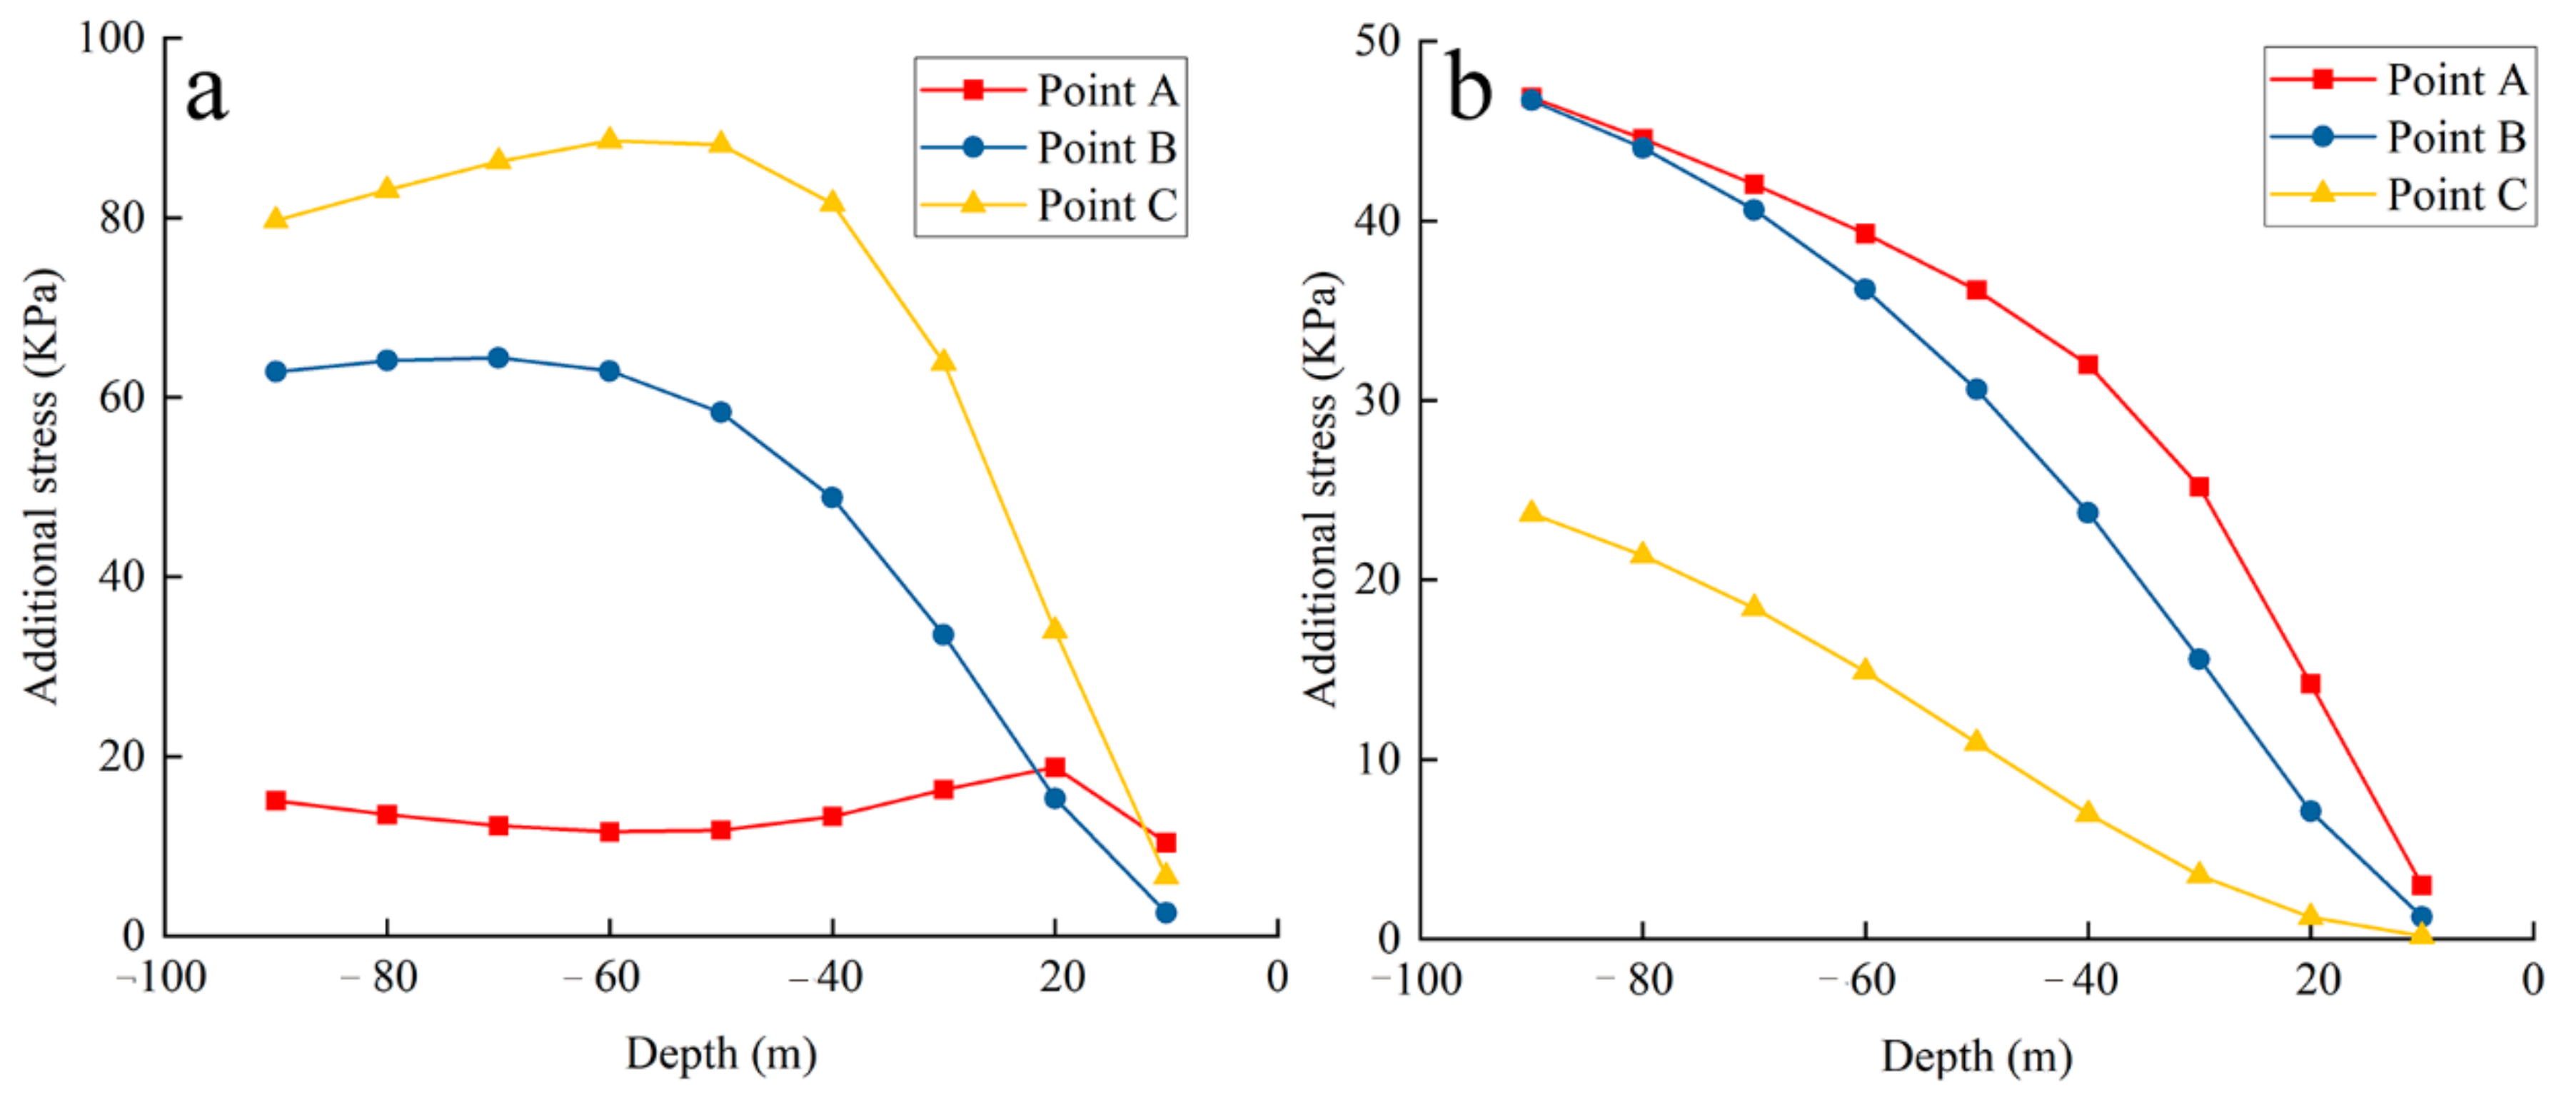
5.1. Depth of the Influence of Additional Stress Generated by Building Loads
5.2. Response Relationship between Foundation Settlement and Static Load of Buildings
5.2.1. Spatial Response Relationship between Foundation Settlement Rate and Static Load of Buildings
5.2.2. Quantitative Response Relationship between Foundation Settlement Rate and Static Load of Buildings
5.3. Response Relationship between Foundation Settlement Gradient and Additional Stress Gradient
5.3.1. Spatial Response Relationship between Foundation Settlement Rate Gradient and Additional Stress Gradient
5.3.2. Quantitative Response Relationship between Foundation Settlement Rate Gradient and Additional Stress Gradient
6. Conclusions
- (1)
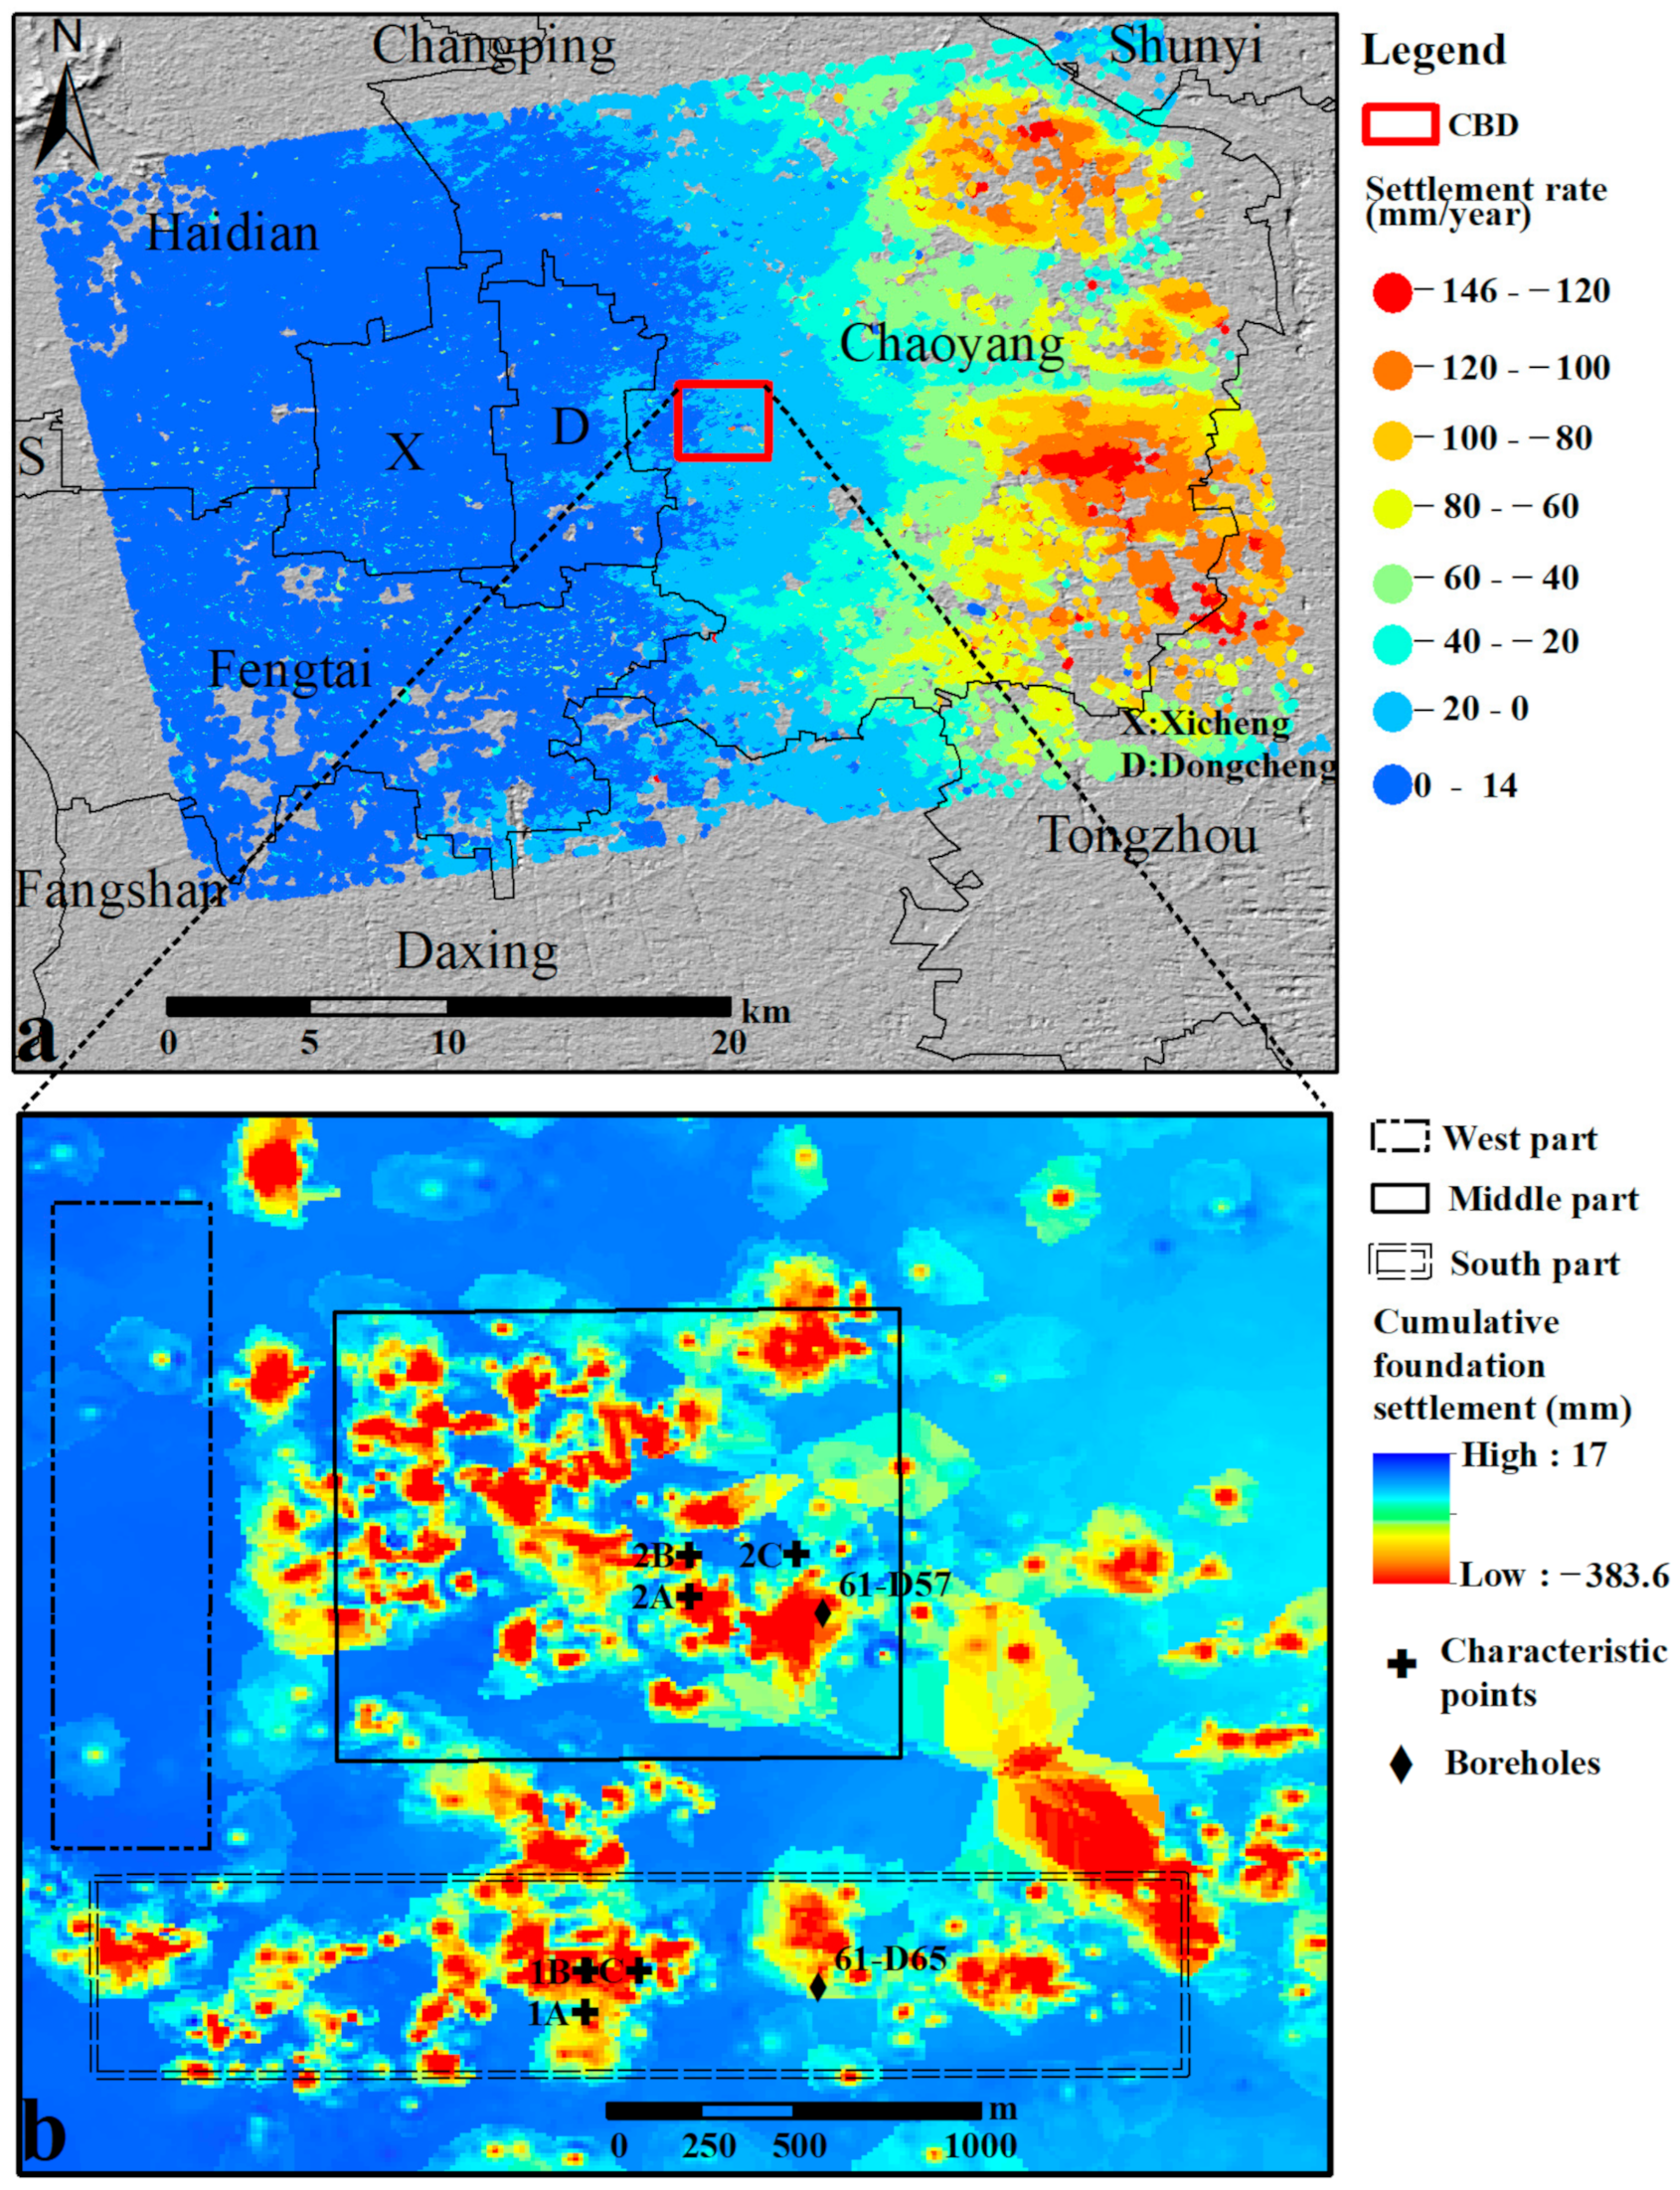
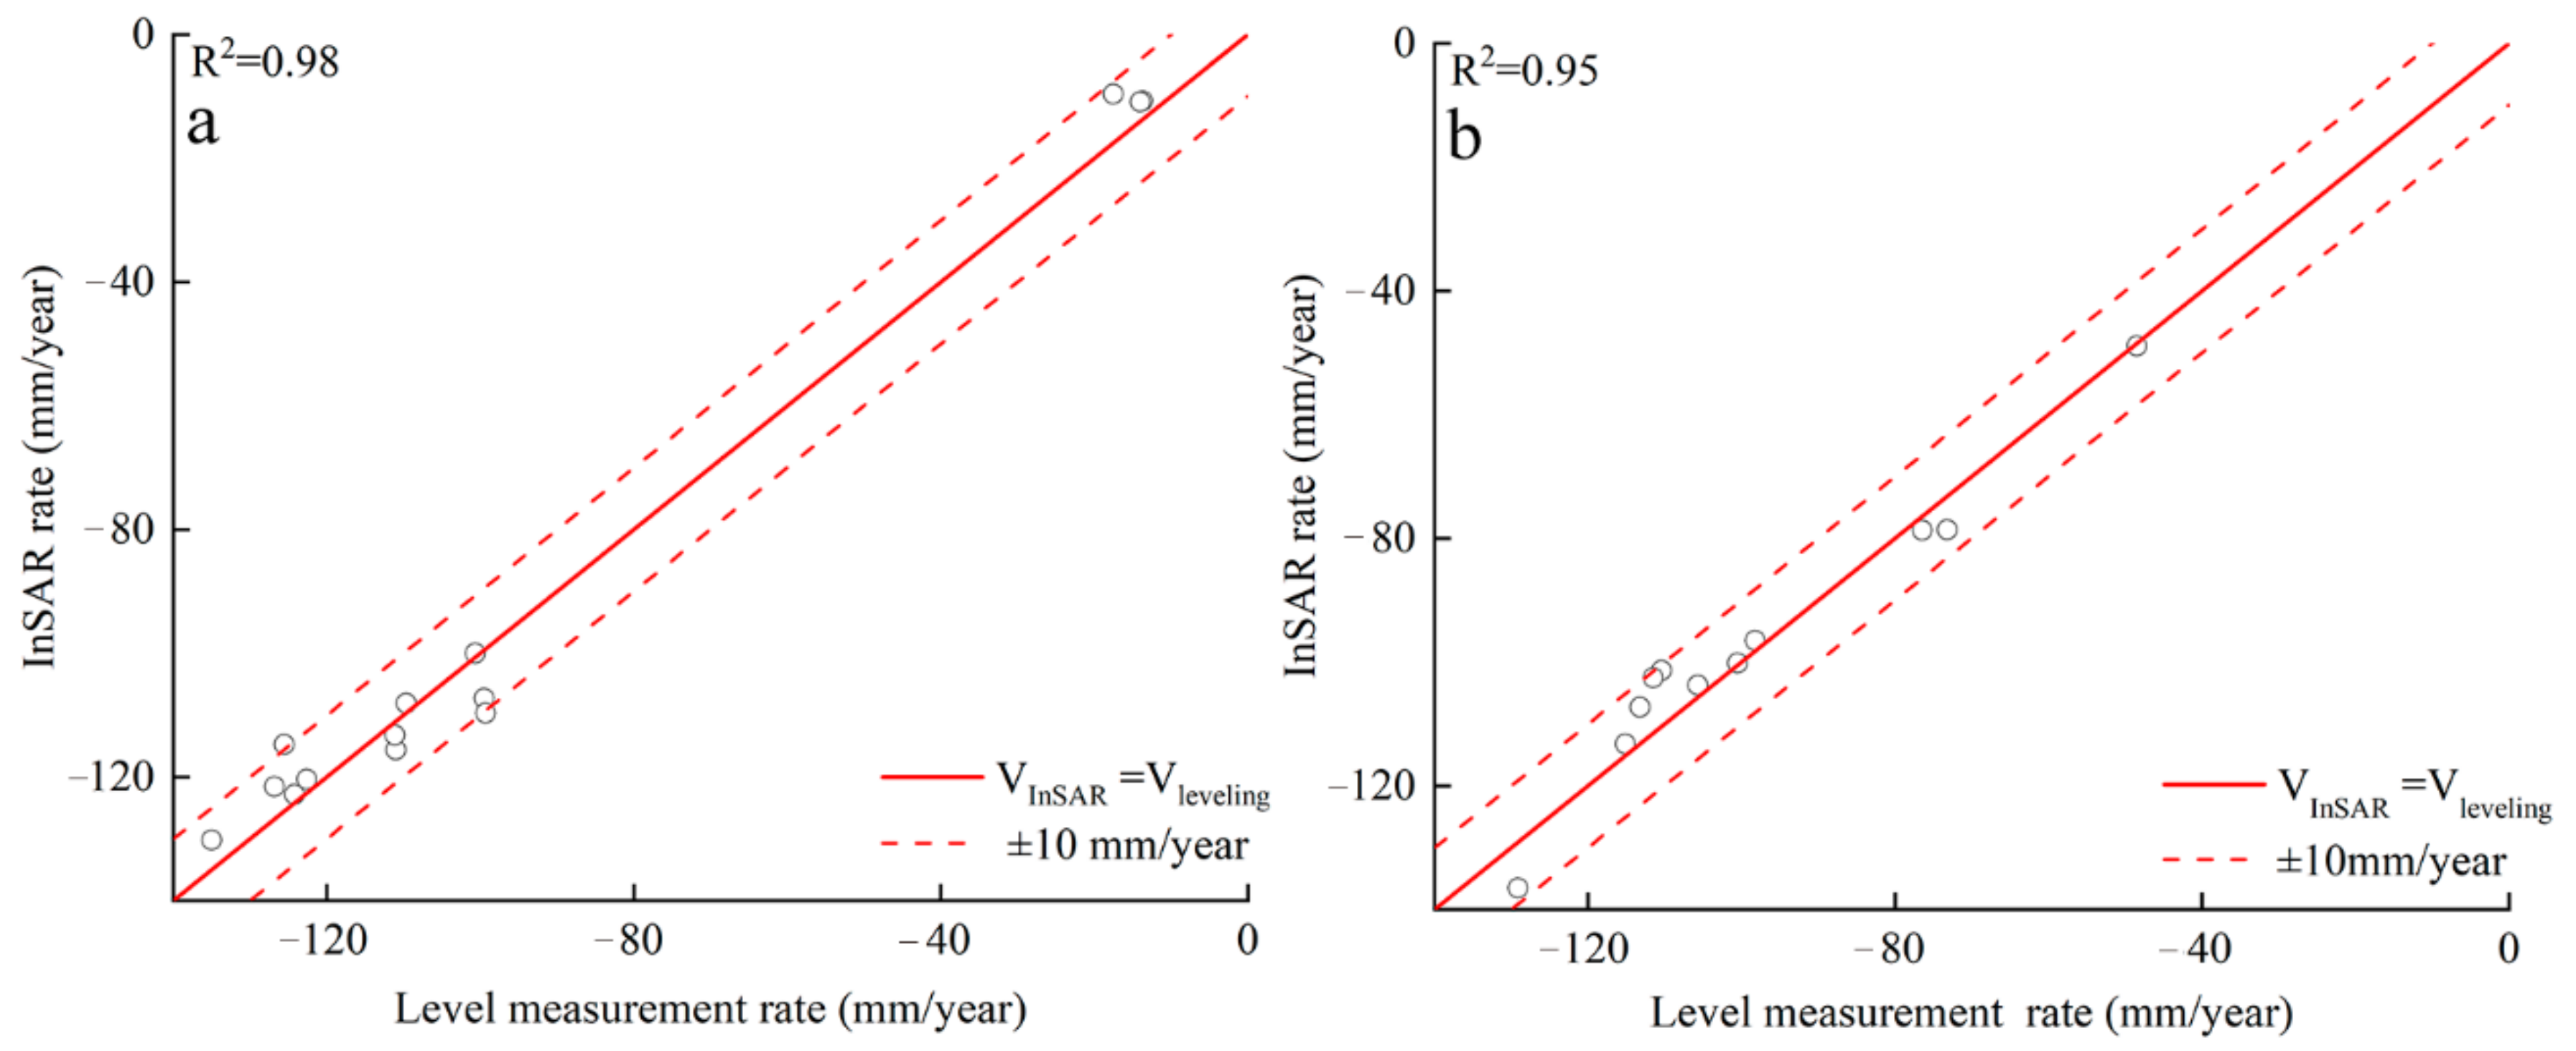
- The PS-InSAR results showed that the average surface settlement rate varied from −47.9 to −0.5 mm/year in the middle and south of the CBD and that the average foundation settlement rate varied from −5.9 to 2 mm/year in the west part during the observation periods. The deformation rates derived by the PS-InSAR technology agreed well with those of the leveling benchmarks, and the correlation coefficient and mean deviation were 0.98 and 3.8 mm/year for 2011 to 2013, and 0.95 and 4.2 mm/year for 2013 to 2015, respectively.
- (2)
- Comparing the corresponding conditions, we found that the influence depth of the additional stresses generated by building loads on foundation settlement was 74.9 m in the CBD.
- (3)
- By comparing the spatial distribution of the additional stress generated by building loads and that of the foundation settlement rate, we found a positive response relationship between them. By analyzing two sets of characteristic points, we found that a characteristic point with greater additional stress generally has a larger settlement rate. We used the same method to explore the response relationship between uneven foundation settlement and additional stress gradients and also found a positive correlation between them.
Supplementary Materials
Author Contributions
Funding
Institutional Review Board Statement
Informed Consent Statement
Data Availability Statement
Acknowledgments
Conflicts of Interest
References
- Li, F.; Gong, H.; Chen, B.; Zhou, C.; Guo, L. Analysis of the contribution rate of the influencing factors to land subsidence in the Eastern Beijing Plain, China based on extremely randomized trees (ERT) method. Remote Sens. 2020, 12, 2963. [Google Scholar] [CrossRef]
- Buckley, S.; Rosen, P.; Hensley, S.; Byron, D. Land subsidence in Houston, Texas, measured by radar interferometry and constrained by extensometers. J. Geophys. Res. Solid Earth 2003, 108, 243–251. [Google Scholar] [CrossRef]
- Solari, L.; Ciampalini, A.; Raspini, F.; Bianchini, S.; Moretti, S. PSInSAR analysis in the Pisa urban area (Italy): A case study of subsidence related to stratigraphical factors and urbanization. Remote Sens. 2016, 8, 120. [Google Scholar] [CrossRef] [Green Version]
- Ortega-Guerrero, A.; Rudolph, D.L.; Cherry, J.A. Analysis of long-term land subsidence near Mexico City: Field investigations and predictive modeling. Water Resour. Res. 1999, 35, 3327–3341. [Google Scholar] [CrossRef]
- Ferretti, A. Permanent scatterers in SAR interferometry. IEEE Trans. Geosci. Remote Sens. 2001, 39, 8–20. [Google Scholar] [CrossRef]
- Tosi, L.; Teatini, P.; Strozzi, T. Natural versus anthropogenic subsidence of Venice. Sci. Rep. 2013, 3, 2710. [Google Scholar] [CrossRef] [Green Version]
- Chen, W.; Gong, H.; Chen, B.; Liu, K.; Gao, M.; Zhou, C. Spatiotemporal evolution of land subsidence around a subway using InSAR time-series and the entropy method. GISci. Remote Sens. 2017, 54, 78–94. [Google Scholar] [CrossRef]
- Guan, C.; Yi, Z.; Runqiang, Z.; Yang, Z.; Chen, X.; Zhao, F.; Meng, X. Detection of land subsidence associated with land creation and rapid urbanization in the chinese loess plateau using time series InSAR: A case study of Lanzhou new district. Remote Sens. 2018, 10, 270. [Google Scholar]
- Yang, Q.; Ke, Y.; Zhang, D.; Zhang, D.; Chen, B.; Gong, H.; Lv, M.; Zhu, L.; Li, X. Multi-scale analysis of the relationship between land subsidence and buildings: A case study in an Eastern Beijing urban area using the PS-InSAR technique. Remote Sens. 2018, 10, 1006. [Google Scholar] [CrossRef] [Green Version]
- Jiao, S.; Yu, J.; Simic, M.A.; Li, X.; Liu, L. Assessing the impact of building volume on land subsidence in the central business district of Beijing with SAR tomography. Can. J. Remote Sens. 2017, 43, 177–193. [Google Scholar] [CrossRef]
- Liu, Y.; Li, J.; Fasullo, J.; Galloway, D.L. Land subsidence contributions to relative sea level rise at tide gauge Galveston Pier 21, Texas. Sci. Rep. 2020, 10, 17905. [Google Scholar] [CrossRef]
- Galloway, D.; Jones, D.R.; Ingebritsen, S.E. Land Subsidence in the United States. US Geological Survey Circular; USGS Publications: Washington, DC, USA, 1999; p. 1182. [Google Scholar]
- Yan, X.; Gong, S.; Zeng, Z. Relationship between building density and land subsidence in Shanghai urban zone. Hydrogeol. Eng. Geol. 2002, 29, 21–25. (In Chinese) [Google Scholar]
- Jie, Y.; Gao, Y.; Li, G.; Liu, Y.; Sun, T. Discussion on influence depth of large-scale load in urban construction. Ind. Construct. 2007, 37, 57–62. (In Chinese) [Google Scholar]
- Tang, Y.; Cui, Z.; Wang, J.; Lu, C.; Yan, X. Model test study of land subsidence caused by high-rise building group in Shanghai. Bull. Eng. Geol. Environ. 2008, 67, 173–179. [Google Scholar] [CrossRef]
- Cui, Z.; Tang, Y.; Yan, X. Centrifuge modeling of land subsidence caused by the high-rise building group in the soft soil area. Environ. Earth Sci. 2010, 59, 1819–1826. [Google Scholar] [CrossRef]
- Gong, S.; Li, C.; Yang, S. The microscopic characteristics of Shanghai soft clay and its effect on soil body deformation and land subsidence. Environ. Geol. 2009, 56, 1051–1056. [Google Scholar] [CrossRef]
- Chen, B.; Gong, H.; Li, X.; Lei, K.; Ke, Y.; Duan, G.; Zhou, C. Spatial correlation between land subsidence and urbanization in Beijing, China. Nat. Hazards 2015, 75, 2637–2652. [Google Scholar] [CrossRef]
- Parsons, T. The Weight of cities: Urbanization effects on earth’s subsurface. AGU Adv. 2021, 2, 1–15. [Google Scholar] [CrossRef]
- Zhu, L.; Gong, H.; Li, X.; Wang, R.; Chen, B.; Dai, Z.; Teatini, P. Land subsidence due to groundwater withdrawal in the northern Beijing plain, China. Eng. Geol. 2015, 193, 243–255. [Google Scholar] [CrossRef]
- Galloway, D.; Hudnut, K.; Ingebritsen, S.; Phillips, S.; Peltzer, G.; Rogez, F.; Rosen, P. Detection of aquifer system compaction and land subsidence using interferometric synthetic aperture radar, Antelope Valley, Mojave Desert, California. Water Resour. Res. 1998, 34, 2573–2585. [Google Scholar] [CrossRef]
- Chen, B.; Gong, H.; Chen, Y.; Li, X.; Zhou, C.; Lei, K.; Zhu, L.; Duan, L.; Zhao, X. Land subsidence and its relation with groundwater aquifers in Beijing Plain of China. Sci. Total Environ. 2020, 735, 139111. [Google Scholar] [CrossRef]
- Chen, B.; Gong, H.; Lei, K.; Li, J.; Zhou, C.; Gao, M.; Guan, H.; Lv, W. Land subsidence lagging quantification in the main exploration aquifer layers in Beijing plain, China. Int. J. Appl. Earth Obs. Geoinform. 2019, 75, 54–67. [Google Scholar] [CrossRef]
- Luo, Y.; Hu, R.; Ye, C.; Lei, K.; Tian, F.; Cui, W.; Wang, R.; Zhao, L.; Wang, X. The study of preliminary division of land subsidence units. J. Eng. Geol. 2017, 25, 95–107. [Google Scholar]
- Zhao, X.; Chen, B.; Gong, H.; Zhou, C.; Li, X.; Lei, K.; Ke, Y. Land subsidence along the Beijing–Tianjin Intercity Railway during the period of the South-to-North Water Diversion Project. Int. J. Remote Sens. 2020, 41, 4447–4469. [Google Scholar] [CrossRef]
- Zhang, W. Deformation of and numerical analysis on foundation of Wangjingxi Station on Line 13 of Beijing metro caused by shield tunneling below. Tunnel Construct. 2014, 3, 67–78. (In Chinese) [Google Scholar]
- Boussinesq, J. Application des Potentiels a l’Etude de l’Equilibre et du Movement des Elastique; Guthier Villard: Paris, France, 1885. [Google Scholar]


| Parameter | Value |
|---|---|
| Orbit direction | Descending |
| Polarization | HH |
| Spatial resolution (m) | 3 |
| Band | X |
| Numbers of images | 68 |
| Wavelength (cm) | 3.1 |
| Incidence angle (°) | 33.1–33.2 |
| Track No. | 8 |
| Repeat observation period (day) | 11 |
| Date range | April 2010–October 2018 |
| Parameter | Definition |
|---|---|
| σ | Additional stress of different depths at each point in generated grid |
| n | Total number of the buildings in the CBD |
| Pi | Gravity of building i in the CBD |
| X | Longitude of a point in the generated grid in UTM projection coordinates |
| Y | Latitude of a point in the generated grid in UTM projection coordinates |
| Z | Depth of a point in generated grid in UTM projection coordinates |
| Xi | Longitude of building i in UTM projection coordinates |
| Yi | Latitude of building i in UTM projection coordinates |
| Zi | Foundation depth of building i in UTM projection coordinates |
| Ai | Area of building i |
| Hi | Height of building i |
| 2.9 | Floor height of building (Unit is m) |
| 1.5 | Weight per square meter (Unit is t) |
| Di | Foundation depth of building i |
| Ws | Density of soil displaced by the foundation of the building |
| g | Local acceleration of gravity (g = 9.81 m/s2). |
Publisher’s Note: MDPI stays neutral with regard to jurisdictional claims in published maps and institutional affiliations. |
© 2021 by the authors. Licensee MDPI, Basel, Switzerland. This article is an open access article distributed under the terms and conditions of the Creative Commons Attribution (CC BY) license (https://creativecommons.org/licenses/by/4.0/).
Share and Cite
Li, F.; Gong, H.; Chen, B.; Gao, M.; Zhou, C.; Guo, L. Understanding the Influence of Building Loads on Surface Settlement: A Case Study in the Central Business District of Beijing Combining Multi-Source Data. Remote Sens. 2021, 13, 3063. https://0-doi-org.brum.beds.ac.uk/10.3390/rs13163063
Li F, Gong H, Chen B, Gao M, Zhou C, Guo L. Understanding the Influence of Building Loads on Surface Settlement: A Case Study in the Central Business District of Beijing Combining Multi-Source Data. Remote Sensing. 2021; 13(16):3063. https://0-doi-org.brum.beds.ac.uk/10.3390/rs13163063
Chicago/Turabian StyleLi, Fengkai, Huili Gong, Beibei Chen, Mingliang Gao, Chaofan Zhou, and Lin Guo. 2021. "Understanding the Influence of Building Loads on Surface Settlement: A Case Study in the Central Business District of Beijing Combining Multi-Source Data" Remote Sensing 13, no. 16: 3063. https://0-doi-org.brum.beds.ac.uk/10.3390/rs13163063