
Building Capacity for a User-Centred Integrated Early Warning System for Drought in Papua New Guinea

 ,
,
Abstract
:
1. Introduction
- 1.
- Risk knowledge—identification of the worst impacts and threats including a consolidated assessment of any exposures and vulnerabilities.
- 2.
- Monitoring and warning—the infrastructure that detects climate variabilities in the lead up to a disaster with a sound technical and scientific basis.
- 3.
- Communication and dissemination—the communication framework that ensures early warnings are delivered efficiently to vulnerable groups.
- 4.
- Response capability—the systems and knowledge that enable communities to effectively respond to early warnings.
2. Materials and Methods
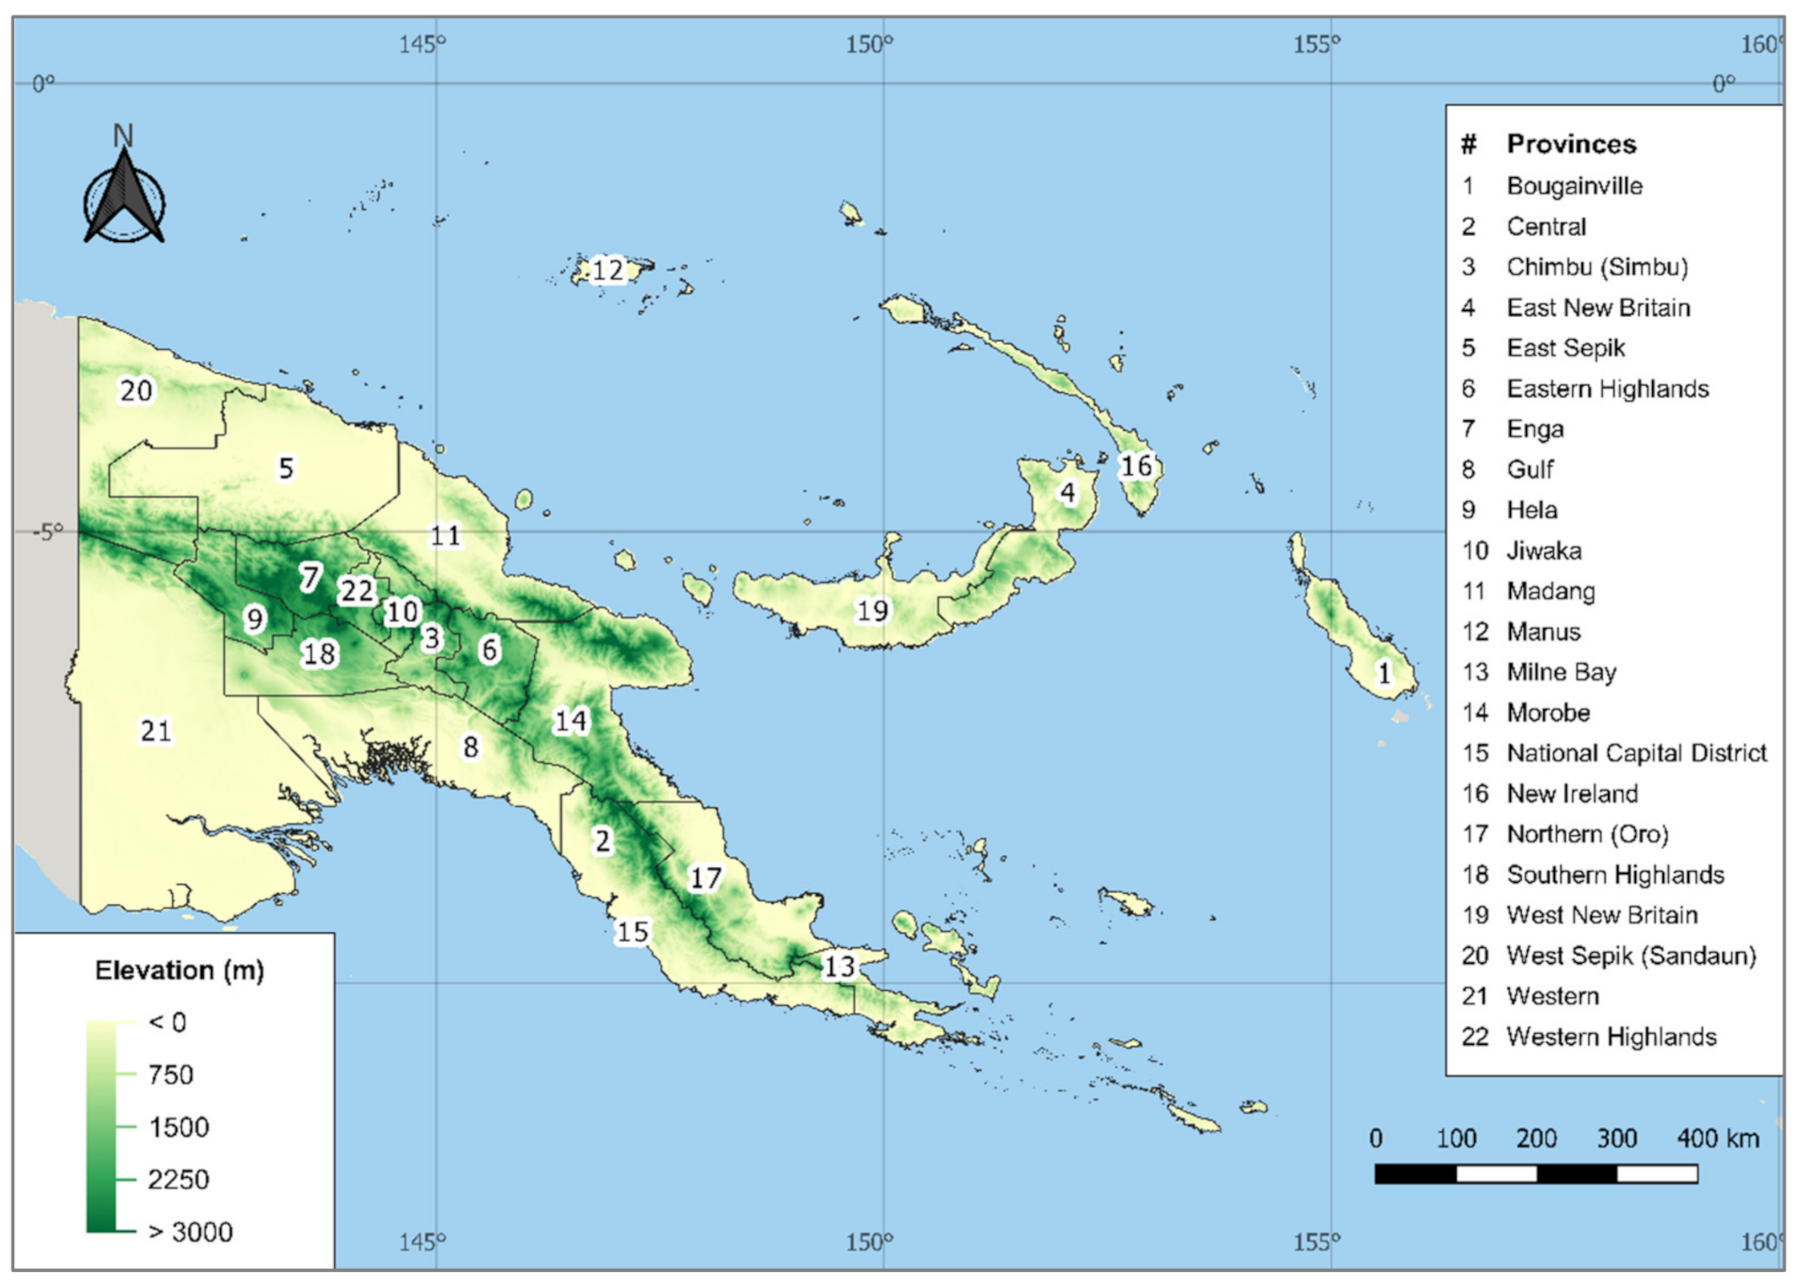
2.1. Study Area
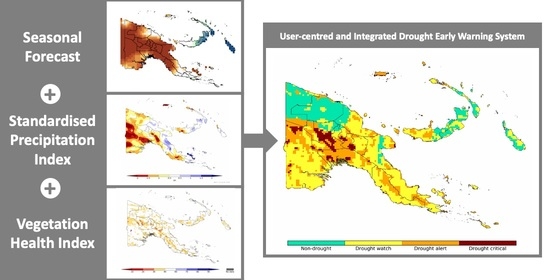
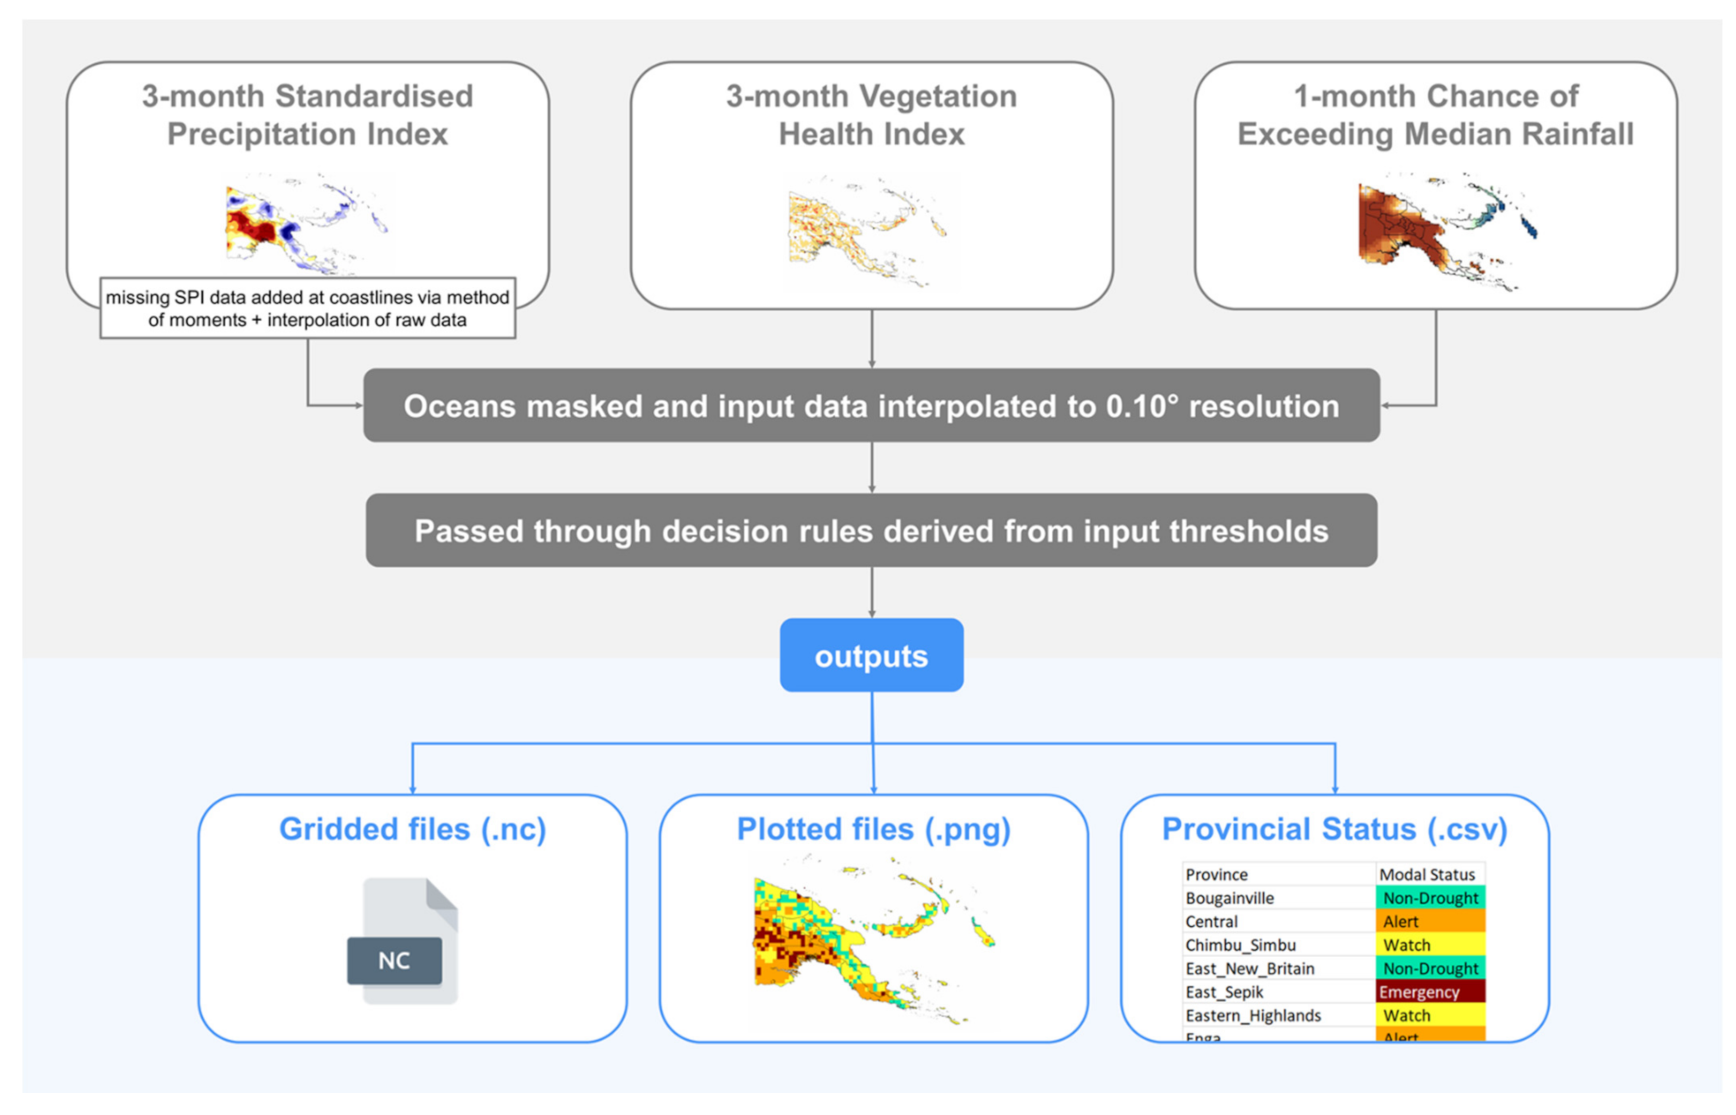
2.2. Drought I-EWS Inputs
2.3. Input Thresholds
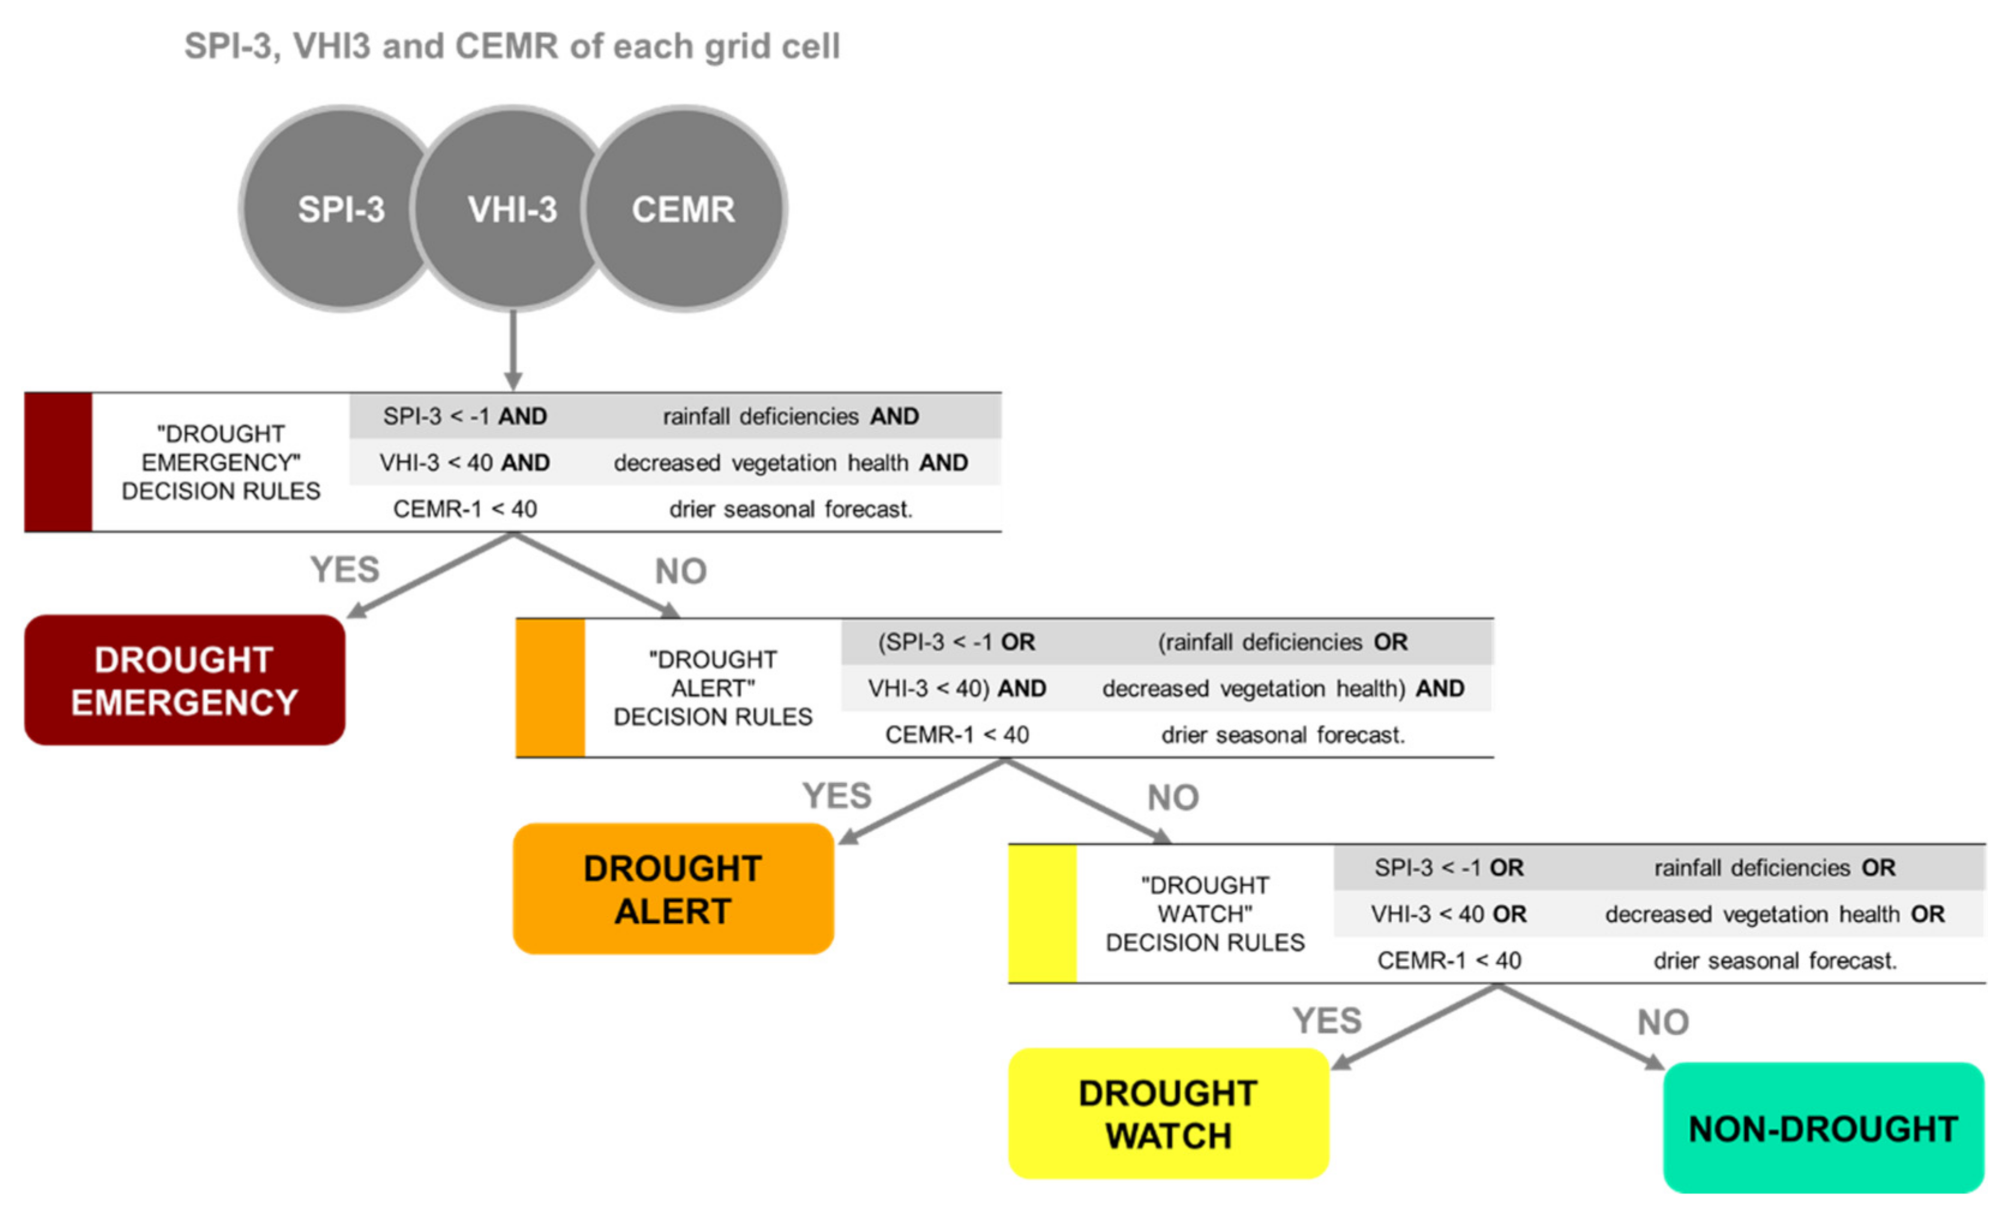
2.4. Decision Rules
3. Results
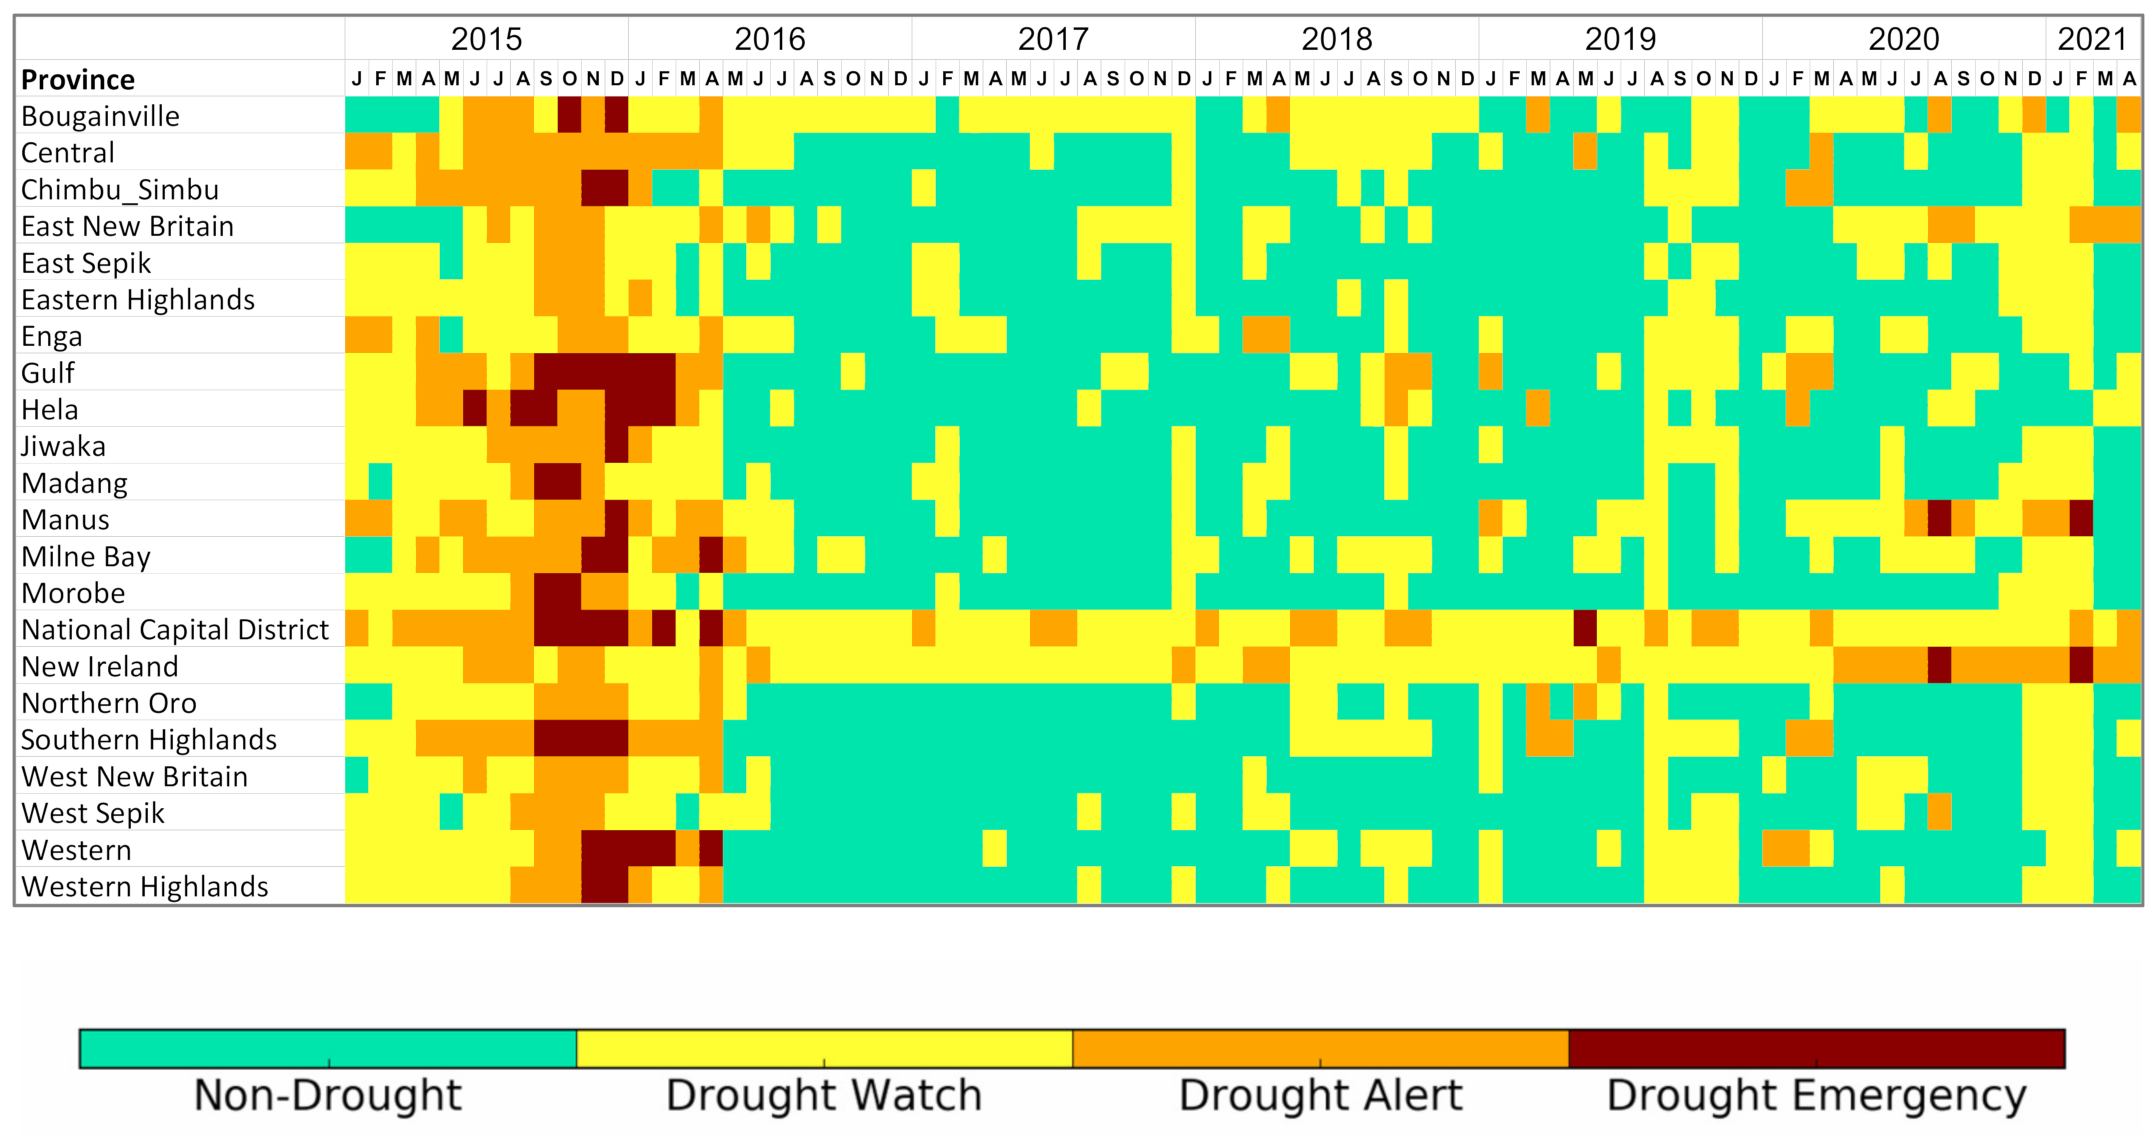
3.1. Analyses at Provincial Level
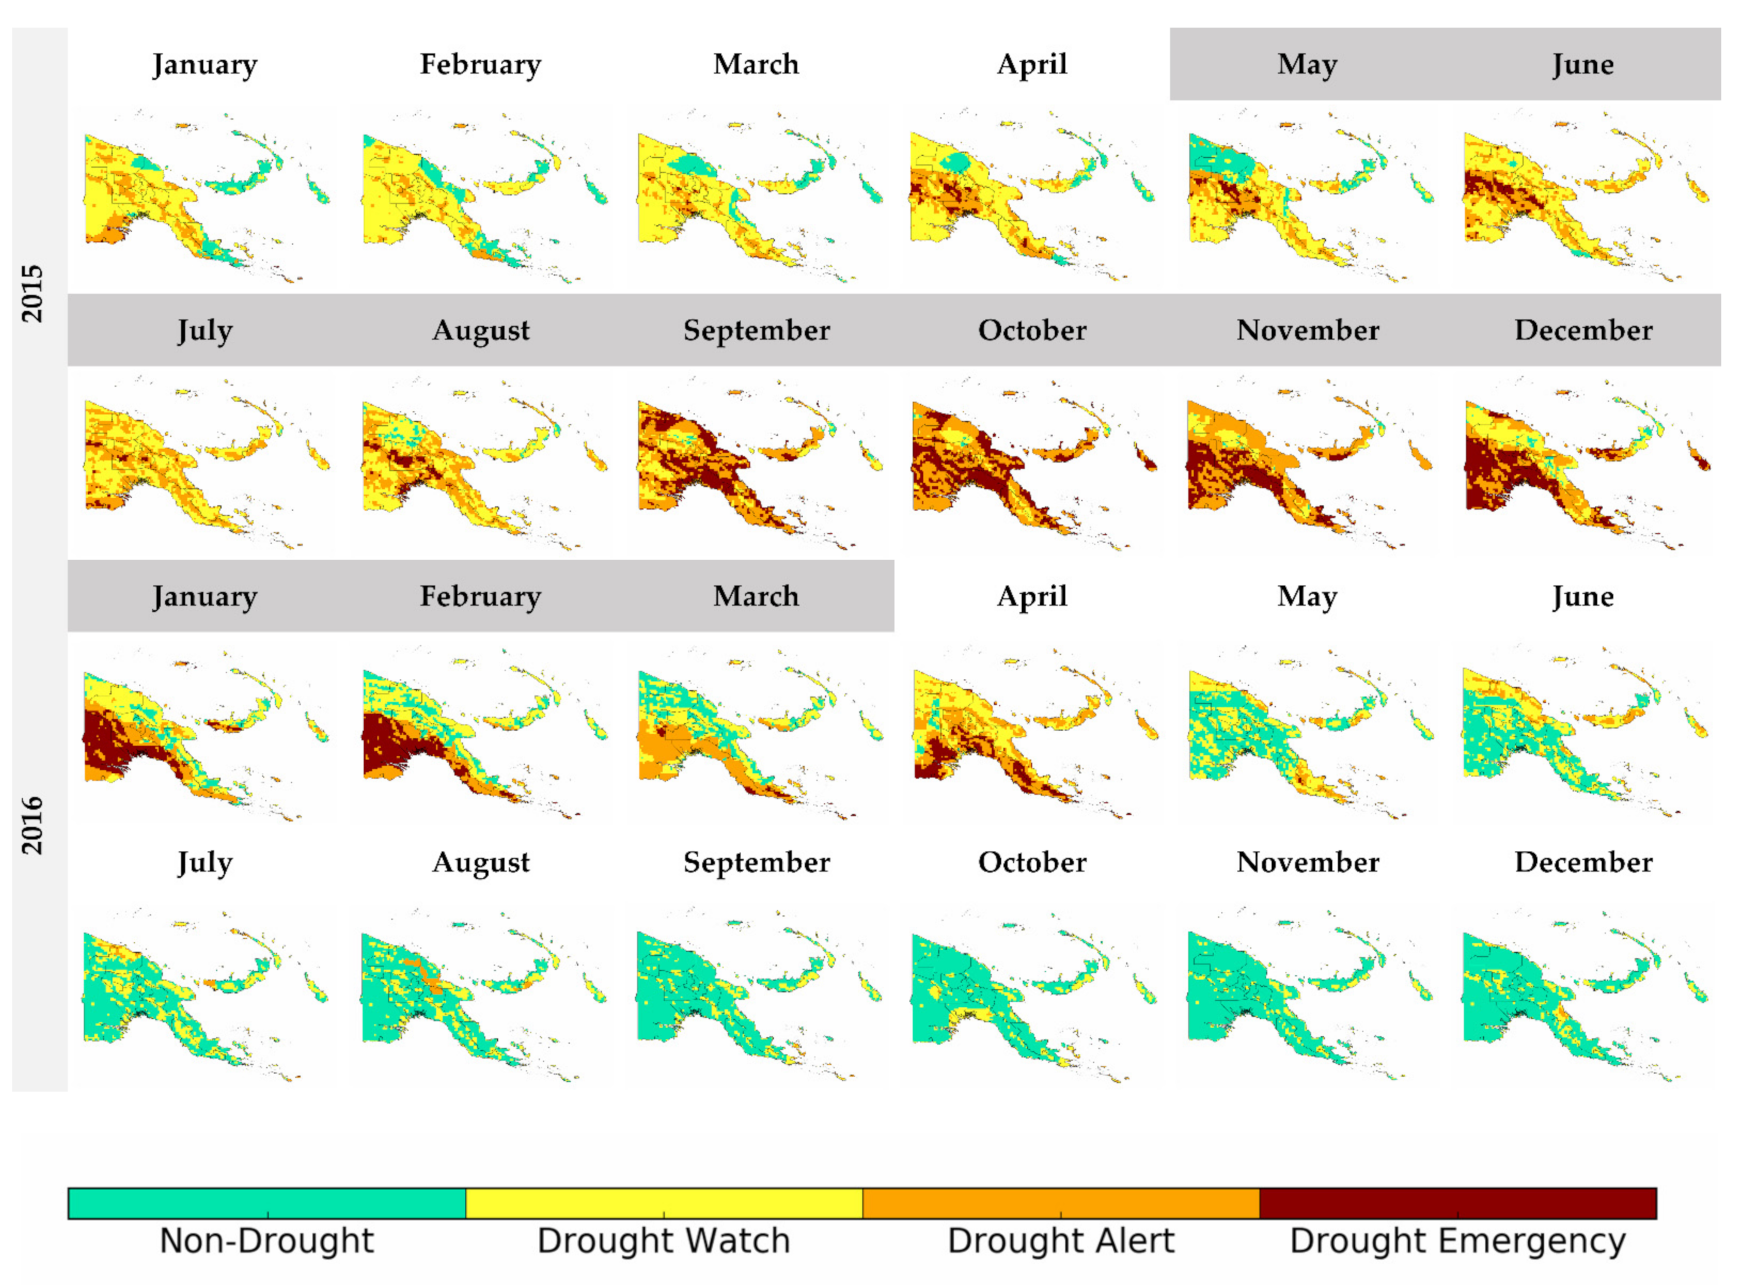
3.2. Drought Evolution
4. Discussion
4.1. System Limited by Spatial Resolution of Inputs
4.2. Dataset Temporal Availability
4.3. Minimising Rapid State Transitions
4.4. False Alarms and Success Rates
4.5. Soil Moisture
4.6. Translating Warnings to Impacts
5. Conclusions
Author Contributions
Funding
Data Availability Statement
Acknowledgments
Conflicts of Interest
Appendix A

| Province | Provincial Mean SPI-3 | Provincial Median SPI-3 | Provincial SPI-3 Standard Deviation |
|---|---|---|---|
| (national—from Table 3) | 0.32 | 0.48 | 0.62 |
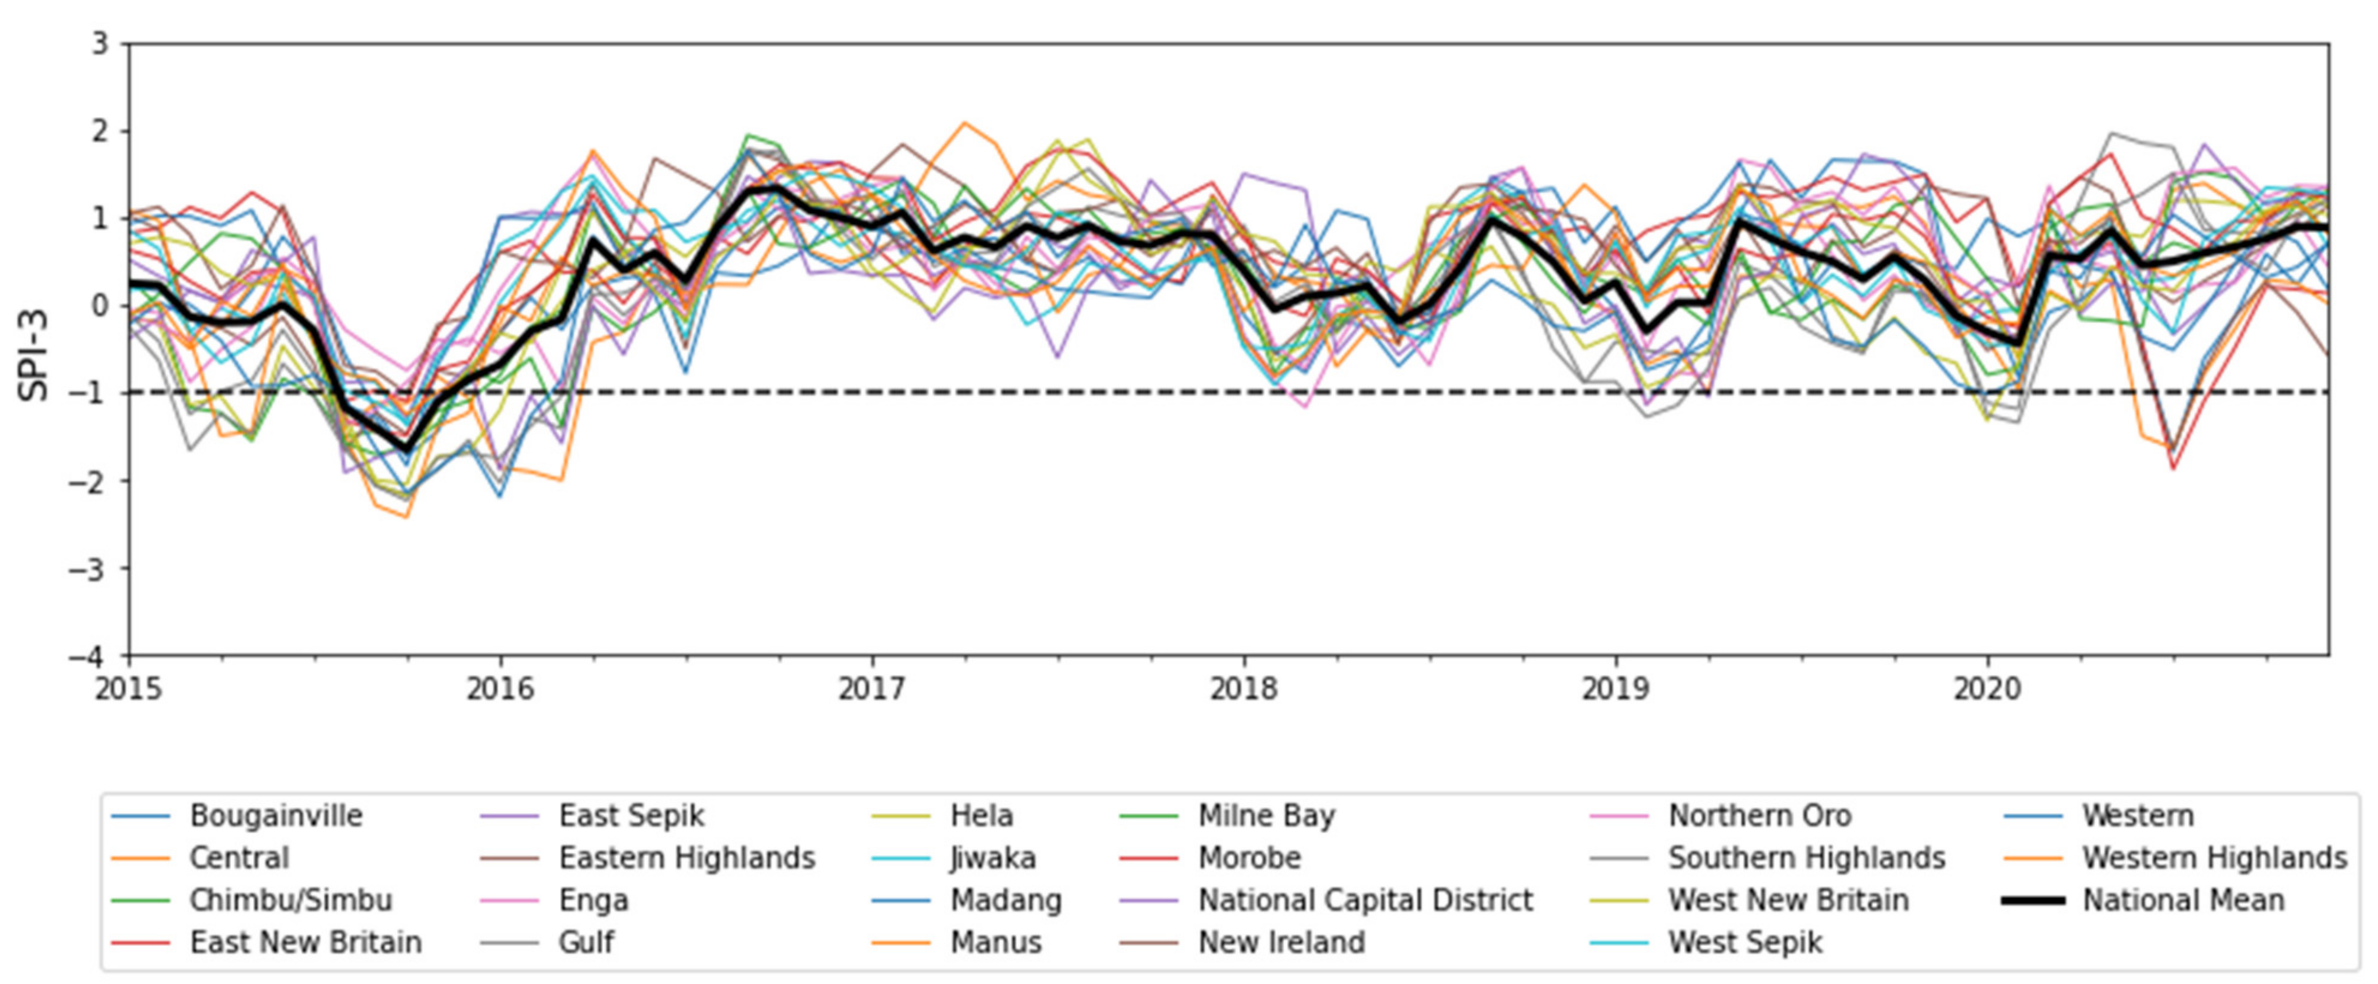
| Bougainville | 0.20 | 0.23 | 0.77 |
| Central | 0.19 | 0.32 | 0.84 |
| Chimbu/Simbu | 0.21 | 0.28 | 0.83 |
| East New Britain | 0.55 | 0.73 | 0.67 |
| East Sepik | 0.45 | 0.52 | 0.59 |
| Eastern Highlands | 0.45 | 0.53 | 0.75 |
| Enga | 0.35 | 0.41 | 0.62 |
| Gulf | 0.11 | 0.25 | 1.01 |
| Hela | 0.14 | 0.36 | 0.95 |
| Jiwaka | 0.33 | 0.41 | 0.63 |
| Madang | 0.50 | 0.49 | 0.64 |
| Manus | 0.25 | 0.28 | 0.93 |
| Milne Bay | 0.33 | 0.50 | 0.78 |
| Morobe | 0.64 | 0.73 | 0.73 |
| National Capital District | 0.25 | 0.20 | 0.92 |
| New Ireland | 0.62 | 0.72 | 0.67 |
| Northern Oro | 0.39 | 0.40 | 0.79 |
| Southern Highlands | 0.01 | 0.13 | 1.03 |
| West New Britain | 0.45 | 0.55 | 0.74 |
| West Sepik | 0.45 | 0.63 | 0.67 |
| Western | 0.09 | 0.30 | 0.89 |
| Western Highlands | 0.37 | 0.41 | 0.67 |
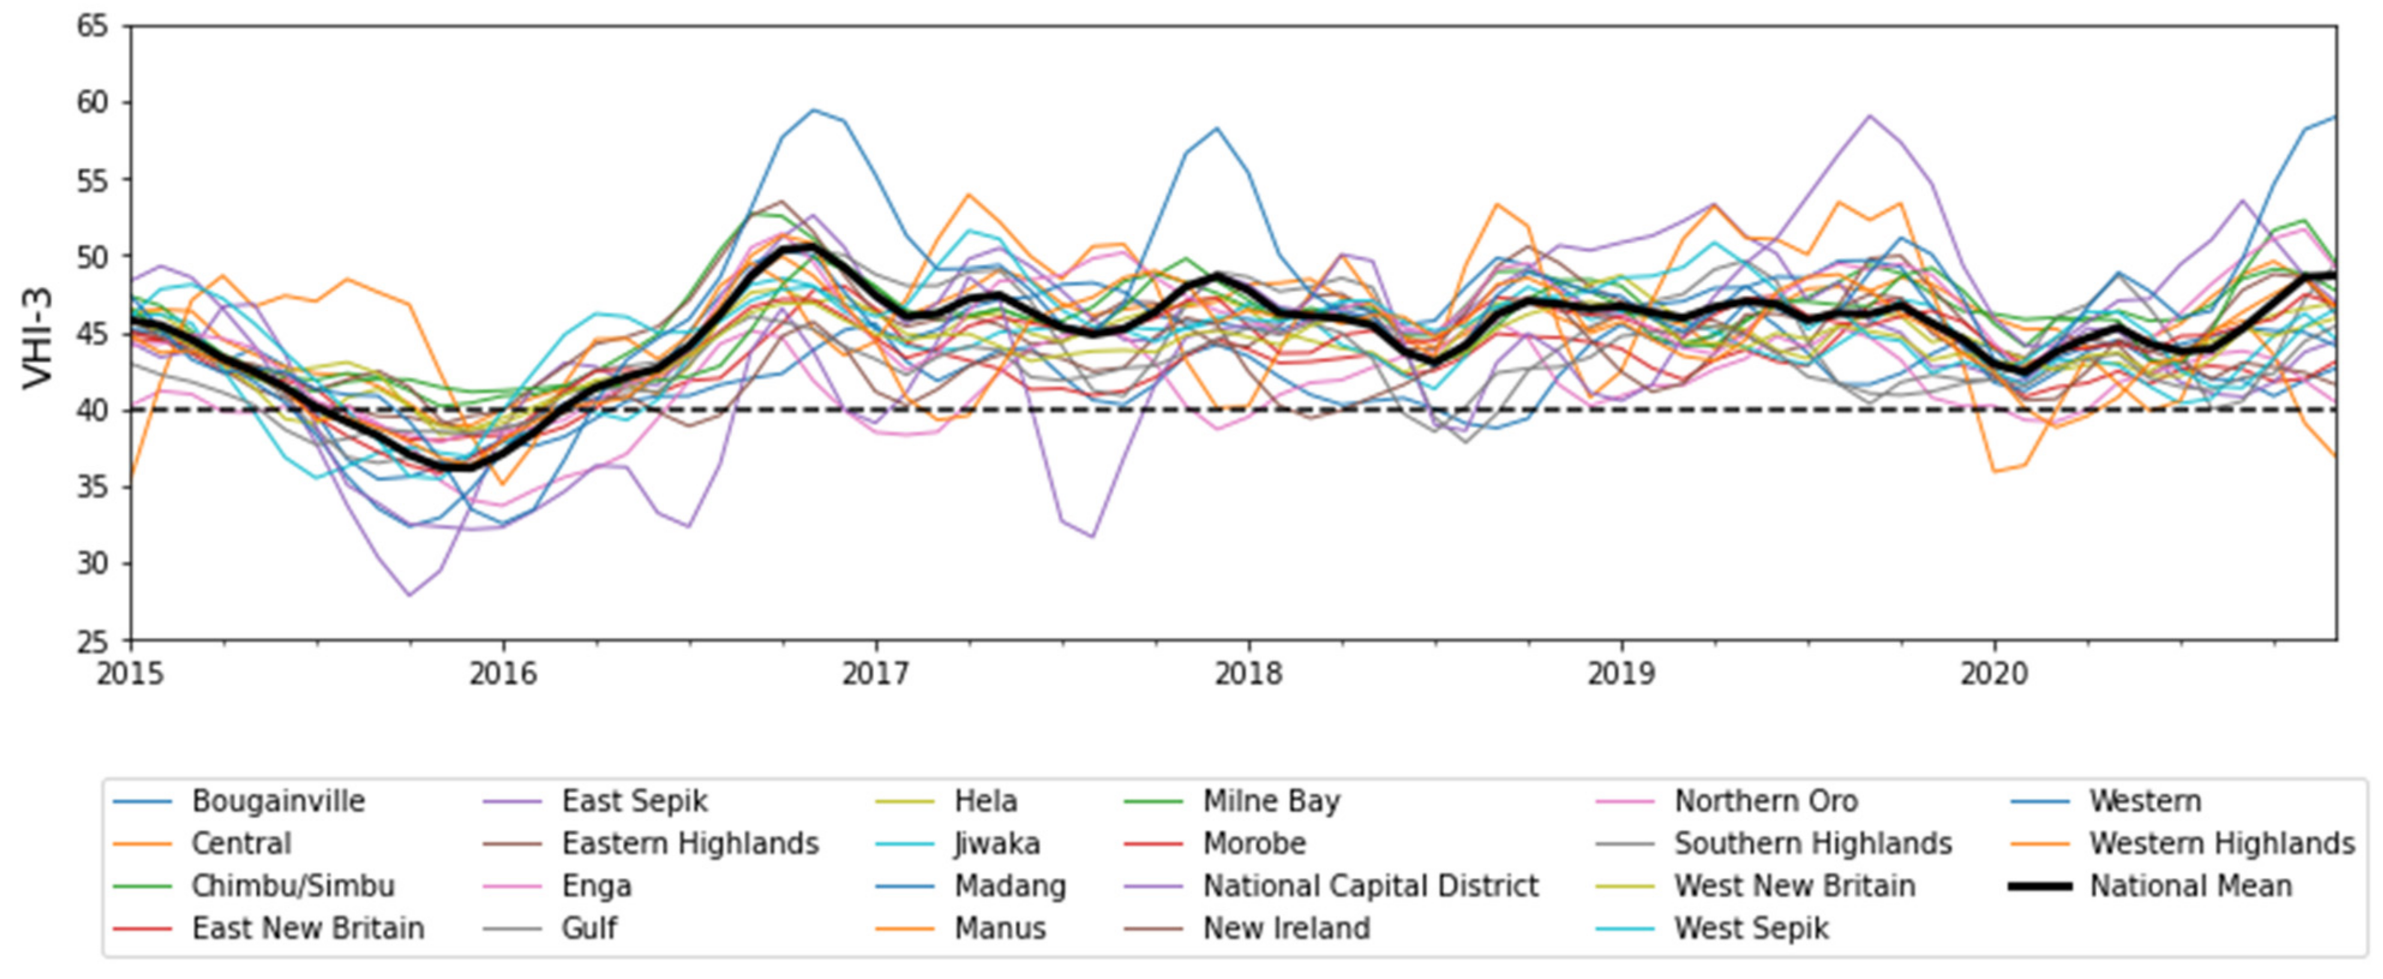
| Province | Provincial Mean VHI-3 | Provincial Median VHI-3 | Provincial VHI-3 Standard Deviation |
|---|---|---|---|
| (national—from Table 3) | 44.63 | 45.55 | 3.21 |
| Bougainville | 42.18 | 42.06 | 2.34 |
| Central | 44.25 | 45.15 | 2.45 |
| Chimbu/Simbu | 44.79 | 45.42 | 2.70 |
| East New Britain | 42.52 | 42.56 | 1.90 |
| East Sepik | 44.54 | 45.22 | 5.10 |
| Eastern Highlands | 44.14 | 43.91 | 2.78 |
| Enga | 41.61 | 41.85 | 2.64 |
| Gulf | 43.52 | 43.32 | 3.77 |
| Hela | 42.44 | 42.92 | 1.98 |
| Jiwaka | 43.80 | 44.68 | 3.19 |
| Madang | 44.93 | 45.66 | 3.96 |
| Manus | 45.06 | 45.32 | 2.84 |
| Milne Bay | 45.55 | 45.70 | 2.75 |
| Morobe | 44.47 | 45.30 | 2.97 |
| National Capital District | 49.92 | 49.64 | 8.89 |
| New Ireland | 43.86 | 43.80 | 1.94 |
| Northern Oro | 46.59 | 46.94 | 3.64 |
| Southern Highlands | 42.90 | 43.27 | 2.18 |
| West New Britain | 43.44 | 43.75 | 1.87 |
| West Sepik | 44.44 | 44.90 | 3.27 |
| Western | 47.05 | 46.75 | 5.80 |
| Western Highlands | 45.05 | 45.31 | 3.55 |
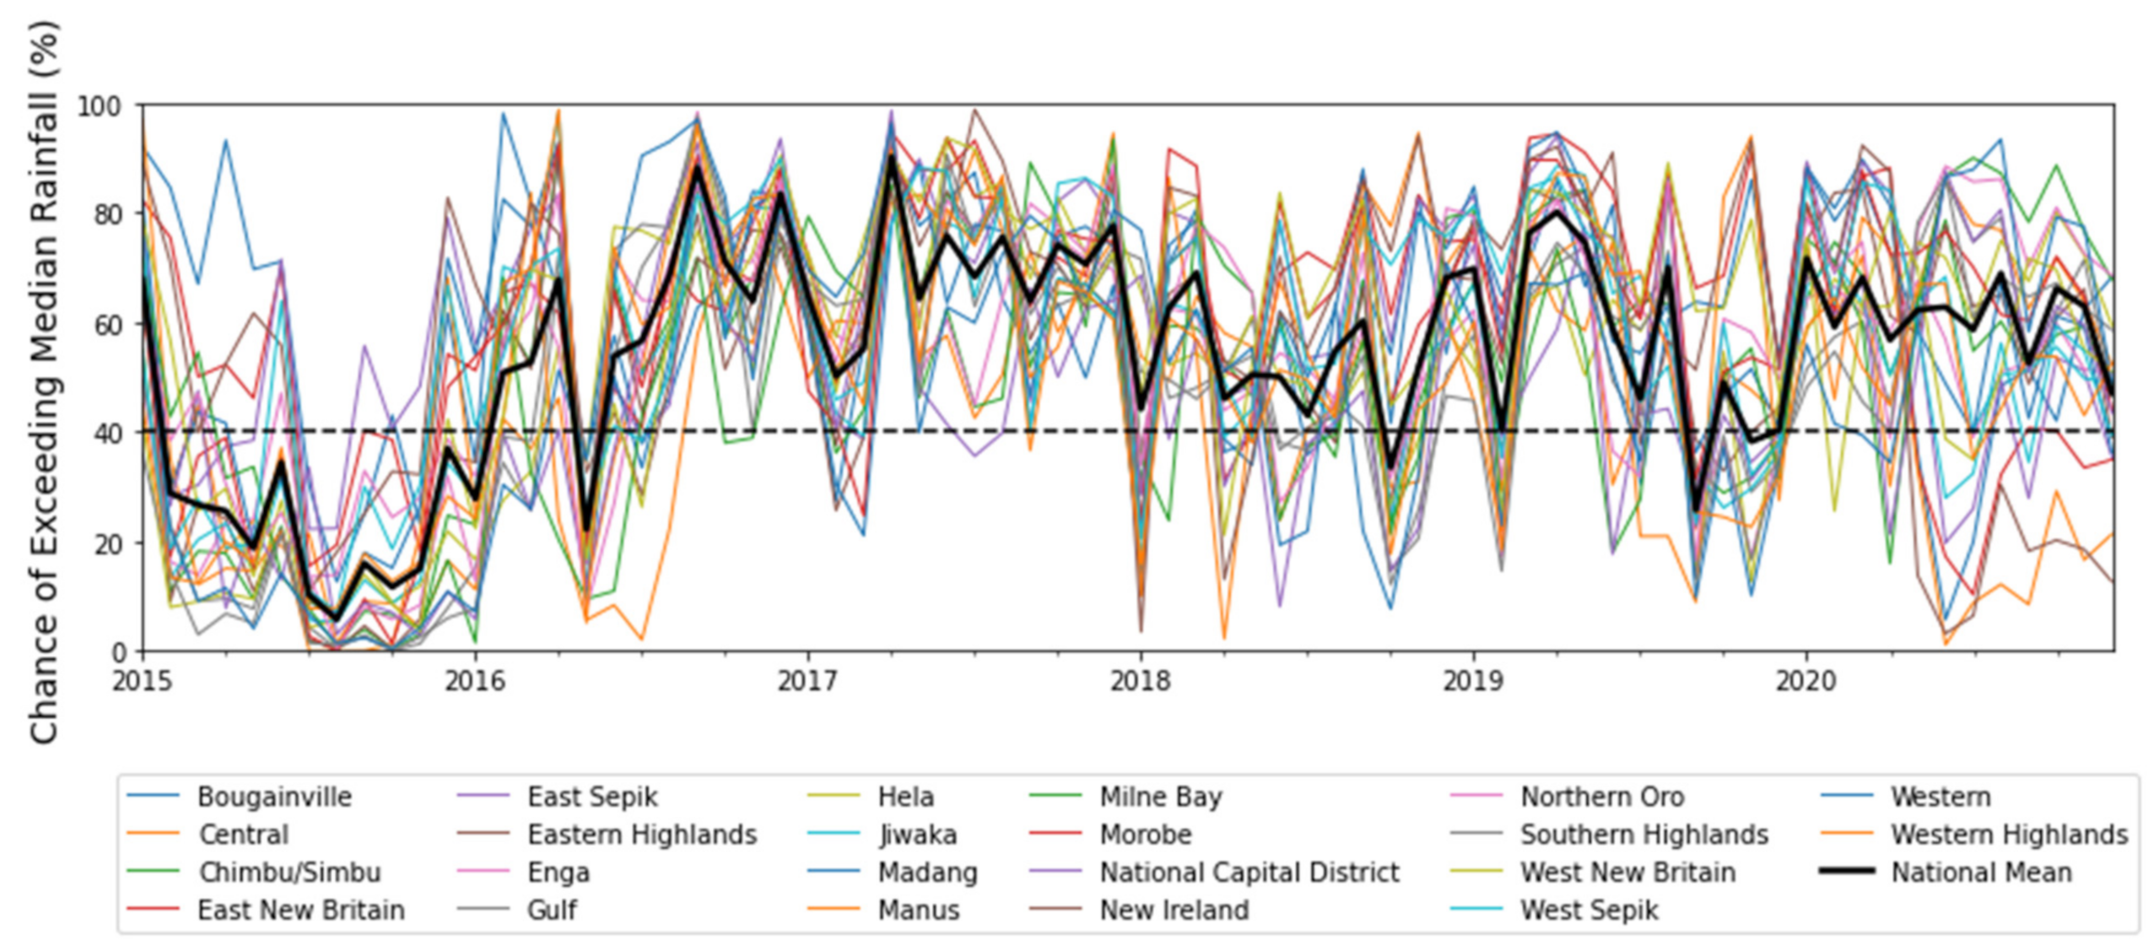
| Province | Provincial Mean CEMR | Provincial Median CEMR | Provincial CEMR Standard Deviation |
|---|---|---|---|
| (national—from Table 3) | 53.79 | 57.92 | 19.90 |
| Bougainville | 60.07 | 63.07 | 22.18 |
| Central | 50.22 | 52.90 | 22.82 |
| Chimbu/Simbu | 50.74 | 57.48 | 23.75 |
| East New Britain | 62.37 | 66.18 | 23.21 |
| East Sepik | 59.18 | 57.57 | 22.18 |
| Eastern Highlands | 53.62 | 59.92 | 24.15 |
| Enga | 53.50 | 56.39 | 20.67 |
| Gulf | 48.61 | 50.56 | 25.34 |
| Hela | 52.71 | 58.35 | 24.59 |
| Jiwaka | 51.66 | 54.86 | 23.46 |
| Madang | 57.35 | 58.28 | 23.63 |
| Manus | 45.93 | 47.86 | 30.67 |
| Milne Bay | 49.62 | 54.82 | 26.58 |
| Morobe | 59.17 | 65.10 | 24.13 |
| National Capital District | 46.19 | 47.11 | 23.79 |
| New Ireland | 58.04 | 64.33 | 26.64 |
| Northern Oro | 55.19 | 61.08 | 25.17 |
| Southern Highlands | 48.32 | 52.50 | 26.58 |
| West New Britain | 57.35 | 63.16 | 24.37 |
| West Sepik | 57.01 | 59.51 | 23.30 |
| Western | 49.10 | 53.90 | 28.38 |
| Western Highlands | 50.27 | 52.60 | 24.25 |

References
- Wilhite, D.A.; Glantz, M.H. Understanding: The Drought Phenomenon: The Role of Definitions. Water Int. 1985, 10, 111–120. [Google Scholar] [CrossRef] [Green Version]
- Iese, V.; Kiem, A.S.; Mariner, A.; Malsale, P.; Tofaeono, T.; Kirono, D.G.C.; Round, V.; Heady, C.; Tigona, R.; Veisa, F.; et al. Historical and Future Drought Impacts in the Pacific Islands and Atolls. Clim. Change 2021, 166, 19. [Google Scholar] [CrossRef]
- Kuleshov, Y.; McGree, S.; Jones, D.; Charles, A.; Cottrill, A.; Prakash, B.; Atalifo, T.; Nihmei, S.; Seuseu, F.L.S.K. Extreme Weather and Climate Events and Their Impacts on Island Countries in the Western Pacific: Cyclones, Floods and Droughts. Atmos. Clim. Sci. 2014, 4, 803. [Google Scholar] [CrossRef] [Green Version]
- Behlert, B.; Diekjobst, R.; Felgentreff, C.; Manandhar, T.; Mucke, P.; Pries, L.; Radtke, K.; Weller, D. The WorldRiskReport 2020; Bündnis Entwicklung Hilft, Ruhr University Bochum—Institute for International Law of Peace and Armed Conflict (IFHV): Bochum, Germany, 2020; pp. 43–51. ISBN 978-3-946785-10-1. [Google Scholar]
- Bourke, R.M.; Harwood, T. Food and Agriculture in Papua New Guinea; ANU E Press: Canberra, Australia, 2009; ISBN 1921536616. [Google Scholar]
- Cobon, D.H.; Ewai, M.; Inape, K.; Bourke, R.M. Food Shortages Are Associated with Droughts, Floods, Frosts and ENSO in Papua New Guinea. Agric. Syst. 2016, 145, 150–164. [Google Scholar] [CrossRef]
- Jacka, J.K. In the Time of Frost: El Niño and the Political Ecology of Vulnerability in Papua New Guinea. Anthropol. Forum 2020, 30, 141–156. [Google Scholar] [CrossRef]
- Nunn, P.D.; Kumar, R. Alluvial Charcoal in the Sigatoka Valley, Viti Levu Island, Fiji. Palaeogeogr. Palaeoclimatol. Palaeoecol. 2004, 213, 153–162. [Google Scholar] [CrossRef]
- Intergovernmental Panel on Climate Change (IPCC). The Impact of Climate Change on Natural Disasters. In Reducing Disaster: Early Warning Systems For Climate Change; Singh, A., Zommers, Z., Eds.; Springer Netherlands: Dordrecht, The Netherlands, 2014; pp. 21–49. ISBN 978-94-017-8598-3. [Google Scholar]
- Wilhite, D.A. Managing Drought Risk in a Changing Climate. Clim. Res. 2016, 70, 99–102. [Google Scholar] [CrossRef] [Green Version]
- Wilhite, D.A.; Hayes, M.J.; Knutson, C.; Smith, K.H. Planning for Drought: Moving from Crisis to Risk Management. JAWRA J. Am. Water Resour. Assoc. 2000, 36, 697–710. [Google Scholar] [CrossRef]
- United Nations Development Programme (UNDP). Five Approaches to Build Functional Early Warning Systems; United Nations Development Programme: Geneva, Switzerland, 2018. [Google Scholar]
- Kelman, I.; Glantz, M.H. Early Warning Systems Defined. In Reducing Disaster: Early Warning Systems For Climate Change; Singh, A., Zommers, Z., Eds.; Springer Netherlands: Dordrecht, The Netherlands, 2014; pp. 89–108. ISBN 978-94-017-8598-3. [Google Scholar]
- World Meteorological Organization (WMO). Multi-Hazard Early Warning Systems: A Checklist; World Meteorological Organization: Geneva, Switzerland, 2018. [Google Scholar]
- Merz, B.; Kuhlicke, C.; Kunz, M.; Pittore, M.; Babeyko, A.; Bresch, D.N.; Domeisen, D.I.V.; Feser, F.; Koszalka, I.; Kreibich, H.; et al. Impact Forecasting to Support Emergency Management of Natural Hazards. Rev. Geophys. 2020, 58, e2020RG000704. [Google Scholar] [CrossRef]
- Macherera, M.; Chimbari, M.J. A Review of Studies on Community Based Early Warning Systems. Jàmbá 2016, 8. [Google Scholar] [CrossRef]
- Garcia Londoño, C. Mountain Risk Management: Integrated People Centred Early Warning System as a Risk Reduction Strategy, Northern Italy. Ph.D. Thesis, University of Milano-Bicocca, Milan, Italy, 2011. [Google Scholar]
- Baudoin, M.-A.; Henly-Shepard, S.; Fernando, N.; Sitati, A.; Zommers, Z. From Top-Down to “Community-Centric” Approaches to Early Warning Systems: Exploring Pathways to Improve Disaster Risk Reduction Through Community Participation. Int. J. Disaster Risk Sci. 2016, 7, 163–174. [Google Scholar] [CrossRef] [Green Version]
- Andersson, L.; Wilk, J.; Graham, L.P.; Wikner, J.J.; Mokwatlo, S.; Petja, B. Local Early Warning Systems for Drought—Could They Add Value to Nationally Disseminated Seasonal Climate Forecasts? Weather Clim. Extrem. 2019, 28, 100241. [Google Scholar] [CrossRef]
- Basher, R. Global Early Warning Systems for Natural Hazards: Systematic and People-Centred. Philos. Trans. R. Soc. A Math. Phys. Eng. Sci. 2006, 364, 2167–2182. [Google Scholar] [CrossRef] [PubMed]
- Garcia, C.; Fearnley, C. Evaluating Critical Links in Early Warning Systems. Environ. Hazards 2012, 11, 123–137. [Google Scholar] [CrossRef]
- Kuleshov, Y.; Inape, K.; Watkins, A.B.; Bear-Crozier, A.; Chua, Z.-W.; Xie, P.; Kubota, T.; Tashima, T.; Stefanski, R.; Kurino, T. Climate Risk and Early Warning Systems (CREWS) for Papua New Guinea. In Drought (Aridity); IntechOpen: London, UK, 2019. [Google Scholar]
- Bhardwaj, J.; Kuleshov, Y.; Watkins, A.; Aitkenhead, I.; Asghari, A. Building Capacity for a User-Centred Integrated Early Warning System (I-EWS) for Drought in the Northern Murray-Darling Basin. Nat. Hazards 2021, 107, 1–26. [Google Scholar] [CrossRef]
- Svoboda, M.D.; Fuchs, A.B. Handbook of Drought Indicators and Indices; World Meteorological Organisation and Global Water Partnership: Genevera, Switzerland, 2016. [Google Scholar]
- Gyasi-Agyei, Y. Identification of the Optimum Rain Gauge Network Density for Hydrological Modelling Based on Radar Rainfall Analysis. Water 2020, 12, 1906. [Google Scholar] [CrossRef]
- Michelson, D.B. Systematic Correction of Precipitation Gauge Observations Using Analyzed Meteorological Variables. J. Hydrol. 2004, 290, 161–177. [Google Scholar] [CrossRef]
- Kidd, C.; Shige, S.; Vila, D.; Tarnavsky, E.; Yamamoto, M.K.; Maggioni, V.; Maseko, B. The IPWG Satellite Precipitation Validation Effort. In Satellite Precipitation Measurement; Springer: Berlin/Heidelberg, Germany, 2020; pp. 453–470. [Google Scholar]
- Ebert, E.E.; Janowiak, J.E.; Kidd, C. Comparison of Near-Real-Time Precipitation Estimates from Satellite Observations and Numerical Models. Bull. Am. Meteorol. Soc. 2007, 88, 47–64. [Google Scholar] [CrossRef] [Green Version]
- Du, T.L.T.; Bui, D.D.; Nguyen, M.D.; Lee, H. Satellite-Based, Multi-Indices for Evaluation of Agricultural Droughts in a Highly Dynamic Tropical Catchment, Central Vietnam. Water 2018, 10, 659. [Google Scholar] [CrossRef] [Green Version]
- Chua, Z.-W.; Kuleshov, Y.; Watkins, A.B. Drought Detection over Papua New Guinea Using Satellite-Derived Products. Remote Sens. 2020, 12, 3859. [Google Scholar] [CrossRef]
- Anshuka, A.; Buzacott, A.J.V.; Vervoort, R.W.; van Ogtrop, F.F. Developing Drought Index–Based Forecasts for Tropical Climates Using Wavelet Neural Network: An Application in Fiji. Theor. Appl. Climatol. 2021, 143, 557–569. [Google Scholar] [CrossRef]
- Han, P.; Wang, P.X.; Zhang, S.Y. Drought Forecasting Based on the Remote Sensing Data Using ARIMA Models. Math. Comput. Model. 2010, 51, 1398–1403. [Google Scholar] [CrossRef]
- Rhee, J.; Im, J.; Park, S.; Forest, R. Drought Forecasting Based on Machine Learning of Remote Sensing and Long-Range Forecast Data. APEC Clim. Cent. Repub. Korea 2016. [Google Scholar] [CrossRef] [Green Version]
- Yan, H.; Moradkhani, H.; Zarekarizi, M. A Probabilistic Drought Forecasting Framework: A Combined Dynamical and Statistical Approach. J. Hydrol. 2017, 548, 291–304. [Google Scholar] [CrossRef] [Green Version]
- Hao, Z.; Singh, V.P.; Xia, Y. Seasonal Drought Prediction: Advances, Challenges, and Future Prospects. Rev. Geophys. 2018, 56, 108–141. [Google Scholar] [CrossRef] [Green Version]
- Steinemann, A.C. Using Climate Forecasts for Drought Management. J. Appl. Meteorol. Climatol. 2006, 45, 1353–1361. [Google Scholar] [CrossRef]
- United Nations Office for Disaster Risk Reduction (UNDRR). Disaster Risk Reduction in Papua New Guinea: Status Report 2019; United Nations Office for Disaster Risk Reduction: Bangkok, Thailand, 2019. [Google Scholar]
- Centre for Excellence in Disaster Management & Humanitarian Assistance. Papua New Guinea Disaster Management Reference Handbook; Centre for Excellence in Disaster Management & Humanitarian Assistance: Joint Base Pearl Harbor-Hickam, HI, USA, 2019. [Google Scholar]
- National Geophysical Data Center, NESDIS, NOAA, US Department Commerce. NOAA National Geophysical Data Center ETOPO1 1 Arc-Minute Global Relief Model; National Geophysical Data Center, NESDIS, NOAA, US Department Commerce: Boulder, CO, USA, 2009. [Google Scholar] [CrossRef]
- Benjamin, A.K.; Mopafi, I.; Duke, T. A Perspective on Food and Nutrition in the PNG Highlands. Food Secur. Papua New Guinea 2001, 11, 94. [Google Scholar]
- Lutulele, R.P. Sweet Potato Variety Developments in the PNG Highlands: Implications for Future Research and Extension Focus. In Proceedings of the Food Security for Papua New Guinea Proceedings of the Papua New Guinea Food and Nutrition 2000 Conference (ACIAR Proceedings 99) University of Technology, Lae, Papua New Guinea, 26–30 June 2001; pp. 683–688. [Google Scholar]
- Prentice, M.L.; Hope, G.S. Climate of Papua. Ecol. Papua 2007, 1, 479–494. [Google Scholar]
- Beck, H.; Zimmermann, N.; McVicar, T.; Vergopolan, N.; Berg, A.; Wood, E. Present and Future Köppen-Geiger Climate Classification Maps at 1-Km Resolution. Sci. Data 2018, 5, 180214. [Google Scholar] [CrossRef] [Green Version]
- Smith, I.; Moise, A.; Inape, K.; Murphy, B.; Colman, R.; Power, S.; Chung, C. ENSO-Related Rainfall Changes over the New Guinea Region. J. Geophys. Res. Atmos. 2013, 118, 10,665–10,675. [Google Scholar] [CrossRef]
- Gressit, J.L. Biogeography and Ecology of New Guinea; Springer Science & Business Media: Berlin/Heidelberg, Germany, 2012; Volume 42, ISBN 9400986327. [Google Scholar]
- Park, S.-Y.; Sur, C.; Kim, J.-S.; Lee, J.-H. Evaluation of Multi-Sensor Satellite Data for Monitoring Different Drought Impacts. Stoch. Environ. Res. Risk Assess. 2018, 32, 2551–2563. [Google Scholar] [CrossRef]
- Choi, M.; Jacobs, J.M.; Anderson, M.C.; Bosch, D.D. Evaluation of Drought Indices via Remotely Sensed Data with Hydrological Variables. J. Hydrol. 2013, 476, 265–273. [Google Scholar] [CrossRef]
- Halwatura, D.; McIntyre, N.; Lechner, A.M.; Arnold, S. Capability of Meteorological Drought Indices for Detecting Soil Moisture Droughts. J. Hydrol. Reg. Stud. 2017, 12, 396–412. [Google Scholar] [CrossRef]
- McKee, T.B. Drought Monitoring with Multiple Time Scales. In Proceedings of the 9th Conference on Applied Climatology, Boston, MA, USA, 15–20 January 1995. [Google Scholar]
- Kogan, F.N. Global Drought Watch from Space. Bull. Am. Meteorol. Soc. 1997, 78, 621–636. [Google Scholar] [CrossRef]
- Vitart, F. Evolution of ECMWF Sub-Seasonal Forecast Skill Scores. Q. J. R. Meteorol. Soc. 2014, 140, 1889–1899. [Google Scholar] [CrossRef]
- European Centre for Medium-Range Weather Forecasts (ECMWF) S2S, ECMWF, Realtime, Instantaneous and Accumulated. Available online: https://apps.ecmwf.int/datasets/data/s2s-realtime-instantaneous-accum-ecmf/levtype=sfc/type=pf/ (accessed on 17 June 2021).
- Kuleshov, Y.; Kurino, T.; Kubota, T.; Tashima, T.; Xie, P. WMO Space-Based Weather and Climate Extremes Monitoring Demonstration Project (SEMDP): First Outcomes of Regional Cooperation on Drought and Heavy Precipitation Monitoring for Australia and Southeast Asia; IntechOpen: London, UK, 2019; ISBN 978-1-78984-734-5. [Google Scholar]
- Beck, H.E.; Wood, E.F.; Pan, M.; Fisher, C.K.; Miralles, D.G.; Van Dijk, A.I.J.M.; McVicar, T.R.; Adler, R.F. MSWEP V2 Global 3-Hourly 0.1 Precipitation: Methodology and Quantitative Assessment. Bull. Am. Meteorol. Soc. 2019, 100, 473–500. [Google Scholar] [CrossRef] [Green Version]
- Kubota, T.; Aonashi, K.; Ushio, T.; Shige, S.; Takayabu, Y.N.; Kachi, M.; Arai, Y.; Tashima, T.; Masaki, T.; Kawamoto, N. Global Satellite Mapping of Precipitation (GSMaP) products in the GPM era. In Satellite Precipitation Measurement; Springer: Berlin/Heidelberg, Germany, 2020; pp. 355–373. [Google Scholar]
- Aonashi, K.; Awaka, J.; Hirose, M.; Kozu, T.; Kubota, T.; Liu, G.; Shige, S.; Kida, S.; Seto, S.; Takahashi, N.; et al. GSMaP Passive Microwave Precipitation Retrieval Algorithm: Algorithm Description and Validation. J. Meteorol. Soc. Japan. Ser. II 2009, 87A, 119–136. [Google Scholar] [CrossRef] [Green Version]
- Bureau of Meteorology ENSO Outlook History. Available online: http://www.bom.gov.au/climate/enso/outlook/#tabs=ENSO-Outlook-history (accessed on 16 August 2021).
- Murphy, B.F.; Power, S.B.; McGree, S. The Varied Impacts of El Niño–Southern Oscillation on Pacific Island Climates. J. Clim. 2014, 27, 4015–4036. [Google Scholar] [CrossRef]
- Bureau of Meteorology ENSO History—La Niña Impacts. Available online: http://www.bom.gov.au/climate/enso/#tabs=Pacific-Ocean&pacific=History&enso-impacts=La-Niña-impacts (accessed on 16 August 2021).
- Bureau of Meteorology ENSO History—El Niño Impacts. Available online: http://www.bom.gov.au/climate/enso/#tabs=Pacific-Ocean&pacific=History&enso-impacts=El-Niño-impacts (accessed on 16 August 2021).
- Bureau of Meteorology Indian Ocean History. Available online: http://www.bom.gov.au/climate/enso/#tabs=Indian-Ocean&indian=History (accessed on 16 August 2021).
- Bureau of Meteorology Indian and Pacific Ocean Interaction History. Available online: http://www.bom.gov.au/climate/enso/#tabs=Indian-Ocean&indian=History&iod-impacts=Pacific-Ocean-interaction (accessed on 16 August 2021).
- Dinku, T.; Ceccato, P.; Grover-Kopec, E.; Lemma, M.; Connor, S.J.; Ropelewski, C.F. Validation of Satellite Rainfall Products over East Africa’s Complex Topography. Int. J. Remote Sens. 2007, 28, 1503–1526. [Google Scholar] [CrossRef]
- Deo, R.C. On Meteorological Droughts in Tropical Pacific Islands: Time-series Analysis of Observed Rainfall Using Fiji as a Case Study. Meteorol. Appl. 2011, 18, 171–180. [Google Scholar] [CrossRef]
- Sufri, S.; Dwirahmadi, F.; Phung, D.; Rutherford, S. A Systematic Review of Community Engagement (CE) in Disaster Early Warning Systems (EWSs). Prog. Disaster Sci. 2020, 5, 100058. [Google Scholar] [CrossRef]
- Barrett, A.B.; Duivenvoorden, S.; Salakpi, E.E.; Muthoka, J.M.; Mwangi, J.; Oliver, S.; Rowhani, P. Forecasting Vegetation Condition for Drought Early Warning Systems in Pastoral Communities in Kenya. Remote Sens. Environ. 2020, 248, 111886. [Google Scholar] [CrossRef]
- Zhu, Y.; Wang, W.; Singh, V.P.; Liu, Y. Combined Use of Meteorological Drought Indices at Multi-Time Scales for Improving Hydrological Drought Detection. Sci. Total Environ. 2016, 571, 1058–1068. [Google Scholar] [CrossRef]
- Ji, T.; Li, G.; Yang, H.; Liu, R.; He, T. Comprehensive Drought Index as an Indicator for Use in Drought Monitoring Integrating Multi-Source Remote Sensing Data: A Case Study Covering the Sichuan-Chongqing Region. Int. J. Remote Sens. 2018, 39, 786–809. [Google Scholar] [CrossRef]
- Krishnamurthy R, P.K.; Fisher, J.B.; Schimel, D.S.; Kareiva, P.M. Applying Tipping Point Theory to Remote Sensing Science to Improve Early Warning Drought Signals for Food Security. Earth’s Futur. 2020, 8, e2019EF001456. [Google Scholar] [CrossRef] [Green Version]
- Lavaysse, C.; Vogt, J.; Pappenberger, F. Early Warning of Drought in Europe Using the Monthly Ensemble System from ECMWF. Hydrol. Earth Syst. Sci. 2015, 19, 3273–3286. [Google Scholar] [CrossRef] [Green Version]
- Hoover, J.D.; Leisz, S.J.; Laituri, M.E. Comparing and Combining Landsat Satellite Imagery and Participatory Data to Assess Land-Use and Land-Cover Changes in a Coastal Village in Papua New Guinea. Hum. Ecol. 2017, 45, 251–264. [Google Scholar] [CrossRef]
- Tsakiris, G.; Vangelis, H. Towards a Drought Watch System Based on Spatial SPI. Water Resour. Manag. 2004, 18, 1–12. [Google Scholar] [CrossRef]
- White, J.; Fu, K.-W. Who Do You Trust? Comparing People-Centered Communications in Disaster Situations in the United States and China. J. Comp. Policy Anal. Res. Pract. 2012, 14, 126–142. [Google Scholar] [CrossRef]
- Xue, K.; Guo, S.; Liu, Y.; Liu, S.; Xu, D. Social Networks, Trust, and Disaster-Risk Perceptions of Rural Residents in a Multi-Disaster Environment: Evidence from Sichuan, China. Int. J. Environ. Res. Public Health 2021, 18, 2106. [Google Scholar] [CrossRef] [PubMed]
- Goniewicz, K.; Burkle, F. Disaster Early Warning Systems: The Potential Role and Limitations of Emerging Text and Data Messaging Mitigation Capabilities. Disaster Med. Public Health Prep. 2019, 13, 709–712. [Google Scholar] [CrossRef] [PubMed]
- Cambers, G.; Carruthers, P.; Rabuatoka, T.; Tubuna, S.; Ungaro, J. Implementing Climate Change Adaptation Interventions in Remote Outer Islands of the Pacific Island Region. In Climate Change Adaptation in Pacific Countries: Fostering Resilience and Improving the Quality of Life; Leal Filho, W., Ed.; Springer International Publishing: Cham, Switzerland, 2017; pp. 3–18. ISBN 978-3-319-50094-2. [Google Scholar]
- Griffen, V. Gender Relations in Pacific Cultures and Their Impact on the Growth and Development of Children. In Proceedings of the Children’s Rights and Culture in the Pacific’Seminar, 30 October 2006; Available online: http://linkasea.pbworks.com/f/Griffen+Gender_Relations_in_Pacific_cultures.pdf (accessed on 17 August 2021).
- Clissold, R.; Westoby, R.; McNamara, K.E. Women as Recovery Enablers in the Face of Disasters in Vanuatu. Geoforum 2020, 113, 101–110. [Google Scholar] [CrossRef]
- Morioka, K.; Aid, A. A Climate for Change: Understanding Women’s Vulnerabilty and Adaptive Capacity to Climate Change from ActionAid’s Rights-Based Approach-Case Studies from Papua New Guinea and Solomon Islands; Sydney, Australia, 2012; Available online: https://reliefweb.int/sites/reliefweb.int/files/resources/a%20climate%20for%20change_final.pdf (accessed on 17 August 2021).
- Aipira, C.; Kidd, A.; Morioka, K. Climate Change Adaptation in Pacific Countries: Fostering Resilience Through Gender Equality; Springer: Cham, Denmark, 2017; pp. 225–239. ISBN 978-3-319-50093-5. [Google Scholar]
- Campbell, J.R. Traditional Disaster Reduction in Pacific Island Communities; GNS Science: Institute of Geological and Nuclear Sciences Ltd.: Wellington, New Zealand, 2006; ISBN 0478099614. [Google Scholar]
- Nalau, J.; Handmer, J.; Dalesa, M. The Role and Capacity of Government in a Climate Crisis: Cyclone Pam in Vanuatu. In Climate Change Adaptation in Pacific Countries: Fostering Resilience and Improving the Quality of Life; Leal Filho, W., Ed.; Springer International Publishing: Cham, Switzerland, 2017; pp. 151–161. ISBN 978-3-319-50094-2. [Google Scholar]
- Mercer, J.; Kelman, I.; Suchet-pearson, S.; Lloyd, K. Integrating Indigenous and Scientific Knowledge Bases for Disaster Risk Reduction in Papua New Guinea. Geogr. Ann. Ser. B Hum. Geogr. 2009, 91, 157–183. [Google Scholar] [CrossRef]
- Mercer, J.; Kelman, I.; Taranis, L.; Suchet-Pearson, S. Framework for Integrating Indigenous and Scientific Knowledge for Disaster Risk Reduction. Disasters 2010, 34, 214–239. [Google Scholar] [CrossRef] [PubMed]


| Input | Relevant Equations | Timescale | Drought Threshold | Available Time Range | Native Resolution |
|---|---|---|---|---|---|
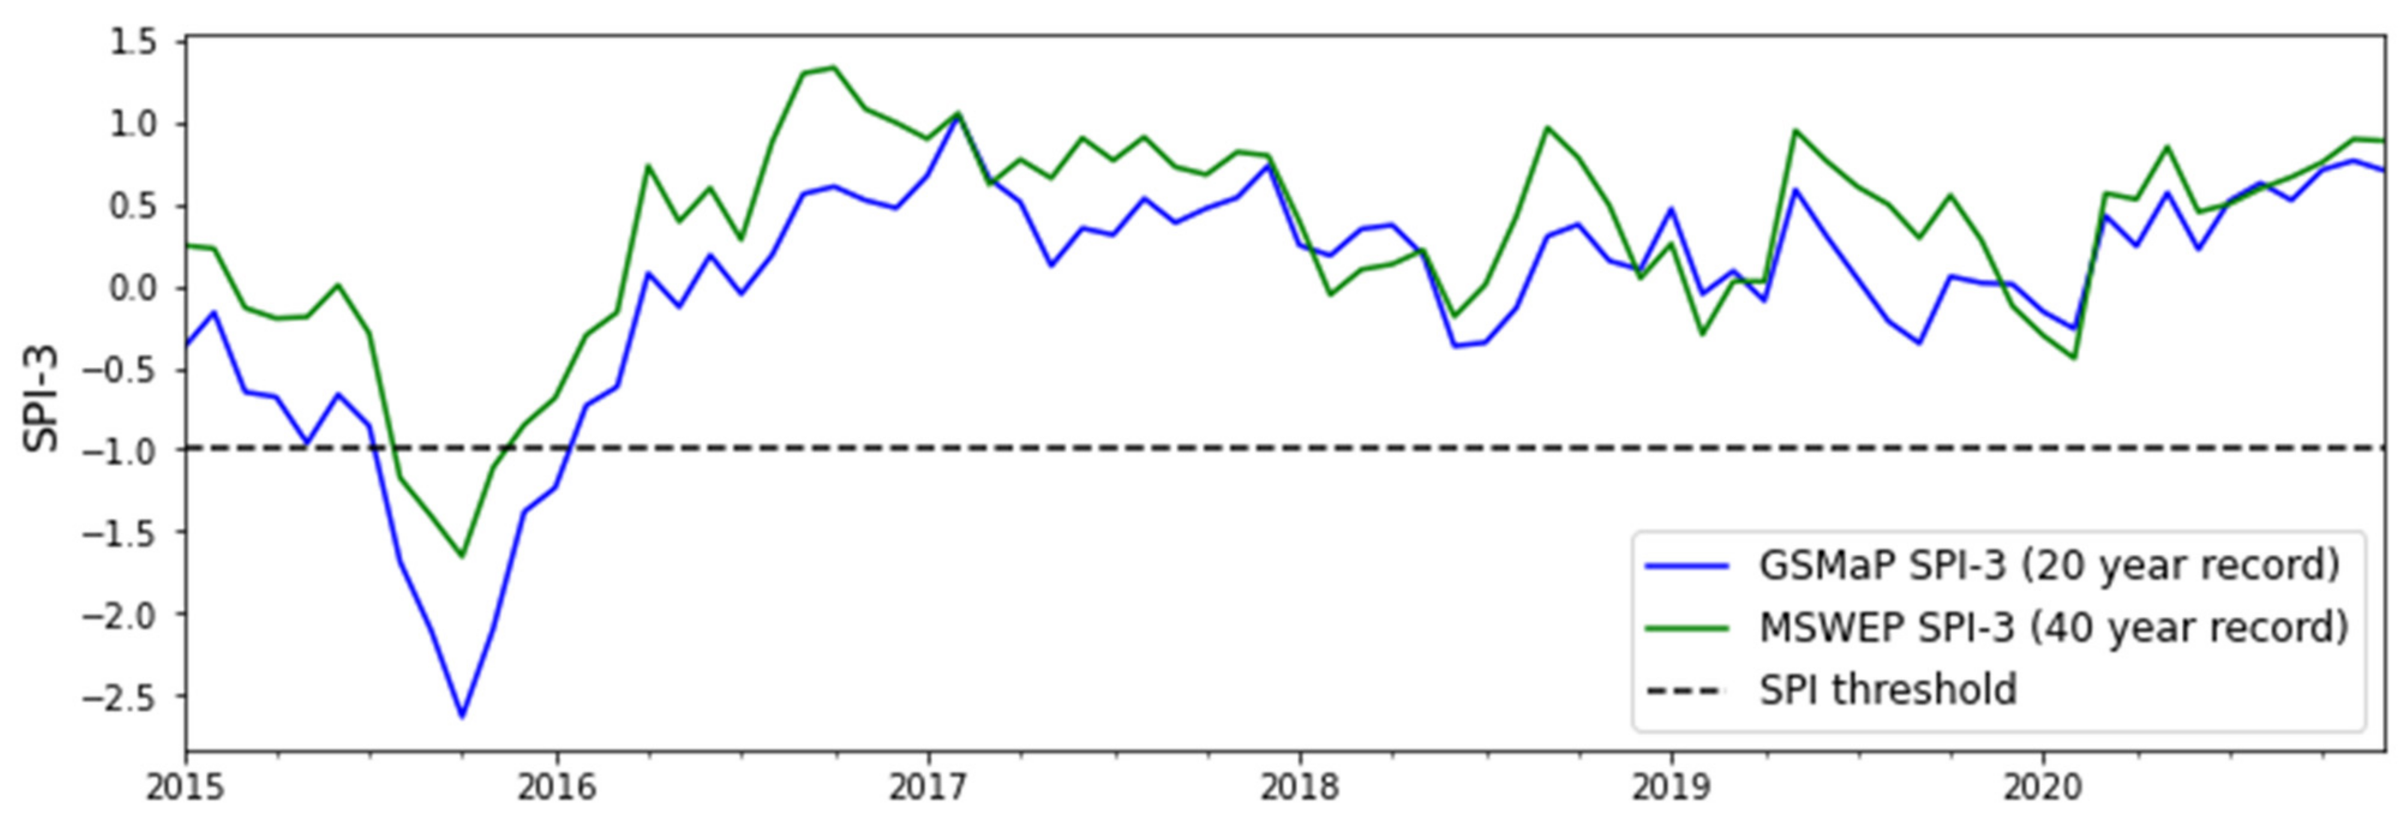
| Standardised Precipitation Index [49] | where p—precipitation over a certain time period, pm—mean rainfall over the same period, and —standard deviation over the same period. | 3-month standardisation | SPI-3 < −1 indicates mild toextreme drought | 2000 to now | 0.1° (~10 km) |
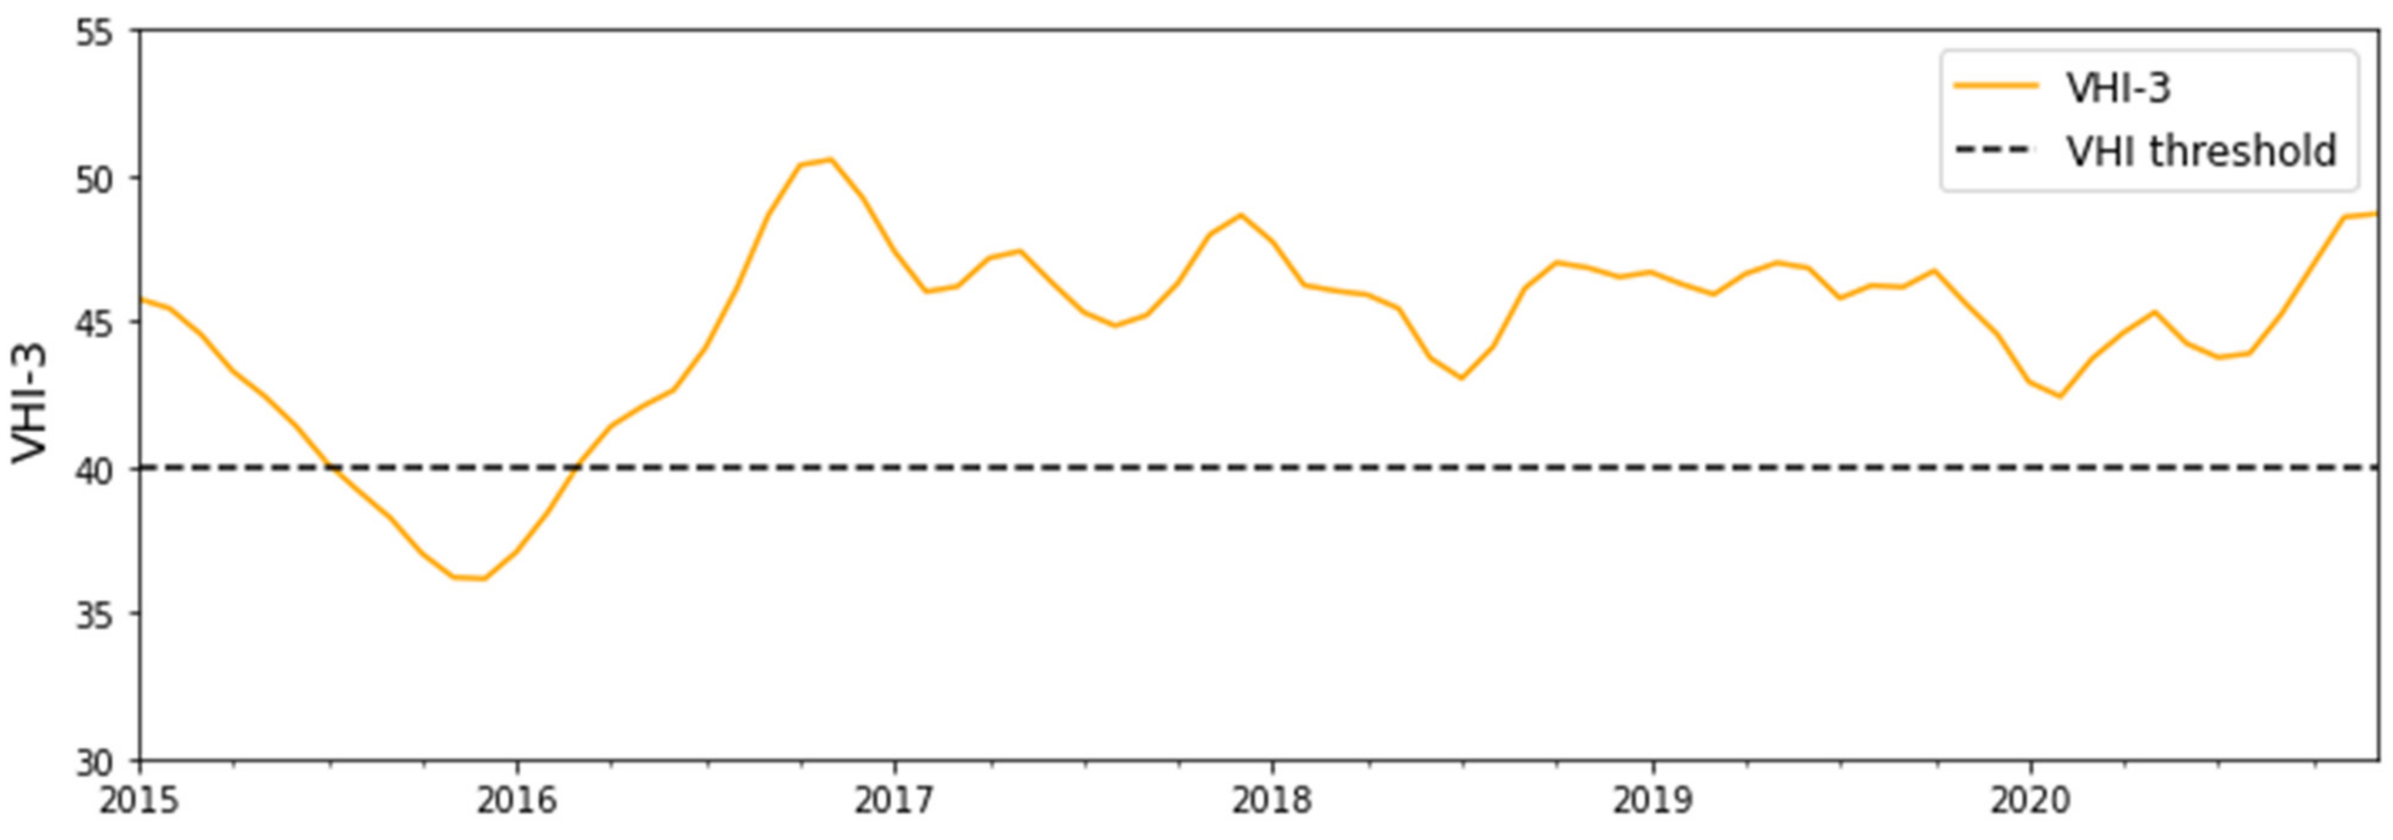
| Vegetation Health Index [50] | The VHI is a weighted combination of the Vegetation Condition Index (VCI) and the Temperature Condition Index (TCI). VCI and TCI are derived from the Normalised Difference Vegetation Index (NDVI) and Brightness (radiative) Temperature (BT), respectively. where α is the weighted coefficient that combines VCI and TCI; most of the literature assigns α = 0.5. | 3-month accumulation | VHI-3 < 40 indicates mild toextreme drought | 2013 to now | 0.1° (~10 km) |
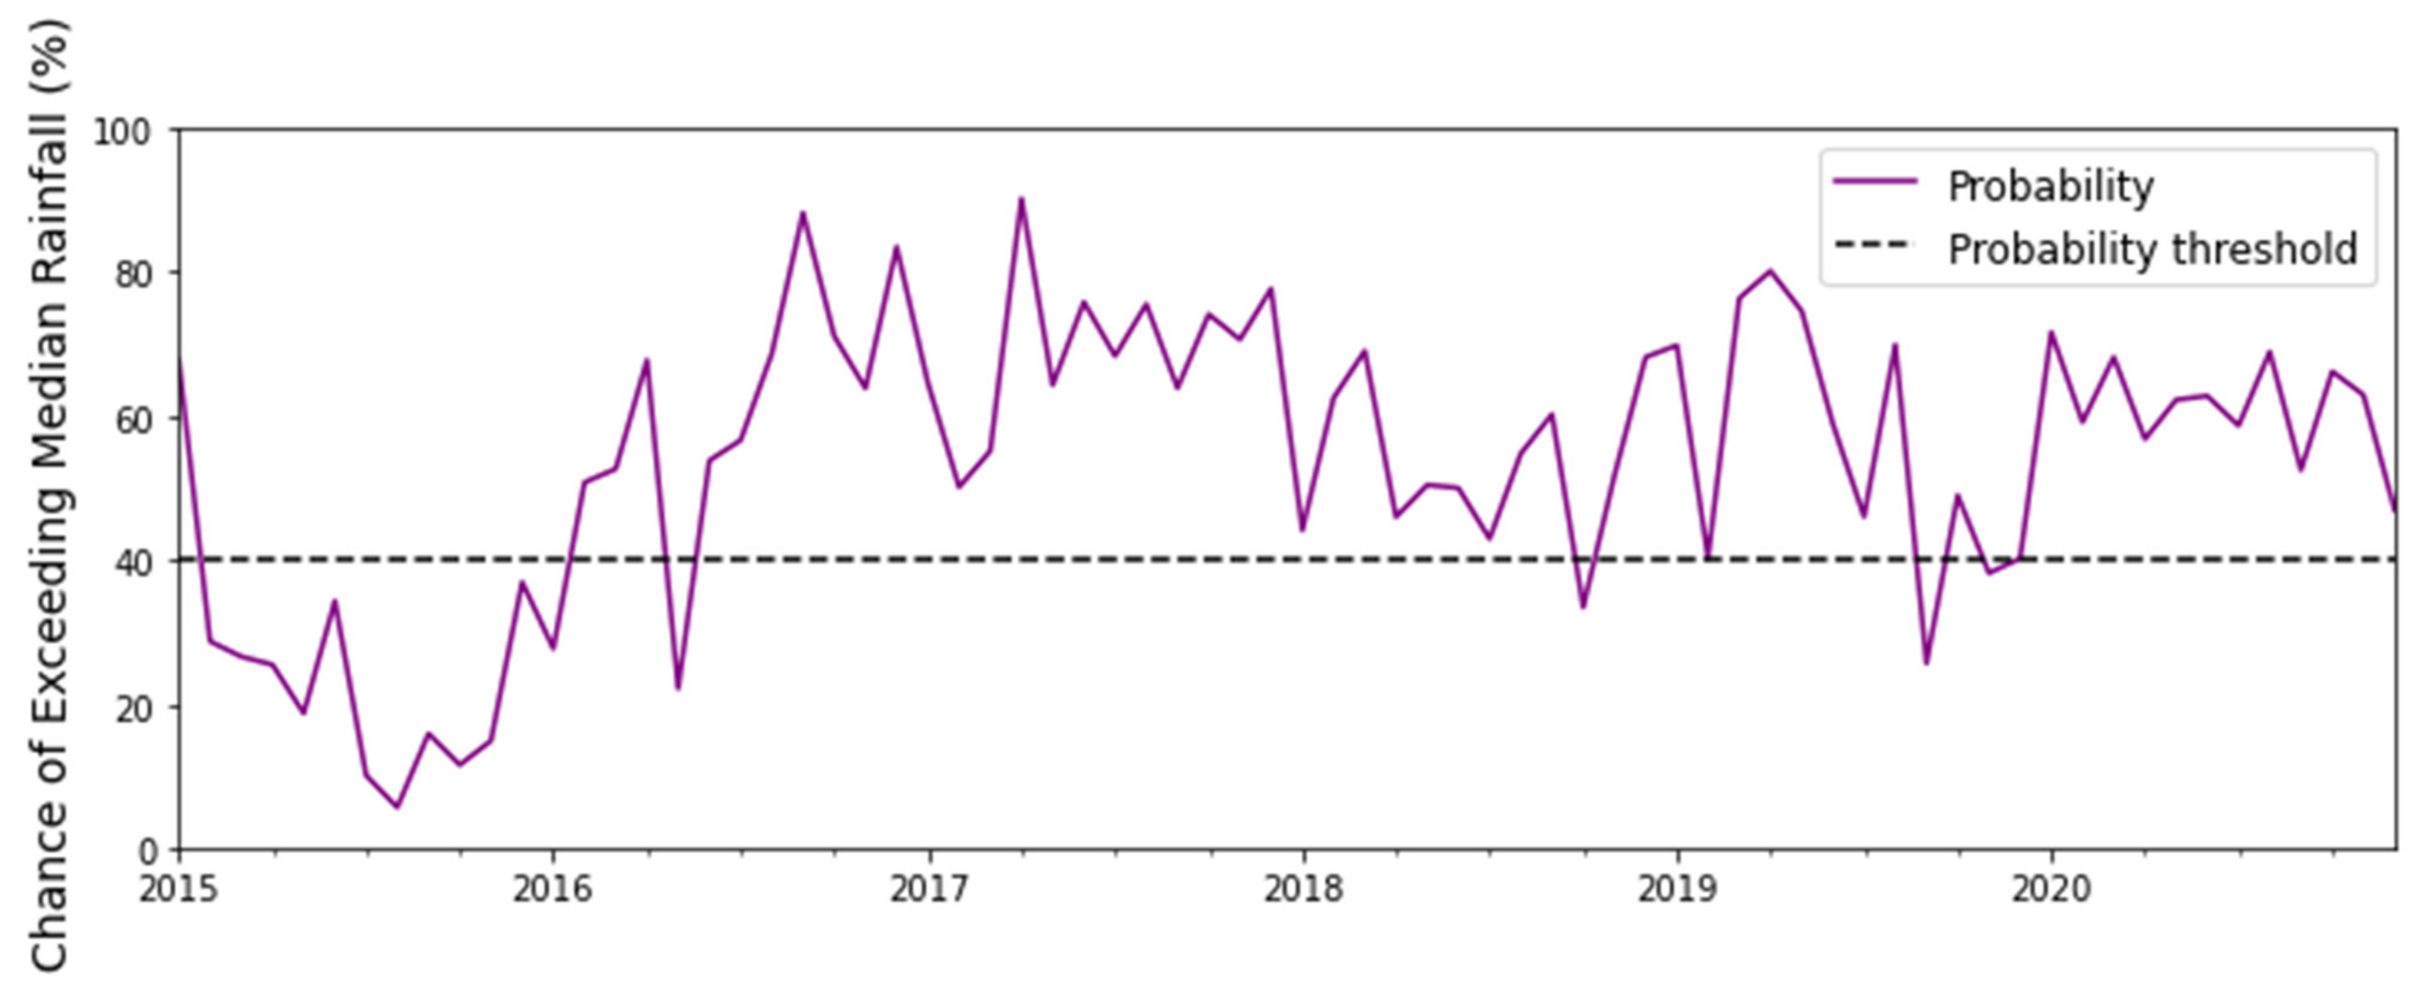
| Chance of Exceeding Median Rainfall [51,52] | ECMWF’s CEMR is generated from a complex dynamic climate prediction model that uses a range of initial conditions and evolves them for 50 ensemble members. | 1-month forecast conditions projected | CEMR-1 < 40% indicates low chance of exceeding median rainfall for the next month | 2015 to now | O640 (~18 km) |
| Input | National Mean | National Median | National Standard Deviation | |
|---|---|---|---|---|
| SPI-3 | GSMaP | −0.01 | 0.18 | 0.72 |
| MSWEP | 0.31 | 0.47 | 0.62 | |
| VHI-3 | 44.75 | 45.68 | 3.21 | |
| CEMR-1 | 53.80 | 57.72 | 19.85 | |
| Determinants of Actionable Early Warning Communication | ||
|---|---|---|
| Trust | Gender-Specific Inclusions | Traditional Knowledge Inclusions |
|
|
|
Publisher’s Note: MDPI stays neutral with regard to jurisdictional claims in published maps and institutional affiliations. |
© 2021 by the authors. Licensee MDPI, Basel, Switzerland. This article is an open access article distributed under the terms and conditions of the Creative Commons Attribution (CC BY) license (https://creativecommons.org/licenses/by/4.0/).
Share and Cite
Bhardwaj, J.; Kuleshov, Y.; Chua, Z.-W.; Watkins, A.B.; Choy, S.; Sun, Q. Building Capacity for a User-Centred Integrated Early Warning System for Drought in Papua New Guinea. Remote Sens. 2021, 13, 3307. https://0-doi-org.brum.beds.ac.uk/10.3390/rs13163307
Bhardwaj J, Kuleshov Y, Chua Z-W, Watkins AB, Choy S, Sun Q. Building Capacity for a User-Centred Integrated Early Warning System for Drought in Papua New Guinea. Remote Sensing. 2021; 13(16):3307. https://0-doi-org.brum.beds.ac.uk/10.3390/rs13163307
Chicago/Turabian StyleBhardwaj, Jessica, Yuriy Kuleshov, Zhi-Weng Chua, Andrew B. Watkins, Suelynn Choy, and Qian (Chayn) Sun. 2021. "Building Capacity for a User-Centred Integrated Early Warning System for Drought in Papua New Guinea" Remote Sensing 13, no. 16: 3307. https://0-doi-org.brum.beds.ac.uk/10.3390/rs13163307