
A Multi-Scale Spatial Attention Region Proposal Network for High-Resolution Optical Remote Sensing Imagery


1
Jinling Institute of Technology, Nanjing 211169, China
2
Software Testing Engineering Laboratory of Jiangsu Province, Nanjing 211169, China
3
Key Laboratory of Intelligent Perception and Image Understanding of Ministry of Education of China, Xidian University, Xi’an 710071, China
4
School of Mathematics and Statistics, Xi’an Jiaotong University, Xi’an 710049, China
*
Author to whom correspondence should be addressed.
Remote Sens. 2021, 13(17), 3362; https://0-doi-org.brum.beds.ac.uk/10.3390/rs13173362
Submission received: 1 June 2021
/
Revised: 18 August 2021
/
Accepted: 21 August 2021
/
Published: 25 August 2021
Abstract
:Deep convolutional neural networks (DCNNs) are driving progress in object detection of high-resolution remote sensing images. Region proposal generation, as one of the key steps in object detection, has also become the focus of research. High-resolution remote sensing images usually contain various sizes of objects and complex background, small objects are easy to miss or be mis-identified in object detection. If the recall rate of region proposal of small objects and multi-scale objects can be improved, it will bring an improvement on the performance of the accuracy in object detection. Spatial attention is the ability to focus on local features in images and can improve the learning efficiency of DCNNs. This study proposes a multi-scale spatial attention region proposal network (MSA-RPN) for high-resolution optical remote sensing imagery. The MSA-RPN is an end-to-end deep learning network with a backbone network of ResNet. It deploys three novel modules to fulfill its task. First, the Scale-specific Feature Gate (SFG) focuses on features of objects by processing multi-scale features extracted from the backbone network. Second, the spatial attention-guided model (SAGM) obtains spatial information of objects from the multi-scale attention maps. Third, the Selective Strong Attention Maps Model (SSAMM) adaptively selects sliding windows according to the loss values from the system’s feedback, and sends the windowed samples to the spatial attention decoder. Finally, the candidate regions and their corresponding confidences can be obtained. We evaluate the proposed network in a public dataset LEVIR and compare with several state-of-the-art methods. The proposed MSA-RPN yields a higher recall rate of region proposal generation, especially for small targets in remote sensing images.
1. Introduction
Deep convolutional neural networks have promoted tremendous advances in computer vision, particularly in the field of object detection. Two networks have attracted the most attentions of object detection researchers: the Faster RCNN [1], the representative of two-stage algorithms, and YOLO [2], a typical case of one-stage algorithms. The two-stage algorithms usually present high recognition rates, and have been extensively used for detection on remote sensing images. High-resolution remote sensing images usually cover vast lands and oceans with targets in various sizes, so identifying targets in them is quite challenging. The two-stage algorithms usually generate object proposals first, that is, to localize target areas. Thus, object proposals have become the critical issue in detection tasks on remote sensing images.
Object proposal methods intend to outline candidate areas from images that hypothetically contain targets. These results exclude class information. Hosang et al. [3] demonstrated that “for object detection improving proposal localization accuracy is as important as improving recall”. The higher the recall of proposal regions, the greater the accuracies of the final detection results. Object proposal methods use coordinates to mark the positions of objects [3], and hardly have any prior information, like object category, to fulfill this task.
Techniques to generate object proposals can be categorized into three groups [3]: grouping methods [4,5], window scoring methods [6,7,8], and deep learning methods [1]. Grouping methods and window scoring methods depend on artificially designed features. They are inept at large amount of images and diversified scenarios. Within the framework of the Faster RCNN, He et al. [1] designed a fully-convolutional network, Region Proposal Network(RPN), to simultaneously predict object boundaries and object scores, integrating region proposal and object classification into an end-to-end process. RPN inspired a series of object proposal methods based on deep neural networks, including AttractioNet [9], DeepMask [10], SharpMask [11] that is based on DeepMask [10], and FastMask [12]. Among them, DeepMask [10] is outstanding. It outperforms the RPN model in the average recall rate when being applied to the public image dataset COCO. Different from the RPN [1] model, it uses object instance segmentation to generate candidate areas.
Many researchers have applied the regional proposal methods for natural images to remote sensing images. However, remote sensing images are quite different from natural images: a remote sensing image usually covers a vast area involving large amount of data, rich texture information, and targets that almost blend into backgrounds; objects in them hold various sizes, and smaller ones usually crowded together [13]. Some scholars have intended to improve traditional regional proposal methods specifically for remote sensing images. Zhong et al. [14] improved the accuracy of region proposals by a position-sensitive balancing framework. Li et al. [15] introduced multi-angle anchor points based on the Faster R-CNN [1] framework to construct a rotation-insensitive RPN, which effectively solved the problem of rotation changes of geospatial objects. Based on Faster R-CNN, Tang et al. [16] combined a region proposal network with hierarchical feature maps to extract vehicle-like targets, and improved the accuracy of region proposals. Although some of their efforts have paid off, their approaches can still hardly improve the accuracy for complex situations, like diversified sizes of objects co-existing in images where the recall rate of regional proposals for smaller targets stays low.
Attention mechanism, one of the most valuable breakthroughs in deep Learning, has been widely used in many fields, such as natural language processing, image recognition, speech recognition, and image caption [17,18]. Three types of attention mechanism are popular: spatial attention [19,20], channel attention [21], and hybrid attention [22,23]. The spatial attention focuses on ’where’ is an informative part, which transforms the spatial information in the original image into another space and retains the key information [23]. Many networks have been proposed deploying the spatial attention networks, like Spatial Transformer Network (STN) proposed by Google Deep Mind [19], and dynamic capacity networks [20]. The spatial attention locates targets, and then performs certain transformations or assigns weights. It is proper for tasks of locating regions of interest.
For natural images, some approaches adopted attention mechanism to generate proposals specifically for small targets. Christuan Wihms et al. [24] designed AttentionMask based on FastMask [12]. They added an extra module to the backbone network of FastMask to focus on the small objects that might be missed before. They also deployed a Scale-specific Objectness Attention Model (SOAM) that utilizes the vision attention mechanism [17]. The whole performance of AttentionMask has risen from that of FastMask. However, given the difference between natural images and remote sensing images, AttentionMask are not quite prepared for remote sensing images. In AttentionMask, the sliding windows for the attention mechanism are selected subjectively, bringing uncertainty to the whole system.
Therefore, this paper proposes a regional proposal generation method for remote sensing images, and focuses on two problems: first, the candidate regions of small objects would be missed or mis-identified among those of diversified sizes of objects; Second, the subjectively-selected sliding windows would impose uncertainty on final results. This approach extracts multi-scale features from deep convolutional nerves and the attention mechanism to efficiently generate region proposals. It can lay the foundation for consequent target detection, and improve the accuracy and efficiency of the detection. Experimental on the LEVIR dataset [25] demonstrates that the proposed approach holds a 2%∼3% higher recall rate, compared with those of the state-of-the-art methods, including RPN [1], FastMask [12], AttentionMask [24], etc.
The proposed approach innovates in the following aspects,
- Development of the scale-specific feature gate that can obtain features from multi-scales, representing semantic information of objects of different sizes. It avoids the misidentification of regional proposals that are caused by various sizes of objects.
- Development of the spatial attention-guided module that uses the multi-scale features to greatly reduce the computing power and improve the accuracy of candidate region generation. It can help the system notice the small objects that might be missed.
- Development of a selective attention module that can adaptively select the appropriate sampling windows based on the feedback of the system, instead of subjectively selecting part of the sliding window of the attention mechanism. It lifts the uncertainty that the subjectively-selected sliding windows might bring.
The rest of the article is organized as follows: Section 2 describes the principles and workflows of the proposed method; Experiments are shown in Section 3; Section 4 reports the experimental results on the LEVIR dataset in comparison with other state-of-the-art methods, and some ablation experiment results; Conclusions are drawn in Section 5.
2. Materials and Method
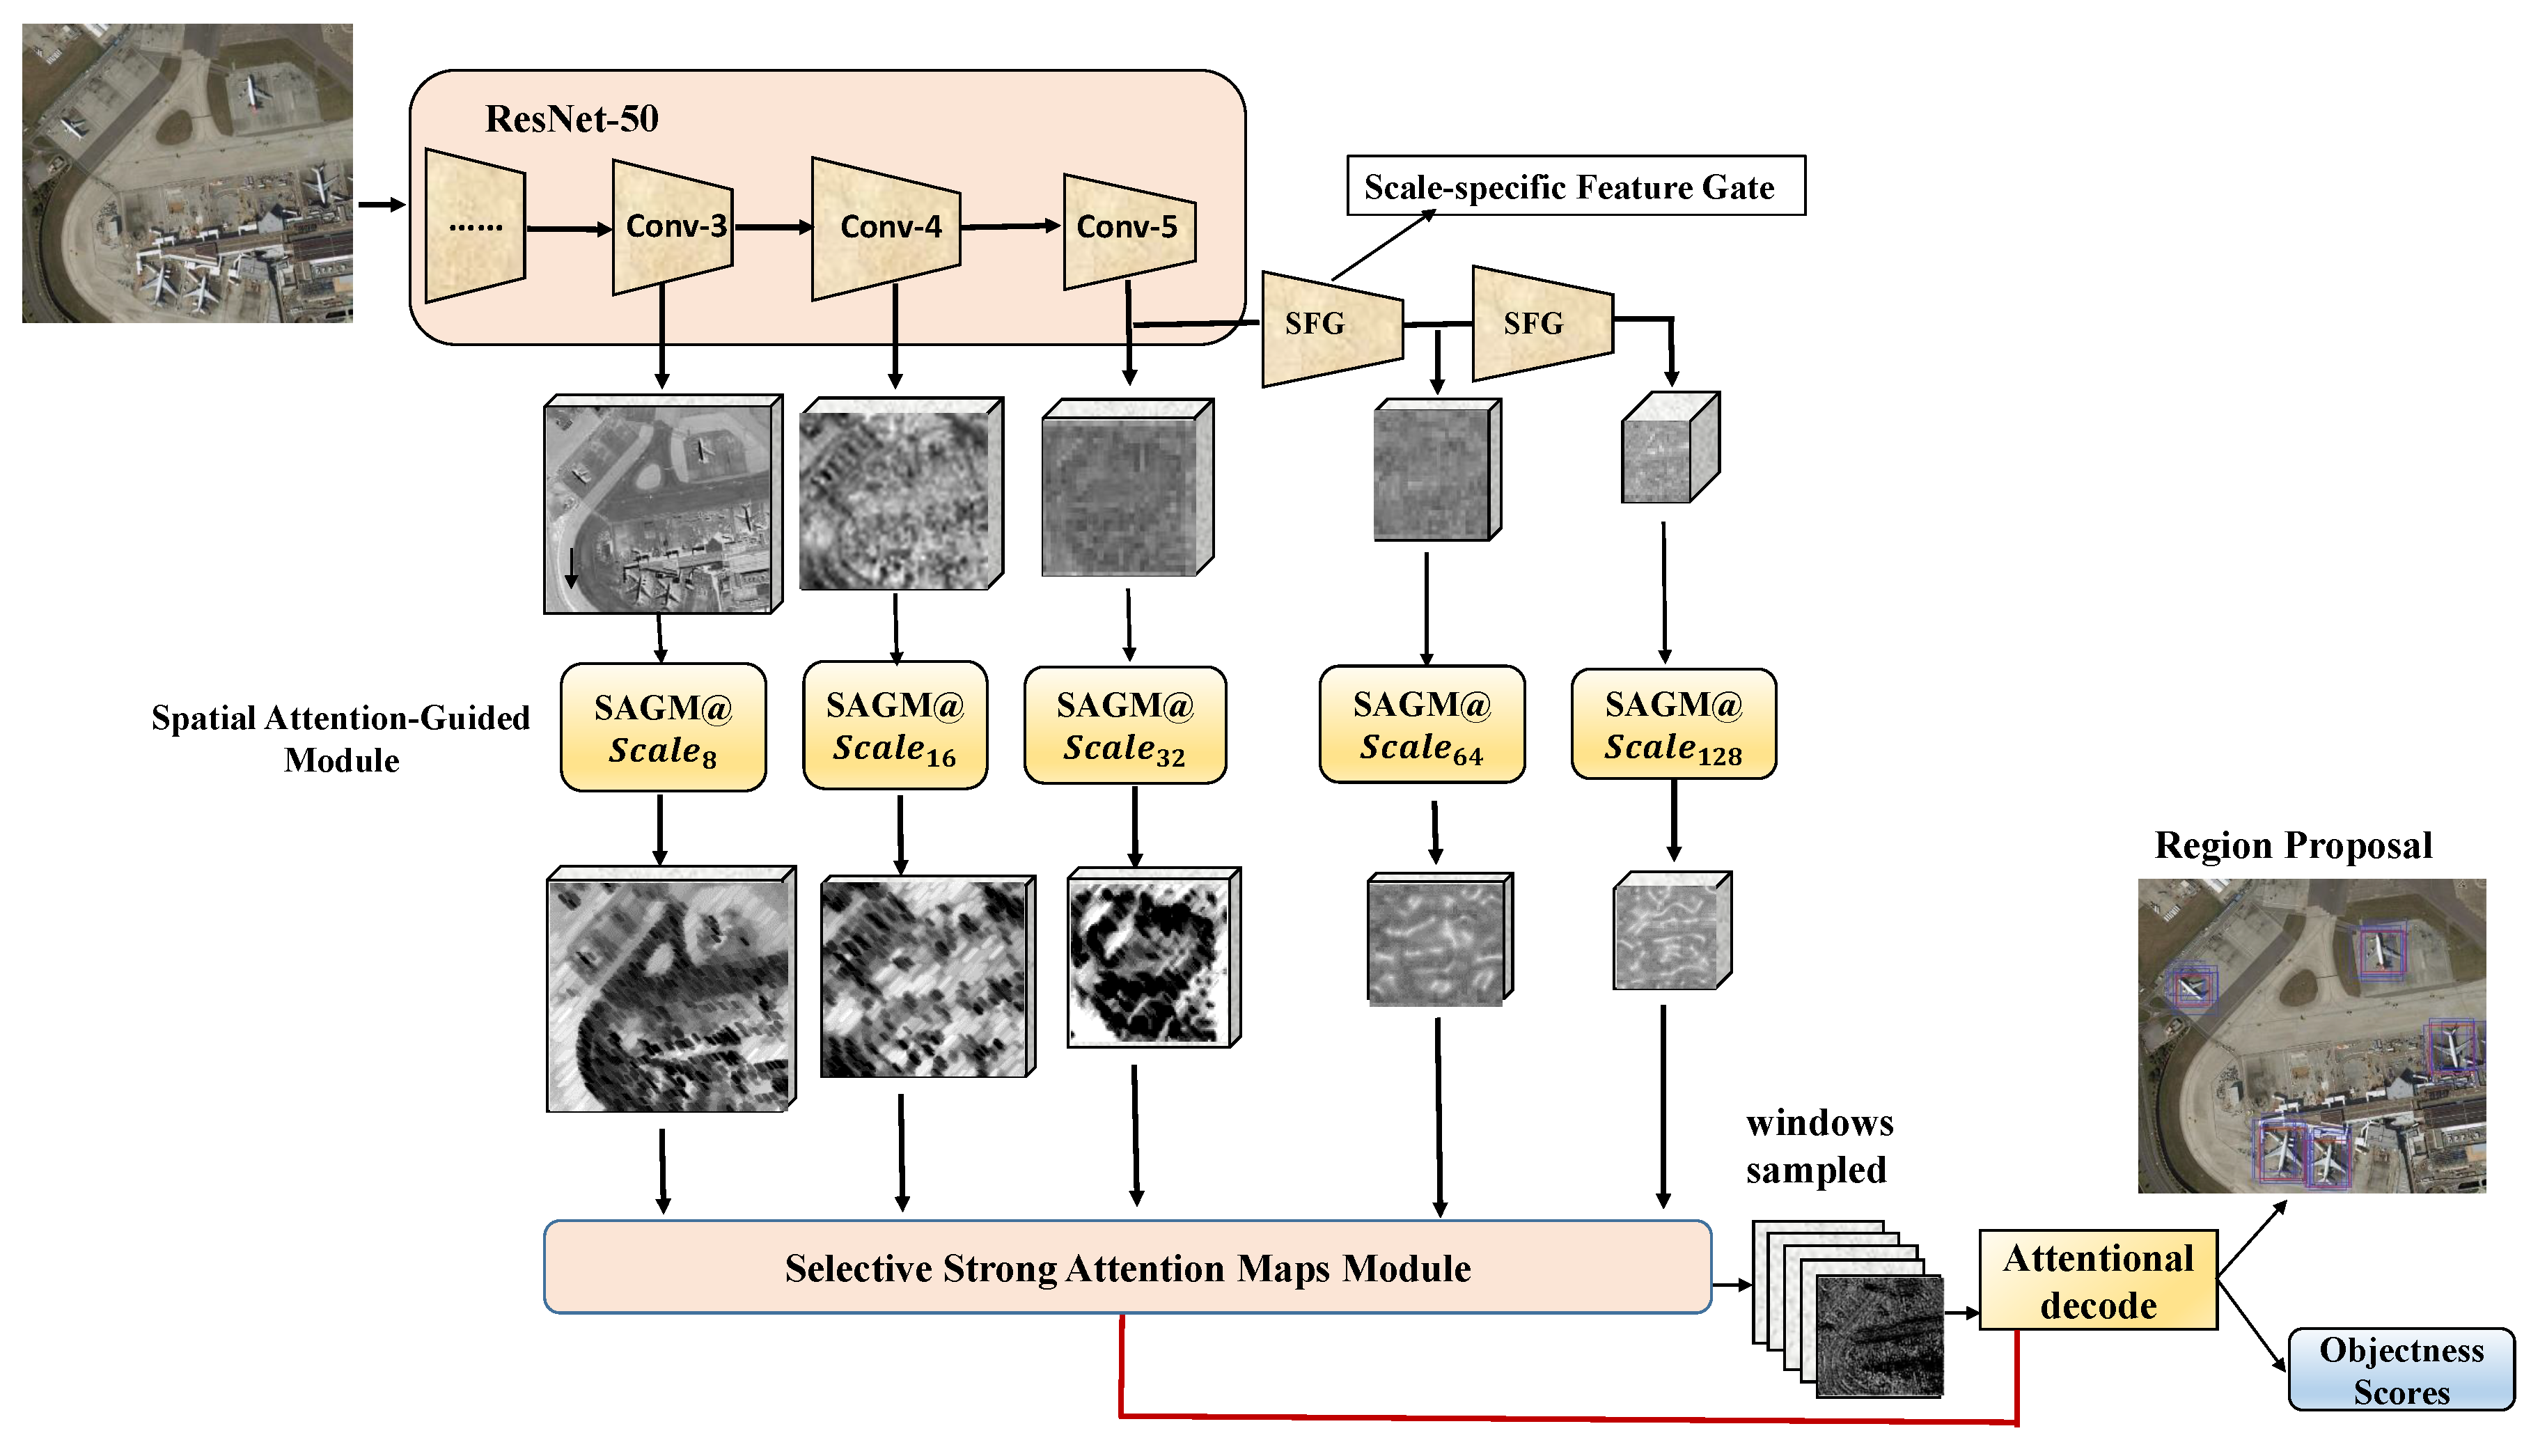
This approach proposes a network that incorporates an object proposal method and a multi-scale spatial attention mechanism (MSA-RPN). The framework is illustrated in Figure 1. The backbone of MSA-RPN is ResNet-50 [26]. First, the remote sensing image input into the MSA-RPN is processed by the backbone network and three scales of features Scale, Scale, Scale are extracted. These features are processed through the scale-specific feature gates and smaller feature maps Scale and Scale are output. Second, a spatial attention-guided module is assigned on each of the five scales of features. This module calculates an attention value for each position in the feature maps and determines whether there is an object at that position. Then all the attention values are jointly ranked. The maps containing positions of the most-likely-existing objects undergo window sampling, and the windows are scored. Third, the selective strong attention maps model(SSAMM) adaptively selects K sampling windows corresponding to the threshold range, and sends them to the attention decoder. Thus, the region proposals and their respect confidences are obtained.
2.1. Multi-Scale Features
In this study, the multi-scale features refer to those extracted from multiple remote sensing images of different sizes that have gone through different convolutional layers in the networks. Features obtained from different convolutional layers represent different levels of information of the images, those from shallow layers express low-level details of images, while those from deep layers contain high-level semantic information. Given the small sizes of most objects in remote sensing images, features representing low-level details are as important as those containing high-level semantic information for positioning and classification. Therefore, combing features extracted from different convolutional layers and conducting correlation fusion can improve the performance of small target detection.
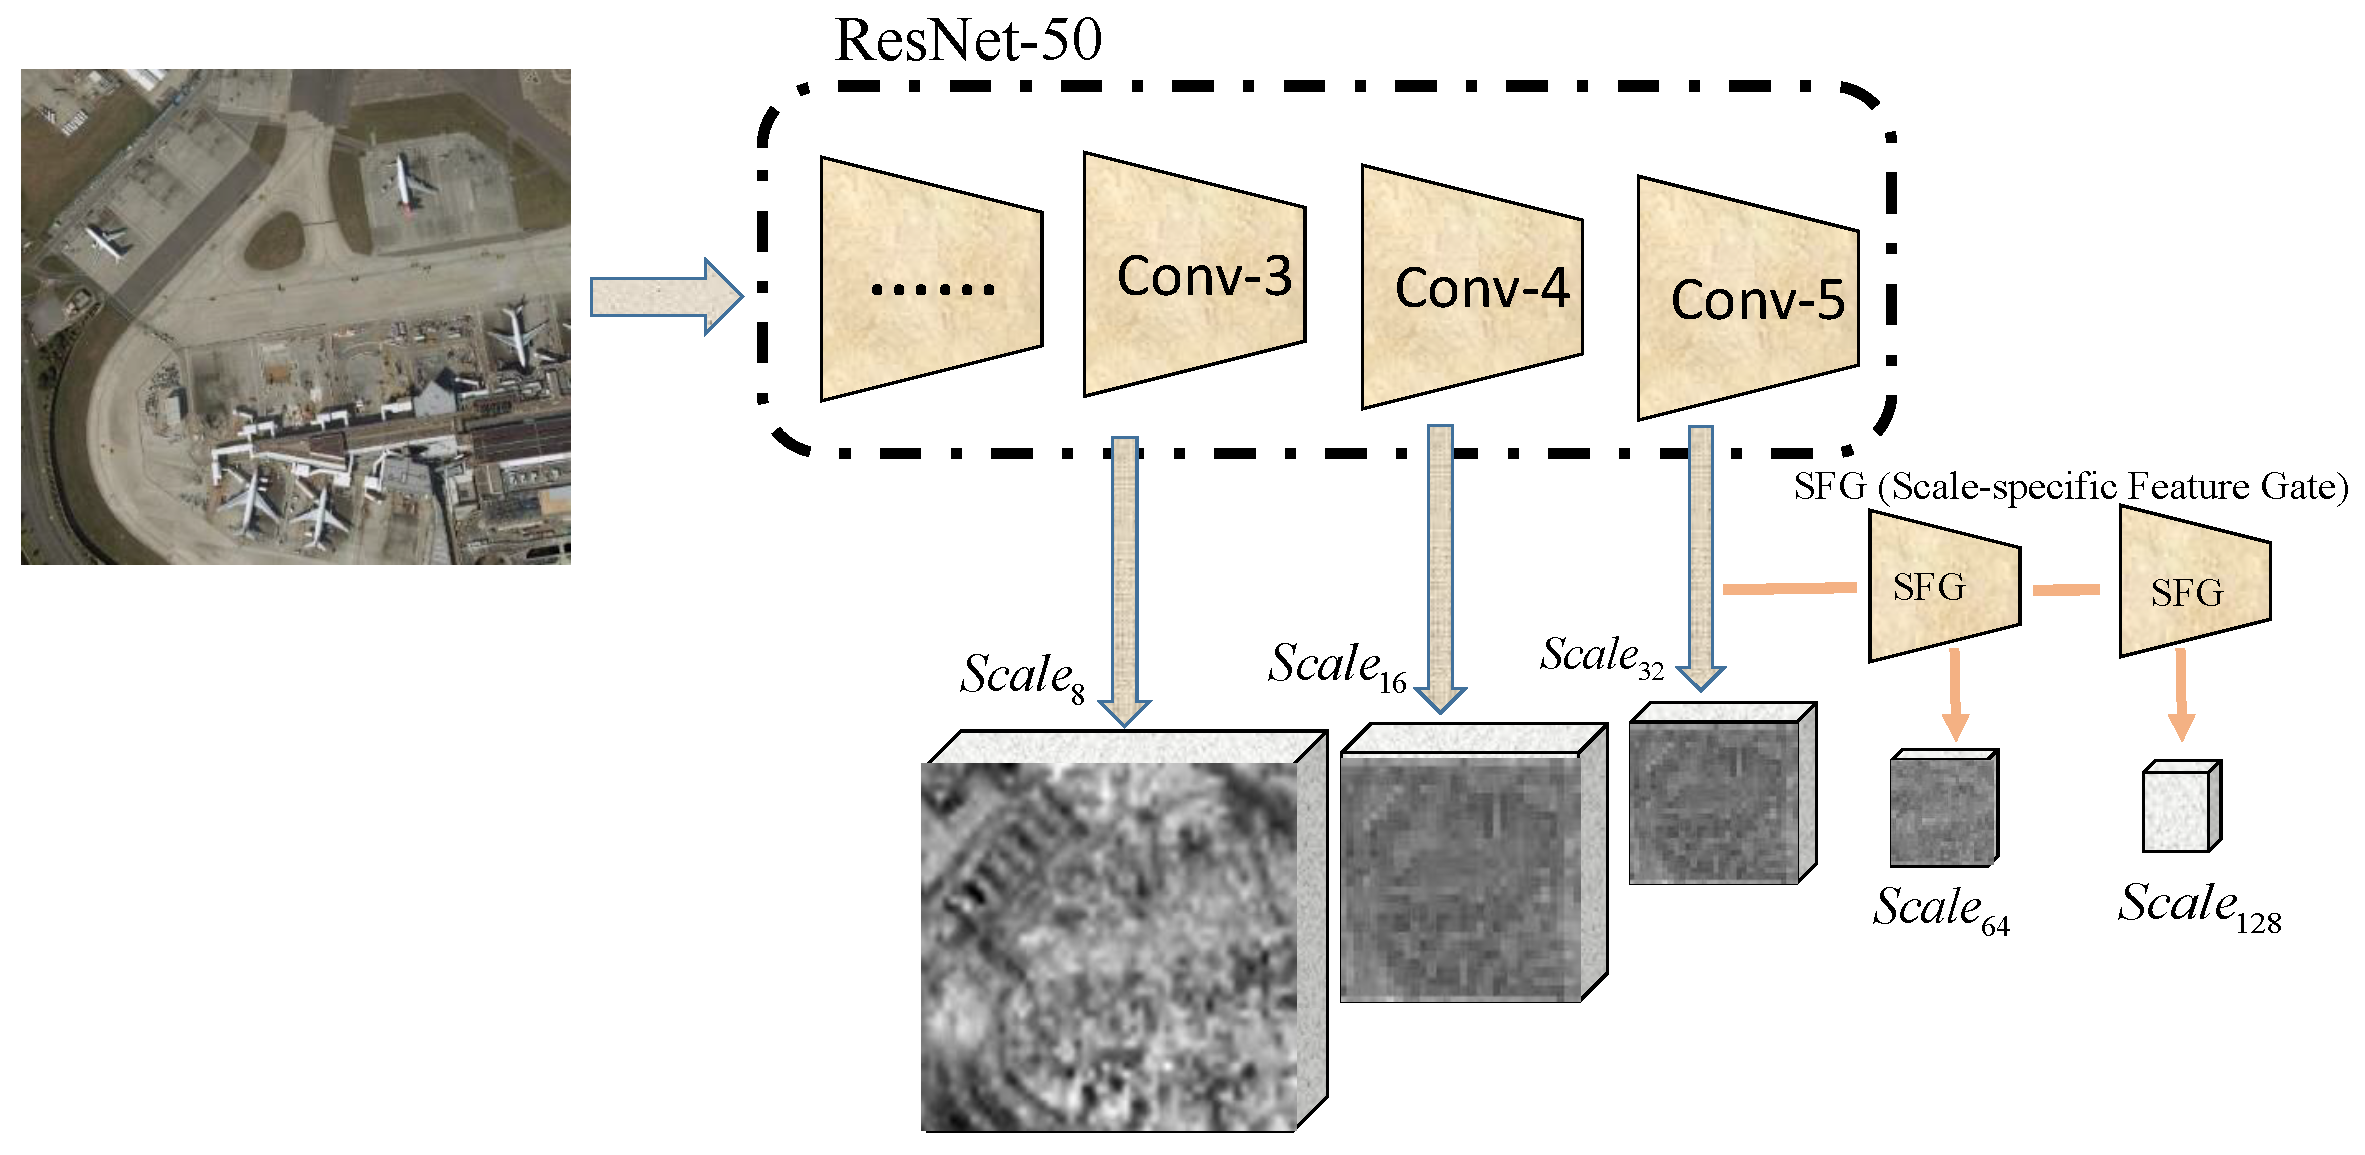
Figure 2 displays the acquisition process of multi-scale features in this work. Suppose a remote sensing image is input into the ResNet-50 network, and feature maps can be extracted from layers of Conv3, Conv4, and Conv5, with a size of 1/8, 1/16, 1/32 of the original image, respectively. These maps further undergo the Scale-specific Feature Gate (SFG) modules and smaller feature maps with semantic information are obtained. Table 1 lists the scales of features obtained through this process.
2.2. Scale-Specific Feature Gate
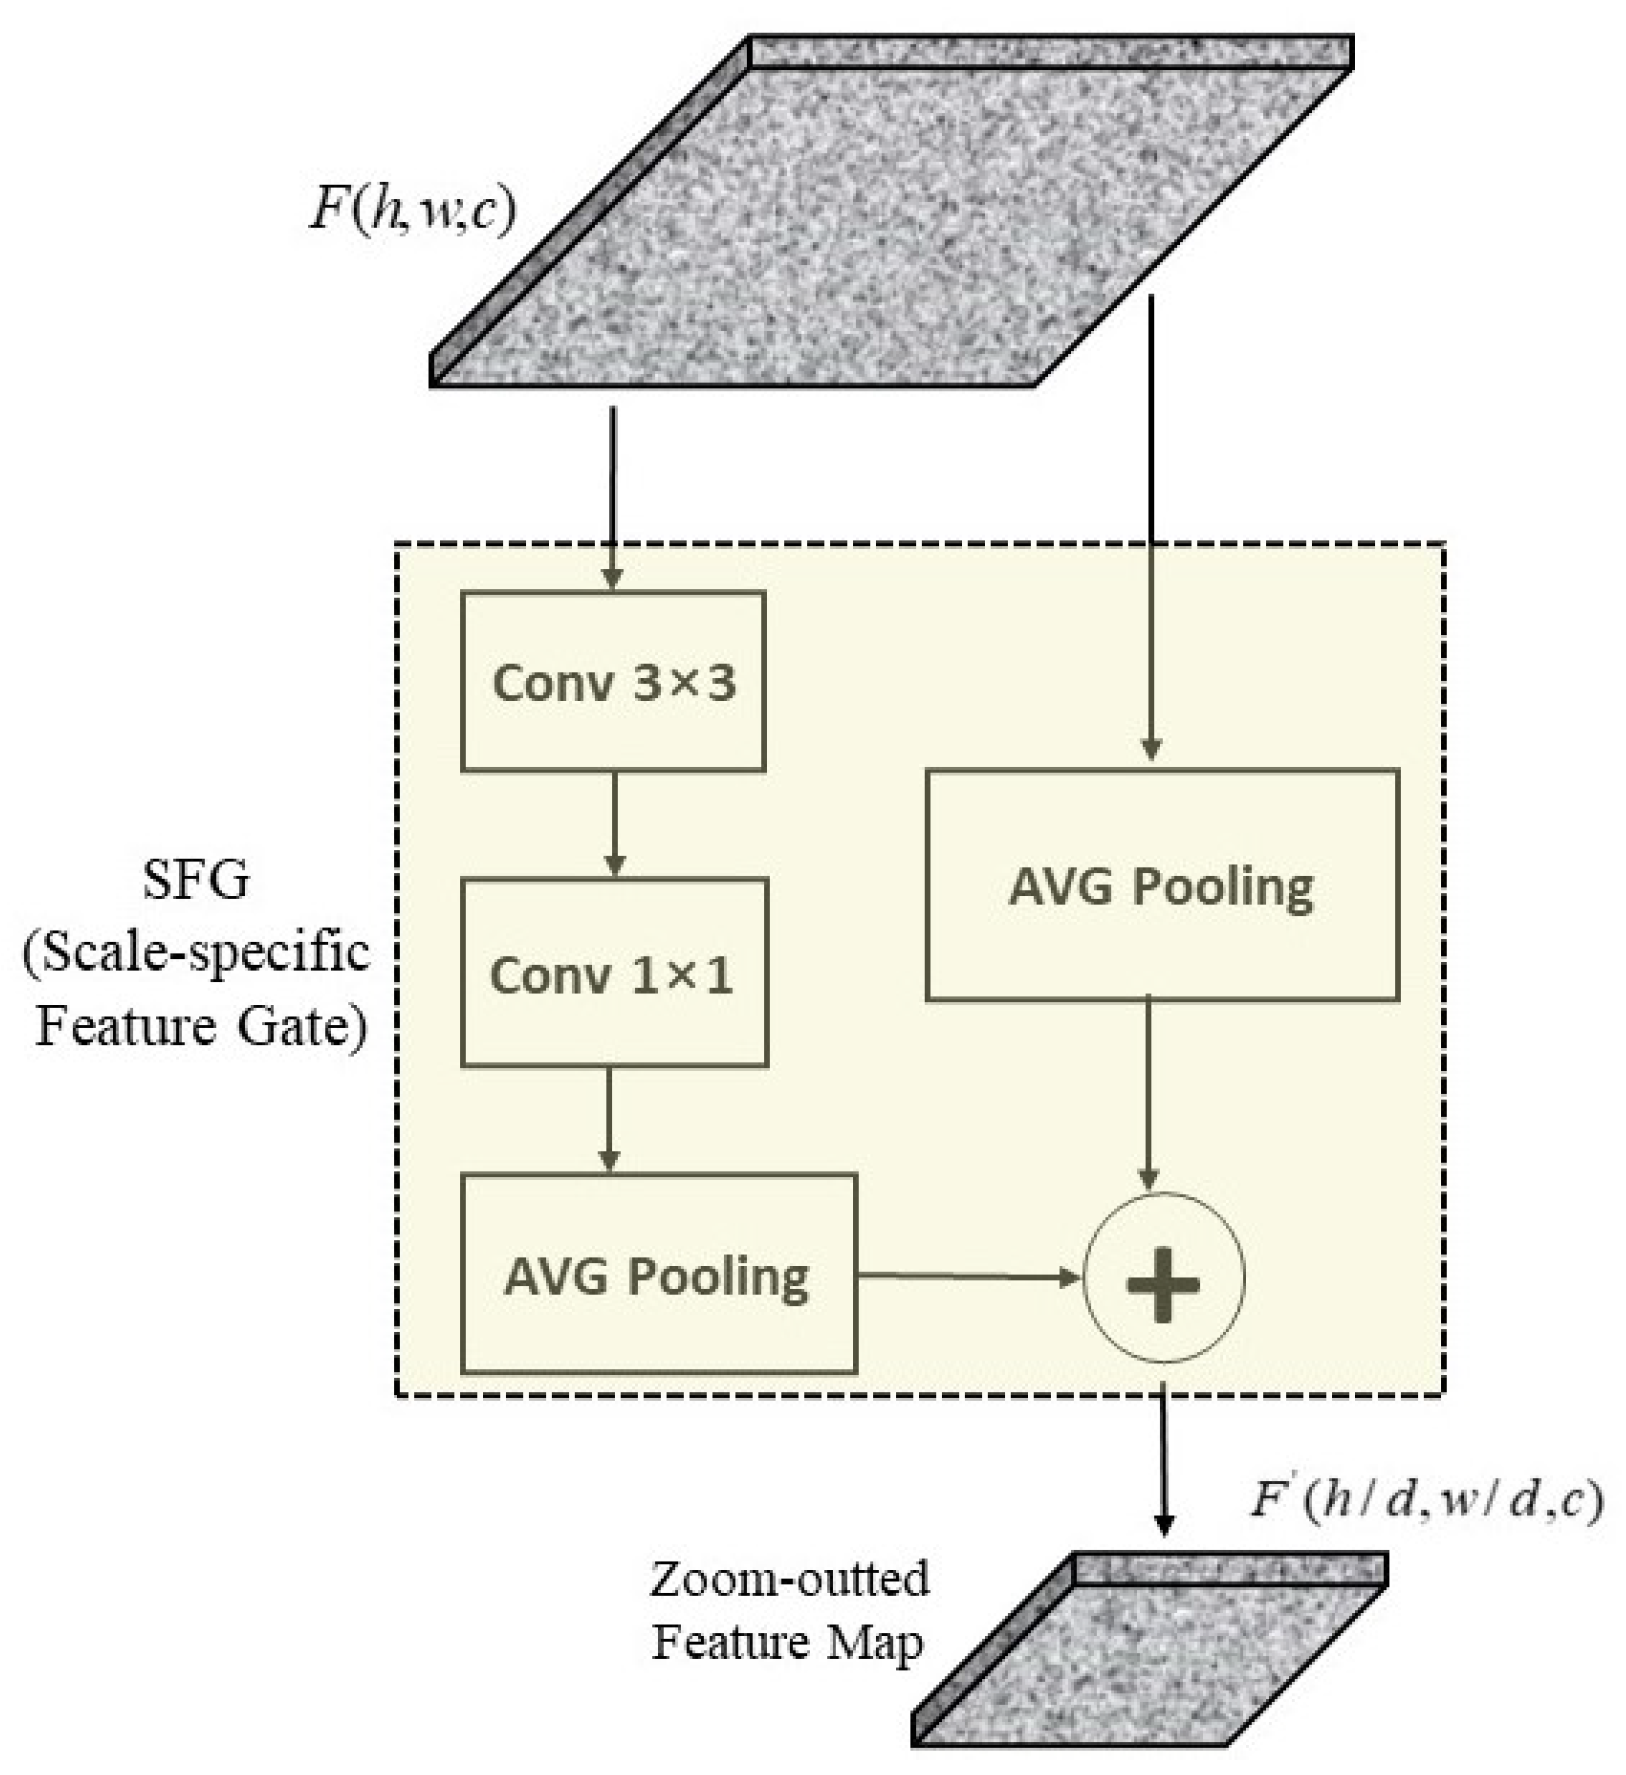
Maximum pooling and average pooling are the two widely used pooling methods in deep convolutional neural networks [27]. After maximum pooling, the value of the processed feature map is significantly greater than that of the bottom one. Average pooling is to obtain the average value of all the pixels in a grid, and preserve more information of the background of the image. The scale-specific feature gates (SFGs) proposed in this paper adopt the average pooling to reduce dimensions and benefit the transmission of semantic information to the next modules. Figure 3 depicts the working process of a SFG. The SFGs condense the feature maps of Scale into maps of Scale and then Scale. A SFG uses two branches to fulfill its task. One branch condenses the feature maps by sequentially dealing them through a convolution layer a convolution layer, and an average pooling process; simultaneously, the other branch sends the input feature maps into another average pooling to retain the semantic information that may be lost through the convolution layers. Finally, the SFG integrates the features output by the two branches together. The input of a SFG is denoted as , which i thes output by Conv5 of the ResNet, and the output is denoted as .
2.3. Spatial Attention Guided Model (SAGM)
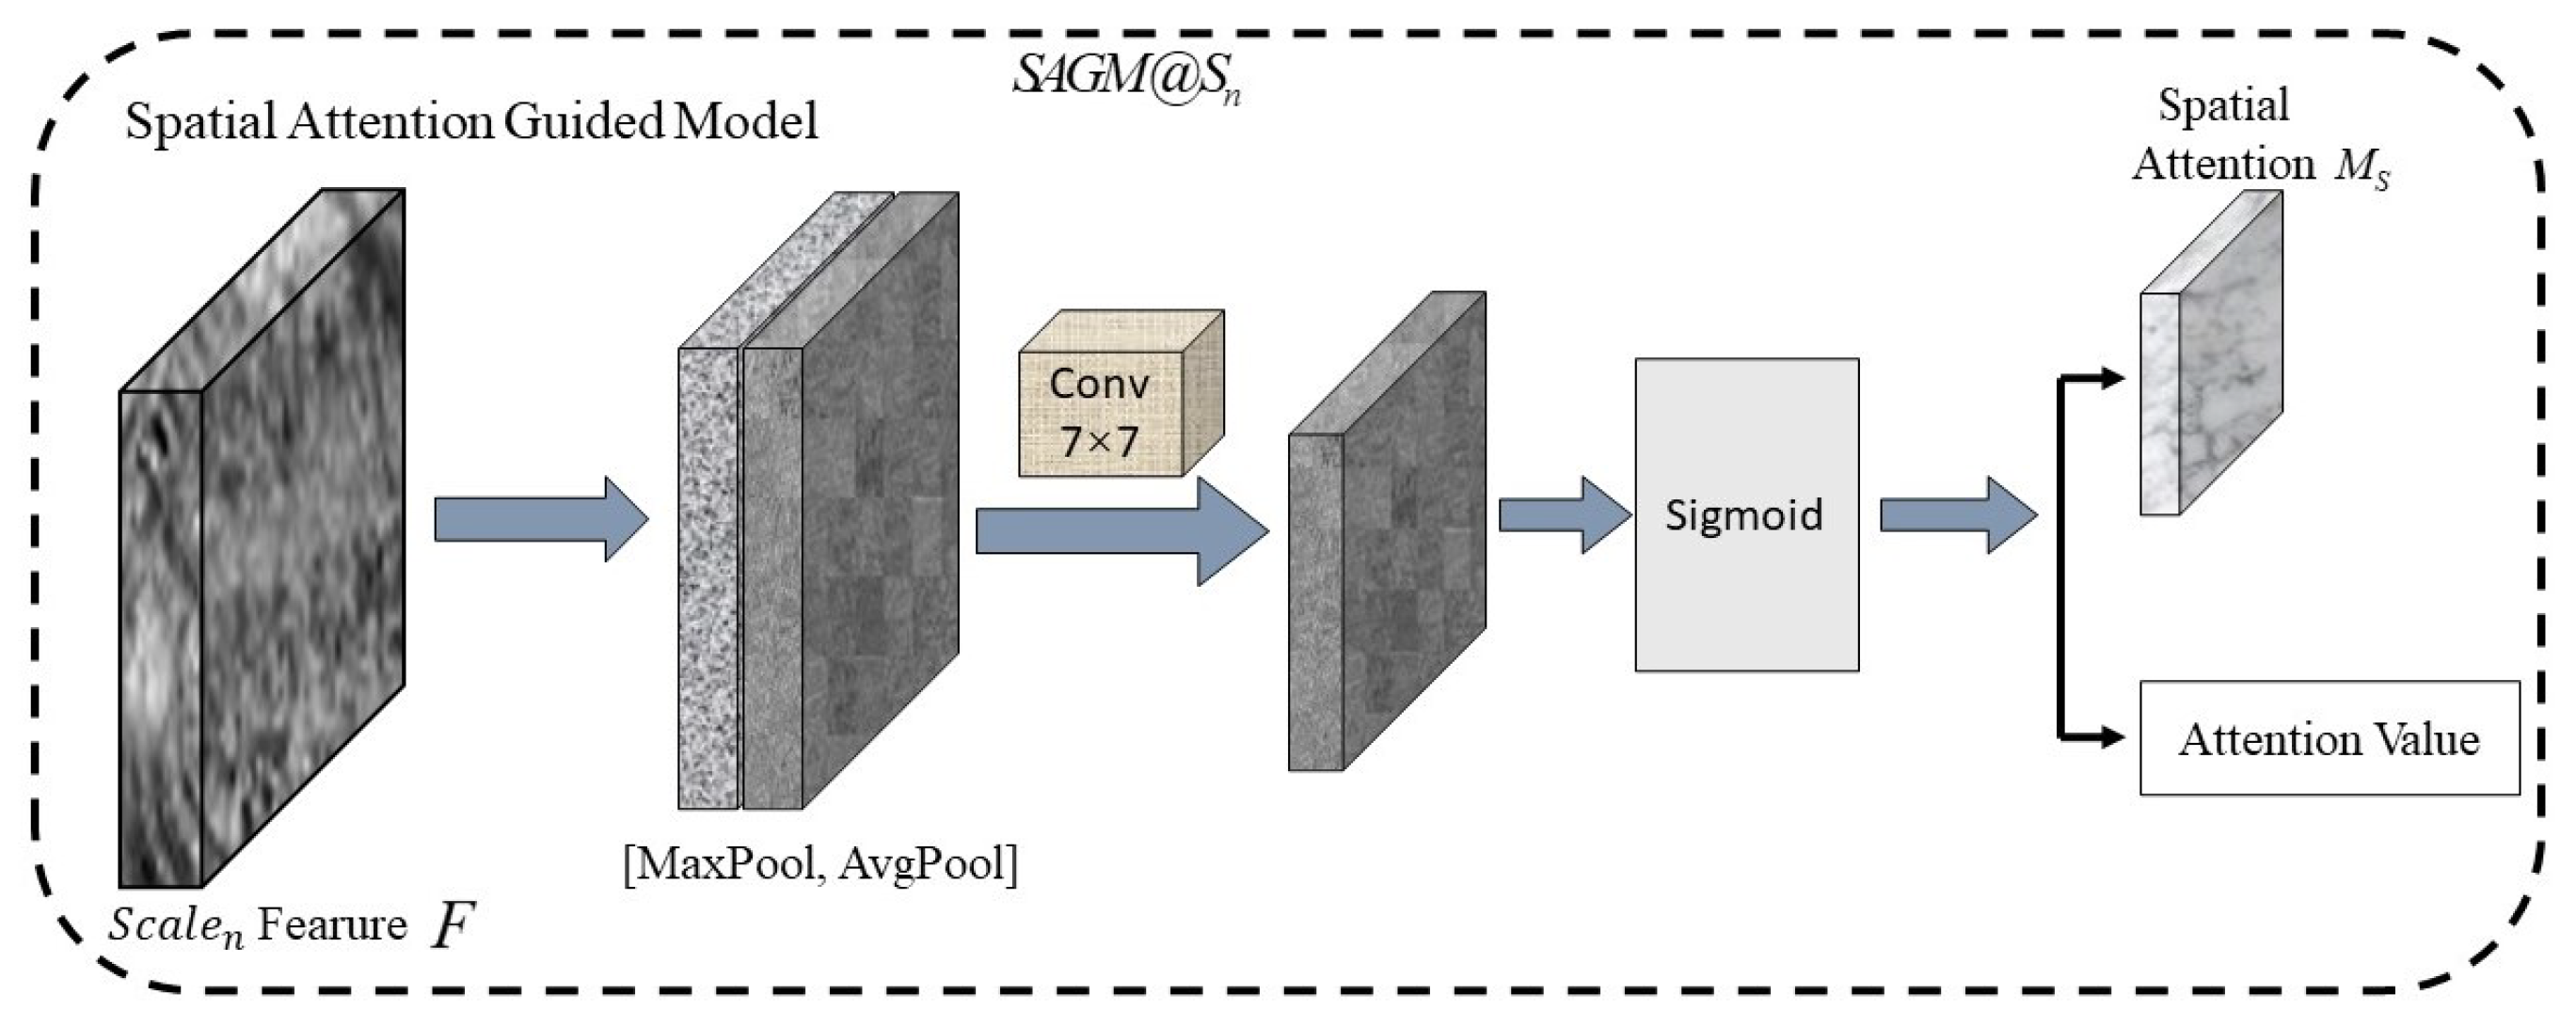
The Spatial Attention Guided Model (SAGM) in MSA-RPN uses the spatial attention to appropriate location information of objects and extract features that can represent the locations. It can reduce the processing time by eliminating redundant features, thus improve the efficiency of the detection. Figure 4 illustrates the structure of a SAGM. Feature F is processed by both the maximum and the average pooling, and the results of the two are merged to a new feature. The fused feature goes through a convolution layer, and the multi classification function sigmoid. Then, the spatial attention map is generated and can be expressed as
where and represent the average pooling and the maximum pooling in the channel direction, respectively, and represents the convolution operation.
2.4. Selective Strong Attention Maps Model (SSAMM)
In MSA-RPN, after SAGMs, a set of attention maps and their respect attention values are obtained. The attention values are ranked in an ascending order, and the maps with the top values are selected for the window sampling (with a sliding window of ). Then multi-windows are obtained. Different networks deploy different strategies to select windows. FastMask selects all sampling windows, resulting in increased calculation cost and decreased system efficiency. AttentionMask selects the first 1000 windows as strong feature windows, and 1000 is an empirical value. This paper proposes the selective strong attention maps model (SSAMM) that can adaptively select the appropriate number of windows based on the feedback of the system. The loss value output by the attention module is input to the SSAMM, and the SSAMM determines K windows to be selected according to the range of the loss value. This adaptive mechanism can help the system to obtain better features, and improve its robustness. Table 2 lists values of K and their corresponding loss values. It should be noted that when the network is initiated, the Loss value is unknown, and K is set as 5000 for the first iteration.
2.5. Loss Function
MSA-RPN intends to complete multiple tasks, so different loss functions are needed. We deploy a regression loss function similar to that in the Faster RCNN, and describe it as
Then the loss function of the candidate region proposal can be expressed as
where represents the four parameterized borders of the ground truth labeled in the original image, and represents the output, that is, the four parameterized coordinates of the predicted candidate anchor box.
Training SAGMs is different from other loss functions, as the number of the negative samples is much larger than that of the positive samples in the feature layers. This imbalance will hinder the work of the binary cross-entropy loss function. Therefore, we adopt two strategies to calculate the loss function when training SAGM. First, we add weight to the binary cross-entropy loss function to alleviate the imbalance between classes, and the weighted binary cross-entropy loss function is described as
where r denotes the ratio of the number of pixels with the label of non-object to that of pixels with the label of object in the ground truth of an objectness spatial attention map, that is, the ratio of the negative samples to the positive ones; represents the weight factor. When and , there is a larger loss. Next, we deploy the negative sample mining strategy that randomly selects three non-object pixels for every object pixel, and establishes a set of positive and negative samples of locations . Then the standard binary cross loss function is combined with the spatial normalization to process the set of positions. The loss function of the SAGM can be expressed as
where s represents the feature label in the spatial attention, and represents the predicted feature label of the object.
In summary, for an image that contains multi objects to be detected, the loss function of MSA-RPN can be expressed as
where M represents the number of feature maps generated by SAGM. is the indicator function that indicates the attention decoding and the candidate anchor box are calculated only when the sample is positive.
3. Experiments
3.1. LEVIR Dataset
We conducted our experiments on the LEVIR (LEarning VIsion and Remote sensing laboratory) dataset [25]. This dataset was established by Zou et al. from Beijing University of Aeronautics and Astronautics. It collects 20,000 high-resolution remote sensing images, mostly from Google Earth, at a size of pixels, and a spatial resolution range of 0.2∼1.0 m/pixel. These images cover most of the geographical types of areas, including cities, villages, mountains, and oceans, and contain three types of targets: aircraft, ships (landed ships and offshore ships) and oil tanks. A total of 11,028 targets have been labeled, including 4724 aircraft, 3025 ships and 3279 oil tanks. Averagely, labeled targets exit in one image. Given the small sizes of the targets, mostly within a range of pixels to pixels, performing object detection on this dataset is challenging.
3.2. Evaluation Metrics
The recall rate can be regarded as an indicator of the performance of object proposal algorithms [3]. the higher the recall rate, the better the performance of the algorithm. The calculation of the recall rate is defined as
where refers to the number of the candidate boxes that contain real targets within the set of the regional proposals, and represents the number of predicted boxes within the set of the regional proposals. Ref. [3] demonstrated that the average recall rate can objectively and effectively evaluate region proposal algorithms. So we adopt the average recall rate as the indicator. Since objects of different sizes in the regional proposals might lead to different detection results, we referred to the evaluation method on the COCO dataset (refer to Table 3), and prepared the same number of region proposals for detection experiments on the large, the medium and the small objects separately.
The definitions of the large, the medium and the small objects in high-resolution remote sensing images are quite different from those in the COCO dataset [28]. We adopted the definitions in Sig-NMS [29] that uses the “object-image ratio” as the threshold. Namely, ,where is the area of the object and the are of the image. When , the corresponding object t is defined as a small object; When , t is a medium object; and when , t is a large object.
3.3. Implementation Details
We performed the MSA-RPN within the Caffe Version framework [30], on a computer with the operating system of Ubuntu , and the GPU of NVIDIA 2080Ti 12G. MSA-RPN was trained by the standard stochastic gradient descent (SGD) with an initial learning rate of . To begin with, the learning rate was multiplied by 10, the momentum selection was set to , the weight decay was [31], and the batch size was 8. The weight factors are , , , . This experiment used the anchor point method to represent region proposals, same with those in Faster RCNN [1], YOLO [2], and AttractNet [9].
4. Results and Discussions
4.1. Comparison of the MSA-RPN and Other State-of-the-Art Methods
We conducted RPN, FastMask and AttentionMask on the LEVIR dataset, together with the proposed MSA-RPN, and compared the results.
Table 4 lists the average recall rates of MSA-RPN and the other algorithms. The recall rate of MSA-RPN for 10 regional proposals is not as high as those of the RPN and the FastMask algorithms, but those of MSA-RPA for 100 and 1000 regional proposals are relatively high. Particularly, for small objects in 100 regional proposals, the recall rate of MSA-RPN is higher than that of the AttentionMask algorithm.
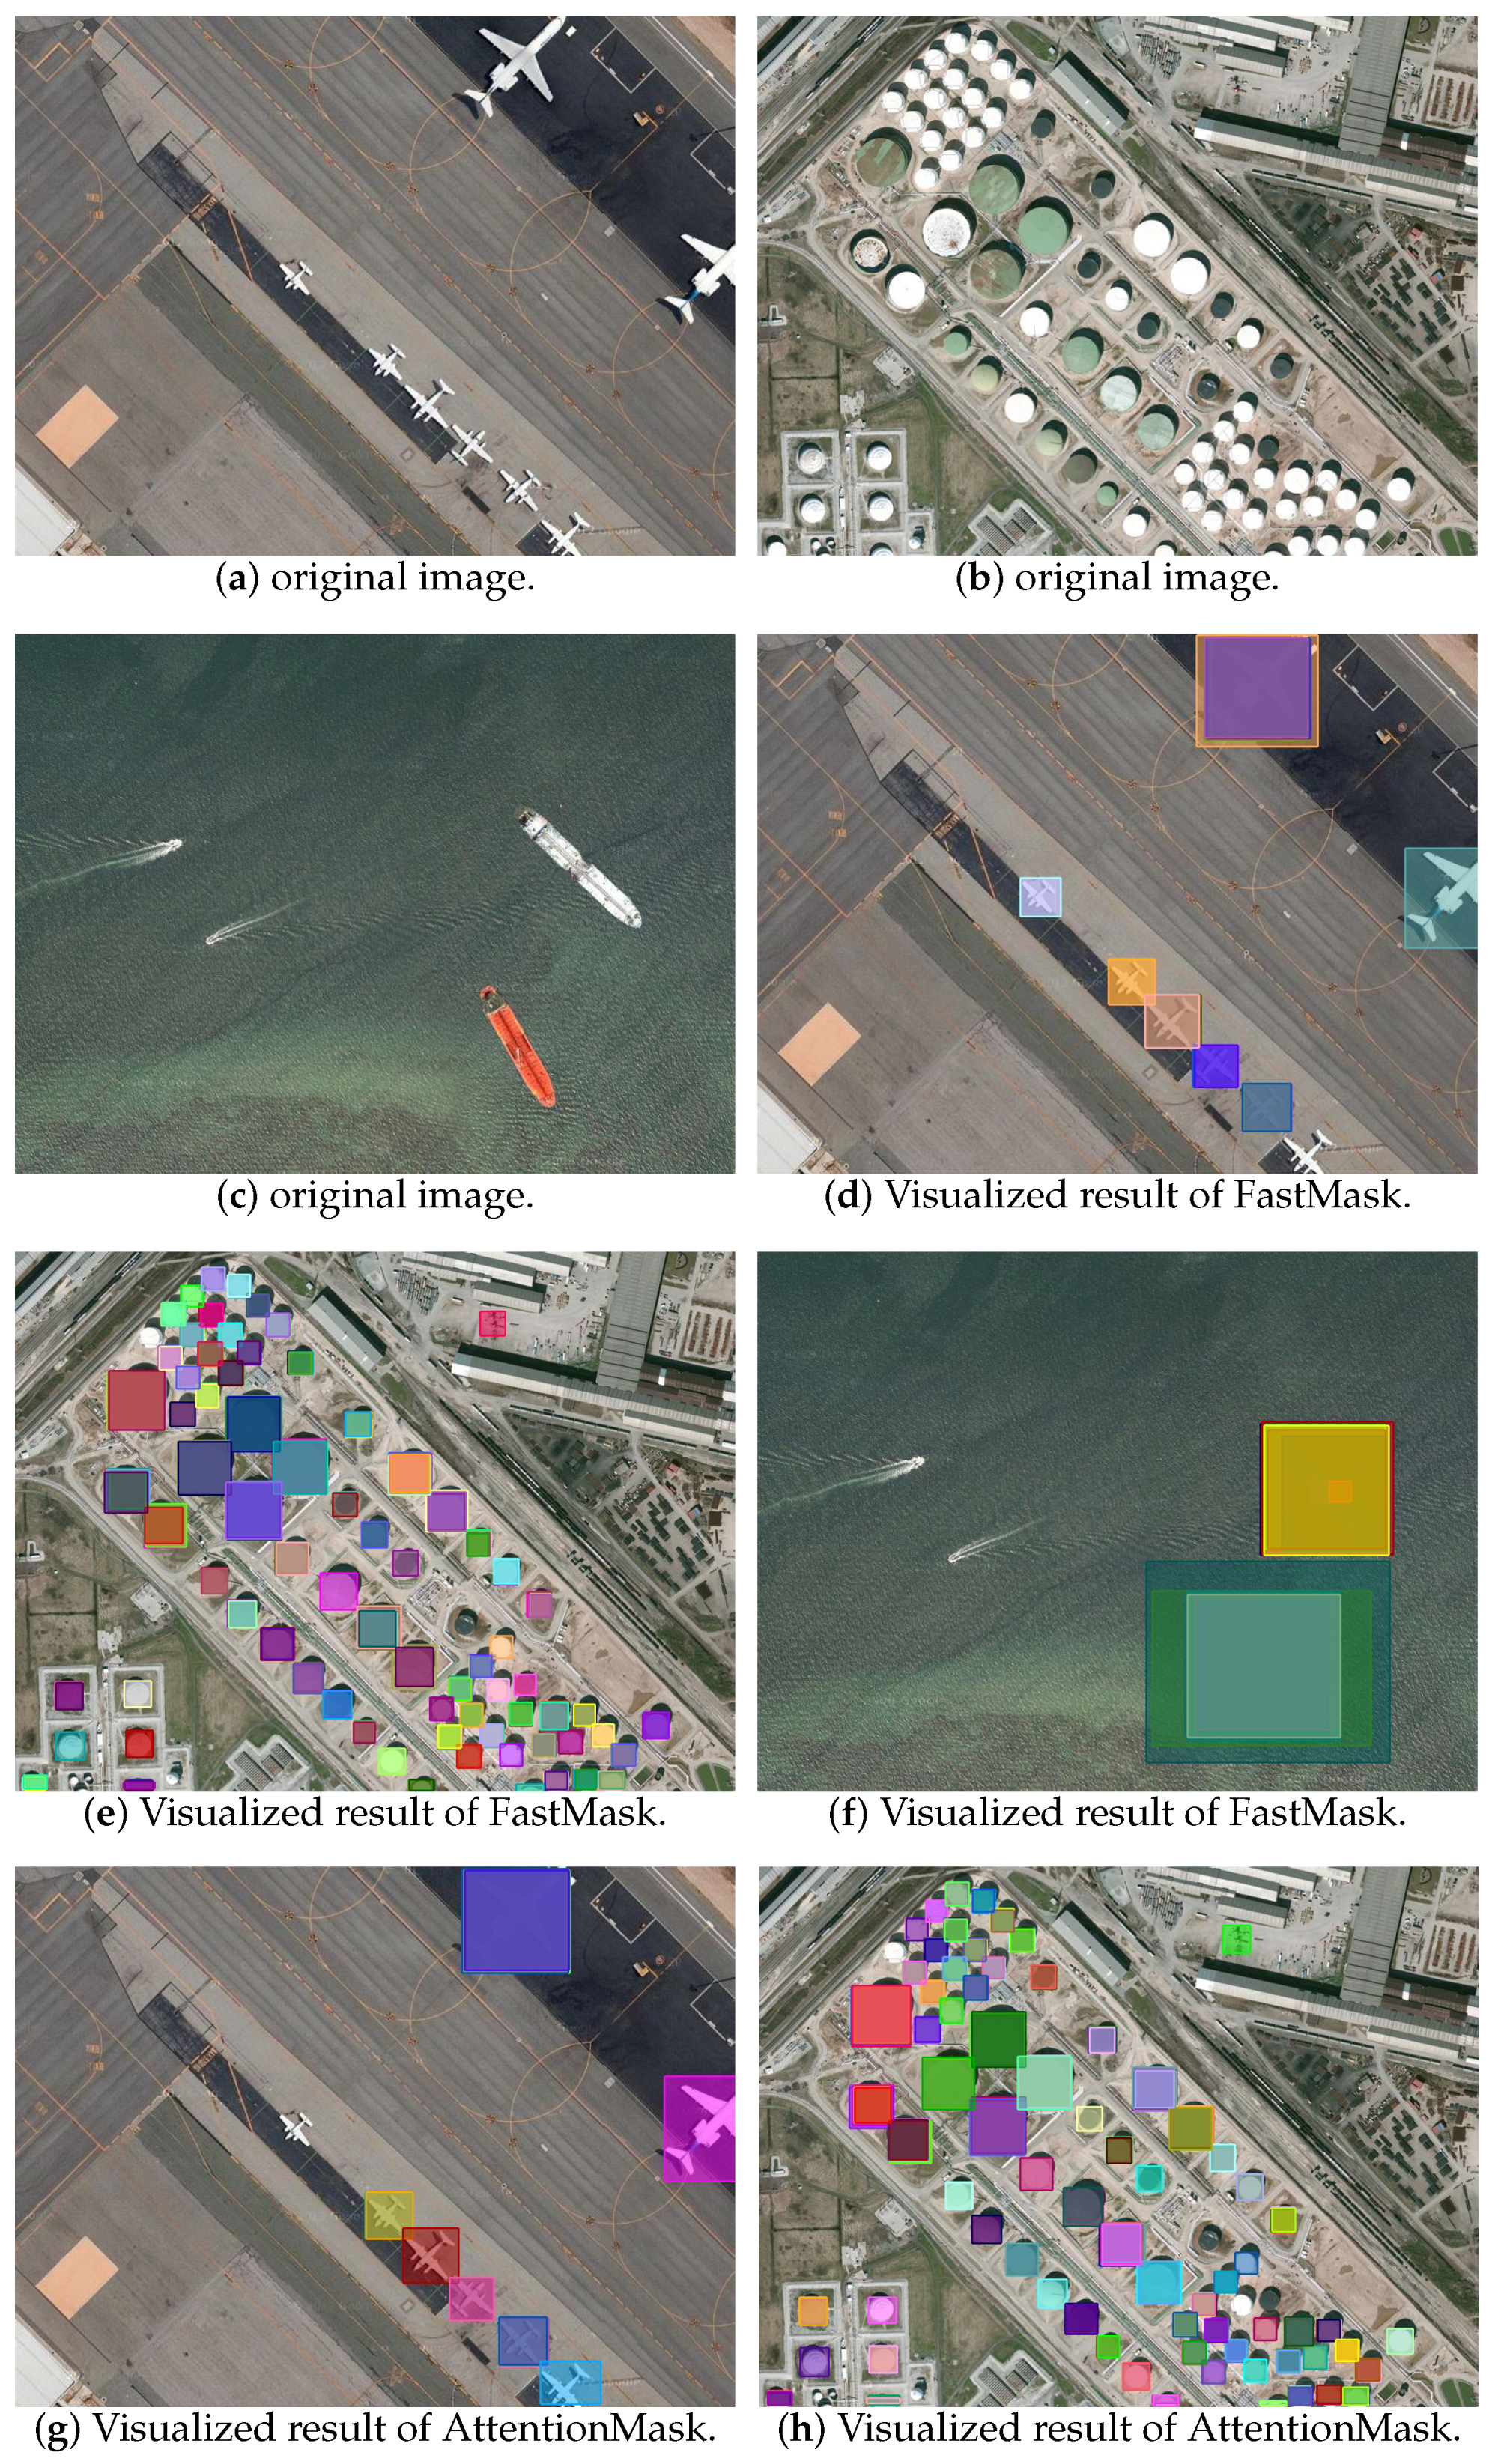
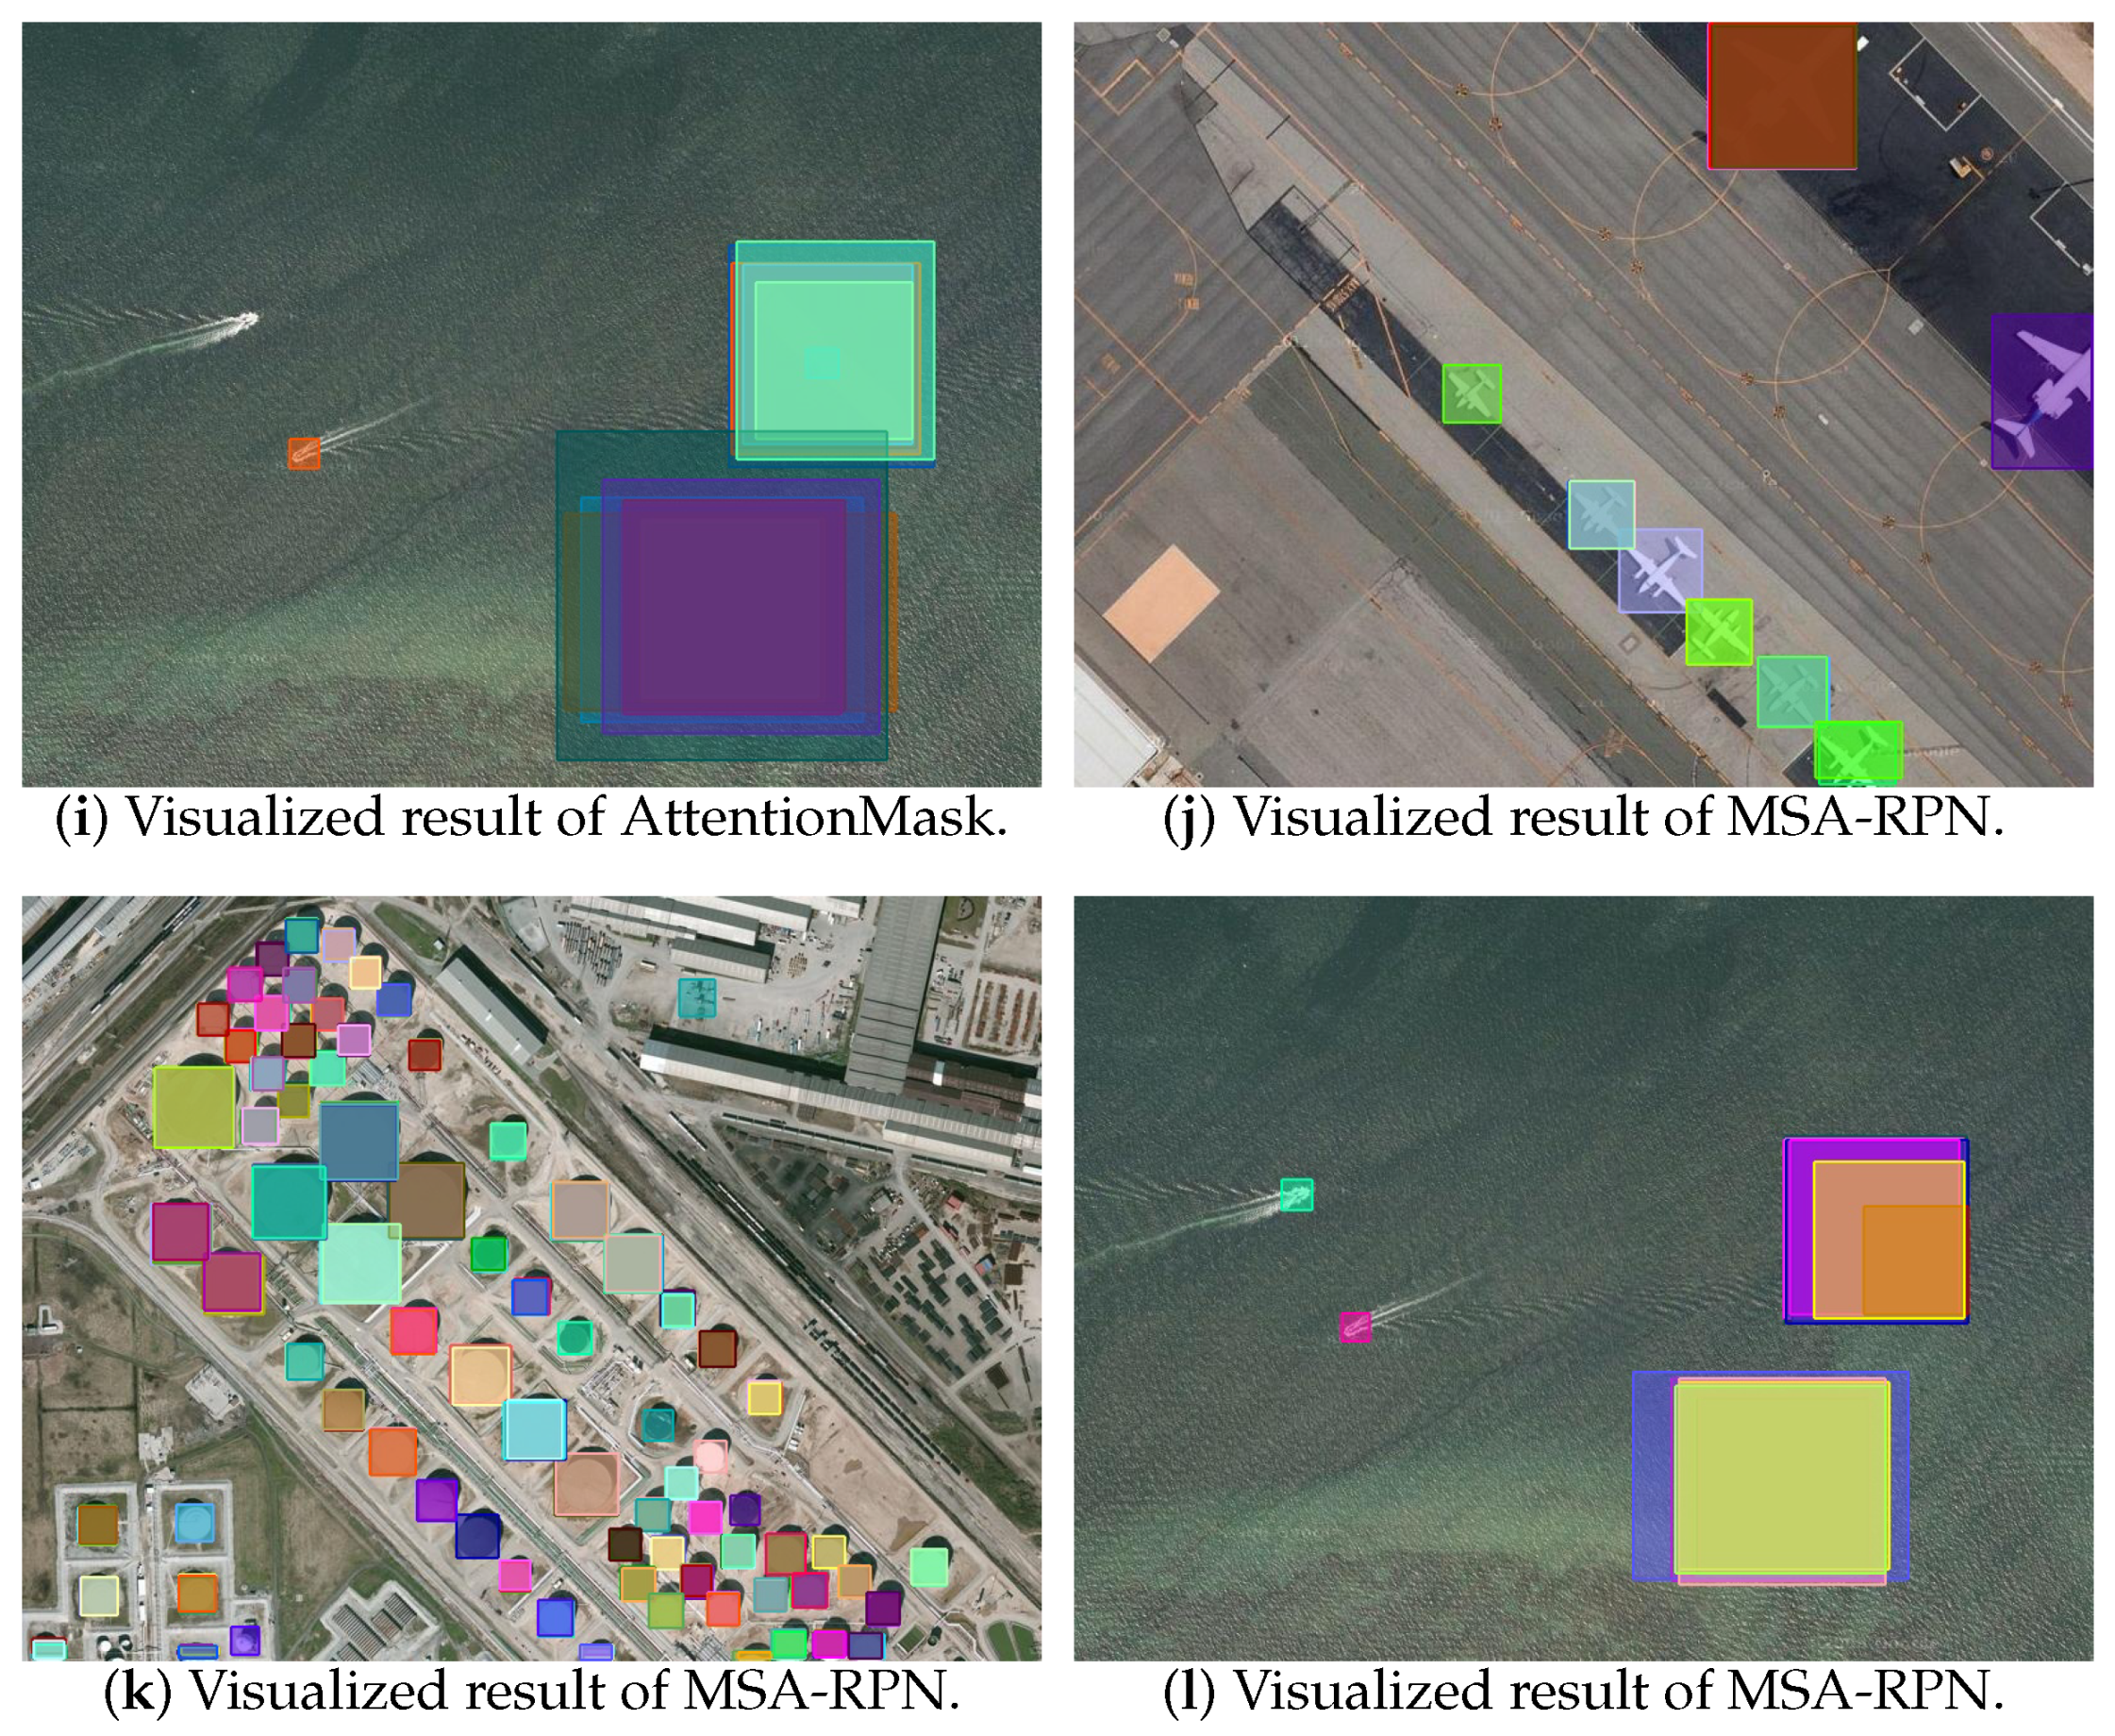
Figure 5 displays the visualized results of MSA-RPN and the other algorithms. Figure 5a–c are three original images that contain aircraft, ships and oil tanks, respectively. These objects are of different sizes, including the small, the medium and the large, and concentrate together. Especially in Figure 5c, about 70 oil tanks huddle together. Figure 5d–f present the region proposals of FastMask. Compared with the original images, Figure 5d misses an airplane and Figure 5f ignores two small ships. This is because FastMask focuses on the high-level semantic information, and outputs feature maps at a size of of the original image. This causes the easy losing of small objects. Figure 5g–i depict the results of AttentionMask. Compared with FastMask, AttentionMask detects the same number of small airplanes and one more small ship. This indicates that AttentionMask is improved compared to FastMask. The reason is that it notices details in lower layers by retaining the features of Figure 5j–l exhibit the results of the proposed MSA-RPN algorithm. MSA-RPN successfully detects all the airplanes and ships, and the oil tanks with black appearance. It demonstrates that MSA-RPN can detect objects of various sizes from complex backgrounds with rich textures.
4.2. Ablation Experiments
4.2.1. Influences of Scales
We selected one or more combinations of Scale, Scale, Scale, Scale, Scale and Scale to investigate the influences of scales on regional proposals. We defined MSA-RPN as the combination of scales, where b means the starting size, and e the ending size. For example, when and the combination of scales extend from Scale to Scale, when and , only Scale is selected. The experimental results on the LEVIR data set are listed in Table 5. In the top four rows in Table 5, as the ending scales are increased from 128 to 192, the recall rates in the four situations stay the same, while the time consumptions largely rise. Comparing MSA-RPN with MSA-RPN, we could find that MSA-RPN achieves a greater improvement from MSA-RPN. This is because Scale can better retain the feature information of small targets. We further conducted two experiments using the maximum and the minimum scales, denoted as MSA-RPN and MSA-RPN, respectively, and the results are listed in the bottom two rows in Table 5. Obviously, MSA-RPN obtains better results on small objects while MSA-RPN performs better on large objects. So we chose the combination of MSA-RPN for the following experiment.
4.2.2. Influence of the SFG
FastMask uses a Neck [12] component to obtain multi-scale features, while AttentionMask obtains the feature maps of Scale from the backbone network, and then uses the Neck component to extract features of Scale, Scale, Scale and Scale. Different from them, the proposed MSA-RPN outputs features of Scale, Scale and Scale through Conv3, Conv4 and Conv5 in the ResNet50 backbone network, respectively, and obtains features of smaller sizes of Scale and Scale, from the proposed SFGs.
To validate the effectiveness of SFGs, we compared it with the Neck component. Table 6 presents the results. The recall rates of the Neck+SAGM method are lower than those of the SFG+SAGM method. Under the conditions of 100 regional proposals, the recall rates of the SFG+SAGM are slightly higher for the small objects but largely higher for the large and the medium objects. As features of Scale retains information of the small objects, while features of Scale and Scale, and large sizes retain information of the medium and the large targets, SFGs can increase the recall rate of regional proposals for remote sensing images.
4.2.3. Impact of the SAGM and SSAMM Module
SOAM in AttentionMask can improve the recall rate of regional proposals. Therefore, we compared the proposed SAGM with SOAM, and the results are listed in Table 7. SAGM performs better on the small targets. The experiment also validated that SAGM costs less time on a single image.
As FastMask selects all sampling windows and AttentionMask selects the first 1000 windows as strong feature windows for their attention mechanism, the proposed SSAMM adaptively selects the appropriate number of windows based on the feedback of the system. To demonstrate the effectiveness of SSAMM, we conducted MSA-RPN both with and without SSAMM, and the results are compared in Table 8. For MSA-RPN without SSAMM, k is set as 2500. The results indicate that SSAMM improves the recall rates of all the sets, specifically increasing the recall rate of the small objects to that of the large objects.
5. Conclusions
In this work, we introduced a novel MSA-RPN network for region proposal generation of high-resolution remote sensing images. The introduced MSA-RPN can effectively solve the problem of inaccurate region proposal of multi-scale and dense objects, especially small objects. The MSA-RPN is mainly composed of three key models: SFG, SAGM and SSAMM. The SFG module helps the network to obtain smaller feature to represent more semantic information in remote sensing images; SAGM adopts spatial attention to focus on scale-special regions to generate multi-scale attention maps, and then obtains window samples; Finally, SSAMM can adaptively send the obtained sampling window into the spatial attention decoder to obtain region proposal and the corresponding confidence. We conducted experiments on LEVIR dataset and compared with other region proposal methods such as RPN, FastMask and Attentionmask. Experiment results showed that the proposed network outperformed state-of-the-art approaches both quantitative and qualitatively. We also provided extensive experiments to evaluate the impact of the individual components of the proposed architecture. The experimental results showed that SFG module could improve the recall rate of medium and large-scale objects, while SAGM module and SSAMM could improve the recall rate of small objects. Therefore, MSA-RPN can improve the recall rate of candidate regions of multi-scale objects, especially for small targets. A further direction to investigate is the use of MSA-RPN to efficiently combine object recognition to improve the accuracy of object detection in high-resolution remote sensing images.
Author Contributions
All the authors made significant contributions to the work. Investigation, literature analysis, methodology, writing original draft, validation, R.D.; funding acquisition, project administration, Y.Z.; supervision, L.J.; revising and editing, J.Z. and W.S. All authors have read and agreed to the published version of the manuscript.
Funding
This research was funded by Jiangsu Province Modern Education Technology Research Project grant number 2021-R-89410.
Institutional Review Board Statement
Not applicable.
Informed Consent Statement
Not applicable.
Data Availability Statement
The data presented in this study are available on request from the corresponding author.
Conflicts of Interest
The authors declare no conflict of interest.
References
- Ren, S.; He, K.; Girshick, R.; Sun, J. Faster R-CNN: Towards Real-Time Object Detection with Region Proposal Networks. IEEE Trans. Pattern Anal. Mach. Intell. 2017, 39, 1137–1149. [Google Scholar] [CrossRef] [PubMed] [Green Version]
- Redmon, J.; Farhadi, A. YOLO9000: Better, Faster, Stronger. In Proceedings of the IEEE Conference on Computer Vision and Pattern Recognition (CVPR), Honolulu, HI, USA, 21–26 July 2017; pp. 6517–6525. [Google Scholar]
- Hosang, J.; Benenson, R.; Dollár, P.; Schiele, B. What Makes for Effective Detection Proposals? IEEE Trans. Pattern Anal. Mach. Intell. 2016, 38, 814–830. [Google Scholar] [CrossRef] [PubMed] [Green Version]
- Gu, C.; Lim, J.J.; Arbelaez, P.; Malik, J. Recognition Using Regions. In Proceedings of the IEEE Conference on Computer Vision and Pattern Recognition, Miami, FL, USA, 20–25 June 2009; pp. 1030–1037. [Google Scholar] [CrossRef]
- Uijlings, J.R.R.; van de Sande, K.E.A.; Gevers, T.; Smeulders, A.W.M. Selective Search for Object Recognition. Int. J. Comput. Vis. 2013, 104, 154–171. [Google Scholar] [CrossRef] [Green Version]
- Alexe, B.; Deselaers, T.; Ferrari, V. What is an object? In Proceedings of the IEEE Computer Society Conference on Computer Vision and Pattern Recognition, San Francisco, CA, USA, 13–18 June 2010; pp. 73–80. [Google Scholar] [CrossRef]
- Cheng, M.M.; Zhang, Z.; Lin, W.Y.; Torr, P. BING: Binarized Normed Gradients for Objectness Estimation at 300fps. In Proceedings of the IEEE Conference on Computer Vision and Pattern Recognition, Columbus, OH, USA, 23–28 June 2014; pp. 3286–3293. [Google Scholar] [CrossRef] [Green Version]
- Zitnick, C.L.; Dollár, P. Edge Boxes: Locating Object Proposals from Edges. In European Conference on Computer Vision; Springer: Cham, Switzerland, 2014; pp. 391–405. [Google Scholar]
- Gidaris, S.; Komodakis, N. Attend Refine Repeat: Active Box Proposal Generation via In-Out Localization. In Proceedings of the British Machine Vision Conference (BMVC), York, UK, 19–22 September 2016; pp. 90.1–90.13. [Google Scholar]
- Pinheiro, P.O.; Collobert, R.; Dollár, P. Learning to Segment Object Candidates. In Proceedings of the Internati Onal Conference on Neural Information Processing Systems, Montreal, QC, Canada, 7–12 December 2015; MIT Press: Cambridge, MA, USA, 2015; Volume 2, pp. 1990–1998. [Google Scholar]
- Pinheiro, P.O.; Lin, T.Y.; Collobert, R.; Dollár, P. Learning to Refine Object Segments. In Proceedings of the European Conference on Computer Vision, Amsterdam, The Netherlands, 8–16 October 2016; Springer: Cham, Switzerland, 2016; pp. 75–91. [Google Scholar]
- Hu, H.; Lan, S.; Jiang, Y.; Cao, Z.; Sha, F. FastMask: Segment Multi-scale Object Candidates in One Shot. In Proceedings of the IEEE Conference on Computer Vision and Pattern Recognition, Honolulu, HI, USA, 21–26 July 2017; pp. 2280–2288. [Google Scholar]
- A, Z.D.; A, H.S.; A, S.Z.; B, J.Z.; A, L.L.; A, H.Z. Multi-scale object detection in remote sensing imagery with convolutional neural networks. ISPRS J. Photogramm. Remote Sens. 2018, 145, 3–22. [Google Scholar]
- Zhong, Y.; Han, X.; Zhang, L. Multi-class geospatial object detection based on a position-sensitive balancing framework for high spatial resolution remote sensing imagery. ISPRS J. Photogramm. Remote Sens. 2018, 138, 281–294. [Google Scholar] [CrossRef]
- Li, K.; Cheng, G.; Bu, S.; You, X. Rotation-Insensitive and Context-Augmented Object Detection in Remote Sensing Images. IEEE Trans. Geosci. Remote Sens. 2017, 56, 2337–2348. [Google Scholar] [CrossRef]
- Tang, T.; Zhou, S.; Deng, Z.; Zou, H.; Lei, L. Vehicle Detection in Aerial Images Based on Region Convolutional Neural Networks and Hard Negative Example Mining. Sensors 2017, 17, 336. [Google Scholar] [CrossRef] [PubMed] [Green Version]
- Vaswani, A.; Shazeer, N.; Parmar, N.; Uszkoreit, J.; Jones, L.; Gomez, A.N.; Kaiser, Ł.; Polosukhin, I. Attention is All You Need. In Proceedings of the International Conference on Neural Information Processing Systems, Long Beach, CA, USA, 4–9 December 2017; Curran Associates Inc.: Long Beach, CA, USA, 2017; pp. 6000–6010. [Google Scholar]
- Zagoruyko, S.; Komodakis, N. Paying More Attention to Attention: Improving the Performance of Convolutional Neural Networks via Attention Transfer. In Proceedings of the International Conference on Learning Representations, Toulon, France, 24–16 April 2017. [Google Scholar]
- Jaderberg, M.; Simonyan, K.; Zisserman, A.; Kavukcuoglu, K. Spatial Transformer Networks. In Proceedings of the International Conference on Neural Information Processing Systems, Montreal, QC, Canada, 7–12 December 2015; MIT Press: Montreal, QC, Canada, 2015; Volume 28. [Google Scholar]
- Almahairi, A.; Ballas, N.; Cooijmans, T.; Zheng, Y.; Larochelle, H.; Courville, A. Dynamic Capacity Networks. In Proceedings of the International Conference on Machine Learning, New York City, NY, USA, 19–24 June 2016; Volume 48, pp. 2549–2558. [Google Scholar]
- Hu, J.; Shen, L.; Albanie, S.; Sun, G.; Wu, E. Squeeze-and-Excitation Networks. IEEE Trans. Pattern Anal. Mach. Intell. 2020, 42, 2011–2023. [Google Scholar] [CrossRef] [Green Version]
- Wang, F.; Jiang, M.; Qian, C.; Yang, S.; Li, C.; Zhang, H.; Wang, X.; Tang, X. Residual Attention Network for Image Classification. In Proceedings of the IEEE Conference on Computer Vision and Pattern Recognition, Honolulu, HI, USA, 21–26 July 2017; pp. 6450–6458. [Google Scholar]
- Woo, S.; Park, J.; Lee, J.Y.; Kweon, I.S. CBAM: Convolutional Block Attention Module. In Proceedings of the European Conference on Computer Vision (ECCV), Glasgow, UK, 23–28 August 2018; Volume 11211. [Google Scholar]
- Wilms, C.; Frintrop, S. AttentionMask: Attentive, Efficient Object Proposal Generation Focusing on Small Objects. In Proceedings of the Asian Conference on Computer Vision, Perth, Australia, 2–6 December 2018; Springer: Cham, Switzerland, 2018; pp. 2–6. [Google Scholar]
- Zou, Z.; Shi, Z. Random Access Memories: A New Paradigm for Target Detection in High Resolution Aerial Remote Sensing Images. IEEE Trans. Image Process. 2017, 27, 1100–1111. [Google Scholar] [CrossRef]
- He, K.; Zhang, X.; Ren, S.; Sun, J. Deep Residual Learning for Image Recognition. In Proceedings of the IEEE Conference on Computer Vision and Pattern Recognition (CVPR) IEEE, Las Vegas, NV, USA, 27–30 June 2016; pp. 770–778. [Google Scholar] [CrossRef] [Green Version]
- He, K.; Zhang, X.; Ren, S.; Sun, J. Spatial Pyramid Pooling in Deep Convolutional Networks for Visual Recognition. IEEE Trans. Pattern Anal. Mach. Intell. 2014, 37, 1904–1916. [Google Scholar] [CrossRef] [PubMed] [Green Version]
- Lin, T.Y.; Maire, M.; Belongie, S.; Hays, J.; Perona, P.; Ramanan, D.; Dollár, P.; Zitnick, C.L. Microsoft COCO: Common objects in context. In Proceedings of the European Conference on Computer Vision, Zurich, Switzerland, 6–12 September 2014; Springer: Berlin/Heidelberg, Germany, 2014; pp. 740–755. [Google Scholar]
- Dong, R.; Xu, D.; Zhao, J.; Jiao, L.; An, J. Sig-NMS-Based Faster R-CNN Combining Transfer Learning for Small Target Detection in VHR Optical Remote Sensing Imagery. IEEE Trans. Geosci. Remote Sens. 2019, 57, 8534–8545. [Google Scholar] [CrossRef]
- Jia, Y.; Shelhamer, E.; Donahue, J.; Karayev, S.; Long, J.; Girshick, R.B.; Guadarrama, S.; Darrell, T. Caffe: Convolutional Architecture for Fast Feature Embedding. arXiv 2014, arXiv:1408.5093. [Google Scholar]
- Krizhevsky, A.; Sutskever, I.; Hinton, G.E. ImageNet Classification with Deep Convolutional Neural Networks. In Proceedings of the International Conference on Neural Information Processing Systems, Lake Tahoe, NV, USA, 3–6 December 2012; Curran Associates Inc.: Lake Tahoe, NV, USA, 2012; Volume 60, pp. 1097–1105. [Google Scholar]
Figure 1.
Framework of the proposed MSA-RPN.

Figure 2.
The process of generating multiscale features.

Figure 3.
The structure of a SFG.

Figure 4.
The structure of a SAGM.

Figure 5.
Visualized result of MSA-RPN and the other algorithms.


Table 1.
Definition of Multi-scale features.
| Feature Size | Notation | Layer That Outputs the Features |
|---|---|---|
| 1/8 of the original image | Scale | Conv3 |
| 1/16 of the original image | Scale | Conv4 |
| 1/32 of the original image | Scale | Conv5 |
| 1/64 of the original image | Scale | SFG |
| 1/128 of the original image | Scale | SFG |
Table 2.
K values and their corresponding ranges of loss values.
| Range of Loss | The Value of K |
|---|---|
| (+∞,1] | 5000 |
| (1,0.5] | 4000 |
| (0.5,0.3] | 3000 |
| (0.3,0.2] | 2000 |
| (0.2,0) | 1000 |
Table 3.
Denotations of the average recalls for different situations.
| Regional Proposals | 10 | 100 | 1000 | Small Objects | Medium Objects | Large Objects |
|---|---|---|---|---|---|---|
| Representation |
Table 4.
Average recall rates of MSA-RPN and the other State-of-the-Art methods on the LEVIR dataset.
Table 4.
Average recall rates of MSA-RPN and the other State-of-the-Art methods on the LEVIR dataset.
| Method | Times | ||||||
|---|---|---|---|---|---|---|---|
| RPN | 0.287 | 0.455 | 0.575 | 0.165 | 0.528 | 0.697 | 0.38 s |
| FastMask | 0.289 | 0.487 | 0.581 | 0.168 | 0.532 | 0.701 | 0.35 s |
| AttentionMask | 0.272 | 0.483 | 0.595 | 0.189 | 0.527 | 0.722 | 0.24 s |
| MSA-RPN | 0.285 | 0.490 | 0.603 | 0.285 | 0.533 | 0.735 | 0.22 s |
Table 5.
Results of different combinations of scales on the LEVIR dataset.
| Combination | Times | |||
|---|---|---|---|---|
| MSA-RPN | 0.283 | 0.535 | 0.736 | 0.26 s |
| MSA-RPN | 0.285 | 0.533 | 0.735 | 0.22 s |
| MSA-RPN | 0.191 | 0.532 | 0.734 | 0.24 s |
| MSA-RPN | 0.193 | 0.528 | 0.736 | 0.23 s |
| MSA-RPN | 0.190 | 0.310 | 0.345 | 0.13 s |
| MSA-RPN | 0.050 | 0.451 | 0.612 | 0.15 s |
Table 6.
Comparison results of the SFG and the Neck on the LEVIR dataset.
| Method | Times | ||||||
|---|---|---|---|---|---|---|---|
| Neck+SAGM | 0.221 | 0.389 | 0.591 | 0.278 | 0.516 | 0.709 | 0.28 s |
| SFG+SAGM | 0.285 | 0.490 | 0.603 | 0.285 | 0.533 | 0.735 | 0.22 s |
Table 7.
Comparison results of the SAGM and the SOAM on the LEVIR data set.
| Method | Times | ||||||
|---|---|---|---|---|---|---|---|
| SFG+SOAM | 0.221 | 0.389 | 0.591 | 0.191 | 0.522 | 0.712 | 0.23 s |
| SFG+SAGM | 0.285 | 0.490 | 0.603 | 0.285 | 0.533 | 0.735 | 0.22 s |
Table 8.
Results of MSA-RPN with and without SSAMM.
| Method | Times | ||||||
|---|---|---|---|---|---|---|---|
| NO SSAMM | 0.281 | 0.489 | 0.601 | 0.279 | 0.534 | 0.732 | 0.21 s |
| SSAMM | 0.285 | 0.490 | 0.603 | 0.285 | 0.533 | 0.735 | 0.22 s |
Publisher’s Note: MDPI stays neutral with regard to jurisdictional claims in published maps and institutional affiliations. |
© 2021 by the authors. Licensee MDPI, Basel, Switzerland. This article is an open access article distributed under the terms and conditions of the Creative Commons Attribution (CC BY) license (https://creativecommons.org/licenses/by/4.0/).
Share and Cite
MDPI and ACS Style
Dong, R.; Jiao, L.; Zhang, Y.; Zhao, J.; Shen, W. A Multi-Scale Spatial Attention Region Proposal Network for High-Resolution Optical Remote Sensing Imagery. Remote Sens. 2021, 13, 3362. https://0-doi-org.brum.beds.ac.uk/10.3390/rs13173362
AMA Style
Dong R, Jiao L, Zhang Y, Zhao J, Shen W. A Multi-Scale Spatial Attention Region Proposal Network for High-Resolution Optical Remote Sensing Imagery. Remote Sensing. 2021; 13(17):3362. https://0-doi-org.brum.beds.ac.uk/10.3390/rs13173362
Chicago/Turabian StyleDong, Ruchan, Licheng Jiao, Yan Zhang, Jin Zhao, and Weiyan Shen. 2021. "A Multi-Scale Spatial Attention Region Proposal Network for High-Resolution Optical Remote Sensing Imagery" Remote Sensing 13, no. 17: 3362. https://0-doi-org.brum.beds.ac.uk/10.3390/rs13173362
Note that from the first issue of 2016, this journal uses article numbers instead of page numbers. See further details here.