
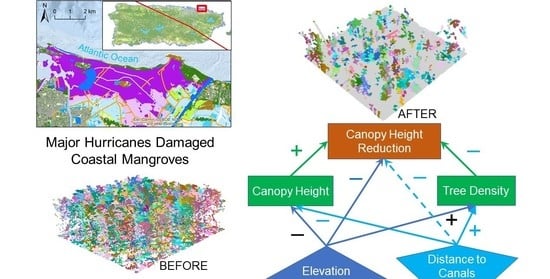
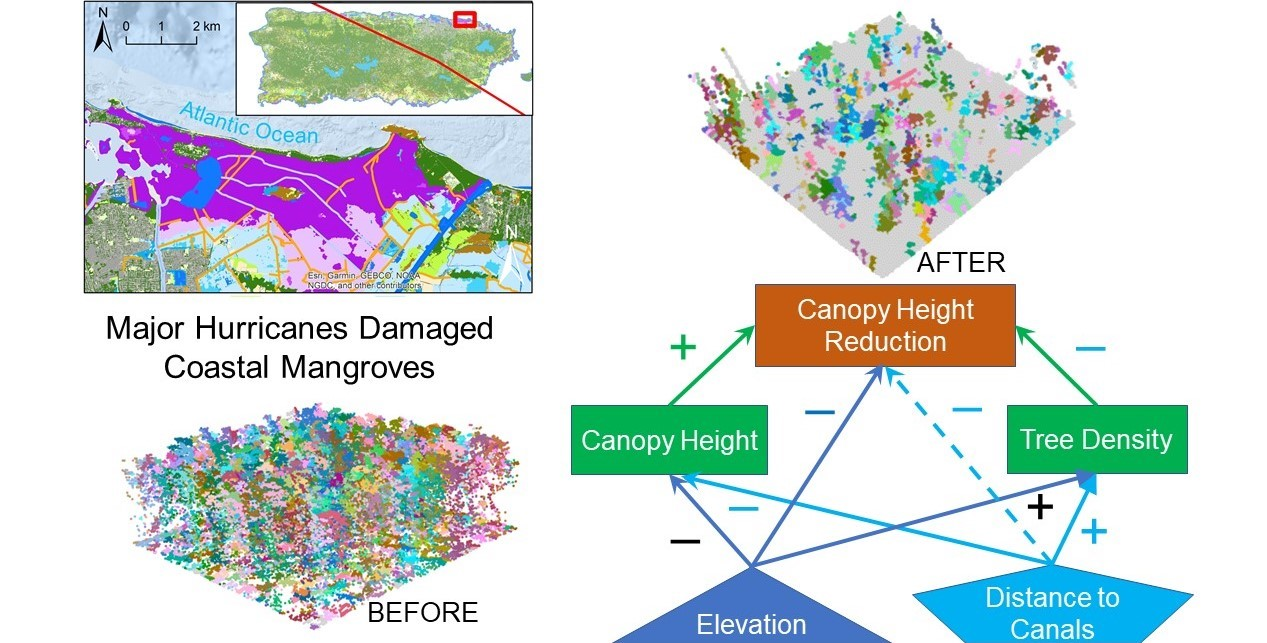
Elevation and Distribution of Freshwater and Sewage Canals Regulate Canopy Structure and Differentiate Hurricane Damages to a Basin Mangrove Forest

Abstract
:
1. Introduction
2. Methods
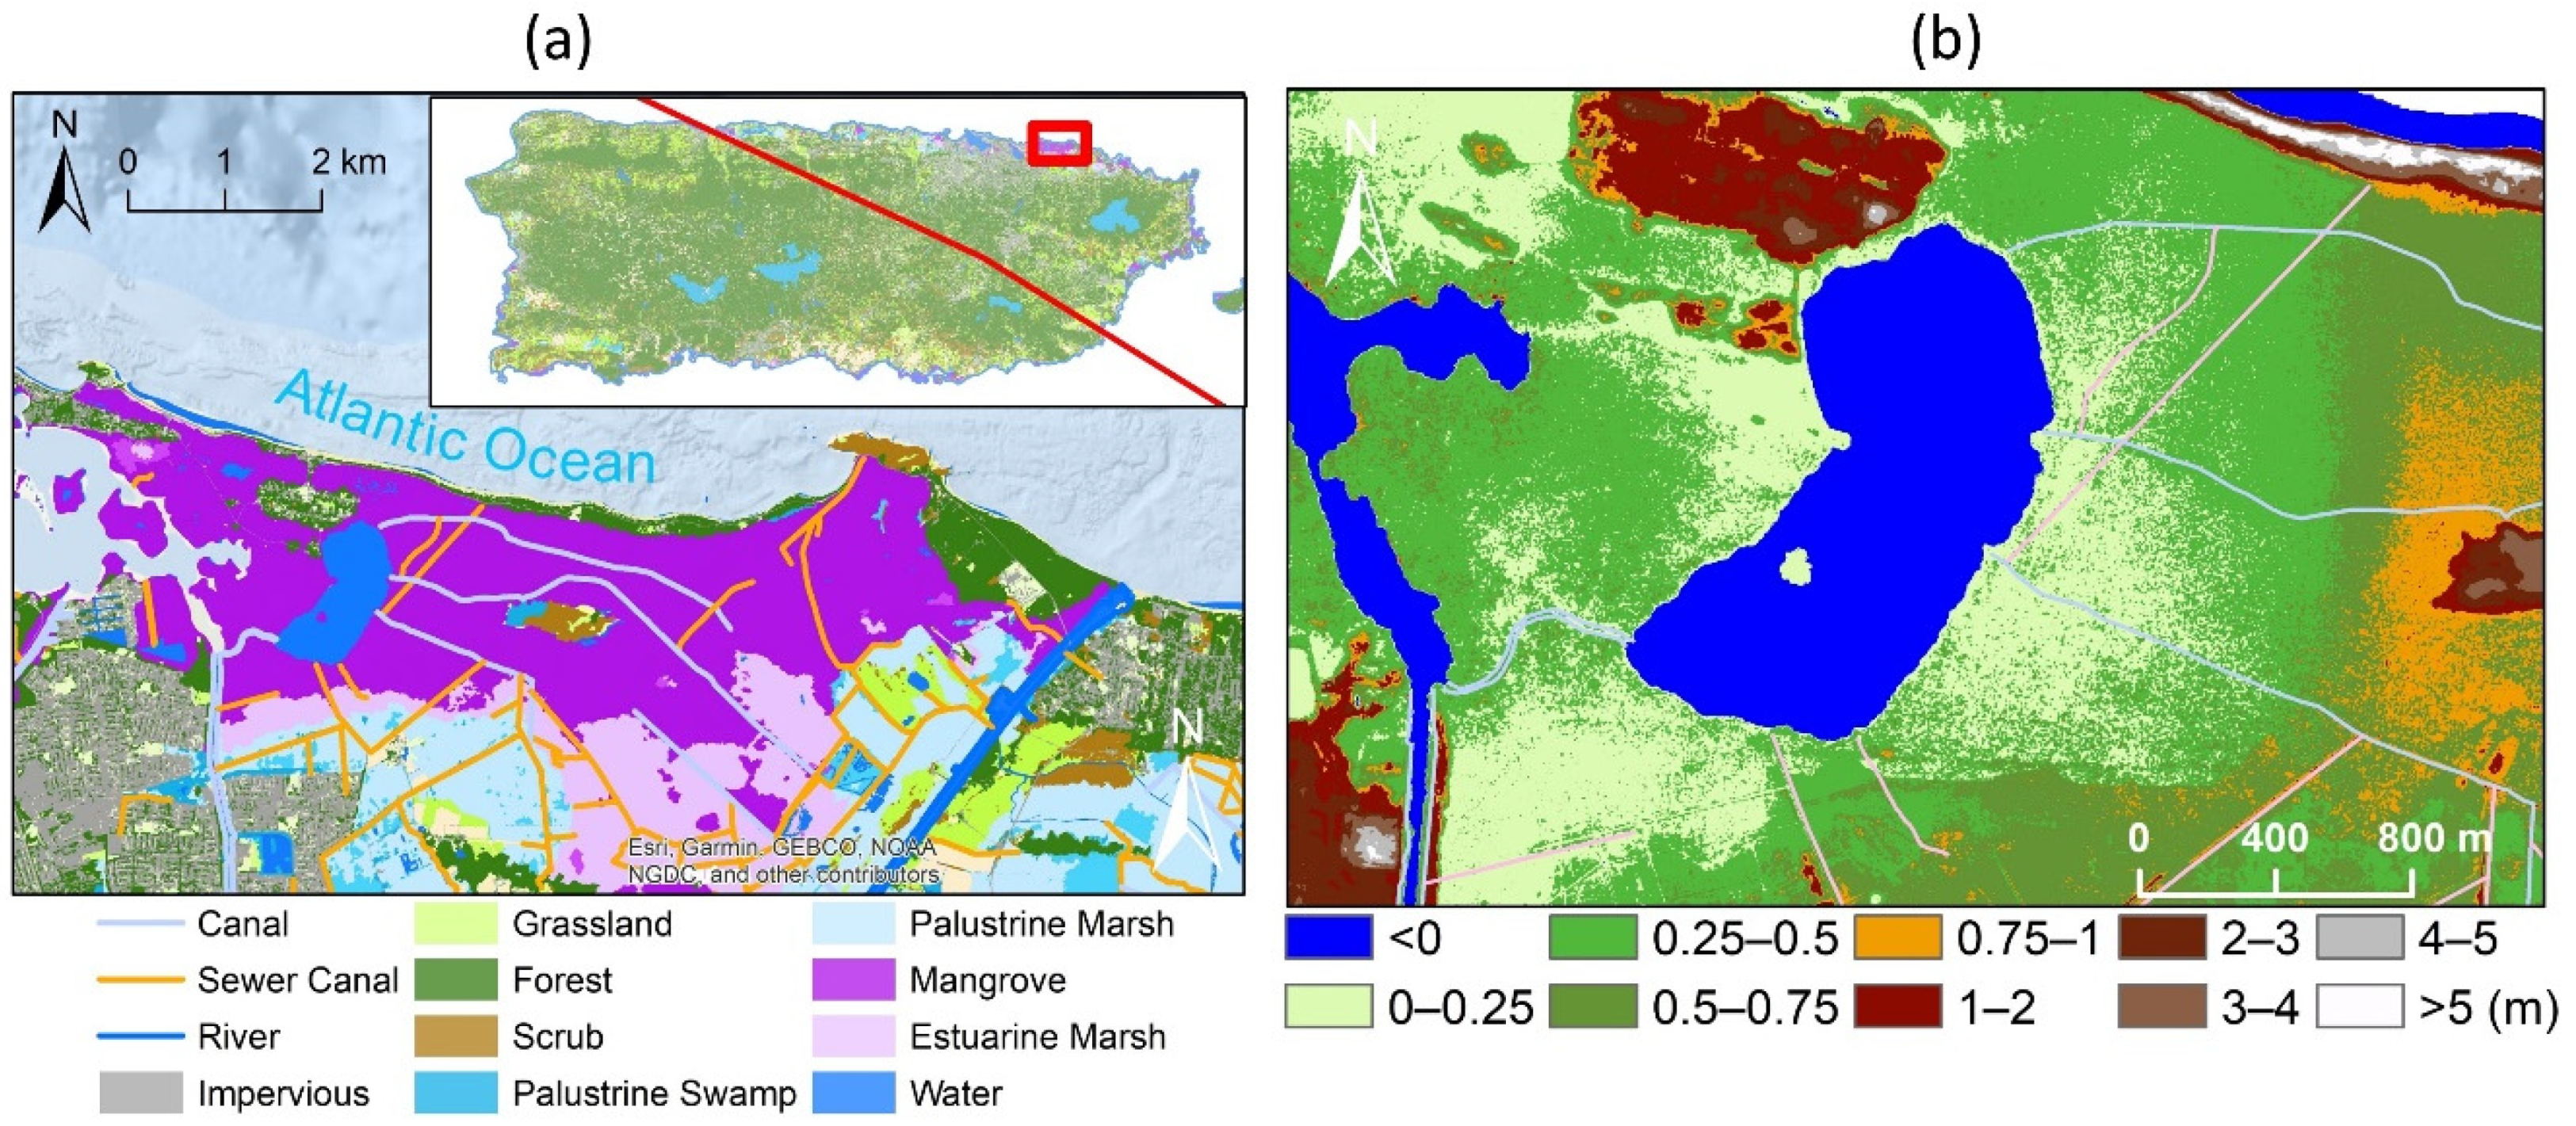
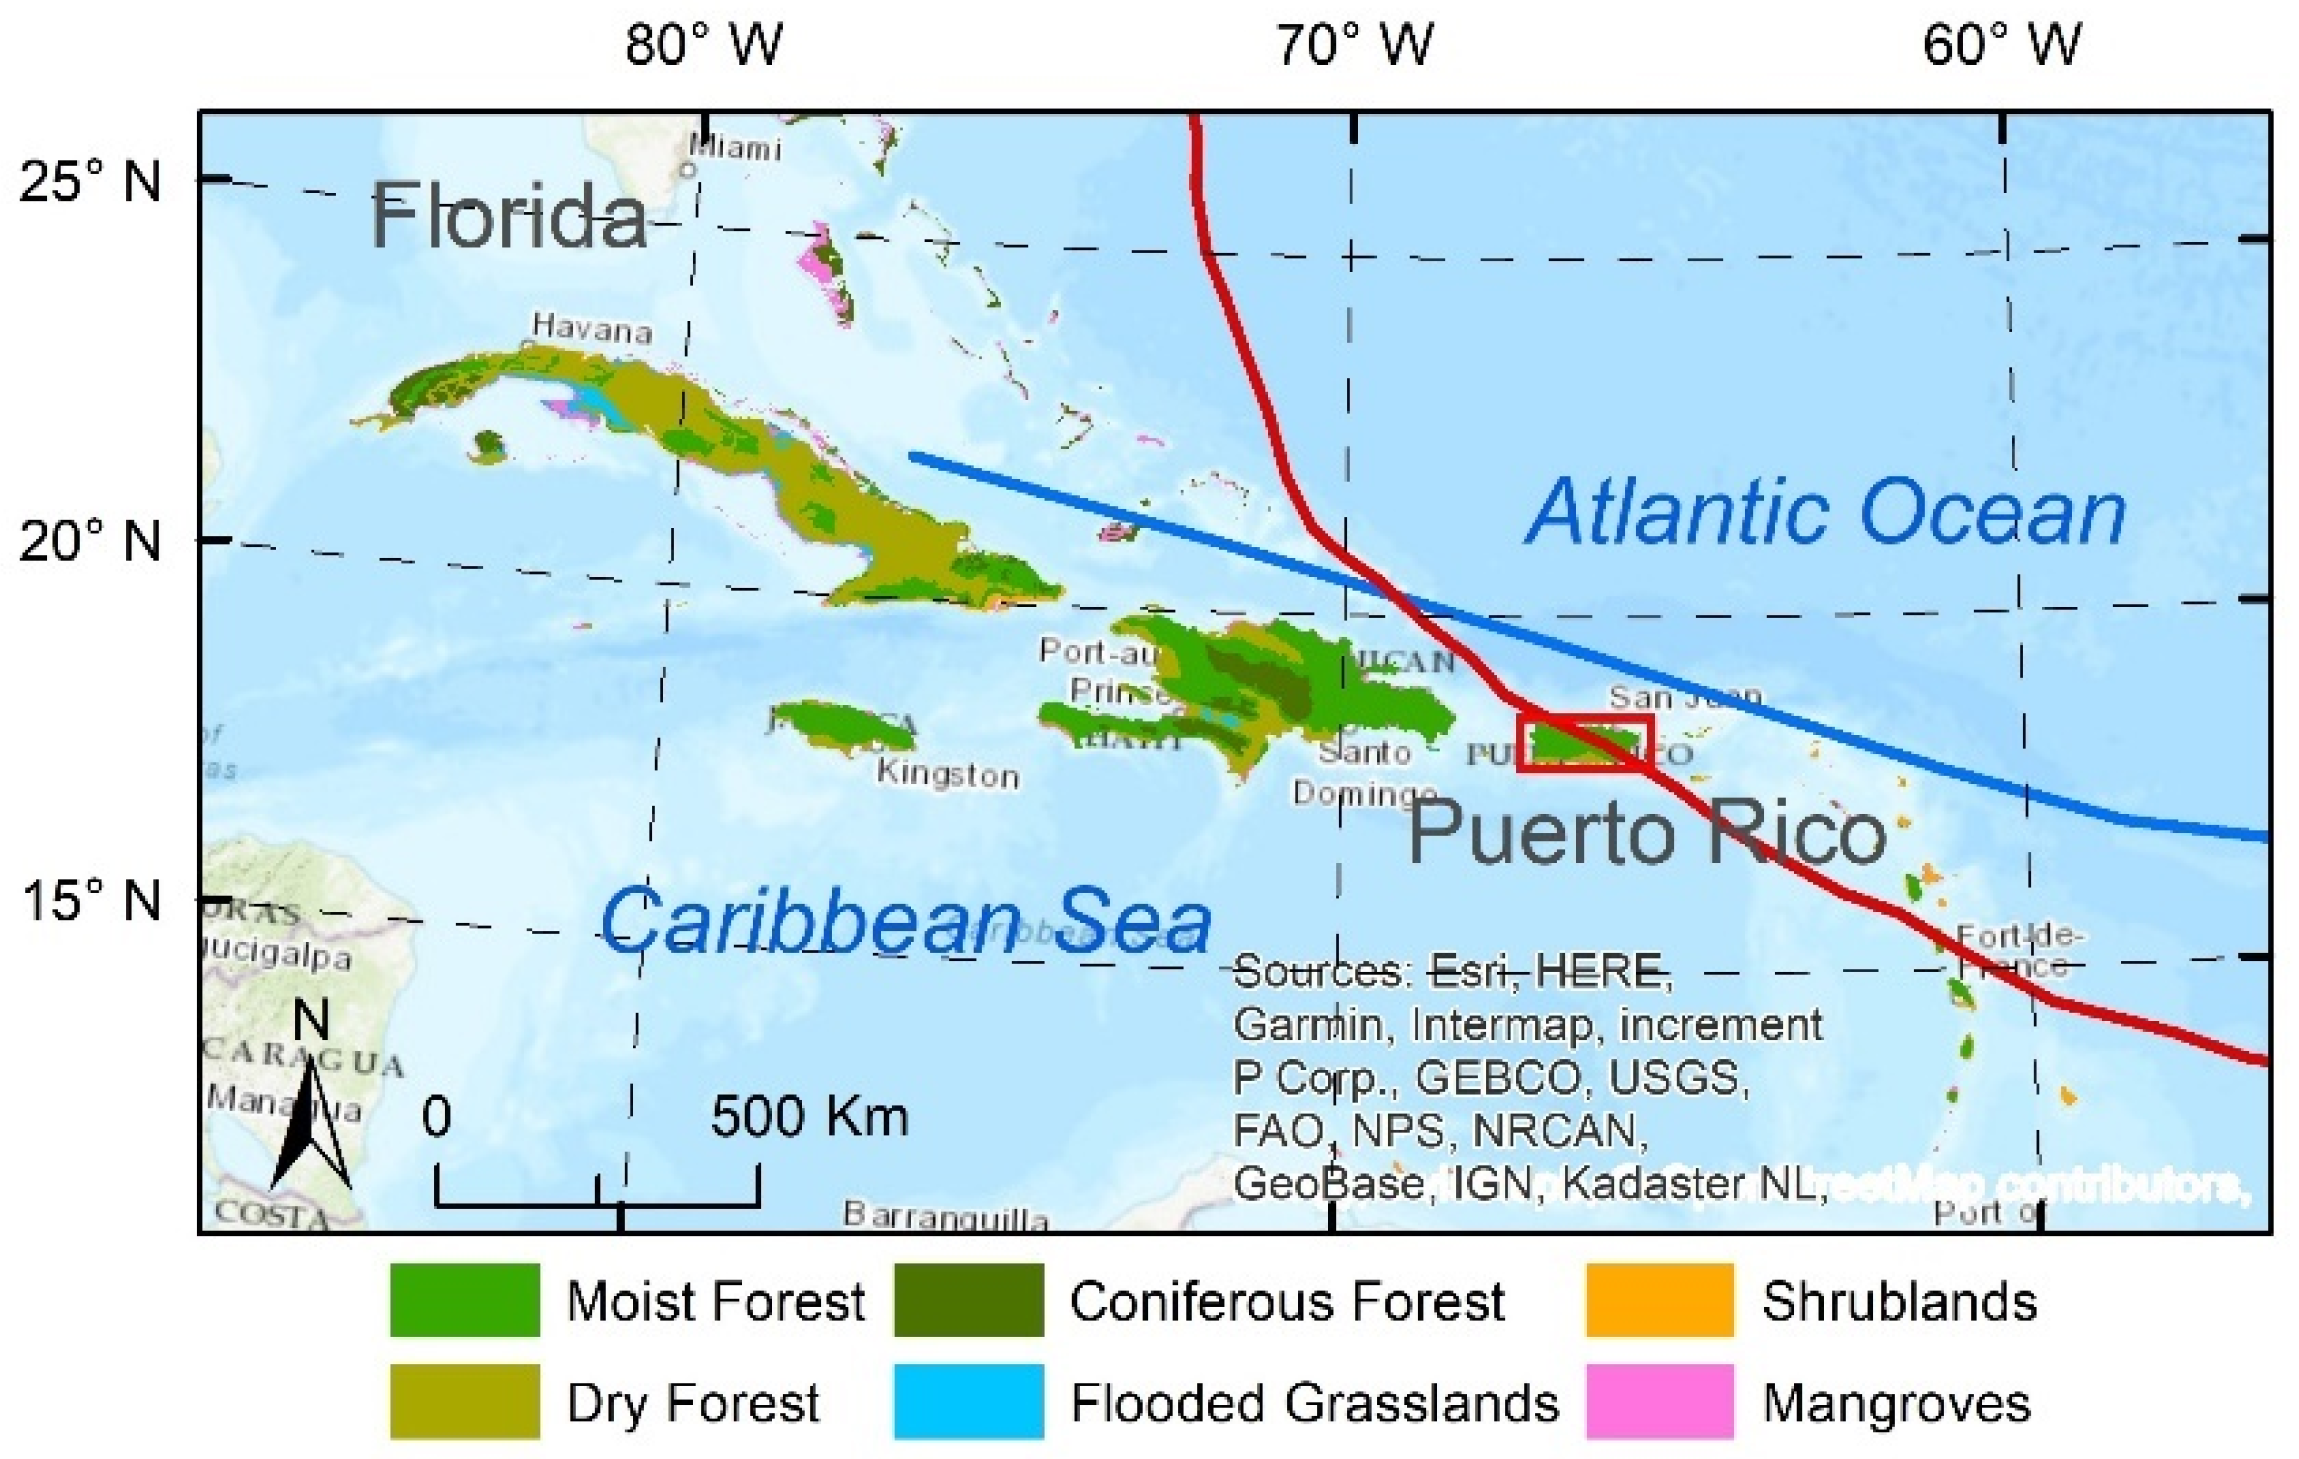
2.1. Study Area
2.2. LiDAR Data Processing
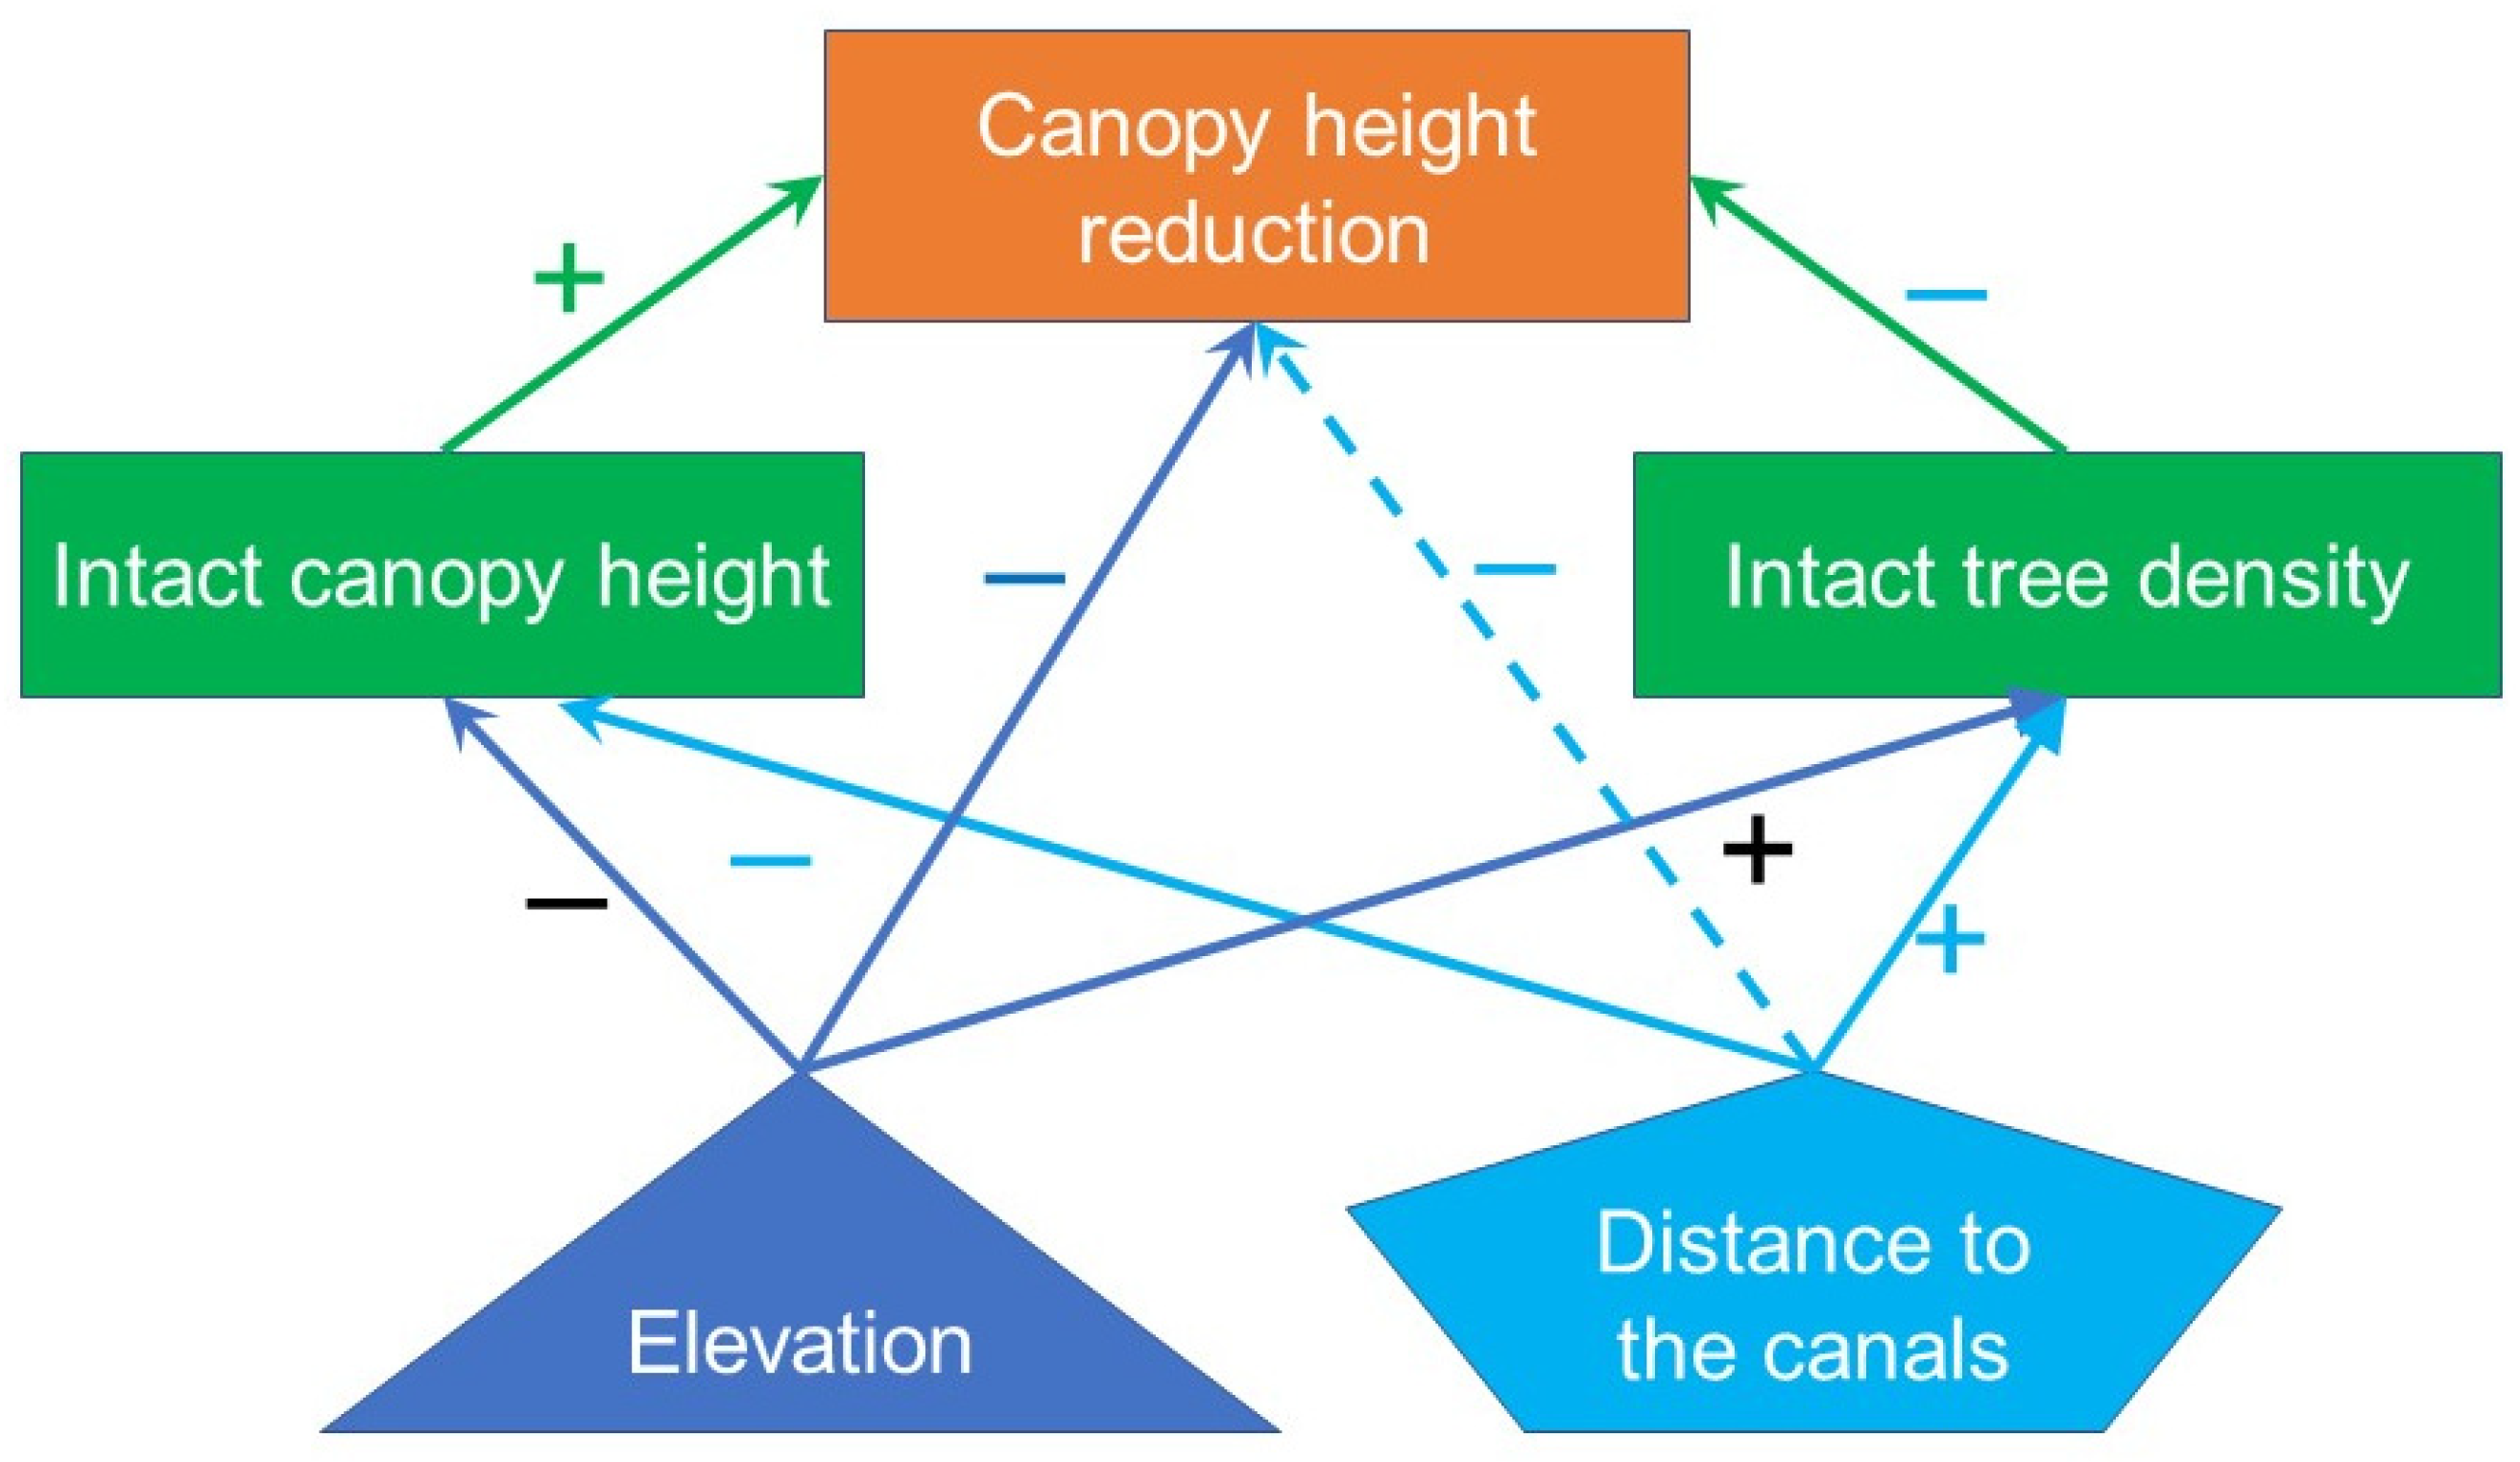
2.3. Statistical Modeling
3. Results
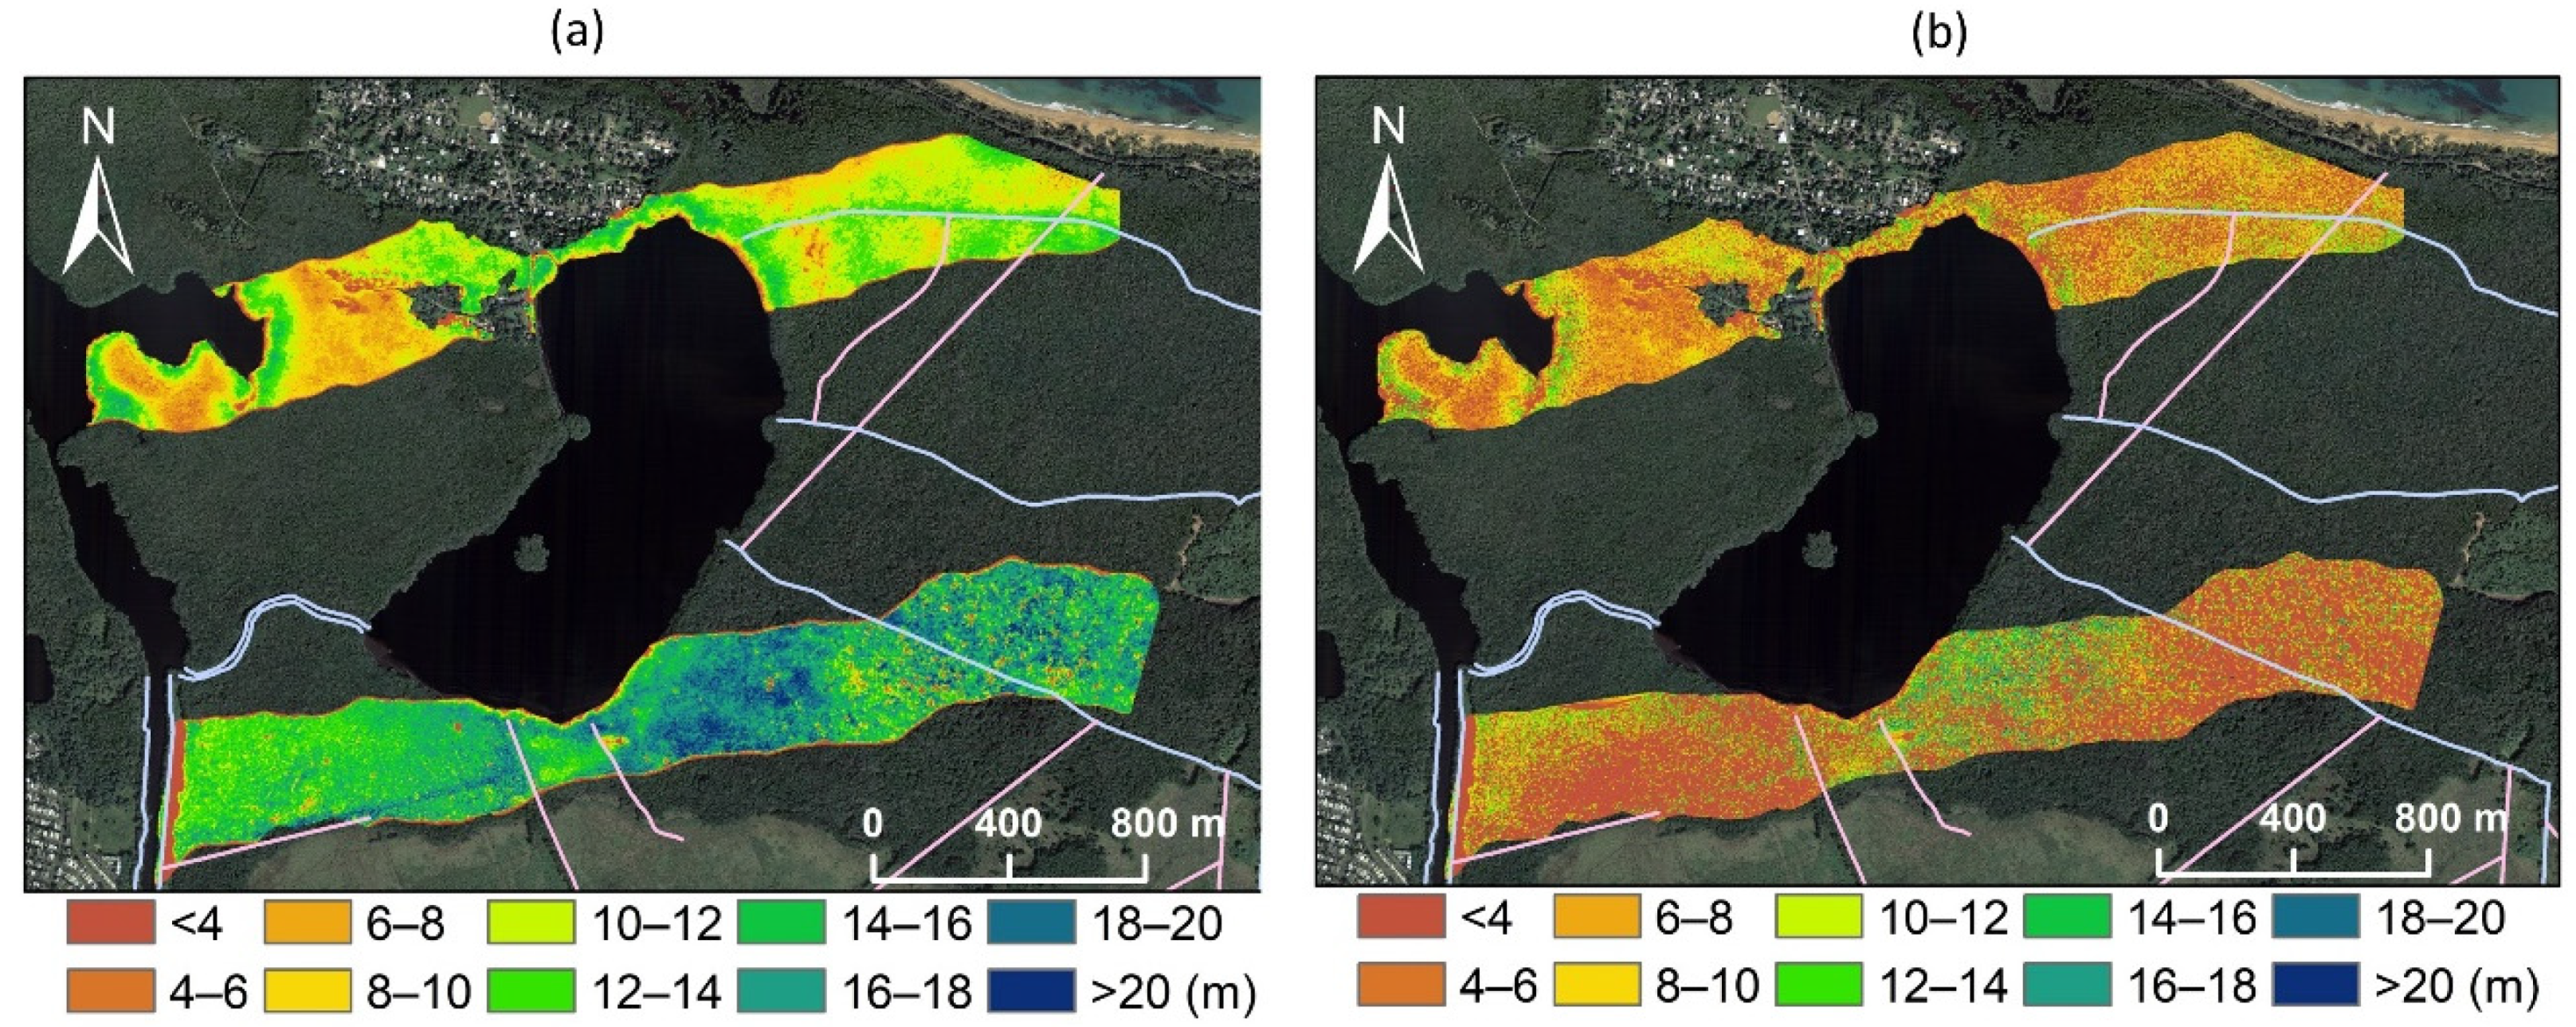
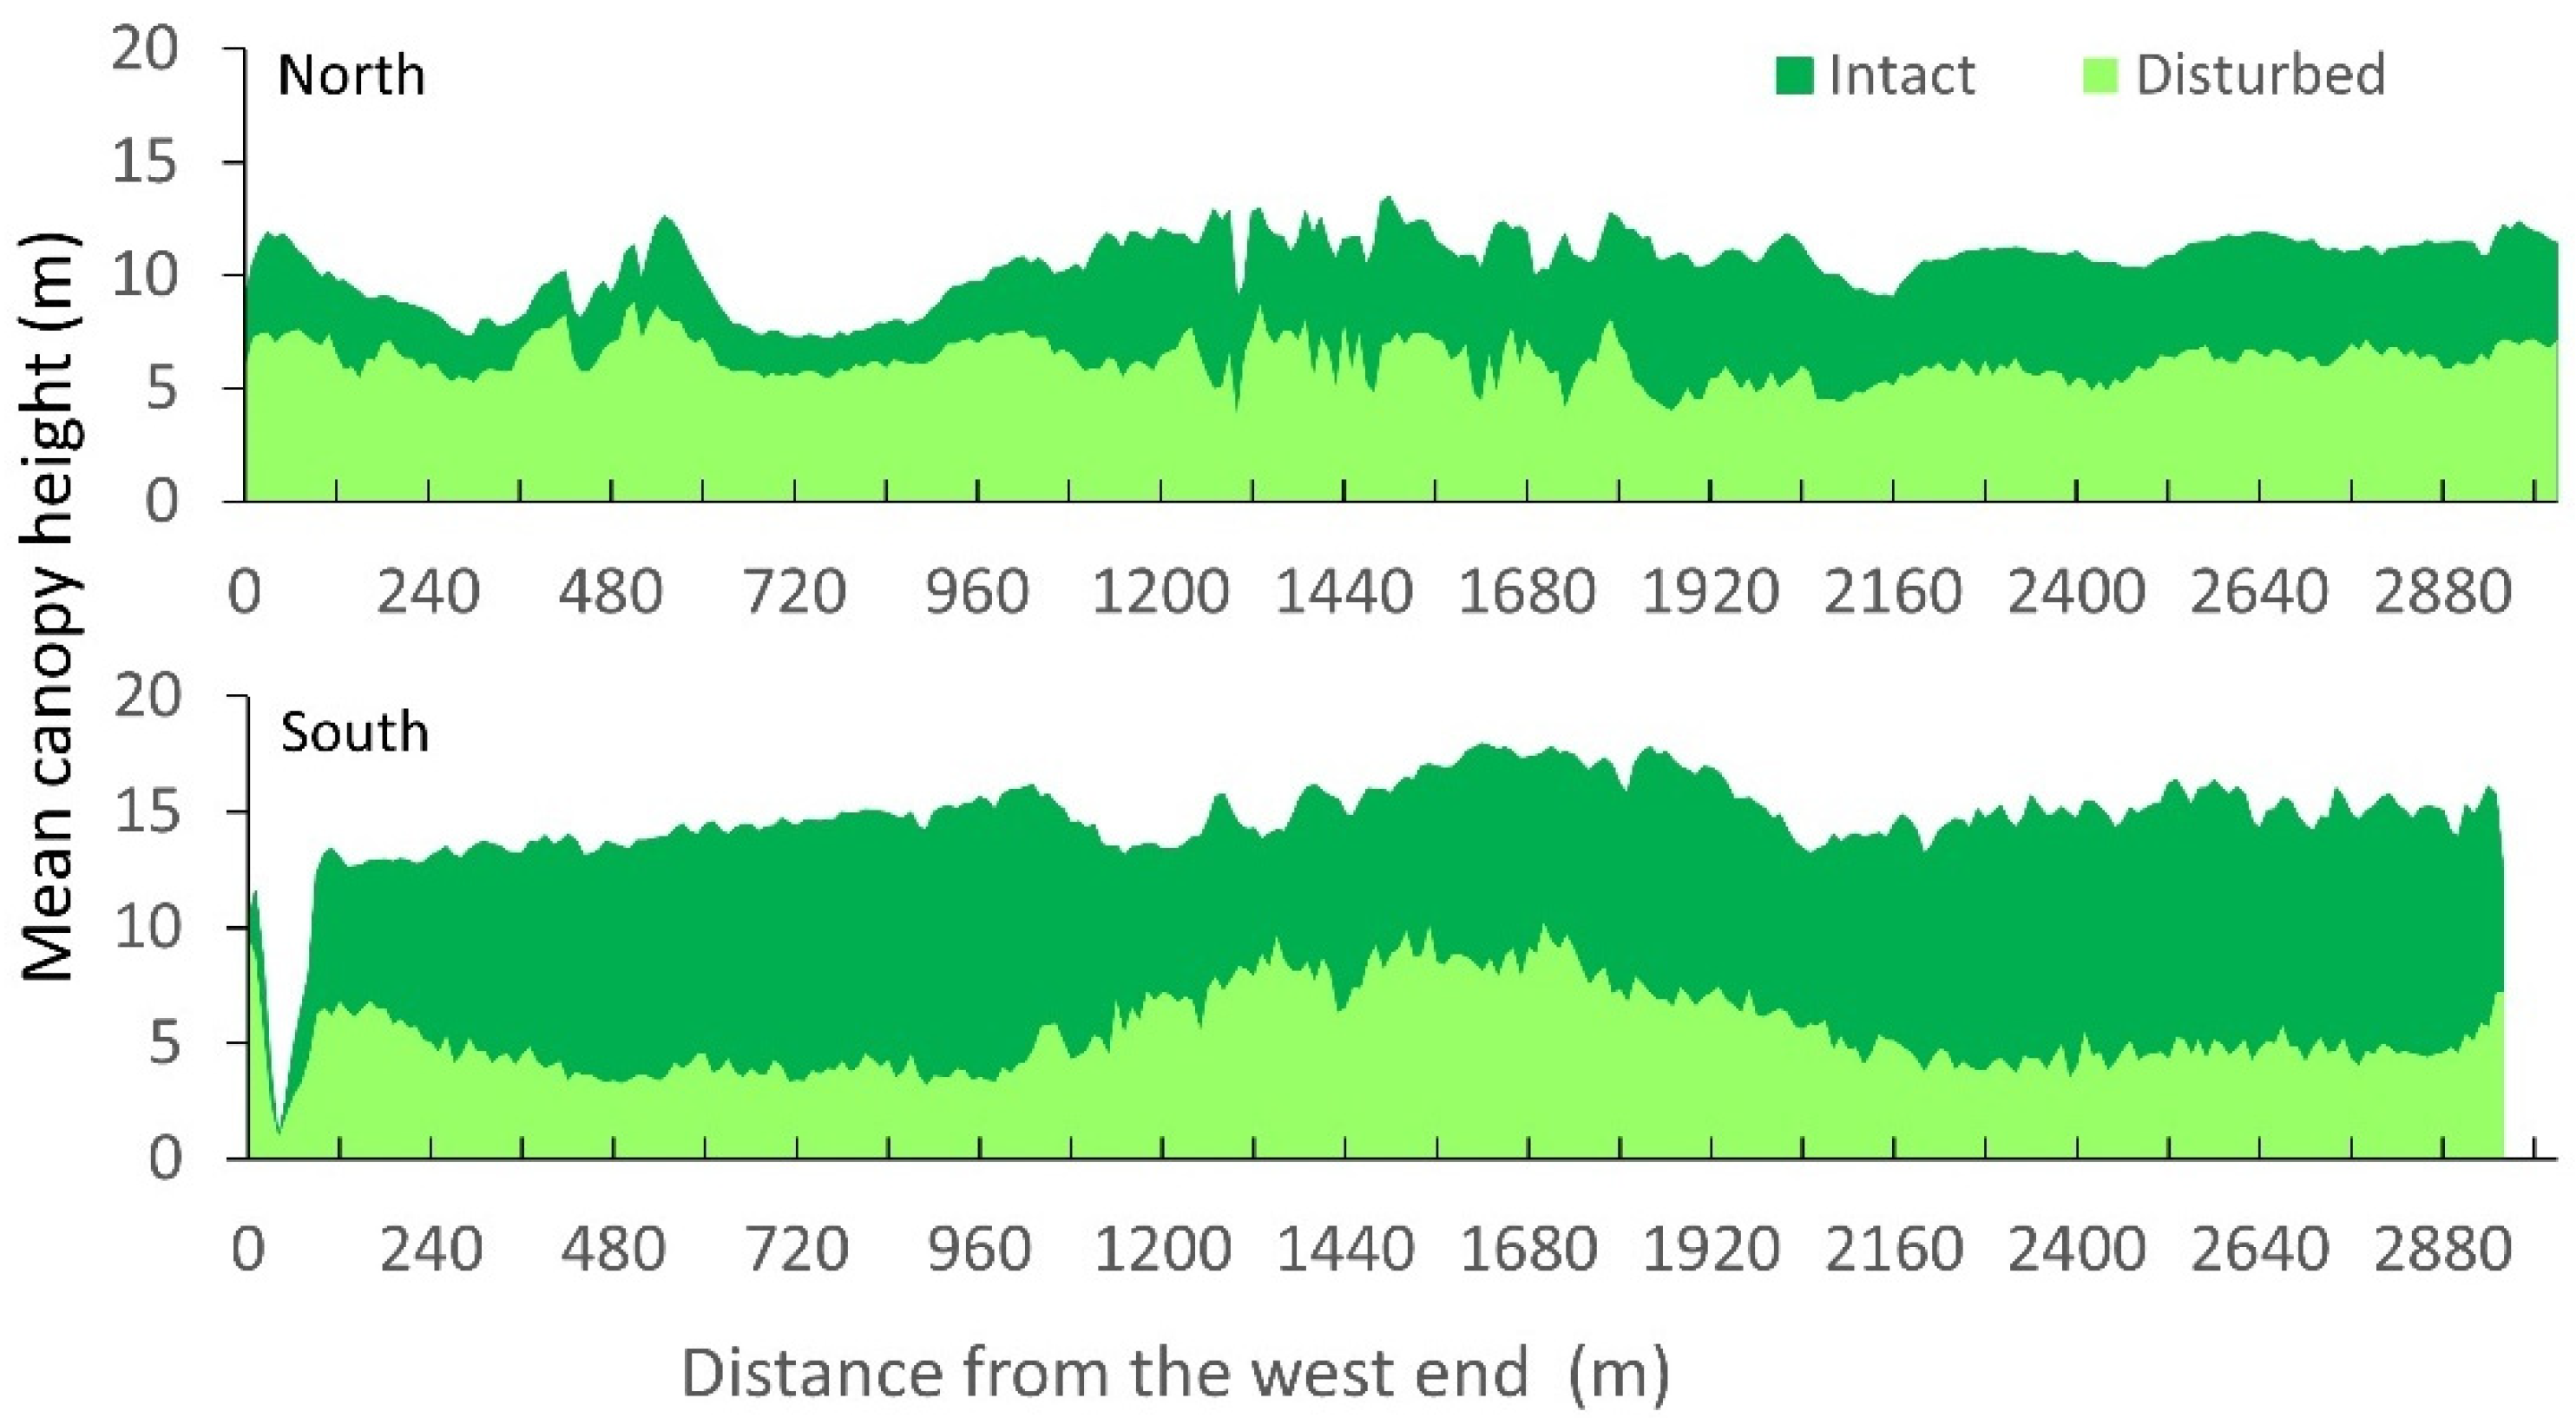
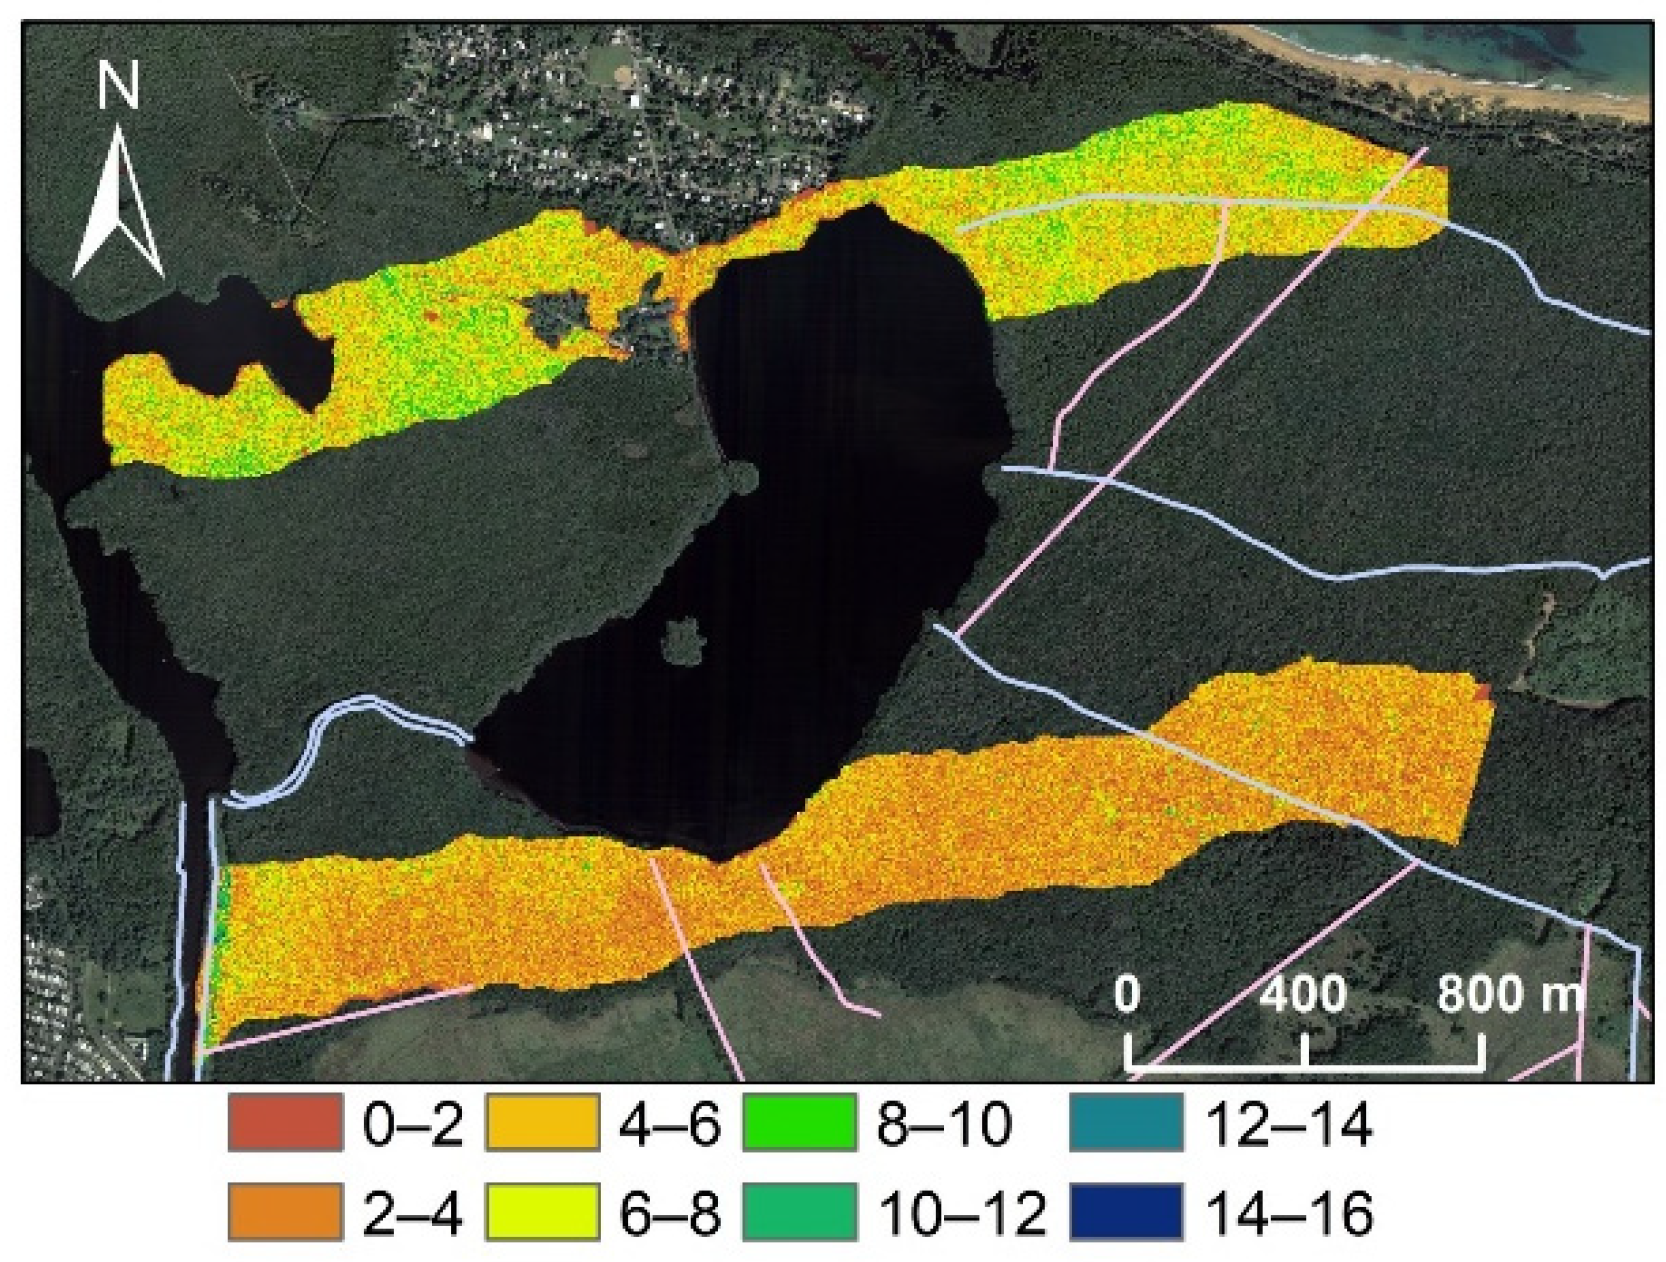
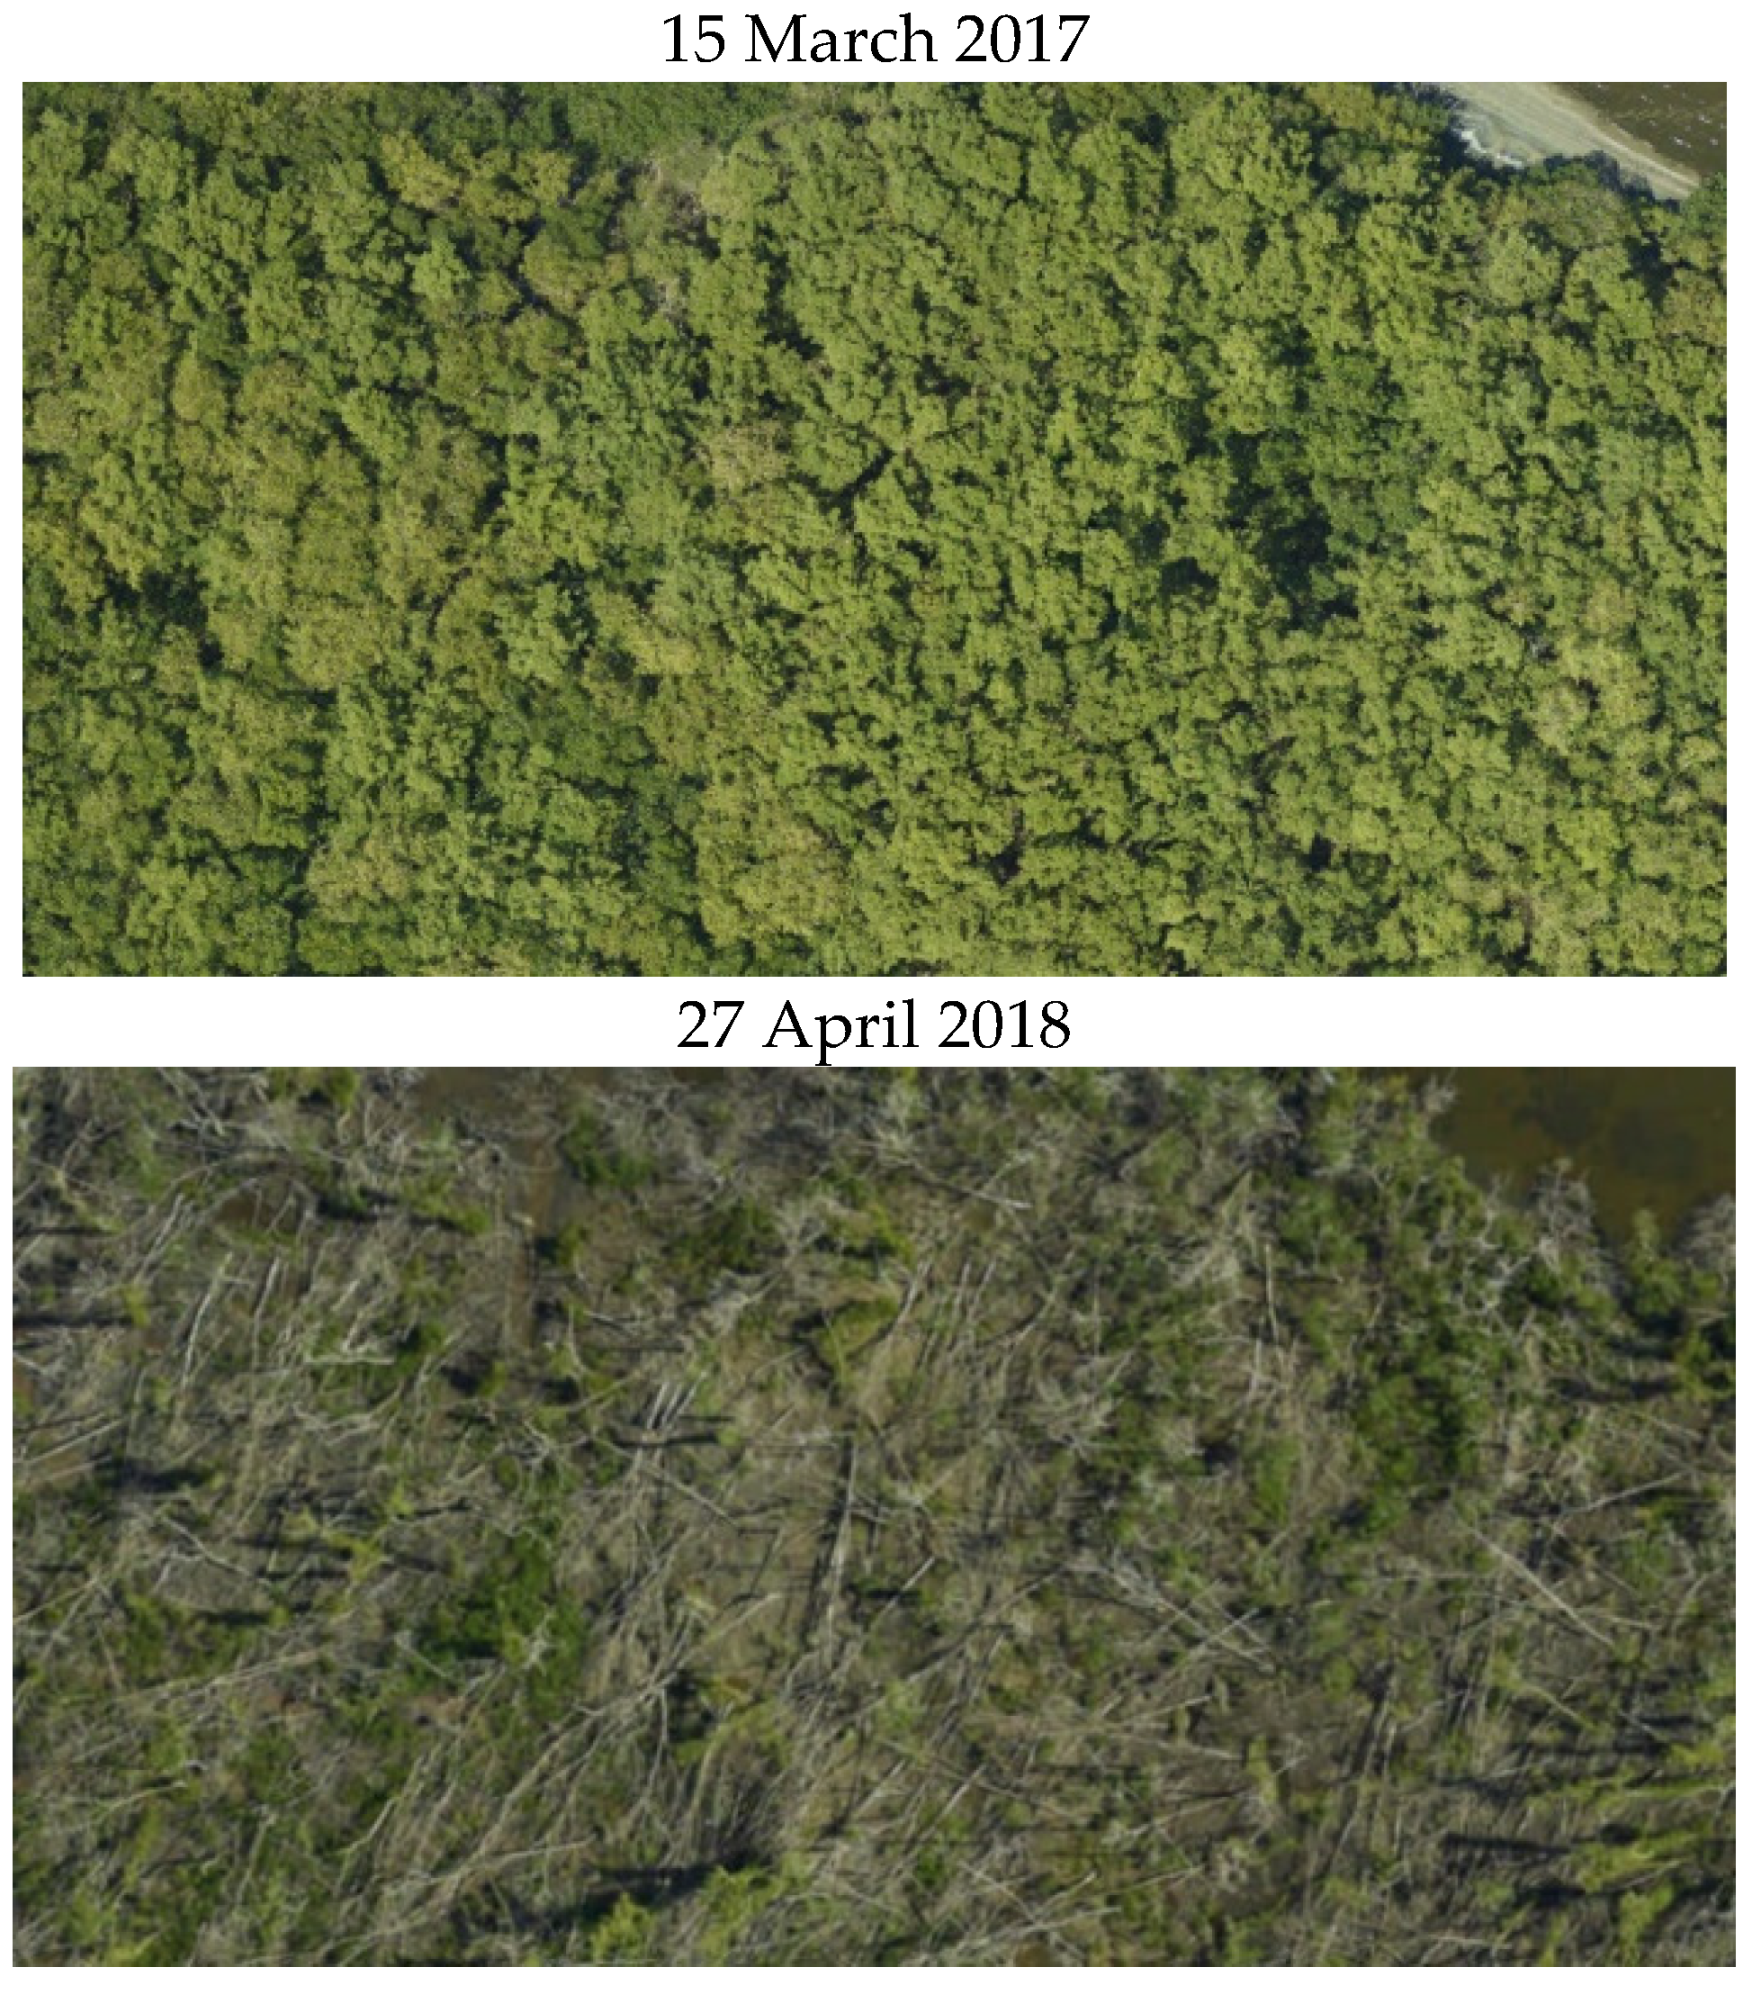
3.1. Spatial Variations in Canopy Height and Tree Density
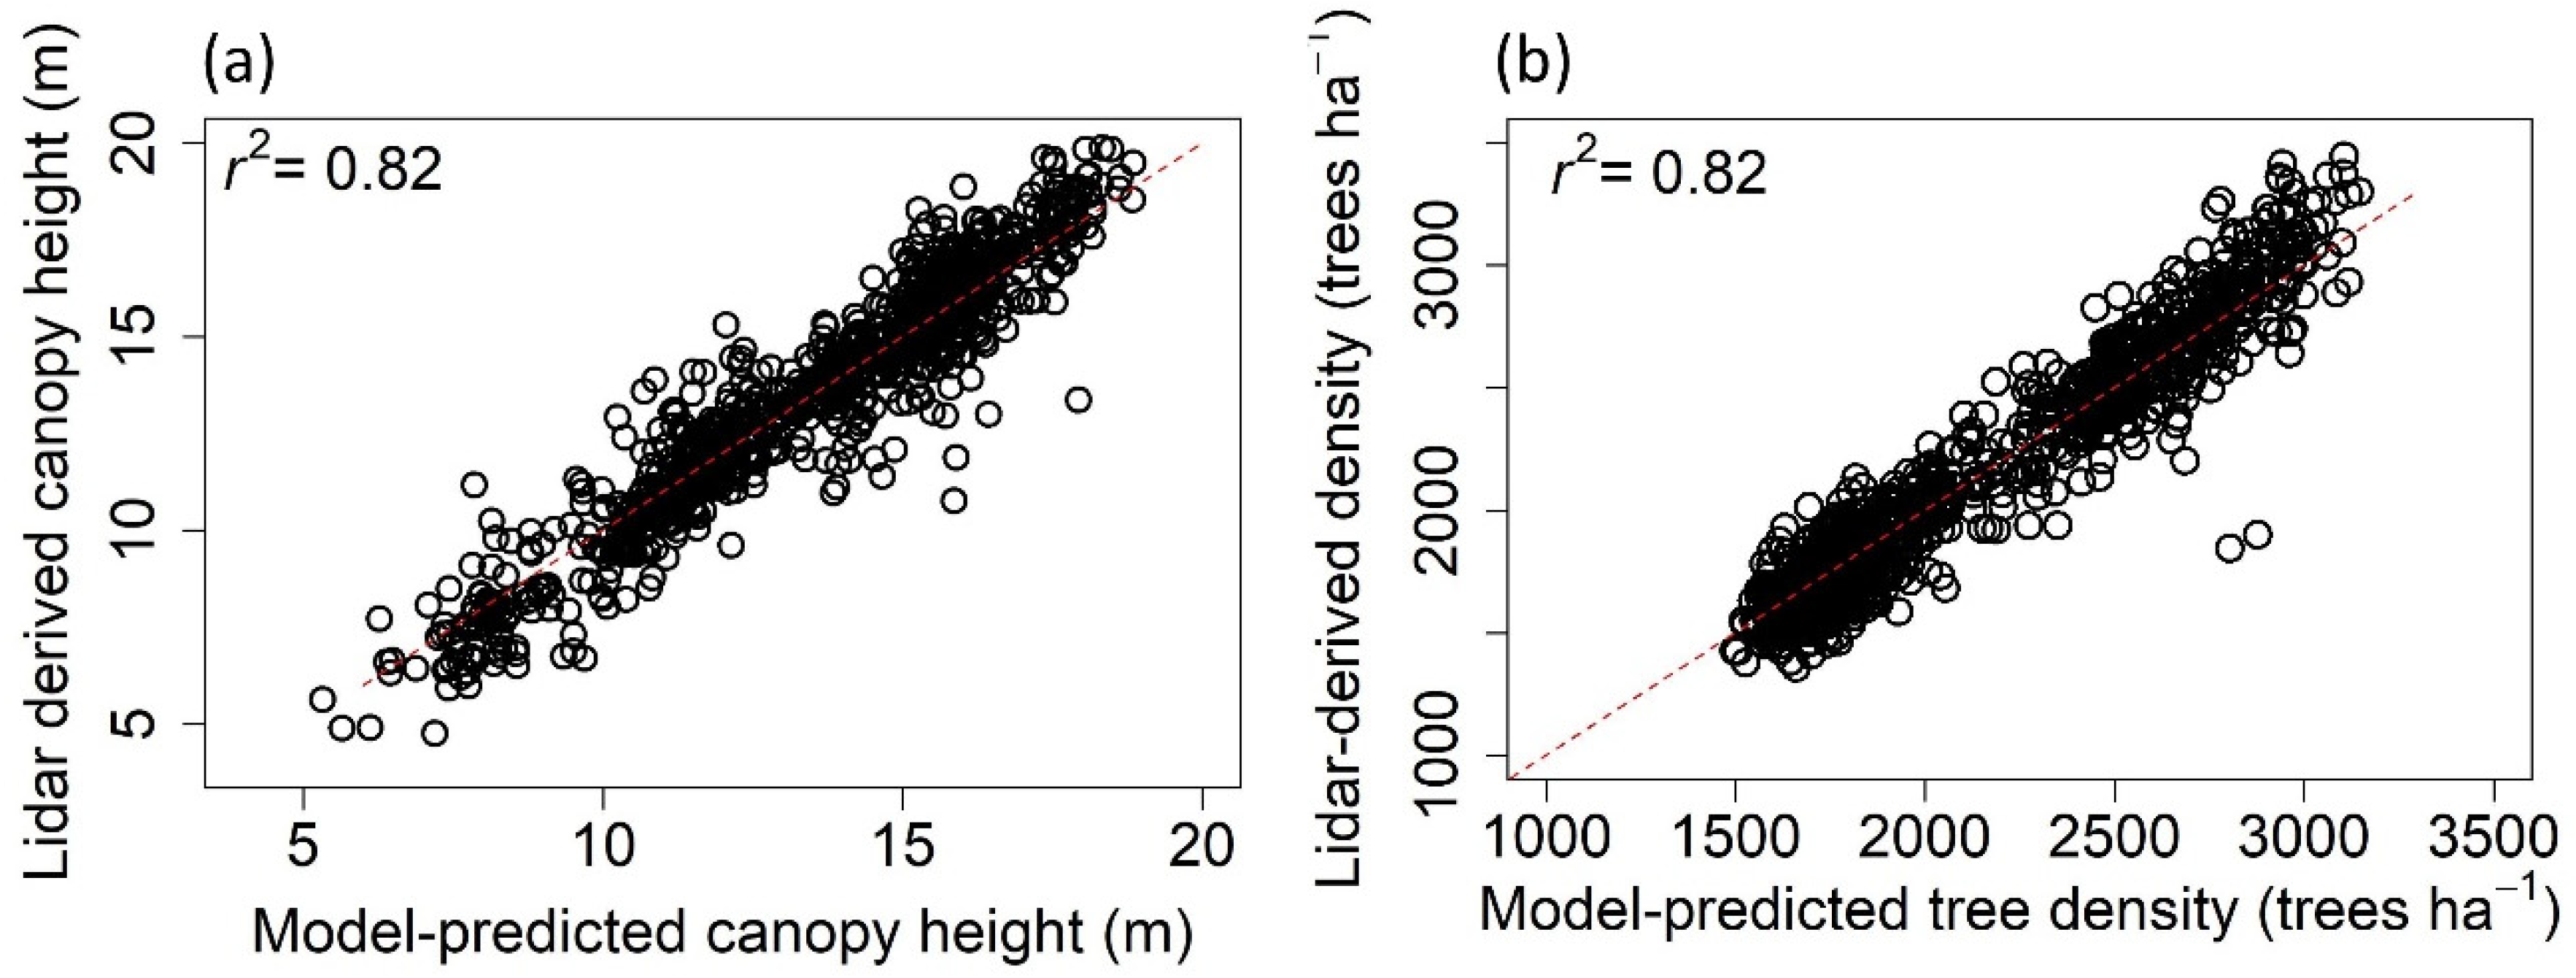
3.2. Spatial Regression of Intact Canopy Height and Tree Density
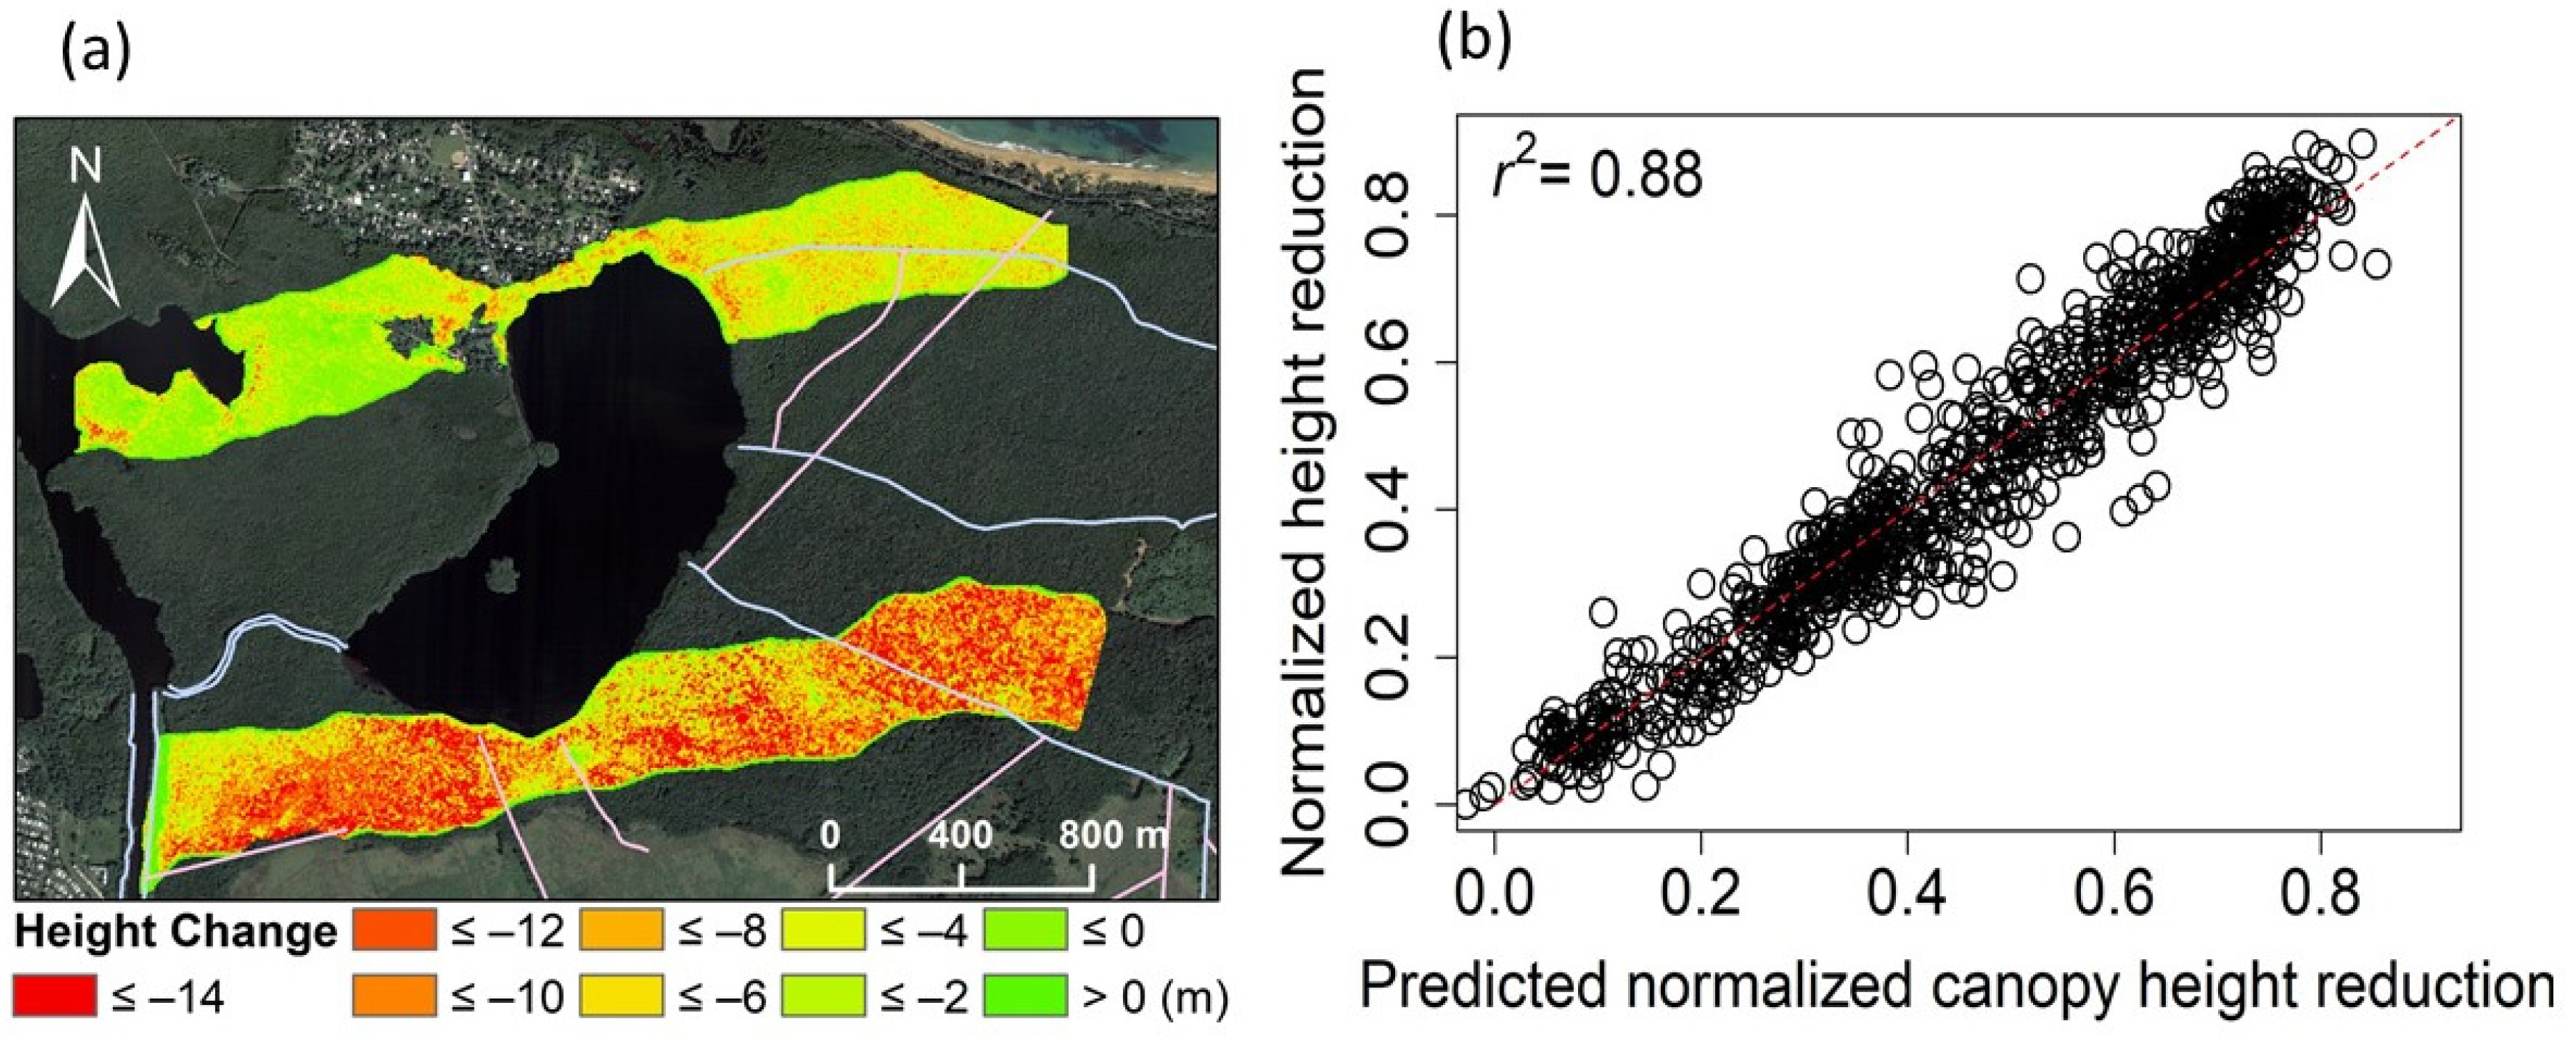
3.3. Spatial Regression of Canopy Height Reduction
4. Discussion
5. Conclusions
Author Contributions
Funding
Acknowledgments
Conflicts of Interest
Appendix A


References
- Giri, C.; Ochieng, E.; Tieszen, L.L.; Zhu, Z.; Singh, A.; Loveland, T.; Masek, J.; Duke, N. Status and distribution of mangrove forests of the world using earth observation satellite data. Glob. Ecol. Biogeogr. 2011, 20, 154–159. [Google Scholar] [CrossRef]
- Field, C.; Osborn, J.; Hoffman, L.; Polsenberg, J.; Ackerly, D.; Berry, J.; BjÖRkman, O.; Held, A.; Matson, P.; Mooney, H. Mangrove biodiversity and ecosystem function. Glob. Ecol. Biogeogr. Lett. 1998, 7, 3–14. [Google Scholar] [CrossRef]
- Lovelock, C.E.; Krauss, K.W.; Osland, M.J.; Reef, R.; Ball, M.C. The Physiology of Mangrove Trees with Changing Climate. In Tropical Tree Physiology—Adaptations and Responses in a Changing Environment; Goldstein, G., Santiago, L.S., Eds.; Springer: Berlin, Germany, 2016; pp. 149–179. [Google Scholar]
- Alongi, D. Carbon sequestration in mangrove forests. Carbon Manag. 2014, 3, 313–322. [Google Scholar] [CrossRef]
- Kristensen, E.; Andersen, F.O.; Homboe, N.; Holmer, M. Carbon and nitrogen mineralization in sediments of the Bangrong mangrove area, Phuket, Thailand. Aquat. Microb. Ecol. 2000, 22, 199–213. [Google Scholar] [CrossRef]
- Gedan, K.B.; Kirwan, M.L.; Wolanski, E.; Barbier, E.B.; Silliman, B.R. The present and future role of coastal wetland vegetation in protecting shorelines: Answering recent challenges to the paradigm. Clim. Chang. 2011, 106, 7–29. [Google Scholar] [CrossRef]
- Doody, J.P. ‘Coastal squeeze’—An historical perspective. J. Coast. Conserv. 2004, 10, 129–138. [Google Scholar] [CrossRef]
- Branoff, B. Urban Mangrove Biology and Ecology: Emergent Patterns and Management Implications; University of Puerto Rico: San Juan, PR, USA, 2018. [Google Scholar]
- Lee, S.Y.; Primavera, J.H.; Dahdouh-Guebas, F.; McKee, K.; Bosire, J.O.; Cannicci, S.; Diele, K.; Fromard, F.; Koedam, N.; Marchand, C.; et al. Ecological role and services of tropical mangrove ecosystems: A reassessment. Glob. Ecol. Biogeogr. 2014, 23, 726–743. [Google Scholar] [CrossRef]
- Choy, S.C.; Booth, W.E. Prolonged inundation and ecological changes in an Avicennia mangrove: Implications for conservation and management. Hydrobiologia 1994, 285, 237–247. [Google Scholar] [CrossRef]
- Mbense, S.; Rajkaran, A.; Bolosha, U.; Adams, J. Rapid colonization of degraded mangrove habitat by succulent salt marsh. S. Afr. J. Bot. 2016, 107, 129–136. [Google Scholar] [CrossRef]
- Lovelock, C.E.; Feller, I.C.; Reef, R.; Hickey, S.; Ball, M.C. Mangrove dieback during fluctuating sea levels. Sci. Rep. 2017, 7, 1680. [Google Scholar] [CrossRef]
- Ward, G.A.; Smith, T., III. Predicting mangrove forest recovery on the southwest coast of Florida following the impact of Hurricane Wilma, Octobe 2005. In Science and the Storms: The USGS Response to the Hurricanes of 2005; Farris, G.S., Smith, G.J., Crane, M.P., Demas, C.R., Robbins, L.L., Lavoie, D.L., Eds.; U.S. Geological Survey Circular, John W. Powell National Center: Reston, VA, USA, 2005; 283p. [Google Scholar]
- Blankespoor, B.; Dasgupta, S.; Lange, G.-M. Mangroves as a protection from storm surges in a changing climate. Ambio 2017, 46, 478–491. [Google Scholar] [CrossRef]
- Yu, M.; Gao, Q. Topography, drainage capability, and legacy of drought differentiate tropical ecosystem response to and recovery from major hurricanes. Environ. Res. Lett. 2020, 15, 104046. [Google Scholar] [CrossRef]
- Branoff, B.; Cuevas, E.; Hernandez, E. Assessment of Urban Coastal Wetlands Vulnerability to Hurricanes in Puerto Rico; Department of Natural and Environmental Resources: San Juan, PR, USA, 2015. [Google Scholar]
- Taillie, P.J.; Roman-Cuesta, R.; Lagomasino, D.; Cifuentes-Jara, M.; Fatoyinbo, T.; Ott, L.E.; Poulter, B. Widespread mangrove damage resulting from the 2017 Atlantic mega hurricane season. Environ. Res. Lett. 2020, 15, 064010. [Google Scholar] [CrossRef]
- Zhang, K.; Thapa, B.; Ross, M.; Gann, D. Remote sensing of seasonal changes and disturbances in mangrove forest: A case study from South Florida. Ecosphere 2016, 7, e01366. [Google Scholar] [CrossRef] [Green Version]
- Huang, W.; Sun, G.; Dubayah, R.; Cook, B.; Montesano, P.; Ni, W.; Zhang, Z. Mapping biomass change after forest disturbance: Applying LiDAR footprint-derived models at key map scales. Remote Sens. Environ. 2013, 134, 319–332. [Google Scholar] [CrossRef]
- van Leeuwen, M.; Nieuwenhuis, M. Retrieval of forest structural parameters using LiDAR remote sensing. Eur. J. For. Res. 2010, 129, 749–770. [Google Scholar] [CrossRef]
- Gao, Q.; Yu, M. Canopy Density and Roughness Differentiate Resistance of a Tropical Dry Forest to Major Hurricane Damage. Remote Sens. 2021, 13, 2262. [Google Scholar] [CrossRef]
- Mitchell, S.J. Wind as a natural disturbance agent in forests: A synthesis. For. Int. J. For. Res. 2012, 86, 147–157. [Google Scholar] [CrossRef] [Green Version]
- Gardiner, B.; Byrne, K.; Hale, S.; Kamimura, K.; Mitchell, S.J.; Peltola, H.; Ruel, J.-C. A review of mechanistic modelling of wind damage risk to forests. For. Int. J. For. Res. 2008, 81, 447–463. [Google Scholar] [CrossRef] [Green Version]
- Krauss, K.W.; Osland, M.J. Tropical cyclones and the organization of mangrove forests: A review. Ann. Bot. 2019, 125, 213–234. [Google Scholar] [CrossRef]
- Cartier, K. Hurricanes Hit Puerto Rico’s Mangroves Harder Than Florida’s. EOS 2019. [Google Scholar] [CrossRef]
- Martinuzzi, S.; Gould, W.A.; Lugo, A.E.; Medina, E. Conversion and recovery of Puerto Rican mangroves: 200 years of change. For. Ecol. Manag. 2009, 257, 75–84. [Google Scholar] [CrossRef]
- Yu, M.; Rivera-Ocasio, E.; Heartsill-Scalley, T.; Davila-Casanova, D.; Rios-López, N.; Gao, Q. Landscape-Level Consequences of Rising Sea-Level on Coastal Wetlands: Saltwater Intrusion Drives Displacement and Mortality in the Twenty-First Century. Wetlands 2019, 39, 1343–1355. [Google Scholar] [CrossRef]
- Gao, Q.; Yu, M. Discerning Fragmentation Dynamics of Tropical Forest and Wetland during Reforestation, Urban Sprawl, and Policy Shifts. PLoS ONE 2014, 9, e113140. [Google Scholar] [CrossRef]
- Kennaway, T.; Helmer, E.H. The forest types and ages cleared for land development in Puerto Rico. Giscience Remote Sens. 2007, 44, 356–382. [Google Scholar] [CrossRef]
- Martinez, R.; Cintron, G.; Encarnacion, L.A. Mangroves in Puerto Rico: A Structural Inventory; Department of Natural Resources, Puerto Rico: San Juan, PR, USA, 1979. [Google Scholar]
- Lugo, A.E.; Medina, E. Mangrove Forests. In Encyclopedia of Natural Resources—Land; Wang, Y., Ed.; Taylor & Francis: New York, NY, USA, 2014; Volume 1. [Google Scholar]
- Puerto Rico Department of Natural and Environmental Resources. Bosque Estatal de Piñones; Puerto Rico Department of Natural and Environmental Resources: San Juan, PR, USA, 2008. [Google Scholar]
- Cook, B.; Corp, L.; Nelson, R.; Middleton, E.; Morton, D.; McCorkel, J.; Masek, J.; Ranson, K.; Ly, V.; Montesano, P. NASA Goddard’s LiDAR, Hyperspectral and Thermal (G-LiHT) Airborne Imager. Remote Sens. 2013, 5, 4045. [Google Scholar] [CrossRef] [Green Version]
- Office for Coastal Management. C-CAP Land Cover, Puerto Rico, 2010. 2020. Available online: https://www.fisheries.noaa.gov/inport/item/48301 (accessed on 24 August 2021).
- Roussel, J.-R.; Auty, D.; Boissieu, F.D.; Meador, A.S. Lidr: Airborne LiDAR Data Manipulation and Visualization for Forestry Applications. 2019. Available online: https://cran.r-project.org/package=lidR (accessed on 24 August 2021).
- Anselin, L.; Griffith, D.A. DO SPATIAL EFFECFS REALLY MATTER IN REGRESSION ANALYSIS? Pap. Reg. Sci. 1988, 65, 11–34. [Google Scholar] [CrossRef]
- R Core Team. R: A Language and Environment for Statistical Computing; R Foundation for Statistical Computing: Vienna, Austria, 2020. [Google Scholar]
- Pool, D.; Snedaker, S.C.; Lugo, A.E. Structure of Mangrove Forests in Florida, Puerto Rico, Mexico, and Costa Rica. Biotropica 1977, 9, 195–212. [Google Scholar] [CrossRef] [Green Version]
- Krauss, K.W.; McKee, K.L.; Lovelock, C.E.; Cahoon, D.R.; Saintilan, N.; Reef, R.; Chen, L. How mangrove forests adjust to rising sea level. New Phytol. 2014, 202, 19–34. [Google Scholar] [CrossRef] [Green Version]
- Lugo, A.E.; Snedaker, S.C. The ecology of mangroves. Annu. Rev. Ecol. Syst. 1974, 5, 39–64. [Google Scholar] [CrossRef]
- Medina, E. Mangrove Physiology: The challenge of salt, heat, and light stress under recurrent flooding. In Ecosystemas de Manglar en America Tropical; Yanez-Arancibia, A., Lara-Dominquez, A.L., Eds.; Instituto de Ecologia A.C. Mexico: Xalapa, Mexico, 1999; pp. 109–126. [Google Scholar]
- Leong, R.C.; Friess, D.; Crase, B.; Lee, W.K.; Webb, E. High-resolution pattern of mangrove species distribution is controlled by surface elevation. Estuar. Coast. Shelf Sci. 2017, 202, 185–192. [Google Scholar] [CrossRef]
- Angelou, N.; Dellwik, E.; Mann, J. Wind load estimation on an open-grown European oak tree. For. Int. J. For. Res. 2019, 92, 381–392. [Google Scholar] [CrossRef]
- Peterson, C.J.; Ribeiro, G.H.P.d.M.; Negrón-Juárez, R.; Marra, D.M.; Chambers, J.Q.; Higuchi, N.; Lima, A.; Cannon, J.B. Critical wind speeds suggest wind could be an important disturbance agent in Amazonian forests. For. Int. J. For. Res. 2019, 92, 444–459. [Google Scholar] [CrossRef]
- Paz, H.; Vega-Ramos, F.; Arreola-Villa, F. Understanding hurricane resistance and resilience in tropical dry forest trees: A functional traits approach. For. Ecol. Manag. 2018, 426. [Google Scholar] [CrossRef]
- Renaud, J.-P.; Vega, C.; Durrieu, S.; Lisein, J.; Magnussen, S.; Lejeune, P.; Fournier, M. Stand-level wind damage can be assessed using diachronic photogrammetric canopy height models. Ann. For. Sci. 2017, 74, 74. [Google Scholar] [CrossRef] [Green Version]
- Hall, J.; Muscarella, R.; Quebbeman, A.; Arellano, G.; Thompson, J.; Zimmerman, J.K.; Uriarte, M. Hurricane-Induced Rainfall is a Stronger Predictor of Tropical Forest Damage in Puerto Rico Than Maximum Wind Speeds. Sci. Rep. 2020, 10, 4318. [Google Scholar] [CrossRef] [PubMed]
- Duryea, M.L.; Kamp, E. Wind and Trees: Lessons Learned from Hurricanes; School of Forest Resources and Conservation, University of Florida FAS Extension: Gainesville, FL, USA, 2017; Available online: http://edis.ifas.ufl.edu (accessed on 24 August 2021).
- Moore, J.; Lin, Y. Determining the extent and drivers of attrition losses from wind using long-term datasets and machine learning techniques. For. Int. J. For. Res. 2019, 92, 425–435. [Google Scholar] [CrossRef]
- Walter, B.; Gromke, C.; Lehning, M. The SLF boundary layer wind tunnel—An experimental facility for aerodynamical investigations of living plants. In Proceedings of the 2nd International Conference Wind Effects on Trees, Freiburg, Germany, 13–16 October 2009; pp. 31–38. [Google Scholar]
- Jimenez, D.L.; Alvarez-Añorve, M.; Pineda-Cortes, M.; Flores-Puerto, J.; Benitez-Malvido, J.; Oyama, K.; Avila Cabadilla, L. Structural and functional traits predict short term response of tropical dry forests to a high intensity hurricane. For. Ecol. Manag. 2018, 426. [Google Scholar] [CrossRef]
- Hale, S.; Gardiner, B.; Peace, A.; Nicoll, B.; Taylor, P.; Pizzirani, S. Comparison and validation of three versions of a forest wind risk model. Environ. Model. Softw. 2015, 68, 27–41. [Google Scholar] [CrossRef] [Green Version]
- Locatelli, T.; Tarantola, S.; Gardiner, B.; Patenaude, G. Variance-based sensitivity analysis of a wind risk model—Model behaviour and lessons for forest modelling. Environ. Model. Softw. 2017, 87, 84–109. [Google Scholar] [CrossRef] [Green Version]
- Nguyen, H.T.; Stanton, D.E.; Schmitz, N.; Farquhar, G.D.; Ball, M.C. Growth responses of the mangrove Avicennia marina to salinity: Development and function of shoot hydraulic systems require saline conditions. Ann. Bot. 2015, 115, 397–407. [Google Scholar] [CrossRef]
- Chen, Y.; Ye, Y. Effects of Salinity and Nutrient Addition on Mangrove Excoecaria agallocha. PLoS ONE 2014, 9, e93337. [Google Scholar] [CrossRef]
- Peters, R.; Vovides, A.G.; Luna, S.; Gruters, U.; Berger, U. Changes in allometric relations of mangrove trees due to resource availability—A new mechanistic modelling approach. Ecol. Model. 2014, 283, 53–61. [Google Scholar] [CrossRef]
- Vovides, A.G.; Vogt, J.; Kollert, A.; Berger, U.; Grueters, U.; Peters, R.; Lara-Domínguez, A.L.; López-Portillo, J. Morphological plasticity in mangrove trees: Salinity-related changes in the allometry of Avicennia germinans. Trees 2014, 28, 1413–1425. [Google Scholar] [CrossRef]
- Whigham, D.F.; Verhoeven, J.T.A.; Samarkin, V.; Megonigal, P.J. Responses of Avicennia germinans (Black Mangrove) and the Soil Microbial Community to Nitrogen Addition in a Hypersaline Wetland. Estuaries Coasts 2009, 32, 926–936. [Google Scholar] [CrossRef] [Green Version]
- Kodikara, K.A.S.; Jayatissa, L.P.; Huxham, M.; Dahdouh-Guebas, F.; Koedam, N. The effects of salinity on growth and survival of mangrove seedlings changes with age. Acta Bot. Bras. 2017, 32. [Google Scholar] [CrossRef] [Green Version]
- Reich, P.B.; Walter, M.B.; Ellsworth, D.S. Leaf life-span in relation to leaf, plant, and stand characterisitics among diverse ecosystems. Ecol. Monogr. 1992, 62, 365–392. [Google Scholar] [CrossRef]
- Chapin, F.S.I.; Matson, P.; Vitousek, P.M. Principles of Terrestrial Ecosystem Ecology, 2nd ed.; Springer: New York, NY, USA, 2011. [Google Scholar]
- Lugo, A.E. Visible and invisible effects of hurricanes on forest ecosystems: An international review. Austral Ecol. 2008, 33, 368–398. [Google Scholar] [CrossRef]
- Wang, Y.; Fang, H. Estimation of LAI with the LiDAR Technology: A Review. Remote Sens. 2020, 12, 3457. [Google Scholar] [CrossRef]
- Gao, Q.; Yu, M. Reforestation-induced changes of landscape composition and configuration modulate freshwater supply and flooding risk of tropical watersheds. PLoS ONE 2017, 12, e0181315. [Google Scholar] [CrossRef] [Green Version]
- Yu, M.; Gao, Q.; Gao, C.; Wang, C. Extent of Night Warming and Spatially Heterogeneous Cloudiness Differentiate Temporal Trend of Greenness in Mountainous Tropics in the New Century. Sci. Rep. 2017, 7, 41256. [Google Scholar] [CrossRef]


| Transect | North | South | Pooled |
|---|---|---|---|
| Area (ha) | 82.4 | 105.4 | 187.8 |
| Intact CHM (m) | 10.1 ± 3.1 | 14.5 ± 4.3 | 12.6 ± 4.4 |
| Disturbed CHM (m) | 6.2 ± 2.5 | 5.4 ± 3.8 | 5.8 ± 3.3 |
| Intact tree density (ha−1) | 2579 ± 853 | 1806 ± 727 | 2147 ± 874 |
| DEM (m) | 0.28 ± 0.14 | 0.18 ± 0.21 | 0.22 ± 0.19 |
| Distance to canals (m) | 414.6 ± 350.9 | 164.5 ± 100.1 | 273.7 ± 273.4 |
Publisher’s Note: MDPI stays neutral with regard to jurisdictional claims in published maps and institutional affiliations. |
© 2021 by the authors. Licensee MDPI, Basel, Switzerland. This article is an open access article distributed under the terms and conditions of the Creative Commons Attribution (CC BY) license (https://creativecommons.org/licenses/by/4.0/).
Share and Cite
Gao, Q.; Yu, M. Elevation and Distribution of Freshwater and Sewage Canals Regulate Canopy Structure and Differentiate Hurricane Damages to a Basin Mangrove Forest. Remote Sens. 2021, 13, 3387. https://0-doi-org.brum.beds.ac.uk/10.3390/rs13173387
Gao Q, Yu M. Elevation and Distribution of Freshwater and Sewage Canals Regulate Canopy Structure and Differentiate Hurricane Damages to a Basin Mangrove Forest. Remote Sensing. 2021; 13(17):3387. https://0-doi-org.brum.beds.ac.uk/10.3390/rs13173387
Chicago/Turabian StyleGao, Qiong, and Mei Yu. 2021. "Elevation and Distribution of Freshwater and Sewage Canals Regulate Canopy Structure and Differentiate Hurricane Damages to a Basin Mangrove Forest" Remote Sensing 13, no. 17: 3387. https://0-doi-org.brum.beds.ac.uk/10.3390/rs13173387