Article

An Investigation of Extreme Weather Impact on Precipitable Water Vapor and Vegetation Growth—A Case Study in Zhejiang China

1
School of Geodesy and Geomatics, Wuhan University, Wuhan 430072, China
2
School of Resources and Environmental Science and Engineering, Hubei University of Science and Technology, Xianning 437100, China
3
College of Geomatics, Xi’an University of Science and Technology, Xi’an 710054, China
4
College of Geomatics and Geoinformation, Guilin University of Technology, Guilin 541004, China
*
Author to whom correspondence should be addressed.
Remote Sens. 2021, 13(18), 3576; https://0-doi-org.brum.beds.ac.uk/10.3390/rs13183576
Submission received: 1 August 2021 / Revised: 3 September 2021 / Accepted: 5 September 2021 / Published: 8 September 2021
(This article belongs to the Special Issue Carbon, Water and Climate Monitoring Using Space Geodesy Observations)

Abstract

:
Zhejiang province in China experienced an extreme climate phenomenon in August 2014 with temperature rises, sunshine duration decreases, and precipitation increases, particularly, the successive heavy rainfall events occurring from 16 to 20 August 2014 that contributed to this climate anomaly. This study investigates the spatial-temporal variation characteristics of precipitable water vapor (PWV) and the normalized difference vegetation index (NDVI) associated with this phenomenon. Multiple sources of PWV values derived from the Global Positioning System (GPS), Radiosonde (RS) and European Centre for Medium-Range Weather Forecasts (ECMWF) ERA-Interim data are used with different spatiotemporal resolutions. The monthly averaged PWV in August 2014 exceeded the 95% percentiles of climatological value (53 mm) while the monthly averaged temperature was less than the 5% percentiles of climatological value (26.6 °C). Before the extreme precipitation, the PWV increased from the yearly averaged value of about 35 mm to more than 60 mm and gradually returned to the August climatological average of 50 mm after the precipitation ended. A large-scale atmospheric water vapor was partially conveyed by the warm wet air current of anticyclones which originated over the South China Sea (25° N, 130° E) and the Western Pacific Ocean. The monthly NDVI variation over the past 34 years (1982–2015) was investigated in this paper and the significant impact of extreme climate on vegetation growth in August 2014 was found. The extreme negative temperature anomaly and positive PWV anomaly are the major climate-driven factors affecting vegetation growth in the north and south of Zhejiang province with correlation coefficients of 0.83 and 0.72, respectively, while the extreme precipitation does not show any apparent impact on NDVI.

Graphical Abstract

1. Introduction

Ongoing climate change has caused extreme climatic events to happen more frequently, which can fundamentally threaten plant growth and survivorship [1]. For example, climatic changes and weather extremes are causing shifts in the distribution of tree species, affecting the productivity of forests [2]. The most important effects of heat waves on the vegetation are due to high temperatures and extreme drought stress, which affect plant physiology and metabolism [3]. Therefore, investigating the extreme weather impact on vegetation growth has becomes the focus.
An extreme climate phenomenon occurred in August 2014 in Zhejiang province, China; many areas experienced a record of high precipitation with the average precipitation exceeding 200 mm for the period from 8 to 20 August according to reports from the Zhejiang meteorological observatory. The temperature in Zhejiang province was consistently low in August 2014 while the averaged sunshine duration was about 118 h, which only accounts for half of the averaged values for the past 50 years. The strongest successive precipitation occurred between 16 and 20 August, which affected millions of people and the amount of public and private properties damages reached up to ten billion RMB.
Extreme precipitation needs a rich supply of moisture and transportation in the atmosphere; however, the amount of atmospheric water vapor is controlled by air temperature [4]. Knowledge of the spatiotemporal variation of atmospheric water vapor and temperature would provide valuable information to aid in understanding atmospheric phenomena and certain extreme events [5]. The Global Navigation Satellite Systems (GNSS) technique was proved to be able to detect sudden changes in precipitable water vapor (PWV) [6,7,8,9] and has been widely used in the monitoring of atmospheric storms and depressions [10] as well as the forecasting of heavy precipitation [11]. The authors of [12] pointed out that the PWV characteristics are an important factor because they could affect future climate change trends. Additionally, PWV variations are highly correlated with precipitation, and precipitation begins normally after the PWV reaches its peak and PWV returns to its climatological value after the end of the precipitation [12,13,14,15]. The authors of [16] also found that the increase of atmospheric water vapor could possibly lead to the occurrence of the precipitation events.
Vegetation growth is mainly affected by external climatic factors and human activities [17,18,19]. Extreme climate events exert a direct, or indirect, impact on ecosystems over different spatiotemporal scales [20,21,22]. An investigation of vegetation variation under extreme climate events can enhance our understanding of the result of climate change in particular in densely populated areas. Regional vegetation recordings are usually used to reflect the footprint of climate change and possibly to evaluate the influence of climate change on ecosystems through time and space [23,24].
This article mainly studies the impact of extreme climate events on the temporal and spatial changes of PWV and vegetation growth and conducts it with climatology. In order to achieve this research purpose, this paper investigates the impact of extreme climate phenomena on atmospheric PWV characteristics and vegetation growth by comparing case studies in Zhejiang province, China, in order to better understand: (1) The relationship between time and space, PWV and changes in extreme precipitation events (2) The impact of extreme weather events on the spatial and temporal distribution of vegetation growth. It is expected that this study may open up a new way for the study of extreme climates in the future. Multiple sources of data are used, this includes the PWV time series derived from GPS, radiosonde, and European Centre for Medium-Range Weather Forecasts (ECMWF) ERA-Interim reanalysis data, precipitation, temperature, and sunshine duration data obtained from meteorological stations, hourly precipitation time series from rain gauges, and normalized difference vegetation index (NDVI) time series from the Global Inventory Monitoring and Modelling System third generation (GIMMS3g) dataset. This study reveals: (1) A continuous water vapor transportation and supply, which is reflected by high PWV values, is a prerequisite for extreme rainfall; (2) the influence of multi climatic factors on vegetation growth is found to be inhomogeneous.

2. Data and Methods

2.1. Obtaining the PWV Time Series

The PWV time series are calculated using different observations in this study. The first is calculated from the GPS observations with a sampling interval of 30 s and relevant meteorological data from the Zhejiang Continuously Operating Reference Stations (CORS) network. The information related to GPS CORS stations is listed in Table 1. The Zenith Total Delay (ZTD) parameter is estimated using the independently developed Precise Point Positioning (PPP) technique [9]. The specific information pertaining to the GPS PWV determination and its accuracy assessment can be found in [11]. The GPS-derived PWV was first quality-controlled using the method in which the lower and upper limitations of PWV values are defined as 0 and 150 mm, respectively [25]. Finally, the 5-min PWV time series from eight GPS stations for the year 2014 are obtained.
The second PWV dataset used is the 12-h radiosonde data from the Integrated Global Radiosonde Archive (IGRA) Version 2, which was produced by the National Climate Data Center (NCDC) updated in August 2016. Two radiosonde stations (58,457 and 58,633) and their long-term PWV time series are used for 30 years (1987–2016) of data in this paper. The corresponding methodology for the calculation of PWV using radiosonde data can be referred to [26]. PWV at a grid point of 0.125° × 0.125° across eight years (2010–2017) covering the entire Zhejiang province using the layered ECMWF ERA-Interim global reanalysis products with the temporal resolutions of four times daily are calculated. The location of Zhejiang province in China, as well as the distributions of the GPS, radiosonde, and the meteorological stations used, are shown in Figure 1.

2.2. Description of the NDVI Dataset

Vegetation growth can be quantified by the NDVI, which is selected from the Global Inventory Monitoring and Modelling System third generation (GIMMS3g) dataset in this study. This kind of dataset has been improved by the advanced calibration products and calibrated with the Sea-viewing Wide Field-of-view Sensor (SeaWiFS) observations [27]. The spatiotemporal resolution of the selected NDVI is half-monthly intervals and 1/12°, respectively [28]. Monthly NDVI data are obtained using the fortnightly NDVI time series and the maximum value composite (MVC) method to remove the influence of atmospheric noise [29]. Additionally, the NDVI data with “snow” or “clouds” flags in Zhejiang province are also excluded from the GIMMS3g dataset [30]. As the grid data of NDVI are provided by GIMMS3g, the average value of those grid points in Zhejiang province are produced directly to represent vegetation growth conditions in Zhejiang province.

2.3. Additional Datasets

Hourly precipitation data of corresponding rain gauges are also collected from the Zhejiang Water and Rain Information Display System (ZWRIDS) for the month of August. Eight rain gauges are determined according to the location of the selected GPS stations (Figure 1). Those two kinds of stations are almost collocated with the horizontal and vertical distances less than 2 km and 100 m respectively. In addition, daily temperature, precipitation, and sunshine duration data are also obtained from the China Surface Climate Dataset (Version 3.0) from the China Meteorological Administration (CMA), which includes 18 meteorological stations from 1951 to present. All of the data obtained were subjected to a strict quality control and the percentage of actual data for each dataset generally exceeds 99%. Due to the NDVI data being conducted at a monthly scale, the daily precipitation, temperature, and sunshine duration used in this study have been converted to a monthly scale accordingly.

2.4. Extreme Precipitation Event

It is reported from Zhejiang Meteorological Bureau that the extreme climate anomaly in August 2014 occurred with monthly precipitation increase while the monthly temperature and sunshine duration decreased. This extreme climate event was difficult to be characterized, because of not only the variations of climatic factors but also the month in which it happened. Generally, typhoon events are frequent and bring strong rainfall in August, however, only one typhoon event formed in the northwest Pacific Ocean which is the lowest number in recorded history. In addition, this typhoon did not induce any rainfall in Zhejiang province, but the number of days with strong precipitation was abnormally high in August 2014. Among them, successive extreme precipitation events occurred from 16 to 20 August 2014, which contributed a lot to this extreme climate anomaly. The accumulated precipitation amount for the successive precipitation period of 16 to 20 August in Zhejiang province is presented in Figure 2. It can be seen that the five-day precipitation amount exceeded 200 mm in the southeast of Zhejiang province.

3. Result and Discussion

3.1. Abnormality of Climatic Factors in August 2014

A number of important climatic factors, such as monthly precipitation, monthly temperature, monthly sunshine duration, etc., were abnormal according to the report from the Zhejiang Meteorological Bureau in August. To quantify the extreme climatic factors to investigate their correlation with extreme climate phenomenon, data from meteorological stations in Zhejiang province are selected from the CMA. Figure 3 shows the monthly time series of those climatic factors in August for the past 50 years from 1957 to 2016. It can be observed from Figure 3 that the amount of monthly accumulated precipitation in August 2014 is the highest in those 50 years with an average monthly precipitation of 322.7 mm, which is almost twice the average value over the 50 years. The monthly average temperature in Zhejiang province is about 26.8 °C, which is about 1.1 °C less than the average value over the 50 years and ranked fourth lowest overall. The monthly accumulated sunshine duration is about 117.9 h, which is about half of the 50-year average value and only more than 2.8 h greater than the lowest values occurring in August 1980 (115.1 h).
Precipitation events are highly correlated with temperature change [31]. It is found that PWV increases with air temperature by about 7% K-1 according to the Clausius-Clapeyron (C-C) relation when the relative humidity is a constant in the lower atmosphere [32]. Therefore, the PWV and temperature changes in the extreme period of August 2014 are further analyzed. Figure 4 compares the monthly-averaged 2014 GPS data as well as the monthly-averaged 2014 radiosonde data and ECMWF data to 30 and eight years of monthly-averaged radiosonde and ECMWF data, respectively. It can be observed from Figure 4a that 2014 PWV monthly average derived from GPS, radiosonde, and ECMWF are higher than the climatological one based on 30-year radiosonde data recorded in August. The monthly average PWV derived from GPS and radiosonde data is more than 60 mm, approximately 10% higher than the long-term climatological monthly average. Additionally, the monthly average of PWV derived from ECMWF is around 57 mm, also approximately 10% higher than the monthly average of 8-year ECMWF data. It is also noted that the monthly average of PWV is above the 95th percentile of normal climatologic values based on the 30 years of monthly-averaged radiosonde data. For the temperature comparison (Figure 4b), the temperature monthly average is lower than the climatologic one. The monthly average temperature in August 2014 is about 27 °C, which is lower than the long-term climatological monthly average by 7%. It was also observed that the monthly average of temperature is lower than the 5th percentile of its normal climatological value calculated using the monthly averaged radiosonde data of 30 years. Monthly-averaged PWV and temperature in August 2014 exceed the 95th and are less than 5th, percentiles of long-term climatological values, respectively, which represents the climate abnormality in August 2014 in terms of the magnitude and timing of climatic factors.
In addition, the frequency distributions of PWV and temperature are also analyzed in August 2014 to verify the extreme climatic anomaly [12,33]. Figure 5 gives the statistical frequency distributions of PWV and temperature for Augusts from 2010 to 2017 using the data from the ECMWF ERA-Interim data. It can be seen that the frequency distribution of PWV exceeded 95th percentiles of 30-year monthly data derived from radiosonde data while that of temperature was less than 5th percentiles of 30-year monthly data. Such a result shows how anomalous August 2014 was. According to the above results it can be concluded that the temporal datasets of temperature, sunshine duration or even NDVI, is observed something cyclical, but the precipitation can also be detected by the abnormal change of those factors.

3.2. PWV Characteristics and Extreme Precipitation

The temporal characteristics of PWV and temperature in August 2014 have been compared with the long-term radiosonde and ECMWF data described in Section 3.1. Both the maximum PWV value and the minimum temperature occurred in August 2014, but not observed in August of any other years. This is an indication that the atmospheric water vapor content is anomalously large and that the temperature decreased for the time of year in which the precipitation happened.
In the process of heavy precipitation from 16 to 20 August, the average precipitation in Zhejiang province reached 155.5 mm, which accounts for about half of monthly accumulated precipitation and about five times more than the same period in past years. Additionally, the average temperature during this period is 20 °C, which is about 3.7 °C lower than in the same period in previous years. The occurrence of strong precipitation requires a large amount of atmospheric water vapor supplementation [13]. Before precipitation, the water vapor convergence was reflected by the increased PWV values. The authors of [14] found that the PWV decreases and rainfall begins after the PWV peaks. In addition, the increase in extreme precipitation for a given increase in high amounts of water vapor becomes disproportionately large compared to the same increase at low amounts of water vapor [34].
Figure 6 presents the 5 min PWV time series as well as the corresponding hourly precipitation data at four GPS stations (LJSL, ZJPH, ZJXC, and ZJYH) for the period of 16 to 20 August. It is found that precipitation happened after the PWV peaks, which is consistent with the results from [12,14]. Before 17 August, the PWV at four GPS stations exceeded 65 mm, while the August climatological average is around 55 mm obtained from the 30 years of radiosonde data (Figure 4a). After the precipitation ended on around 20 August, the PWV decrease to values closer to its August climatological average. The decrease of PWV during precipitation is the result of a transition of atmospheric water vapor into liquid water particles and icy hydrometeors [35,36]. It is also noted that the PWV values are larger than the long-term PWV median and its range is between one and two standard deviations for most of the time in which precipitation occurred. As can be observed from Figure 6, although the PWV fluctuated during strong precipitation events, its value remains to be relatively constant. As described by [37], the high PWV values over multiple days during precipitation indicate a continuous water vapor transportation and supply into this area. Therefore, the atmospheric water vapor transportation that supplies this strong precipitation during the period 16–20 August 2014 is analyzed below.

3.3. Atmospheric Water Vapor Transportation

Abundant atmospheric water vapor supply is required for consecutive precipitation events, such as the one was observed during 16–20 August 2014. In Section 3, the PWV was found to remain anomalous with a high value during precipitation period. To understand the atmospheric water vapor characteristics of this heavy successive precipitation, issues such as where the atmospheric water vapor comes from and how the moisture circulates are investigated.
The atmospheric water vapor sources and their transportation are analyzed using the ECMWF-derived 500 hPa geopotential height, wind field, and temperature in conjunction with the PWV data to answer the questions posed above [12]. Five epochs throughout this event are selected based on the process of heavy precipitation. Spatial-temporal variations of the four variables mentioned above are shown in Figure 7 for each epoch. The atmospheric water vapor distribution is shown in Figure 7a1–a4 on 16 August at 12:00 UTC, at the beginning of the heavy precipitation event. The cold air moves south from the Shandong Peninsula to the direction of Hubei Province with the deepening and strengthening of a low-pressure system in Northeast China. In the meantime, an anticyclone was generated and strengthened in the eastern ocean off Taiwan (25° N, 130° E), which brought abundant moisture to the south-eastern coast of China. The convergence area was formed in Zhejiang province between southwest warm wet air current of anticyclonic circulation near Taiwan and the cold air of low pressure in Northeast China. Therefore, heavy precipitation is generated in Zhejiang province. It was also noted that abundant atmospheric water presented in Zhejiang province (Figure 7a4), which suggests the sufficiency of water vapor supply provided by the anticyclone.
By 19 August 00:00 UTC (Figure 7b1–b4), the anticyclone had disappeared in the South China Sea, but another convergence area was formed between the anticyclone in the Pacific Ocean and the cold air of the low-pressure region in Northeast China, which moved from the ocean to the south-eastern coast of China and carried with a large amount of moisture. The temperature is slightly increased due to the influence of ocean air (Figure 7b3) and the PWV value is decreased with the strong precipitation for the period of 16 to 19 August (see Figure 7b4). On 20 August 00:00 UTC, the previously-formed convergence area moved to the south-eastern coast of China (Figure 7c1–c4). The temperature in Zhejiang province is further increased (Figure 7c3) while the PWV value is generally decreased in South China with the deepening of the cold air in the low-pressure region in Northeast China (Figure 7c4). By the end of 21 August at 00:00 UTC (Figure 7d1–d4), the weather over the south of China is mainly controlled by the anticyclone derived from the Pacific Ocean. The temperature in the south of China is increased due to the landing of the ocean wind (Figure 7d3) while the PWV decreased below the climatological average with a value of about 40 mm in Zhejiang province (Figure 7d4), which indicates the end of heavy precipitation. On 23 August at 12:00 UTC (Figure 7e1–e4), the influence of the anticyclone was strengthened, and the temperature was further increased. The PWV value returned to its climatological average value of around 55 mm.
Upon analyzing the ECMWF-derived PWV with the 500 hPa geopotential height, wind field, and temperature, it can be found that the location and intensity of the atmospheric water vapor transportation varied during precipitation. On 16 August, the moisture transportation occurred for the first time caused by the influence of an anticyclone over the eastern ocean of Taiwan. While the second atmospheric water vapor transportation event happened with the moving of an anticyclone in the Pacific Ocean over the mainland of China during the period 19–21 August. It was also found that the variations in PWV values gradually decreased from north to south during precipitation (Figure 7a4–d4) and returned to the climatological average value after the end of precipitation (Figure 7e4).

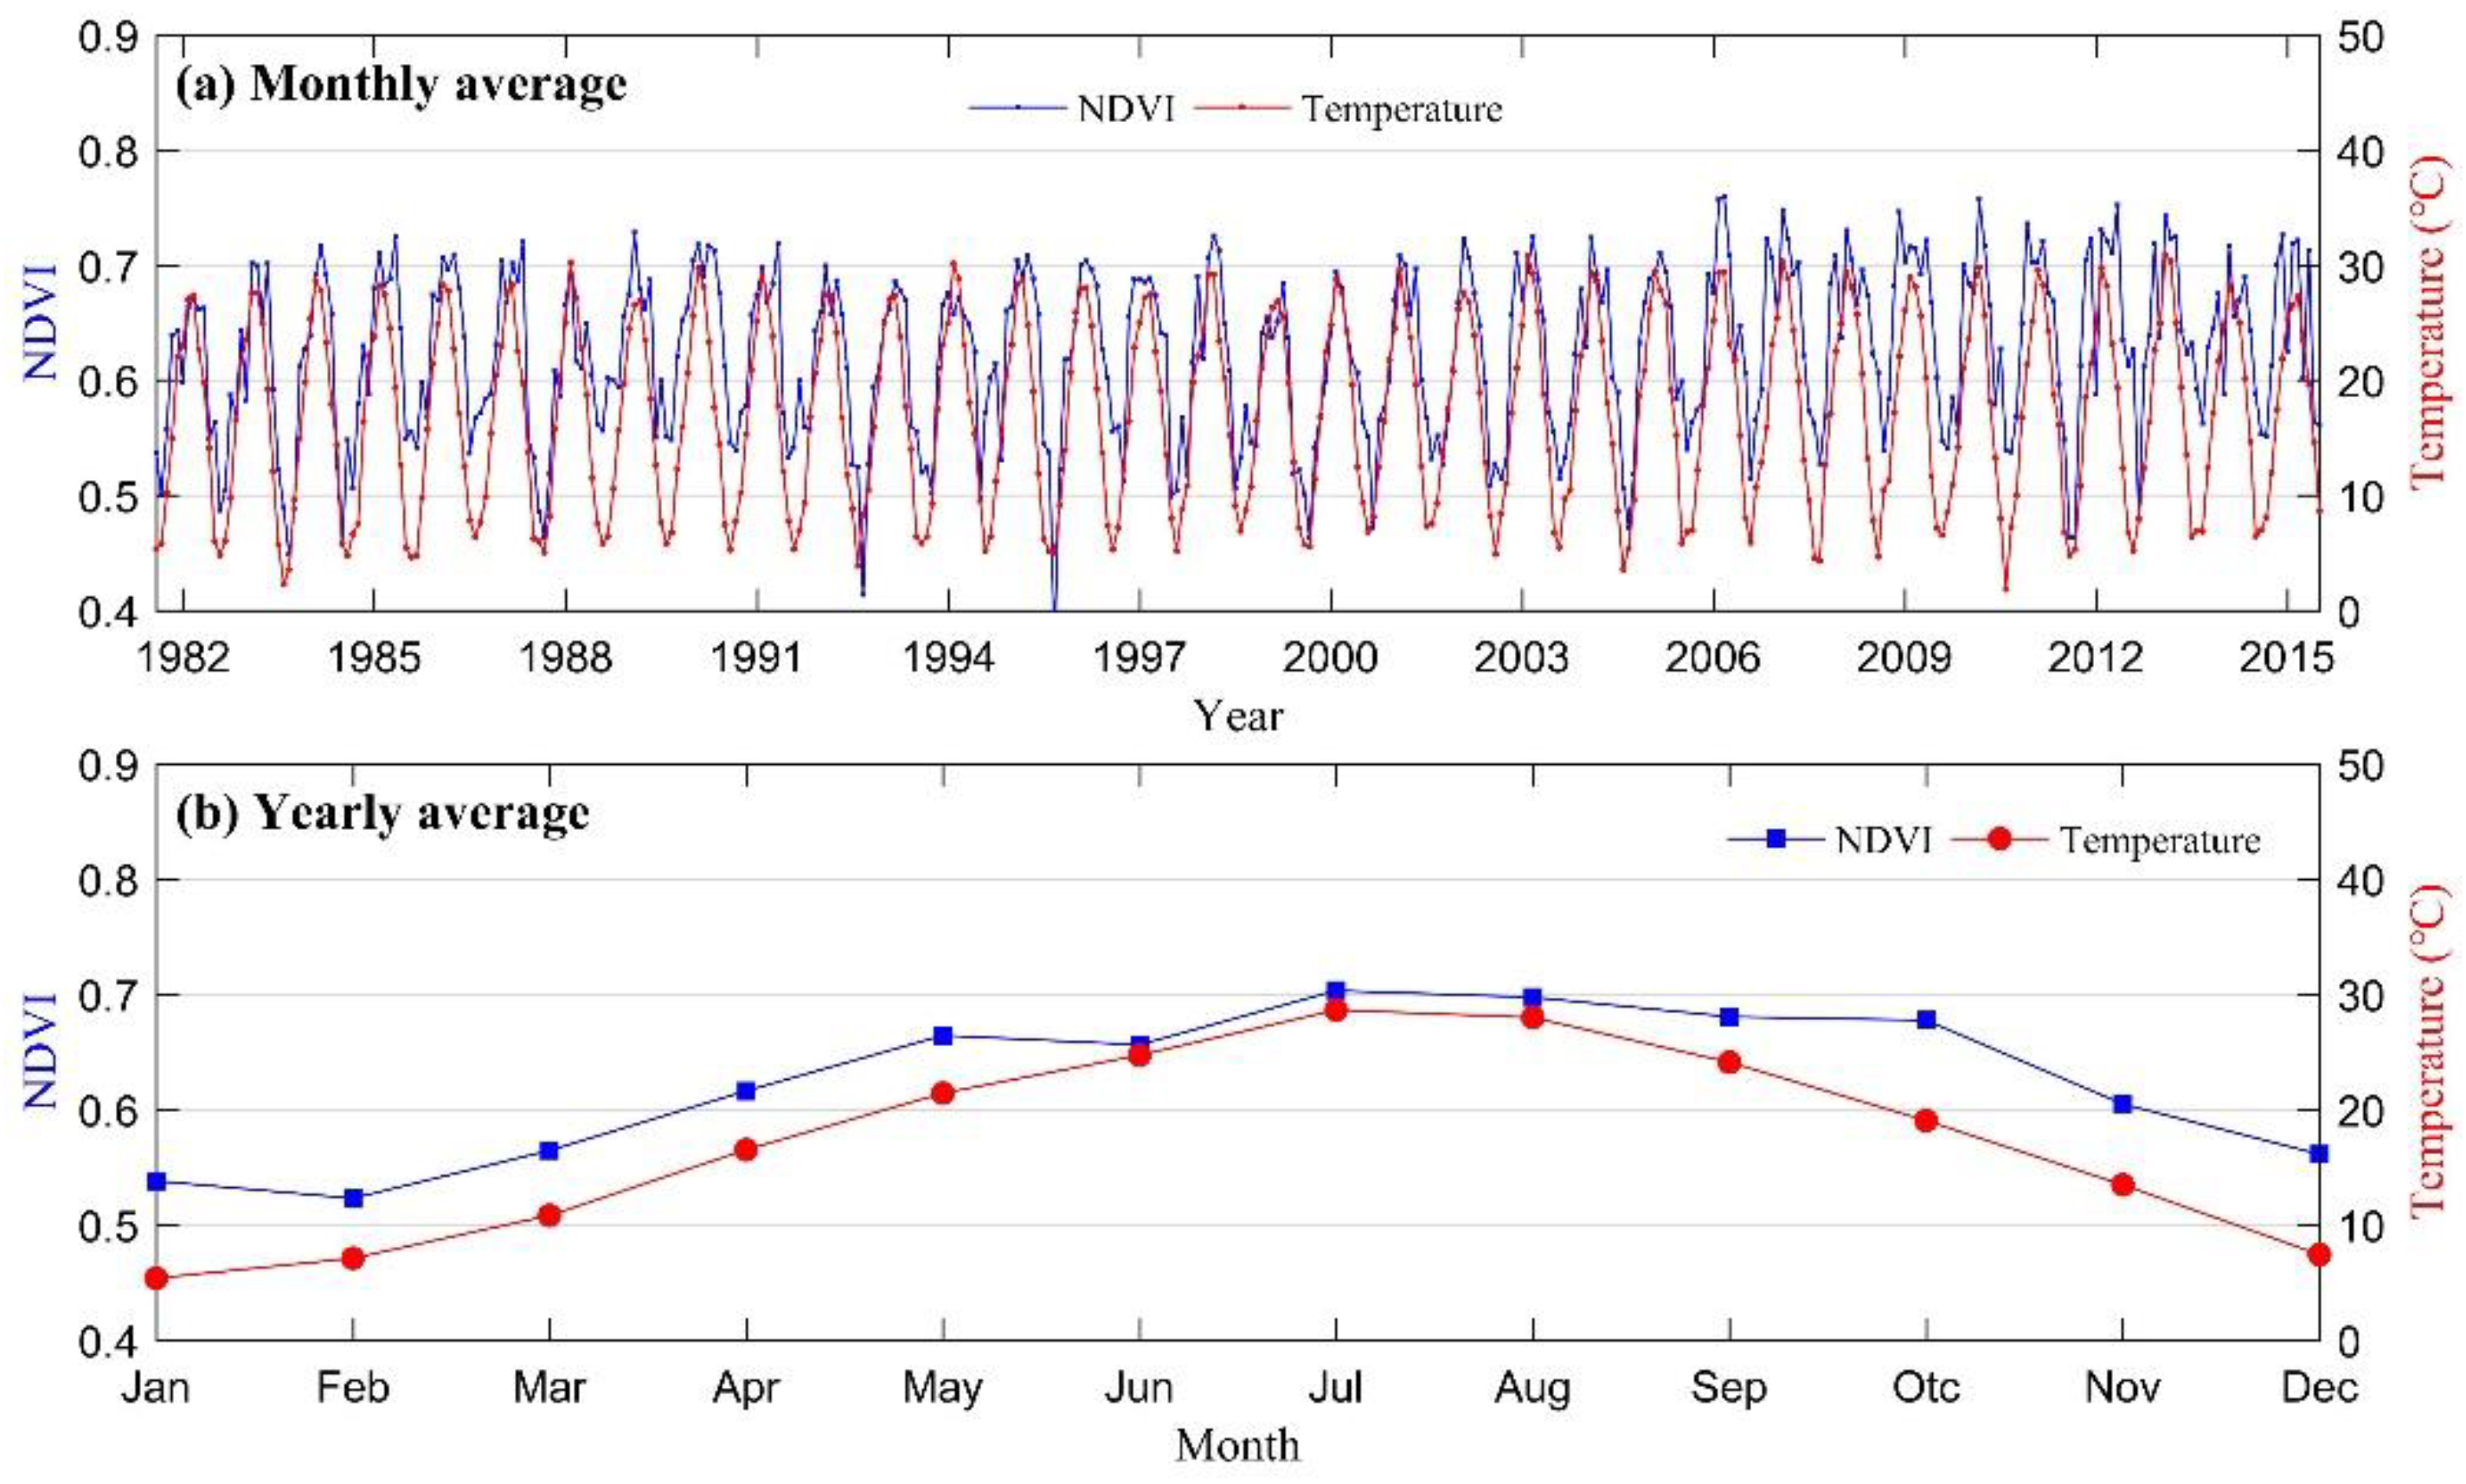
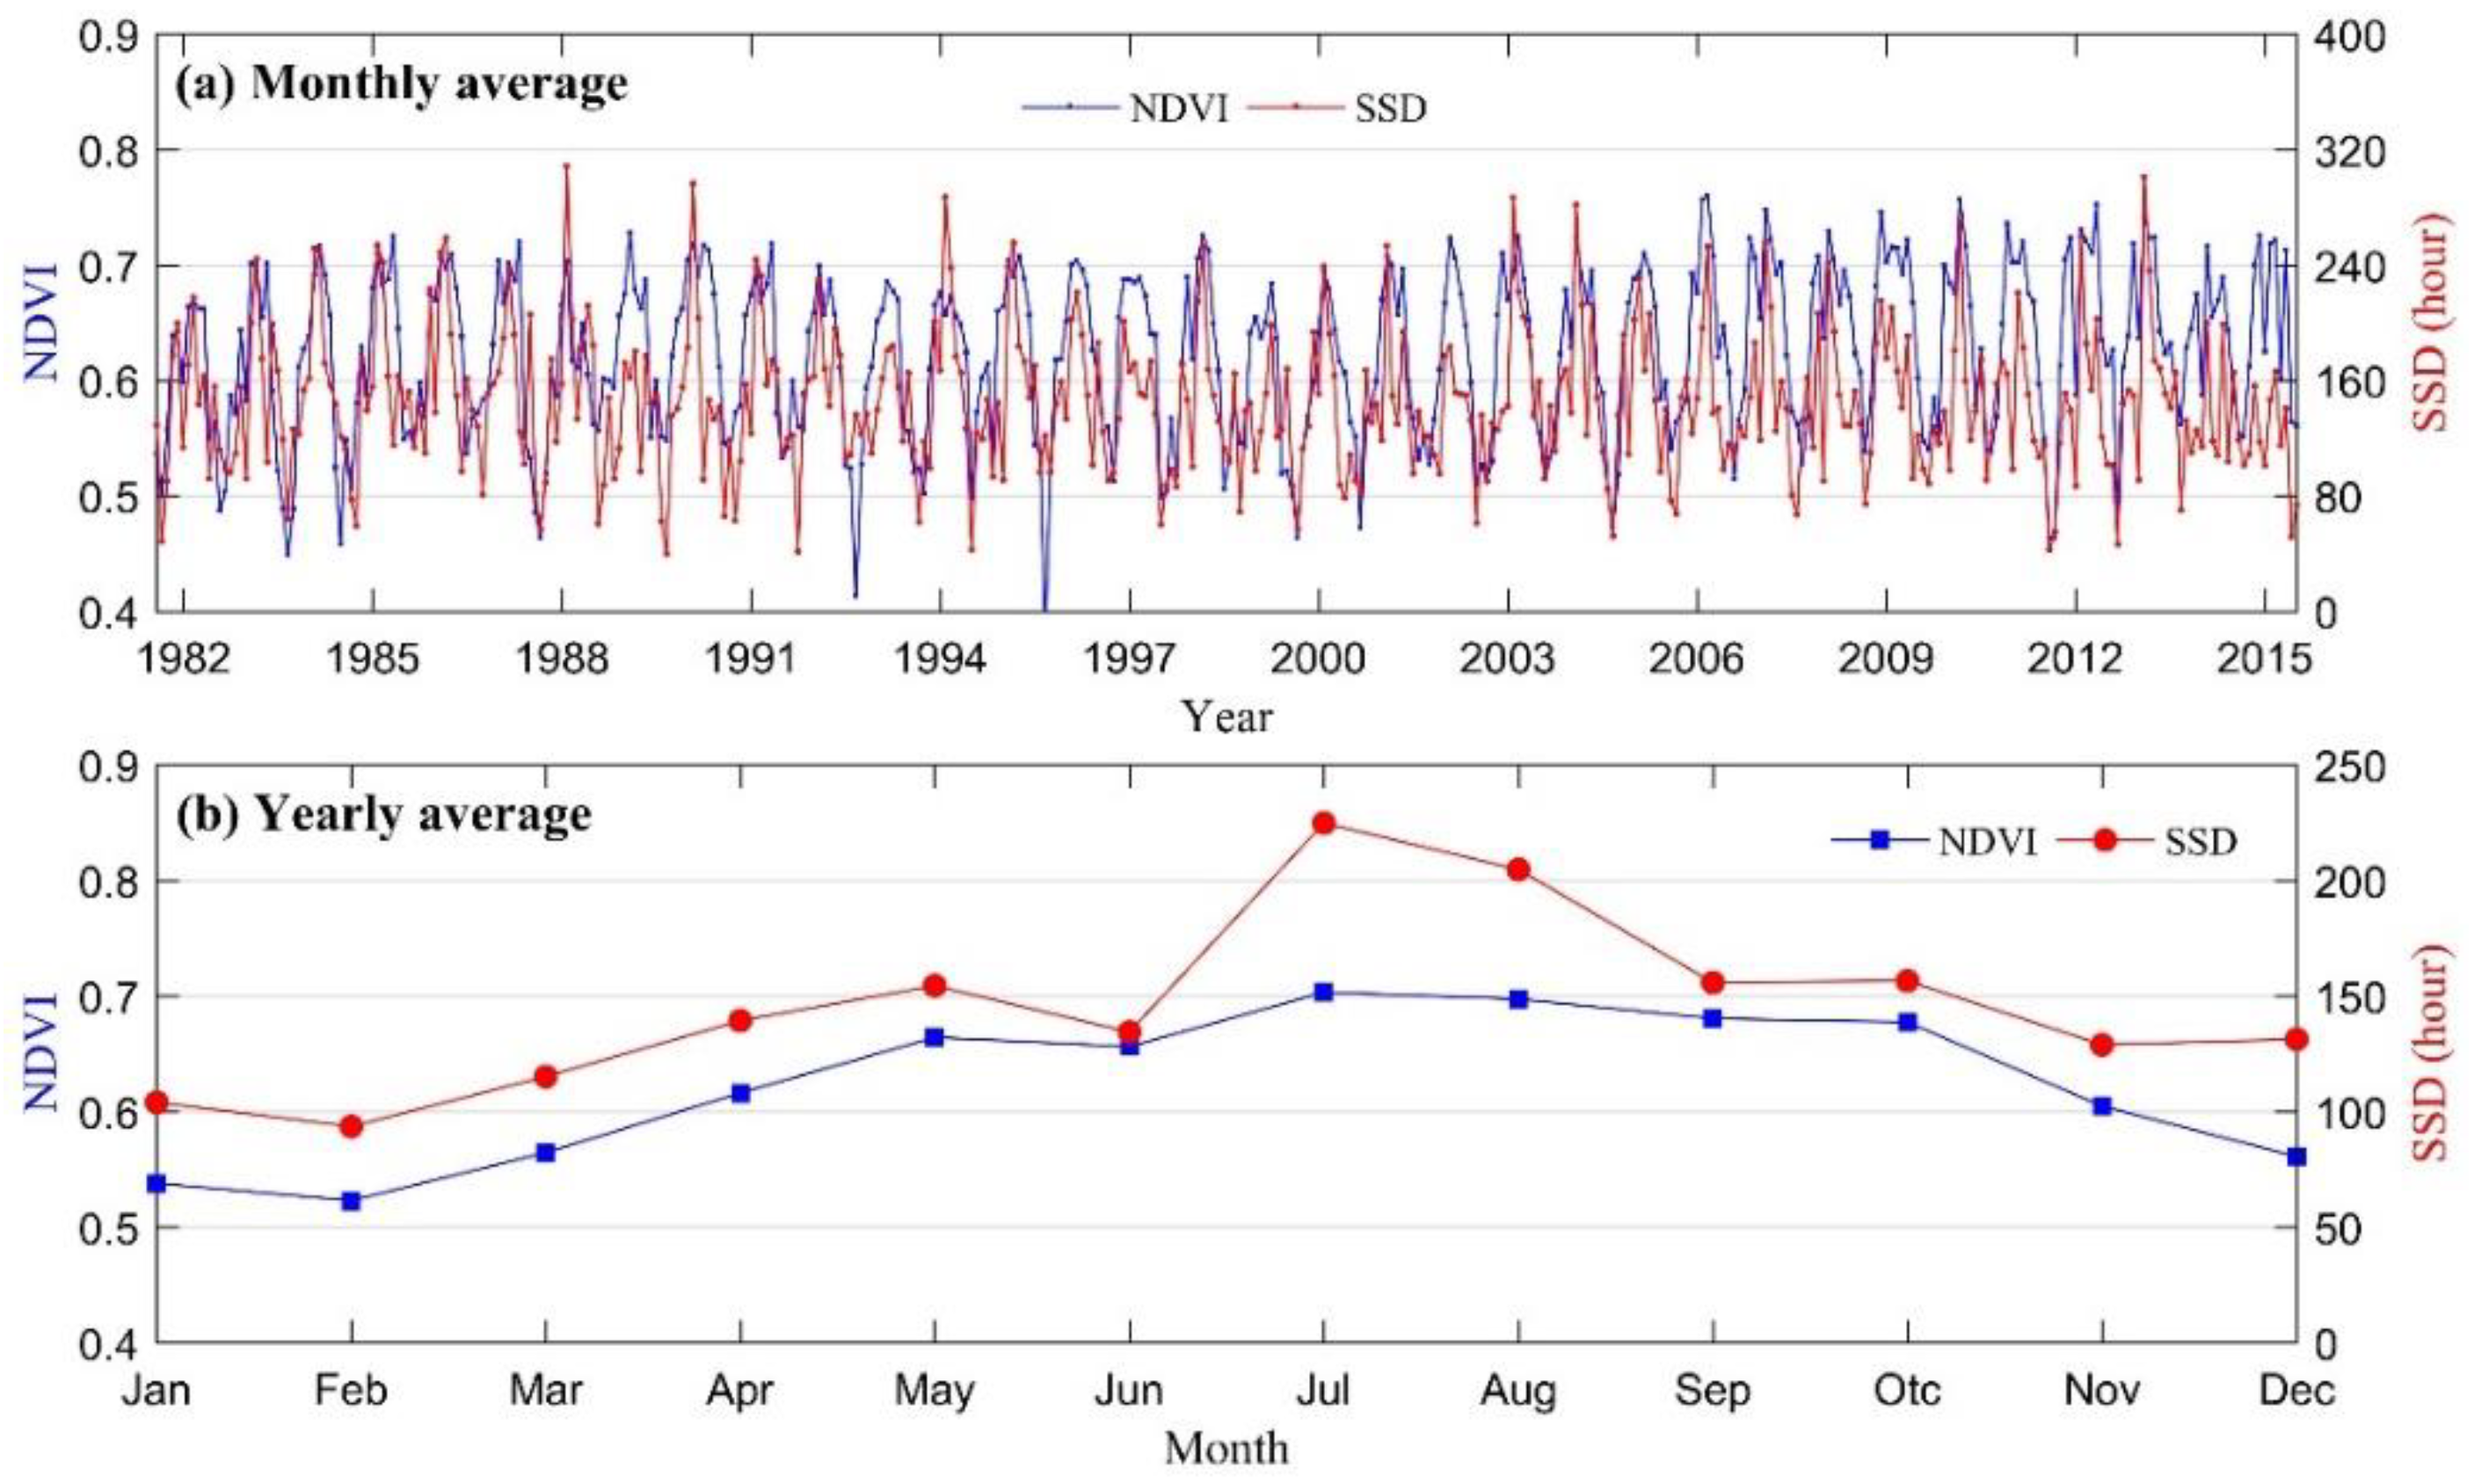
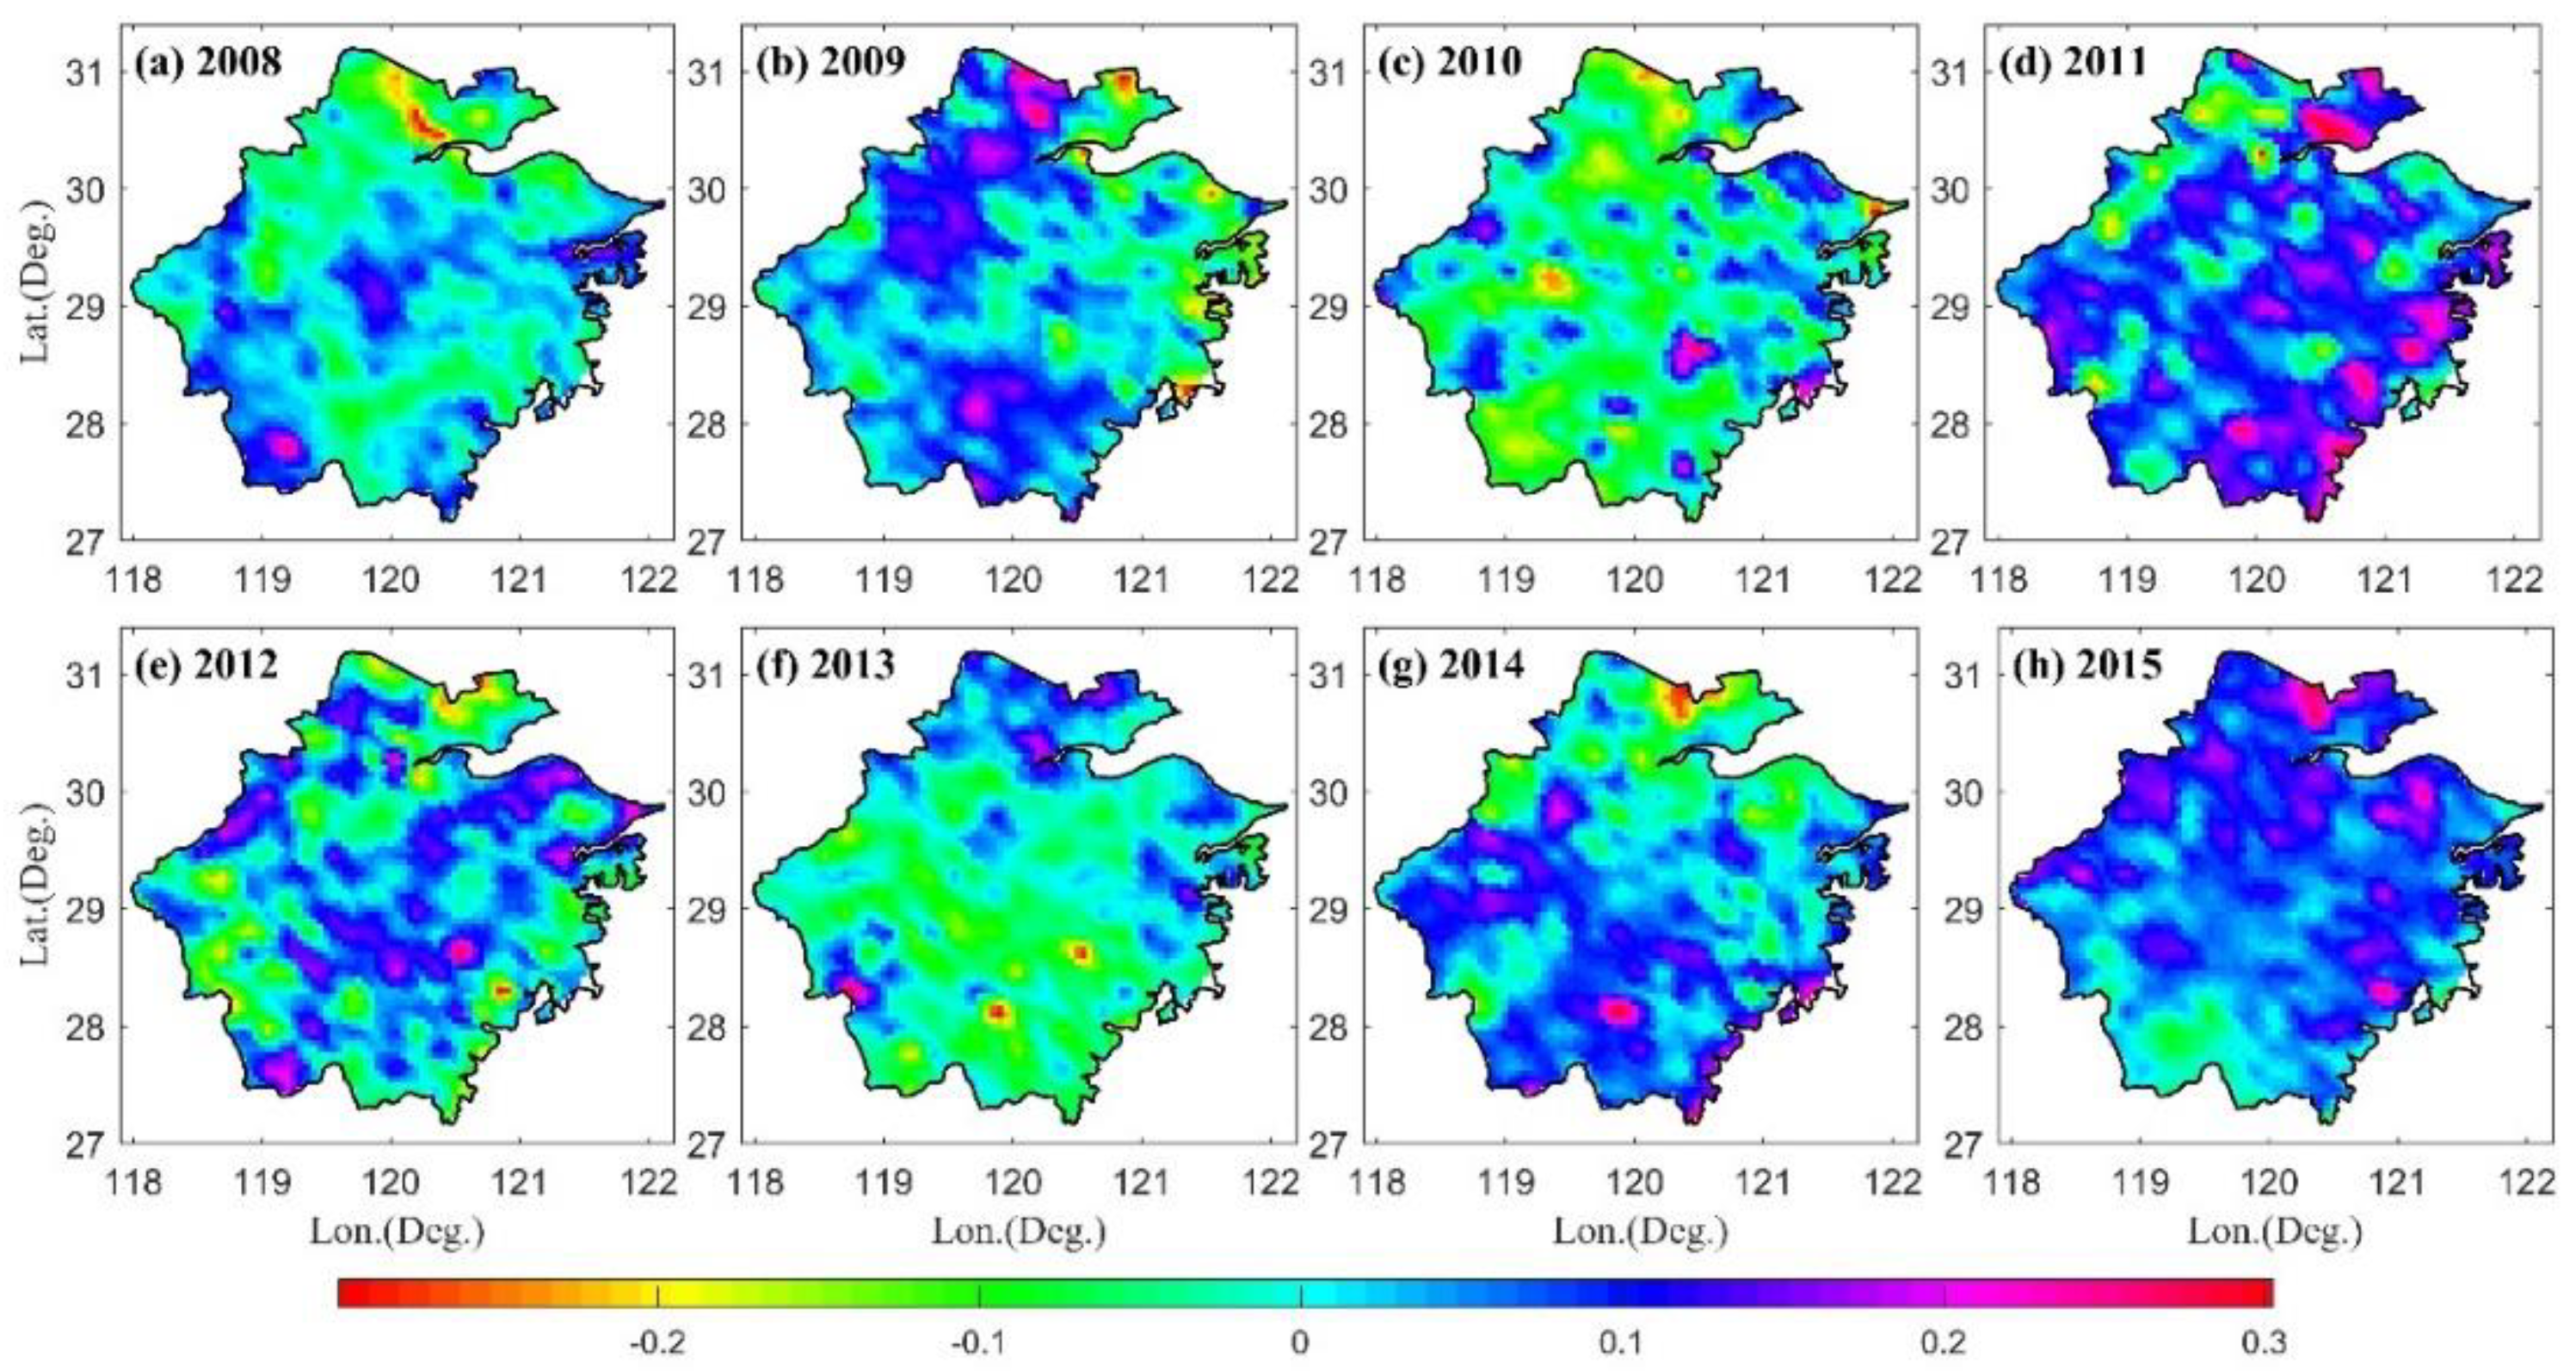
3.4. Influence of Extreme Climate on Vegetation Growth

Generally, vegetation growth is primarily affected by some external climatic factors, such as precipitation, temperature, sunshine duration, etc. [17,18,19,38,39,40]. The occurrence of extreme climate events is often accompanied by extreme precipitation, high temperature, heat, etc., which could impose a significant impact on ecosystems at different spatiotemporal scales [20,22]. Therefore, it is necessary to investigate the influence of extreme climate event on vegetation growth to enhance our understanding of the consequences of this extreme climate event. In this section, the variation of NDVI derived from the GIMMS3g dataset is selected as an indicator to represent the vegetation responses to this extreme climate event.
Zhejiang province is mainly covered by the evergreen vegetation according to the land cover maps provided by the European Space Agency (ESA) Glob Cover Portal, which is produced using the 300 m observations from MERIS sensors on board the ENVISAT satellite mission [41]. The average value of NDVI over 35 years (1981–2015) is about 0.7 in Zhejiang province. The NDVI data are selected for the vegetation growing season, which is regarded as those months with the values of NDVI and temperature are larger than 0.2 and 0 °C, respectively [42]. Figure 8 shows the time series of NDVI in August derived from the GIMMS3g dataset for the past 35 years (1981–2015). It is observed, from Figure 8, that the NDVI value in August 2014 is below the long-term NDVI average and the third least value in the past 35 years.
The extreme climate event occurred in August 2014 in Zhejiang, which resulted in abnormal changes in precipitation, temperature, sunshine duration, and PWV. Therefore, the relationship between four climatic factors and vegetation growth are investigated in this section. The time series of monthly averaged and yearly-averaged NDVI in the past 34 years (1982–2015) are compared with the corresponding temperature (Figure 9), precipitation (Figure 10), PWV (Figure 11), and sunshine duration (Figure 12), respectively. Pearson correlation coefficients (PCC) [43] between NDVI and climatic factors are also calculated and are listed in Table 2. It can be seen from Figure 9 that time series of temperature has a strong synchrony with that of NDVI. This indicates the primary contribution of temperature to the vegetation growth, which is consistent with the work published by [19,42,43,44]. It also can be concluded from Figure 10 and Figure 11 that the PWV and sunshine duration are the second and third factors that influenced the variation of vegetation growth, respectively. However, no evident relationship was observed between NDVI and precipitation in Zhejiang province. It should be noted that the NDVI has a stronger correlation with PWV than precipitation and SSD, which was not investigated in previous studies.
Some studies have also concluded that there is a correlation between PWV and NDVI [45,46,47]. Some studies have also found that there is a correlation between precipitation and NDVI [48,49,50,51,52], which indirectly proves the correlation between PWV and NDVI. However, the specific change trend of the correlation between PWV and NDVI is different due to different locations and different events. In this experiment, the partial correlation coefficients between NDVI and the four parameters of precipitation, temperature, SSD and PWV in the past 34 years (1982–2015) were also analyzed. When analyzing the correlation coefficient between NDVI and a certain parameter, the other three parameters will be excluded. Also, the relationship between the probability P-value of the test statistic and the given significance level α is given, where α = 0.01. It can be seen from the partial correlation coefficients in Table 3 that there is a certain correlation between temperature and PWV and NDVI. The partial correlation coefficient between NDVI and temperature is 0.54, and the partial correlation coefficient between temperature and PWV is −0.30. There is no correlation between NDVI and Precipitation and SSD. The correlation between temperature and NDVI is greater than PWV, and there is a negative correlation between PWV and NDVI. The reason for the negative correlation between PWV and NDVI is that in this extreme meteorological event, a large PWV anomaly will cause excessive precipitation, and excessive precipitation may lead to the appearance of low temperature weather. There is also the possibility of excessive precipitation leading to floods and thus affecting the growth of vegetation.
The distribution of NDVI variation compared to the last year in August for the period of 2008 to 2015 is presented in Figure 13, from which it can be observed that the NDVI values in 2014 decreased in the northern part while increased in the southern part of Zhejiang province. To investigate the spatial variation in NDVI caused by this extreme climate phenomenon, the anomalous values of monthly accumulated precipitation, monthly temperature, monthly total sunshine duration, and monthly PWV are calculated based on the average values over 8 years (2008–2015) (Figure 14). It is observed that the anomalous values of precipitation and PWV are positive while the anomalous values of temperature and sunshine duration are negative in August 2014. The negative anomaly of temperature in the north of Zhejiang province is relatively large with an average value of about −2 °C while the vegetation is apparently decreased in this part, which indicates the temperature is a primary factor affecting vegetation growth in the northern part of Zhejiang province. Conversely, most NDVI values are increased in the southern part of Zhejiang where the positive PWV anomaly is evident in those areas while the negative temperature anomaly is weakened, which indicates that the PWV is the main factor influencing vegetation growth in the southern part of Zhejiang province in August 2014. However, the average NDVI values decreased (Figure 8), which corresponds to the result obtained above that temperature is the primary factor influencing the vegetation growth in Zhejiang province.
In addition, it also can be observed that the impacts of precipitation and sunshine duration on vegetation growth are also spatially unequal. Actually, vegetation growth is a result of the comprehensive influence of multiple climatic factors as well as human activities, especially for those areas with dense populations in the southeast of China (due to the influence of anthropogenic activities on vegetation growth being out of the scope of this research, it is not mentioned here).

4. Discussion

This paper reveals the impact of extreme climate events on the temporal and spatial changes of PWV and vegetation growth and compares them with climatology. This is a new research perspective. It is also researched extreme weather phenomena occurred in Zhejiang province in August 2014. Through the analysis of the environmental data of precipitation, temperature, sunshine hours, and PWV in August in Zhejiang province in 50 years, it is found that these data show abnormal fluctuations. It can be seen from Figure 5 that the PWV increased abnormally in August 2014, while the temperature was low. From Figure 8, it is shown that NDVI is also very small. Through correlation coefficient analysis and partial correlation coefficient analysis, the temperature is positively correlated with NDVI and negatively correlated with PWV. This conclusion is consistent with the changes in the above data. However, through partial correlation analysis, there is no correlation between SSD and NDVI. This conclusion is different from previous studies, and it also shows that the changing factors affecting NDVI are diverse and complex. In addition, the experimental results in this paper show that there is a negative correlation between PWV and NDVI. This conclusion is different from the results in [48]. We believe that proper moisture is beneficial to vegetation growth, but too much PWV may cause flooding, thereby affecting vegetation growth.

5. Conclusions

The purpose of this research is to investigate the influence of extreme climate event on the spatial-temporal variation of PWV as well as vegetation growth and compare them to climatology. An extreme climate phenomenon occurred in August 2014 is selected as a case to perform this study. During this extreme climate, precipitation, temperature, sunshine duration, and PWV all show abnormal changes. Monthly-averaged PWV and temperature comparisons using 30 years of radiosonde data reveal that PWV exceeds 95th percentiles of climatologic value while temperatures were less than the 5th percentiles of their corresponding climatologic values. The above result indicates how abnormal the atmospheric water vapor was during this extreme climate. Extreme precipitation from 16 to 20 August was analyzed with GPS-derived PWV time series data. Before precipitation, PWV rose to between 1 and 2 standard deviations as calculated using the long-term median, which is consistent with previous studies of the relationship between rainfall and PWV. Atmospheric water vapor supplementation during heavy precipitation was first brought by the anticyclone formed at the eastern ocean of Taiwan (25°N,130°E) on 16 August. By 19 August, this anticyclone had disappeared, and the atmospheric moisture was transported from the east ocean off China brought by another anticyclone in the Pacific Ocean.
The condition of vegetation growth during this extreme climate event is investigated and the NDVI is selected as an indicator to reflect vegetation variations during the growing season. The comparison of 35-year monthly NDVI time series data reveals that the value during this event is far below the long-term average and was the third lowest recorded value. The correlation analysis between NDVI and precipitation, temperature, PWV, and sunshine shows that temperature is the main climatic factor affecting vegetation growth in Zhejiang province, with a correlation coefficient of 0.83 and a partial correlation coefficient of 0.54. It is also noted that PWV is an important factor affecting the change of NDVI, with a correlation coefficient of 0.72 and a partial correlation coefficient of -0.3, which has not been investigated before. The influence of spatial inequality of climatic factors on vegetation growth has been analyzed. The result indicates that the vegetation change is mainly controlled by a negative temperature anomaly in the north of Zhejiang province while being mainly influenced by the positive PWV anomaly in the south of Zhejiang province during this extreme climate event.

Author Contributions

Conceptualization, S.X. and F.G.; methodology, S.X.; software, S.X. and Q.Z.; validation, L.H. (Lin He), L.H. (Liangke Huang) and T.Z.; writing—original draft preparation, S.X.; writing—review and editing, T.Z.; visualization, F.G.; All authors have read and agreed to the published version of the manuscript.

Funding

The research was funded by National Natural Science Foundation of China (42074029, 41825009 and 42064002) and the State Key Program of National Natural Science Foundation of China (Grant No. 41730109).

Institutional Review Board Statement

Not applicable.

Informed Consent Statement

Not applicable.

Data Availability Statement

The GPS observations and relevant meteorological data are from the Zhejiang Continuously Operating Reference Stations (CORS) network (http://metadata.zrzyt.zj.gov.cn/). NDVI is selected from the Global Inventory Monitoring and Modelling System third generation (GIMMS3g) dataset (https://ecocast.arc.nasa.gov/data/pub/gimms/). Hourly precipitation data of corresponding rain gauges are also collected from the Zhejiang Water and Rain Information Display System (ZWRIDS) for the month of August. daily temperature, precipitation, and sunshine duration data are also obtained from the China Surface Climate Dataset (Version 3.0) from the China Meteorological Administration (CMA). The ECMWF data is available at https://cds.climate.copernicus.eu/cdsapp#!/dataset/reanalysis-era5-pressure-levels?tab=overview, all accessed on 31 July 2021.

Acknowledgments

We thank C.J. Tucker and J. Pinzon of NASA GSFC for making available the GIMMS NDVI3g dataset. China Meteorological Administration (CMA), ECMWF and IGRA are also thanked for providing the corresponding meteorological, PWV and radiosonde data. Zhejiang Administration of Surveying Mapping and Geo-information is acknowledged for providing GPS and corresponding meteorological data. The Water Conservancy Bureau of Zhejiang province is also acknowledged for providing the hourly precipitation information. All data are available from the first author upon request.

Conflicts of Interest

The authors declare no conflict of interest.

References

  1. Niu, S.; Luo, Y.; Li, D.; Cao, S.; Xia, J.; Li, J.; Smith, M.D. Plant growth and mortality under climatic extremes: An overview. Environ. Exp. Bot. 2014, 98, 13–19. [Google Scholar] [CrossRef]
  2. Matisons, R.; Jansone, D.; Elferts, D.; Adamovičs, A.; Schneck, V.; Jansons, Ā. Plasticity of response of tree-ring width of Scots pine provenances to weather extremes in Latvia. Dendrochronologia 2019, 54, 1–10. [Google Scholar] [CrossRef]
  3. Thomas, A.; Andrea, M.; Graziano, R.; Simone, O. Effects of summer heat waves on Europe’s wild flora and vegetation. Eff. Summer Heat Waves Eur. Wild Flora Veg. 2014, 58, 128–132. [Google Scholar]
  4. Myhre, G.; Shindell, D.T.; Bréon, F.M.; Collins, W.; Fuglestvedt, J.; Huang, J.; Koch, D.; Lamarque, J.F.; Lee, D.; Mendoza, B.; et al. Anthropogenic and natural radiative forcing. Clim. Chang. 2013, 423, 659–740. [Google Scholar]
  5. Starr, D.; Melfi, S.H. The Role of Water Vapor in Climate. A Strategic Research Plan for the Proposed GEWEX Water Vapor Project (GVaP). NASA Conf. Publ. 1991, 3120. Available online: https://ntrs.nasa.gov/api/citations/19910016242/downloads/19910016242.pdf (accessed on 31 July 2021).
  6. Bevis, M.; Businger, S.; Herring, T.; Rocken, C.; Anthes, R.A.; Ware, R.H. GPS meteorology: Remote sensing of atmospheric water vapor using the Global Positioning System. J. Geophys. Res. 1992, 97, 15787–15801. [Google Scholar] [CrossRef]
  7. Bevis, M.; Businger, S.; Chiswell, S.; Herring, T.A.; Anthes, R.A.; Rocken, C.; Ware, R.H. GPS meteorology: Mapping zenith wet delays onto precipitable water. J. Appl. Meteorol. 1994, 33, 379–386. [Google Scholar] [CrossRef]
  8. Rocken, C.; Ware, R.; Van Hove, T.; Solheim, F.; Alber, C.; Johnson, J.; Bevis, M.; Businger, S. Sensing atmospheric water vapor with the Global Positioning System. Geophys. Res. Lett. 1993, 20, 2631–2634. [Google Scholar] [CrossRef] [Green Version]
  9. Li, P.; Jiang, X.; Zhang, X.; Ge, M.; Schuh, H. GPS + Galileo + BeiDou precise point positioning with triple-frequency ambiguity resolution. GPS Solut. 2020, 24, 78. [Google Scholar] [CrossRef]
  10. Akilan, A.; Azeez, K.A.; Balaji, S.; Schuh, H.; Srinivas, Y. GPS derived Zenith Total Delay (ZTD) observed at tropical locations in South India during atmospheric storms and depressions. J. Atmos. Sol.-Terr. Phys. 2015, 125, 1–7. [Google Scholar] [CrossRef] [Green Version]
  11. Zhao, Q.; Yao, Y.; Yao, W. GPS-based PWV for precipitation forecasting and its application to a typhoon event. J. Atmos. Sol.-Terr. Phys. 2018, 167, 124–133. [Google Scholar] [CrossRef]
  12. Huelsing, H.K.; Wang, J.; Mears, C.; Braun, J.J. Precipitable water characteristics during the 2013 Colorado flood using ground-based GPS measurements. Atmos. Meas. Tech. 2017, 10, 4055–4066. [Google Scholar] [CrossRef] [Green Version]
  13. Adams, D.K.; Gutman, S.I.; Holub, K.L.; Pereira, D.S. GNSS observations of deep convective time scales in the Amazon. Geophys. Res. Lett. 2013, 40, 2818–2823. [Google Scholar] [CrossRef]
  14. Sapucci, L.F.; Machado, L.A.; de Souza, E.M.; Campos, T.B. GPS-PWV jumps before intense rain events. Atmos. Meas. Tech. Discuss 2016, 1–27. [Google Scholar] [CrossRef] [Green Version]
  15. Yao, Y.; Shan, L.; Zhao, Q. Establishing a method of short-term rainfall forecasting based on GNSS-derived PWV and its application. Sci. Rep. 2017, 7, 12465. [Google Scholar] [CrossRef]
  16. Kunkel, K.E.; Karl, T.R.; Brooks, H.; Kossin, J.; Lawirmore, J.H.; Arndt, D.; Bosart, L.; Changnon, D.; Cutter, S.L.; Doesken, N.; et al. Monitoring and understanding trends in extreme storms: State of knowledge. Bull. Am. Meteorol. Soc. 2013, 94, 499–514. [Google Scholar] [CrossRef]
  17. Bonan, G.B. Forests and climate change: Forcings, feedbacks, and the climate benefits of forests. Science 2008, 320, 1444–1449. [Google Scholar] [CrossRef] [Green Version]
  18. Craine, J.M.; Nippert, J.B.; Elmore, A.J.; Skibbe, A.M.; Hutchinson, S.L.; Brunsell, N.A. Timing of climate variability and grassland productivity. Proc. Natl. Acad. Sci. USA 2012, 109, 3401–3405. [Google Scholar] [CrossRef] [Green Version]
  19. Wu, D.; Zhao, X.; Liang, S.; Zhou, T.; Huang, K.; Tang, B.; Zhao, W. Time-lag effects of global vegetation responses to climate change. Glob. Chang. Biol. 2015, 21, 3520–3531. [Google Scholar] [CrossRef]
  20. Easterling, D.R.; Meehl, G.A.; Parmesan, C.; Changnon, S.A.; Karl, T.R.; Mearns, L.O. Climate extremes: Observations, modeling, and impacts. Science 2000, 289, 2068–2074. [Google Scholar] [CrossRef] [Green Version]
  21. Kumar, P. Hydrology: Seasonal rain changes. Nat. Clim. Chang. 2013, 3, 783. [Google Scholar] [CrossRef]
  22. Zhang, Y.; Liang, S. Changes in forest biomass and linkage to climate and forest disturbances over Northeastern China. Glob. Chang. Biol. 2014, 20, 2596–2606. [Google Scholar] [CrossRef]
  23. Whitlock, C.; Bartlein, P.J. Vegetation and climate change in northwest America during the past 125 kyr. Nature 1997, 388, 57. [Google Scholar] [CrossRef]
  24. Bao, G.; Bao, Y.; Sanjjava, A.; Qin, Z.; Zhou, Y.; Xu, G. NDVI-indicated long-term vegetation dynamics in Mongolia and their response to climate change at biome scale. Int. J. Climatol. 2015, 35, 4293–4306. [Google Scholar] [CrossRef]
  25. Wang, J.; Zhang, L.; Dai, A.; Van Hove, T.; Van Baelen, J. A near-global, 2-hourly data set of atmospheric precipitable water from ground-based GPS measurements. J. Geophys. Res. Atmos. 2007, 112. [Google Scholar] [CrossRef] [Green Version]
  26. Zhao, Q.; Yao, Y.; Yao, W.Q.; Li, Z. Near-global GPS-derived PWV and its analysis in the El Niño event of 2014–2016. J. Atmos. Sol.-Terr. Phys. 2018, 179, 69–80. [Google Scholar] [CrossRef]
  27. Høgda, K.A.; Tømmervik, H.; Karlsen, S.R. Trends in the start of the growing season in Fennoscandia 1982–2011. Remote Sens. 2013, 5, 4304–4318. [Google Scholar] [CrossRef] [Green Version]
  28. Tucker, C.J.; Pinzon, J.E.; Brown, M.E.; Slayback, D.A.; Pak, E.W.; Mahoney, R.; Vermote, E.F.; El Saleous, N. An extended AVHRR 8-km NDVI dataset compatible with MODIS and SPOT vegetation NDVI data. Int. J. Remote Sens. 2005, 26, 4485–4498. [Google Scholar] [CrossRef]
  29. Holben, B.N. Characteristics of maximum-value composite images from temporal AVHRR data. Int. J. Remote Sens. 1986, 7, 1417–1434. [Google Scholar] [CrossRef]
  30. Xu, L.; Myneni, R.B.; Chapin, F.S., III; Callaghan, T.V.; Pinzon, J.E.; Tucker, C.J.; Zhu, Z.; Bi, J.; Ciais, P.; Tømmervik, H.; et al. Temperature and vegetation seasonality diminishment over northern lands. Nat. Clim. Chang. 2013, 3, 581. [Google Scholar] [CrossRef] [Green Version]
  31. Karl, T.R.; Trenberth, K.E. Modern global climate change. Science 2003, 302, 1719–1723. [Google Scholar] [CrossRef] [Green Version]
  32. Trenberth, K.E.; Fasullo, J.; Smith, L. Trends and variability in column-integrated atmospheric water vapor. Clim. Dyn. 2005, 24, 741–758. [Google Scholar] [CrossRef]
  33. Foster, J.; Bevis, M.; Raymond, W. Precipitable water and the lognormal distribution. J. Geophys. Res. Atmos. 2006, 111. [Google Scholar] [CrossRef] [Green Version]
  34. Kunkel, K.E.; Stevens, S.E.; Stevens, L.E.; Karl, T.R. Observed climatological relationships of extreme daily precipitation events with precipitable water and vertical velocity in the contiguous United States. Geophys. Res. Lett. 2020, 47, e2019GL086721. [Google Scholar] [CrossRef]
  35. Brenot, H.; Ducrocq, V.; Walpersdorf, A.; Champollion, C.; Caumont, O. GPS zenith delay sensitivity evaluated from high-resolution numerical weather prediction simulations of the 8–9 September 2002 flash flood over southeastern France. J. Geophys. Res. Atmos. 2006, 111. [Google Scholar] [CrossRef] [Green Version]
  36. Nuissier, O.; Ducrocq, V.; Ricard, D.; Lebeaupin, C.; Anquetin, S. A numerical study of three catastrophic precipitating events over southern France. I: Numerical framework and synoptic ingredients. Q. J. Roy. Meteor. Soc. 2010, 134, 111–130. [Google Scholar] [CrossRef]
  37. Van Baelen, J.; Reverdy, M.; Tridon, F.; Labbouz, L.; Dick, G.; Bender, M.; Hagen, M. On the relationship between water vapor field evolution and the life cycle of precipitation systems. Q. J. R. Meteorol. Soc. 2011, 137 (Suppl. S1), 204–223. [Google Scholar] [CrossRef] [Green Version]
  38. Gimeno, L.; Stohl, A.; Trigo, R.M.; Dominguez, F.; Yoshimura, K.; Yu, L.; Drumond, A.; Maria Duran-Quesada, A.; Nieto, R. Oceanic and terrestrial sources of continental precipitation. Rev. Geophys. 2012, 50. [Google Scholar] [CrossRef]
  39. Wang, X.; Piao, S.; Ciais, P.; Li, J.; Friedlingstein, P.; Koven, C.; Chen, A. Spring temperature change and its implication in the change of vegetation growth in North America from 1982 to 2006. Proc. Natl. Acad. Sci. USA 2011, 108, 1240–1245. [Google Scholar] [CrossRef] [PubMed] [Green Version]
  40. Wang, H.; Liu, D.; Lin, H.; Montenegro, A.; Zhu, X. NDVI and vegetation phenology dynamics under the influence of sunshine duration on the Tibetan plateau. Int. J. Climatol. 2015, 35, 687–698. [Google Scholar] [CrossRef]
  41. Bontemps, S.; Defourney, P.; Van Bogaert, E.; Arino, O. GLOBCOVER2009 Products Description and Validation Report. 2010. Available online: https://globcover.s3.amazonaws.com/LandCover2009/GLOBCOVER2009_Validation_Report_1.0.pdf (accessed on 20 May 2012).
  42. Piao, S.; Fang, J.; Zhou, L.; Ciais, P.; Zhu, B. Variations in satellite-derived phenology in China’s temperate vegetation. Glob. Chang. Biol. 2006, 12, 672–685. [Google Scholar] [CrossRef]
  43. Lee Rodgers, J.; Nicewander, W.A. Thirteen ways to look at the correlation coefficient. Am. Stat. 1988, 42, 59–66. [Google Scholar] [CrossRef]
  44. Peng, S.; Piao, S.; Ciais, P.; Myneni, R.B.; Chen, A.; Chevallier, F.; Dolman, A.J.; Janssens, I.A.; Peñuelas, J.; Zhang, G.; et al. Asymmetric effects of daytime and night-time warming on Northern Hemisphere vegetation. Nature 2013, 501, 88–92. [Google Scholar] [CrossRef] [PubMed]
  45. Zhao, Q.; Ma, X.; Liang, L.; Yao, W. Spatial–Temporal Variation Characteristics of Multiple Meteorological Variables and Vegetation over the Loess Plateau Region. Appl. Sci. 2020, 10, 1000. [Google Scholar] [CrossRef] [Green Version]
  46. Mohammadkhani, M.R.; Shishegaran, A.; Shokrollahi, B. Forecasting probable maximum precipitation using innovative algorithm to estimate atmosphere precipitable water vapor. J. Math. Models Eng. (MME) 2019, 5, 90–96. [Google Scholar]
  47. Wollmann, T.; Abtahi, F.; Eghdam, A.; Seoane, F.; Lindecrantz, K.; Haag, M.; Koch, S. User-Centred Design and Usability Evaluation of a Heart Rate Variability Biofeedback Game. IEEE Access 2016, 4, 5531–5539. [Google Scholar] [CrossRef]
  48. Huang, G.; Zhu, H.; Zhang, J.; Liu, B. Analysis of the Characteristics of Climate Change in the Ecologically Vulnerable Area of the Mu Us Dune Field under the Background of Global Warming. Remote Sens. 2021, 13, 627. [Google Scholar] [CrossRef]
  49. Zhang, H.; Chang, J.; Zhang, L.; Wang, Y.; Li, Y.; Wang, X. NDVI dynamic changes and their relationship with meteorological factors and soil moisture. Environ. Earth Sci. 2018, 77, 582.1–582.11. [Google Scholar] [CrossRef]
  50. Pan, S.; Zhao, X.; Yue, Y. Spatiotemporal changes of NDVI and correlation with meteorological factors in northern china from 1985–2015. E3S Web Conf. 2019, 131, 1040. [Google Scholar] [CrossRef]
  51. Nanzad, L.; Zhang, J.; Tuvdendorj, B.; Nabil, M.; Zhang, S.; Bai, Y. NDVI anomaly for drought monitoring and its correlation with climate factors over Mongolia from 2000 to 2016. J. Arid Environ. 2019, 164, 69–77. [Google Scholar] [CrossRef]
  52. Pei, Z.; Fang, S.; Yang, W.; Wang, L.; Wu, M.; Zhang, Q.; Han, W.; Khoi, D.N. The Relationship between NDVI and Climate Factors at Different Monthly Time Scales: A Case Study of Grasslands in Inner Mongolia, China (1982–2015). Sustainability 2019, 11, 7243. [Google Scholar] [CrossRef] [Green Version]
Figure 1. (a) Location of Zhejiang province in China. (b) The geographic distributions of the primary GPS CORS, rain gauge, radiosonde and meteorological stations used in this study, all GPS stations are from the Zhejiang CORS Network.
Remotesensing 13 03576 g001
Figure 2. Image of accumulated precipitation over Zhejiang province from 16–20 August 2014, which is interpolated using the data derived from the recording of meteorological stations.
Remotesensing 13 03576 g002
Figure 3. Monthly time series of (a) accumulated precipitation, (b) temperature and (c) accumulated sunshine duration in August for the past 50 years (1957–2016).
Remotesensing 13 03576 g003
Figure 4. Monthly-averaged (a) PWV and (b) temperature, the PWV is derived from the GPS, RS and ECMWF ERA-Interim data while the temperature is derived from the RS and ECMWF ERA-Interim data. The 95th percentile for 30 years of radiosonde-derived PWV and the 5th percentile for 30 years of radiosonde-derived temperature are identified, respectively.
Remotesensing 13 03576 g004
Figure 5. Statistical frequency distribution of (a) PWV and (b) temperature for August of 2010–2017 using the data obtained from the ECMWF ERA-Interim data. The 95th percentiles for 8 years of ECMWF-derived PWV and the 5th percentiles for 8 years of ECMWF-derived temperature are identified, respectively.
Remotesensing 13 03576 g005
Figure 6. A time series of 5 min GPS PWV compared with 1-hourly precipitation at corresponding rain gauges from 17–20 August 2014. The green, magenta and black dashed lines indicate the PWV long-term median, 1 and 2 standard deviations above the PWV median, respectively. (ad) are the data of LJSL, ZJPH, ZJXC, ZJYH stations respectively.
Remotesensing 13 03576 g006
Figure 7. A comparison of ECMWF ERA-Interim 4-hourly averaged 500 hPa geopotential height (a1,b1,c1,d1,e1), 500 hPa wind field (a2,b2,c2,d2,e2), 500 hPa temperature (a3,b3,c3,d3,e3) and precipitable water vapor image (a4,b4,c4,d4,e4), respectively.
Remotesensing 13 03576 g007
Figure 8. Time series of NDVI in August derived from the GIMMS3g dataset for the 35 years from 1981 to 2015.
Remotesensing 13 03576 g008
Figure 9. NDVI time series change with temperature during the vegetation growing season, (a) is the monthly average of NDVI and temperature and (b) is the yearly-averaged NDVI and temperature from the 34-year data.
Remotesensing 13 03576 g009
Figure 10. NDVI time series change with precipitation during the vegetation growing season, (a) is the monthly average of NDVI and precipitation and (b) is the yearly-averaged NDVI and precipitation from the 34-year data.
Remotesensing 13 03576 g010
Figure 11. NDVI time series change with PWV during the vegetation growing season, (a) is the monthly average of NDVI and PWV and (b) is the yearly-averaged NDVI and PWV from the 34-year data.
Remotesensing 13 03576 g011
Figure 12. NDVI time series change with sunshine duration (SSD) during the vegetation growing season, (a) is the monthly average of NDVI and SSD and (b) is the yearly-averaged NDVI and SSD from the 34-year data.
Remotesensing 13 03576 g012
Figure 13. Distribution of NDVI variation compared to the last year in August for the period of 2008 to 2015 in Zhejiang province. (ah) represents different years of data.
Remotesensing 13 03576 g013
Figure 14. Spatial distributions of anomalous values of monthly accumulated precipitation (a), monthly temperature (b), monthly total sunshine duration (c), and monthly PWV (d) calculated based on the 8 years (2008–2015) of average values.
Remotesensing 13 03576 g014
Table 1. GPS CORS stations information in Zhejiang province.
GPS StationLongitude (°)Latitude (°)Height (m)
LJSL121.9629.4374.0
ZJCN120.6027.42182.2
ZJKH118.4129.13194.8
ZJPH121.1030.8117.5
ZJWL121.6228.30187.8
ZJXC120.8929.55170.0
ZJXJ120.7428.83168.5
ZJYH119.6728.27130.0
Table 2. Pearson Correlation Coefficients (PCC) of NDVI with Precipitation, temperature, SSD, and PWV for the past 34 years (1982–2015).
PrecipitationTemperatureSSDPWV
Monthly NDVI0.120.830.650.72
Table 3. Partial Cor-relation Coefficients of NDVI with Precipitation, temperature, SSD, and PWV for the past 34 years (1982–2015) (α = 0.01).
PrecipitationTemperatureSSDPWV
Monthly NDVIPartial Correlation Coefficients’−0.010.540.05−0.30
p-value0.84 > α1.32 × 10⁻³¹ < α0.31 > α9.32 × 10⁻⁹ < α
Publisher’s Note: MDPI stays neutral with regard to jurisdictional claims in published maps and institutional affiliations.

