
Retrieval of Water Vapour Profiles from GLORIA Nadir Observations

 , , , , , , and
Abstract
:
1. Introduction
2. Materials and Methods
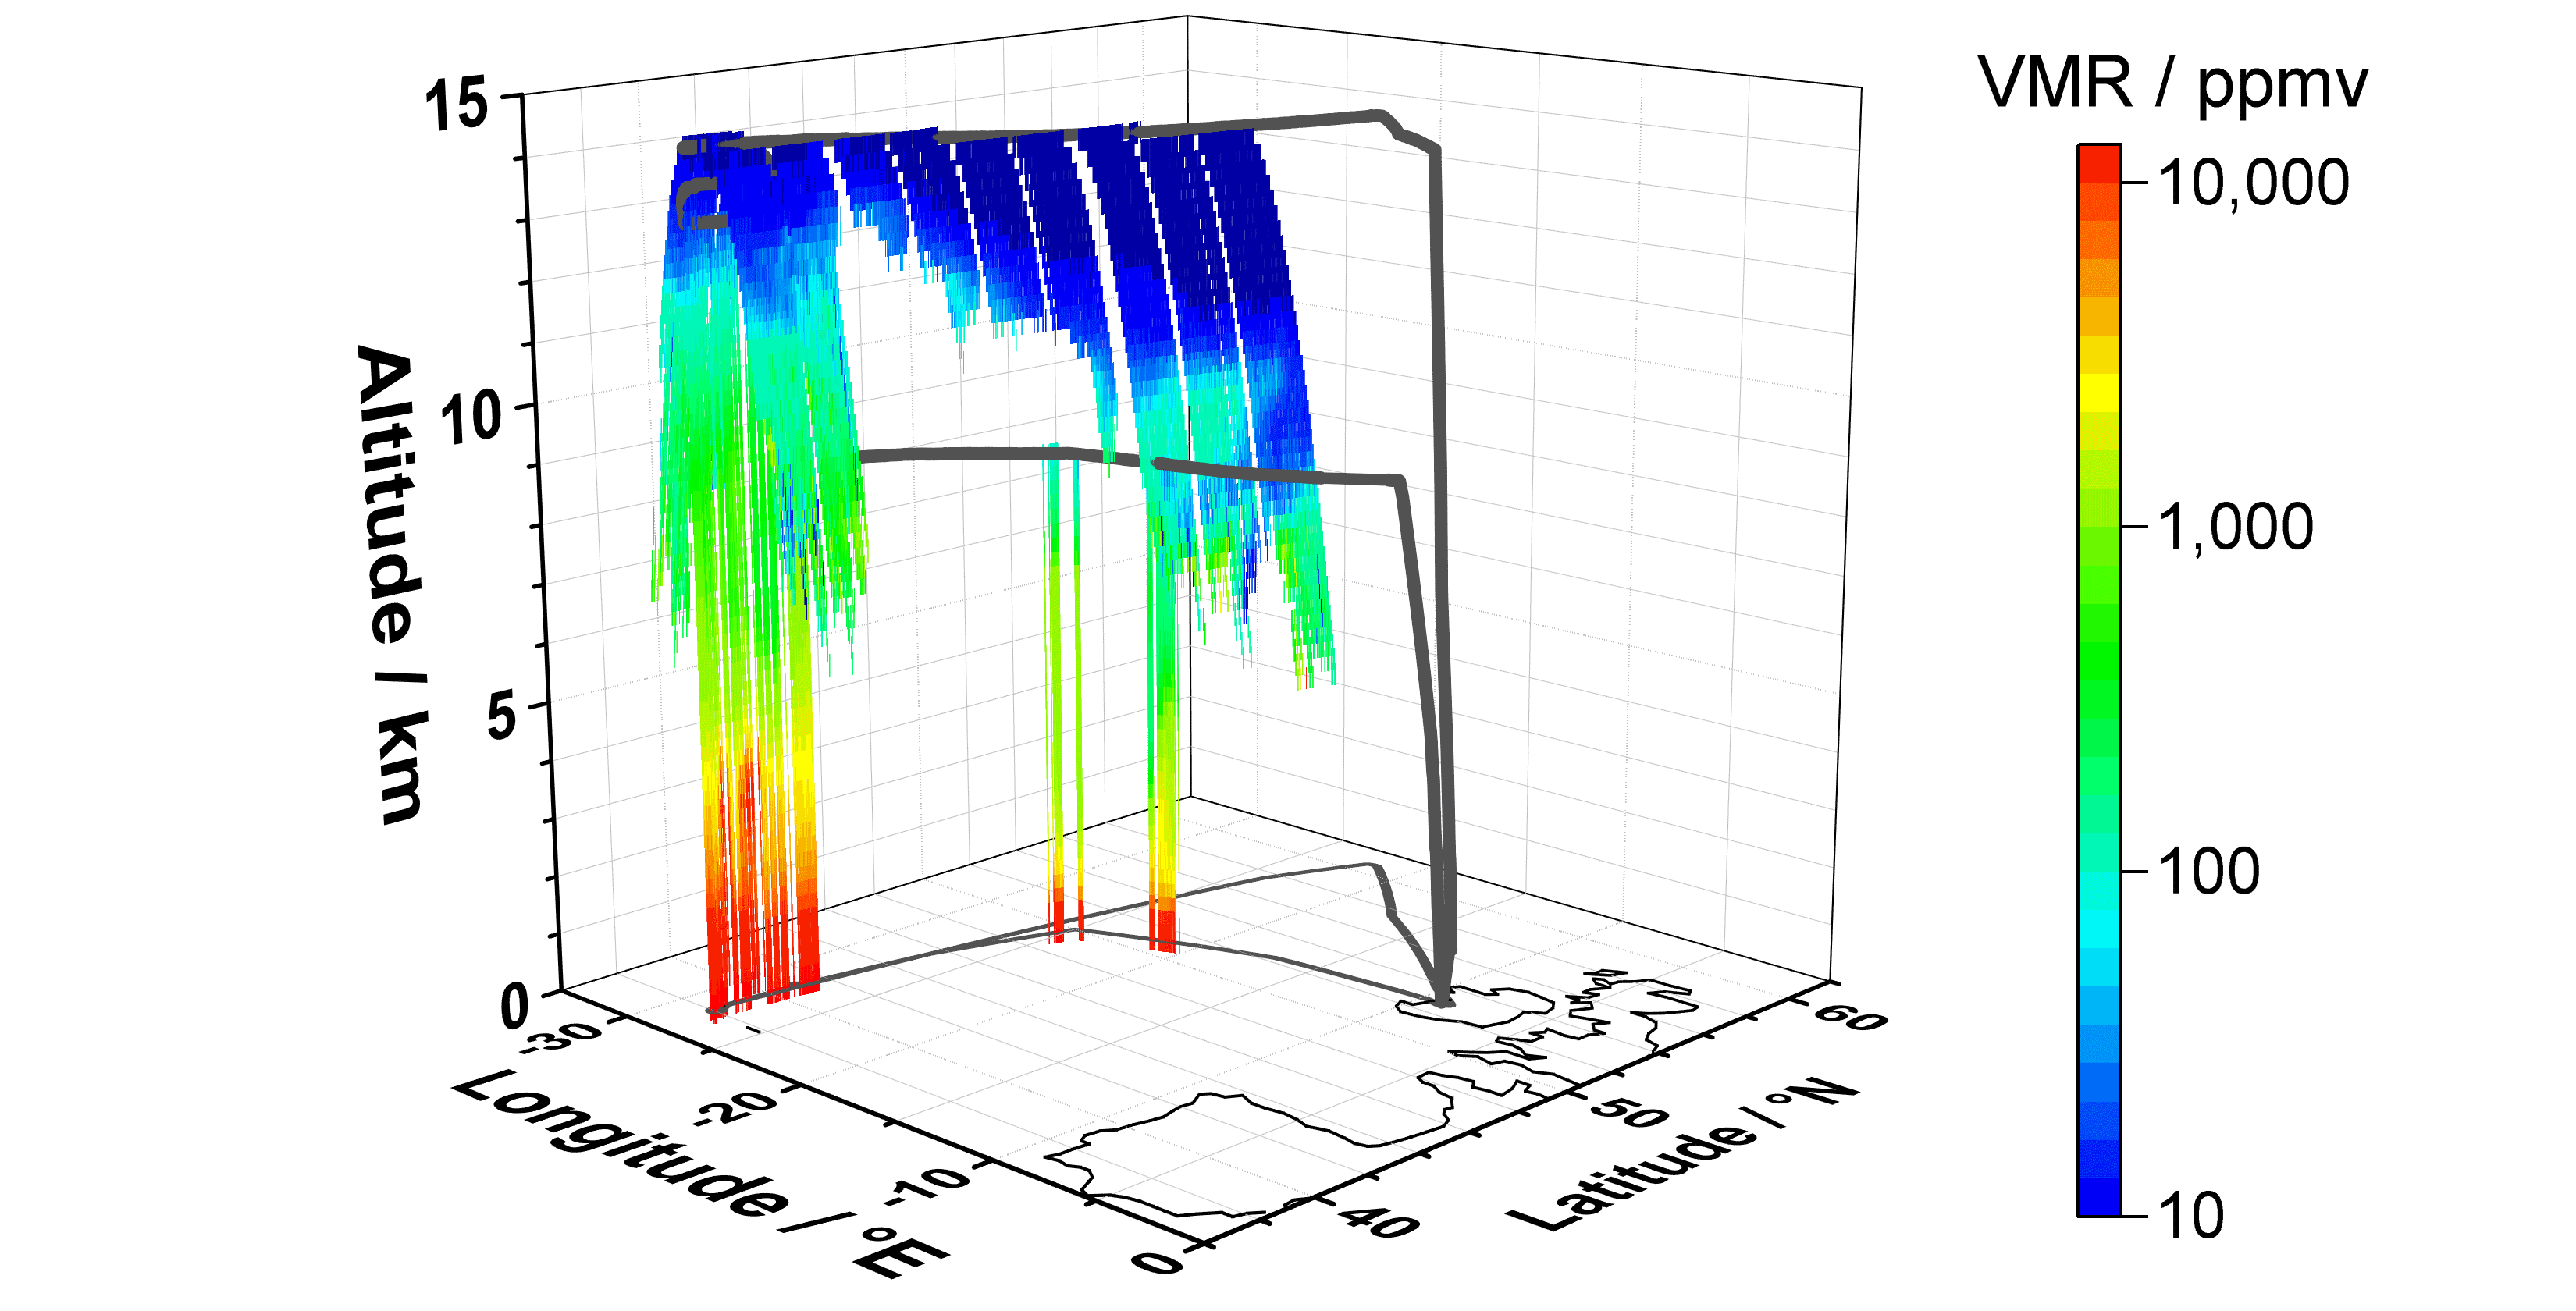
2.1. GLORIA Instrument
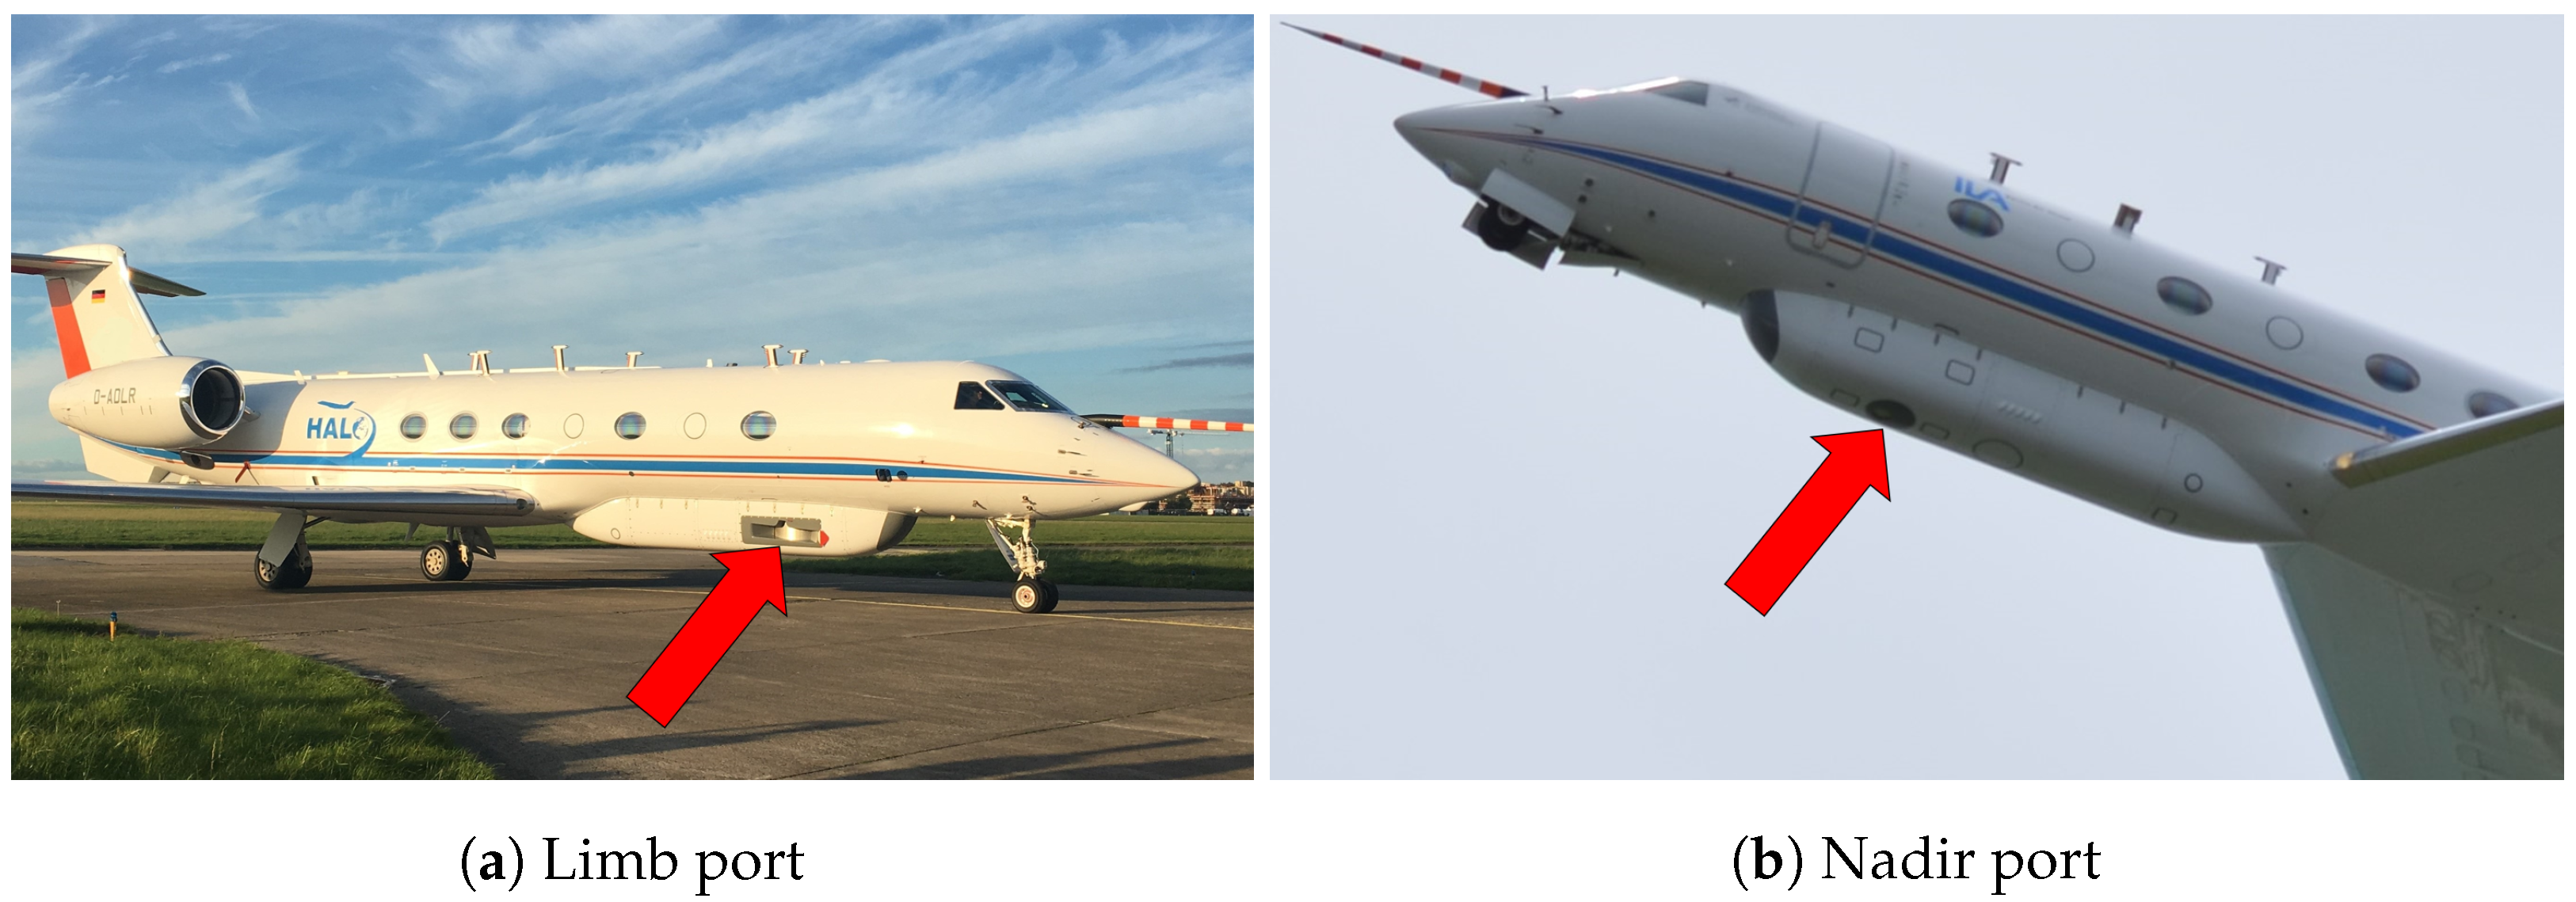
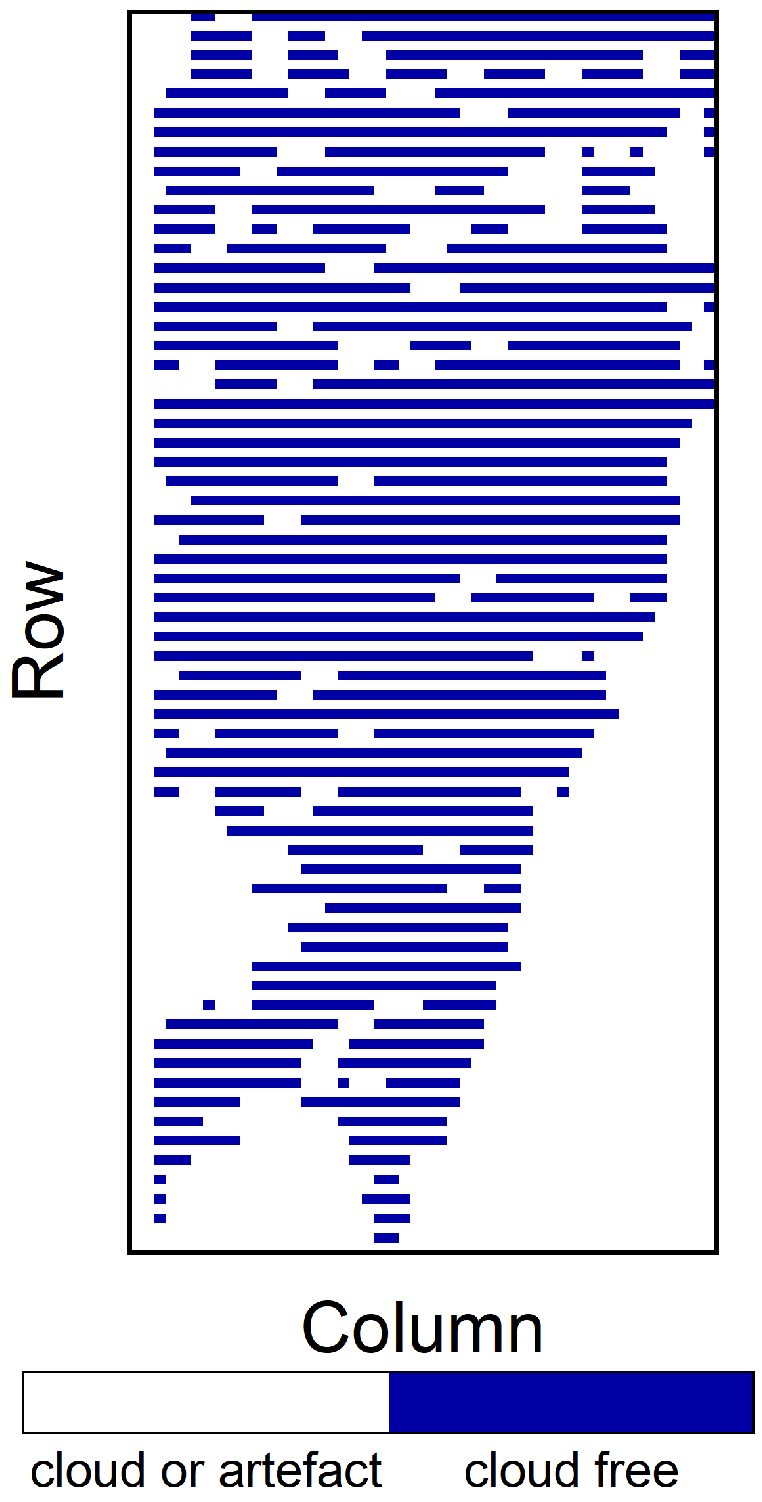
2.2. Determination of Mean Spectra and Cloud Filtering
2.3. Retrieval Process
2.4. Retrieval Diagnostics
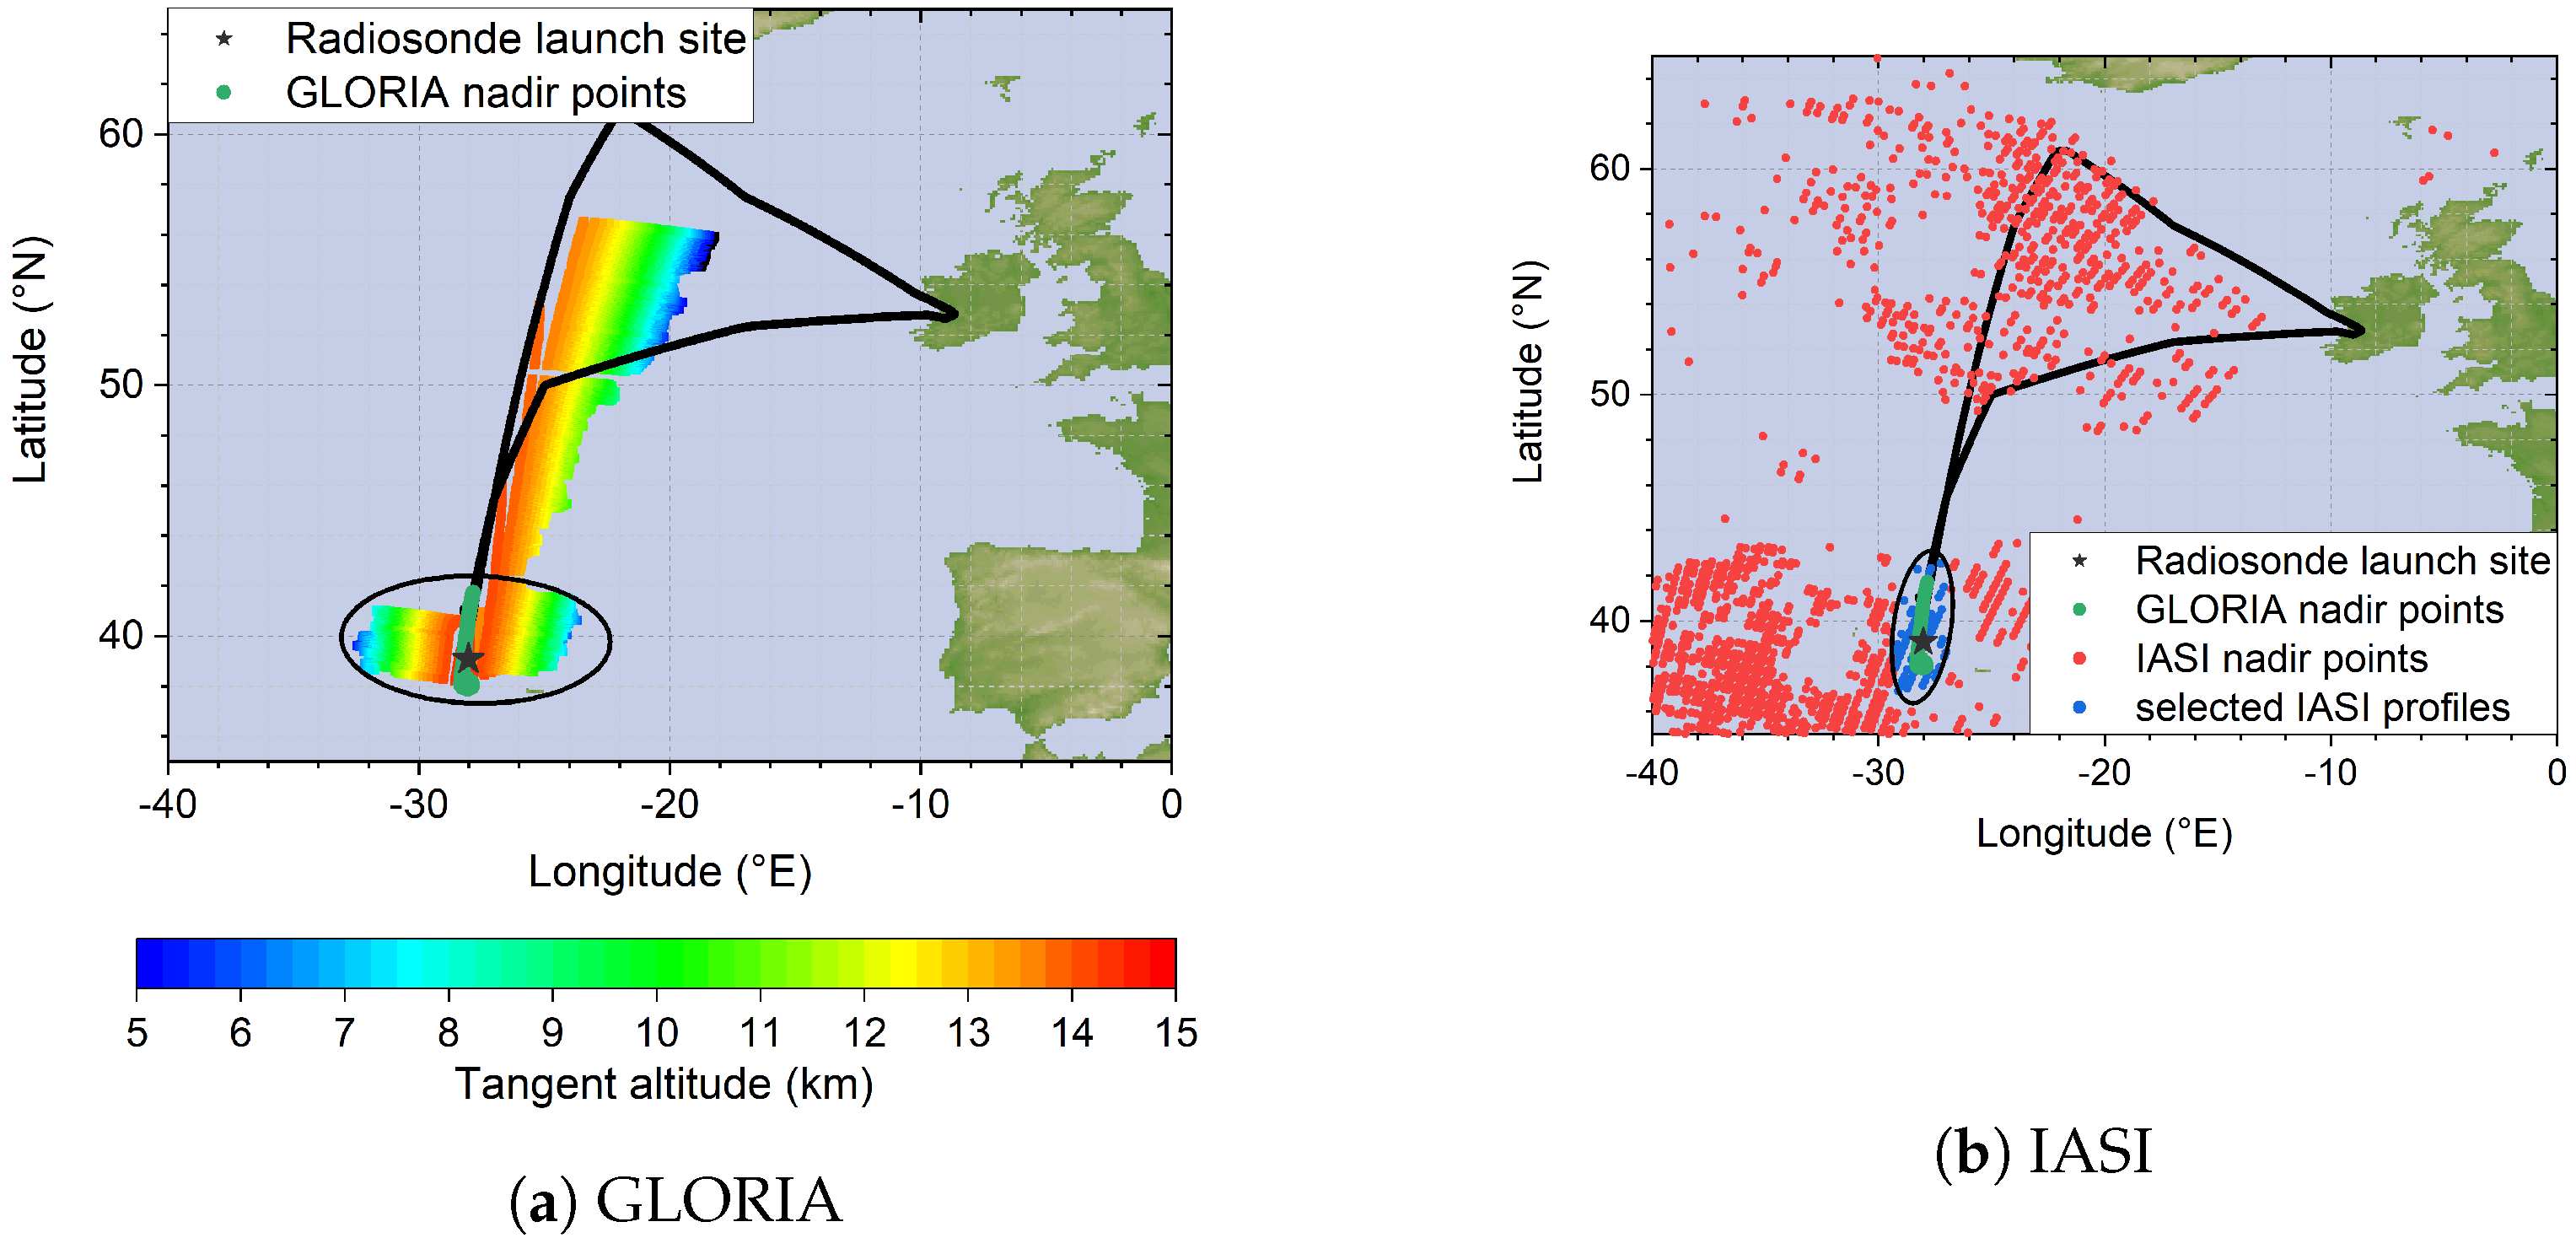
2.5. IASI Measurements
3. Results
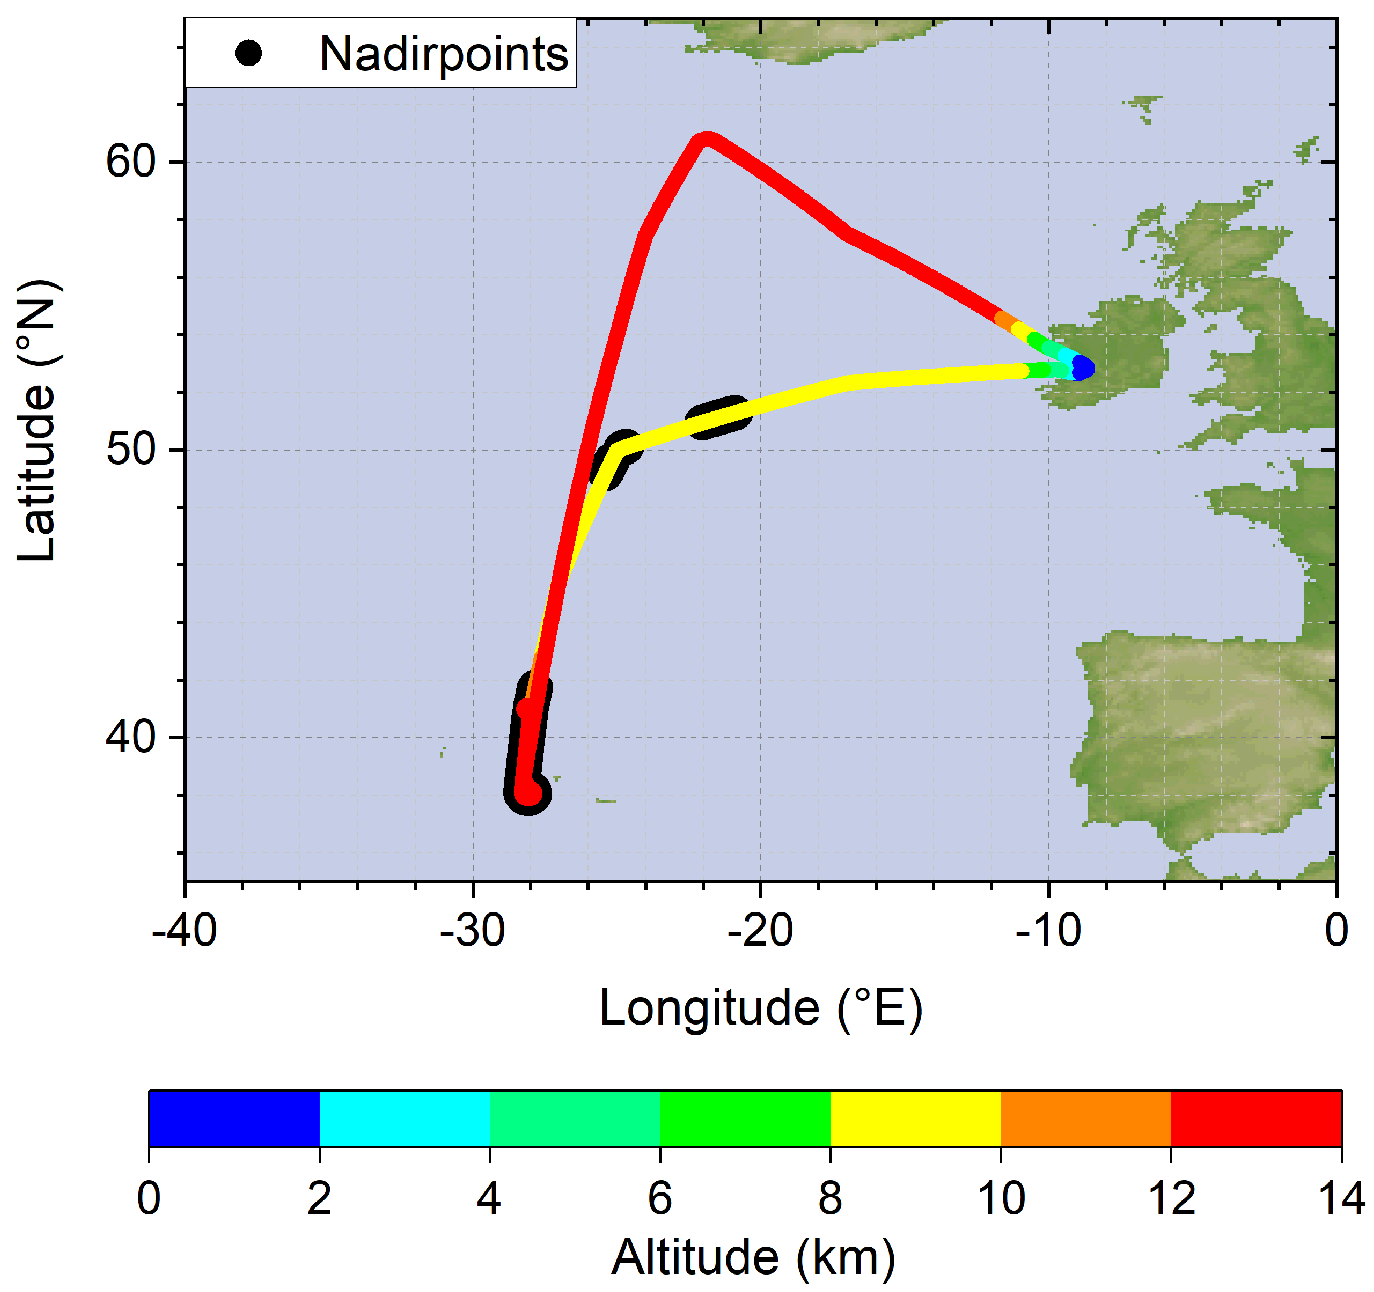
3.1. Flight Data
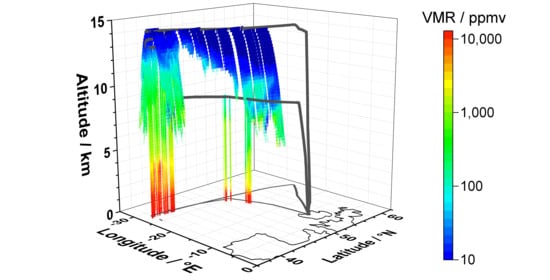
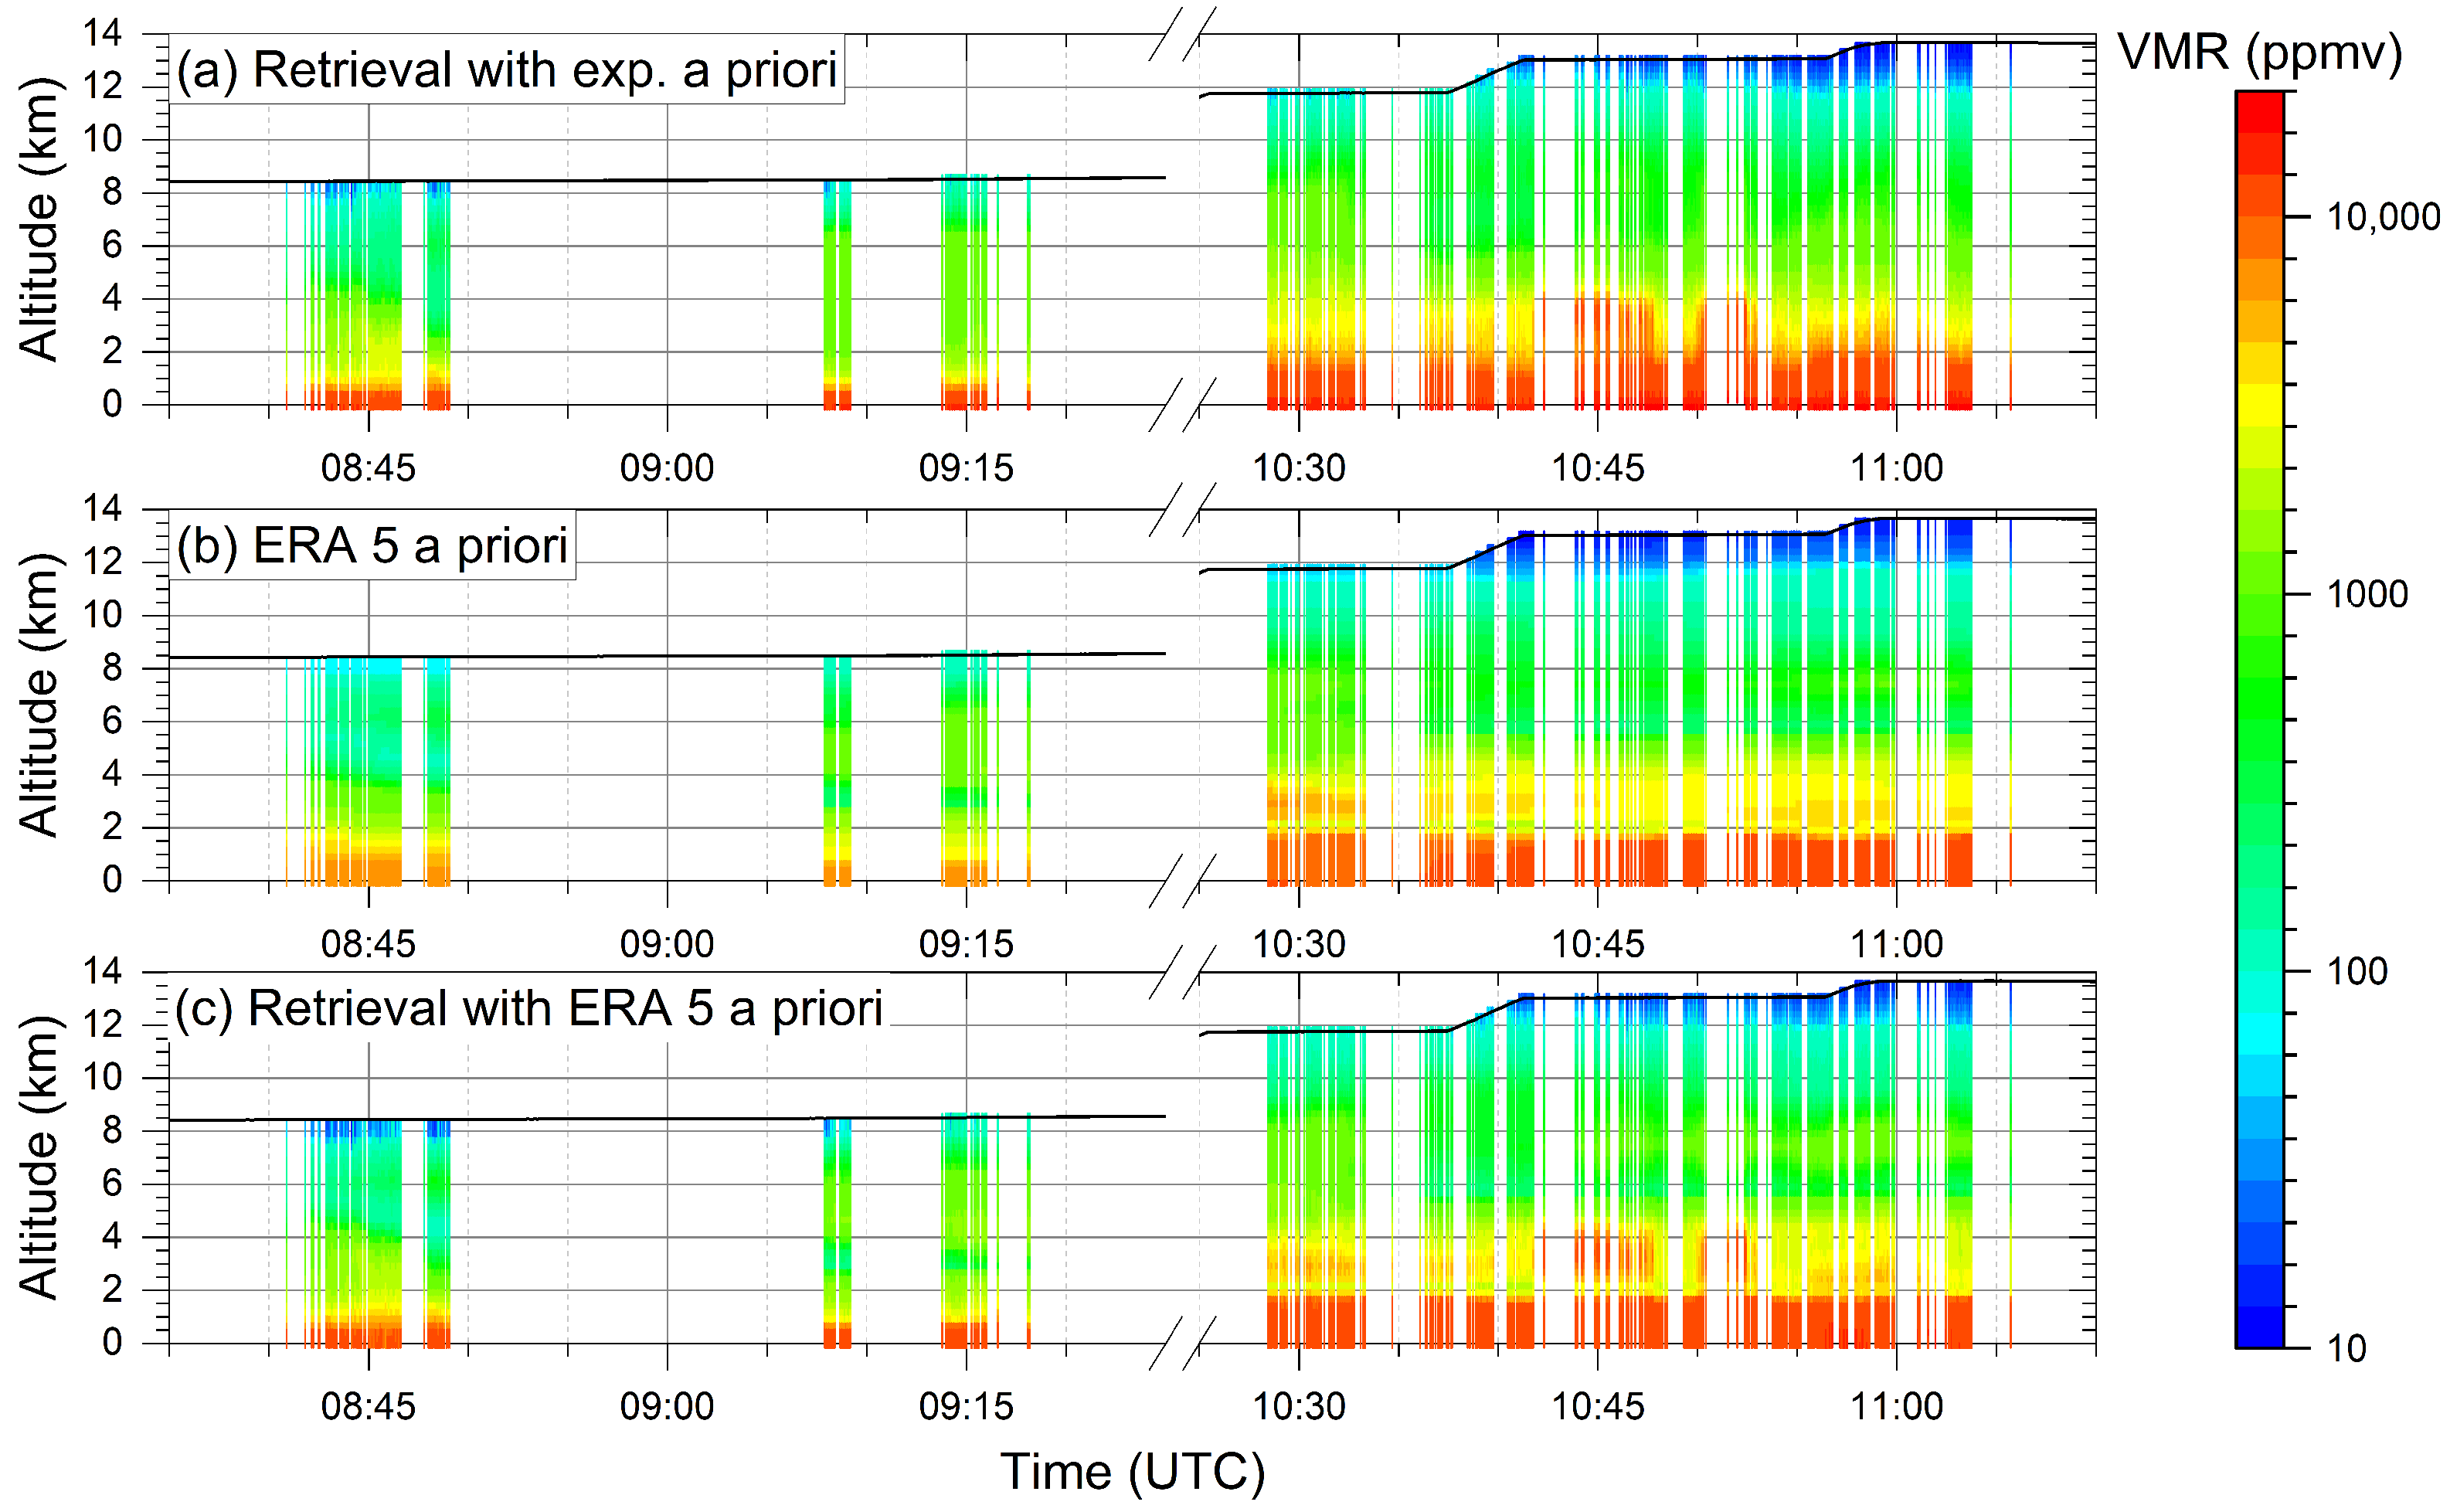
3.2. Cross Sections
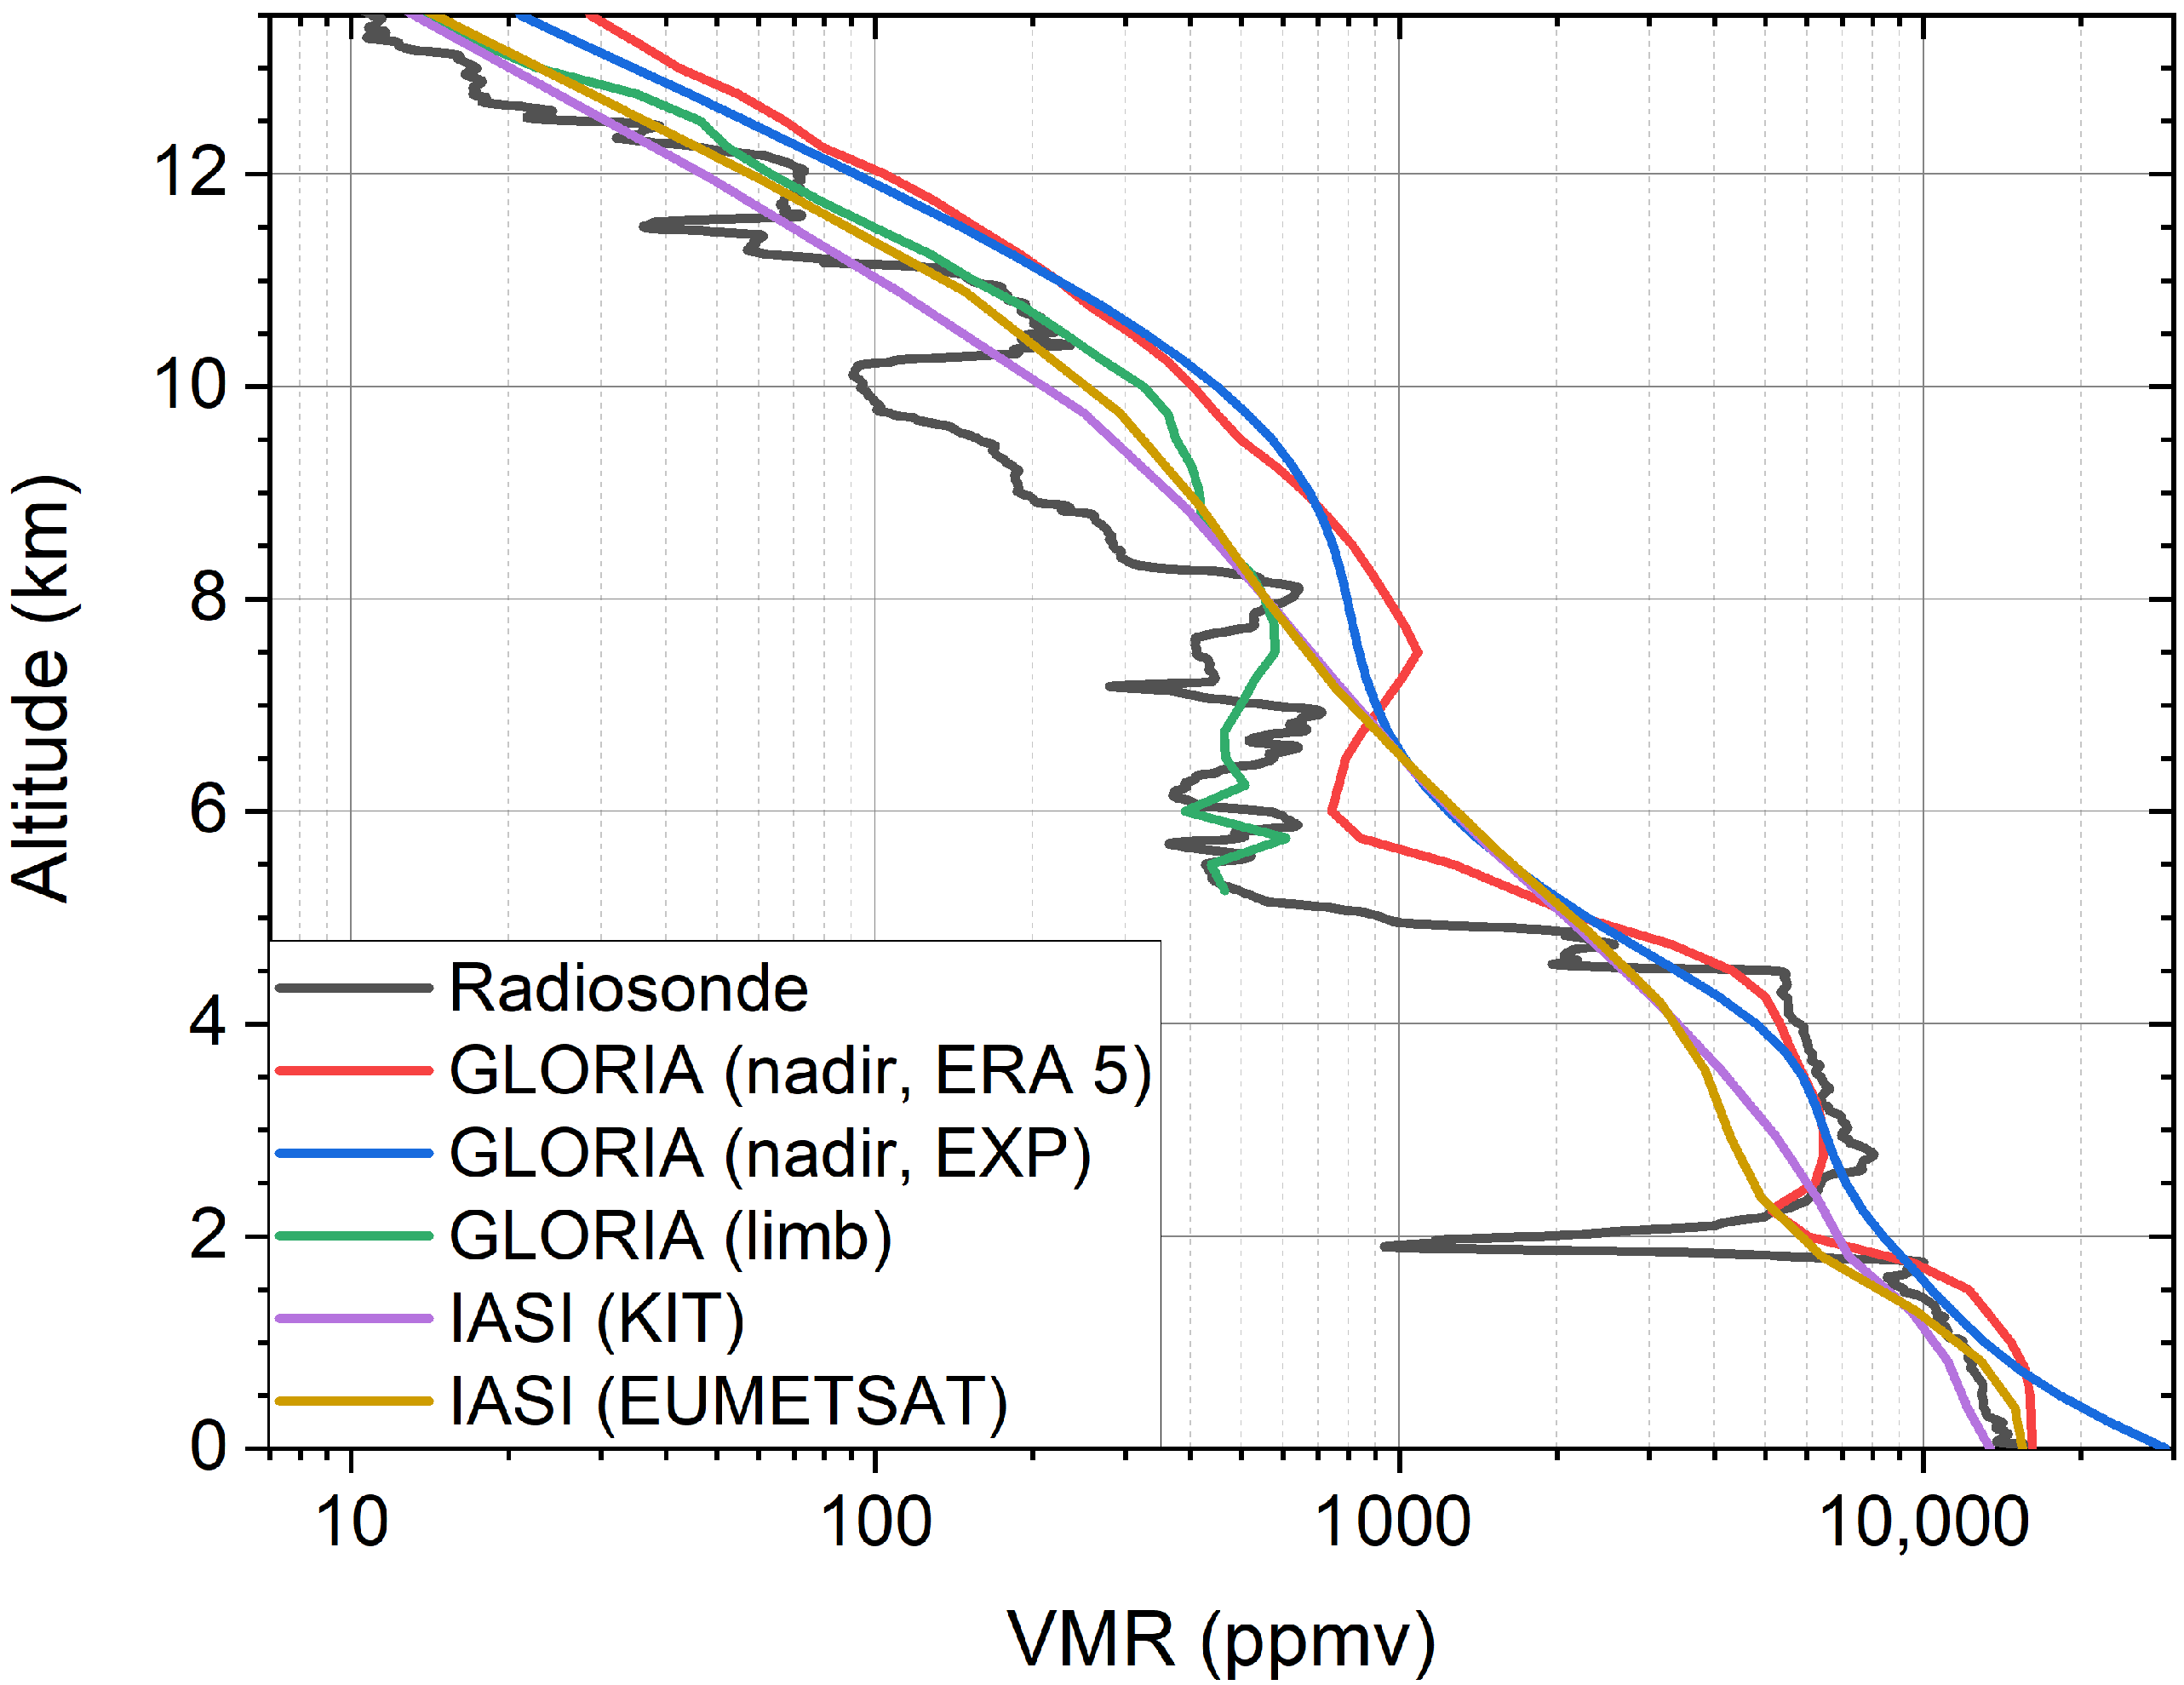
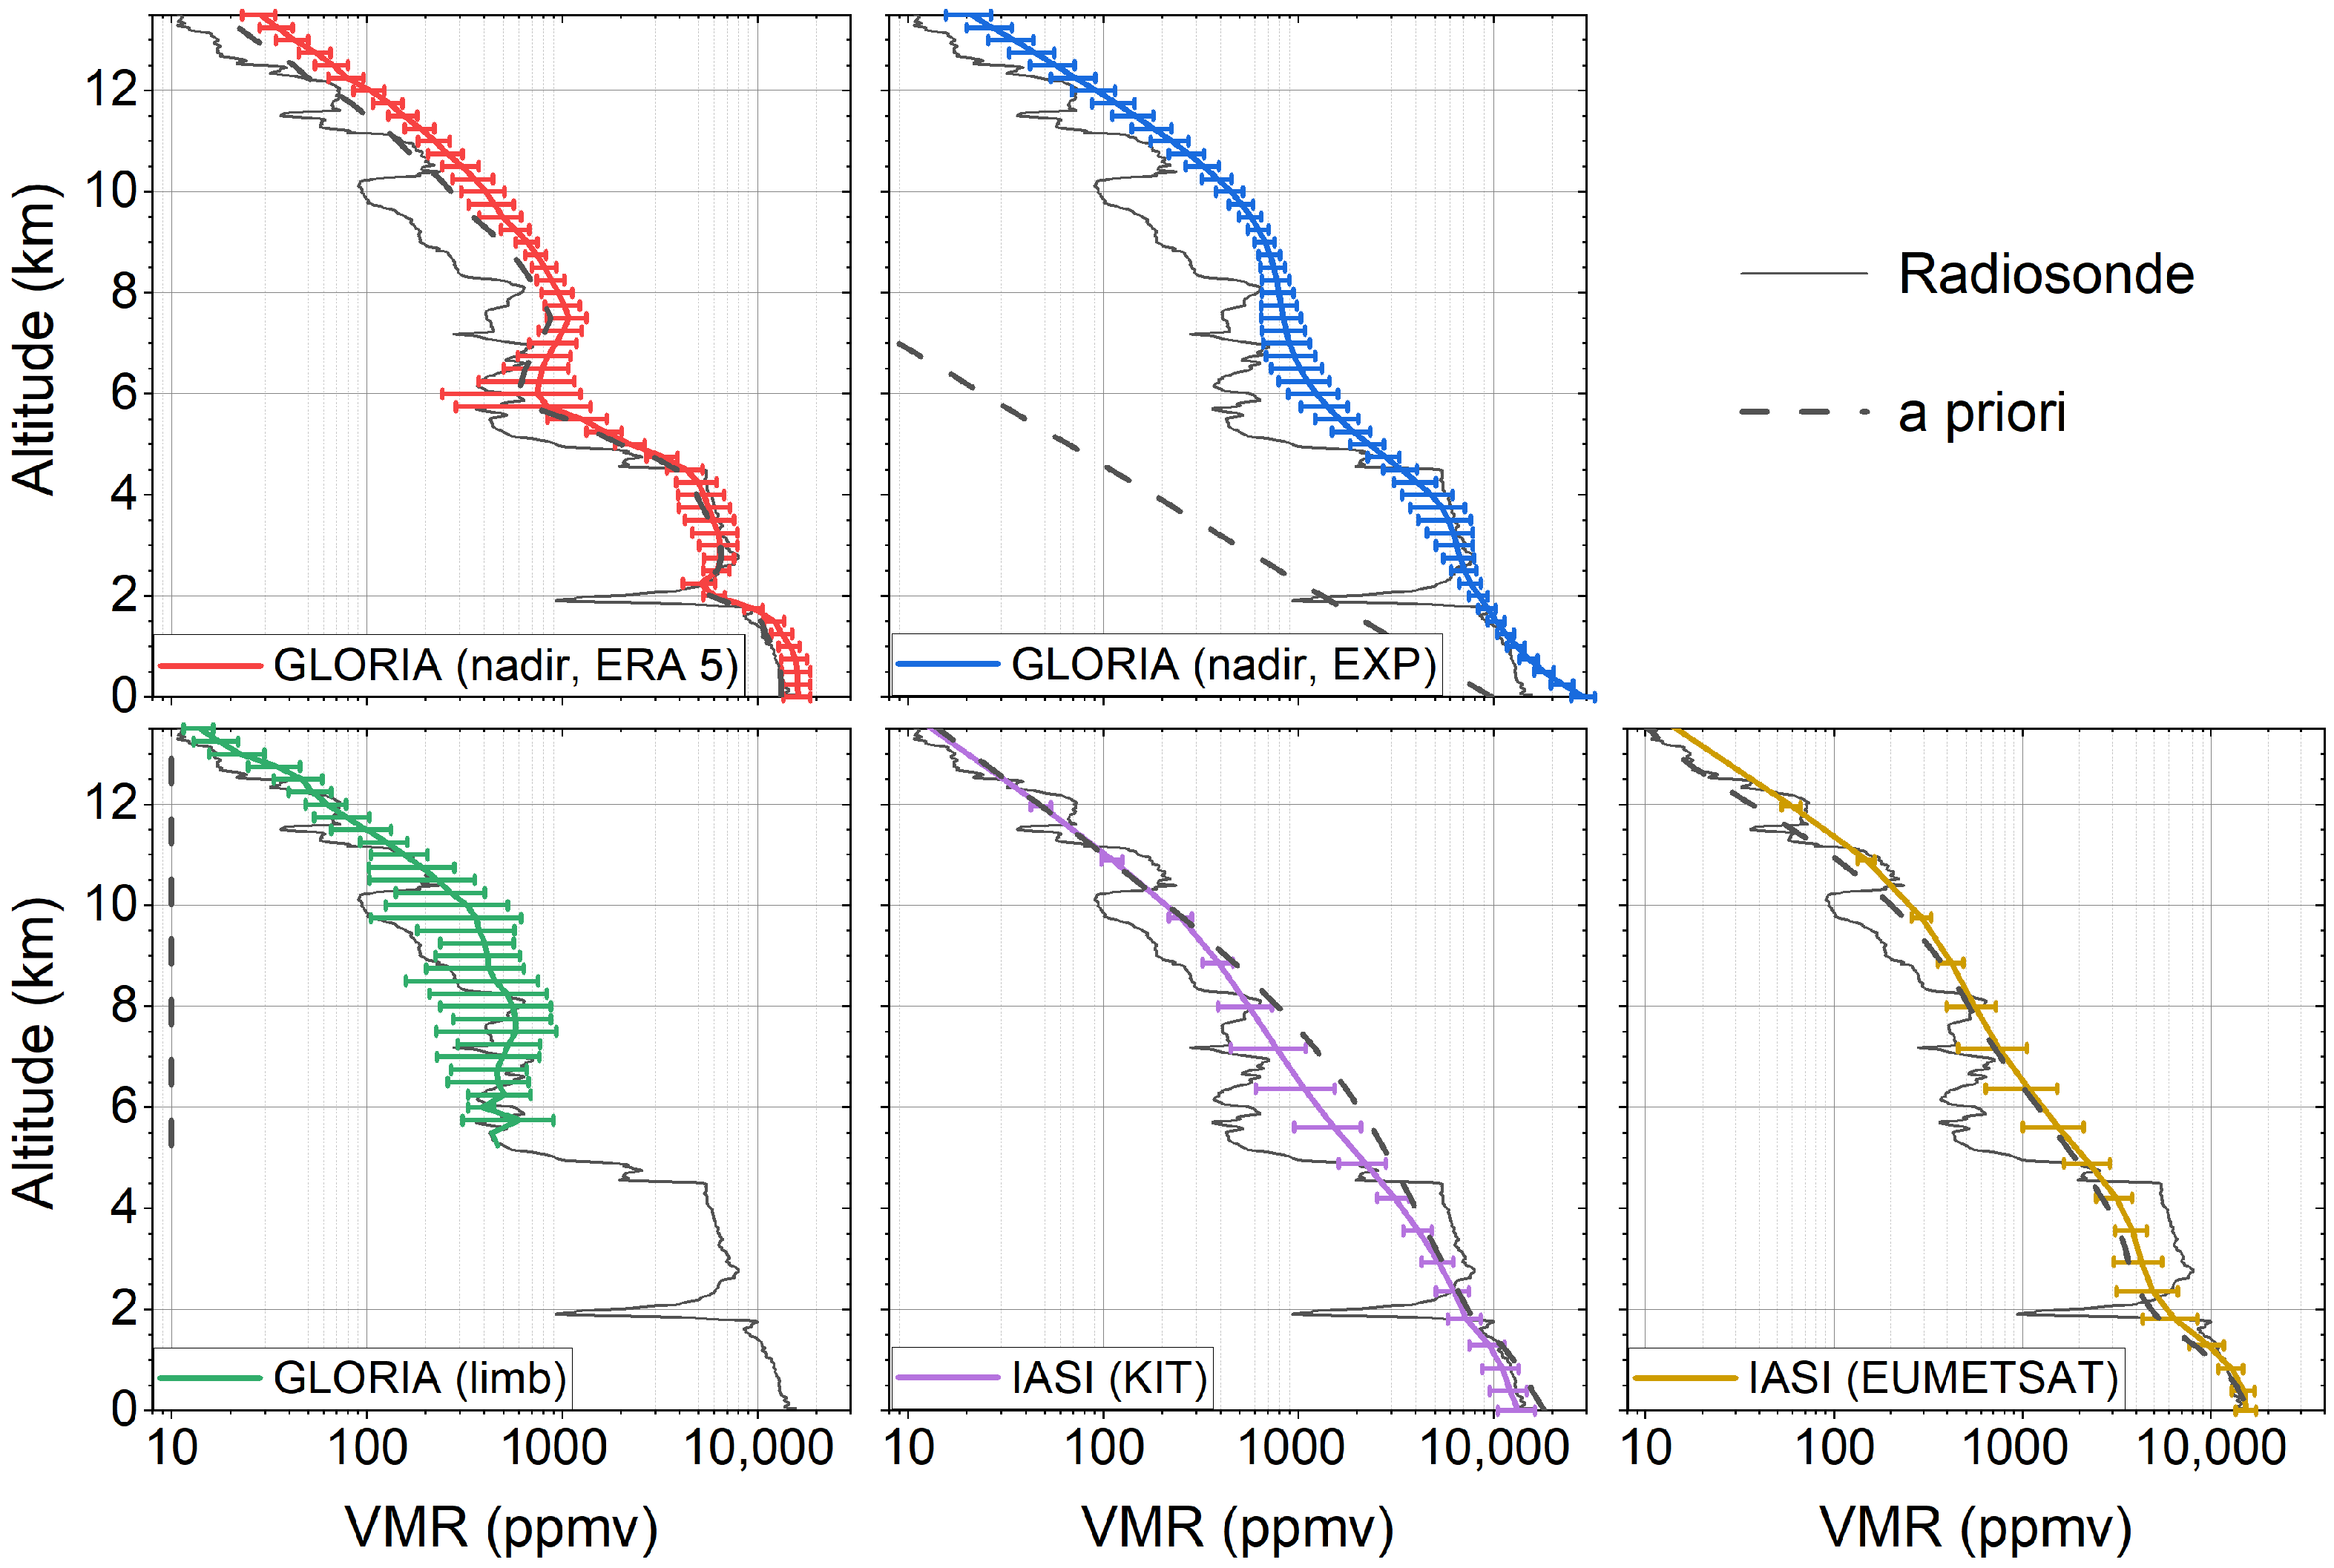
3.3. Comparison of Mean Profiles
4. Discussion
Author Contributions
Funding
Data Availability Statement
Acknowledgments
Conflicts of Interest
References
- Beer, R.; Glavich, T.A.; Rider, D.M. Tropospheric emission spectrometer for the Earth Observing System’s Aura satellite. Appl. Opt. 2001, 40, 2356–2367. [Google Scholar] [CrossRef]
- Worden, J.; Kulawik, S.; Frankenberg, C.; Payne, V.; Bowman, K.; Cady-Peirara, K.; Wecht, K.; Lee, J.E.; Noone, D. Profiles of CH4, HDO, H2O, and N2O with improved lower tropospheric vertical resolution from Aura TES radiances. Atmos. Meas. Tech. 2012, 5, 397–411. [Google Scholar] [CrossRef] [Green Version]
- Aumann, H.H.; Pagano, R.J. Atmospheric infrared sounder on the Earth Observing System. Opt. Eng. 1994, 33, 776–784. [Google Scholar] [CrossRef]
- Pagano, T.S.; Aumann, H.H.; Hagan, D.E.; Overoye, K. Prelaunch and in-flight radiometric calibration of the Atmospheric Infrared Sounder (AIRS). IEEE Trans. Geosci. Remote Sens. 2003, 41, 265–273. [Google Scholar] [CrossRef]
- Divakarla, M.G.; Barnet, C.D.; Goldberg, M.D.; McMillin, L.M.; Maddy, E.; Wolf, W.; Zhou, L.; Liu, X. Validation of Atmospheric Infrared Sounder temperature and water vapor retrievals with matched radiosonde measurements and forecasts. J. Geophys. Res. Atmos. 2006, 111. [Google Scholar] [CrossRef] [Green Version]
- Han, Y.; Revercomb, H.; Cromp, M.; Gu, D.; Johnson, D.; Mooney, D.; Scott, D.; Strow, L.; Bingham, G.; Borg, L.; et al. Suomi NPP CrIS measurements, sensor data record algorithm, calibration and validation activities, and record data quality. J. Geophys. Res. Atmos. 2013, 118, 12734–12748. [Google Scholar] [CrossRef]
- Siméoni, D.; Singer, C.; Chalon, G. Infrared atmospheric sounding interferometer. Acta Astronaut. 1997, 40, 113–118. [Google Scholar] [CrossRef]
- Pougatchev, N.; August, T.; Calbet, X.; Hultberg, T.; Oduleye, O.; Schlüssel, P.; Stiller, B.; St. Germain, K.; Bingham, G. IASI temperature and water vapor retrievals—Error assessment and validation. Atmos. Chem. Phys. 2009, 9, 6453–6458. [Google Scholar] [CrossRef] [Green Version]
- August, T.; Klaes, D.; Schlüssel, P.; Hultberg, T.; Crapeau, M.; Arriaga, A.; O’Carroll, A.; Coppens, D.; Munro, R.; Calbet, X. IASI on Metop-A: Operational Level 2 retrievals after five years in orbit. J. Quant. Spectrosc. Radiat. Transf. 2012, 113, 1340–1371. [Google Scholar] [CrossRef]
- Schneider, M.; Ertl, B.; Diekmann, C.J.; Khosrawi, F.; Weber, A.; Hase, F.; Höpfner, M.; García, O.E.; Sepúlveda, E.; Kinnison, D. Design and description of the MUSICA IASI full retrieval product. Earth Syst. Sci. Data Discuss. 2021, 2021, 1–51. [Google Scholar] [CrossRef]
- Revercomb, H.E.; LaPorte, D.D.; Smith, W.L.; Buijs, H.; Murcray, D.G.; Murcrayr, F.J.; Sromovsky, L.A. High-altitude aircraft measurements of upwelling IR radiance: Prelude to FTIR from geosynchronous satellite. Mikrochim. Acta 1988, 95, 439–444. [Google Scholar] [CrossRef]
- Smith, W.L.; Zhou, D.K.; Larar, A.M.; Mango, S.A.; Howell, H.B.; Knuteson, R.O.; Revercomb, H.E. The NPOESS Airborne Sounding Testbed Interferometer—Remotely Sensed Surface and Atmospheric Conditions during CLAMS. J. Atmos. Sci. 2005, 62, 1118–1134. [Google Scholar] [CrossRef] [Green Version]
- Wilson, S.H.S.; Atkinson, N.C.; Smith, J.A. The Development of an Airborne Infrared Interferometer for Meteorological Sounding Studies. J. Atmos. Ocean. Technol. 1999, 16, 1912–1927. [Google Scholar] [CrossRef]
- Maestri, T.; Rizzi, R.; Smith, J.A. Spectral infrared analysis of a cirrus cloud based on Airborne Research Interferometer Evaluation System (ARIES) measurements. J. Geophys. Res. Atmos. 2005, 110. [Google Scholar] [CrossRef]
- Illingworth, S.M.; Allen, G.; Newman, S.; Vance, A.; Marenco, F.; Harlow, R.C.; Taylor, J.; Moore, D.P.; Remedios, J.J. Atmospheric composition and thermodynamic retrievals from the ARIES airborne FTS system—Part 1: Technical aspects and simulated capability. Atmos. Meas. Tech. 2014, 7, 1133–1150. [Google Scholar] [CrossRef] [Green Version]
- Allen, G.; Illingworth, S.M.; O’Shea, S.J.; Newman, S.; Vance, A.; Bauguitte, S.J.B.; Marenco, F.; Kent, J.; Bower, K.; Gallagher, M.W.; et al. Atmospheric composition and thermodynamic retrievals from the ARIES airborne TIR-FTS system—Part 2: Validation and results from aircraft campaigns. Atmos. Meas. Tech. 2014, 7, 4401–4416. [Google Scholar] [CrossRef] [Green Version]
- Friedl-Vallon, F.; Gulde, T.; Hase, F.; Kleinert, A.; Kulessa, T.; Maucher, G.; Neubert, T.; Olschewski, F.; Piesch, C.; Preusse, P.; et al. Instrument concept of the imaging Fourier transform spectrometer GLORIA. Atmos. Meas. Tech. 2014, 7, 3565–3577. [Google Scholar] [CrossRef] [Green Version]
- Riese, M.; Oelhaf, H.; Preusse, P.; Blank, J.; Ern, M.; Friedl-Vallon, F.; Fischer, H.; Guggenmoser, T.; Höpfner, M.; Hoor, P.; et al. Gimballed Limb Observer for Radiance Imaging of the Atmosphere (GLORIA) scientific objectives. Atmos. Meas. Tech. 2014, 7, 1915–1928. [Google Scholar] [CrossRef] [Green Version]
- Höpfner, M.; Ungermann, J.; Borrmann, S.; Wagner, R.; Spang, R.; Riese, M.; Stiller, G.; Appel, O.; Batenburg, A.M.; Bucci, S.; et al. Ammonium nitrate particles formed in upper troposphere from ground ammonia sources during Asian monsoons. Nat. Geosci. 2019, 12, 608–612. [Google Scholar] [CrossRef]
- Johansson, S.; Höpfner, M.; Kirner, O.; Wohltmann, I.; Bucci, S.; Legras, B.; Friedl-Vallon, F.; Glatthor, N.; Kretschmer, E.; Ungermann, J.; et al. Pollution trace gas distributions and their transport in the Asian monsoon upper troposphere and lowermost stratosphere during the StratoClim campaign 2017. Atmos. Chem. Phys. 2020, 20, 14695–14715. [Google Scholar] [CrossRef]
- Woiwode, W.; Dörnbrack, A.; Bramberger, M.; Friedl-Vallon, F.; Haenel, F.; Höpfner, M.; Johansson, S.; Kretschmer, E.; Krisch, I.; Latzko, T.; et al. Mesoscale fine structure of a tropopause fold over mountains. Atmos. Chem. Phys. 2018, 18, 15643–15667. [Google Scholar] [CrossRef] [Green Version]
- Johansson, S.; Woiwode, W.; Höpfner, M.; Friedl-Vallon, F.; Kleinert, A.; Kretschmer, E.; Latzko, T.; Orphal, J.; Preusse, P.; Ungermann, J.; et al. Airborne limb-imaging measurements of temperature, HNO3, O3, ClONO2, H2O and CFC-12 during the Arctic winter 2015/2016: Characterization, in situ validation and comparison to Aura/MLS. Atmos. Meas. Tech. 2018, 11, 4737–4756. [Google Scholar] [CrossRef] [Green Version]
- Wetzel, G.; Friedl-Vallon, F.; Glatthor, N.; Grooß, J.U.; Gulde, T.; Höpfner, M.; Johansson, S.; Khosrawi, F.; Kirner, O.; Kleinert, A.; et al. Pollution trace gases C2H6, C2H2, HCOOH, and PAN in the North Atlantic UTLS: Observations and simulations. Atmos. Chem. Phys. 2021, 21, 8213–8232. [Google Scholar] [CrossRef]
- Piesch, C.; Sartorius, C.; Friedl-Vallon, F.; Gulde, T.; Heger, S.; Kretschmer, E.; Maucher, G.; Nordmeyer, H.; Barthel, J.; Ebersoldt, A.; et al. The mechanical and thermal setup of the GLORIA spectrometer. Atmos. Meas. Tech. 2015, 8, 1773–1787. [Google Scholar] [CrossRef] [Green Version]
- Kleinert, A.; Friedl-Vallon, F.; Guggenmoser, T.; Höpfner, M.; Neubert, T.; Ribalda, R.; Sha, M.K.; Ungermann, J.; Blank, J.; Ebersoldt, A.; et al. Level 0 to 1 processing of the imaging Fourier transform spectrometer GLORIA: Generation of radiometrically and spectrally calibrated spectra. Atmos. Meas. Tech. 2014, 7, 4167–4184. [Google Scholar] [CrossRef] [Green Version]
- Ungermann, J.; Kleinert, A.; Maucher, G.; Bartolomé, I.; Krasauskas, L.; Neubert, T.; Friedl-Vallon, F.; Johansson, S. On Quantifying and Mitigation GLORIA Instrument Effects and Uncertainties. 2021; In Preparation. [Google Scholar]
- Höpfner, M.; Oelhaf, H.; Wetzel, G.; Friedl-Vallon, F.; Kleinert, A.; Lengel, A.; Maucher, G.; Nordmeyer, H.; Glatthor, N.; Stiller, G.; et al. Evidence of scattering of tropospheric radiation by PSCs in mid-IR limb emission spectra: MIPAS-B observations and KOPRA simulations. Geophys. Res. Lett. 2002, 29, 119-1–119-4. [Google Scholar] [CrossRef] [Green Version]
- Stiller, G.P.; von Clarmann, T.; Funke, B.; Glatthor, N.; Hase, F.; Höpfner, M.; Linden, A. Sensitivity of trace gas abundances retrievals from infrared limb emission spectra to simplifying approximations in radiative transfer modelling. J. Quant. Spectrosc. Radiat. Transf. 2002, 72, 249–280. [Google Scholar] [CrossRef]
- Rodgers, C.D. Inverse Methods for Atmospheric Sounding: Theory and Practice; World Scientific: Singapore, 2000; Volume 2. [Google Scholar]
- Tikhonov, A.N. On the solution of ill-posed problems and the method of regularization. Dokl. Akad. Nauk SSSR 1963, 151, 501–504. [Google Scholar]
- Hersbach, H.; Bell, B.; Berrisford, P.; Hirahara, S.; Horányi, A.; Muñoz-Sabater, J.; Nicolas, J.; Peubey, C.; Radu, R.; Schepers, D.; et al. The ERA5 global reanalysis. Q. J. R. Meteorol. Soc. 2020, 146, 1999–2049. [Google Scholar] [CrossRef]
- Schneider, M.; Hase, F. Optimal estimation of tropospheric H2O and δD with IASI/METOP. Atmos. Chem. Phys. 2011, 11, 11207–11220. [Google Scholar] [CrossRef] [Green Version]
- Borger, C.; Schneider, M.; Ertl, B.; Hase, F.; García, O.E.; Sommer, M.; Höpfner, M.; Tjemkes, S.A.; Calbet, X. Evaluation of MUSICA IASI tropospheric water vapour profiles using theoretical error assessments and comparisons to GRUAN Vaisala RS92 measurements. Atmos. Meas. Tech. 2018, 11, 4981–5006. [Google Scholar] [CrossRef] [Green Version]
- Masuda, K.; Takashima, T.; Takayama, Y. Emissivity of pure and sea waters for the model sea surface in the infrared window regions. Remote Sens. Environ. 1988, 24, 313–329. [Google Scholar] [CrossRef]
- Kleinert, A.; Krisch, I.; Ungermann, J.; Adibekyan, A.; Gutschwager, B.; Monte, C. Characterization of blackbody inhomogeneity and its effect on the retrieval results of the GLORIA instrument. Atmos. Meas. Tech. 2018, 11, 3871–3882. [Google Scholar] [CrossRef] [Green Version]
- von Clarmann, T.; Höpfner, M.; Kellmann, S.; Linden, A.; Chauhan, S.; Funke, B.; Grabowski, U.; Glatthor, N.; Kiefer, M.; Schieferdecker, T.; et al. Retrieval of temperature, H2O, O3, HNO3, CH4, N2O, ClONO2 and ClO from MIPAS reduced resolution nominal mode limb emission measurements. Atmos. Meas. Tech. 2009, 2, 159–175. [Google Scholar] [CrossRef] [Green Version]
- EUMETSAT. IASI Level 2: Product Guide. Technical Report, EUM/OPS-EPS/MAN/04/0033. 2017. Available online: https://www.eumetsat.int/media/45982 (accessed on 13 September 2021).
- Wetzel, G.; Fischer, H.; Oelhaf, H. Remote sensing of trace gases in the midinfrared spectral region from a nadir view. Appl. Opt. 1995, 34, 467–479. [Google Scholar] [CrossRef] [PubMed]


Publisher’s Note: MDPI stays neutral with regard to jurisdictional claims in published maps and institutional affiliations. |
© 2021 by the authors. Licensee MDPI, Basel, Switzerland. This article is an open access article distributed under the terms and conditions of the Creative Commons Attribution (CC BY) license (https://creativecommons.org/licenses/by/4.0/).
Share and Cite
König, N.; Wetzel, G.; Höpfner, M.; Friedl-Vallon, F.; Johansson, S.; Kleinert, A.; Schneider, M.; Ertl, B.; Ungermann, J. Retrieval of Water Vapour Profiles from GLORIA Nadir Observations. Remote Sens. 2021, 13, 3675. https://0-doi-org.brum.beds.ac.uk/10.3390/rs13183675
König N, Wetzel G, Höpfner M, Friedl-Vallon F, Johansson S, Kleinert A, Schneider M, Ertl B, Ungermann J. Retrieval of Water Vapour Profiles from GLORIA Nadir Observations. Remote Sensing. 2021; 13(18):3675. https://0-doi-org.brum.beds.ac.uk/10.3390/rs13183675
Chicago/Turabian StyleKönig, Nils, Gerald Wetzel, Michael Höpfner, Felix Friedl-Vallon, Sören Johansson, Anne Kleinert, Matthias Schneider, Benjamin Ertl, and Jörn Ungermann. 2021. "Retrieval of Water Vapour Profiles from GLORIA Nadir Observations" Remote Sensing 13, no. 18: 3675. https://0-doi-org.brum.beds.ac.uk/10.3390/rs13183675