Article

A Comprehensive Evaluation of Near-Real-Time and Research Products of IMERG Precipitation over India for the Southwest Monsoon Period

1
Divecha Centre for Climate Change, Indian Institute of Science, Bengaluru 560012, India
2
India Meteorological Department, Ministry of Earth Sciences, New Delhi 110003, India
*
Author to whom correspondence should be addressed.
Remote Sens. 2021, 13(18), 3676; https://0-doi-org.brum.beds.ac.uk/10.3390/rs13183676
Submission received: 6 July 2021 / Revised: 13 August 2021 / Accepted: 17 August 2021 / Published: 15 September 2021

Abstract

:
Precipitation is one of the integral components of the global hydrological cycle. Accurate estimation of precipitation is vital for numerous applications ranging from hydrology to climatology. Following the launch of the Global Precipitation Measurement (GPM) Core Observatory, the Integrated Multi-satellite Retrievals for GPM (IMERG) precipitation product was released. The IMERG provides global precipitation estimates at finer spatiotemporal resolution (e.g., 0.1°/half-hourly) and has shown to be better than other contemporary multi-satellite precipitation products over most parts of the globe. In this study, near-real-time and research products of IMERG have been extensively evaluated against a daily rain-gauge-based precipitation dataset over India for the southwest monsoon period. In addition, the current version 6 of the IMERG research product or Final Run (IMERG-F V6) has been compared with its predecessor, version 5, and error characteristics of IMERG-F V6 for pre-GPM and GPM periods have been assessed. The spatial distributions of different error metrics over the country show that both near-real-time IMERG products (e.g., Early and Late Runs) have similar error characteristics in precipitation estimation. However, near-real-time products have larger errors than IMERG-F V6, as expected. Bias in all-India daily mean rainfall in the near-real-time IMERG products is about 3–4 times larger than research product. Both V5 and V6 IMERG-F estimates show similar error characteristics in daily precipitation estimation over the country. Similarly, both near-real-time and research products show similar characteristics in the detection of rainy days. However, IMERG-F V6 exhibits better performance in precipitation estimation and detection of rainy days during the GPM period (2014–2017) than the pre-GPM period (2010–2013). The contribution of different rainfall intensity intervals to total monsoon rainfall is captured well by the IMERG estimates. Furthermore, results reveal that IMERG estimates under-detect and overestimate light rainfall intensity of 2.5–7.5 mm day−1, which needs to be improved in the next release. The results of this study would be beneficial for end-users to integrate this multi-satellite product in any specific application.

1. Introduction

Precipitation is one of the key components of the global water and energy cycles, and a robust constellation of precipitation-related satellite sensors could provide reliable global distributions of precipitation at distinct spatiotemporal scales [1,2,3]. Following the launch of the Tropical Rainfall Measuring Mission (TRMM) satellite in November 1997, satellite-based precipitation estimation techniques received an unprecedented boost. The TRMM satellite carried the first space-borne active microwave radar, the Ku-band (13.8 GHz) Precipitation Radar (PR), to provide a three-dimensional structure of the tropical precipitation. A nine-channel conically scanning passive microwave radiometer, namely, the TRMM Microwave Imager, was paired with the PR and placed in a unique non-sun-synchronous orbit to capture the diurnal variability of the tropical precipitation [4]. Several global or quasi-global multi-satellite precipitation products were developed and made available to users during the TRMM-era [5,6]. These precipitation products take relative advantages of the passive microwave imagers onboard the low-Earth orbiting satellites and infrared sensors onboard the geostationary satellites. In addition, these multi-satellite precipitation products provide precipitation information at uniform spatial and temporal scales even over the regions where rain gauge observations are unavailable or meager [7]. Some of the popular TRMM-era multi-satellite precipitation products are TRMM Multisatellite Precipitation Analysis (TMPA [8]), Climate Prediction Centre Morphing (CMORPH [9]), Precipitation Estimation from Remotely Sensed Information using Artificial Neural Networks (PERSIANN [10]), and Global Satellite Mapping of Precipitation (GSMaP [11]). These multi-satellite precipitation products have rather large uncertainties over several regions of the globe at multiple timescales [6]. However, among the TRMM-era multi-satellite precipitation products, TMPA was generally shown to be superior to other products at global and regional scales [12,13].
The TRMM satellite was decommissioned in April 2015, after 17 years of uninterrupted service. In order to continue the objectives of the TRMM satellite with some further advancement, the Global Precipitation Measurement (GPM) Core Observatory was launched in February 2014. This satellite carries Dual-frequency Precipitation Radar (DPR) paired with a 13-channel passive microwave radiometer, namely, GPM Microwave Imager (GMI), which enables more accurate precipitation estimation and its phase detection [14]. Both TRMM and GPM are collaborative missions between the United States (US) National Aeronautics and Space Administration (NASA) and the Japan Aerospace Exploration Agency (JAXA). After the successful launch of the GPM Core Observatory, two GPM-based multi-satellite precipitation products, namely, Integrated Multi-satellite Retrievals for GPM (IMERG [15,16]) by NASA and GSMaP version 6 by JAXA were released. There are three kinds of IMERG products (e.g., Early, Late, and Final Runs) available depending upon their applications and latency times. Early (e.g., IMERG-E) and Late (e.g., IMERG-L) Runs are available in near-real-time, whereas Final Run (e.g., IMERG-F) is a research product available in post-real-time and includes rain gauge observations over land. IMERG products are available at finer spatial and temporal resolutions (0.1°/half-hourly) as compared to TMPA (0.25°/three-hourly).
Several research studies showed that the GPM-era multi-satellite precipitation products (e.g., IMERG) usually perform better than the TRMM-era products (e.g., TMPA). IMERG products show better performance than the TMPA-3B42 product in the estimation and detection of extreme precipitation over China [17], India [18], and Nepal [19]. IMERG was also shown to be marginally better than TMPA over the southeastern United States by Tan et al. [20], and they noticed better precipitation detection and reduction in errors when scaled up to larger area (from 0.1° to 2.5°) and longer time periods (from 0.5 h to 24 h). Sunilkumar et al. [21] evaluated IMERG-F estimates against rain-gauge-based gridded rainfall dataset (e.g., APHRODITE-2) over Japan, Nepal, and Philippines regions for 2014–2015. They showed that IMERG is able to capture diurnal to intraseasonal variability of precipitation and be improved in the detection of extreme precipitation events compared to the TMPA-3B42. The differences between IMERG and TMPA precipitation products are larger over the ocean as compared to land due to similar gauge adjustment [22]. Furthermore, the GPM-based GSMaP precipitation product showed similar performance as IMERG [23,24]. Based on statistical and hydrological assessments, Yuan et al. [25] demonstrated that IMERG-F (V05B) is better than TMPA-3B42 and GSMaP products over Myanmar. IMERG is also shown to be better than TMPA in orographic precipitation estimation over the Tibetan Plateau at multiple timescales [26]. These studies revealed the superiority of IMERG products over other contemporary or TRMM-era multi-satellite precipitation products.
Three Runs of IMERG products (with different release versions) were extensively evaluated over several parts of the globe. For instance, the IMERG-F V6 product was shown to be in good agreement with the radar-based Stage IV product in the representation of seasonal spatial distribution and diurnal cycle of mesoscale convective systems over the central and eastern US for the period of 2014–2016 [27]. Although the amplitude of the precipitation diurnal cycle has been overestimated by the IMERG suite, the near-real-time IMERG-L product has shown better performance than the IMERG-F product in the representation of precipitation diurnal cycle over Brazil during 2014–2018 as compared against 1261 rain gauge observations [28]. An evaluation of IMERG-F V6 product over China at a daily scale for 2014–2018 revealed that the multi-satellite product has limited capability in the detection of light rainfall of less than 5 mm day–1, which becomes further worse over the regions with complex winter precipitation phase due to large miss bias [29]. A comparison of three Runs of IMERG over the Sichuan basin of China for 2016–2018 revealed that all three Runs perform better during summer precipitation than autumn precipitation; however, IMERG-E underestimated wet precipitation substantially [30]. A comprehensive analysis of versions 5 and 6 products of the IMERG suite over Iran for June 2014 to June 2018 against 76 rain gauge observations showed an improvement in V6 than V5, especially for near-real-time products [31]. The IMERG-E product unexpectedly showed a higher correlation with rain gauge observations than IMERG-F over the arid regions of the United Arab Emirates for the period of 2015–2017 [32]. Better performance of IMERG-E than IMERG-L and IMERG-F was also reported for a tropical storm “Imelda” over the southeast coastal regions of Texas in the US when compared with Stage-IV radar precipitation estimates [33]. In addition, it was observed that IMERG-F V5 was better than V6 over the global mountainous regions in the estimation of light and heavy precipitation because V6 utilizes total column water vapor to derive a motion vector [34]. Although the IMERG-F V6 product was shown to be one of the best multi-satellite precipitation products over the Hindu Kush mountains of Pakistan, it has large uncertainty in the detection of light and moderate precipitation events [35].
However, there are limited studies to comprehensively evaluate the IMERG precipitation products over India owing to distinct topographical characteristics (e.g., Figure 1a). IMERG-F showed notable improvement over TMPA-3B42 in systematic error at basin scale over India across all precipitation intensities [36]. In addition, IMERG-F showed better performance than TMPA-3B42 at a sub-daily scale across India [37]. However, similar to other satellite precipitation products, IMERG has a rather larger bias over the orographic regions of the Western Ghats and foothills of the Himalayas [38]. But, all these studies over India utilized an earlier version of IMERG products (e.g., V4 or V5) for a limited period (e.g., one monsoon season or few specific rain events). IMERG products were upgraded to V06B in 2020, and IMERG-F was retrospectively processed for TRMM-era as well. As IMERG V06B supersedes all prior IMERG versions [39], it becomes imperative to assess the accuracy of the recent version of IMERG products for the Indian monsoon precipitation. Hence, the objectives of this study are as follows:
(1)
To quantify error characteristics of V06B near-real-time (IMERG-E and IMERG-L) and research (IMERG-F) products;
(2)
To assess the changes in error characteristics of the IMERG-F product from V05B to V06B;
(3)
To assess the consistency of error characteristics of IMERG-F V06B for pre-GPM and GPM periods.
This study is carried out over India at different spatial scales such as at the grid scale, sub-regional scale, and country scale for the southwest monsoon season spanning from June to September.

2. Data and Methods

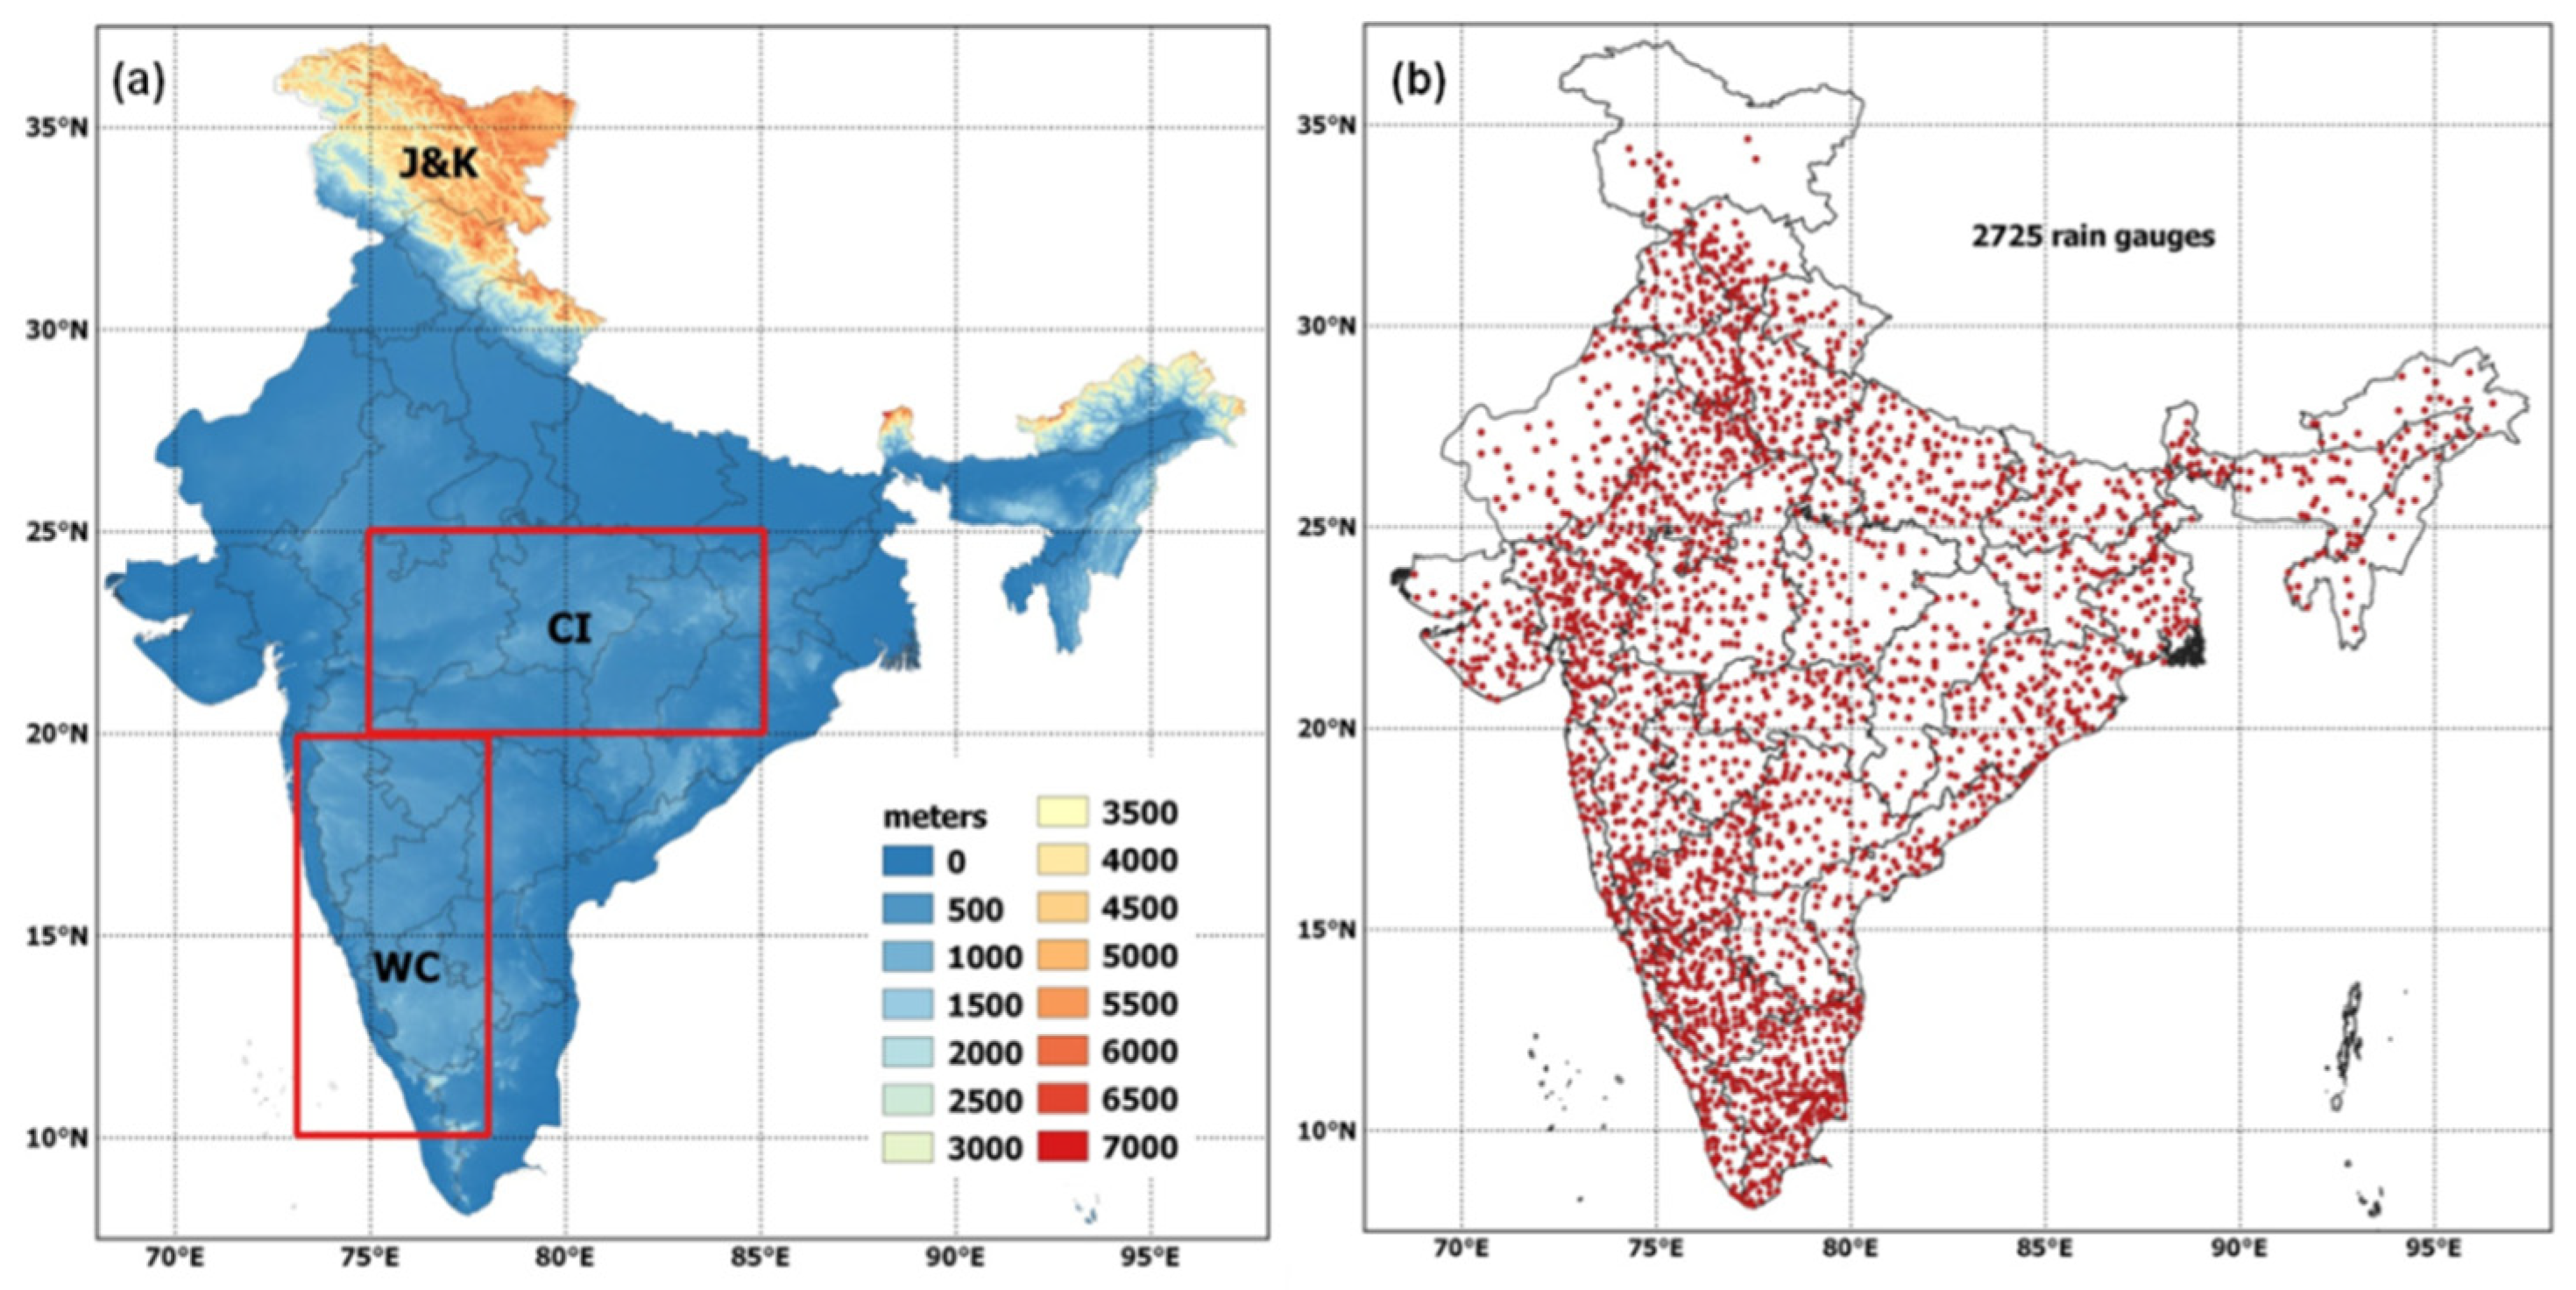
2.1. Rain Gauge Data

India has a network of about 7000 rain gauges installed and maintained by the India Meteorological Department (IMD). A daily gridded rainfall dataset using these rain gauge observations has been prepared by the IMD [40]. This gridded rain-gauge-based rainfall dataset is developed using inverse distance weighted interpolation method after rigorous quality check and also takes care of barriers and directional effects. This precipitation dataset is available at 0.25° spatial resolution since 1901 and reproduces the mean southwest monsoon rainfall features and spatial gradient of orographic rainfall more realistically and comparable with other existing daily gauge-based rainfall data sets such as earlier versions of IMD gridded products with coarser spatial resolutions and the Asian Precipitation-Highly Resolved Observational Data Integration Towards Evaluation of the Water Resources (APHRODITE) product [40]. Earlier versions of IMD gridded products and APHRODITE use a fewer number of rain gauges as compared to this gridded precipitation product. This daily gridded dataset showed a very high correlation coefficient of 0.99 and root mean square error (RMSE) less than 1 mm day−1 in the southwest monsoon precipitation estimation as compared to APHRODITE and coarser spatial resolution IMD datasets. More detail about the procedures of development of this gridded rainfall dataset, such as quality control, spatial interpolation, rain gauge distribution, and its variability, can be found in Pai et al. [40]. This rain-gauge-based daily gridded rainfall dataset for the monsoon period of 2010–2017 is considered as a reference in this study. The spatial distribution of rain gauges for a typical day is shown in Figure 1b. The rain gauge density is highest over the southern parts of the country, while northern and northeastern parts of India have rather poor rain gauge density. It is also to be noted that the number of daily reporting rain gauges varied with time, and it is between 2500 and 3000 during the study period. Although this gridded rain-gauge-based rainfall dataset might have some uncertainties due to spatial interpolation over rain gauge sparse area, it would mitigate the spatial representativeness error due to comparison of point observations from rain gauges and larger footprints of satellites. This gridded daily rain-gauge-based rainfall data has been widely used for the evaluation of multi-satellite precipitation products over India and for hydrometeorological and climatological applications [13,23,38,41,42,43,44,45,46].

2.2. IMERG Data

The IMERG is a unified US algorithm that benefits from CMORPH, PERSIANN, and TMPA algorithms [15,16]. IMERG suite provides global precipitation estimates at half-hourly interval and at 0.1° spatial resolution. There are three Runs of this product intended for different user requirements based on latency and accuracy. Early Run or IMERG-E is available after 4 h of acquisition time and relevant for flash flooding, whereas Late Run or IMERG-L product is available after 14 h of satellite acquisition time and is supposed to be good for crop forecasting. Final Run or IMERG-F is intended for research and is available after 3.5 months. IMERG-F utilizes monthly rain gauge information over land from the Global Precipitation Climatology Center (GPCC) for bias adjustment. However, the number of rain gauges utilized in IMERG-F through GPCC is less than 300. It indicates that IMERG-F uses about one-tenth of the total number of rain gauges used in the IMD rain-gauge-based gridded rainfall data. In addition, IMERG-F uses monthly rain gauge observations and further downscales the precipitation estimates to half-hourly scale. In V6, IMERG has been computed for the first time for both TRMM- and GPM-era. Thus, IMERG V6 is available since June 2000. A detailed description of the changes in V6 from V5 is provided by Huffman et al. [39]. Version 06B (V6 hereafter) of half-hourly IMERG-E, IMERG-L, and IMERG-F, and version 05B (V5 hereafter) of IMERG-F for the southwest monsoon season of 2014–2017 has been used in this study. Additionally, IMERG-F V06B for June to September of 2010–2013 has been used to compare the changes in error characteristics during pre-GPM (e.g., 2010–2013) and GPM (2014–2017) periods. All IMERG products (e.g., near-real-time versus research product, V5 versus V6 research product, and pre-GPM versus GPM periods) have been considered for an equal 4-year period for consistency.

2.3. Evaluation Methodology

In India, daily rainfall is computed by accumulating rainfall observations ending at 0300 UTC. For a fair comparison, daily rainfall from half-hourly IMERG products has been computed using the same time convention. As spatial resolution of the IMD gridded gauge-based rainfall data is 0.25°, daily IMERG datasets have been re-sampled at the same spatial resolution of 0.25° for the study period, and daily precipitation across India is extracted. As India receives precipitation in the form of rainfall alone during the southwest monsoon season, the terms “rainfall” and “precipitation” were interchangeably used in this manuscript.
In order to quantify the error characteristics of IMERG products against the IMD rain-gauge-based dataset, several continuous and categorical error metrics were used. Table 1 outlines the definitions/formulae of continuous error metrics used in this study to quantify the accuracy of IMERG in precipitation estimation. Mean, bias, correlation coefficient, and RMSE are the most commonly used continuous error metrics for the evaluation of any satellite-based precipitation product. Correlation coefficient has no unit, whereas mean, bias, and RMSE have been expressed in mm day−1. To express bias and RMSE in percentage, these quantities have to be normalized against the observed mean (e.g., rain-gauge-based data) and multiplied by 100. Coefficient of variation (CV) is used to compare the temporal variability of monsoon precipitation from IMERG and IMD datasets. Moreover, modified Kling–Gupta efficiency (KGE) has been used to assess the reliability of IMERG products for hydrological applications. This KGE score combines correlation coefficient, bias, and variability and has proven to be very useful statistical metric in hydrology [47]. Furthermore, the errors in the satellite-based precipitation estimates can be decomposed into systematic and random components, which is vital for algorithm development and improvement [42,48]. In this study, both systematic and random components of errors have been computed using Equations (1) and (2), respectively.
( E r r o r ) S y s t = i = 1 N ( S i   * G i ) 2 N
( E r r o r ) R a n d = i = 1 N ( S i S i * ) 2 N
where S i   * = a × G i + b with a and b be the slope and intercept of a linear regression error model, respectively [48].
For the quantification of skill of IMERG products in the detection of monsoon rainy days, four categorical skill metrics defined in Table 2 have been used. Daily monsoon precipitation of less than 2.5 mm is considered as non-rainy days for India as per the IMD convention.

3. Results and Discussion

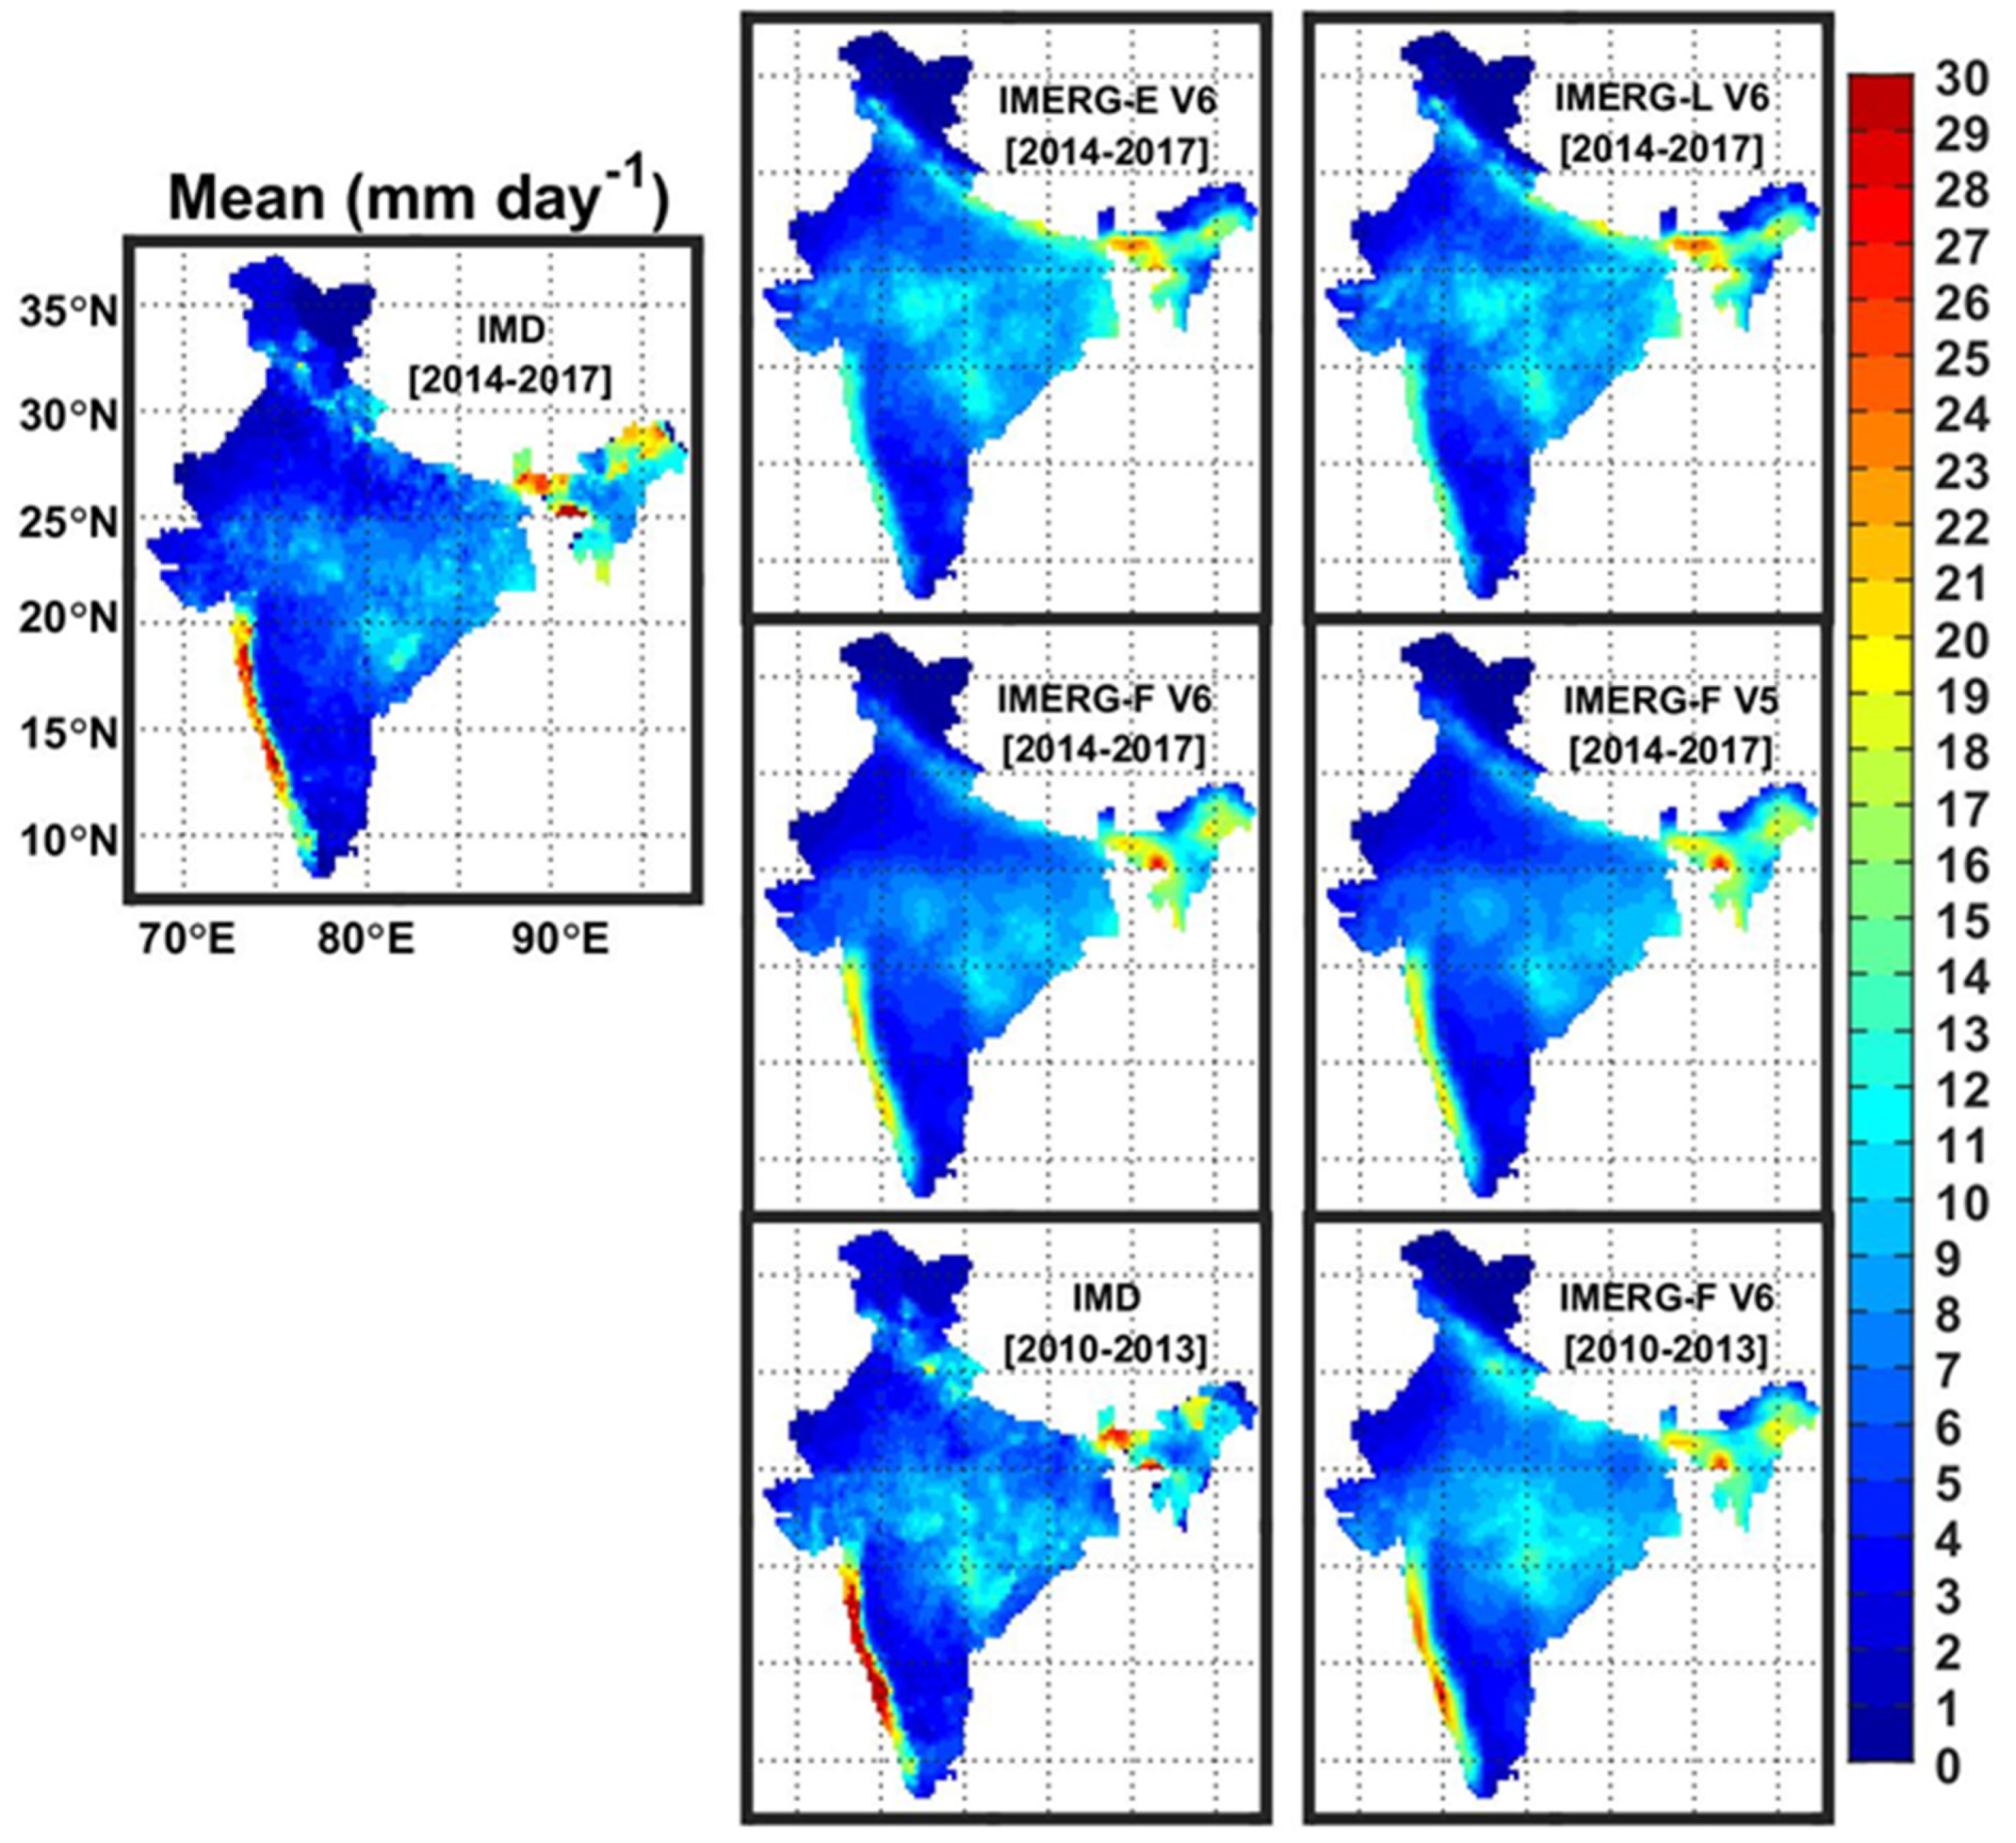
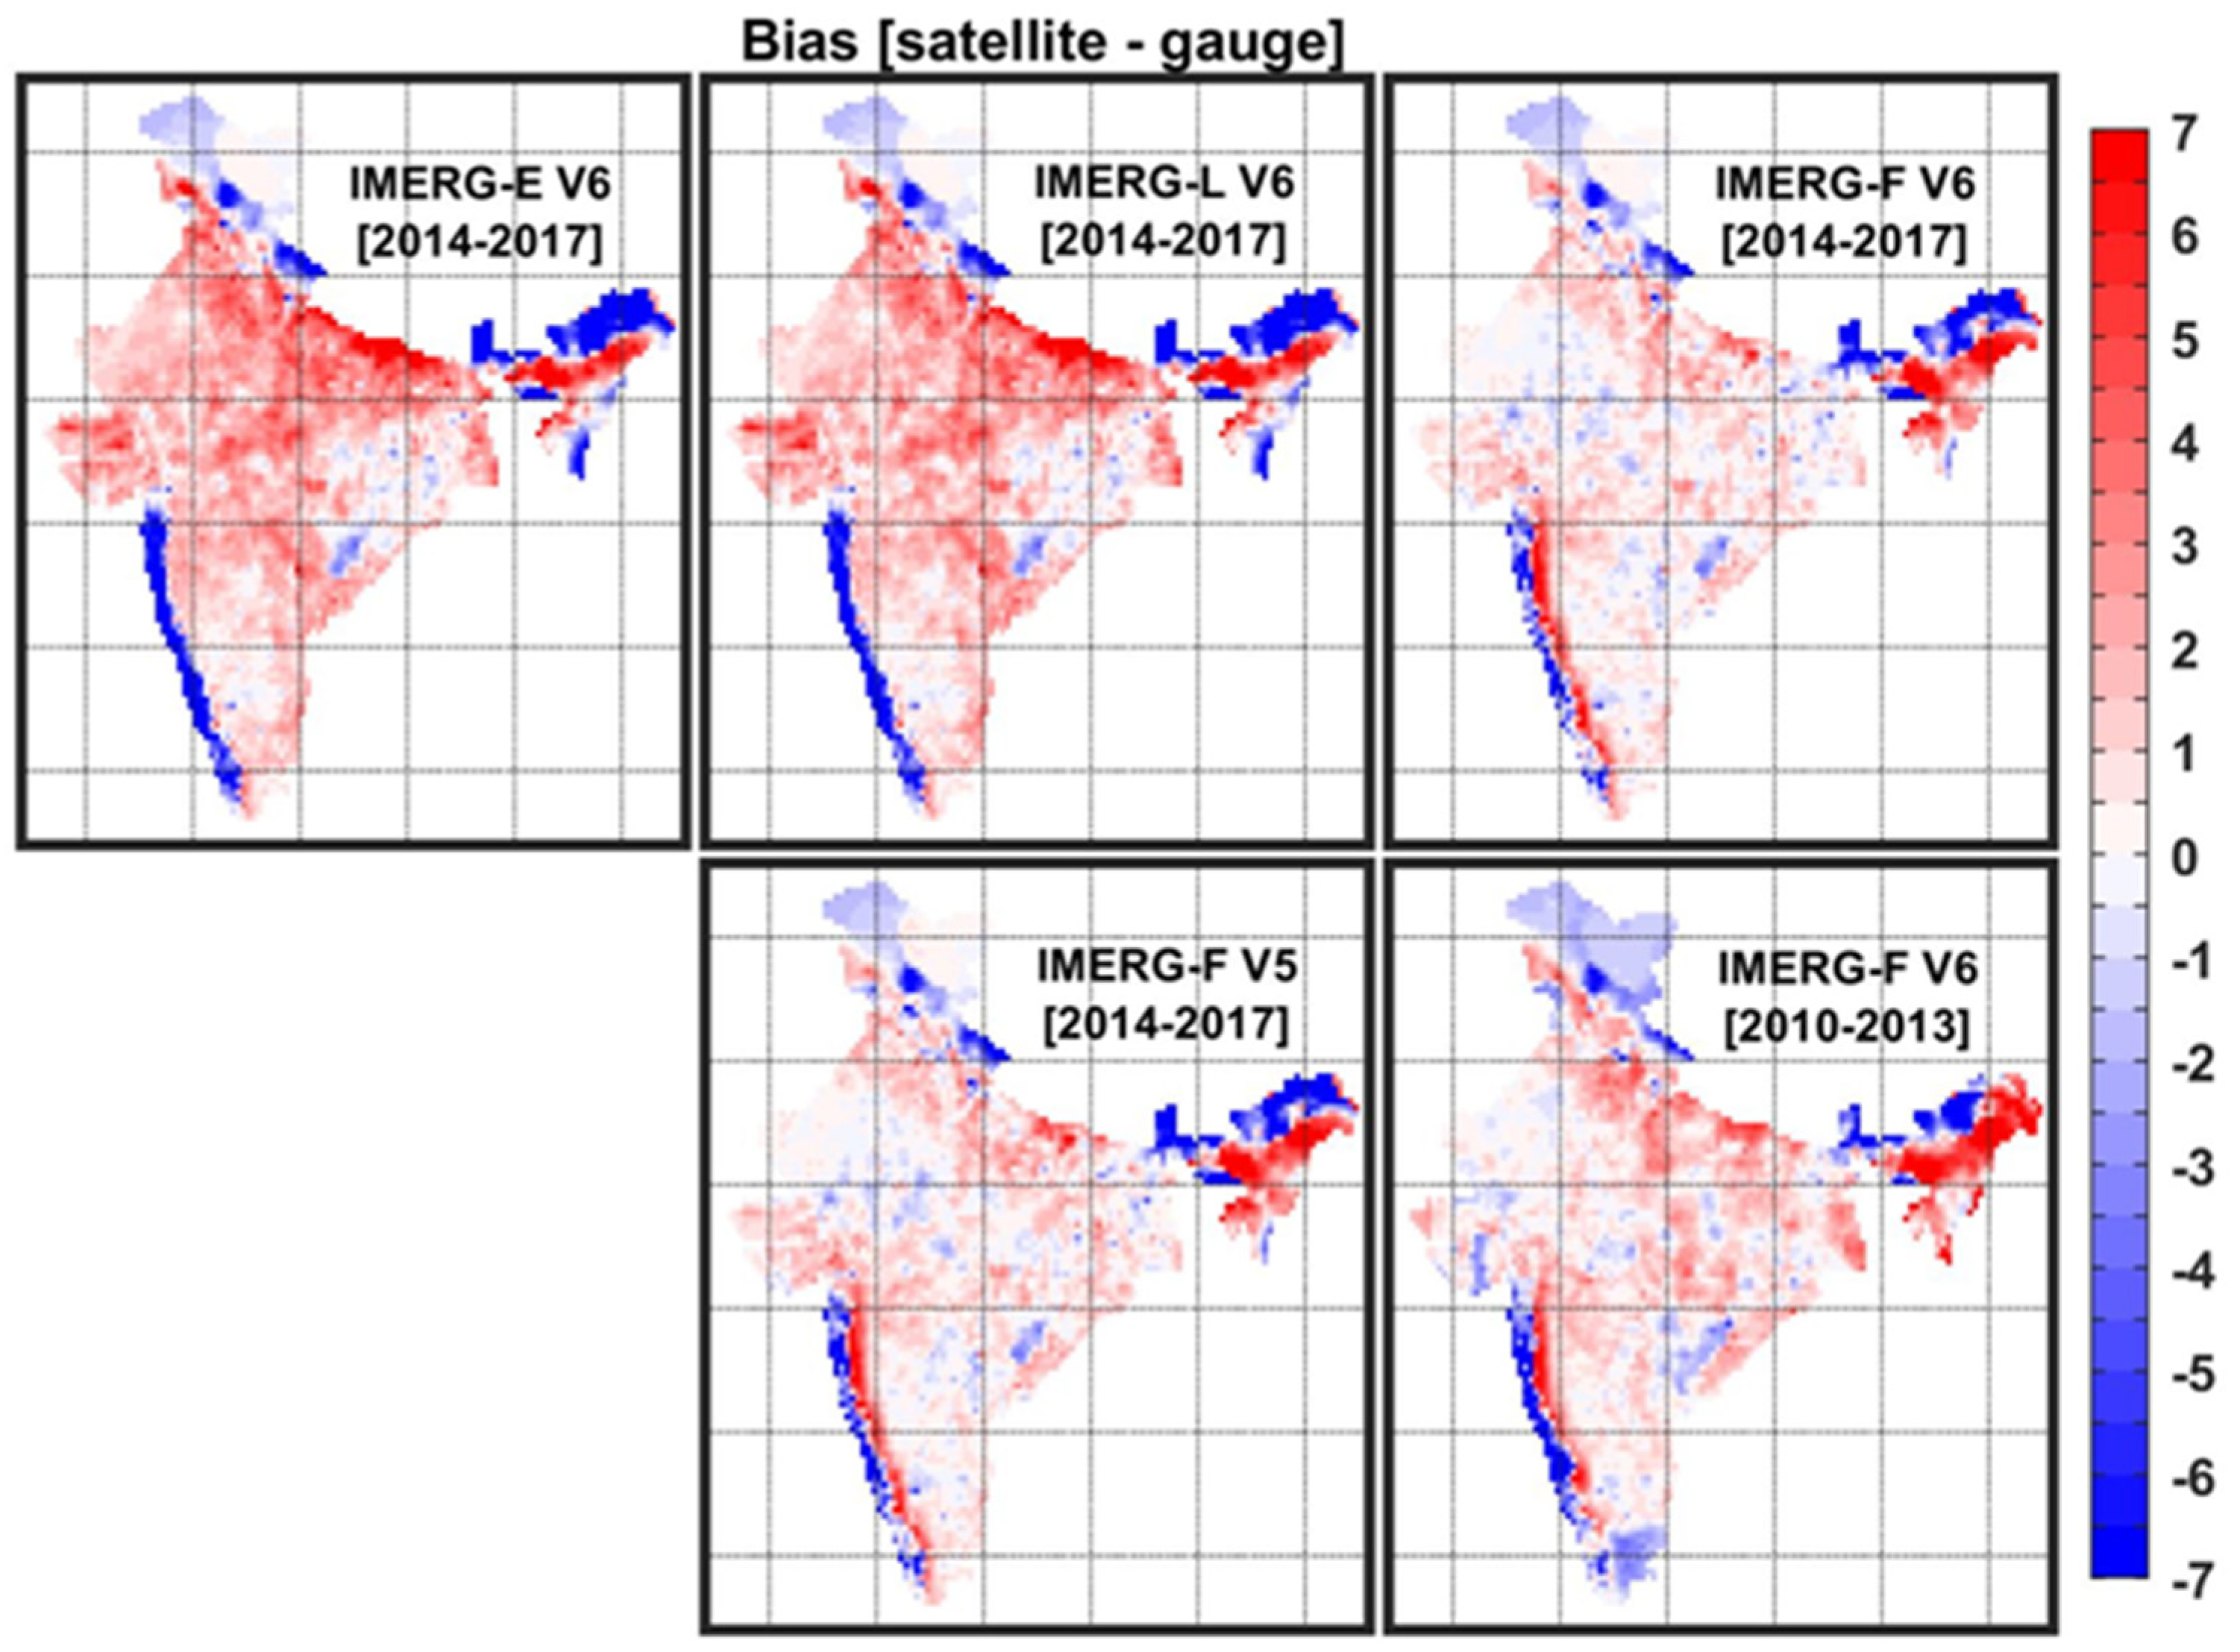
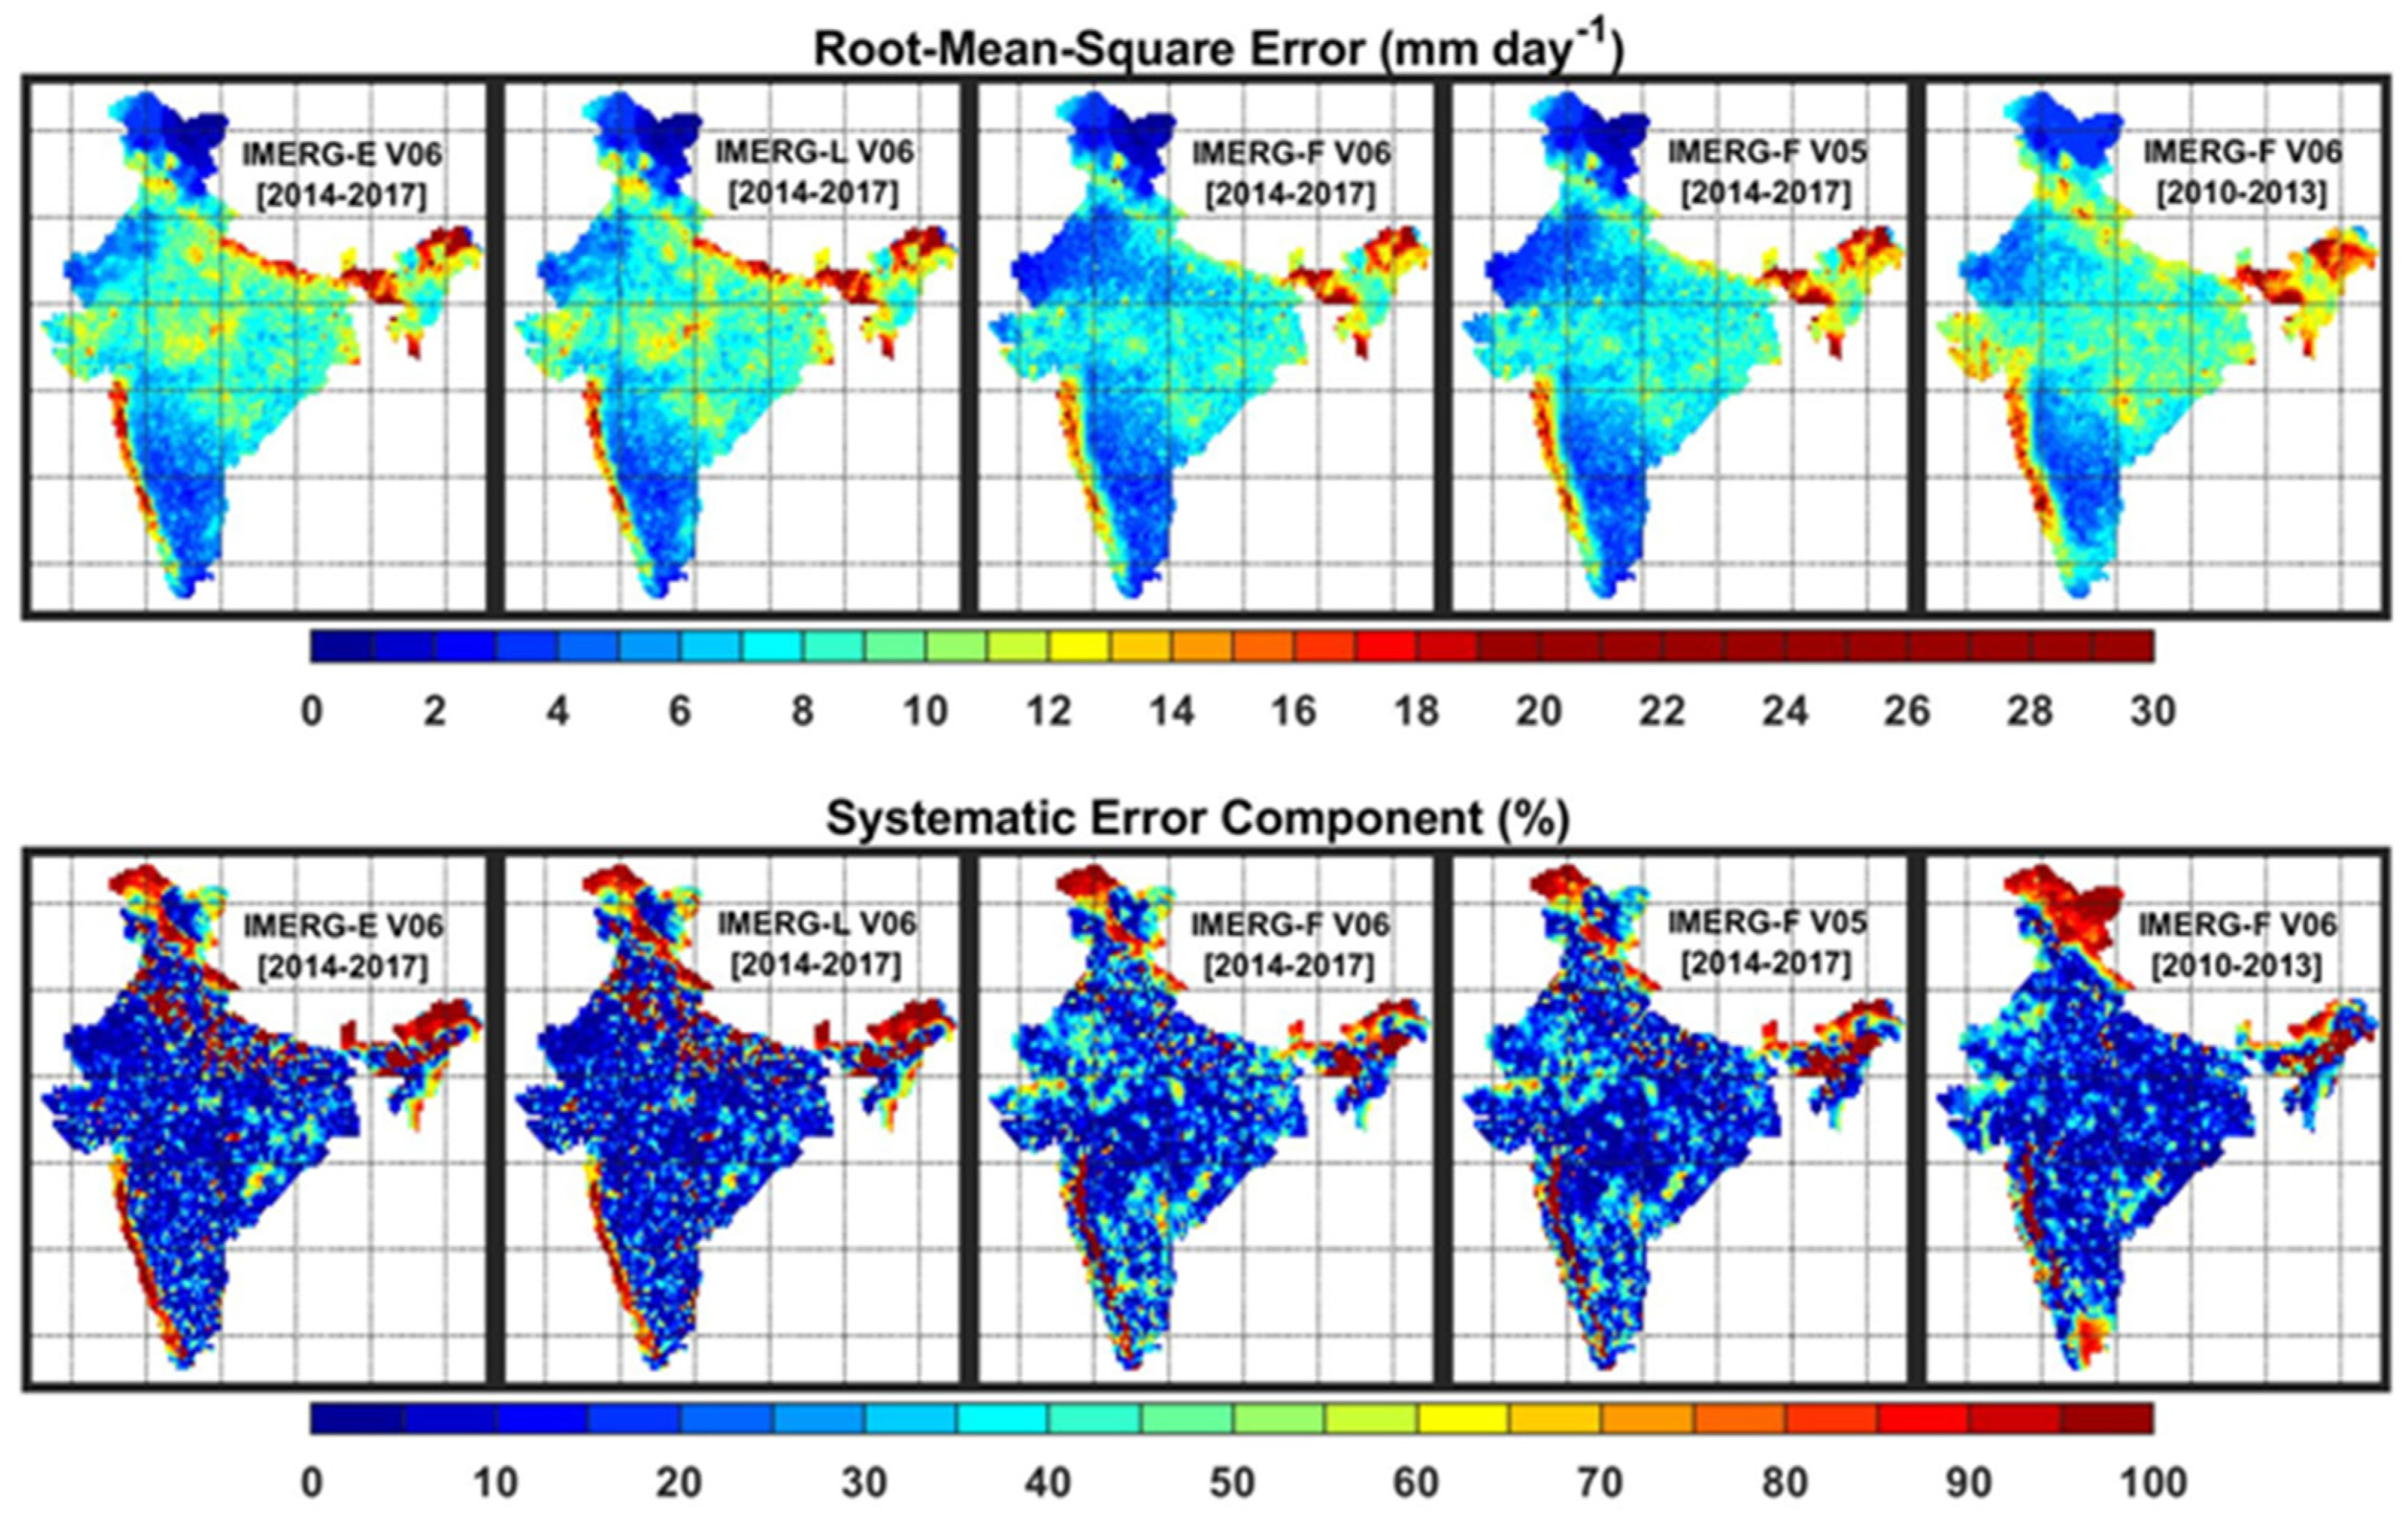
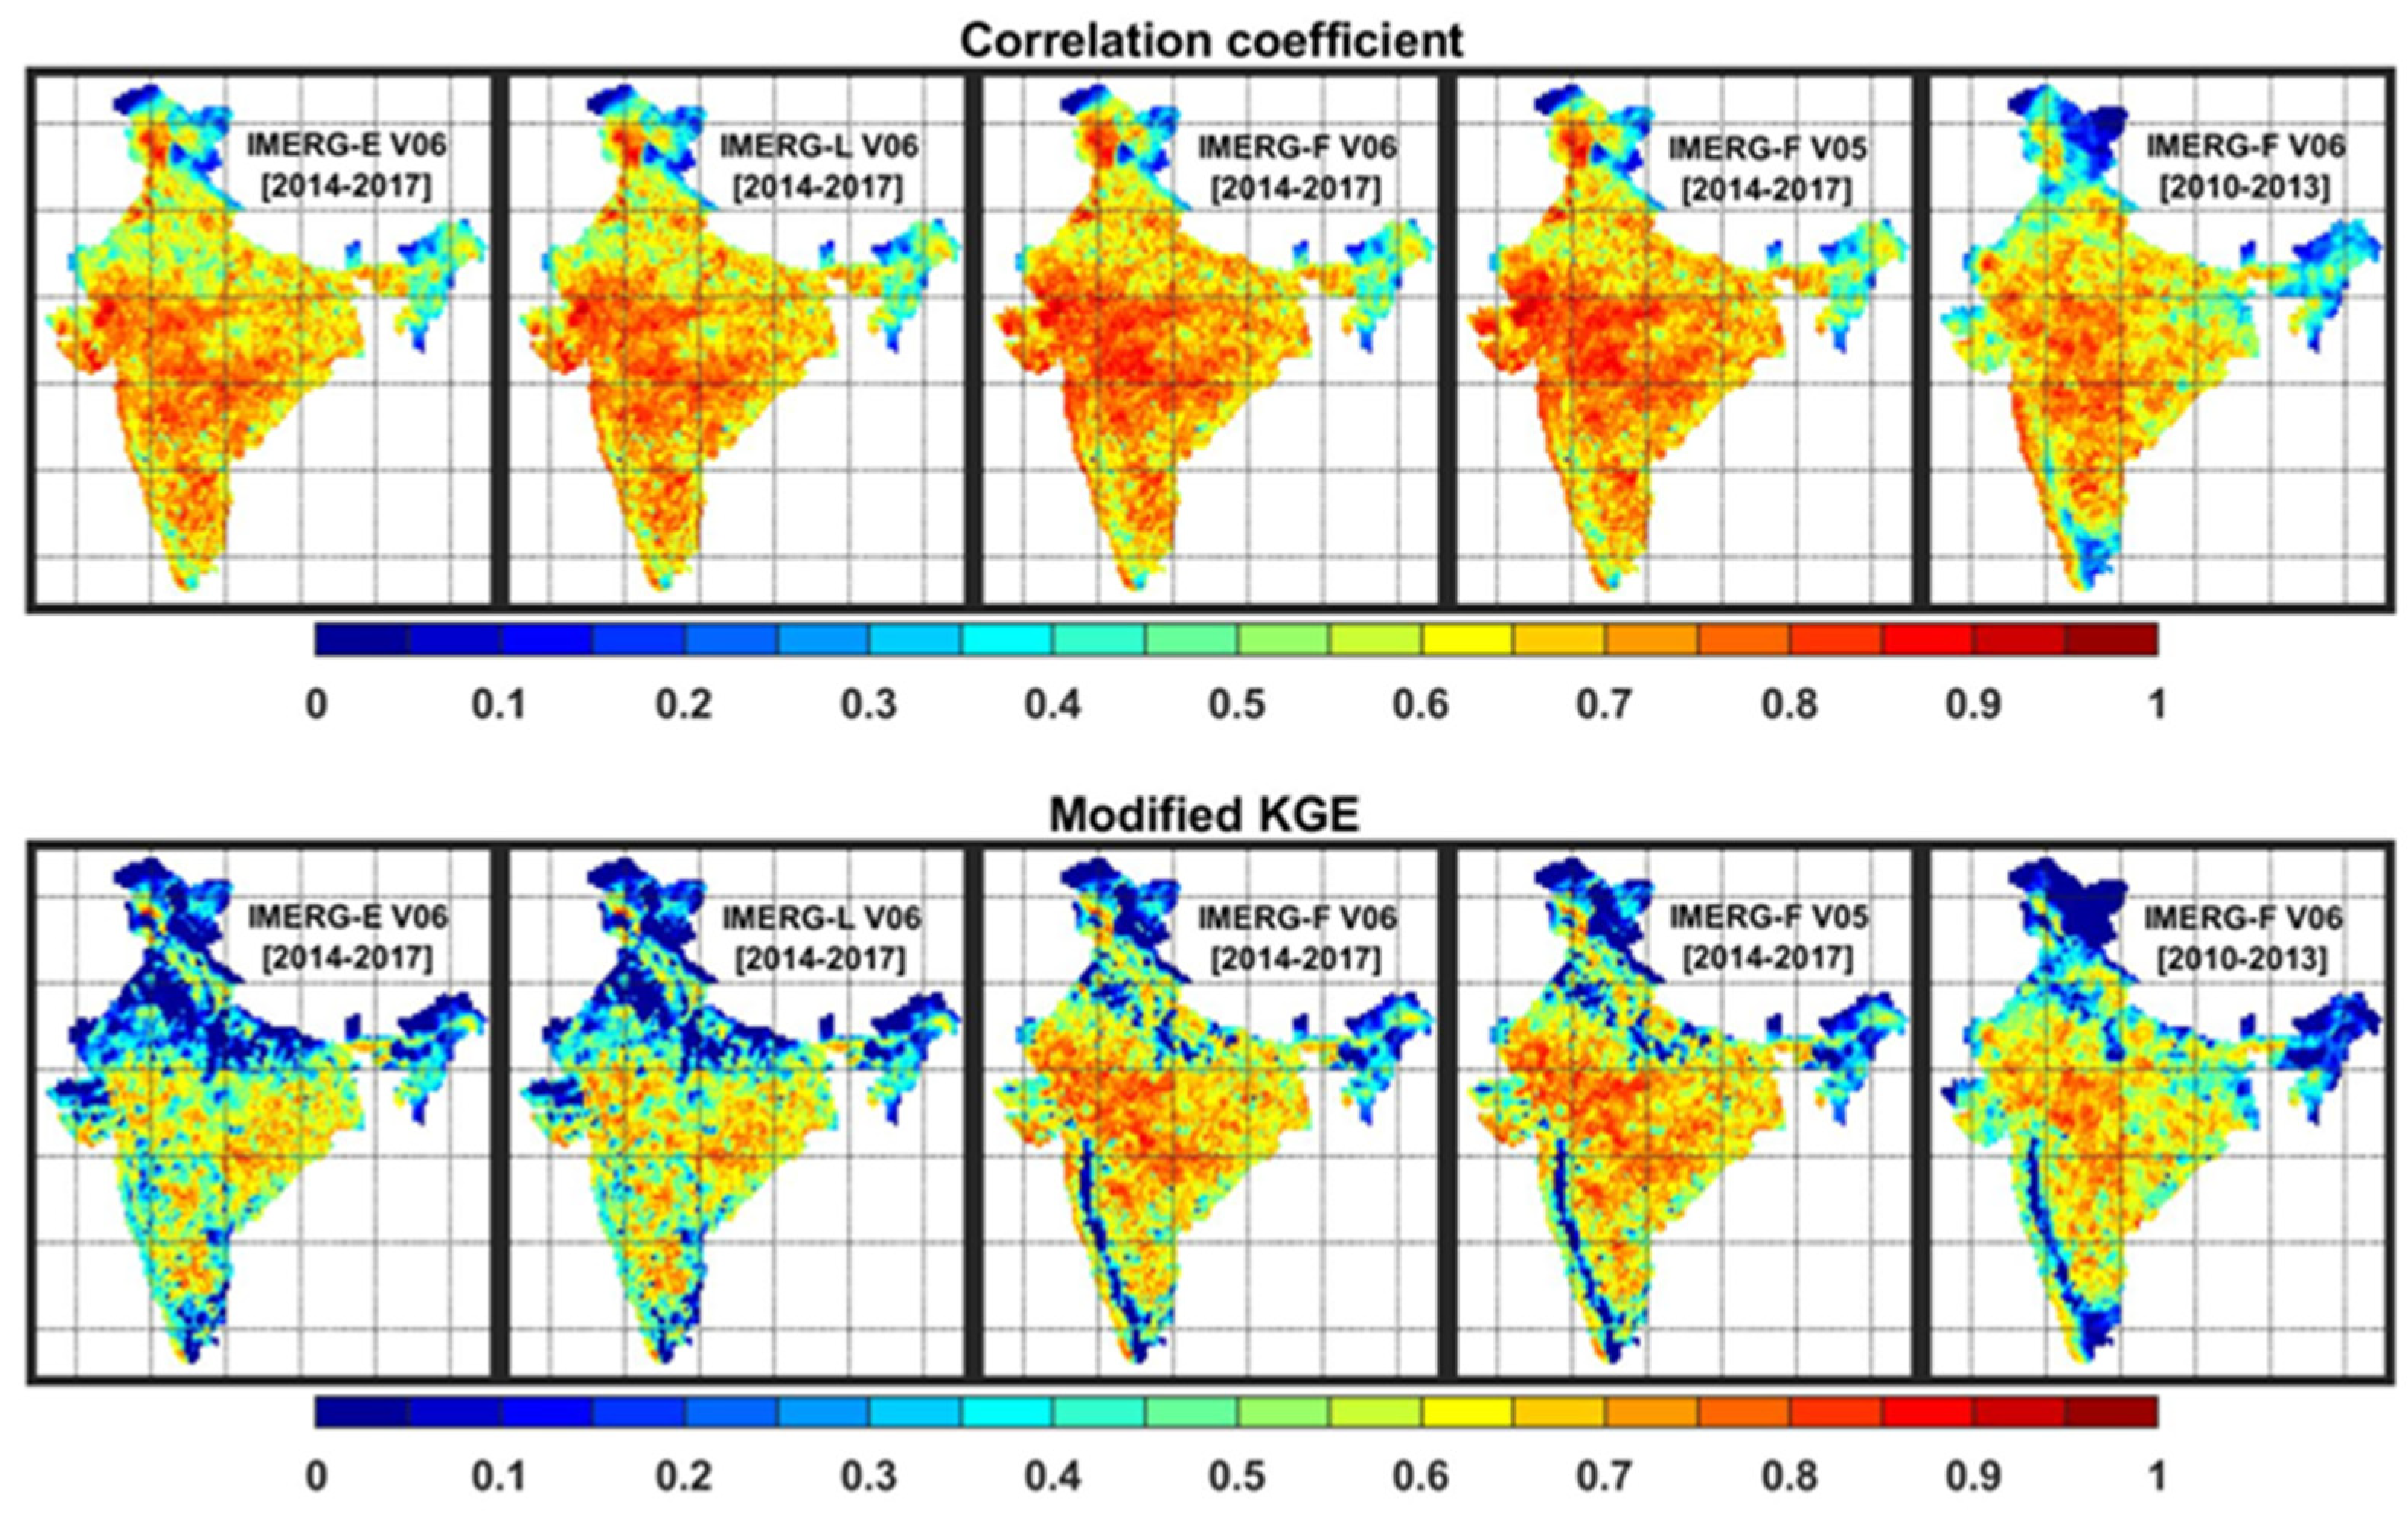
3.1. Spatial Distributions of Continuous Error Metrics

As India receives about three-fourths of its annual precipitation from the southwest monsoon rainfall and it exhibits substantial spatial and temporal variability [49], this study is restricted to the monsoon rainfall spanning from June to September. Figure 2 shows the spatial distributions of 4-year mean monsoon rainfall from the IMD rain-gauge-based data and IMERG estimates. In order to compare the error characteristics in IMERG-F V6 during pre-GPM and GPM periods, monsoon precipitation from the rain-gauge-based dataset and IMERG-F V6 product for 2010–2013 has also been shown in the lower panel of the figure. The well-known large-scale features of the southwest monsoon rainfall such as higher rainfall over the west coast and northeast India, moderate rainfall over central India and foothills of the Himalayas, and low or negligible rainfall over the southeast peninsula and western parts of India are captured reasonably well by the IMERG estimates qualitatively. However, the magnitude of monsoon rainfall in IMERG estimates differs from the rain-gauge-based data. Near-real-time IMERG products (e.g., IMERG-E and IMERG-L) generally show higher mean rainfall than the research product (e.g., IMERG-F). A 20-year comparison of Early and Final Runs of IMERG V6 showed that IMERG-E provides about 12% higher annual rainfall than IMERG-F product at a global scale [50]. The differences between both products were found to be small in cold regions and large in arid regions. Additionally, IMERG-E measures 33% higher extreme precipitation rates than IMERG-F.
Figure 3 presents the bias in the IMERG estimates as compared to the IMD rain-gauge-based dataset. Near-real-time IMERG products (e.g., IMERG-E and IMERG-L) show a larger magnitude of bias as compared to IMERG-F estimates. IMERG-E and IMERG-L show similar bias features such as underestimation of the monsoon rainfall over the west coast, northeast, and northern India, and overestimation over the remaining regions. However, the magnitude of the bias is about 0.5–1 mm day−1 less in IMERG-L than IMERG-E across the country. The bias features are similar but with lower magnitude in IMERG-F estimates as compared to IMERG-E and IMERG-L over most parts of the country except along the west coast. The magnitude of bias in IMERG-F V6 is about 4 mm day−1 less than IMERG-E and IMERG-L estimates. However, IMERG-F V6 does not show any notable improvement in bias from IMERG-F V5. It can also be seen that magnitude of the bias is higher by about 4 mm day−1 in IMERG-F V6 over the west coast and southernmost parts of the country during the pre-GPM period (e.g., 2010–2013) than the GPM period (2014–2017).
Unlike IMERG-E and IMERG-L estimates, the IMERG-F product shows an underestimation of monsoon rainfall along the west coast (location shown in Figure 1a) followed by an overestimation. The topography, mean monsoon rainfall from the rain-gauge-based dataset, and bias in IMERG-F V6 product over the west coast for 2014–2017 are shown in Figure 4. The coastal region has very low elevation, and elevation increases drastically eastward, known as the Western Ghats mountain range. The rain-gauge-based dataset shows that higher rainfall occurs over the coastal belts (upto about 100 km to the coast) and becomes very less or negligible eastward. The windward side of the Western Ghats receives higher monsoon rainfall associated with low-level monsoon jet and orography, whereas the leeward side receives very low rainfall [49]. Heavy rainfall activities along these coastal areas during the southwest monsoon season are also associated with offshore troughs/vortices and offshore convective systems linked to atmospheric conditions over the equatorial Indian Ocean [51,52]. However, warm rain events dominate over the Western Ghats due to rather shallower clouds [53], and IMERG products have limited accuracy in warm precipitation estimation than ice-initiated precipitation [54]. As IMERG-F utilizes monthly rain gauge observations for bias correction, the magnitude of the bias is reduced as compared to near-real-time products. However, highly varied topography and rather coarser resolution of rain-gauge-based input dataset (e.g., GPCC) to the IMERG-F introduce contrasting bias features in the IMERG-F product along the west coast. Additionally, it was shown that rain gauge correction has no impact on the accuracy of IMERG V6 products over the global complex terrain areas [34]. The distinct diurnal cycle of precipitation over the coastal and complex topographic regions associated with local-scale effects is not adequately captured by the satellite-derived precipitation products, and this error propagates in the daily precipitation estimates [55,56]. The combined use of satellites, rain gauges, and weather radars would be beneficial for better precipitation estimation over such regions [57,58,59].
The spatial distributions of CV from the rain-gauge-based dataset and IMERG products across India for the southwest monsoon season are illustrated in Figure 5. As expected, a larger magnitude of CV over the lower mean monsoon rainfall regions and smaller CV over the higher mean rainfall regions are depicted by both rain-gauge-based and multi-satellite products qualitatively. However, three Runs of IMERG V6 generally show a smaller magnitude of CV by 50–90% as compared to the rain-gauge-based product. IMERG-F V5 appears to be marginally better than IMERG-F V6 in terms of CV. Moreover, CV depicted by IMERG-F V6 during the pre-GPM period, is closer to observations as compared to the GPM period.
The spatial distributions of RMSE and the systematic error component for IMERG products as compared to the rain-gauge-based dataset are presented in Figure 6. As the sum of systematic and random error components is always 100%, the random error component can be determined by visualizing the systematic error component. Therefore, the random error component has not been shown in the figure. In general, the magnitude of RMSE in IMERG estimates is larger over the higher mean rainfall regions and vice versa. However, IMERG-E and IMERG-L show higher RMSE than the IMERG-F product. Although IMERG-F V6 does not show any notable improvement in RMSE than IMERG-F V5, the magnitude of RMSE is notably smaller in IMERG-F V6 during the GPM period (2014–2017) than the pre-GPM period (2010–2013). Larger systematic errors in IMERG products can be seen primarily over the orographic regions of the west coast, northeast, and northern India. Near-real-time IMERG products have the smallest systematic error as compared to the IMERG-F product. However, IMERG-F V6 has a larger systematic error than IMERG-F V5. Additionally, the systematic error is smaller in IMERG-F V6 across the country except for the southeast peninsular India during the pre-GPM period than the GPM period. This analysis suggests that the IMERG-F V6 product needs a suitable bias correction before its integration in any specific application, particularly for the GPM period. However, it would be interesting to examine the sources of errors in IMERG products using sub-daily scale precipitation analysis. Few studies over the US region showed that passive microwave sensors provide the most skillful estimates to IMERG, whereas infrared estimations have rather poor skill [60,61,62].

3.2. Error Metrics at the All-India Scale

In this section, error characteristics of IMERG products have been assessed at all-India scale against the IMD rain-gauge-based dataset. Daily all-India mean rainfall estimates for the monsoon season (e.g., June–September) from both multi-satellite and rain-gauge-based data have been compared for the 4-year period. Table 3 shows the different error metrics for IMERG products at the all-India scale. Bias and RMSE are normalized with respect to the mean rainfall obtained from the rain-gauge-based dataset and presented in percentage. All IMERG products overestimate all-India mean monsoon rainfall as compared to the rain-gauge-based dataset. Bias in near-real-time IMERG products is about 2–3 times more than the research product. Biases in all-India daily mean monsoon rainfall are 10–11% in near-real-time IMERG products, whereas it is about 3% in the research product for 2014–2017. IMERG-E shows about 1% higher bias than IMERG-L. IMERG-F V6 has a marginally larger bias than IMERG-F V5. However, IMERG-F V6 exhibits about double bias during the pre-GPM period (2010–2013) than the GPM period (2014–2017). Bias in all-India daily mean monsoon rainfall in IMERG-F V6 is about 3% during the GPM period, whereas it is about 6% during the pre-GPM period. Temporal CV indicates that the IMERG-F V6 product is in good agreement with rain-gauge-based dataset in the detection of daily rainfall variability, while near-real-time products slightly overestimate the all-India daily mean rainfall variability. The correlation coefficient, RMSE, and KGE clearly indicate that IMERG-L is marginally better than IMERG-E, and IMERG-F V6 is superior to near-real-time IMERG products. Normalized RMSE is the minimum of about 17%, and correlation coefficient and KGE are the largest for the IMERG-F V6 during the GPM period. The improvement in these metrics is marginal in IMERG-F V6 as compared to IMERG-F V5. Moreover, a better performance of IMERG-F V6 during the GPM period than the pre-GPM period is also evident. These results clearly indicate that IMERG-F V6 during the GPM period performs better than near-real-time, V5, and pre-GPM IMERG period products at all-India scale.
Figure 7 shows the spatial distributions of correlation coefficient and KGE for IMERG products as compared to the rain-gauge-based dataset across India. A smaller correlation coefficient in IMERG products has generally been found over the northern and northeastern parts of India. However, the research product of IMERG shows a higher correlation coefficient than near-real-time products. Both V5 and V6 estimates of IMERG-F show a similar correlation coefficient, but IMERF-F V6 has a larger correlation with the rain-gauge-based dataset during the GPM period than the pre-GPM period. The KGE score combines correlation, bias, and variability and gives equal weightage to each of the components. Therefore, a smaller KGE score has been seen in IMERG products over larger parts of the northern and northeastern parts of the country. It is also to be noted that the rain gauge density over the northern and northeastern parts is rather poor [63], and rain gauge density plays a key role in the evaluation of any satellite-based precipitation product. Therefore, the error metrics over these sub-regions might have larger uncertainty. The pattern of KGE is similar to the bias pattern over the west coast in IMERG-F estimates. IMERG-F shows better performance than IMERG-E and IMERG-L. Overall, both near-real-time IMERG products have similar error characteristics in precipitation estimation. There is no noticeable change in error metrics in IMERG-F V6 as compared to V5. However, IMERG-F V6 exhibits better performance during the GPM period (2014–2017) than the pre-GPM period (2010–2013).
Since monsoon rainfall shows prominent interannual variability, bias and RMSE in all-India monsoon rainfall from IMERG-F V6 for 2010–2017 has been computed for each year separately to investigate the reason for larger bias and error in the multi-satellite estimates during the pre-GPM period than the GPM period. Figure 8 presents yearly variations in all-India mean monsoon rainfall from both IMERG-F V6 and IMD rain-gauge-based data and bias and RMSE in the IMERG estimates. IMERG systematically overestimates all-India mean rainfall except for 2017. Bias is the largest during 2010 and 2015, whereas RMSE is the largest during 2010 and 2012. It indicates that bias and RMSE are not always linearly dependent. Much less bias during 2016 and 2017 with an opposite sign as compared to other years leads to smaller bias in IMERG-F V6 during the GPM period than the pre-GPM period. However, bias and RMSE in the IMERG-F V6 estimates do not show any clear evidence of their association with interannual variations of the all-India monsoon rainfall.

3.3. Spatial Distributions of Categorical Skill Metrics

In this section, the capabilities of IMERG products have been assessed for the detection of rainy days over India. During the southwest monsoon period, daily rainfall less than 2.5 mm is considered as a non-rainy day according to the IMD convention. Therefore, a threshold of 2.5 mm day−1 is considered for the detection of rainy days from both multi-satellite and rain-gauge-based data. Figure 9 shows the spatial distributions of POD and FAR in IMERG products in the detection of rainy days across India, whereas FBI and PSS are shown in Figure 10. In general, higher POD and PSS and smaller FAR can be seen in IMERG products across the country except for few regions. IMERG products show smaller POD, FBI, and PSS and larger FAR over the northern India. Both near-real-time and research products show similar characteristics in the detection of rainy days. However, IMERG-F V6 shows marginal improvement over the IMERG-F V5 product. IMERG-F V6 shows notably better performance in rainy day detection during the GPM period than the pre-GPM period. Interestingly, POD is relatively smaller and FBI is rather larger in the IMERG suite over the orographic regions than the plain regions. It clearly indicates that satellite-based product performs better over the plain regions than orographic regions in the detection of monsoon rainy days. FAR in the IMERG suite is smaller over the windward side of the Western Ghats than the leeward side, but the opposite is true in the case of PSS. Over the hilly northern part of the country (Jammu and Kashmir region), IMERG products show exceptionally small POD, FBI, PSS, and large FAR as compared to the rain-gauge-based dataset. However, rain gauge density is meager over this high altitude region, and the rain-gauge-based gridded data might have larger uncertainty over this region.

3.4. Error Metrics for Different Rainfall Intensity Intervals

In this section, domain-mean daily monsoon rainfall from the IMERG products has been evaluated against the rain-gauge-based dataset for different rain intensity intervals. IMD categorizes daily monsoon rainfall intensity into seven intervals. In this study, very light rainfall (or traces) of less than 2.5 mm day−1 is not considered due to the sensitivity of precipitation-related satellite sensors. Additionally, two different groups, namely, very heavy and extremely heavy rainfall intervals, have been grouped as one category for this study due to rather less number of such events. Therefore, five rainfall intervals defined in Table 4 have been used in this study. The evaluation is carried out for domain-mean rainfall for all-India, central India (20°–25° N and 75°–85° E) and west coast (10°–20° N and 73°–78° E). Two domains, namely, central India and the west coast, are shown in Figure 1a. Central India and the west coast receive a fairly good amount of southwest monsoon rainfall, and rain gauge density over these sub-regions is good enough (e.g., Figure 1b). Central India is a plain region, whereas the west coast is an orographic region. Central India receives substantial monsoon rainfall associated with large-scale features such as monsoon trough, lows or/and depressions, whereas the west coast monsoon precipitation process is a combination of both large-scale and local-scale features. As poor rain gauge density leads to larger uncertainty in the error characteristics [63], northeast India is not considered. Only three IMERG estimates (e.g., V6 of IMERG-E, IMERG-L, and IMERG-F) for 2014–2017 have been considered for this analysis.
Figure 11 presents the frequency of daily monsoon rainfall of distinct intensity intervals and their contributions to the total monsoon rainfall for all-India and two sub-regions. The frequency of light and moderate rain is altogether about 55–60% based on the rain-gauge-based data, which are 40–42% from the IMERG estimates. Both near-real-time and research products of IMERG V6 underestimate the frequency of light to very heavy rainfall over all-India and two sub-regions. This is due to considerable overestimation of frequency of very light rainfall of less than 2.5 mm day−1 by the IMERG estimates as compared to the rain-gauge-based dataset. Although the frequency of heavy to very heavy rainfall is 2–3%, it contributes 20–23% of the total monsoon rainfall as inferred from the rain-gauge-based dataset. Moderate rainfall contributes 40–50% of total monsoon rainfall. The contribution of different rainfall intensity intervals to the total monsoon rainfall is captured well by the IMERG estimates. However, near-real-time IMERG products overestimate the contribution of moderate rainfall to the total monsoon rainfall over the west coast of India. Additionally, IMERG-E and IMERG-L notably underestimate the contribution of heavy to very heavy rainfall to the total monsoon rainfall over the west coast, whereas IMERG-F shows better agreement with the rain-gauge-based dataset. It indicates that heavy rainfall over the complex terrain is usually underestimated by satellite-only precipitation products.
Bias and RMSE in IMERG estimates for different rainfall intensity intervals as compared to the IMD rain-gauge-based dataset is illustrated in Figure 12 for all-India, central India, and the west coast. The three IMERG estimates systematically overestimate light rainfall and underestimate rather heavy to very heavy rainfall. Additionally, RMSE is the largest for light rainfall, followed by moderate rainfall intensity. Interestingly, IMERG-F shows the largest bias and RMSE compared to IMERG-E and IMERG-L over the west coast in light rainfall estimation. It indicates that IMERG estimates under-detect and overestimate light rainfall, which needs to be improved in the next release. However, there is a notable reduction in bias in the IMERG-F product as compared to IMERG-E and IMERG-L products over the west coast for rather moderate to very heavy rainfall intensities. IMERG-L has a smaller magnitude of bias than IMERG-E and IMERG-F for rather heavy to very heavy rainfall intensities for all-India and central India but has the largest RMSE. These results clearly demonstrate the regional variations in error characteristics of IMERG products associated with distinct topography and precipitation processes.

4. Summary and Conclusions

India receives about 80% of its annual rainfall from the southwest or summer monsoon spanning from June to September, which exhibits substantial spatiotemporal variability. In addition, diverse topography and a fairly good rain gauge network make India a good test-bed to evaluate any satellite-based precipitation product. However, very few studies dealt with the evaluation of IMERG products for the southwest monsoon season over the country. In this study, near-real-time (e.g., V6 of IMERG-E and IMERG-L) and research products (IMERG-F V6 and V5) of IMERG were comprehensively evaluated against the IMD rain-gauge-based dataset over India at a daily scale for the southwest monsoon period. The evaluation was also carried out for pre-GPM and GPM periods. The spatial distributions of different error metrics across the country showed similar performance by both IMERG-E and IMERG-L estimates in precipitation estimation with marginally better performance by IMERG-L over IMERG-E. However, near-real-time products had rather larger errors than IMERG-F V6 estimates. IMERG-F V6 showed distinct bias patterns from IMERG-E and IMERG-L estimates over the west coast associated with complex terrain and precipitation processes. Bias in all-India daily mean rainfall in the near-real-time IMERG products was about 2–3 times larger than the research product. However, there was no considerable change in error metrics in IMERG-F V6 observed compared to the IMERG-F V5 product. Both near-real-time and research products showed similar characteristics in the detection of rainy days. IMERG-F V6 exhibited an overall better performance in precipitation estimation and detection of rainy days during the GPM period (2014–2017) than the pre-GPM period (2010–2013). Better performance of IMERG during the GPM period than during the pre-GPM period might be due to the availability of the DPR after the launch of the GPM Core Observatory, which provides better calibration than the TRMM-PR for IMERG estimates.
Furthermore, IMERG products were evaluated at all-India and sub-regional scales for different precipitation intensity intervals. The contributions of different rainfall intensity intervals to the total monsoon rainfall were captured well by the IMERG V6 estimates (e.g., IMERG-E, IMERG-L, and IMERG-F), but they underestimated the frequency of light to very heavy rainfall intensities over all-India, central India, and west coast regions. Additionally, results indicated that IMERG V6 products under-detected and overestimated light rainfall intensity, which needs to be improved in the next release. Results of this study clearly revealed that the error characteristics of IMERG products differ with region, topography, precipitation process, and product release version.The results of this study would be useful for both end-users and algorithm developers. Nevertheless, there is a need for an extensive evaluation of IMERG products at a sub-daily scale using radar and automatic weather station datasets over India in order to assess their capabilities in the diurnal cycle representation. The integration of ground-based weather radars and surface parameters such as soil moisture and terrain elevation in the multi-satellite precipitation product would further enhance its accuracy for hydrological applications.

Author Contributions

Conceptualization, methodology, formal analysis, writing—original draft preparation, S.P.; writing—review and editing, supervision, J.S. All authors have read and agreed to the published version of the manuscript.

Funding

This research received no external funding. The APC was funded by the Divecha Centre for Climate Change.

Acknowledgments

The GPM-IMERG precipitation products were obtained from the NASA Precipitation Processing System (PPS), and rain-gauge-based gridded rainfall data were provided by the Office of Climate Research and Services (CRS), IMD, Pune. The authors thank the Department of Science and Technology, Government of India, for financial support for the Centre for Excellence at Divecha Centre for Climate Change. The authors also thank the editor and anonymous reviewers for their constructive comments. The statements contained in the manuscript are the authors’ opinions and do not reflect the opinions of their organizations.

Conflicts of Interest

The authors declare no conflict of interest.

References

  1. Schlosser, C.A.; Houser, P.R. Assessing a satellite-era perspective of the global water cycle. J. Clim. 2007, 20, 1316–1338. [Google Scholar] [CrossRef] [Green Version]
  2. Levizzani, V.; Cattani, E. Satellite remote sensing of precipitation and the terrrestrial water cycle in a changing climate. Remote Sens. 2019, 11, 2301. [Google Scholar] [CrossRef] [Green Version]
  3. Kidd, C.; Huffman, G.; Maggioni, V.; Chambon, P.; Oki, R. The global satellite precipitation constellation: Current status and future requirement. Bull. Amer. Meteorol. Soc. 2021, 1–47. [Google Scholar] [CrossRef]
  4. Kummerow, C.; Barnes, W.; Kozu, T.; Shiue, J.; Simpson, J. The Tropical Rainfall Measuring Mission (TRMM) sensor package. J. Atmos. Ocean. Tecnol. 1998, 15, 809–817. [Google Scholar] [CrossRef]
  5. Hong, Y.; Tang, G.; Ma, Y.; Huang, Q.; Han, Z.; Zeng, Z.; Yang, Y.; Wang, C.; Guo, X. Remote sensing precipitation: Sensors, retrievals, validations, and applications. In Observation and Measurement of Ecohydrological Processes; Li, X., Vereecken, H., Eds.; Springer: Berlin/Heidelberg, Germany, 2018; pp. 1–23. [Google Scholar] [CrossRef]
  6. Sun, Q.; Miao, C.; Duan, Q.; Ashouri, H.; Sorooshian, S.; Hsu, K.-L. A review of global precipitation data sets: Data sources, estimation, and intercomparisons. Rev. Geophys. 2018, 56, 79–107. [Google Scholar] [CrossRef] [Green Version]
  7. Kidd, C.; Becker, A.; Huffman, G.J.; Muller, C.L.; Joe, P.; Skofronick-Jackson, G.; Kirschbaum, D.B. So, how much of the Earth’s surface is covered by rain gauges? Bull. Am. Meteorol. Soc. 2017, 98, 69–78. [Google Scholar] [CrossRef]
  8. Huffman, G.J.; Adler, R.F.; Bolvin, D.T.; Nelkin, E.J. The TRMM Multi-satellite Precipitation Analysis (TMPA). In Satellite Precipitation for Surface Hydrology; Hossain, F., Gebremichael, M., Eds.; Springer: Dordrecht, The Netherlands, 2010; pp. 3–22. [Google Scholar] [CrossRef] [Green Version]
  9. Joyce, R.; Xie, P.; Janowiak, J.E. Kalman filter-based CMORPH. J. Hydrometeorol. 2011, 12, 1547–1563. [Google Scholar] [CrossRef]
  10. Hong, Y.; Hsu, K.L.; Sorooshian, S.; Gao, X. Precipitation estimation from remotely sensed imagery using an artificial neural network cloud classification system. J. Appl. Meteorol. 2004, 43, 1834–1852. [Google Scholar] [CrossRef] [Green Version]
  11. Kubota, T.; Shige, S.; Hashizume, H.; Aonashi, K.; Takahashi, N.; Seto, S.; Hirose, M.; Takayabu, Y.N.; Nakagawa, K.; Iwanami, K.; et al. Global precipitation map using satelliteborne microwave radiometers by the GSMaPproject: Production and validation. IEEE Trans. Geosci. Remote Sens. 2007, 45, 2259–2275. [Google Scholar] [CrossRef]
  12. Maggioni, V.; Meyers, P.C.; Robinson, M.D. A review of merged high-resolution satellite precipitation product accuracy during the Tropical Rainfall Measuring Mission (TRMM) era. J. Hydrometeorol. 2016, 17, 1101–1117. [Google Scholar] [CrossRef]
  13. Prakash, S.; Mitra, A.K.; Gairola, R.M.; Norouzi, H.; Pai, D.S. Status of high-resolution multisatellite precipitation products across India. In Remote Sensing of Aerosols, Clouds, and Precipitation; Islam, T., Hu, Y., Kokhanovsky, A., Wang, J., Eds.; Elsevier: Amsterdam, The Netherlands, 2018; pp. 301–314. [Google Scholar] [CrossRef]
  14. Skofronick-Jackson, G.; Kirschbaum, D.; Petersen, W.; Huffman, G.; Kidd, C.; Stocker, E.; Kakar, R. The Global Precipitation Measurement (GPM) mission’s scientific achievements and societal contributions: Reviewing four years of advanced rain and snow observations. Q. J. R. Meteorol. Soc. 2018, 144, 27–47. [Google Scholar] [CrossRef] [Green Version]
  15. Huffman, G.J.; Bolvin, D.T.; Braithwaite, D.; Hsu, K.; Joyce, R.; Kidd, C.; Nelkin, E.J.; Sorooshian, S.; Tan, J.; Xie, P. NASA Global Precipitation Measurement (GPM) Integrated Multi-satellitE Retrievals for GPM (IMERG). Algorithm Theoretical Basis Document (ATBD) Version 5.2. 2018; p. 35. Available online: https://pmm.nasa.gov/sites/default/files/document_files/IMERG_ATBD_V5.2.pdf (accessed on 12 February 2021).
  16. Huffman, G.J.; Bolvin, D.T.; Braithwaite, D.; Hsu, K.-L.; Joyce, R.J.; Kidd, C.; Nelkin, E.J.; Sorooshian, S.; Stocker, E.F.; Tan, J.; et al. Integrated Multi-satellite Retrievals for the Global Precipitation Measurement (GPM) Mission (IMERG). In Satellite Precipitation Measurement; Springer: Berlin/Heidelberg, Germany, 2020; Volume 1, pp. 343–353. [Google Scholar] [CrossRef]
  17. Fang, J.; Yang, W.; Luan, Y.; Du, J.; Lin, A.; Zhao, L. Evaluation of the TRMM 3B42 and GPM IMERG products for extreme precipitation analysis over China. Atmos. Res. 2019, 223, 24–38. [Google Scholar] [CrossRef]
  18. Prakash, S.; Mitra, A.K.; Pai, D.S.; AghaKouchak, A. From TRMM to GPM: How well can heavy rainfall be detected from space? Adv. Water Resour. 2016, 88, 1–7. [Google Scholar] [CrossRef]
  19. Sharma, S.; Khadka, N.; Hamal, K.; Shrestha, D.; Talchabhadel, R.; Chen, Y. How accurately can satellite products (TMPA and IMERG) detect precipitation patterns, extremities, and drought across the Nepalese Himalaya? Earth Space Sci. 2020, 7, e2020EA001315. [Google Scholar] [CrossRef]
  20. Tan, J.; Petersen, W.A.; Kirstetter, P.-E.; Tian, Y. Performance of IMERG as a function of spatiotemporal scale. J. Hydrometeorol. 2017, 18, 307–319. [Google Scholar] [CrossRef]
  21. Sunilkumar, K.; Yatagai, A.; Masuda, M. Preliminary evaluation of GPM-IMERG rainfall estimates over three distinct climate zones with APHRODITE. Earth Sapce Sci. 2019, 6, 1321–1335. [Google Scholar] [CrossRef] [Green Version]
  22. Liu, Z. Comparison of Integrated Multisatellite Retrievals for GPM (IMERG) and TRMM Multisatellite Precipitation Analysis (TMPA) monthly precipitation products: Initial results. J. Hydrometeorol. 2016, 17, 777–790. [Google Scholar] [CrossRef]
  23. Prakash, S.; Mitra, A.K.; AghaKouchak, A.; Liu, Z.; Norouzi, H.; Pai, D.S. A preliminary assessment of GPM-based multi-satellite precipitation estimates over a monsoon dominated region. J. Hydrol. 2018, 556, 865–876. [Google Scholar] [CrossRef] [Green Version]
  24. Zhou, Z.; Guo, B.; Xing, W.; Zhou, J.; Xu, F.; Xu, Y. Comprehensive evaluation of latest GPM era IMERG and GSMaP precipitation products over mainland China. Atmos. Res. 2020, 246, 105132. [Google Scholar] [CrossRef]
  25. Yuan, F.; Zhang, L.; Soe, K.M.W.; Ren, L.; Zhao, C.; Zhu, Y.; Jiang, S.; Liu, Y. Applications of TRMM- and GPM-era multiple-satellite precipitation products for flood simulations at sub-daily scales in a sparsely gauged watershed in Myanmar. Remote Sens. 2019, 11, 140. [Google Scholar] [CrossRef] [Green Version]
  26. Zhang, S.J.; Wang, D.H.; Qin, Z.; Zheng, Y.; Guo, J. Assessment of the GPM and TRMM precipitation products using the rain gauge network over the Tibetan Plateau. J. Meteorol. Res. 2018, 32, 324–336. [Google Scholar] [CrossRef]
  27. Cui, W.; Dong, X.; Xi, B.; Feng, Z.; Fan, J. Can the GPM IMERG Final product accurately represent MCSs’ precipitation characterstics over the Central and Eastern United States? J. Hydrometeorol. 2020, 21, 39–57. [Google Scholar] [CrossRef]
  28. Afonso, J.M.S.; Vila, D.A.; Gan, M.A.; Quispe, D.P.; Barreto, N.J.C.; Chinchay, J.H.H.; Palharini, R.S.A. Precipitation diurnal cycle assessment of satellite-based estimates over Brazil. Remote Sens. 2020, 12, 2339. [Google Scholar] [CrossRef]
  29. Li, X.; Sungmin, O.; Wang, N.; Liu, L.; Huang, Y. Evaluation of the GPM IMERG V06 products for light rain over Mainland China. Atmos. Res. 2021, 253, 105510. [Google Scholar] [CrossRef]
  30. Wang, H.; Wang, L.; He, J.; Ge, F.; Chen, Q.; Tang, S.; Yao, S. Can the GPM IMERG hourly products replicate the variation in precipitation during the wet season over the Sichuan Basin, China? Earth Space Sci. 2020, 7, e2020EA001090. [Google Scholar] [CrossRef] [Green Version]
  31. Hosseini-Moghari, S.-M.; Tang, Q. Validation of GPM IMERG V05 and V06 precipitation products over Iran. J. Hydrometeorol. 2020, 21, 1011–1037. [Google Scholar] [CrossRef] [Green Version]
  32. Mahmoud, M.T.; Hamouda, M.A.; Mohamed, M.M. Spatiotemporal evaluation of the GPM satellite precipitation products over the United Arab Emirates. Atmos. Res. 2019, 219, 200–212. [Google Scholar] [CrossRef]
  33. Sakib, S.; Ghebreyesus, D.; Sharif, H.O. Performance evaluation of IMERG GPM products during tropical storm Imelda. Atmosphere 2021, 12, 687. [Google Scholar] [CrossRef]
  34. Derin, Y.; Anagnostou, E.; Berne, A.; Borga, M.; Boudevillain, B.; Buytaert, W.; Chang, C.-H.; Chen, H.; Delrieu, G.; Hsu, Y.C.; et al. Evaluation of GPM-era global satellite precipitation products over multiple complex terrain regions. Remote Sens. 2019, 11, 2936. [Google Scholar] [CrossRef] [Green Version]
  35. Hamza, A.; Anjum, M.N.; Cheema, M.J.M.; Chen, X.; Afzal, A.; Azam, M.; Shafi, M.K.; Gulakhmadov, A. Assessment of IMERG-V06, TRMM-3B42V7, SM2RAIN-ASCAT, and PERSIANN-CDR precipitation products over the Hindu Kush mountains of Pakistan, South Asia. Remote Sens. 2020, 12, 3871. [Google Scholar] [CrossRef]
  36. Beria, H.; Nanda, T.; Bisht, D.S.; Chatterjee, C. Does the GPM mission improve the systematic error component in satellite rainfall estimates over TRMM? An evaluation at a pan-India scale. Hydrol. Earth Syst. Sci. 2017, 21, 6117–6134. [Google Scholar] [CrossRef] [Green Version]
  37. Murali Krishna, U.V.; Das, S.K.; Deshpande, S.M.; Doiphode, S.L.; Pandithurai, G. The assessment of Global Precipitation Measurement estimates over the Indian subcontinent. Earth Space Sci. 2017, 4, 540–553. [Google Scholar] [CrossRef]
  38. Reddy, M.V.; Mitra, A.K.; Momin, I.M.; Mitra, A.K.; Pai, D.S. Evaluation and inter-comparison of high-resolution multi-satellite rainfall products over India for the southwest monsoon period. Int. J. Remote Sens. 2019, 40, 4577–4603. [Google Scholar] [CrossRef]
  39. Huffman, G.J.; Bolvin, D.T.; Nelkin, E.J.; Stocker, E.F.; Tan, J. V06 IMERG Release Notes. 2020; p. 15. Available online: https://gpm.nasa.gov/sites/default/files/2020-10/IMERG_V06_release_notes_201006_0.pdf (accessed on 12 February 2021).
  40. Pai, D.S.; Sridhar, L.; Rajeevan, M.; Sreejith, O.P.; Satbhai, N.S.; Mukhopadhyay, B. Development of a new high spatial resolution (0.25° × 0.25°) long period (1901–2010) daily gridded rainfall data set over India and its comparison with existing data sets over the region. Mausam 2014, 65, 1–18. [Google Scholar]
  41. Bharti, V.; Singh, C. Evaluation of error in TRMM 3B42V7 precipitation estimates over the Himalayan region. J. Geophys. Res. Atmos. 2015, 120, 12458–12473. [Google Scholar] [CrossRef]
  42. Prakash, S.; Mitra, A.K.; AghaKouchak, A.; Pai, D.S. Error characterization of TRMM Multisatellite Precipitation Analysis (TMPA-3B42) products over India for different seasons. J. Hydrol. 2015, 529, 1302–1312. [Google Scholar] [CrossRef]
  43. Vinnarasi, R.; Dhanya, C.T. Changing characteristics of extreme wet and dry spells of Indian monsoon rainfall. J. Geophys. Res. Atmos. 2016, 121, 2146–2160. [Google Scholar] [CrossRef]
  44. Sharma, S.; Mujumdar, P. Increasing frequency and spatial extent of concurrent meteorological droughts and heatwaves in India. Sci. Rep. 2017, 7, 15582. [Google Scholar] [CrossRef] [Green Version]
  45. Barik, B.; Ghosh, S.; Sahana, A.S.; Pathak, A.; Sekhar, M. Water-food-energy nexus with changing agricultural scenarios in India during recent decades. Hydrol. Earth Syst. Sci. 2017, 21, 3041–3060. [Google Scholar] [CrossRef] [Green Version]
  46. Mukherjee, S.; Aadhar, S.; Stone, D.; Mishra, V. Increase in extreme precipitation events under anthropogenic warming in India. Weather Clim. Extrem. 2018, 20, 45–53. [Google Scholar] [CrossRef]
  47. Kling, H.; Fuchs, M.; Paulin, M. Runoff conditions in the upper Danube basin under an ensemble of climate change scenarios. J. Hydrol. 2012, 424–425, 264–277. [Google Scholar] [CrossRef]
  48. AghaKouchak, A.; Mehran, A.; Norouzi, H.; Behrangi, A. Systematic and random error components in satellite precipitation data sets. Geophys. Res. Lett. 2012, 39, L09406. [Google Scholar] [CrossRef] [Green Version]
  49. Gadgil, S. The Indian monsoon and its variability. Annu. Rev. Earth Planet. Sci. 2003, 31, 429–467. [Google Scholar] [CrossRef] [Green Version]
  50. Li, Z.; Tang, G.; Hong, Z.; Chen, M.; Gao, S.; Kirstetter, P.; Gourley, J.J.; Wen, Y.; Yami, T.; Nabih, S.; et al. Two-decades of GPM IMERG Early and Final run products intercomparison: Similarity and difference in climatology, rates, and extremes. J. Hydrol. 2021, 594, 125975. [Google Scholar] [CrossRef]
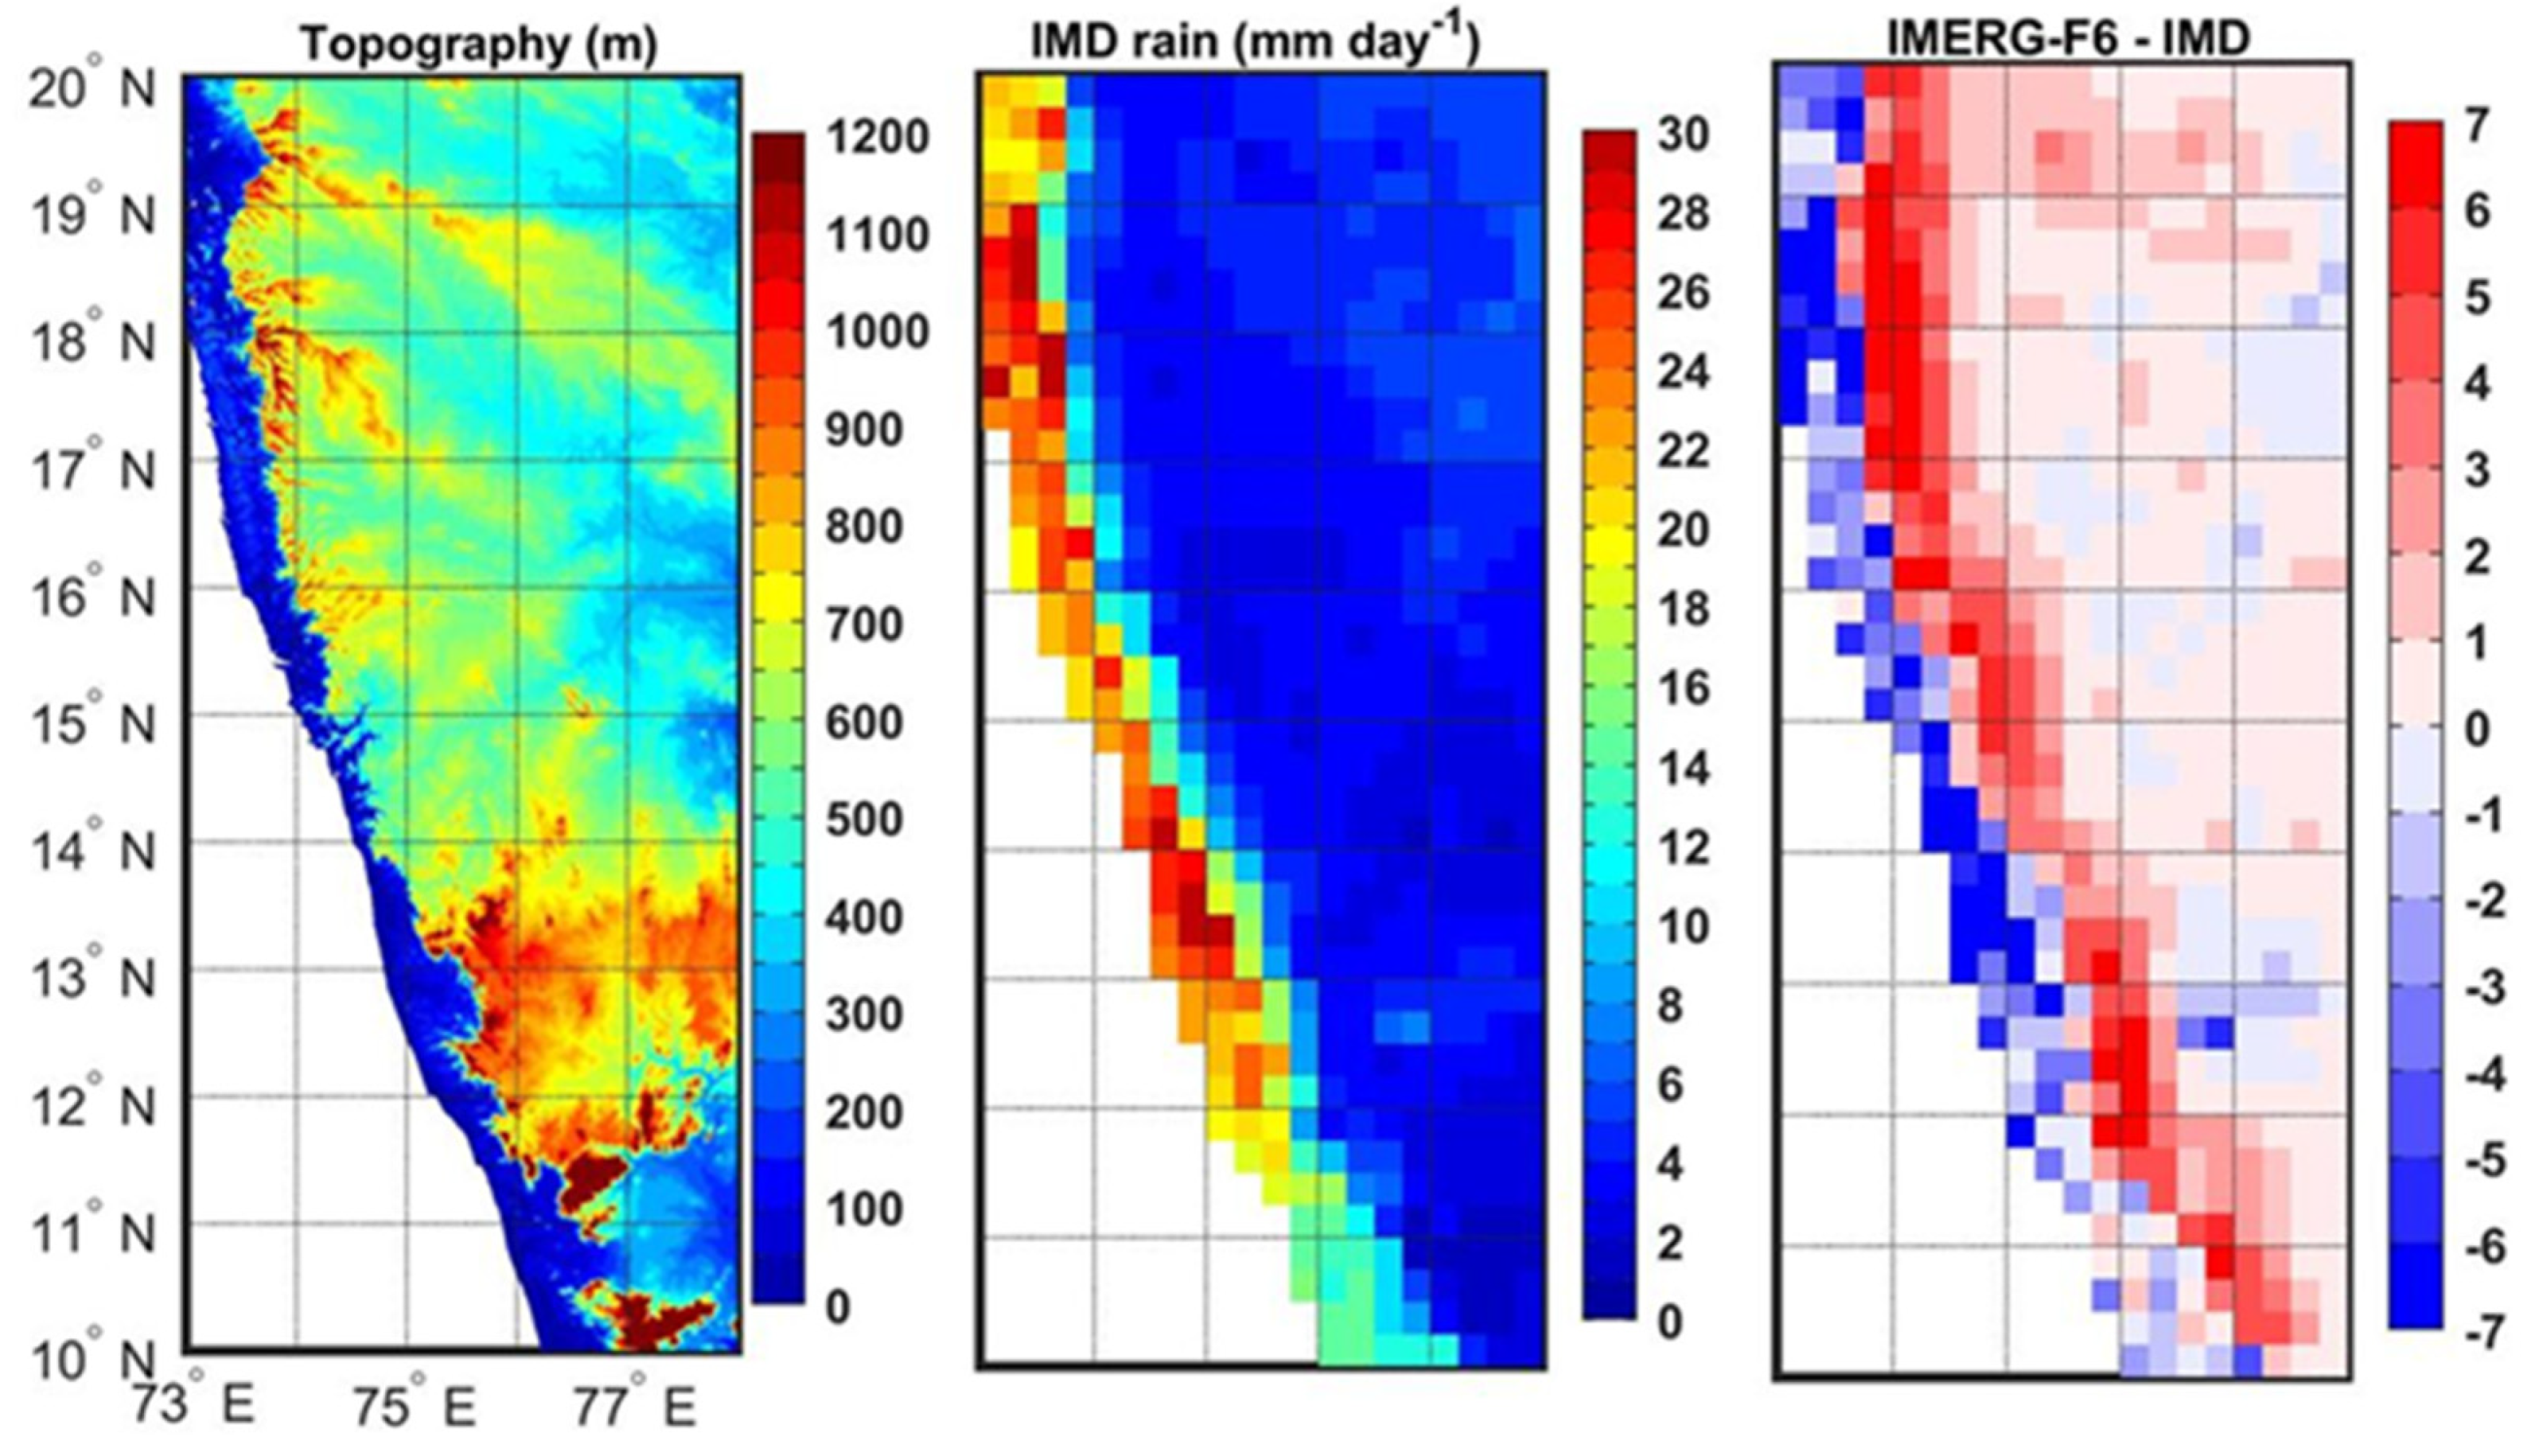
  51. Francis, P.A.; Gadgil, S. Intense rainfall events over the west coast of India. Meteorol. Atmos. Phys. 2006, 94, 27–42. [Google Scholar] [CrossRef]
  52. Konduru, R.T.; Mrudula, G. Effect of offshore troughs on the South India erratic summer monsoon rainfall in June 2017. Dyn. Atmos. Oceans 2021, 93, 101187. [Google Scholar] [CrossRef]
  53. Kumar, S.; Hazra, A.; Goswami, B.N. Role of interaction between dynamics, thermodynamics and cloud microphysics on summer monsoon precipitation clouds over the Myanmar Coast and Western Ghats. Clim. Dyn. 2014, 43, 911–924. [Google Scholar] [CrossRef]
  54. Rojas, Y.; Minder, J.R.; Campbell, L.S.; Massmann, A.; Garreaud, R. Assessment of GPM IMERG satellite precipitation estimation and its dependence on microphysical rain regimes over the mountains of south-central Chile. Atmos. Res. 2021, 253, 105454. [Google Scholar] [CrossRef]
  55. Guo, J.; Zhai, P.; Wu, L.; Cribb, M.; Li, Z.; Ma, Z.; Wang, F.; Chu, D.; Wang, P.; Zhang, J. Diurnal variation and the influential factors of precipitation from surface and satellite measurements in Tibet. Int. J. Climatol. 2014, 34, 2940–2956. [Google Scholar] [CrossRef]
  56. Chiaravalloti, F.; Brocca, L.; Prcopio, A.; Massari, C.; Gabriele, S. Assessment of GPM and SM2RAIN-ASCAT rainfall products over complex terrain in southern Italy. Atmos. Res. 2018, 206, 64–74. [Google Scholar] [CrossRef]
  57. Wehbe, Y.; Temimi, M.; Ghebreyesus, D.T.; Milewski, A.; Norouzi, H.; Ibrahim, E. Consistency of precipitation products over the Arabian Peninsula and interactions with soil moisture and water storage. Hydrol. Sci. J. 2018, 63, 408–425. [Google Scholar] [CrossRef]
  58. Ochoa-Rodriguez, S.; Wang, L.-P.; Willems, P.; Onof, C. A review of radar-rain gauge data merging methods and their potential for urban hydrological applications. Water Resour. Res. 2019, 55, 6356–6391. [Google Scholar] [CrossRef]
  59. Wehbe, Y.; Temimi, M.; Adler, R.F. Enhancing precipitation estimates through the fusion of weather radar, satellite retrievals, and surface parameters. Remote Sens. 2020, 12, 1342. [Google Scholar] [CrossRef] [Green Version]
  60. Tan, J.; Petersen, W.A.; Tokay, A. A novel approach to identify sources of errors in IMERG for GPM ground validation. J. Hydrometeorol. 2016, 17, 2477–2491. [Google Scholar] [CrossRef]
  61. Rajagopal, M.; Zipser, E.; Huffman, G.; Russell, J.; Tan, J. Comparison of IMERG version 06 precipitation at and between passive microwave overpasses in the tropics. J. Hydrometeorol. 2021, 22, 2117–2130. [Google Scholar] [CrossRef]
  62. Ayat, H.; Evans, J.P.; Behrangi, A. How do different sensors impact IMERG precipitation estimates during hurricane days? Remote Sens. Environ. 2021, 259, 112417. [Google Scholar] [CrossRef]
  63. Prakash, S.; Seshadri, A.; Srinivasan, J.; Pai, D.S. A new parameter to assess impact of rain gauge density on uncertainty in the estimates of monthly rainfall over India. J. Hydrometeorol. 2019, 20, 821–832. [Google Scholar] [CrossRef]
Figure 1. (a) Topography (m) distributions across India, and (b) locations of 2725 reporting IMD rain gauges for a typical day in July 2014. Two rectangular boxes shown in Figure 1a indicate central India (CI) and west coast (WC) of India considered for detailed analysis.
Remotesensing 13 03676 g001
Figure 2. Spatial distributions of 4-year mean monsoon rainfall (mm day−1) across India from the IMD rain-gauge-based data and IMERG estimates for the GPM (2014–2017) and pre-GPM (2010–2013) periods.
Remotesensing 13 03676 g002
Figure 3. Spatial distributions of bias (mm day−1) in the IMERG estimates as compared to the rain-gauge-based dataset over India for the GPM (2014–2017) and pre-GPM (2010–2013) periods.
Remotesensing 13 03676 g003
Figure 4. Spatial distributions of topography (m), mean monsoon rainfall (mm day−1) from the IMD rain-gauge-based data, and bias (mm day−1) in IMERG-F version 6 estimates for 2014–2017 over west coast of India.
Remotesensing 13 03676 g004
Figure 5. Spatial distributions of coefficient of variations (%) in daily monsoon rainfall across India from the IMD rain-gauge-based data and IMERG estimates for the GPM (2014–2017) and pre-GPM (2010–2013) periods.
Remotesensing 13 03676 g005
Figure 6. Spatial distributions of root mean square error (mm day−1) and contribution of systematic error component (%) to the total error in IMERG estimates as compared to the rain-gauge-based data over India for the GPM (2014–2017) and pre-GPM (2010–2013) periods.
Remotesensing 13 03676 g006
Figure 7. Spatial distributions of correlation coefficient and modified Kling–Gupta efficiency in IMERG estimates as compared to the rain-gauge-based data over India for the GPM (2014–2017) and pre-GPM (2010–2013) periods.
Remotesensing 13 03676 g007
Figure 8. Interannual variations in all-India monsoon rainfall from the IMD rain-gauge-based dataset and IMERG-F version 6 estimates. Bias and root mean square errors in IMERG-F product for the same period against the rain-gauge-based dataset are also shown in the figure.
Remotesensing 13 03676 g008
Figure 9. Spatial distributions of probability of detection and false alarm ratio in the detection of rainy days from the IMERG estimates as compared to the rain-gauge-based data over India for the GPM (2014–2017) and pre-GPM (2010–2013) periods.
Remotesensing 13 03676 g009
Figure 10. Spatial distributions of frequency bias index and Peirce skill score in the detection of rainy days from the IMERG estimates as compared to the rain-gauge-based data over India for the GPM (2014–2017) and pre-GPM (2010–2013) periods.
Remotesensing 13 03676 g010
Figure 11. Frequency and contribution of different rainfall intensity intervals to the total monsoon rainfall for all-India, central India, and west coast from the IMD rain-gauge-based data and IMERG version 6 estimates for 2014–2017.
Remotesensing 13 03676 g011
Figure 12. Bias and root mean square errors in the IMERG version 6 estimates as compared to the IMD rain-gauge-based data for 2014–2017 over all-India, central India, and west coast for different rainfall intensity intervals.
Remotesensing 13 03676 g012
Table 1. Formulae for the computation of continuous error metrics used in this study. Si and Gi denote precipitation estimates from the IMERG and rain-gauge-based products, respectively, and N is the total number of colocated points.
Error MetricsFormulae
Bias (mm day−1) B i a s = S G
where, S = i = 1 N S i N and G = i = 1 N G i N
Correlation coefficient r = i = 1 N ( G i G ) ( S i S ) [ i = 1 N ( G i G ) 2 × i = 1 N ( S i S ) 2 ] 1 / 2
Coefficient of variation (%) ( C V ) S = [ i = 1 N ( S i S ) 2 N ] 2 S × 100 %
( C V ) G = [ i = 1 N ( G i G ) 2 N ] 2 G × 100 %
Root mean square error (mm day−1) R M S E = [ i = 1 N ( S i G i ) 2 N ] 1 2
Modified Kling–Gupta efficiency K G E = 1 [ ( r 1 ) 2 + ( S G 1 ) 2 + ( ( C V ) S ( C V ) G 1 ) 2 ] 1 2
Table 2. Formulae, range, and perfect score of four categorical skill metrics used in this study. H (Hits) is the number of events when both IMERG and rain-gauge-based products detect rainy days, FA (False Alarms) is the number of events when only IMERG detects rainy days, M (Misses) is the events when only rain-gauge-based product detect rainy days, and CN (Correct Negatives) is the number of events when both IMERG and rain-gauge-based products detect non-rainy days.
FormulaeRangePerfect Score
Probability of Detection P O D = H H + M 0 to 11
False Alarm Ratio F A R = F A H + F A 0 to 10
Frequency Bias Index F B I = H + F A H + M 0 to ∞1
Peirce′s Skill Score P S S = H H + M F A F A + C N −1 to 11
Table 3. Error statistics in the IMERG precipitation products as compared to the IMD rain-gauge-based dataset for all-India daily monsoon rainfall estimates.
2014–20172010–2013
IMDIMERG-E V6IMERG-L V6IMERG-F V6IMERG-F V5IMDIMERG-F V6
Mean(mm/day)6.637.347.296.806.787.327.74
Bias (%)10.709.882.592.185.73
CV (%)46.5251.1350.6347.7349.0142.6645.47
Correlation0.890.920.940.930.92
RMSE (%)28.6524.9116.8918.2619.91
KGE0.810.840.930.910.88
Table 4. Five rainfall categories based on daily rainfall amounts have been used in this study. The daily rainfall ranges for these five rain categories are adopted from the IMD. Daily rainfall less than 2.5 mm is not considered, and two rain categories—very heavy and extremely heavy—are grouped into very heavy rain category in this study.
Rain CategoryDaily Rainfall Range (mm)
Light2.5–7.5 mm
Moderate (Mod)7.5–35.5 mm
Rather heavy (RHvy)35.5–64.5 mm
Heavy (Hvy)64.5–124.5 mm
Very heavy (VHvy)≥124.5 mm
Publisher’s Note: MDPI stays neutral with regard to jurisdictional claims in published maps and institutional affiliations.

