Article

Artificial Intelligence Based Structural Assessment for Regional Short- and Medium-Span Concrete Beam Bridges with Inspection Information

1
Department of Bridge Engineering, Tongji University, Shanghai 200092, China
2
Planning and Design Management Center, Shanghai Lingang Economic Development (Group) Co., Ltd., Shanghai 201306, China
3
State Key Laboratory for Disaster Reduction in Civil Engineering, Tongji University, Shanghai 200092, China
4
Shanghai Qi-Zhi Research Institute, Shanghai 200003, China
*
Author to whom correspondence should be addressed.
Remote Sens. 2021, 13(18), 3687; https://0-doi-org.brum.beds.ac.uk/10.3390/rs13183687
Submission received: 29 June 2021 / Revised: 2 September 2021 / Accepted: 14 September 2021 / Published: 15 September 2021
(This article belongs to the Special Issue Bridge Monitoring Using Remote Sensors)

Abstract

:
The functional and structural characteristics of civil engineering works, in particular bridges, influence the performance of transport infrastructure. Remote sensing technology and other advanced technologies could help bridge managers review structural conditions and deteriorations through bridge inspection. This paper proposes an artificial intelligence-based methodology to solve the condition assessment of regional bridges and optimize their maintenance schemes. It includes data integration, condition assessment, and maintenance optimization. Data from bridge inspection reports is the main source of this data-driven approach, which could provide a substantial amount og condition-related information to reveal the time-variant bridge condition deterioration and effect of maintenance behaviors. The regional bridge condition deterioration model is established by neural networks, and the impact of the maintenance scheme on the future condition of bridges is quantified. Given the need to manage limited resources and ensure safety and functionality, adequate maintenance schemes for regional bridges are optimized with genetic algorithms. The proposed data-driven methodology is applied to real regional highway bridges. The regional inspection information is obtained with the help of emerging technologies. The established structural deterioration models achieve up to 85% prediction accuracy. The obtained optimal maintenance schemes could be chosen according to actual structural conditions, maintenance requirements, and total budget. Data-driven decision support can substantially aid in smart and efficient maintenance planning of road bridges.

1. Introduction

There is an increasing concern that highway bridges have been suffering from structural deterioration and deficiency due to environmental erosion, overloading, initial defects, natural and human-made hazards, and other factors [1,2,3]. A bridge deteriorates under the environmental interference and external loads, and different maintenance schemes will keep the bridge in different conditions [4,5,6]. The complex environment and load factors make it quite hard for stakeholders to assess the structural conditions and set appropriate maintenance schemes, even for a single bridge.
Structural conditions could be determined with the help of structural health monitoring and inspections [7,8,9]. Traditional inspection approaches are labor-consuming. Recent emerging technologies have significantly increased the accuracy and efficiency of inspection works [10,11]. Rashidi et at. [12] reviewed bridge monitoring and inspection technology with terrestrial laser scanning techniques, identified its current research gaps and future directions. Jung et al. [13] addressed a novel method for fully autonomous bridge inspection using an unmanned aerial vehicle (UAV). Kim [14] modeled the bridges with point clouds techniques to identify the location of the damage in three-dimensional space and classify the bridge components. Kumar et al. [15] identified spatial and temporal variations of concrete bridges with ground-penetrating radar. Ortiz-Sanz et al. [16] used thermal cameras on UAV to inspect the thermal anomalies with infrared thermography techniques. Zollini et al. [17] detected the width and length of cracks and extension of weathered areas using UAV Photogrammetry. The satellite-based remote sensing techniques are also used for assessing the structural condition of bridges [18,19,20,21,22]. Gagliardi et al. [20] achieved the high precision of displacement measurement of bridges using satellite remote sensing Persistent Scatterer Interferometry (PSI). Tosti et al. [21] integrated the Ground Penetrating Radar (GPR) and Interferometric Synthetic Aperture Radar (InSAR) for monitoring transport assets at network level. Xiong et al. [22] derived the long-term displacements of the Hong Kong-Zhuhai-Macao Bridge (HZMB) by the PSI and InSAR technology.
Integrating datasets collected with different advanced bridge inspection technologies could take the advantage of the various types of data and fill the gaps. The data fusion technique supports the comprehensive assessment of bridges with the abundant data. Ciampoli et al. [23] reviewed recent studies on transportation infrastructure safety assessment using data fusion techniques for monitoring and detection. Solla et al. [24] proposed a data combination method of GPR and infrared thermography (IRT) data to detect the corrosion of rebar and assess the resistance of reinforced concrete. Alani et al. [25] integrated the GPR and InSAR technologies for monitoring a masonry arch bridge. The integration of multi-source inspection data has the potential to further interpret the measured data and extract the structural features.
Short- and medium-span beam bridges are one of the most common types of bridges throughout the world [26,27,28]. There are three main types of concrete beam bridges, that is, box-shaped beam bridges, hollow slab bridges, and T-shaped beam bridges. Each type of bridge has common characteristics, such as regular configurations, definite force transmission mechanisms, and comparable maintenance strategies [29,30]. In addition, damage location and crack directions are also typical for the same type of bridges. These similarities also contain regional deterioration characteristics and maintenance action effects.
With the help of emerging technologies and manual inspections, inspections could collect detailed and accurate information of measured bridges yearly. Years of regional bridge inspection data imply the deterioration features of the structure. The National Bridge Inventory (NBI) is a typical database for American bridges [31]. It stores Departments of Transportation data from every state since 1968, as collected by the Federal Highway Administration [32]. Bridge general information, structural ratings, and related maintenance actions are also recorded in this database. This traditional passive management approach only performs retrofit measurement when severe damage is detected. Nowadays, active management approaches using historical measured data are gaining more and more attention [33]. With the aid of data mining techniques, it is possible to analyze the correlation of measured data and extract the main deterioration features, thereby providing a reliable basis for the regional management plan.
Artificial intelligence techniques [34,35] have been widely applied to various structural safety fields, such as condition prediction and damage detection. The neural network (NN) is suitable for dealing with the big data issues, and it could directly extract the multi-dimension features and non-linear relationships among input data. Huang [36] accurately predicted the deterioration of bridge decks with NN models. The statistical analysis was also used to identify significant factors that influence the deteriorations. Liu and Zhang [33] pick more than twenty features from the NBI database and train NN models for three primary components including the deck, superstructure, and substructure. Li and Burgueno [37] analyzed quite a few NN models to predict the conditions of abutments, and the final accuracy achieved was 86%. Therefore, the NN model can simulate the deterioration of structural conditions by extracting important features from the bridge inspection information.
Inspection information is a main indicator for structural maintenance decision-making. The way in which the inspected structural characteristics evolve is crucial for maintenance costs and safety conditions [38,39]. Regional bridges in the transportation network focus on not only individual-level but also network-level management [26,40]. The regional maintenance strategy should be optimized with the consideration of the overall maintenance cost and structural safety. Gidaris et al. [41] reviewed the maintenance models of regional bridges affected by various disasters, and demonstrated the utilization of these models in the condition assessment of infrastructure. Mackie et al. [42] addressed a method that takes into account the structural condition and maintenance measures of bridge components, as well as the repair cost. Liu and Frangopol [43] proposed a network-level optimization method with the help of the safety of each individual bridge. Soliman et al. [44] suggested a method that could integrate the inspection, monitoring, and maintenance information to assess the regional safety.
This study proposes a novel data-driven methodology to assess the condition of regional bridges and schedule the maintenance schemes. The bridge inspection information obtained by remote technologies and visual inspections is utilized to ascertain the general information and current condition of bridges. This study provides the following contributions when comparing with previous works: (1) Data extraction and integration techniques are established for the regional bridge inspection information, and key parameters of regional deterioration features are identified. (2) Based on the regional measured data, the data-driven deterioration models of regional bridges at component level and system level are established. (3) The proposed data processing and condition assessment methods are verified with the help of a regional database of some highway bridges in Hebei, China, and the deterioration models and maintenance schemes of bridges in the region are also determined.
The remainder of this study is organized as follows. Section 2 summarizes the emerging technologies that are used in the bridge inspection and the generated inspection reports. Section 3 introduces the proposed data-driven methodology for condition assessment and maintenance optimization. Section 4, Section 5 and Section 6 describe the data integration, condition assessment, and maintenance optimization part in the methodology, respectively. Section 7 shows the application of the proposed method to the real regional highway bridges. Finally, Section 8 offers conclusions regarding the proposed methodology.

2. Bridge Inspections and Condition Ratings

The main content of highway bridge inspection includes appearance inspection, internal inspection, mechanical performance evaluation and geometric parameter inspection. Advanced inspection technology, such as UAV [17], radar scanning [15], infrared thermal imaging [16], spectral measurement, doppler remote tester, and laser scanning [45], has significantly increased the accuracy and efficiency of inspection works, shown in Figure 1. Based on the inspection results and corresponding codes, the structural condition could be determined as different condition levels.
Based on the Chinese code, condition ratings of small- and medium-span bridges are derived from the annual bridge inspections, and they are the basis for bridge condition assessment and management decision making. In China, the ratings include a structural evaluation of system level, unit level, and component level on a 1–5 scale, shown in Figure 2. The structural components are firstly rated based on the inspection results and associated standards. The rating of the unit is weighted by the ratings of its components, and the rating of the bridge system is weighted by the ratings of the units. As the types of bridge components in the area are diversified and the systems and units are similar, this paper aims to reveal the deterioration features and plan the maintenance works based on the ratings of bridge systems and units.
The Chinese standard, Highway Bridge Structural Condition Evaluation Standard (JTG/T H21-2011), classifies the current structural condition of bridge components, units, and systems into five levels (Level 1 to Level 5). Level 1 represents the inspected structures with the best conditions, and Level 5 represents the inspected structures with the worst conditions.

3. Condition Assessment and Maintenance Optimization Methodology

Due to loads, construction defects, material properties, environmental factors, etc., existing concrete bridges will inevitably deteriorate. Within a certain transportation network, bridges experience a similar environment (traffic loads, temperature, humidity, etc.), and their design and construction practices are also relevant. Thus, there must be some extents of performance correlation among individual bridges within the same transportation network [46]. This paper proposes an overall condition assessment and optimization methodology based on these regional performance correlations. This proposed methodology consists of three steps (data integration, condition assessment, and maintenance optimization).
Data integration is a step that collects field data and translates it into a machine-readable dataset. Bridge databases are integrated from several sources. Bridge configuration characteristics are extracted from bridge inspection reports. The time-variant bridge condition curves are determined based on several years of regional bridge inspection reports. Bridge maintenance behaviors are also included to reflect the bridge condition improvement. Traffic data are collected from the video-based survey as well as the local authority’s travel demand model to reflect the bridge service load variation. To import more potential correlations, data from other sources, such as the environment and site surroundings, should be included as well. Data preprocessing techniques, such as cleaning and regulation, are then implemented to purify the established database and highlight the correlated attributes.
As for condition assessment, the deterioration models for regional bridges are extracted from the purified database. The established deterioration models provide a solution to predict a bridge’s future performance. Although the data quality is improved after preprocessing, subjectivity and data imbalance still exist. This study introduces a modified cost-sensitive indicator to overcome these potential problems. As the selected features and structural conditions have complex correlations, this paper employs the NN to generate regional deterioration models. The database is split randomly into a training set, a validation set, and a test set. The NN is trained with the training set to minimize the prediction error. The validation test is then performed to find the optimal weights while the test set is used to estimate efficiency of the network. In addition, the established deterioration models enable bridge and component condition prediction under different maintenance plans.
Finally, a multi-objective optimization is conducted in the maintenance optimization step based on the results predicted from the previous steps. The genetic algorithm (GA) is employed to achieve a life-cycle-cost–benefit balance between the total maintenance cost and the whole bridge network performance. The calculated Pareto Front consists of all optimal regional maintenance schemes that satisfy the economic and performance constraints, allowing bridge managers to select the most appropriate one for implementation.

4. Data Integration Techniques

4.1. Data in Inspection Reports

Inspection reports of bridges in China mainly record the current condition ratings of structures and components at each inspection. Some structural general information is also depicted in the inspection reports. A translated inspection report sample is shown in Figure 3. The bridge general information contains route code, route name, kilometer point, bridge code, bridge name, width, structure length, structure type, climate, owner, year built, last maintenance, average daily truck traffic (ADTT), average daily traffic (ADT), and inspection date. Some of them are condition-related parameters, and they are of great importance in understanding the deterioration process of the regional bridges. For example, ADT represents the daily traffic volume of the inspection bridge, which could reflect the effect of the vehicle loadings. In addition, as too many heavy trucks often have a greater impact on the condition of the bridge, ADTT is another important parameter that reflects the loading effects. The detailed selected parameters used to train the regional deterioration models are illustrated in the next section.
Inspection reports contain considerable structural condition-related information. The variation of structural condition ratings is related with the structure, traffic loads, environments, etc. Some potential correlation among the structural condition and features might be hidden in the regional condition dataset. The condition ratings denoted in the inspection reports include three levels: component-level, unit-level, and system-level. This study mainly focuses on the system-level and unit-level assessment and maintenance. The time-variant deterioration features of structural conditions might be hidden in several years of regional bridge inspection reports. In addition, bridge maintenance behaviors are also included in the inspection reports to record the improvement of structural conditions. These features are also important to reflect the maintenance effects of the target bridge.

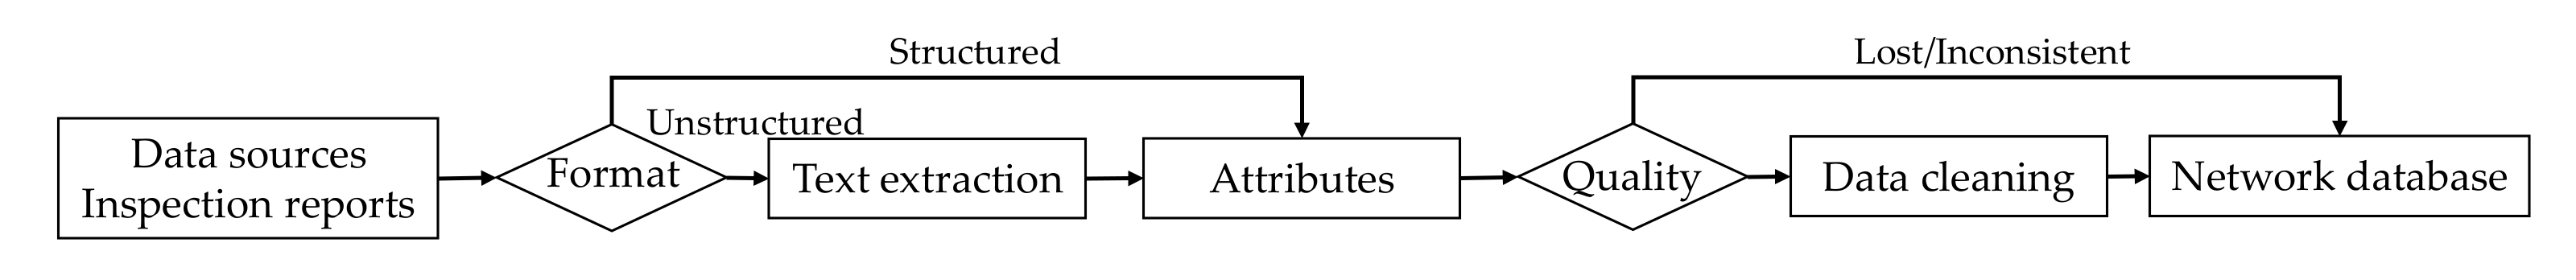
4.2. Data Integration Technique

Before training deterioration models, data in inspection reports should be extracted and translated into the machine-readable format. Data recorded in the inspection report can be classified as the structured data and unstructured data. Some oldest reports are stored as the paper format, which account for a small proportion of the total reports. They could be scanned into the electronic format and extracting data with the help of text extraction technology. Most of data are structured data; they are stored and summarized in the spreadsheets.
This study proposes a procedure to assemble these data into a uniform and machine-readable format. The regional database can be established with the procedure illustrated in Figure 4. The preserved human error and data missing impact the analysis accuracy and efficiency. The continuity and accuracy of data could be influenced by improper paper storage and broken electronic documents. Even for the preserved documents, it is difficult to unify these formats due to poor management and changing standards. Moreover, several data points are obtained through manual behaviors, which can lead to subjectivity, human error, etc. It is necessary to conduct data cleaning techniques to improve data quality. A common solution is using the redundant data of the same bridge from different sources to check the data correctness. Then, based on the data extraction and cleaning techniques, the regional bridge database can be established.
The measured multi-source dataset includes a variety of data types and formats. There are twenty kinds of parameters that could be extracted from inspection reports, and these could be represented as a series of attributes. Different attributes may have different data formats, such as numerical, ordinal, nominal, etc. Table 1 categorizes all selected attributes into these formats. The numerical type can be compared quantitatively. “Structure length”, for example, is a numerical attribute, which records the length of a bridge. In contrast, the ordinal data and nominal data are qualitative information. The comparison among qualitative values is unclear. For example, Bridge rating is ordinal, where Level 1 is better than Level 2. Meanwhile, “Structural type” is nominal whose value can be designated as “Slab,” “T-shape,” “Box,”, etc.

5. Condition Assessment Techniques

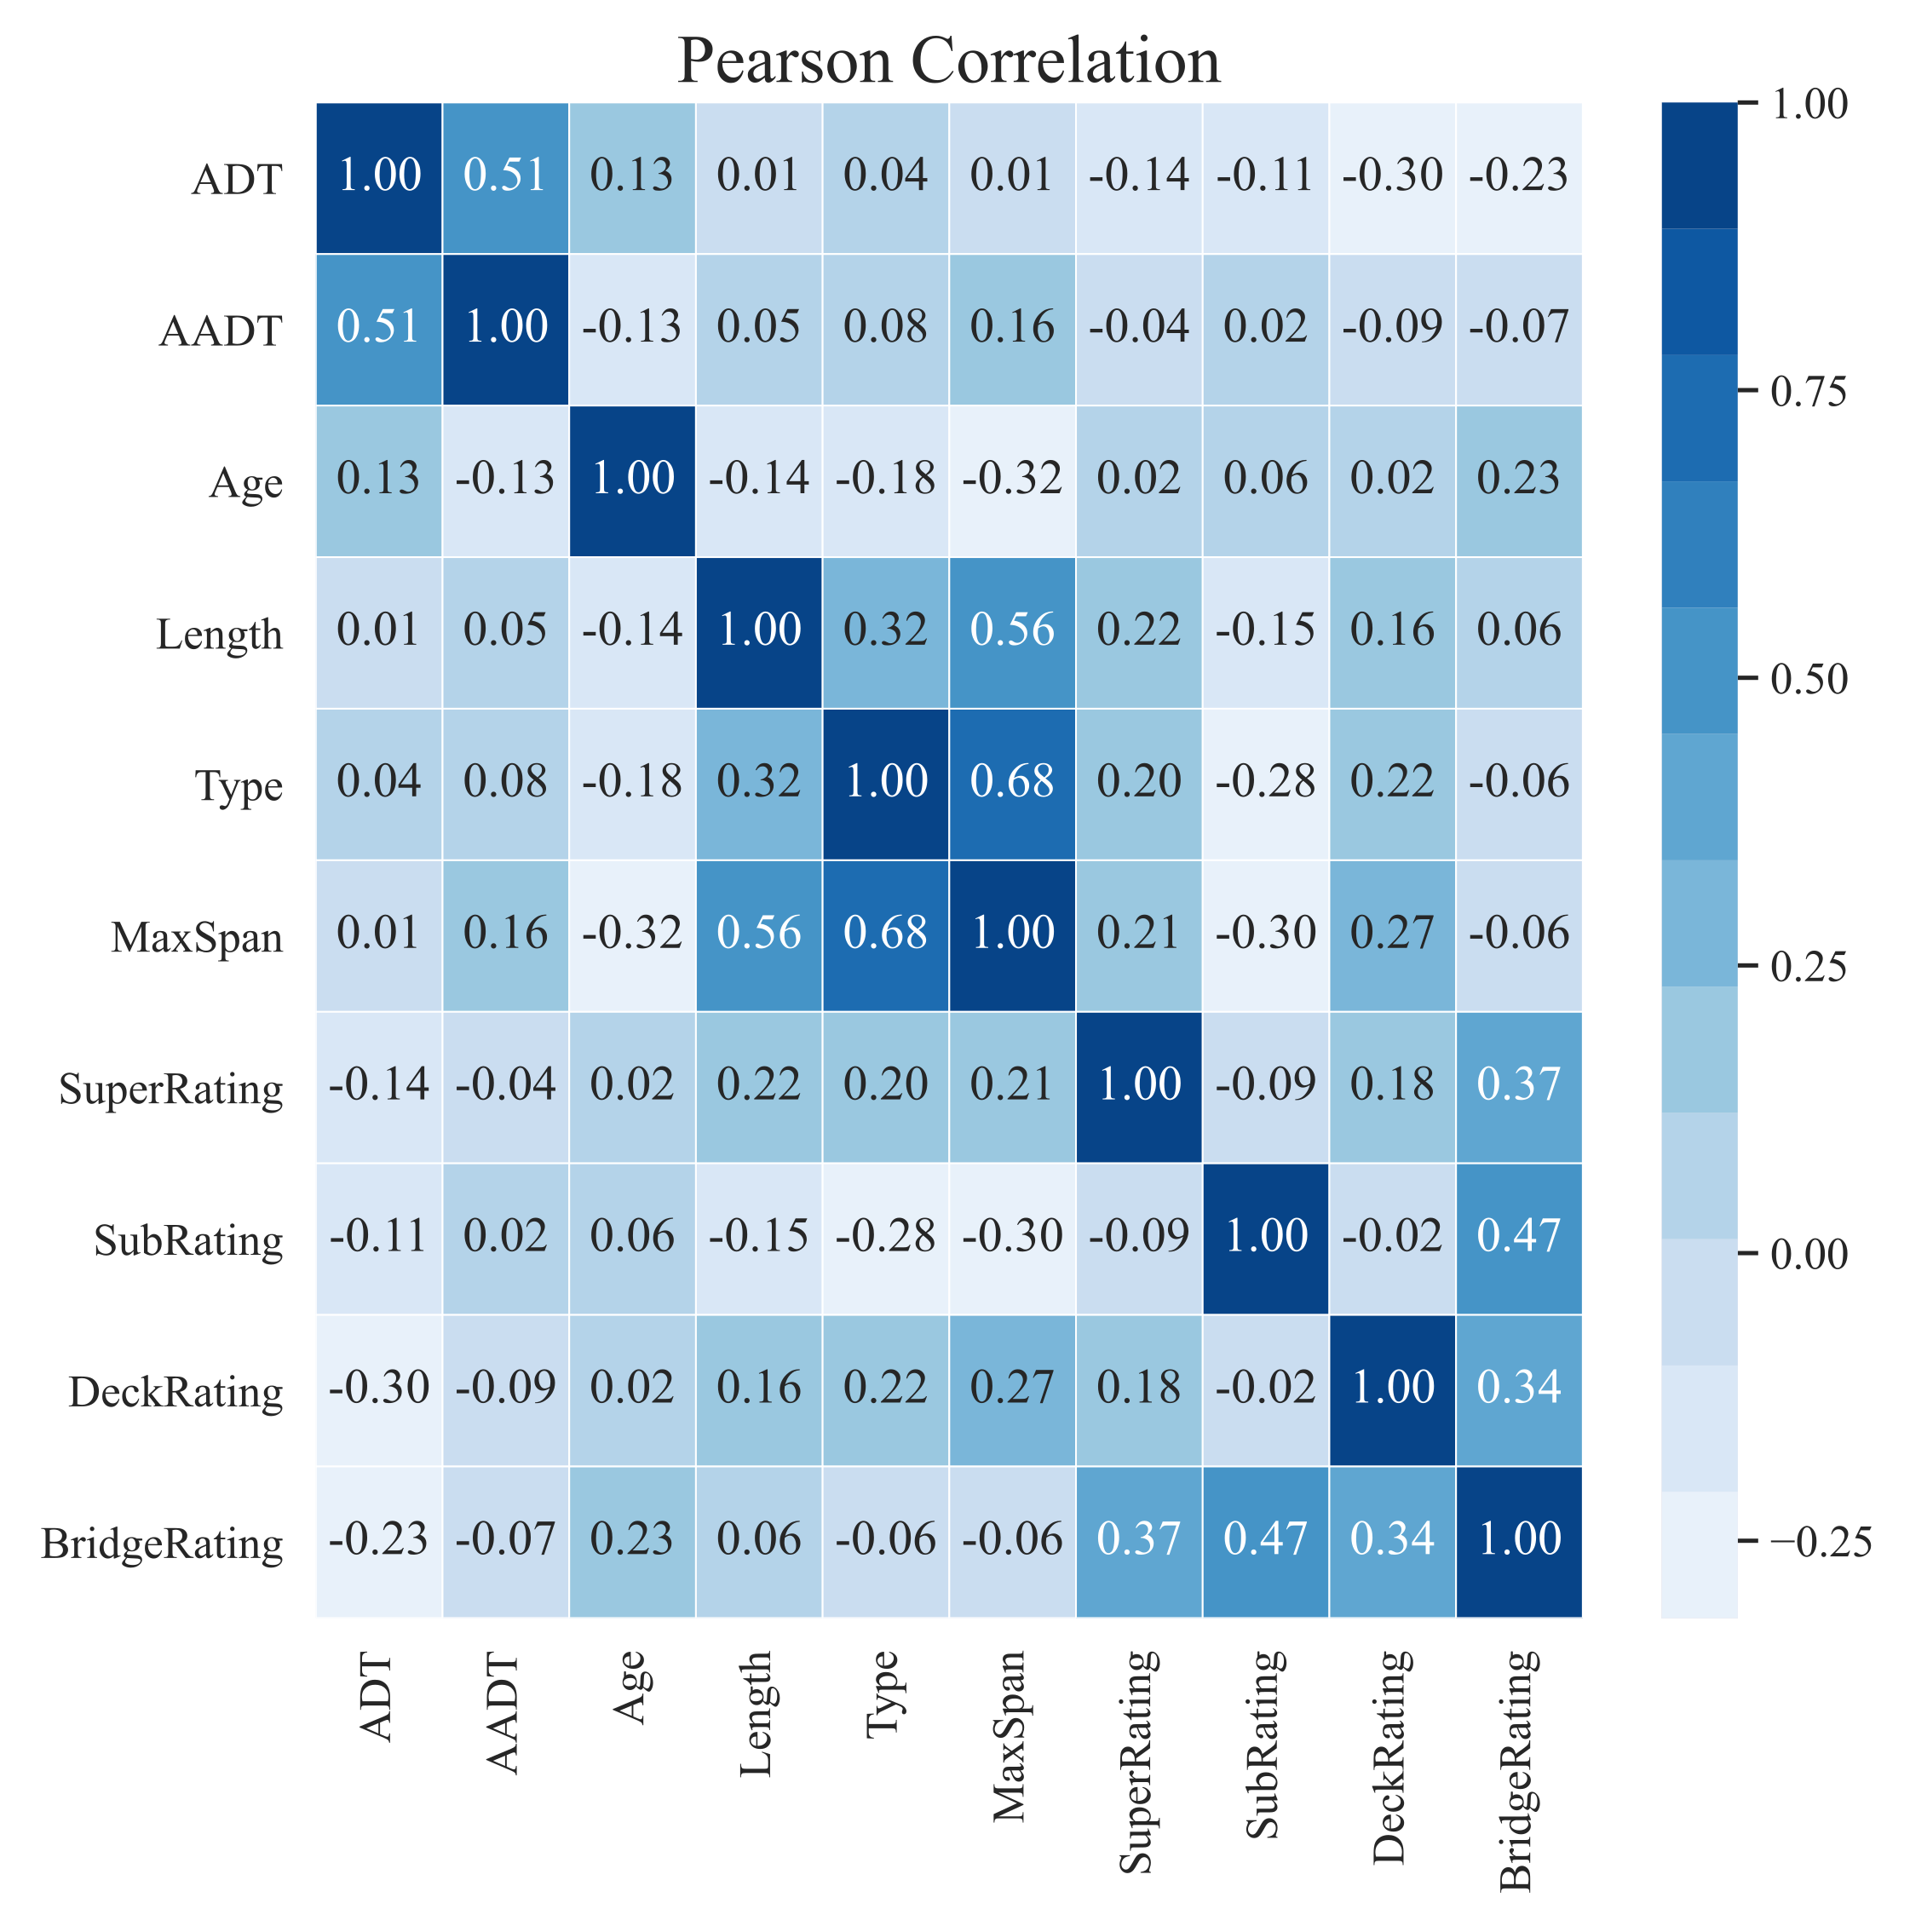
5.1. Feature Selection

The successful assessment of structural conditions depends on the appropriate selection of the main features and the careful description of its effects. As for regional bridge condition assessment, the features should not only have a potential contribution to the structural deterioration, but also reflect regional features. Thus, the features should be selected based on the comprehensive consideration of the bridge structure, deterioration condition, maintenance history, etc. Maintenance actions must be reflected in the deterioration model due to its direct effects on structural deterioration.
The data values imported from the database should be converted to computable formats. Different formats have their own conversion approaches. As for nominal values, the one-hot coding technique is employed, which means a nominal feature is encoded with a binary vector with only the specific category assigned by 1 and others assigned by 0. In order to reduce data redundancy and improve data integrity, the numeric and ordinal formats are normalized into the range of [0,1] with the min–max normalization method in the Equation (1):
a i j = m a x j a i j m a x j m i n j ; i = 1 , 2 , , m ; j = 1 , 2 , , n
where a i j denotes the original value of the j th feature of the i th sample; a i j denotes the corresponding converted value; and m a x j and m i n j denote the highest and lowest data value of the specified feature, respectively. Table 2 summarizes the feature set and their corresponding converted results.

5.2. Deterioration Model Establishment

For aging structures, the deterioration model usually plays a significant role in the estimation of the structural condition. Deterioration models should correctly describe the deteriorating effect and its variation over time. To describe the complex relationship among the regional features and structural conditions, an NN is employed to establish the deterioration model of regional bridges. NN could implicitly extract complex nonlinear relationships between dependent and independent variables, and detect all possible interactions between predictor variables. The overview of established NN for regional bridge condition assessment is shown in Figure 5.
Neural networks are composed of several neurons and links. These neurons are connected to transfer the information. Neurons receive inputs from up-layer neurons, and each neuron performs a different active function with certain weights and thresholds on the received data. Neural networks can include one input layer, one output layer, and one or more hidden layers. The input layer transforms the basic database into the neural network. The hidden layers extract the features and correlations from the input data and provide the results to the output layers.
The proper weights and thresholds of each neuron are the key to make the model reliable. In machine learning, the back-propagation algorithm is widely employed in NN training. It can efficiently compute the loss between the trained result and ground truth and propagate the loss to adjust the neuron weights. The gradient method makes it efficient to update model parameters and improve its performance each time. The data from the regional bridge database are split randomly in this study into a training set, a test set, and a validation set. The NN is trained with the training set to minimize the prediction and adjust the weights between connected neurons. The validation set is employed to find the optimal weights, and then the test set is used to estimate the efficiency of the network.
However, the structural condition distribution of the sample bridges suffers from a great imbalance, which means the standard mean square error (MSE) defined by Equation (2) may lead to significant deviation. For example, the proportion of bridge rating with level 1~3 accounts for over 90%, while the bridges in the poor condition constitute less than one-tenth. This imbalance will cause the NN to overfit the high-rating samples and underfit the low-rating samples. Therefore, this study proposes a modified MSE with a cost-sensitive formation to alleviate this imbalance impact. The modified MSE is shown in Equations (3) and (4).
M S E s t a n d a r d = 1 4 m i = 1 m Δ y i 2
Δ y = f x i y i = Δ y i , 1 , Δ y i , 2 , Δ y i , 3 , Δ y i , 4
M S E m o d i f i e d = 1 4 m i = 1 m j = 1 4 cos t j Δ y i , j 2
where f   denotes the neural network; m denotes the number of samples; and x i and y i denote the input and output, respectively. As there are four outputs, Δ y i , j j = 1 , 2 , 3 , 4 denotes these prediction errors with the j th output and the i th sample; and the cos t j denotes the cost-sensitive values of the j th output.
For model updates, it is not practical to monitor every bridge in the region, and the real-time model update is also impossible. Retraining and updating the model with an updated regional bridge database is an effective way to update the model. Generally, retraining the model does not need to collect the new data for all regional bridges, and the new inspection data of parts of regional bridges could accomplish the model update.

6. Maintenance Scheme Optimization Techniques

6.1. Objective Functions

In real cases, it is impossible to quantify all the preferences of decision makers as objective functions, which may result in excessive computational effort. There are two objective functions considered in this study. Function (1) is a cost indicator representing the total cost for bridge management. Function (2) is a safety indicator representing the total condition ratings of regional bridges. As a matter of fact, cost estimation is a complicated problem that can be figured in a variety of ways. In this study, the exact value is not important, so the costs are specified by the authors. As the deterioration features and maintenance works are considered in the unit level and system level, the cost estimation is roughly characterized by the number of maintenance behaviors in the bridge network during a given period. The units for the maintenance costs are set to 1, as the relative values are more important than the absolute ones. In the cost function, the maintenance cost of each bridge is weighted by the length of the bridge. The scale of the bridge is also one of the factors that affect the maintenance cost. This study briefly uses the length of the bridge to represent the scale of the bridge. The cost indicator ( I n d c ) and safety indicator ( I n d s ) could be expressed in the Equations (5) and (6), respectively.
I n d c = i = 1 n a c t i o n i × w e i g h t i
I n d s = i = 1 n c o n d i t i o n i
where, a c t i o n i denotes the planned action of the i th bridge in the inspection region, 0 means no action is taken, 1 means the bridge should be implement maintenance actions; n denotes the total number of bridges; and c o n d i t i o n i denotes the condition rating of the i th bridge in the inspection region, after the maintenance behavior is implemented (the condition value of Level 1, 2, 3, 4, and 5 represented as 0, 1, 2, 3, and 4, respectively).

6.2. Genetic Algorithms for Optimization Problems

GA is a powerful tool for solving the optimization problems, and it has been widely used in civil engineering fields to find a balance under considerable constraints. In any group of bridges, it is unrealistic to give every single bridge the most effective cost–benefit maintenance scheme. The regional balance should be made from the single-bridge view to the regional bridges view [47,48]. This algorithm reflects the process of natural selection, where the fittest individuals are selected for reproduction in order to produce the next generation of offspring. In this study, the chromosome represents a feasible solution to the specified problem. The fitness of each chromosome, representing the quality of the solution, is evaluated by a series of objective functions. The group of chromosomes forms a population that evolves as the algorithm iterates. Obviously, the cost indicator and safety indicator defined in this study, corresponding to the regional management scheme, should be the minimum. The objective optimization problem is presented in general as the following Equation (7).
minimize   I n d c x ,   x X minimize   I n d s x ,   x X subject   to   a i x i b i ,   i = 1 , , k ,
where, x = x 1 , , x k denotes the decision vector in the domain X R k ; I n d c x and I n d s x are defined as the objective functions to be optimized and minimized, respectively; and a i and b i are the lower and upper bounds of the decision vector component x i , respectively.
In this study, a nondominated sorting GA (NSGA-II) is used for the maintenance schedule optimizations of regional bridges. The fitness ranking under two objectives is computed with the nominated sorting approach. Specifically, scheme P is dominated by scheme Q, if Q has a higher ranking than P under either objective. In other words, P is the dominant solution and Q the non-dominant one. All the non-dominate solutions in a population are assigned to the non-dominant set F 1 , while the others are assigned to dominant sets F i i = 1 , 2 , , N 1 , where i equals to one plus the number of corresponding dominators of a solution. The concept of crowing distance is introduced to prevent premature convergence.

7. Applications on Existing Transportation Networks

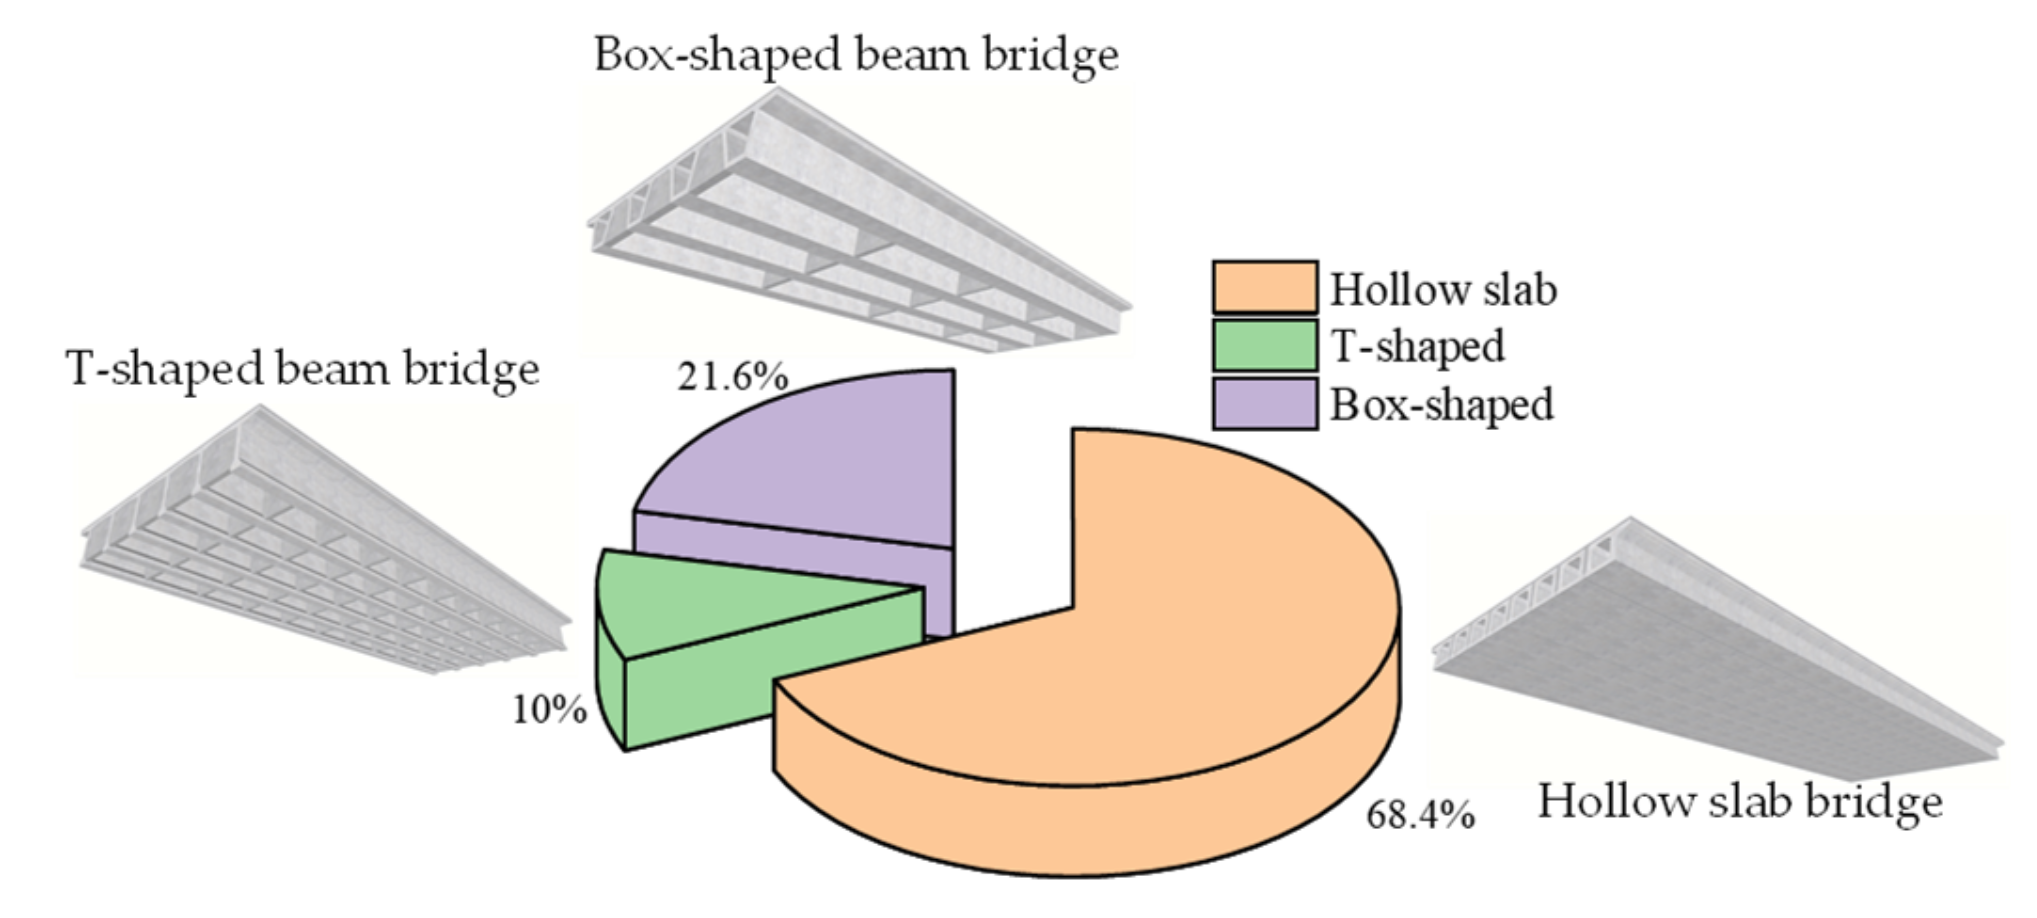
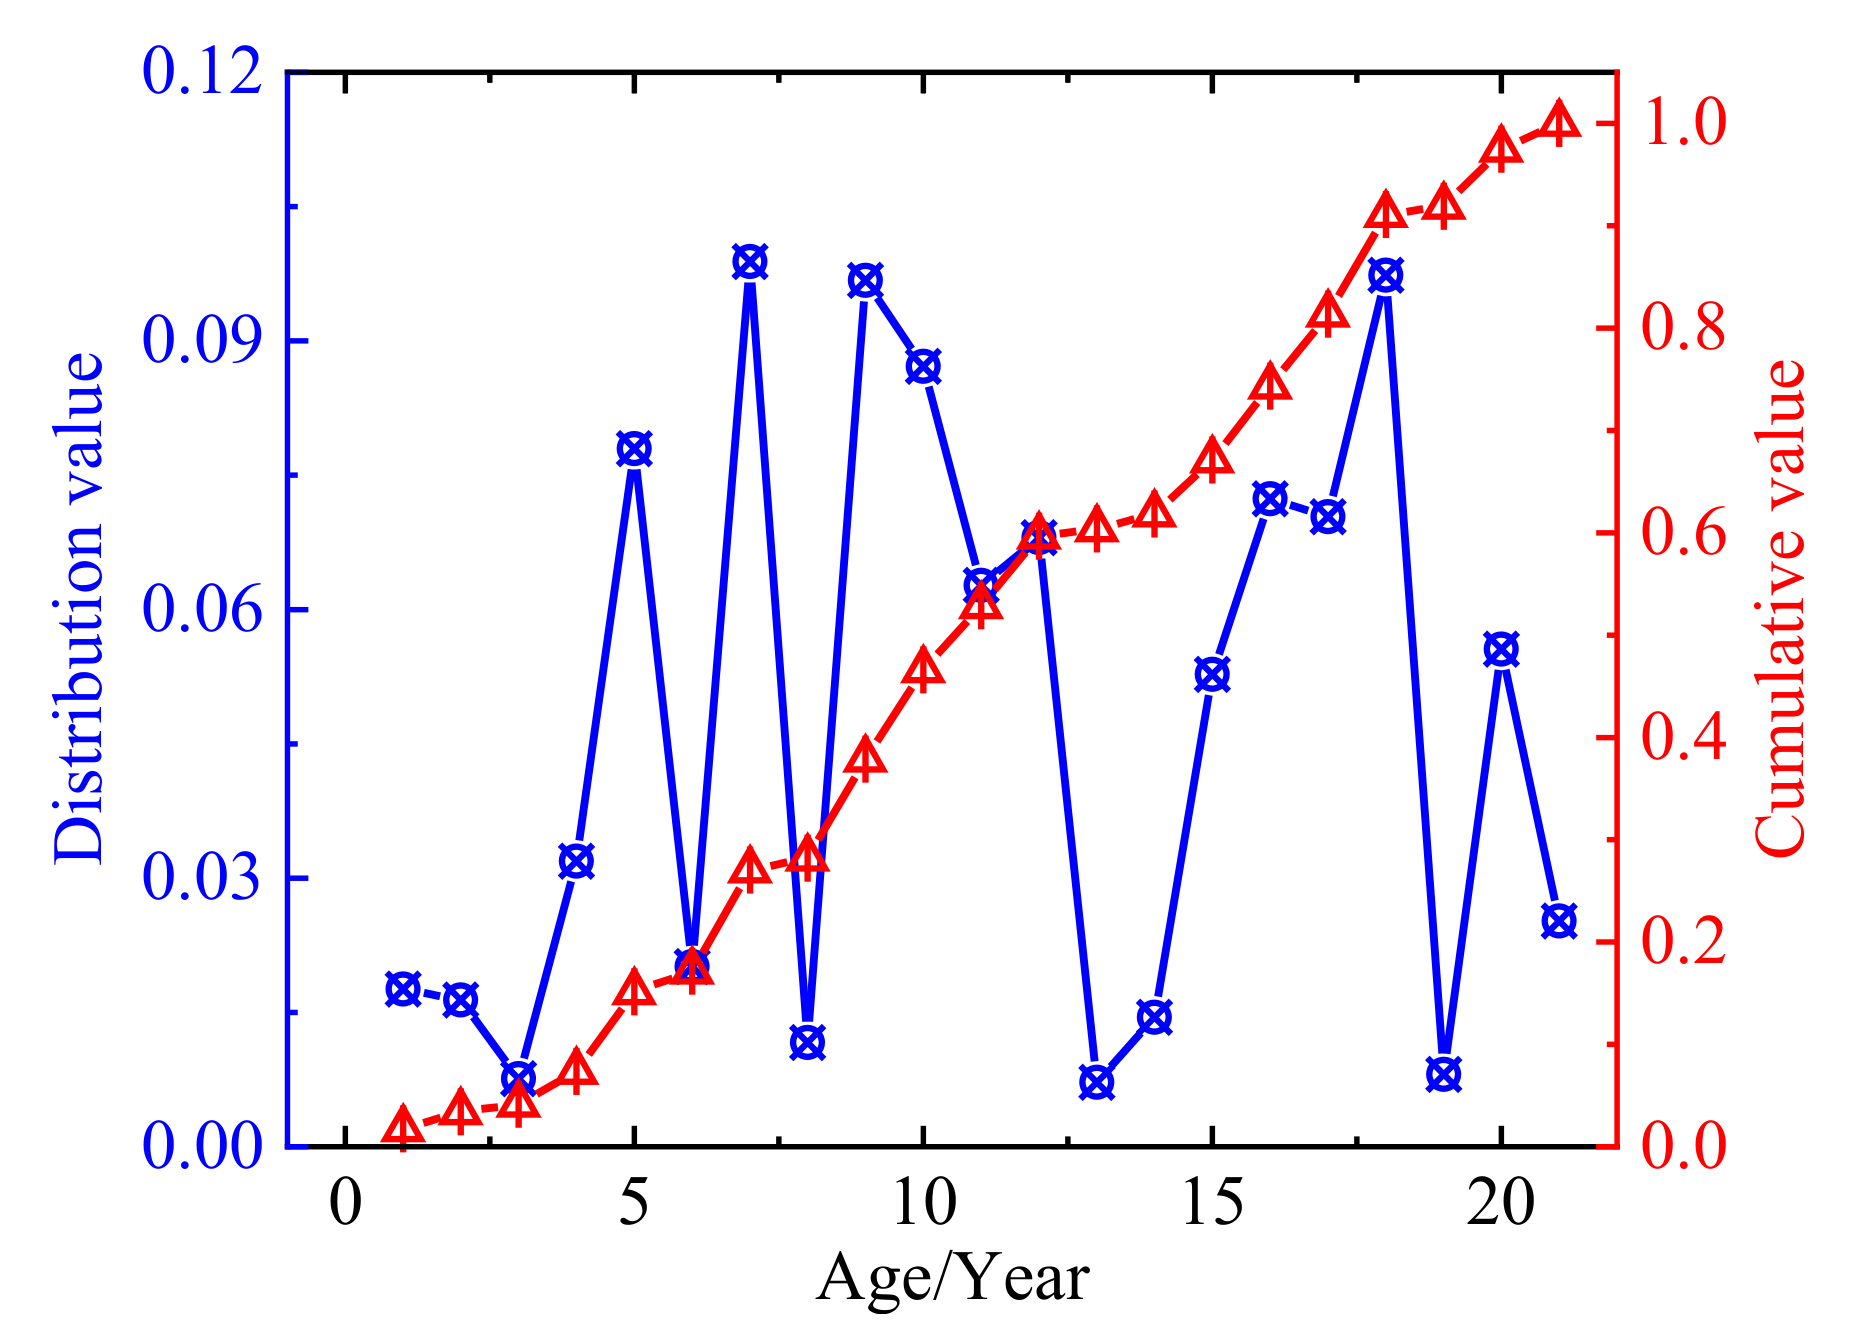
7.1. Database Overview

This paper uses bridge data in Hebei to establish the regional bridge database, assess the bridge conditions, and optimize the maintenance scheme. Hebei is a coastal province in northern China. The complex and diverse landscape leads to different climates in that region. Regarding the regional annual rainfall and temperature, three sub-regions are determined, shown in Figure 6. There are three main types of bridges, including: box-shaped beam bridges, hollow slab bridges, and T-shaped beam bridges. The percentage of each type of bridge in the area is also shown in the figure.
The regional bridge database is established using the proposed data extraction and integration techniques. The data collected from the regional inspection report covers the age of bridges ranging from 1 to 21 years. The bridge age distribution is shown in Figure 7. The bridge ages that account for more than 5% are 5, 7, 9 to 12, 15 to 18, and 20. It is noted that a relatively large number of bridges are distributed within each bridge age range, which also provides the possibility to model structural deteriorations. This makes it possible to extract both the deterioration features and the maintenance behavior effects of bridges through this database.
Figure 8 compares condition ratings of bridge main components (superstructure, substructure, and deck) in different sub-regions. The data is extracted from the bridges with an age of 5, which covers nearly 1000 measured bridges. According to Chinese rating codes, there are five condition levels for inspected bridge where Level 1 denotes bridges in the best condition. As we can see, nearly all of the inspected bridges in Hebei Province are categorized as either Level 1 or Level 2, which means most of the bridges remain in nearly intact or slightly damaged condition, which is likely due to continuous regular maintenance. The number of bridges in the low-condition zone is small. They might contain some potential risks that affect the service capacity of the transportation network and warrant more attention. By comparing all three components, it can be seen that the bridge deck is the most damaged structure. As these bridge components are directly exposed to both traffic wheels and the environment, the deck is more vulnerable than other bridge components.
Features used for deterioration models are listed in Section 4.1. A correlation matrix is a tool to investigate the potential relationships between two variables. Figure 9 summarizes correlation coefficient values of parts of the selected features. An absolute correlation coefficient value close to 1 indicates that the correlation between two variables is strong. It can be seen that the maximum absolute correlation coefficient value is 0.68 which is the correlation between “Structural type” and “Max span”. Other pairs of variables whose absolute correlation coefficient value slightly exceeds 0.5 are “ADT” and “AADT”, and “Length” and “Max span”. However, the correlation between these variable pairs is still not strong. Moreover, most of the variable pairs listed here have low absolute correlation values. It is worth noting that the features selected to be trained in the database are statistical independently.

7.2. Condition Assessment Performance

The entire regional bridge database contains various structural condition-related features (i.e., the deterioration of materials or the service periods of bridge), and these measured data have a significant impact on extracting the structural deterioration features and prioritizing the maintenance interventions. Thus, the entire database should be randomly split into the training, validation, and test dataset to make them contain sufficient structural features and improve the generalization of the training model.
In the model training step for this study, the database is randomly split into a training set (80%), a validation set (10%), and a test set (10%). As the training dataset is not too large, the number of layers is set as four. The NN is trained with the training set to minimize the prediction error. The validation test is performed to find the optimal weights, and then the test set is used to estimate the efficiency of the network. The ideal trained models are expected to indicate the general law of bridge deterioration and effectively generalized to other bridge networks.
The parametric studies of the optimal architecture of the proposed method are analyzed in order to obtain the optimal degradation model to assess the condition. There are three NN candidate models selected with three different cost-sensitive values. In Model 1, the cost-sensitive values for each category are one. It represents the common cost function and set as the control group. In Model 2, the cost-sensitive values for Level 1 to Level 5 are set as 0.75, 0.85, 0.91, 0.96, and 1.00, respectively. In Model 3, the cost-sensitive values for Level 1 to Level 5 are set as 0.50, 0.67, 0.80, 0.91, and 1.00, respectively. The cost of low-rated samples is gradually increased to make up their impacts.
A C C = i = 1 5 r i i i = 1 5 j = 1 5 r i j
where r i j denotes the component of the confusion matrix at the i th row and the j th column.
An indicator A C C (shown in Equation (8)) is defined to evaluate the overall model performance using the test set. The corresponding results of three NN models are illustrated in Table 3. After running a comparison, the Model 2 is identified as the most optimal one, which is then selected to represent the bridge deterioration. Based on this model, the prediction performance of bridge system, superstructure, substructure, and deck are 85.76%, 77.04%, 84.64%, and 78.64%, respectively. Using this model, it is possible to accurately evaluate and predict the condition of regional bridges while considering environmental deterioration, external loads, and maintenance actions.

7.3. Regional Maintenance Scheme Optimizations

There are 2000 highway bridges designed to be optimized via their maintenance actions for the next year. The optimal maintenance scheme should strike a balance between the maintenance costs and the overall conditions. With the NSGA-II optimization method, the chromosome is in the form of a 2000 × 3 matrix. x i t i = 1 , , 2000 ; t = 1 , 2 , 3 indicates the maintenance action for the component t of bridge i . The vector in each row is composed of three elements, representing whether there is maintenance behavior for the three components, respectively. For example, the vector 1 , 1 , 0 denotes that the corresponding bridge will require maintenance in superstructure and substructure parts. For the parameter settings, the population size and the generation quantity are designated as 1000. The probabilities of crossover and mutation are 90% and 10%, respectively.
Groups of bridges need to be well managed with a limited resource. Therefore, the cost indicator and safety indicator defined in this study corresponding to the regional management scheme should be the simultaneously minimized. Figure 10 shows optimal maintenance schemes (red points) for this transportation network. Each point represents an optimal solution that satisfies the given constraints and objectives. There are 122 optimal maintenance schemes selected from the genetic evolution. A total of 86 schemes belong to economy maintenance schemes, and 68 maintenance schemes belong to safety schemes.
Figure 11 compares the condition rating distributions of the previous year, the next year with economy scheme, and the next year with safety scheme. The initial condition rating distribution is marked with red bars. Among these three conditions, the initial condition of Level 1 bridges accounted for the least proportion, and the proportion of Level 2 and Level 3 bridges is the largest. After the maintenance actions implemented, the overall bridge ratings are improved in both the economy scheme (41.95, 737) and safety scheme (158.205, 319). The economy plan, which is marked as orange bars in Figure 11, moderately increases the overall condition level with less maintenance actions. It requires less budget. The safety scheme (red bars in Figure 11) maintains most of bridges in the best condition, but the total budget may be excessive. Nearly 80% of bridges are maintained at Level 1. The optimal maintenance schemes in Figure 11 could be chosen to improve the overall conditions, according to actual structural conditions, management requirements, and total budget.

8. Conclusions

This paper proposes a complete regional condition assessment methodology to benefit maintenance practices. This methodology includes data integration, deterioration prediction, and maintenance optimization, and is validated with a real transportation network.
Bridge conditions can be determined with the help of condition-related inspection technologies. Remote sensing and other advanced emerging technologies increase the efficiency and capability of inspection works. The bridge inspection report integrates datasets collected with different advanced bridge inspection techniques and is an efficient way to provide condition-related information of regional bridges. The data extraction method proposed in this study integrates and cleans the regional multi-year bridge inspection data, and the established regional bridge database provides the solid basis for the condition assessment. Worldwide, short- and medium-span beam bridges are the most dominant bridge types in the regional transportation network. As they have common characteristics and comparable management strategies, this study established a data-driven model based on the regional bridge database to extract regional deterioration characteristics and assess structural conditions. Years of regional bridge inspection data also imply the effect of bridge maintenance. The regional maintenance schemes are effectively optimized with the genetic algorithms. This study outputs several optimal maintenance schemes for 2000 regional bridges. Each individual optimal scheme represents and satisfies the constraint of maintenance costs and safety conditions. They could be roughly classified as the safety preference scheme and economy preference scheme. A bridge manager could choose the most appropriate scheme according to actual structural conditions, maintenance requirements, and total budget.

Author Contributions

Conceptualization, Y.X. and L.S.; Data curation, Y.X. and P.W.; Formal analysis, X.L. and P.W.; Funding acquisition, Y.X., X.L. and L.S.; Investigation, Y.X., X.L. and P.W.; Methodology, Y.X. and X.L.; Project administration, Y.X. and L.S.; Resources, L.S.; Software, X.L. and P.W.; Supervision, Y.X. and L.S.; Validation, Y.X.; Visualization, X.L. and P.W.; Writing—original draft, X.L.; Writing—review & editing, Y.X. All authors have read and agreed to the published version of the manuscript.

Funding

This paper is supported by the National Key Research and Development Program of China (2017YFC1500605), Transportation Science and Technology Program of Shandong Province (2021B51), National Natural Science Foundation of China (51978508), Technology Cooperation Project of Shanghai Qizhi Institute (SYXF0120020109), and China Scholarship Council (201906260157).

Institutional Review Board Statement

Not applicable.

Informed Consent Statement

Not applicable.

Data Availability Statement

Data is contained within the article.

Conflicts of Interest

The authors declare no conflict of interest.

References

  1. Rashidi, M.; Samali, B.; Sharafi, P. A new model for bridge management: Part A: Condition assessment and priority ranking of bridges. Aust. J. Civ. Eng. 2016, 14, 35–45. [Google Scholar] [CrossRef] [Green Version]
  2. Rashidi, M.; Samali, B.; Sharafi, P. A new model for bridge management: Part B: Decision support system for remediation planning. Aust. J. Civ. Eng. 2016, 14, 46–53. [Google Scholar] [CrossRef] [Green Version]
  3. Shi, J.; Fang, W.S.; Wang, Y.J.; Zhao, Y. Measurements and analysis of track irregularities on high speed maglev lines. J. Zhejiang Univ.-Sci. A 2014, 15, 385–394. [Google Scholar] [CrossRef] [Green Version]
  4. Pourzeynali, S.; Zhu, X.; Zadeh, A.G.; Rashidi, M.; Samali, B. Comprehensive Study of Moving Load Identification on Bridge Structures Using the Explicit Form of Newmark-β Method: Numerical and Experimental Studies. Remote Sens. 2021, 13, 2291. [Google Scholar] [CrossRef]
  5. Lei, J.; Lozano-Galant, J.A.; Xu, D.; Turmo, J. Structural system identification by measurement error-minimizing observability method. Struct. Control Health Monit. 2019, 26, e2425. [Google Scholar] [CrossRef]
  6. Emadi, S.; Lozano-Galant, J.A.; Xia, Y.; Ramos, G.; Turmo, J. Structural system identification including shear deformation of composite bridges from vertical deflections. Steel Compos. Struct. 2019, 32, 731–741. [Google Scholar] [CrossRef]
  7. Lei, X.M.; Sun, L.M.; Xia, Y. Lost data reconstruction for structural health monitoring using deep convolutional generative adversarial networks. Struct. Health Monit.-Int. J. 2021, 20, 2069–2087. [Google Scholar] [CrossRef]
  8. Li, Y.X.; Sun, L.M.; Zhang, W.; Nagarajaiah, S. Bridge damage detection from the equivalent damage load by multitype measurements. Struct. Control Health Monit. 2021, 28, e2709. [Google Scholar] [CrossRef]
  9. Chen, L.; Nagarajaiah, S.; Sun, L.M. A unified analysis of negative stiffness dampers and inerter-based absorbers for multimode cable vibration control. J. Sound Vib. 2021, 494, 115814. [Google Scholar] [CrossRef]
  10. Remondino, F. Heritage Recording and 3D Modeling with Photogrammetry and 3D Scanning. Remote Sens. 2011, 3, 1104–1138. [Google Scholar] [CrossRef] [Green Version]
  11. Peng, T.; Nogal, M.; Casas, J.R.; Turmo, J. Role of Sensors in Error Propagation with the Dynamic Constrained Observability Method. Sensors 2021, 21, 2918. [Google Scholar] [CrossRef]
  12. Rashidi, M.; Mohammadi, M.; Kivi, S.S.; Abdolvand, M.M.; Linh, T.H.; Samali, B. A Decade of Modern Bridge Monitoring Using Terrestrial Laser Scanning: Review and Future Directions. Remote Sens. 2020, 12, 3796. [Google Scholar] [CrossRef]
  13. Jung, S.; Choi, D.; Song, S.; Myung, H. Bridge Inspection Using Unmanned Aerial Vehicle Based on HG-SLAM: Hierarchical Graph-Based SLAM. Remote Sens. 2020, 12, 3022. [Google Scholar] [CrossRef]
  14. Kim, H.; Kim, C. Deep-Learning-Based Classification of Point Clouds for Bridge Inspection. Remote Sens. 2020, 12, 3757. [Google Scholar] [CrossRef]
  15. Kumar, V.; Morris, I.M.; Lopez, S.A.; Glisic, B. Identifying Spatial and Temporal Variations in Concrete Bridges with Ground Penetrating Radar Attributes. Remote Sens. 2021, 13, 1846. [Google Scholar] [CrossRef]
  16. Ortiz-Sanz, J.; Gil-Docampo, M.; Arza-Garcia, M.; Canas-Guerrero, I. IR Thermography from UAVs to Monitor Thermal Anomalies in the Envelopes of Traditional Wine Cellars: Field Test. Remote Sens. 2019, 11, 1424. [Google Scholar] [CrossRef]
  17. Zollini, S.; Alicandro, M.; Dominici, D.; Quaresima, R.; Giallonardo, M. UAV Photogrammetry for Concrete Bridge Inspection Using Object-Based Image Analysis (OBIA). Remote Sens. 2020, 12, 3180. [Google Scholar] [CrossRef]
  18. Jung, J.; Kim, D.J.; Vadivel, S.K.P.; Yun, S.H. Long-Term Deflection Monitoring for Bridges Using X and C-Band Time-Series SAR Interferometry. Remote Sens. 2019, 11, 1258. [Google Scholar] [CrossRef] [Green Version]
  19. D’Amico, F.; Gagliardi, V.; Ciampoli, L.B.; Tosti, F. Integration of InSAR and GPR techniques for monitoring transition areas in railway bridges. NDT E Int. 2020, 115, 102291. [Google Scholar] [CrossRef]
  20. Gagliardi, V.; Benedetto, A.; Ciampoli, L.B.; D’Amico, F.; Alani, A.; Tosti, F. Health monitoring approach for transport infrastructure and bridges by satellite remote sensing Persistent Scatterer Interferometry (PSI). In Earth Resources and Environmental Remote Sensing/Gis Applications Xi, Proceedings of SPIE, Online, 21–24 September 2020; Schultz, K., Michel, U., Nikolakopoulos, K.G., Eds.; International Society for Optics and Photonics: Bellingham, WA, USA, 2020; Volume 11534. [Google Scholar]
  21. Tosti, F.; Gagliardi, V.; D’Amico, F.; Alani, A.M. Transport infrastructure monitoring by data fusion of GPR and SAR imagery information. Transp. Res. Procedia 2020, 45, 771–778. [Google Scholar] [CrossRef]
  22. Xiong, S.T.; Wang, C.S.; Qin, X.Q.; Zhang, B.C.; Li, Q.Q. Time-Series Analysis on Persistent Scatter-Interferometric Synthetic Aperture Radar (PS-InSAR) Derived Displacements of the Hong Kong-Zhuhai-Macao Bridge (HZMB) from Sentinel-1A Observations. Remote Sens. 2021, 13, 546. [Google Scholar] [CrossRef]
  23. Ciampoli, L.B.; Gagliardi, V.; Clementini, C.; Latini, D.; Del Frate, F.; Benedetto, A. Transport Infrastructure Monitoring by InSAR and GPR Data Fusion. Surv. Geophys. 2020, 41, 371–394. [Google Scholar] [CrossRef]
  24. Solla, M.; Laguela, S.; Fernandez, N.; Garrido, I. Assessing Rebar Corrosion through the Combination of Nondestructive GPR and IRT Methodologies. Remote Sens. 2019, 11, 1705. [Google Scholar] [CrossRef] [Green Version]
  25. Alani, A.M.; Tosti, F.; Ciampoli, L.B.; Gagliardi, V.; Benedetto, A. An integrated investigative approach in health monitoring of masonry arch bridges using GPR and InSAR technologies. NDT E Int. 2020, 115, 102288. [Google Scholar] [CrossRef]
  26. Lei, X.M.; Sun, L.M.; Xia, Y.; He, T.T. Vibration-Based Seismic Damage States Evaluation for Regional Concrete Beam Bridges Using Random Forest Method. Sustainability 2020, 12, 5106. [Google Scholar] [CrossRef]
  27. Jiangu, L.Z.; He, W.K.; Wei, B.; Wang, Z.W.; Li, S.S. The shear pin strength of friction pendulum bearings (FPB) in simply supported railway bridges. Bull. Earthq. Eng. 2019, 17, 6109–6139. [Google Scholar] [CrossRef]
  28. Wang, A.; Zhang, Z.; Lei, X.; Xia, Y.; Sun, L. All-Weather Thermal Simulation Methods for Concrete Maglev Bridge Based on Structural and Meteorological Monitoring Data. Sensors 2021, 21, 5789. [Google Scholar] [CrossRef]
  29. Xia, Y.; Lei, X.M.; Wang, P.; Liu, G.M.; Sun, L.M. Long-term performance monitoring and assessment of concrete beam bridges using neutral axis indicator. Struct. Control Health Monit. 2020, 27, e2637. [Google Scholar] [CrossRef]
  30. Lei, X.M.; Sun, L.M.; Xia, Y. Seismic fragility assessment and maintenance management on regional bridges using bayesian multi-parameter estimation. Bull. Earthq. Eng. 2021, 18, 1–25. [Google Scholar] [CrossRef]
  31. Bektas, B.A.; Carriquiry, A.; Smadi, O. Using Classification Trees for Predicting National Bridge Inventory Condition Ratings. J. Infrastruct. Syst. 2013, 19, 425–433. [Google Scholar] [CrossRef]
  32. Nasrollahi, M.; Washer, G. Estimating inspection intervals for bridges based on statistical analysis of national bridge inventory data. J. Bridge Eng. 2015, 20, 04014104. [Google Scholar] [CrossRef]
  33. Liu, H.; Zhang, Y.F. Bridge condition rating data modeling using deep learning algorithm. Struct. Infrastruct. Eng. 2020, 16, 1447–1460. [Google Scholar] [CrossRef]
  34. Kiani, J.; Camp, C.; Pezeshk, S. On the application of machine learning techniques to derive seismic fragility curves. Comput. Struct. 2019, 218, 108–122. [Google Scholar] [CrossRef]
  35. Zhao, H.W.; Ding, Y.L.; Li, A.Q.; Sheng, W.; Geng, F.F. Digital modeling on the nonlinear mapping between multi-source monitoring data of in-service bridges. Struct. Control Health Monit. 2020, 27, e2618. [Google Scholar] [CrossRef]
  36. Huang, Y.H. Artificial Neural Network Model of Bridge Deterioration. J. Perform. Constr. Facil. 2010, 24, 597–602. [Google Scholar] [CrossRef]
  37. Li, Z.; Burgueno, R. Using Soft Computing to Analyze Inspection Results for Bridge Evaluation and Management. J. Bridge Eng. 2010, 15, 430–438. [Google Scholar] [CrossRef]
  38. Sabatino, S.; Frangopol, D.M.; Dong, Y. Life cycle utility-informed maintenance planning based on lifetime functions: Optimum balancing of cost, failure consequences and performance benefit. Struct. Infrastruct. Eng. 2016, 12, 830–847. [Google Scholar] [CrossRef]
  39. Frangopol, D.M.; Dong, Y.; Sabatino, S. Bridge life-cycle performance and cost: Analysis, prediction, optimisation and decision-making. Struct. Infrastruct. Eng. 2017, 13, 1239–1257. [Google Scholar] [CrossRef]
  40. Ghasemi, S.H.; Nowak, A.S. Target reliability for bridges with consideration of ultimate limit state. Eng. Struct. 2017, 152, 226–237. [Google Scholar] [CrossRef]
  41. Gidaris, I.; Padgett, J.E.; Barbosa, A.R.; Chen, S.R.; Cox, D.; Webb, B.; Cerato, A. Multiple-Hazard Fragility and Restoration Models of Highway Bridges for Regional Risk and Resilience Assessment in the United States: State-of-the-Art Review. J. Struct. Eng. 2017, 143, 04016188. [Google Scholar] [CrossRef]
  42. Mackie, K.R.; Wong, J.M.; Stojadinovic, B. Post-earthquake bridge repair cost and repair time estimation methodology. Earthq. Eng. Struct. Dyn. 2010, 39, 281–301. [Google Scholar] [CrossRef]
  43. Liu, M.; Frangopol, D.M. Probability-based bridge network performance evaluation. J. Bridge Eng. 2006, 11, 633–641. [Google Scholar] [CrossRef]
  44. Soliman, M.; Frangopol, D.M.; Mondoro, A. A probabilistic approach for optimizing inspection, monitoring, and maintenance actions against fatigue of critical ship details. Struct. Saf. 2016, 60, 91–101. [Google Scholar] [CrossRef] [Green Version]
  45. Ozdemir, E.; Remondino, F.; Golkar, A. An Efficient and General Framework for Aerial Point Cloud Classification in Urban Scenarios. Remote Sens. 2021, 13, 1985. [Google Scholar] [CrossRef]
  46. Bocchini, P.; Frangopol, D.M. A probabilistic computational framework for bridge network optimal maintenance scheduling. Reliab. Eng. Syst. Saf. 2011, 96, 332–349. [Google Scholar] [CrossRef]
  47. Ouyang, M.; Duenas-Osorio, L.; Min, X. A three-stage resilience analysis framework for urban infrastructure systems. Struct. Saf. 2012, 36–37, 23–31. [Google Scholar] [CrossRef]
  48. Ouyang, M.; Duenas-Osorio, L. An approach to design interface topologies across interdependent urban infrastructure systems. Reliab. Eng. Syst. Saf. 2011, 96, 1462–1473. [Google Scholar] [CrossRef]
Figure 1. Condition ratings with the advanced bridge inspection technologies.
Remotesensing 13 03687 g001
Figure 2. Relationship among component ratings, unit ratings, and system ratings.
Remotesensing 13 03687 g002
Figure 3. General information and inspection information extracted from inspection reports.
Remotesensing 13 03687 g003
Figure 4. Data extraction and integration flow chart.
Remotesensing 13 03687 g004
Figure 5. The topology of the neural network based on the specified features.
Remotesensing 13 03687 g005
Figure 6. Percentage of the amount of bridges of each type in Hebei Province.
Remotesensing 13 03687 g006
Figure 7. Age distribution of these measured data.
Remotesensing 13 03687 g007
Figure 8. Superstructure, substructure, and deck ratings for bridges with an age of 5 years.
Remotesensing 13 03687 g008
Figure 9. Pearson correlation matrix of selected attributes.
Remotesensing 13 03687 g009
Figure 10. The optimal maintenance schemes for 2000 bridges.
Remotesensing 13 03687 g010
Figure 11. Comparison of the optimal maintenance schemes.
Remotesensing 13 03687 g011
Table 1. Typical attributes of a bridge network.
GroupsAttributesFormats
1Kilometerpoint, Age, Width, Structure length, Year built, Last maintenance, ADT, ADTT, and Inspection dateNumerical
2Route code, Route name, Bridge code, Bridge name, Structural type, Climate, and OwnerNominal
3Bridge rating, Superstructure rating, Substructure rating, Deck rating, and Maintenance actionOrdinal
Table 2. Selected features and their data value conversion.
No.FeatureOriginal ValueConverted Value
1Region1, 2, 3(1,0,0), (0,1,0), (0,0,1)
2ADTmin = 4912, max = 23,731min = 0, max = 1
3ADTTmin = 625, max = 13,798min = 0, max = 1
4Age *min = 1, max = 21min = 0, max = 1
5Lengthmin = 5, max = 2000min = 0, max = 1
6Structural TypeSlab, T-shape,
Box, Other
(1,0,0,0), (0,1,0,0),
(0,0,1,0), (0,0,0,1)
7Max Spanmin = 5, max = 146min = 0, max = 1
8Bridge Rating1, 2, 3, 4, 50.2, 0.4, 0.6, 0.8, 1
9Superstructure Rating1, 2, 3, 4, 50.2, 0.4, 0.6, 0.8, 1
10Substructure Rating1, 2, 3, 4, 50.2, 0.4, 0.6, 0.8, 1
11Deck Rating1, 2, 3, 4, 50.2, 0.4, 0.6, 0.8, 1
12Superstructure Maintenance0, 10, 1
13Substructure Maintenance0, 10, 1
14Deck Maintenance0, 10, 1
* Age = inspection year—built year.
Table 3. Prediction accuracy of bridge units and system for each model.
ModelsBridge SystemSuperstructureSubstructureDeck
Model 175.68%76.80%83.64%77.12%
Model 285.76%77.04%84.64%78.64%
Model 382.56%76.32%82.24%77.44%
Publisher’s Note: MDPI stays neutral with regard to jurisdictional claims in published maps and institutional affiliations.

