Technical Note

Spatio-Temporal Variations of Precipitable Water Vapor and Horizontal Tropospheric Gradients from GPS during Typhoon Lekima

1
Meteorological Observation Centre of China Meteorological Administration, Beijing 100081, China
2
GNSS Research Center, Wuhan University, Wuhan 430079, China
3
Key Laboratory of Beibu Gulf Environment Change and Resources Utilization of Ministry of Education, Nanning Normal University, Nanning 530001, China
*
Author to whom correspondence should be addressed.
Remote Sens. 2021, 13(20), 4082; https://0-doi-org.brum.beds.ac.uk/10.3390/rs13204082
Submission received: 25 August 2021 / Revised: 2 October 2021 / Accepted: 7 October 2021 / Published: 13 October 2021

Abstract

:
GPS data during Typhoon Lekima at 700 stations in China were processed by the Precise Point Positioning (PPP) method. A refined regional Tm model was used to derive the precipitable water vapor (PWV) at these GPS stations. Spatio-temporal variations of PWV with the typhoon process were analyzed. As the typhoon approached, PWV at stations near the typhoon center increased sharply from about 50 mm to nearly 80 mm and then dropped back to about 40–50 mm as the typhoon left. Comparisons of GPS, radiosonde, the Global Data Assimilation System (GDAS) Global Forecast System (GFS) analysis products and ERA5 reanalysis products at four matched GPS-RS stations show overall overestimations of PWV from radiosonde, GFS and ERA5 compared with GPS in a statistical perspective. An empirical orthogonal functions (EOF) analysis of the PWV during the typhoon event revealed some different patterns of variability, with both the first EOF (~36.1% of variance) and second EOF (~30.3% of variance) showing distinctively large anomalies over the typhoon landing locations. The typhoon caused a large horizontal tropospheric gradient (HTG) with the magnitude reaching 5 mm and the direction pointing to the typhoon center when it made a landfall on mainland China. The magnitude and the consistency of the HTG direction decreased overall as the typhoon weakened.

1. Introduction

The typhoon is a mature tropical cyclone that develops at the Northwestern Pacific Basin, generally accompanied by heavy rain and strong winds. Information about atmospheric water vapor is of particular importance to the study of the typhoon as it is the main source of precipitation, and it plays a crucial role in the energy system of typhoon dynamics [1]. For example, one could expect very strong vertical water vapor gradients with wet layers related to updrafts near the center of the typhoon, and dry areas related to downdrafts and stratosphere–troposphere exchanges [2,3]. The radiosonde is one of the most commonly used tools for measuring atmospheric water vapor. However, the radiosonde instruments are generally operated twice daily at most stations, resulting in a relatively low time resolution of water vapor measurements, which hampers its applications in the studies of extreme weather events such as storms and typhoons. The satellite-based (near) infrared radiometers, however, are affected by the cloudy weather conditions which are extremely common during a typhoon event. The satellite-based microwave radiometer can provide reliable water vapor information over the ocean, but the accuracy is relatively lower for over the land due to the complex emissivity. Recent studies show that a microwave radiometer over land determines precipitable water vapor (PWV) with accuracy of about 4.94 mm when comparing with Atmospheric Infrared Sounder (AIRS) [4].
The ground-based Global Positioning System (GPS), or Global Navigation Satellite System (GNSS), has the advantages of high-accuracy, low-cost, high temporal resolution and can work during all weather conditions compared with other water vapor measuring tools [5]. The ground-based GNSS has been taken as the first priority observation by WMO (World Meteorological Organization) GRUAN (GCOS Reference Upper-Air Network) for measuring total column water vapor [6]. It has also been widely used as reference in evaluations of other water vapor measuring tools and numerical weather prediction (NWP) models [7,8,9,10]. Due to the rapid development of GNSS systems and their successful applications in diverse fields, the ground permanent GNSS networks have dramatically expanded in recent years, which enables us to study the spatio-temporal variations of atmospheric water vapor with high resolution during extreme weather events.
The ground-based GPS was firstly used to study the severe weather conditions during a tornado event in a GPS/STORM experiment by [11]. PWV based on the radiosonde and GPS were compared during some typhoon events, and good agreements were generally found [12,13]. GPS PWV variations showed significant correlations with precipitations, indicating the potential of utilizing GPS PWV variations for monitoring and predicting the characteristic aspects of typhoons [14,15,16]. Some methods have also been proposed recently for short-term forecasting of rainstorm or typhoon events based on GPS PWV temporal changes [17,18]. Ref. [19] used GPS PWV as inputs for spaghetti line plots for path prediction of two hurricanes (Harvey and Irma), and reported that GPS can serve as an additional resource for improving the monitoring of hurricane paths. Ref. [20] even used GPS network to remotely track the spatial extent and daily evolution of terrestrial water storage caused by Hurricane Harvey.
PWV is the integral of water vapor content above the station in a unit column. Besides the PWV, the horizontal tropospheric gradient (HTG), which reflects the asymmetry characteristic of the troposphere, can also be derived from GPS data processing [21]. The severe weather conditions are generally accompanied by strong spatial variations of water vapor in the troposphere, which may result in large tropospheric gradients in the horizontal component. However, there are few studies focusing on the relationship between the HTG and severe weather events such as the typhoon. Ref. [22] studied the effect that Hurricane Harvey had on the spatial and temporal behavior of the zenith tropospheric delay (ZTD) and gradients based on 11 GPS stations, and demonstrated that the tropospheric gradients can show a consistent signature under severe weather events. More investigations using denser stations on more events are required to further explore the potential of HTG in severe weather research.
Typhoon Lekima, the ninth named storm of the 2019 Pacific typhoon season, was the costliest typhoon in Chinese history. Originating from a tropical depression that formed east of the Philippines on 30 July, Lekima gradually organized, and intensified under favorable environmental conditions and peaked as a Category 4 super typhoon. It made landfall in the Zhejiang province of China on 9 August as a Category 2 typhoon and made a second landfall in the Shandong province of China on 11 August. The track of the typhoon center is presented in Figure 1b (track data were downloaded from https://www.wunderground.com/hurricane/western-pacific/2019/typhoon-Lekima) (accessed on 6 November 2019). Lekima brought heavy rain to the country and caused catastrophic damage in mainland China, with a death toll of 56 people and more than USD 9.26 billion in damages.
In this paper, the PWV and HTG derived from a national GPS network in China consisting of nearly 700 permanent GPS stations will be used to study the spatial and temporal variations of the troposphere during Typhoon Lekima. As a comparison, the radiosonde data, Global Data Assimilation System (GDAS) Global Forecast System (GFS) analysis fields and ERA5 reanalysis from the European Centre for Medium-Range Weather Forecasts (ECMWF) will also be analyzed. The data and methodology used in this study will be described in Section 2. Spatio-temporal variations of PWV and HTG as well as comparisons of different tools will be discussed in Section 3 and Section 4, respectively, followed by the conclusions in Section 5.

2. Data and Methods

In this section, the data including GPS, radiosonde, GFS analysis and ERA5 reanalysis product will be introduced. The method for calculating PWV and HTG from these data as well as for the Empirical Orthogonal Functions (EOF) analysis will also be described.

2.1. GPS Data

GPS data at about 700 GPS stations provided by the China Meteorological Administration GNSS network (CMAGN) were processed by the PPP method [23] in a daily manner using the PANDA software package [24]. The data cover the period from 7 August to 13 August 2019, with a time interval of 30 s, and the CMAGN network has a good coverage over the east of China, as shown in Figure 1. The final GPS satellite orbit and clock products released by IGS were used and fixed in the PPP processing. The absolute antenna phase center correction model [25], phase wind-up corrections [26] and relativity corrections were applied. Station coordinates estimated from PPP weekly solutions were fixed. The a priori ZTD and mapping functions from GPT2 [27] were used, and the estimated ZTD corrections were then estimated as a piecewise constant every 5 min with a power density of 20 mm h−1/2. HTG in the north–south (GNS) and west–east (GWE) components were estimated every 1 h with a power density of 5 mm h−1/2. Cutoff elevation angles of satellites were set to be 7° and an elevation-dependent weighting strategy was applied to measurements at low elevations (below 30°) [28].
Air pressures measured by meteorological sensors equipped at GPS stations were used to calculate the zenith hydrostatic delay (ZHD) based on the Saastamoinen model [29]. The wet part of ZTD, namely the ZWD, was then split from ZTD by subtracting ZHD. The regional high-accuracy weighted mean temperature (Tm) model, WHU_CPT model, developed by Zhang et al. (2019), was used to estimate Tm based on the air temperature at the GPS station. The WHU_CPT model provides Tm with an average accuracy of ~2.97 K over China, compared with ~4.45 K in the Bevis model [5,30]. The PWV can be finally retrieved from the ZWD, with its accuracy generally better than 1.5 mm [31,32]. Besides the 5 min interval PWV, the HTG in the NS and WE component with a time interval of 1 h will also be used in the following analyses.

2.2. GFS Analysis Data

The NCEP’s GFS is the cornerstone of NCEP’s operational production suite of numerical guidance. The Global Data Assimilation System (GDAS) uses maximum amounts of satellite and conventional observations from global sources and generates initial conditions for the global forecasts. The global data assimilation and forecasts are made four times daily at 0000, 0600, 1200 and 1800 UTC.
The 6-hourly NCEP analysis grid products with horizontal resolution of 0.25° at 34 pressure levels from 0.4 to 1000 hPa covering the same period as GPS data were used to estimate PWV at GPS stations. Fields (air pressure, geopotential height, air temperature and relative humidity) at the four grids nearest the GPS station are horizontally interpolated to the GPS antenna location. The GFS PWV can be calculated by integrating specific humidity from the GPS antenna level to the top level, following
PWV = 1 ρ w q g d P
where ρ w is the liquid water density (1000 kg·m−3) and g is the gravitational acceleration in kg·m−2. q denotes the specific humidity in kg·kg−1, and p is the air pressure in hPa. The height difference between GPS antenna and analysis grids was compensated by the method described by [9]. According to the investigation by [8], the accuracy of PWV estimated from NCEP NWP generally ranges from 1 to 5 mm globally.

2.3. ERA5 Reanalysis Data

ERA5, a successor of ERA-Interim, is the fifth generation of reanalysis from ECMWF. The most substantial upgrades relative to ERA-Interim are the finer spatial grid (79 km to 31 km), the higher temporal resolution (3- and 6-hourly mixed to hourly), the more vertical levels (60 to 137), a new NWP model and the increase in the amount of data assimilated [33]. The dataset will eventually cover from 1950 to near real time. As the first global hourly reanalysis, ERA5 is highly promising in supporting hourly PWV retrieval [34].
The hourly ERA5 air pressure, geopotential height, air temperature and relative humidity with horizontal resolution of 0.25° at 37 pressure levels from 0.1 to 1000 hPa covering the period from 7 August to 13 August 2019 were used to calculate PWV at GPS stations following the same method as described in Section 2.2. According to [35], the average RMS of ERA5-derived PWV error is about 1.73 mm over China.

2.4. Radiosonde Data

Radiosonde data provided by the Integrated Global Radiosonde Archive (IGRA) were used in this study. Radiosonde temperature and humidity profiles requires at least 300 hPa for the top level and data are mandatory at the surface level. Temperature or humidity profiles with gaps larger than 200 hPa between two consecutive recordings were excluded. The radiosonde PWV generally has an accuracy ranging from 1 to 3 mm according to [31].
In order to make comparisons between the radiosonde and GPS, horizontal separation between these two kinds of stations is limited to be less than 50 km and the elevation difference is required to be less than 200 m. We should still be aware that systematic errors may be introduced in spite of the small separation if the GPS and radiosonde stations have quite different humidity structures, especially during a typhoon event. In addition, the strong horizontal wind caused by the typhoon can push the radiosonde balloon laterally over very large distances. The PWV computed from the radiosonde data will therefore be contaminated by this drift compared with a quasi-vertical ascent in a normal situation. If more than one GPS station are matched with a radiosonde station, only the one with smallest horizontal separation will be selected. There are four match pairs located in the vicinity of typhoon paths as shown in Figure 1b. All the four stations are equipped with radiosonde of type GTS1 (also named Shang-E in some publications) manufactured by Shanghai Changwang Meteorological Instrument Plant. PWVs were then estimated from the radiosonde data and were adjusted to the GPS antenna height following method described in [32].

2.5. EOF Analysis Method

EOF analysis decomposes the coherent spatio-temporal field into individual spatial and temporal modes in order to better understand the underlying process, which is widely used in meteorological and climatological studies [36]. Suppose that the data points at each grid can be arranged into a spatio-temporal field matrix A ( m × n ) ( t , x ) as
A ( m × n ) ( t , x ) = a 11 a 1 n a m 1 a m n
where m and n are the numbers of grids and time epochs, respectively. An eigenvalue problem A x = λ x then can be formulated for the EOF implementation. The eigenvalue decomposition of the covariance matrix C of A ( m × n ) ( t , x ) can be used to solve this problem. The covariance matrix C is a symmetric matrix defined as
C = 1 N A A T   or   A i , A j
where the element of the covariance matrix C, namely, sij, which denotes the covariance between the data points of any pair of grid points (si, sj) for i = 1 , 2 , , m , and j = 1 , 2 , , n , can be written as
s i j = 1 N k = 1 K A t k x i A * t k x j
The covariance matrix C can be decomposed as C = V Λ V T by using the singular value decomposition (SVD) method. The matrix V T comprises the orthogonal eigenvectors (EOFs) of C which represent the spatial patterns, and the diagonal matrix Λ contains the eigenvalues of C. The multiplications of V and Λ , denoted as U = V Λ , are the projection of sampled data onto eigenvectors which represents the principal components (PCs) associated with the EOFs.

3. PWV Variation Analyses

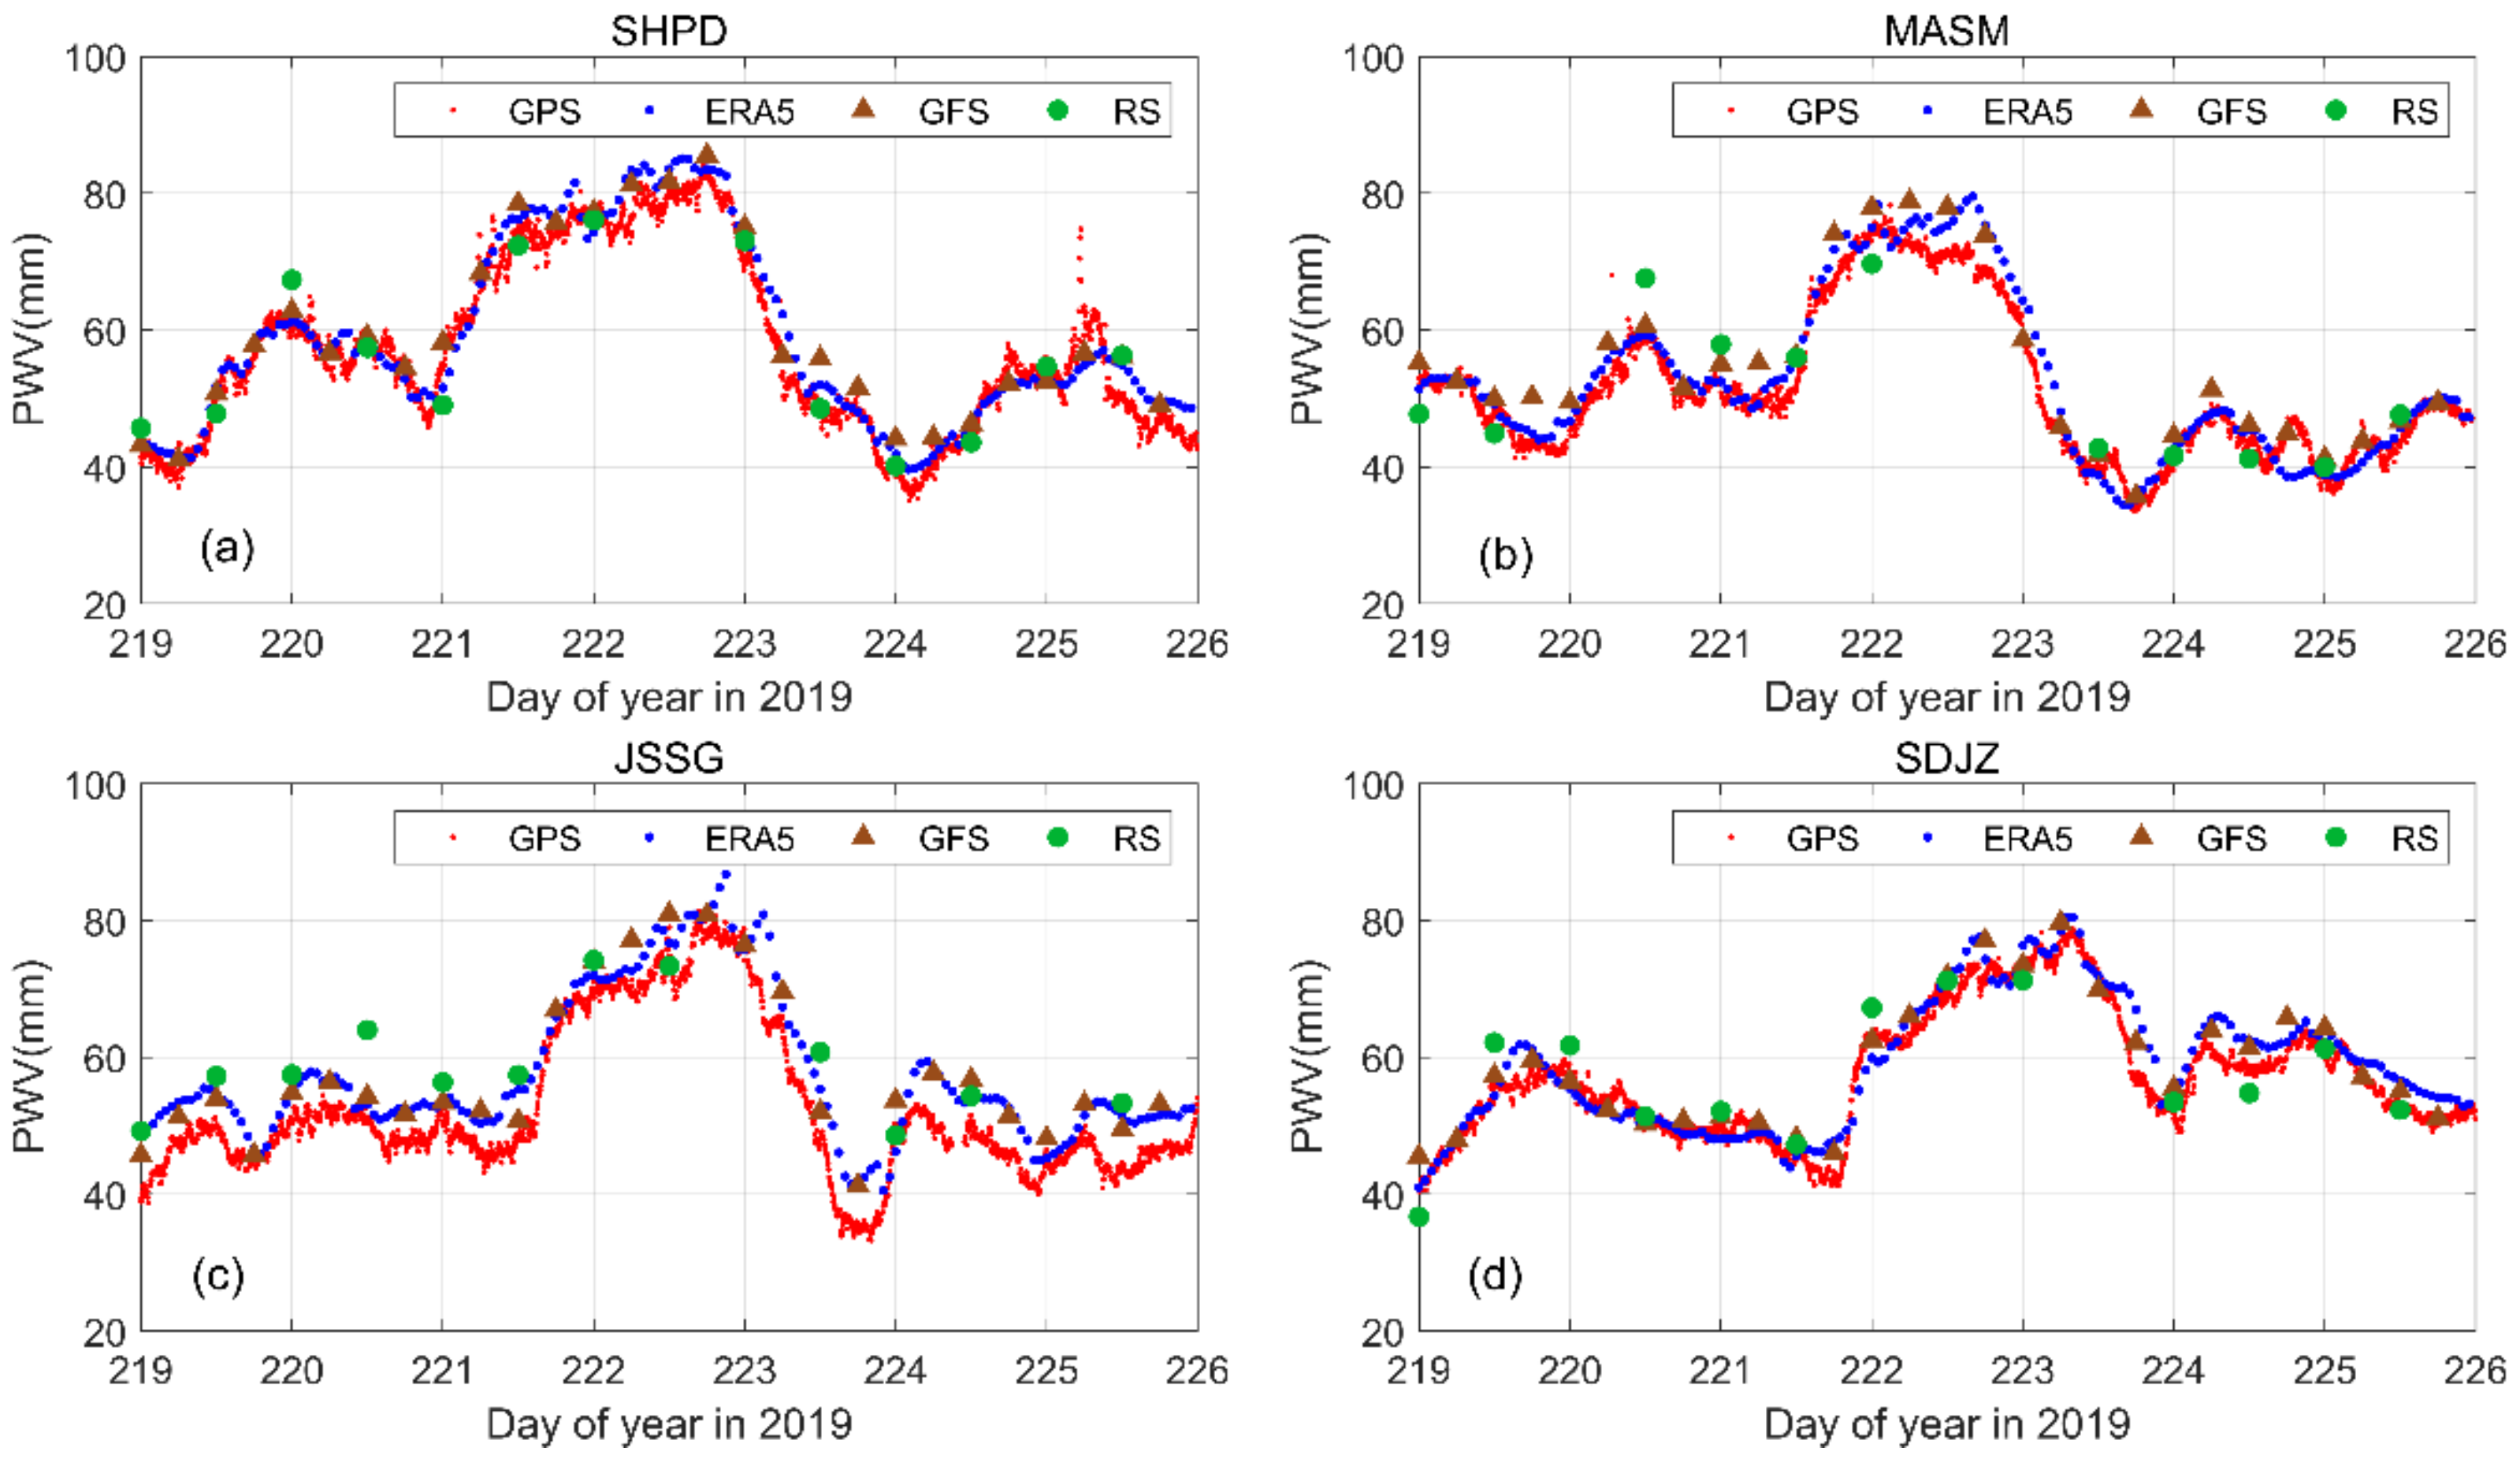
3.1. PWV Temporal Variations

PWV comparisons of GPS, ERA5 reanalysis, GFS analysis and radiosonde during Typhoon Lekima at four GPS-RS match stations are presented in Figure 2. GPS PWV has not been assimilated in both ERA5 and GFS. Therefore, taking GPS as independent reference, mean (Ave.), standard deviation (STD) and root mean square (RMS) for ERA5, GFS and radiosonde PWV differences are summarized in Table 1. GPS PWV time series at all stations experience a significant increment from about 50 mm to 80 mm as the typhoon approaches. The duration of high PWV at SHPD station is about two days, which is longer than the other three stations due to the location of SHPD (in the coast region close to the landing location of Lekima as shown in Figure 1b). The maximum PWV at MASM station is the smallest (<80 mm) as it is not along the track of the typhoon. The four matched stations are ordered in station latitude from Figure 2a–d, where we can easily find a shift in the time of the PWV increment from the south to the north. As the Lekima leaves, the PWV drops continuously down to the level before the typhoon approaching.
Compared with GPS, ERA5, GFS and RS overestimate the PWV at the four matched stations in statistical perspective, with the mean value of PWV difference of 1.3, 1.1, 4.1 and 1.4 for ERA5, 3.1, 2.9, 4.5, 2.2 mm for GFS, and 1.0, 1.2, 6.7 and 1.5 mm for radiosonde, respectively. In general, the ERA5 agrees with GPS best, with RMS of 2.4, 1.9, 5.3 and 2.8 mm at these 4 stations, compared with 3.8, 3.0, 4.8 and 2.8 mm for GFS, and 3.7, 4.9, 8.3 and 3.5 mm for radiosonde, respectively. Due to the low temporal resolution, many temporal variation details are absent in radiosonde PWV time series as can be seen from Figure 2. The hourly ERA5 PWV can generally capture the temporal PWV variations during the whole period, but there is still underestimation of PWV increment as the typhoon passes station JSSG.

3.2. PWV Spatial Variations

The spatial distribution of GPS and GFS PWV at different time epochs with a time interval of 6 h from 18:00 UTC on 9 August to 12:00 UTC on 11 August is presented in Figure 3 and Figure 4. We can find that PWV at stations in the east part is significantly larger than PWV at stations in the northwest part (below 40 mm). GPS PWV shows strong correlation with the typhoon process since the typhoon brings abundant water vapor from the ocean. The large PWV area moves with the typhoon but with the maximum values decreasing as part of the water vapor turns into precipitation. Compared with GPS PWV, we can also find the overall overestimation of PWV in ERA5 and GFS in the region influenced by the typhoon from Figure 3 and Figure 4. One of the possible reasons may be that water vapor information over land in ERA5 and GFS pressure-level products is mainly from the radiosonde data by assimilation where the radiosonde PWV is generally larger than GPS PWV, as shown in Figure 2. ERA5 agrees better with GPS than GFS in general. For example, the obvious underestimation of PWV between 35–40° N in GFS in Figure 3j does not exist in ERA5 in Figure 3f.

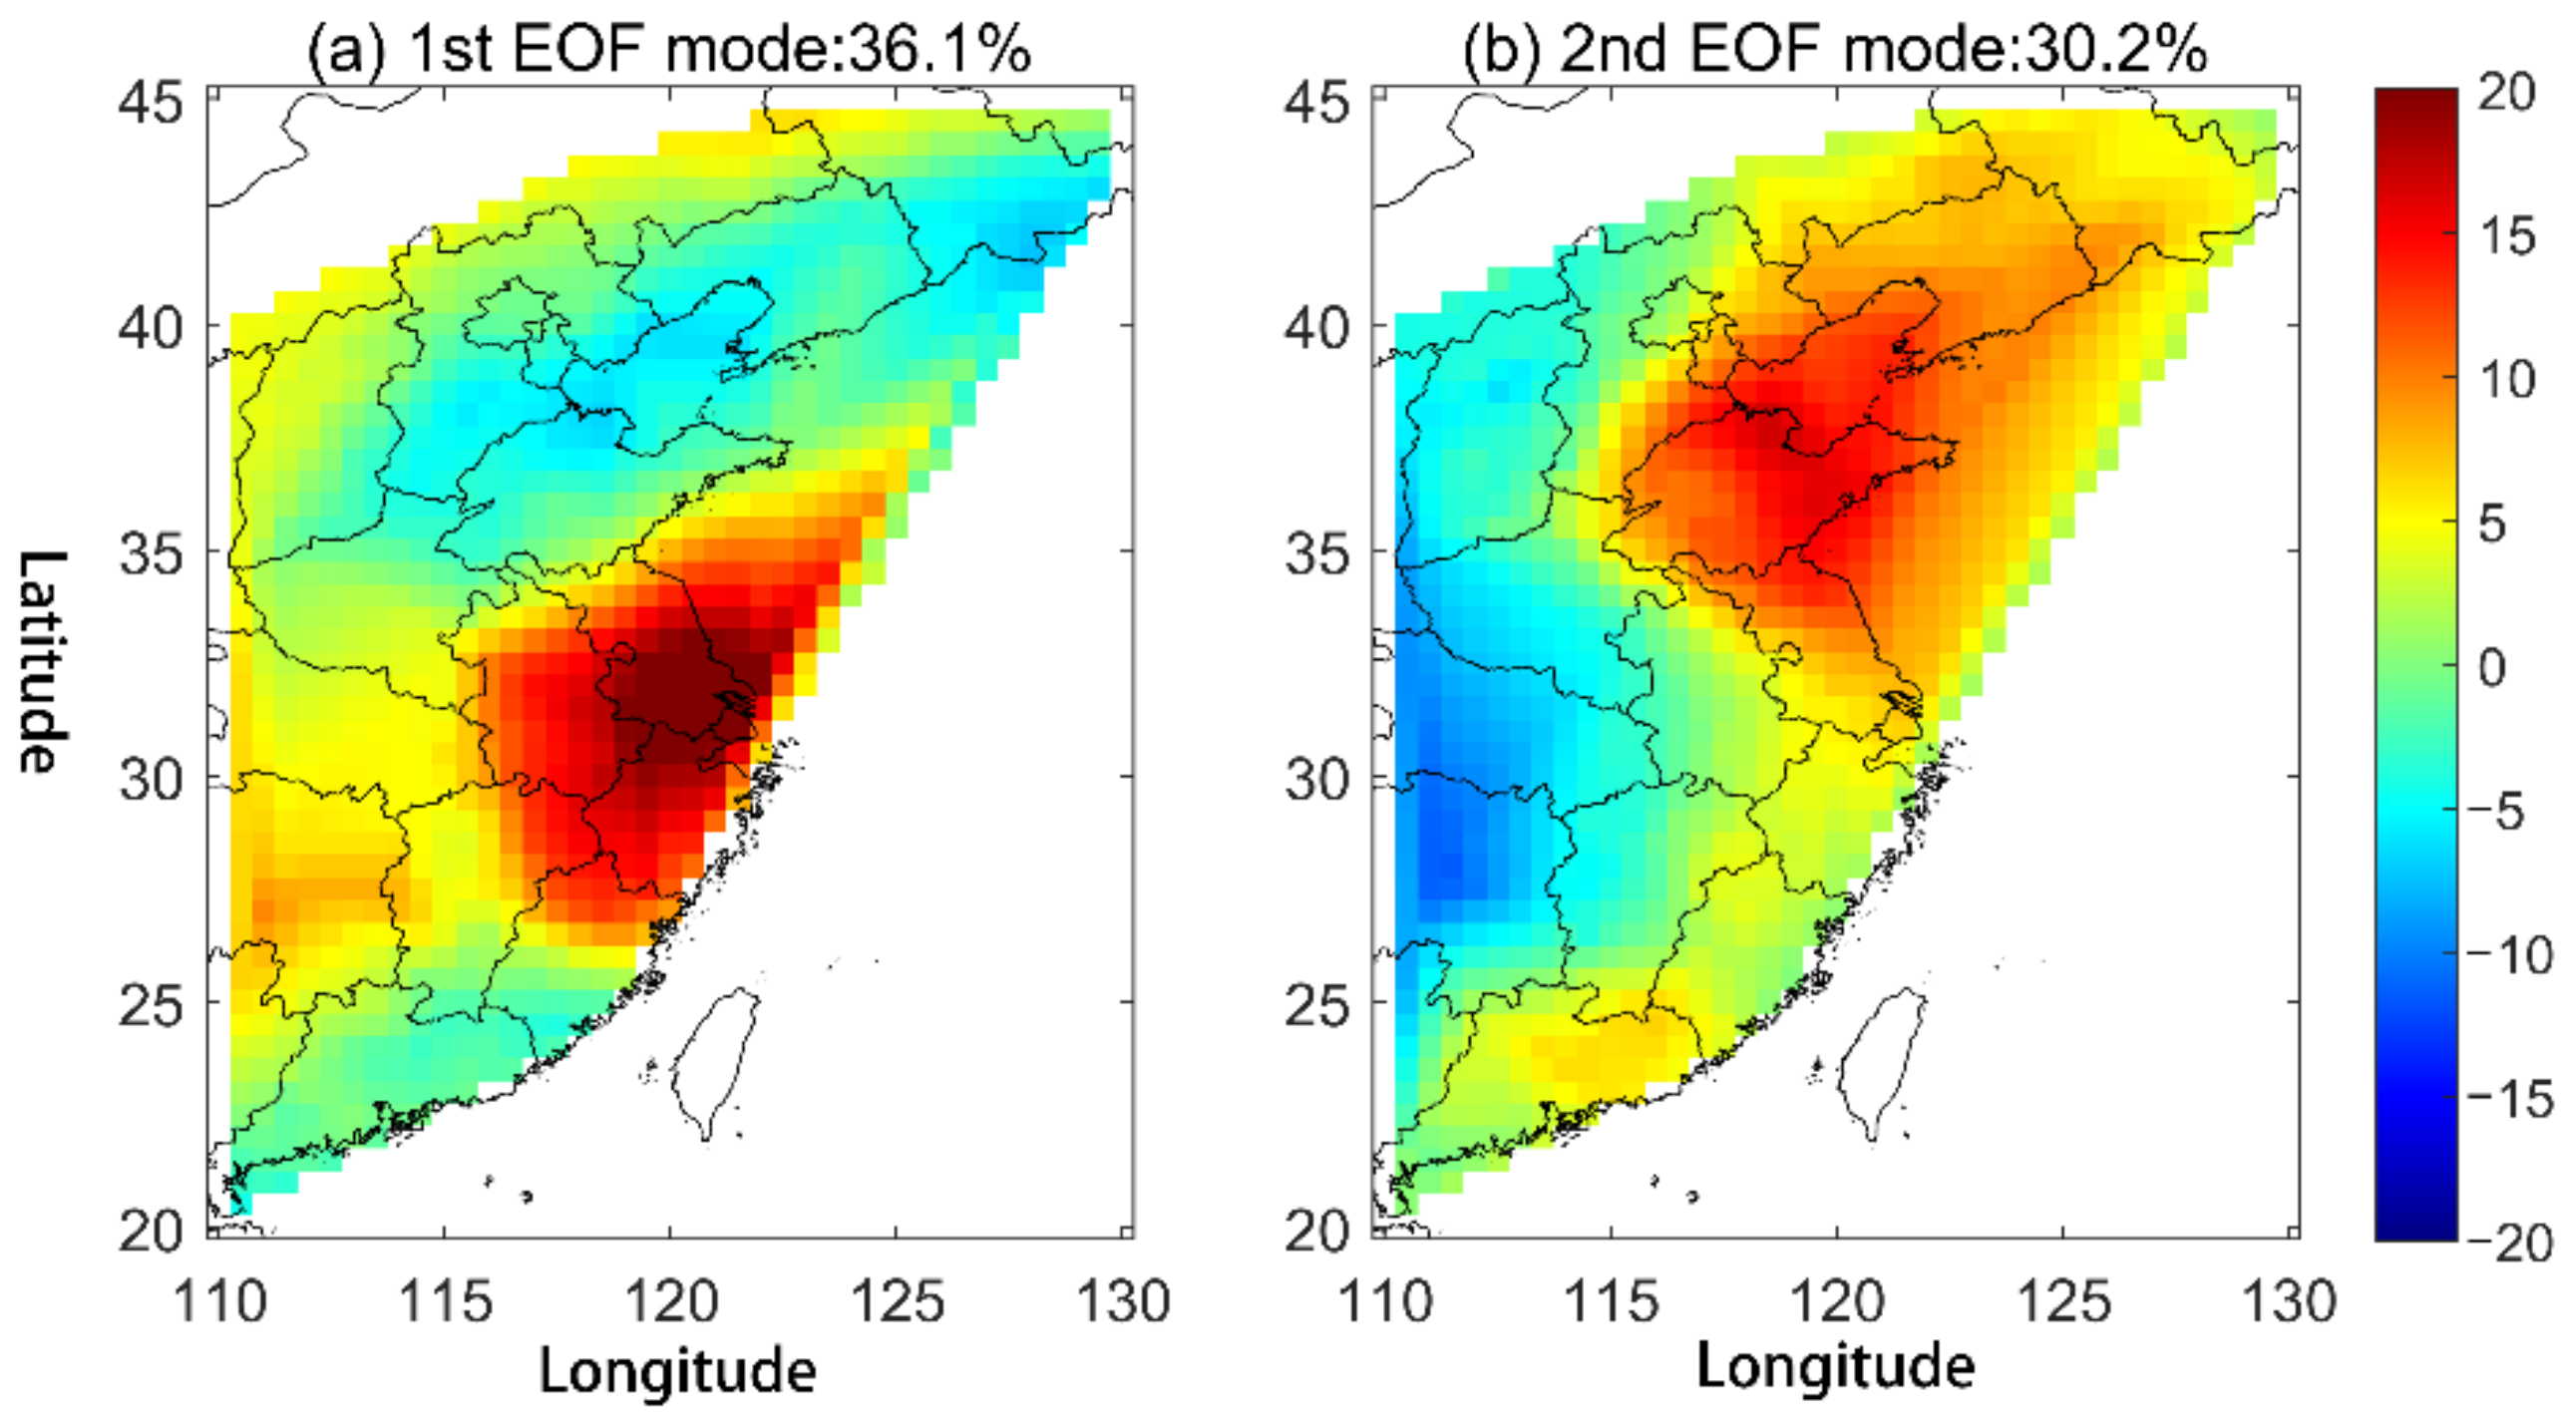
3.3. PWV EOF Analysis

PWV values at all GNSS stations at each epoch were spatially interpolated to grid points with a spatial resolution of 0.5 × 0.5 ° by bilinear interpolation method. An EOF analysis of the gridded PWV was then performed to study the leading modes of variability. Figure 5 presents the two leading EOFs along with the corresponding principal components (PCs), as shown in Figure 6. The two leading EOFs explain about 36.1 and 30.2% of the total variance, respectively, accounting for about 66.3% in total. The first EOF clearly shows distinctive large anomalies centered over the first typhoon landing location, and the corresponding PC depicts the main feature of the PWV variations similar to PWV time series at the station SHPD (near the first landing location) in Figure 2a where the PWV variations are dominated by the water vapor brought by the typhoon. The second EOF represents a dipole mode between the east and west part of the study region. The positive anomalies over the northeast are also contributed by the abundant water vapor carried by the typhoon when it made the second landfall on 11 August (DOY 223). We can also easily find the time lag of the peak values between the PC2 with PC1 due to the movement of typhoon, as shown in Figure 6. However, it is worthy to note that the EOF analysis in this work is only based on GPS PWV over land during the typhoon event. For more complete information for the entire typhoon path, especially over ocean, we can combine GPS PWV with microwave or ERA5 PWV, which is, however, out of the scope of this work.

4. HTG Results

The spatial distributions of HTG at GPS stations at different time epochs with a time interval of 6 h from 18:00 UTC, 9 August to 12:00 UTC, 11 August are presented in Figure 7. Colors of the arrow heads denote the magnitude of HTG (MHTG) estimated following
M H T G = G N S 2 + G W E 2
and the azimuth of HTG, θ , is determined by
θ = atan ( G N S G W E )
Stations with MHTG smaller than 3 mm are not shown in Figure 5 for the purpose of clarity. Most HTG arrows consistently point to the typhoon center with a magnitude larger than 5 mm as shown in Figure 5a when the Lekima made the first landfall on the mainland China, indicating a significant horizontal asymmetry in the troposphere. The anomalous HTG during typhoon is contributed by both the hydrostatic gradient and water vapor-related wet gradient. Ref. [22] explained that the cyclone can induce significant air pressure gradients, and large tropospheric gradients appear perpendicular to the isobars, i.e., pointing to the cyclone center. On the other hand, the large amount of water vapor brought by the typhoon also cause an obvious tropospheric gradient in the wet component, which can also be found from the PWV spatio-temporal variation analysis in Section 3. With the moving of the typhoon, the direction of HTG also changes, still with arrows generally pointing to the center of the typhoon as shown from Figure 7b–h, but the consistency among HTG at stations weakens compared with Figure 7a.
Figure 7. Spatial distribution of HTG (color arrows) at UTC time (a) 09 August 18:00, (b) 10 August 00:00, (c) 10 August 06:00, (d) 10 August 12:00, (e) 10 August 18:00, (f) 11 August 00:00, (g) 11 August 06:00, and (h) 11 August 12:00. The center of Typhoon Lekima is marked (red symbol) in each panel.
Remotesensing 13 04082 g007
We also calculated the azimuth difference at each station between the horizontal gradient vector and the direction pointing from the station to the typhoon center. The distribution of the azimuth difference with the epicentral distance are presented in Figure 8 and Figure 9 where the magnitude of the HTG is distinguished by the maker size and maker color in the scatter graphs. We can find that the probability for azimuth difference smaller than 30 ° in Figure 9 is generally lower than probability in Figure 8, indicating that the HTG convergence phenomenon gradually weakened as the typhoon moved northward. At the early stage when the typhoon made a landfall, e.g., 18:00 UTC on 9 August, with maximum wind speed of 160.9 km/h, the probability of azimuth difference smaller than 30 ° can reach nearly 50%, as shown in Figure 8e. Moreover, most of stations with small angular difference are distributed around the typhoon center with distance of about 400–600 km, as shown in both Figure 7a and Figure 8a. Large horizontal gradient is likely to occur at regions close to the edge of the typhoon. As the typhoon weakens, this special distribution is not obvious. Therefore, the distribution of the HTG direction can represent the passage and development of the typhoon at the early stages, and may be useful for studying and detecting the typhoon.

5. Conclusions

GPS has advantages of high accuracy, high resolutions, low cost and all weather conditions. Due to the increase in the number of permanent GPS stations in operation, GPS can be served as a good tool for monitoring the atmospheric water vapor content, especially for some severe weather events such as storms and typhoons. Besides the integrated PWV or ZTD, the horizontal tropospheric gradients can also be derived from GPS data processing, which provides valuable information for the study of extreme weather events. However, few studies have been carried out based on large amount of GPS stations to explore the relationship of both ZTD and HTG with typhoon events.
In this work, a dense GPS network over China was used to study the spatio-temporal variations of PWV and HTG during the Typhoon Lekima event. Data from near 700 stations were processed by the PPP method based on the PANDA software package to derive ZTD and HTG with time intervals of 5 min and 1 h, respectively. A refined regional Tm model (WHU_CPT) was used to estimate Tm based on GPS station meteorological measurements, and PWV products were then retrieved.
Spatio-temporal variations of PWV with the typhoon process were carefully analyzed. As the typhoon approached, PWV at stations near the typhoon center increased sharply from about 50 mm to nearly 80 mm and maintained high value for one to two days, and then dropped back to 40–50 mm after Lekima left. Comparisons of GPS, radiosonde, the GFS analysis and ERA5 reanalysis products at four matched GPS-RS stations showed overall overestimations of PWV in radiosonde, GFS and ERA5 compared with GPS in statistical perspective, with an average bias of 2.6, 3.2 and 2.0 mm, and RMS of 5.1 and 3.6 and 3.1 mm, respectively. The hourly ERA5 PWV can generally capture the PWV temporal variations during the typhoon though underestimation of amplitude was found at one station, while temporal variation details were obviously absent in the radiosonde 12-hourly PWV time series. An EOF analysis of the PWV during the typhoon event revealed some different patterns of variability, with the first EOF (~36.1% of variance) showing distinctively large anomalies over the typhoon first landing location. The second EOF (~30.3% of variance) represented a dipole mode between the west and east part of the study region, with large anomalies over the second landing location.
Large HTGs were found at stations at the edge of the typhoon, with magnitude reaching nearly 5 mm. The arrows representing the direction of the HTG consistently point to the typhoon center when Lekima made its first landfall on mainland China, with probability of angular difference within 30° larger than 50%. As Lekima moved from the south to the north, the consistency among arrow direction weakened, with magnitude decreasing. The characteristics of GPS PWV and HTG variations with the typhoon process indicate that the dense ground-based GPS networks could be valuable in the study, monitoring and prediction of typhoon events.

Author Contributions

Conceptualization, M.T. and W.Z.; methodology, W.Z.; software, M.T., J.B.; formal analysis, M.T., D.W. and H.L.; investigation, M.T., J.B. and D.W.; resources, H.L., Y.L.; wiring—original draft preparation, M.T.; writing—review and editing, W.Z.; visualization, J.B., H.L.; supervision, W.Z., Y.L.; project administration, W.Z.; Funding acquisition, M.T., W.Z. and Y.L. All authors have read and agreed to the published version of the manuscript.

Funding

This research was funded by National Natural Science Foundation of China (grant number: 41804023; 41774036; 41961144015) and the National BeiDou Augmentation System Meteorological Industry Development and Construction Project (grant number: QT362018J249).

Institutional Review Board Statement

Not applicable.

Informed Consent Statement

Not applicable.

Data Availability Statement

GPS data used in this study can be accessed from China Meteorological Administration (CMA) at http://data.cma.cn/en (accessed on 6 November 2019). Radiosonde data are archived at https://www.ncdc.noaa.gov/data-access/weather-balloon/integrated-global-radiosonde-archive/ (accessed on 6 November 2019). The reanalysis data, ERA5, are released by ECMWF at https://www.ecmwf.int/ (accessed on 6 November 2019), and the GFS data are provided by NOAA at https://www.ncdc.noaa.gov/data-access/model-data/model-datasets/global-forcast-system-gfs (accessed on 6 November 2019).

Acknowledgments

We acknowledge the CMA providing GPS data, IGRA for providing radiosonde data, ECMWF for providing ERA5 data, and NOAA for providing GFS data.

Conflicts of Interest

The authors declare no conflict of interest.

References

  1. Frank, W.M. The structure and energetics of the tropical cyclone-I. Storm structure. Month. Weath. Rev. 1977, 105, 1119–1135. [Google Scholar] [CrossRef]
  2. De Bellevue, J.L.; Réchou, A.; Baray, J.; Ancellet, G.; Diab, R. Signatures of stratosphere to troposphere transport near deep convective events in the southern subtropics. J. Geophys. Res. 2006, 111, D24107. [Google Scholar] [CrossRef] [Green Version]
  3. Pathakoti, M.; Sujatha, P.; Srinivasa, R.; Sai, K.; Rao, P.; Dutt, C.; Dadhwal, V. Evidence of stratosphere–troposphere exchange during severe cyclones: A case study over Bay of Bengal, India, Geomatics. Nat. Hazards Risk 2016, 7, 1816–1823. [Google Scholar] [CrossRef] [Green Version]
  4. Du, J.; Kimball, J.; Jones, L.; Kim, Y.; Glassy, J.; Watts, J. A global satellite environmental data record derived from AMSR-E and AMSR2 microwave Earth observations. Earth Syst. Sci. Data 2017, 9, 791–808. [Google Scholar] [CrossRef] [Green Version]
  5. Bevis, M.; Businger, S.; Herring, T.A.; Rocken, C.; Anthes, R.A.; Ware, R.H. GPS meteorology: Remote sensing of atmospheric water vapor using the Global Positioning System. J. Geophys. Res. 1992, 97, 15787–15801. [Google Scholar] [CrossRef]
  6. Seidel, D.J.; Berger, F.H.; Diamond, H.J.; Goodrich, D.; Immler, F.; Murray, W.; Peterson, T.; Sisterson, D.; Sommer, M.; Thorne, P.; et al. Reference upper-air observations for climate: Rationale, progress, and plans. Bull. Am. Meteorol. Soc. 2009, 90, 361–369. [Google Scholar] [CrossRef]
  7. Wang, J.; Zhang, L. Systematic errors in global radiosonde precipitable water data from comparisons with ground-based GPS measurements. J. Clim. 2008, 21, 2218–2238. [Google Scholar] [CrossRef]
  8. Vey, S.; Dietrich, R.; Rülke, A.; Fritsche, M.; Steigenberger, P.; Rothacher, M. Validation of precipitable water vapor within the NCEP/DOE reanalysis using global GPS observations from one decade. J. Clim. 2010, 23, 675–1695. [Google Scholar] [CrossRef]
  9. Zhang, W.; Lou, Y.; Huang, J.; Zheng, F.; Cao, Y.; Liang, H.; Shi, C.; Liu, J. Multiscale variations of precipitable water over China based on 1999–2015 ground-based GPS observations and evaluations of reanalysis products. J. Clim. 2018, 31, 945–962. [Google Scholar] [CrossRef]
  10. Risanto, C.; Castro, C.; Moker, J.; Arellano, A.; Adams, D.; Fierro, L.; Minjarez Sosa, C. Evaluating Forecast Skills of Moisture from Convective-Permitting WRF-ARW Model during 2017 North American Monsoon Season. Atmosphere 2019, 10, 694. [Google Scholar] [CrossRef] [Green Version]
  11. Rocken, C.; Hove, T.V.; Johnson, J.; Solheim, F.; Ware, R.; Bevis, M.; Chiswell, S.; Businger, S. GPS/Storm—GPS sensing of atmosphere water vapor for meteorology. J. Atmos. Ocean. Technol. 1995, 12, 468–478. [Google Scholar] [CrossRef]
  12. Liou, Y.A.; Huang, C.Y. GPS observation of PW during the passage of a typhoon. Earth Planets Space 2000, 52, 709–712. [Google Scholar] [CrossRef] [Green Version]
  13. Song, D.S.; Yun, H.S.; Lee, D.H. Verification of accuracy of precipitable water vapour from GPS during typhoon RUSA. Surv. Rev. 2008, 40, 19–28. [Google Scholar] [CrossRef]
  14. Liou, Y.A.; Teng, Y.T.; Van Hove, T.; Liljegren, J. Comparison of precipitable water observations in the near Tropics by GPS, microwave radiometer, and radiosondes. J. Appl. Meteorol. 2001, 40, 105–115. [Google Scholar] [CrossRef]
  15. Song, D.S.; Grejner-Brzezinska, D.A. Remote sensing of atmospheric water vapor variation from GPS measurements during a severe weather event. Earth Planets Space 2009, 61, 1117–1125. [Google Scholar] [CrossRef] [Green Version]
  16. Tang, X.; Hancock, C.M.; Xiang, Z.; Kong, Y.; Ligt, H.; Shi, H.; Quaye-Ballard, J.A. Precipitable water vapour retrieval from GPS precise point positioning and NCEP CFSv2 dataset during typhoon events. Sensors 2018, 18, 3831. [Google Scholar] [CrossRef] [PubMed] [Green Version]
  17. Benevides, P.; Catalao, J.; Miranda, P.M.A. On the inclusion of GPS precipitable water vapour in the nowcasting of rainfall. Nat. Hazards Earth Syst. Sci. Discuss. 2015, 3, 3861–3895. [Google Scholar]
  18. Zhao, Q.; Yao, Y.; Yao, W. GPS-based PWV for precipitation forecasting and its application to a typhoon event. J. Atmos. Sol. -Terr. Phys. 2018, 167, 124–133. [Google Scholar] [CrossRef]
  19. Ejigu, Y.; Teferle, F.; Klos, A.; Janusz, B.; Hunegnaw, A. Monitoring and prediction of hurricane tracks using GPS tropospheric products. GPS Solut. 2021, 25, 1–15. [Google Scholar]
  20. Milliner, C.; Materna, K.; Bürgmann, R.; Fu, Y.; Moore, A.; Bekaert, D.; Adhikari, S.; Argus, D. Tracking the weight of Hurricane Harvey’s stormwater using GPS data. Sci. Adv. 2018, 4, eaau2477. [Google Scholar] [CrossRef] [Green Version]
  21. Boehm, J.; Schuh, S. Troposheric gradients from the ECMWF in VLBI analysis. J. Geod. 2007, 81, 403–408. [Google Scholar] [CrossRef]
  22. Graffigna, V.; Hernández-Pajares, M.; Gende, M.A.; Azpilicueta, F.J.; Antico, P.L. Interpretation of the tropospheric gradients estimated with GPS during Hurricane Harvey. Earth Space Sci. 2019, 6, 1348–1365. [Google Scholar] [CrossRef]
  23. Zumberge, J.F.; Heflin, M.B.; Jefferson, D.C.; Watkins, M.M.; Webb, F.H. Precise point positioning for the efficient and robust analysis of GPS data from large networks. J. Geophys. Res. 1997, 102, 5005–5017. [Google Scholar] [CrossRef] [Green Version]
  24. Shi, C.; Zhao, Q.; Geng, J.; Lou, Y.; Ge, M.; Liu, J. Recent development of PANDA software in GNSS data processing. In International Conference on Earth Observation Data Processing and Analysis (ICEODPA); Li, D., Gong, J., Wu, H., Eds.; International Society for Optical Engineering (SPIE): Bellingham, WA, USA, 2008; Volume 7285. [Google Scholar]
  25. Schmid, R.; Steigenberger, P.; Gendt, G.; Ge, M.; Rothacher, M. Generation of a consistent absolute phase-center correction model for GPS receiver and satellite antennas. J. Geod. 2007, 81, 781–798. [Google Scholar] [CrossRef] [Green Version]
  26. Wu, J.; Wu, S.; Hajj, G.; Bertiger, W.; Lichten, S. Effect of antenna orientation on GPS carrier phase. Manuscr. Geod. 1993, 18, 91–98. [Google Scholar]
  27. Lagler, K.; Schindelegger, M.; Böhm, J.; Krásná, H.; Nilsson, T. GPT2: Empirical slant delay model for radio space geodetic techniques. Geophy. Res. Lett. 2013, 40, 1069–1073. [Google Scholar] [CrossRef] [Green Version]
  28. Gendt, G.; Dick, G.; Reigber, C.H.; Tomassini, M.; Liu, Y.; Ramatschi, M. Demonstration of NRT GPS water vapor monitoring for numerical weather prediction in Germany. J. Meteorol. Soc. Jpn. 2003, 82, 360–370. [Google Scholar]
  29. Saastamoinen, J. Atmospheric correction for the troposphere and stratosphere in radio ranging of satellites. Use Artif. Satellites Geod. 1972, 15, 247–251. [Google Scholar]
  30. Zhang, W.; Lou, Y.; Huang, J.; Liu, W. A refined regional empirical pressure and temperature model over China. Adv. Space Res. 2019, 62, 1065–1074. [Google Scholar] [CrossRef]
  31. Wang, J.; Zhang, L.; Dai, A.; van Hove, T.; van Baelen, J. A near-global, 2-hourly data set of atmospheric precipitable water from ground-based GPS measurements. J. Geophys. Res. 2007, 112, D11107. [Google Scholar] [CrossRef] [Green Version]
  32. Zhang, W.; Lou, Y.; Haase, J.; Zhang, R.; Zheng, G.; Huang, J.; Shi, C.; Liu, J. The use of ground-based GPS precipitable water measurements over China to assess radiosonde and ERA-Interim moisture trends and errors from 1999 to 2015. J. Clim. 2017, 30, 7643–7667. [Google Scholar] [CrossRef]
  33. Hersbach, H.; Dee, D. ERA5 reanalysis is in production. ECMWF Newsl. 2016, 147. Available online: https://www.ecmwf.int/en/newsletter/147/news/era5-reanalysis-production (accessed on 6 November 2019).
  34. Zhang, W.; Zhang, H.; Liang, H.; Lou, Y.; Cai, Y.; Cao, Y.; Zhou, Y.; Liu, W. On the suitability of ERA5 in hourly GPS precipitable water vapor retrieval over China. J. Geod. 2019, 93, 1897–1909. [Google Scholar] [CrossRef]
  35. Bai, J.; Lou, Y.; Zhang, W.; Zhou, Y.; Zhang, Z.; Shi, C. Assessment and calibration of MODIS precipitable water vapor products based on GPS network over China. Atmos. Res. 2021, 254, 105504. [Google Scholar] [CrossRef]
  36. Bjornsson, H.; Venegas, S. A manual for EOF and SVD analyses of climatic data. CCGCR Rep. 1997, 97, 112–134. [Google Scholar]
Figure 1. (a) Geographic distribution of GPS stations; (b) four matched GPS-RS stations (red triangles) and the path of Typhoon Lekima’s center (with interval of 6 h). The color of typhoon center denotes the maximum wind speed in km/h. The locations of typhoon center at 9 August 18:00 UTC and 11 August 00:00 UTC are labeled.
Remotesensing 13 04082 g001
Figure 2. PWV comparisons of GPS (red dots), ERA5 reanalysis (blue dots), GFS analysis (brown triangles) and radiosonde (RS) (green circles) at four match stations: (a) SDJZ, (b) JSSG, (c) MASM and (d) SHPD.
Remotesensing 13 04082 g002
Figure 3. (ad) PWV spatial distribution at UTC time 9 August 18:00, 10 August 00:00, 10 August 06:00 and 10 August 12:00, respectively; (eh) PWV difference (ERA5 minus GPS) at the four epochs; (il) PWV difference (GFS minus GPS) at the four epochs.
Remotesensing 13 04082 g003
Figure 4. (ad) PWV spatial distribution at UTC time 10 August 18:00, 11 August 00:00, 11 August 06:00 and 11 August 12:00, respectively; (eh) PWV difference (ERA5 minus GPS) at the four epochs; (il) PWV difference (GFS minus GPS) at the four epochs.
Remotesensing 13 04082 g004
Figure 5. Two leading EOFs of the PWV anomalies.
Remotesensing 13 04082 g005
Figure 6. Two leading PC time series of the PWV anomalies.
Remotesensing 13 04082 g006
Figure 8. (ad) Scatter of azimuth differences with distance between station and typhoon eye at UTC time 9 August 18:00, 10 August 00:00, 10 August 06:00 and 10 August 12:00, respectively; (eh) probability histogram of azimuth differences at the four corresponding time epochs.
Remotesensing 13 04082 g008
Figure 9. (ad) Scatter of azimuth differences with distance between station and typhoon eye at UTC time 10 August 18:00, 11 August 00:00, 11 August 06:00 and 11 August 12:00, respectively; (eh) probability histogram of azimuth differences at the four corresponding time epochs.
Remotesensing 13 04082 g009
Table 1. Comparisons of PWV differences (in mm) for ERA5 reanalysis, GFS analysis and radiosonde with GPS.
StationLatitudeERA5GFSRadiosonde
Ave.STDRMSAve.STDRMSAve.STDRMS
SHPD-5836231.22° N1.32.12.43.12.43.81.03.73.7
MASM-5823831.71° N1.11.71.92.91.03.01.24.84.9
JSSG-5815033.77° N4.13.65.34.51.84.86.75.18.3
SDJZ-5485736.22° N1.42.62.82.21.82.81.53.43.5
Publisher’s Note: MDPI stays neutral with regard to jurisdictional claims in published maps and institutional affiliations.

