1. Introduction
High-quality data on the magnitude of human activity resulting in emissions or removals taking place during a given period of time, also known as Activity Data, are crucial if we are to successfully mitigate against climate change and fully operationalized financial mechanisms such as Results-Based Payments (RBPs) for REDD+ (Reducing Emissions from Deforestation and forest Degradation and the role of conservation, sustainable management of forests and enhancement of forest carbon stocks in developing countries). Statistically robust and transparent approaches for assessing the accuracy and estimating area of change are therefore critical to ensure the integrity of land-use change information [
1]. These can be achieved through wall-to-wall or through sampling approaches. Both approaches are used to assess land-cover, land-use, and their dynamics. Wall-to-wall approaches use satellite imagery to create continuous maps using a combination of algorithms and field observations [
2]. In contrast, sample-based approaches are a well-recognized and efficient way to monitor land-cover and land-use changes by using satellite imagery and employing a probability sample of the target area [
3]. Good guidance on area estimation from the Intergovernmental Panel on Climate Change (IPCC) recommends methods such as probability sampling that neither under nor overestimate and reduce uncertainties as far as practicable [
4].
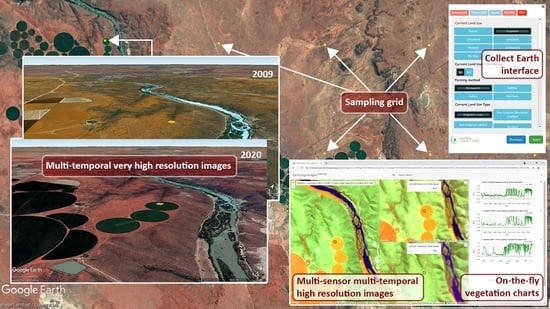
First developed in 2013, Collect Earth (
Figure 1) is a free and open-source software for land monitoring developed by the Food and Agriculture Organization of the United Nations (FAO). Built on top of Google desktop and cloud computing technologies, Open Foris Collect Earth facilitates access to multiple freely available archives of satellite imagery, including archives and databases with high spatial resolution imagery (e.g., Google Earth Pro, Bing Maps, Yandex, Baidu, and others) and those with high temporal resolution imagery that can be accessed through cloud computing (e.g., Google Earth Engine, Google Earth Engine Code Editor) [
5]. The tool allows countries to undertake land monitoring easily and rapidly through a sample-based approach and generate Activity Data (data on the magnitude of human activity resulting in emissions or removals taking place during a given period) through augmented visual interpretation with low costs.
As noted above, Collect Earth takes advantage of the Google Earth Engine service, to which there is currently no alternative. The European Commission’s Data and Information Access Services (DIAS) are not yet fully operational and are a mix of open-source and pay-per-use platforms predominantly focused on Copernicus data. Google Earth Engine offers one of the most state-of-the-art systems for Earth Observation and climatic data storage and processing while also delivering it for free. To our knowledge, there is no other system able to provide this level of service while also being able to guarantee its sustainability (Google Earth Engine has been operational since 2010). A recent overview of Platforms for Big Earth Observation Data Management and Analysis [
6] finds that from the standpoint of ease of use and development maturity, Google Earth Engine is the platform that delivers the best solution for users. Although it has drawbacks such as the lack of guarantee of platform continuity, the ease of use, development maturity, and free access are critical for Collect Earth targeted at developing countries’ users. If the need and demand arise, Collect Earth could be adapted to other providers offering services such as Google Earth Engine, but none have been identified.
Collect Earth is a tool that can also be used to assess land-use, land-use change, natural disasters, sustainable management of scarce resources, restoration potential and ecosystem functioning. Besides being used at the national level for REDD+ monitoring, measurement, and reporting, and at the continental level (e.g.,
https://www.fao.org/documents/card/en/c/cb5896en/, accessed on 5 October 2021) for biophysical assessments of the continent, it has also been used at the global level to assess, for example, the extent of forests in dryland biomes [
7], the earth’s tree restoration potential [
8] and for the monitoring of land restoration [
9].
High-quality data for REDD+ monitoring, measurement and reporting is critical for the continued success of REDD+ implementation and Results-Based Payments (RBPs) [
10]. Furthermore, under the United Nations Framework Convention on Climate Change (UNFCCC) Enhanced Transparency Framework of the Paris Agreement (Article 13), countries, including developing countries, need to report on their national greenhouse gas inventories and progress made in implementing their Nationally Determined Contributions, as well as undergo a technical expert review of the information submitted. Developing countries engaged in the REDD+ process thereby have the opportunity, depending on the national circumstances and the financial status, technology transfer and capacity building, to use the data measured for REDD+ not only to access RBPs but also to fulfil their reporting requirements under the Enhanced Transparency Framework.
Collect Earth is one such tool that makes it possible for countries to measure and report accurate and transparent emissions and removals estimates. Such estimates are transparent as (a) the entire data collection process (from design to analysis) can be independently reviewed and reproduced, (b) the use of a systematic sampling design is more transparent and statistically robust compared to using randomly allocated plots, and (c) that data itself can be used to produce related statistical uncertainties. At the time of writing, thirty-five countries have used Collect Earth to develop their REDD+ Forest Reference Emissions Level or Forest Reference Level (FREL/FRL) submitted to the UNFCCC REDD+ Web Platform. In these FRELs/FRLs, Collect Earth was used to assess the Activity Data (land area and land area change) according to the six broad IPCC categories). Furthermore, several countries (Cambodia, Chile, Costa Rica, and Papua New Guinea) have also used it to report REDD+ results through the UNFCCC Biennial Update Report (BUR) REDD+ Technical Annex. Collect Earth has also been used by fourteen countries for their REDD+ FREL/FRL to perform an accuracy assessment of wall-to-wall land-use and land-use change monitoring (UNFCCC REDD+ Web Platform). Concrete methodological approaches have also been developed to ensure that, in the context of reporting to the UNFCCC, Collect Earth can be used consistently and accurately for land representation for greenhouse-gas inventories [
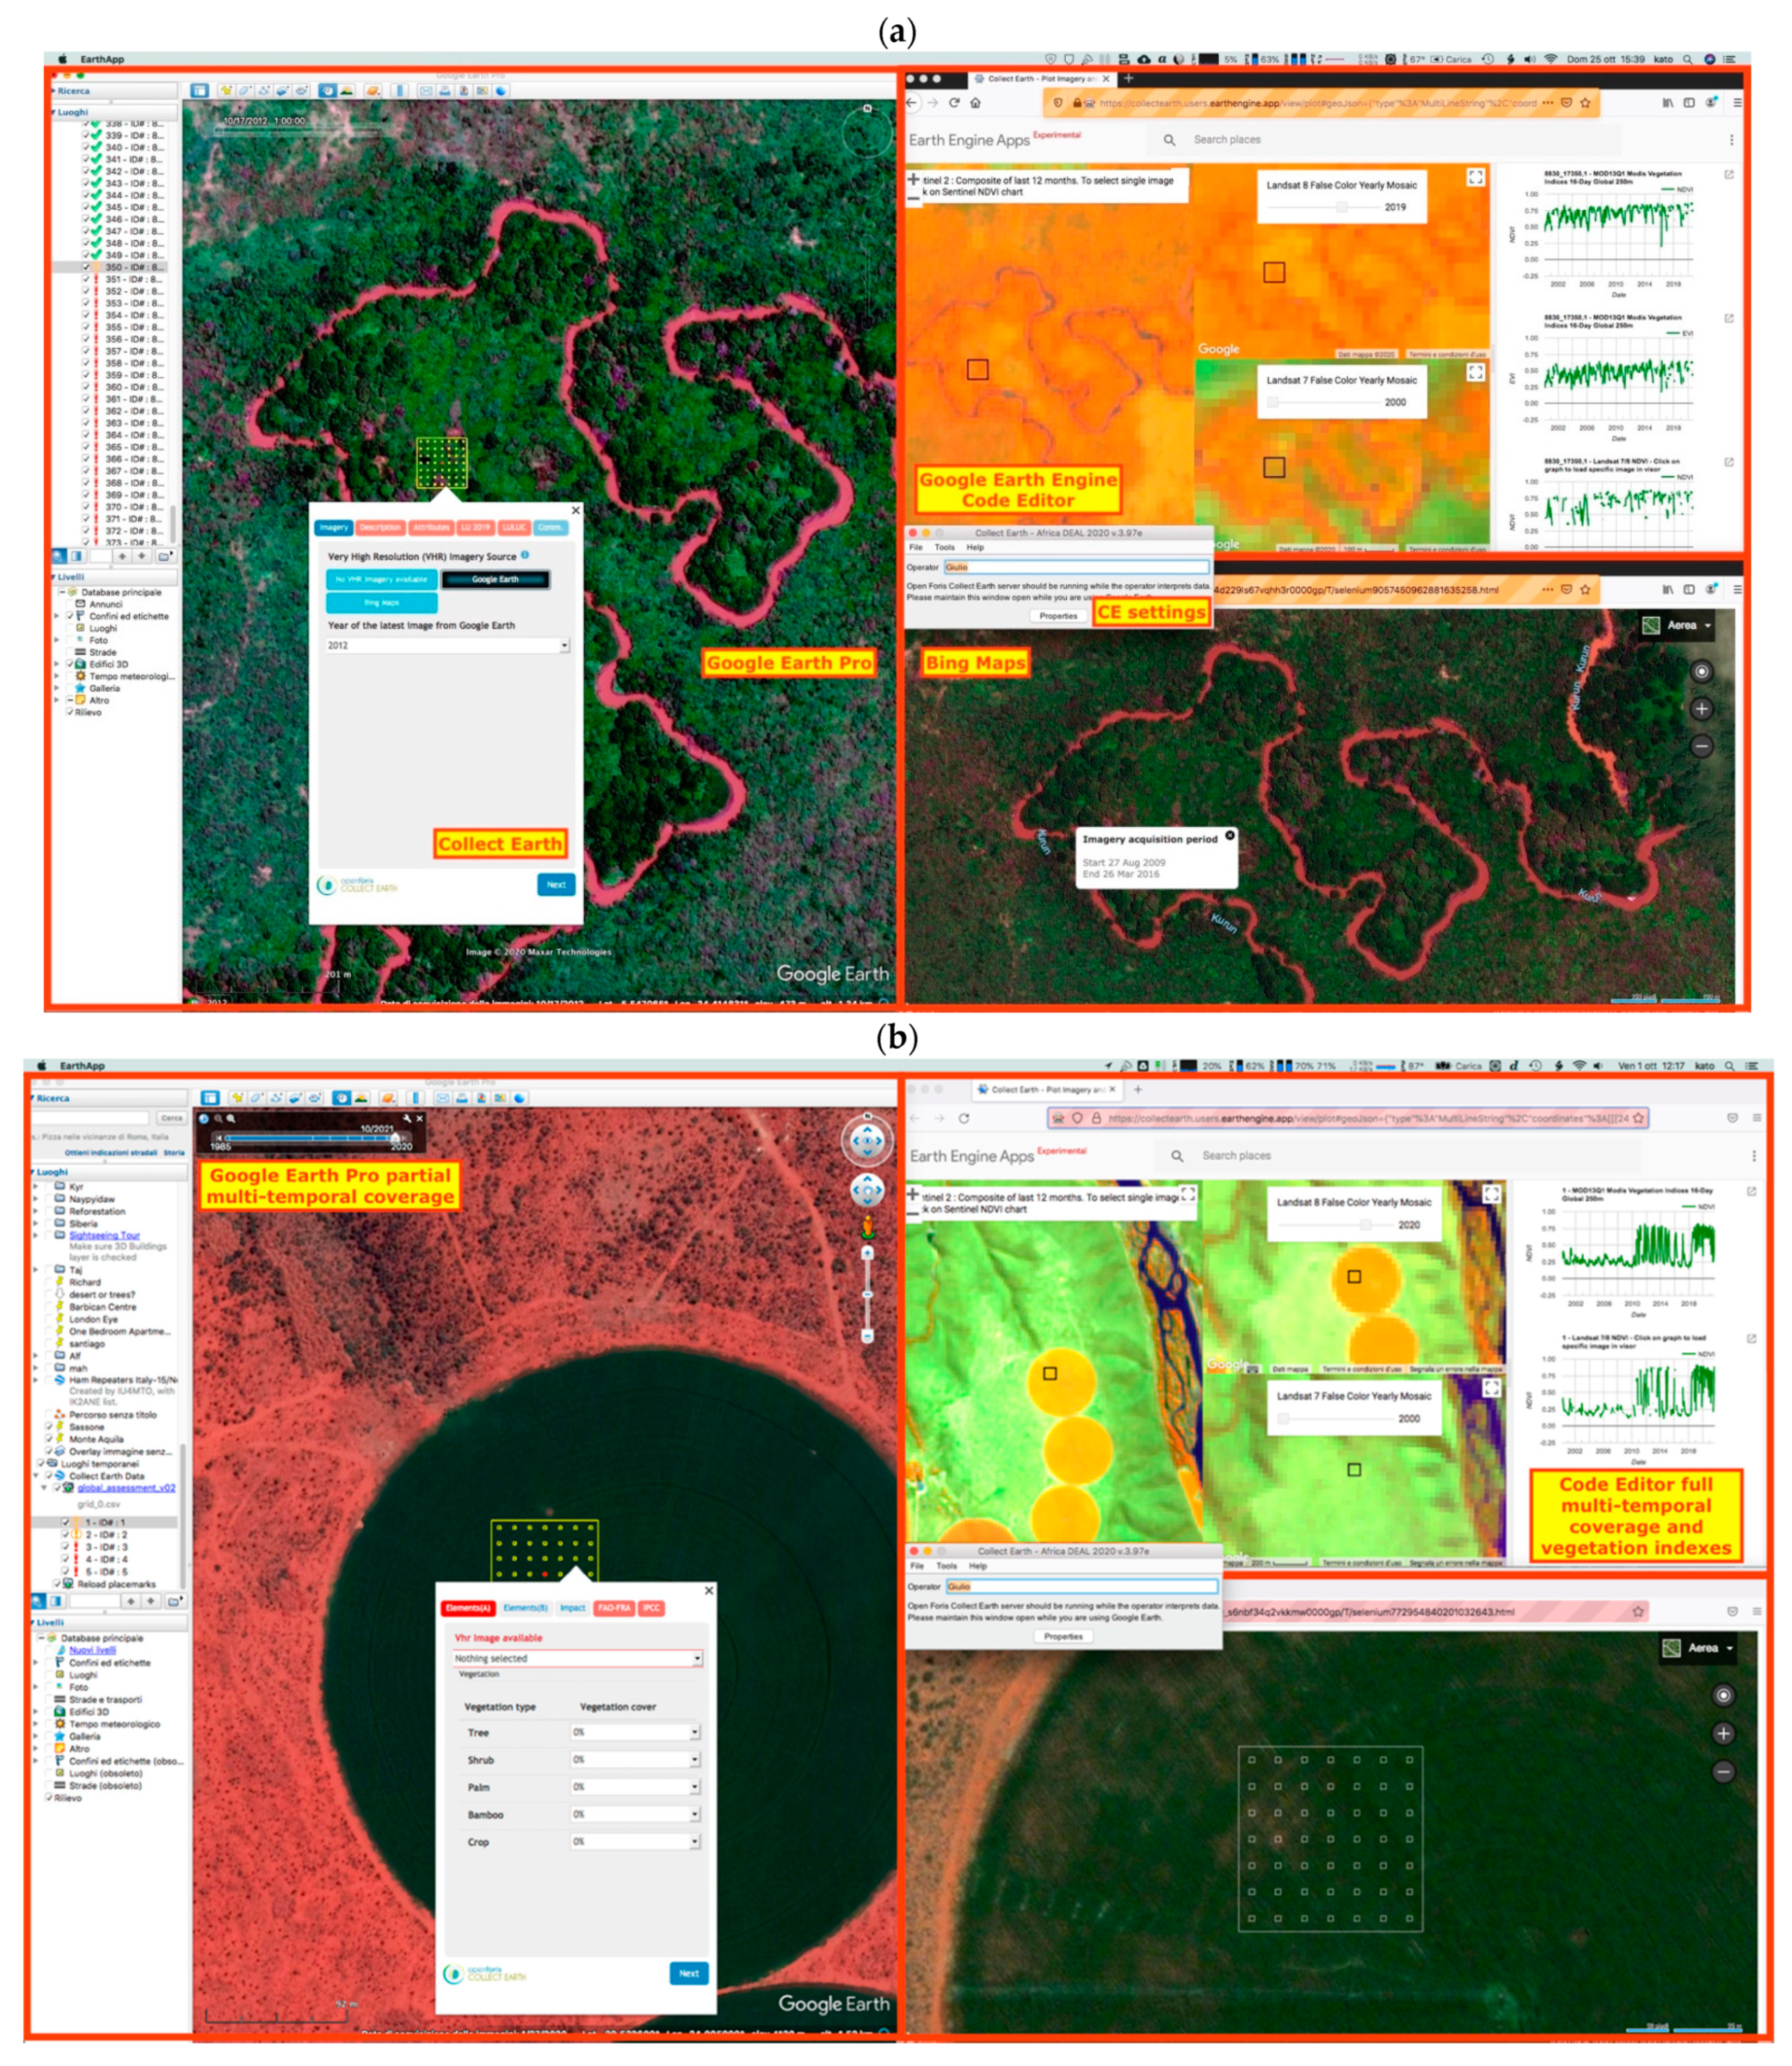
11]. After investing heavily in more traditional wall-to-wall land and forest cover maps, several countries (
Figure 2) chose to use Collect Earth instead as the more accurate, efficient, and less costly alternative.
Based on the review of the 2020 National Inventory Reports (NIR) Annex I Party GHG Inventory Submissions, the vast majority of Annex I Parties (these include the industrialized countries that were members of the OECD (Organization for Economic Co-operation and Development) in 1992, plus countries with Economies In Transition (the EIT Parties), including the Russian Federation, the Baltic States, and several Central and Eastern European States) use a sample-based approach to report on Land-use and Land-use Change and Forestry (LULUCF) to the UNFCCC (out of 42 Parties to the Kyoto Protocol, only three use wall-to-wall mapping (Australia, Portugal, and Turkey). Nonetheless, a sample-based approach, as used by most Annex I Parties and made user-friendly and powerful through a tool, such as Collect Earth, is currently excluded from, for example, the GFOI (Global Forest Observations Initiative) REDD+ Methods and Guidance document [
12]. This document only promotes land-cover and land-cover change maps as considerations for remotely sensed observations. This resource is often referred to by the partners that provide capacity building to developing countries, as well as by the donors and finance mechanisms for countries to obtain REDD+ Results-Based Payments (RBPs). As Collect Earth and the sample-based methodology are used by several countries to report on REDD+, this commentary advocates for a more inclusive approach and a methodological debate concerning the potential of sample-based approaches using remote sensing and ground truthing or high-resolution images to estimate Activity Data for REDD+ and countries’ greenhouse gas inventories for the Agriculture, Forestry, and Other Land Use (AFOLU) sector in general.
2. Uses, Potential, and Limitations of Collect Earth
Collect Earth was first developed in 2013 and first published in 2016 [
5] and has continuously improved by integrating the latest developments and updates in Google Earth Engine. These improvements include incorporating new high-resolution data, such as the European Space Agency’s Copernicus Sentinel 2 and the high-resolution Planet data recently made available through the agreement between Planet and the Government of Norway’s International Climate and Forests Initiative. It continues to be a free, open access tool that non-remote sensing or GIS experts can quickly learn to use to undertake land-use and land-cover assessments. Users can learn to use the tool through freely accessible online tutorials and a ‘user forum’ where questions can be posted and FAO experts provide assistance.
Users can assess several elements (e.g., number of trees) of land-use and land-cover and their associated changes through a pre-defined time horizon (e.g., 2010–2020) in a sample plot (
Figure 2) using an ‘html’ data collection form that appears for each plot in the sampling design through the Google Earth interface. The parameters of this form are set at the beginning of an assessment by the user, depending on the type of information the user would like to collect. For example, for land-use and change assessments in a country, the data collection form will include the six IPCC land-use categories, the national sub-categories (defined by the country and consistent with the reporting in the greenhouse-gas inventory), as well as the possible land-use changes from one category to another. The augmented visual interpretation of the plots is supported through the various indices loaded in the Google Earth Engine interface and by using the images in Bing Maps for corroboration.
Although there is no set level of accuracy required for reporting greenhouse gas inventories to the UNFCCC, increased accuracy of REDD+ results is crucial for countries to access REDD+ RBPs. Low accuracy and high uncertainty in REDD+ results lead to penalties for countries thereby reducing the RBPs they can receive. The level of accuracy and ability to report on complex land-use and land-use change dynamics reached by countries through the use of Collect Earth is equivalent to the accuracy achieved by Annex-I countries in their greenhouse-gas inventory reporting. Annex I countries such as Italy and Switzerland use visual interpretation to assess their Activity Data (see respective 2020 NIRs). Countries using Collect Earth can take their visual interpretation one step further and combine it with other elements, such as vegetation indices in the Google Earth Engine directly linked through Collect Earth, to improve the quality of the assessment of the Activity Data. This is often important in dry domains where it is challenging to distinguish between other land and grassland using satellites images. Using Collect Earth, rules were developed with research institutions and developing countries to use the Normalized Difference Vegetation Index (NDVI) to distinguish between other land and grassland. In case there were peaks above 0.2 or 0.25, and at least one or two of these peaks could be observed in the last 20 years, then the plot was considered grassland. A similar assessment cannot be conducted easily using wall-to-wall maps or a classic visual interpretation analysis. Mexico, for example, used this approach in its FREL submission (Mexico Forest Reference Emission, 2020).
Furthermore, to further increase accuracy, such assessments in Collect Earth are performed using probabilistic sampling designs to select plots through a process that gives all areas within the assessment a known chance of being selected [
5]. Common examples include simple random sampling, stratified sampling, and stratified systematic sampling. Probability sampling allows estimating the sampling errors and uncertainties in the land area estimates [
1] undertaken through the Collect Earth assessments. The Collect Earth website provides a freely accessible online tutorial on generating a sample design through the Google Earth Engine. In the case of Mexico, the country chose to change its methodological approach for its FREL from wall-to-wall assessments (2015 FREL) to sample-based assessments using Collect Earth for increased accuracy (2020 FREL).
Moreover, this level of accuracy was reached by developing countries’ institutions at a low cost and through having received training on Collect Earth (the average cost of training ranges between USD 3000–10,000) and in some cases independently by using online materials and support information (e.g., Mexico). The costs and time needed to undertake an assessment are predictable using sample-based assessment tools such as Collect Earth (on average, a national assessment takes about 2–3 weeks of work, with another 2 weeks for quality assurance and data analysis). Estimates for wall-to-wall assessments are more difficult due to different costs of satellite image acquisition and difficulty in predicting the time needed to undertake the analysis (quality assurance and data analysis can take several months at the national level and often require more trained GIS and remote sensing experts). Furthermore, Collect Earth allows countries and national institutions to collect information that can be used to report to the other Rio Conventions and on the Sustainable Development Goals (SDGs) in a consistent manner and without the need for additional assessments. Examples of the different types of information that can be collected are the green vegetation changes in mountain areas (Mountain Green Cover Index SDG 15.4.2), changes in land productivity and carbon stocks (United Nations Convention to Combat Desertification (UNCCD) Land Degradation Neutrality (LDN) SDG 15.3.1), presence of trees outside the forest, linear vegetation elements and cover heterogeneity (Convention on Biological Diversity (CBD), Landscape Biodiversity) crop types, crop management, number of annual harvests, pasture/grassland distribution and management (FAO STAT, Agriculture) in addition to land-cover biophysical and anthropogenic elements, land-uses, and land-use changes (UNCCD LDN 15.2.1 15.3.1 and UNFCCC AFOLU SDG 15.1.1 and 15.4.2). This is much more challenging to achieve with wall-to-wall maps on forest-cover and forest-cover change.
Collect Earth, and other tools or methods that use augmented visual interpretation through a sample-based methodology can also be used to undertake rapid quantitative national or regional assessments with high accuracy when disturbance alerts, such as the RADD alert (which uses Sentinel 1 radar data), detect events of logging or forest degradation [
13].
Collect Earth, however, also faces particular challenges. The accuracy and robustness of any assessment will depend heavily on applying an appropriate sampling design and sampling intensity to adequately capture the variability of the land characteristics being assessed. This is also the case for Collect Earth. Furthermore, the point-sampling methodology is a non-exhaustive spatial cover (depending on the sampling intensity) which limits capturing the full variability of the land that can be classified and measured [
5]. There is also a risk of interpretation error as the assessments are made through augmented visual interpretation (i.e., not automated or semi-automated assessments). In other words, a Collect Earth assessment benefits from the human intelligence that can discern a wide variety of landscapes and scenarios but differs from the automated and semi-automated assessment that, albeit not always correct, gives a more homogeneous and less subjective response.
Moreover, when only a small number of users are collecting data, there is a risk of introducing systematic errors into the data collection. If multiple users are working on an assessment, it is crucial to develop clear, standard interpretation guidelines to ensure a homogeneous interpretation. For the above reasons, it is always recommended to undertake a detailed data cleaning and data quality assessment during collection, especially at the end. Finally, the Collect Earth tool depends on an Internet connection, and it can be used offline only with substantial limitations and workarounds. In cases where only Google Earth imagery is required, a low or medium-speed Internet connection can be adequate [
5]. However, to quickly visualize and process years of MODIS, Landsat and Sentinel 2 imagery, as well as the Landsat Greenest pixel products, high-speed Internet is an asset.
3. Toward a More Inclusive and Open Approach of Monitoring Land for REDD+
Wall-to-wall maps are more immediate to produce when simple (e.g., forest/non-forest) spatially explicit information is required to design and monitor policies, management decisions and actions, and to visually present their impact (e.g., firefighting, sustainable management of forests, tackling illegal deforestation or forest degradation, monitoring land restoration and reforestation programs). Wall-to-wall maps can also be used to improve the sample design strategy to reduce the number of measurements and increase the accuracy of the results.
One of the benefits of the sampling-based approach is significant time and cost savings as opposed to mapping an area wall-to-wall, as only a statistically representative portion of the target region needs to be mapped [
3]. These cost and time-saving considerations are important to consider as countries will have to update the greenhouse gas inventories that they report to the UNFCCC every two years through the Biennial Update Reports (BURs). Another significant benefit is the possibility to achieve a detailed classification of the land-use sub-categories with high accuracy of the estimates for land-use changes occurring since 2000. Furthermore, land-use changes are often rare events, occurring at rates close to intrinsic differences among two maps of the area at two different times. Sample-based approaches undertaken with tools such as Collect Earth that allow the user to examine the imagery in Google Earth to determine the date (or dates) of change within an assessment time period provide the opportunity to better capture, characterize, and report the land-use change.
Unfortunately, several organizations providing capacity building for forest and land monitoring and reporting to countries engaged in the REDD+ process advocate using wall-to-wall land-cover maps to assess Activity Data for greenhouse gas inventories. This is a missed opportunity for developing countries as they can often obtain only results with low details and significant uncertainties, potentially excluding them from the result-based payments under the UNFCCC. Rather than excluding the sample-based approach to collect Activity Data information, given the need for countries to update their greenhouse gas inventories every two years for the BURs, we believe that there needs to be a more inclusive outlook to sampled-based approaches, such as Collect Earth, to support countries to report progress and results to the UNFCCC on REDD+ and also support countries to use one methodological framework for Activity Data that can be used to monitor report to the UNCCD, the CBD, on the SDGs, and the impact of the UN Decade on Ecosystem Restoration and Nature-Based Solutions. The two approaches (wall-to-wall maps and sample-based approaches) need not be mutually exclusive. Rather, their respective strengths should be integrated and advocated for to best support countries engaged in the REDD+ process. Sample-based approaches can be used to estimate Activity Data for greenhouse gas inventories that need to be updated every two years, which can in turn feed into the analysis of wall-to-wall based approaches when spatially explicit information is needed to measure and monitor the impact of policy and management decisions.


 ,
, 

