Article

Recent Spatiotemporal Trends in Glacier Snowline Altitude at the End of the Melt Season in the Qilian Mountains, China

1
Shaanxi Key Laboratory of Earth Surface System and Environmental Carrying Capacity, Xi’an 710127, China
2
Institute of Earth Surface System and Hazards, College of Urban and Environmental Sciences, Northwest University, Xi’an 710127, China
3
Pearl River Water Resources Research Institute, Pearl River Water Resources Commission, Guangzhou 510611, China
*
Author to whom correspondence should be addressed.
Remote Sens. 2021, 13(23), 4935; https://0-doi-org.brum.beds.ac.uk/10.3390/rs13234935
Submission received: 20 October 2021 / Revised: 26 November 2021 / Accepted: 2 December 2021 / Published: 4 December 2021

Abstract

:
Glaciers in the Qilian Mountains, China, play an important role in supplying freshwater to downstream populations, maintaining ecological balance, and supporting economic development on the Tibetan Plateau. Glacier snowline altitude (SLA) at the end of the melt season is an indicator of the Equilibrium line altitude (ELA), and can be used to estimate the mass balance and climate reconstruction. Here, we employ the height zone-area method to determine the SLA at the end of the melt season during the 1989–2018 period using Landsat, MODIS (Moderate Resolution Imaging Spectroradiometer) SLA and Shuttle Radar Topography Mission (SRTM) digital elevation model (DEM) data. The accuracy of glacier SLA obtained in 1989–2018 after adding MODIS SLA data to the years without Landsat data increased by about 78 m. The difference between the remote-sensing-derived SLA and measured equilibrium line altitude (ELA) is mostly within 50 m, suggesting that the SLA can serve as a proxy for the ELA at the end of the melt season. The SLA of Qiyi Glacier in the Qilian Mountains rose from 4690 ± 25 m to 5030 ± 25 m, with an average of 4900 ± 103 m during the 30 year study period. The western, central, eastern sections and the whole range of the Qilian Mountains exhibited an upward trend in SLA during the 30 year study period. The mean glacier SLAs were 4923 ± 137 m, 4864 ± 135 m, 4550 ± 149 m and 4779 ± 149 m for the western, central, eastern sections and the whole range, respectively. From the perspective of spatial distribution, regardless of the different orientation, grid scale and basin scale, the glacier SLA of Qilian Mountains showed an upward trend from 1989 to 2018, and the glacier SLA is in general located at a comparably higher altitude in the southern and western parts of the Qilian Mountains while it is located at a comparably lower altitude in its northern and eastern parts. In an ideal condition, climate sensitivity studies of ELA in Qilian Mountains show that if the summer mean temperature increases (decreases) by 1 °C, then ELA will increase (decrease) by about 102 m. If the annual total solid precipitation increases (decreases) by 10%, then the glacier ELA will decrease (rise) by about 6 m. The summer mean temperature is the main factor affecting the temporal trend of SLA, whereas both summer mean temperature and annual total precipitation influence the spatial change of SLA.

Graphical Abstract

1. Introduction

The Qilian Mountains in China are an important component of the Qinghai–Tibet Plateau, forming the northeastern rim of the plateau. This mountain range plays a crucial role in regulating human activity, the ecological balance, runoff replenishment, and economic development in the Qinghai-Tibet Plateau [1]. Qilian Mountain is a natural water tower for water resources supply in oasis areas of northwestern China [2,3], the large number of glaciers bred by it play an important role in water supply and drought mitigation in downstream areas [4]. Glacier change in Qilian Mountains directly affects the change of water storage in water towers of each basin. A large portion of the water volume from the Qilian Mountains, especially that in the rivers in the western section, is derived from the melting of alpine glaciers. Glaciers, which serve as “solid reservoirs,” can regulate annual changes in river runoff and are especially valuable for maintaining the relative stability of the water supply. Therefore, activities such as water conservancy, road construction, industrial and mining construction, and tourism development in this mountainous region also need to understand and appreciate the importance of these glaciers to both the hydrological system and socioeconomic sustainability of the region. Furthermore, certain natural hazards in mountainous areas, such as mudslides and floods, are often associated with glacial processes.
Glacier length, area, thickness, equilibrium line altitude (ELA) and mass balance can reflect glacier changes. However, glacier length and area are not only related to climate change, but are also related to glacier flow and glacier morphology. The response of glacier area and length changes to climate change is lagging [5], so they cannot be used as direct evidence to explain climate change. Glacier mass balance is the difference between glacier surface accumulation and ablation. Compared with length and area, mass balance is the most direct, timely and real reflection of climate change [6]. Although there is a relatively consistent understanding of the spatial and temporal patterns of glacier change in the specific study area in recent several decades, there are still large differences in the estimation of large-scale spatial glacier mass balance changes. In addition, there are currently uncertainties in the estimation of sea level rise due to changes in mountain glaciers. Accurate calculation of changes in the mass balance of glaciers in the Qinghai-Tibet Plateau, where observational data is less is the key to reducing this uncertainty. Mass balance can be monitored by glaciology and geodetic methods. The glaciology method is to calculate the mass balance by setting stakes on the glacier surface and measuring stakes and the thickness of snow layer in the snow pits. The use of glaciological methods to monitor mass balance requires sufficient financial guarantees and technical support, especially in the Qinghai-Tibet Plateau with steep terrain and harsh natural conditions. According to the World Glacier Monitoring Service (WGMS), there were about 76 glaciers with observed mass balance in High Mountain Asia, and only 14 glaciers have observed mass balance for more than 5 years over the past 15 years. In particular, there are few monitoring observations of large-scale, long-term, continuous glacier mass balance in the Qilian Mountains. In the absence of field observations, the equilibrium line altitude can be estimated from satellite data via either the toe-to-headwall altitude ratio, area-altitude ratio, area-altitude balance ratio, area altitude balance index method, or median elevation method [7]. However, previous studies have shown that these methods may underestimate the ELA when the glacier is in negative mass balance. The glacier mass balance can be determined based on digital elevation model (DEM) differences for different periods [8,9,10], but this method can only determine the mass balance of the entire glacier; the mass balance at specific measuring points cannot be determined, as a result, it is difficult to obtain the long-term glacier mass balance. Furthermore, the mass balance results of a given region for the same period may vary greatly or even yield contradictory results, since different data and methods are often used [8,11]. In summary, glaciology and geodesy methods are difficult to reveal year by year, glacier by glacier, long time series of mass balance changes, and there are great differences in spatial large-scale glacier mass balance estimates. Therefore, it is necessary to use other data and methods to refine the calculation process to reduce the uncertainty in estimating glacier mass balance.
The glacier snow line is the boundary between snow and bare ice, which is defined as the highest elevation during the melting season that possesses snow from the previous accumulation season [12]. The Snowline altitude (SLA) at the end of the melt season can represents the ELA [13,14]. Therefore, the glacier snow line can be used to estimate, calibrate, and verify glacier mass balance [15,16]. Furthermore, the SLA can be used to determine the glacier accumulation-area ratio [17].
There are currently many available satellite data [18,19,20,21,22] and numerous accompanying processing methods that have been developed to determine the SLA in the Qinghai–Tibet Plateau, such as visual interpretation, band combination, band ratio, normalized difference snow index, snow-ice albedo, and image classification [22,23,24,25,26], to determine the SLA. These methods are simple and efficient, but the transitional zone between ice and snow introduces an uncertainty in the snow line determination. Current remote-sensing-based SLA research is largely focused on large-scale studies, such as High Mountain Asia, Greenland, and Qinghai–Tibet plateau, and utilizes Moderate Resolution Imaging Spectroradiometer (MODIS) data, which possess a 500–1000 m resolution, being generally employed to estimate the SLA [27,28,29]. Studies have shown that 85.66% of the glaciers in the Qilian Mountains cover less than 1.0 km2 [30]. Therefore, it will be difficult to accurately obtain the SLAs of these smaller glaciers in the Qilian Mountains when using satellite observations of 500–1000 m spatial resolution such as MODIS, which will then affect the subsequent ELA, mass balance, and runoff estimations. Alternatively, the SLA research scale is typically relatively small, concentrating on either a single glacier in the Qilian Mountains [31], for example, the difference in albedo between ice and snow is used to determine the SLA of Qiyi Glacier in Qilian Mountains based on Landsat images; or a certain area of the Qilian Mountains, with such a limited number of glaciers SLA research that it is difficult to reflect the glacier changes of the entire mountain range. The Landsat program provides the longest continuous space-based record of the Earth’s land in existence (1972–present). Owing to the influence of cloud, new snowfall and image temporal resolution, the acquisition of SLA from Landsat data at the end of ablation season may often lead to the absence of Landsat data in 1–2 years or even 3–5 years, which prevents us from obtaining the year–to–year SLA data. However, when studying the temporal change of SLA, the SLA of a specific year or some particular years may change the trend of linear fitting results, which is also the reason why we introduce MODIS SLA data in this study. We may obtain year–to–year SLA data through MODIS data with the relatively high temporal aspect. The MODIS is a payload imaging sensor that was launched into the Earth’s orbit by NASA in 1999 on board the Terra satellite, and in 2002 on board the Aqua satellite. Terra MODIS and Aqua MODIS are viewing the entire Earth’s surface every 1 to 2 days. The spatial resolution of MODIS and Landsat data are 500 m and 30 m, respectively, which means that 1 pixel on MODIS is approximately equal to 16.7 pixels on Landsat data. When the area of Qiyi Glacier is 2.781 km2 (1975), then Qiyi Glacier includes 11 MODIS pixels and 31 Landsat pixels. This will cause the SLA identified by the MODIS data to have a smoothing effect. In general, if the snow area in a pixel of MODIS data is ≤50%, then this pixel will not be recognized as the location of the snow line, and the location of the snow line may move to the pixel with a higher altitude. However, for high-resolution Landsat data, it is easier to capture the snow information and determine the snow line with higher accuracy. This is the reason why the SLA identified by MODIS is relatively high. Therefore, we utilize the Landsat Image and the height zone-area method to divide the glacier surface into a series of elevation (height) zones accordingly to determine the SLA. We use Landsat SLA as a “reference value” to correct MODIS SLA data, as this approach minimizes the SLA uncertainty and further completes the SLA time series and improves the SLA precision.
The objectives of our research were to (1) Evaluate the accuracy of SLA obtained by remote sensing; (2) Construct a more complete and accurate SLA time series; (3) Reveal the temporal and spatial variation of SLA and its sensitivity to climate in Qilian Mountains glaciers; (4) Restore and reconstruct ELA in the non-data and data-deficient areas to estimate glacier mass balance.

2. Study Area

The Qilian Mountains, which are located along the northeastern edge of the Qinghai–Tibet Plateau and across the Qinghai and Gansu provinces in northwestern China, are a large mountain range that consists of many northwest–southeast-oriented parallel mountains and valleys (Figure 1). The study area extends from the Altun Mountains in the west to Wushaoling Mountain in the east, and from Qaidam Basin in the south to the Hexi Corridor in the north; the entire mountain system covers an area of approximately 800 km × 300 km. The Qilian Mountains are divided into three sections, with Quinghai and Hara lakes serving as section boundaries: the eastern (Wuwei–Laji Mountains), central (Jiuquan–Delingha), and western (Yingzui Mountains–Dachaidan) sections. The elevation of the Qilian Mountains gradually increases from northeast to southwest, ranging from 4000 to 5200 m. Tuanjie Peak (also known as Gangzewujie, 5826 m) is the highest peak and is located in the Southern Shule Mountains in the center of the Qilian Mountains. The Alpine Ice and Snow Utilization Team, which was organized by the Chinese Academy of Sciences, conducted the first comprehensive investigation into modern glaciers in the Qilian Mountains in 1958, with a total of 2859 glaciers that covered 1972.5 km2 (including the glaciers at the eastern end of the Altun Mountains) and stored 95.4 km3 of ice, as recorded in the First Chinese Glacier Inventory [32]. The number of glaciers in the Qilian Mountains decreased to 2748 by 2015, and the corresponding area decreased to 1539.30 ± 49.50 km2 [33]. In the Chinese Glacier inventory, the Qilian Mountains are divided into Hexi (5Y4) and Qaidam (5Y5) interior areas in the Eastern Asia interior basin (5Y), and Datong river water system (5J4) in the Yellow River basin (5J) [34].
The Qiyi Glacier (39°14.22′ N, 97°45.34′ E, numbered CN5Y437C18) is located in the central section of the Qilian Mountains (Figure 1). It covers an area about 2.817 km2. The name of Qiyi Glacier came from its discovery on 1 July 1958. The Qiyi Glacier is a cirque-valley glacier and a subcontinental glacier. Furthermore, our team has conducted long-term monitoring and research on Qiyi Glacier in the Qilian Mountains and obtained continuous mass balance monitoring data since 2002, which is convenient for verifying the extracted SLA at the end of the melt season.
The annual average temperature in the Qilian Mountains is 5 °C. There is an east-to-west trend of decreasing precipitation, ranging from ~800 mm in Lenglongling to ~400 mm in the southern Danghe Mountains [35]. The ELA in the Qilian Mountains is ~4400–5100 m, and it decreases gradually from west to east [36].

3. Data and Methods

3.1. Data

3.1.1. Landsat Data

The Landsat satellite was first launched in 1972, with six subsequent successful launches (Landsat 2–5, 7, and 8). Landsat 9 is set to launch in December 2020, which will ensure the acquisition of new and long time-series data. Four different sensors have been used during the Landsat missions: the Multispectral Spectral Scanner (Landsat 1–5), Thematic Mapper (TM) (Landsat 4 and 5), Enhanced Thematic Mapper plus (ETM+) (Landsat 7), and Operational Land Imager (Landsat 8). The spatial and temporal resolutions of these sensors are 30 m (multispectral band) and ~16 days, respectively. There were two sensors working at the same time during some periods, which allowed the temporal resolution to be improved to about 8 days.
Landsat data were downloaded from the USGS (https://earthexplorer.usgs.gov/ (accessed on 20 September 2021)) and Geospatial Data Cloud (http://www.gscloud.cn/ (accessed on 20 September 2021)). We selected images that captured the end of the ablation season (June–August), were as free of cloud cover as possible, and had no occurrences of new snowfall events to extract the snow line. The images were screened mainly through visual method. Firstly, we would observe whether there is new snow on the image. If there was snow, this image would be excluded. Otherwise, we further viewed the Browse overlay map and metadata to exclude the images completely occluded by the cloud in the glacier area. In this way, we could not visually determine which scene among 2–3 images could obtain the highest snowline in some specific years; in that case, all the images were downloaded. After loading and comparing the images in Envi software, we finally determined which scene image to deal with. Since our research team has been conducting continuous field observations in the Qiyi Glacier, we have accumulated a large amount of valuable data. Therefore, we take Qiyi Glacier as an example to establish and evaluate the effectiveness and accuracy of SLA obtained by Landsat combined with MODIS data. In the Qiyi Glacier, Landsat TM data were selected for 1989, 1994, 1996, 1997, 1998, 2006, 2010, and 2011, Landsat ETM+ were used for 2011, 2014, and 2018, and Landsat OLI were compiled for 2013 and 2017. Among them, images in August accounted for 54% of the total, followed by images in September, which accounted for 23%, and the least in June (one scene). Therefore, we employed 13 scenes for analysis via the height zone–area method, together with DEM data, to determine the SLA of Qiyi Glacier in the Qilian Mountains during the 1989–2018 period (Table 1).
The Path and Row numbers of Landsat scenes used to study the temporal and spatial changes of the glacier SLA in Qilian Mountains are 136/33, 135/33, 134/33, 133/33, 132/34, and 135/34 (Figure 1). The statistics results show that the glaciers with these six Landsat scenes account for 98.4% of the glaciers in Qilian Mountains. Among them, the glaciers in 136/33, 135/ 33 and 132/34 account for 79.3% of the glaciers in these six scenes, and they are distributed in the western, central and eastern sections of Qilian Mountains. Therefore, in order to study more efficiently, we mainly used the Landsat data of 136/33,135/33 and 132/34 from 1989 to 2018 combined with 133/33, 134/33 and 135/34 in 1989, 1999, 2009 and 2018 to analyze the changes of SLA in Qilian Mountains. A total of 56 scenes meeting our requirements are collected. The detailed information is shown in Table 1.

3.1.2. MODIS SLA Data

Some scholars have studied SLA through the MOD10A1 data downloaded from the National Snow and Ice Data Center (https://nsidc.org/ (accessed on 20 September 2021)) from 2001 to 2016. Through the cloud removal of the Fractional Snow Cover Data of MODIS10A1, calibration of MODIS snow-covered days threshold for permanent snow cover estimation and determination of the boundary altitude value of the permanent snow cover, SLA at the end of the ablation season in High Mountain Asia was determined [14]. Here we directly refer to their research results.

3.1.3. DEM Data

The altitudes of the glacier snowline in the Qilian Mountains were determined using DEMs. We used SRTM DEMs, which cover more than 80% of Earth’s land surface between 60° N and 56° S. The SRTM DEMs were calculated relative to the WGS84 ellipsoid, with a 30 m spatial resolution and a ~16 m linear vertical absolute height error.

3.1.4. Meteorological Data

We use meteorological data for four purposes: (1) To illustrate the change trend of summer mean temperature and annual total precipitation in Qilian Mountains in the past 30 years; (2) To analyze the effects of summer mean temperature and annual total precipitation in different orientations on SLA of glaciers in Qilian Mountains; (3) To reveal the influence of summer mean temperature and annual total precipitation on SLA spatial variation; (4) To discuss the sensitivity of ELA to climate in the Qilian Mountains. Meteorological station data mainly is used for (1), (2), and (4). Because there are few meteorological stations in the Qilian Mountains, the spatial changes of temperature and precipitation cannot be well reflected. Therefore, ERA 5 data are applied, which has been proved to be able to present the spatial pattern of temperature and precipitation in mountainous areas [37,38].
There are 13 meteorological stations in the Qilian Mountains. According to the principle of uniform distribution in the Qilian Mountains and close to the glacier, we also referred to the literature [33], and seven meteorological stations around the glacier had been selected (Table 2). The weather station data are daily temperature and precipitation data downloaded from the National Meteorological Science Data Center (http://data.cma.cn/ (accessed on 20 September 2021)); ERA 5 atmospheric reanalysis data is the monthly average data with high spatial resolution (0.1° × 0.1°) downloaded from the European data center (https://cds.climate.copernicus.eu/cdsapp#!/dataset/reanalysis-era5-land-monthly-means?tab=form (accessed on 20 September 2021)).

3.1.5. Equilibrium Line Altitude Data

ELA is the altitude at the position where the annual material accumulation and annual material loss of glacier are equal. Through the accumulation and ablation of stakes and snow pit observation, we can calculate the mass balance. The position where the annual net balance obtained by the mass balance observation is equal to zero is the accurate balance line position of this year, and the corresponding altitude is ELA. SLA is the lower boundary of perennial snow. It is generally believed that the SLA at the end of the ablation season can be used to represent ELA. In turn, the observed ELA can also be used to evaluate and verify the SLA obtained by remote sensing. The pre-2001 ELA data were reconstructed using a combination of earlier measurements and temperature and precipitation data due to an interruption in monitoring the snow pits and stakes [39], and the post-2001 ELA data were measured in the field. Our team has observed the Qiyi Glacier from late June to early September every year since 2002, and measures the stakes and thickness of the snow pit every 5 days. Therefore, we have obtained many valuable measured data such as mass balance and ELA.

3.2. Methods

3.2.1. Striping Noise of Landsat Image Removal

The Landsat ETM+ instrument, which is equipped with a scan line corrector, malfunctioned in 2003, resulting in data gaps. These gaps will affect SLA determinations if they are distributed on the glacier; therefore, we employed the direct interpolation repair method, which uses neighboring pixels of the image gaps to repair the data gaps. Studies have shown that this method is relatively simple and particularly effective for strip repair in heterogeneous environments [40].

3.2.2. Radiometric Calibration of Landsat Image

The brightness values (or Digital Number (DN) values) of the remote-sensing images were taken from digital images that were 8-bit encoded after quantization and correction (systematically corrected, such as radiation correction and geometric correction of ground control points, and terrain correction through DEM elevation model). Therefore, it was necessary to convert the DN values into radiant brightness values to accurately invert the ground features.
The calibration for the TM/ETM+ data was performed via Equation (1):
Lλ = (LmaxLmin)/(QcalmaxQcalmin) × (QcalQcalmin) + Lmin
where Lλ is the top of the atmosphere spectral radiance; Lmax is the maximum radiation brightness that can be detected by the detector, which corresponds to the maximum gray value; Lmin is the minimum radiation brightness that can be detected by the detector, which corresponds to the minimum gray value; and Qcalmax and Qcalmin are the maximum and minimum gray values received by the sensor, respectively. We can find the parameters required in Equation (1) from the metadata, and check the information about band, wavelengths and resolution of Landsat TM5, ETM+, and OLI data from Table 3.
We used the following formula to calculate the radiant brightness values from the Landsat 8 data:
Lλ = ML × Qcal + AL
where ML and AL are the band-specific multiplicative rescaling factor (Radiance_MULT_x, where x is the band number) and band-specific additive rescaling factor (Radiance_ADD_x, where x is the band number) from the metadata, respectively, and Qcal is the quantized and calibrated standard product pixel values (DN).

3.2.3. Landsat Image Registration

A cloudless Landsat image was selected as the reference image, and the corresponding DEM and reference image were registered. Because we used six scenes data in our study, the Landsat data at different scenes were also registered with the corresponding reference images. Ground control points (GCPs) should be evenly and uniformly distributed in the images to accurately register the glacier terrain. It is worth noting that the number of GCPs is closely related to the polynomial order term n and terrain when using a polynomial mathematical model, such that the number of GCPs should be at least twice (n + 1) × (n + 2)/2. This study specifically uses the Image Registration Workflow tool in ENVI software to register images. By setting parameters such as matching method and Transform, the software will automatically screen out the matched GCPs and display the RMS error after registration, check each point in turn, manually revise each point, and follow the above GCPs selection principle, and ensure that RMS error is less than 1, and finally complete the image registration.

3.2.4. Glacier Boundary Extraction

Visual interpretation has been shown to be the best approach for extracting glacial boundaries. However, this approach is inefficient for large-scale studies that include numerous glaciers. In contrast, the band ratio method is a relatively simple and highly accurate approach that effectively extracts glacial boundaries from larger datasets. Moreover, it can eliminate the influence of terrain and shadow, so as to identify ice and snow in the shadow. By comparison, the ratio of red band and shortwave infrared (i.e., Band 3/Band 5 for the Landsat TM/ETM+ data, Band 4/Band 6 for the Landsat OLI data) has the best recognition effect in shadow and thin moraine [41,42,43]. After adopting the band ratio method, a black-and-white image is obtained, and the threshold is set to distinguish glaciers from other ground objects. Because the situation of each image is different, the threshold setting should be adjusted according to each image.
We overcame the difficulties of this method in distinguishing the boundaries of adjacent glaciers by using the DEM data to extract the ridgelines, then using the ridgelines to differentiate adjacent glaciers [44], and finally conducting a visual inspection to determine the glacier boundaries. In this study, we used the above method to obtain the glacier boundary of Qilian Mountains in 1989 as the glacier boundary on Landsat images before 2000. We utilized existing glacier boundary data for the 2000–2018 glacier boundaries, as previous studies have already documented the glacier boundaries in the Qilian Mountains [33,45]. We employed the glacier boundaries from the Second Chinese Glacier Inventory [45] for the 2000–2009 period and the glacier boundaries extracted by He et al. [33] for the 2010–2018 period.

3.2.5. Determination of SLA

The height zone–area method was employed in this study to determine the location of the glacier snow line. In ENVI software, the images were classified into ice, snow and other types by using the maximum likelihood method. In ARCGIS software, the results of the previous classification were reclassified into ice and snow (taking the Qiyi Glacier in Qilian Mountains as an example) (Figure 2a). The SRTM DEM of the glacier area was extracted with the glacier boundary, the extracted DEM was classified according to the interval of 50 m (Figure 2b), and the reclassified DEM raster data were then transformed into vector data. By combining the reclassified remote sensing image with the vector height zones data, we can obtain the snow area of each height zone, and then compare it with the original Landsat TM band 5, 4, and 3 combination data (the boundary between ice and snow on the combination image of this band is relatively clear). We can determine the height zone data where the snow line is located, and we can also obtain the snow area of this height zones. Taking the ratio of this area to the corresponding height zones as a threshold, we can obtain the SLA of all glaciers on this image (Table 4). According to the setting threshold, this threshold is then extended to the whole Qilian Mountains, and the SLA of other years can also be obtained.

3.2.6. Supplement of SLA Sequence

Interannual variability of the glacier SLA was significant. Due to the influence of cloud, new snowfall and temporal resolution of Landsat data, it may be impossible to extract SLA of a certain year by using Landsat data. However, the SLA of a single year or several years may change the SLA trend. The spatial resolution of Landsat data is high, while the temporal resolution of MODIS data is high. We set the SLA obtained by Landsat data as “reference value” (Figure 3), and calculated the average difference between SLAModis and SLALandsat from 1989 to 2018 in our research. SLAModis data were used to subtract the average value of the difference between the two above, and then the SLA of the year without Landsat data could be obtained. Therefore, we can get a more complete glacier SLA sequence.

3.2.7. Meteorological Data Processing

When studying the relationship between SLA changes and temperature and precipitation from 1989 to 2018, because Qilian Mountain glaciers mainly melted in summer, we discussed the impact of summer mean temperature on SLA. Based on the collected daily temperature data of meteorological stations, we selected the data obtained from June to August to calculate the summer mean temperature. For precipitation, we use the annual total precipitation, which is acquired by the sum of annual precipitation at each station. At the same time, in order to verify the ERA5 data, we calculate the summer mean temperature and annual total precipitation of the ERA5 data corresponding to the location of the meteorological station. We use the percentage of temperature/precipitation anomalies to eliminate the dimension. The percentage of temperature or precipitation anomalies is calculated by (measured value of temperature or precipitation—historical average value of the same period) * 100%/contemporaneous historical average.
When studying the relationship between SLA of different orientations and temperature/precipitation, we also used the summer mean temperature and annual total precipitation acquired from meteorological station data. When we analyzed the relationship between glacier SLAs on the north slope (N, NE and NW), south slope (S, SE and SW), west slope (W, NW and SW) and east slope (E, NE and SE) and the temperature and precipitation of meteorological stations, we used the aspect of the meteorological station in Table 2 to determine which slope the meteorological stations are located on. For example, meteorological stations such as 52633, 52645, and 52787 are distributed on the north slope.
When studying the influence of summer mean temperature and annual total precipitation on the spatial variation of SLA, we used ERA 5 data because there are few meteorological stations throughout Qilian Mountains. Using the cell statistical tool in the Arcgis software, the average monthly temperature data from June to August of the ERA5 data was calculated, and the total monthly precipitation data from January to December were calculated to obtain the summer mean temperature and annual total precipitation. Using the following formula, we can obtain the summer mean temperature change and annual total precipitation change in the Qilian Mountains from 1989 to 2018.
S l o p e = ( n i = 1 n ( i × C i ) i = 1 n i × i = 1 n C i ) / ( n i = 1 n i 2 ( i = 1 n i ) 2 )
where Slope is the slope of the pixel regression equation, Ci is the summer mean temperature or total annual precipitation in the specific year, and n is the length of time of the study. In this study, n = 30.
When studying the sensitivity of ELA to climate, in order to more accurately fit the relationship between ELA and temperature and precipitation, we carried out solid-liquid separation on precipitation data of seven stations in Qilian Mountains. Scholars reported that the daily temperature and precipitation data of meteorological stations were used to calculate the air temperature thresholds of rainfall and snowfall [46], and the statistical relationship between the thresholds T0 and longitude E and altitude H of each station was established, as shown in the following equation,
T0 = −0.0145 E − 0.0234 N + 0.0004 H + 5.3382
Based on formula 4 and the position and elevation information of each meteorological station in Table 2, we obtained the air temperature thresholds of liquid and solid precipitation separation at seven meteorological stations in Qilian Mountains. Based on these thresholds, we calculated the annual total solid precipitation of seven meteorological stations from 1989 to 2018 using daily temperature data and daily precipitation data. Then, the sensitivity of ELA to climate was evaluated by combining the summer mean temperature of seven meteorological stations and the ELA obtained by remote sensing in Qilian Mountains from 1989 to 2018.

4. Results and Discussion

4.1. Glacier SLA Accuracy Evaluation

Cloud cover, fresh snowfall, data source (temporal and spatial resolution of the satellite imagery, and length of the data time series), SRTM DEM, methods will likely affect the glacier SLA accuracy. When selecting images, we have tried our best to remove the influence of cloud cover and snowfall. The uncertainty of SLA obtained by Landsat was controlled in the range of ±25 m by using the height zone-area method after the DEM data were divided into 50 m intervals. Therefore, here we mainly evaluate the impact of data sources on SLA accuracy.
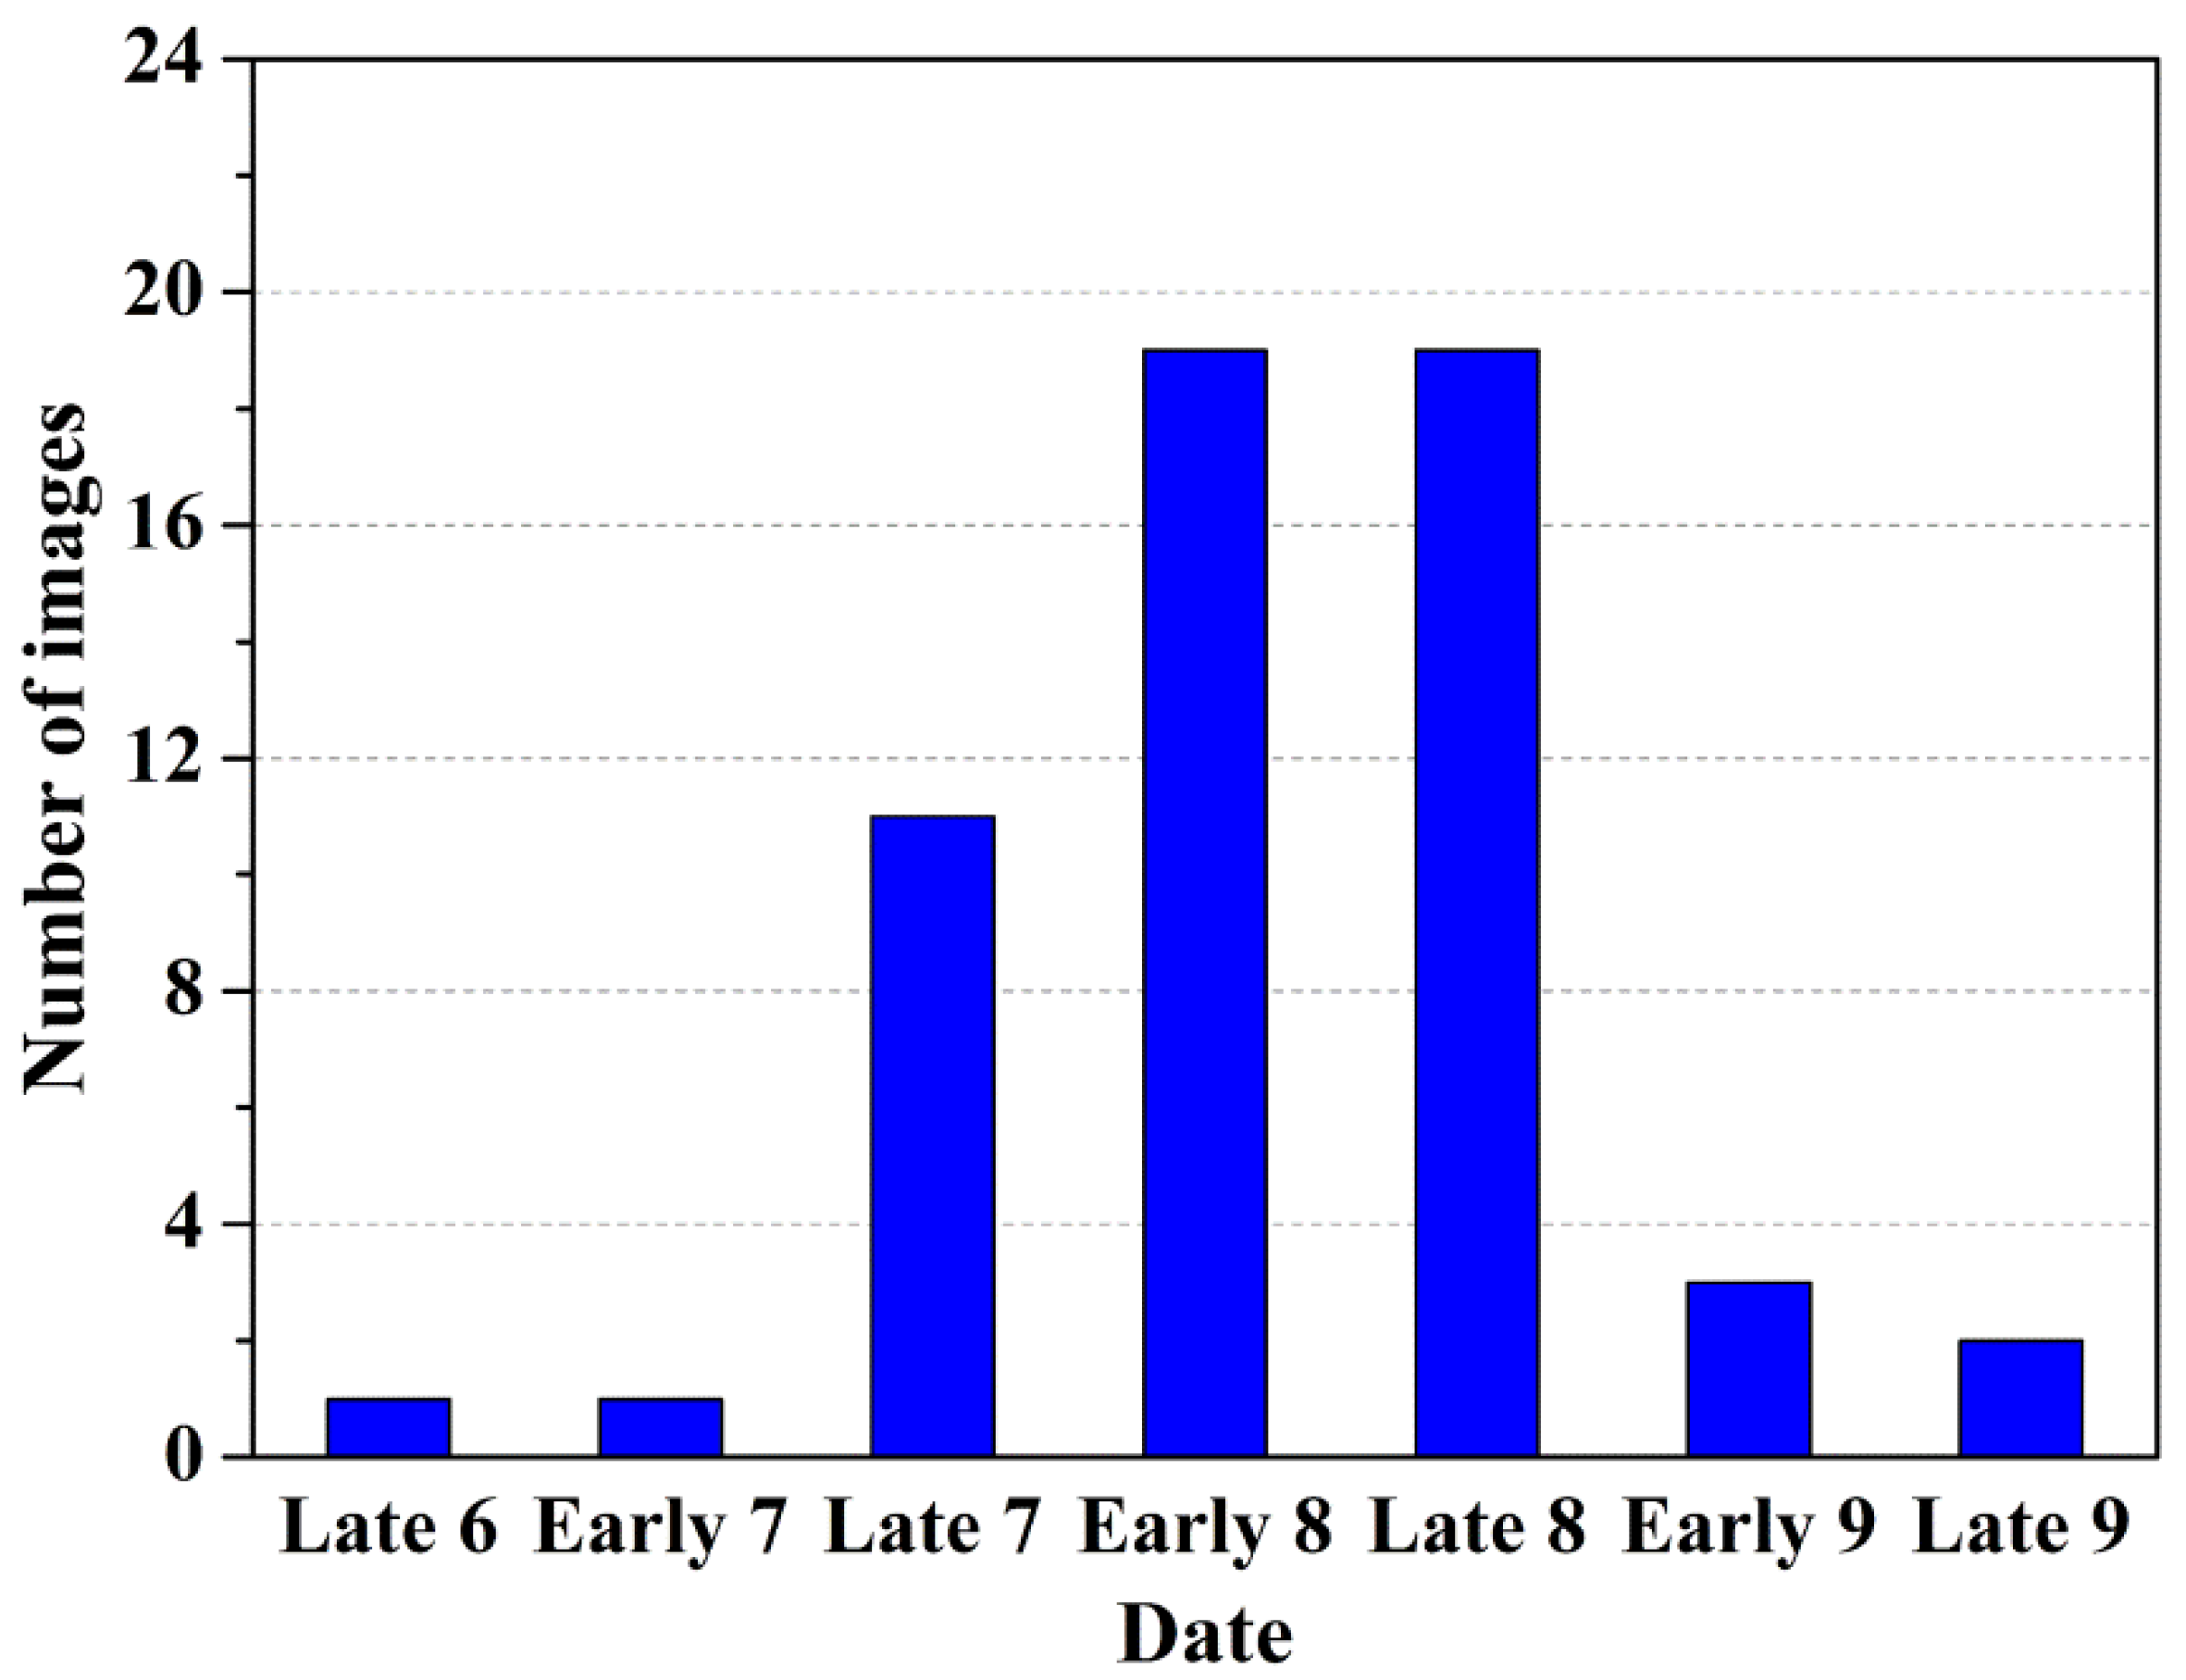
We primarily selected images from the late July to early September timeframe because the glacier SLA at the end of the ablation season should be the highest SLA for a given year, which means that this SLA can represent the ELA. The ablation season mainly occurs in the midsummer (July–August). However, the maximum SLA may also occur in early September, due to relatively high temperatures or no new snowfall. Approximately 88% of the analyzed Landsat images were acquired in the late July–August timeframe, with 78% acquired in August and 22% acquired in late July (Figure 4). How much influence may the SLA obtained by Landsat on different dates have on the accuracy of the SLA? Here we quote our previous research results to illustrate [
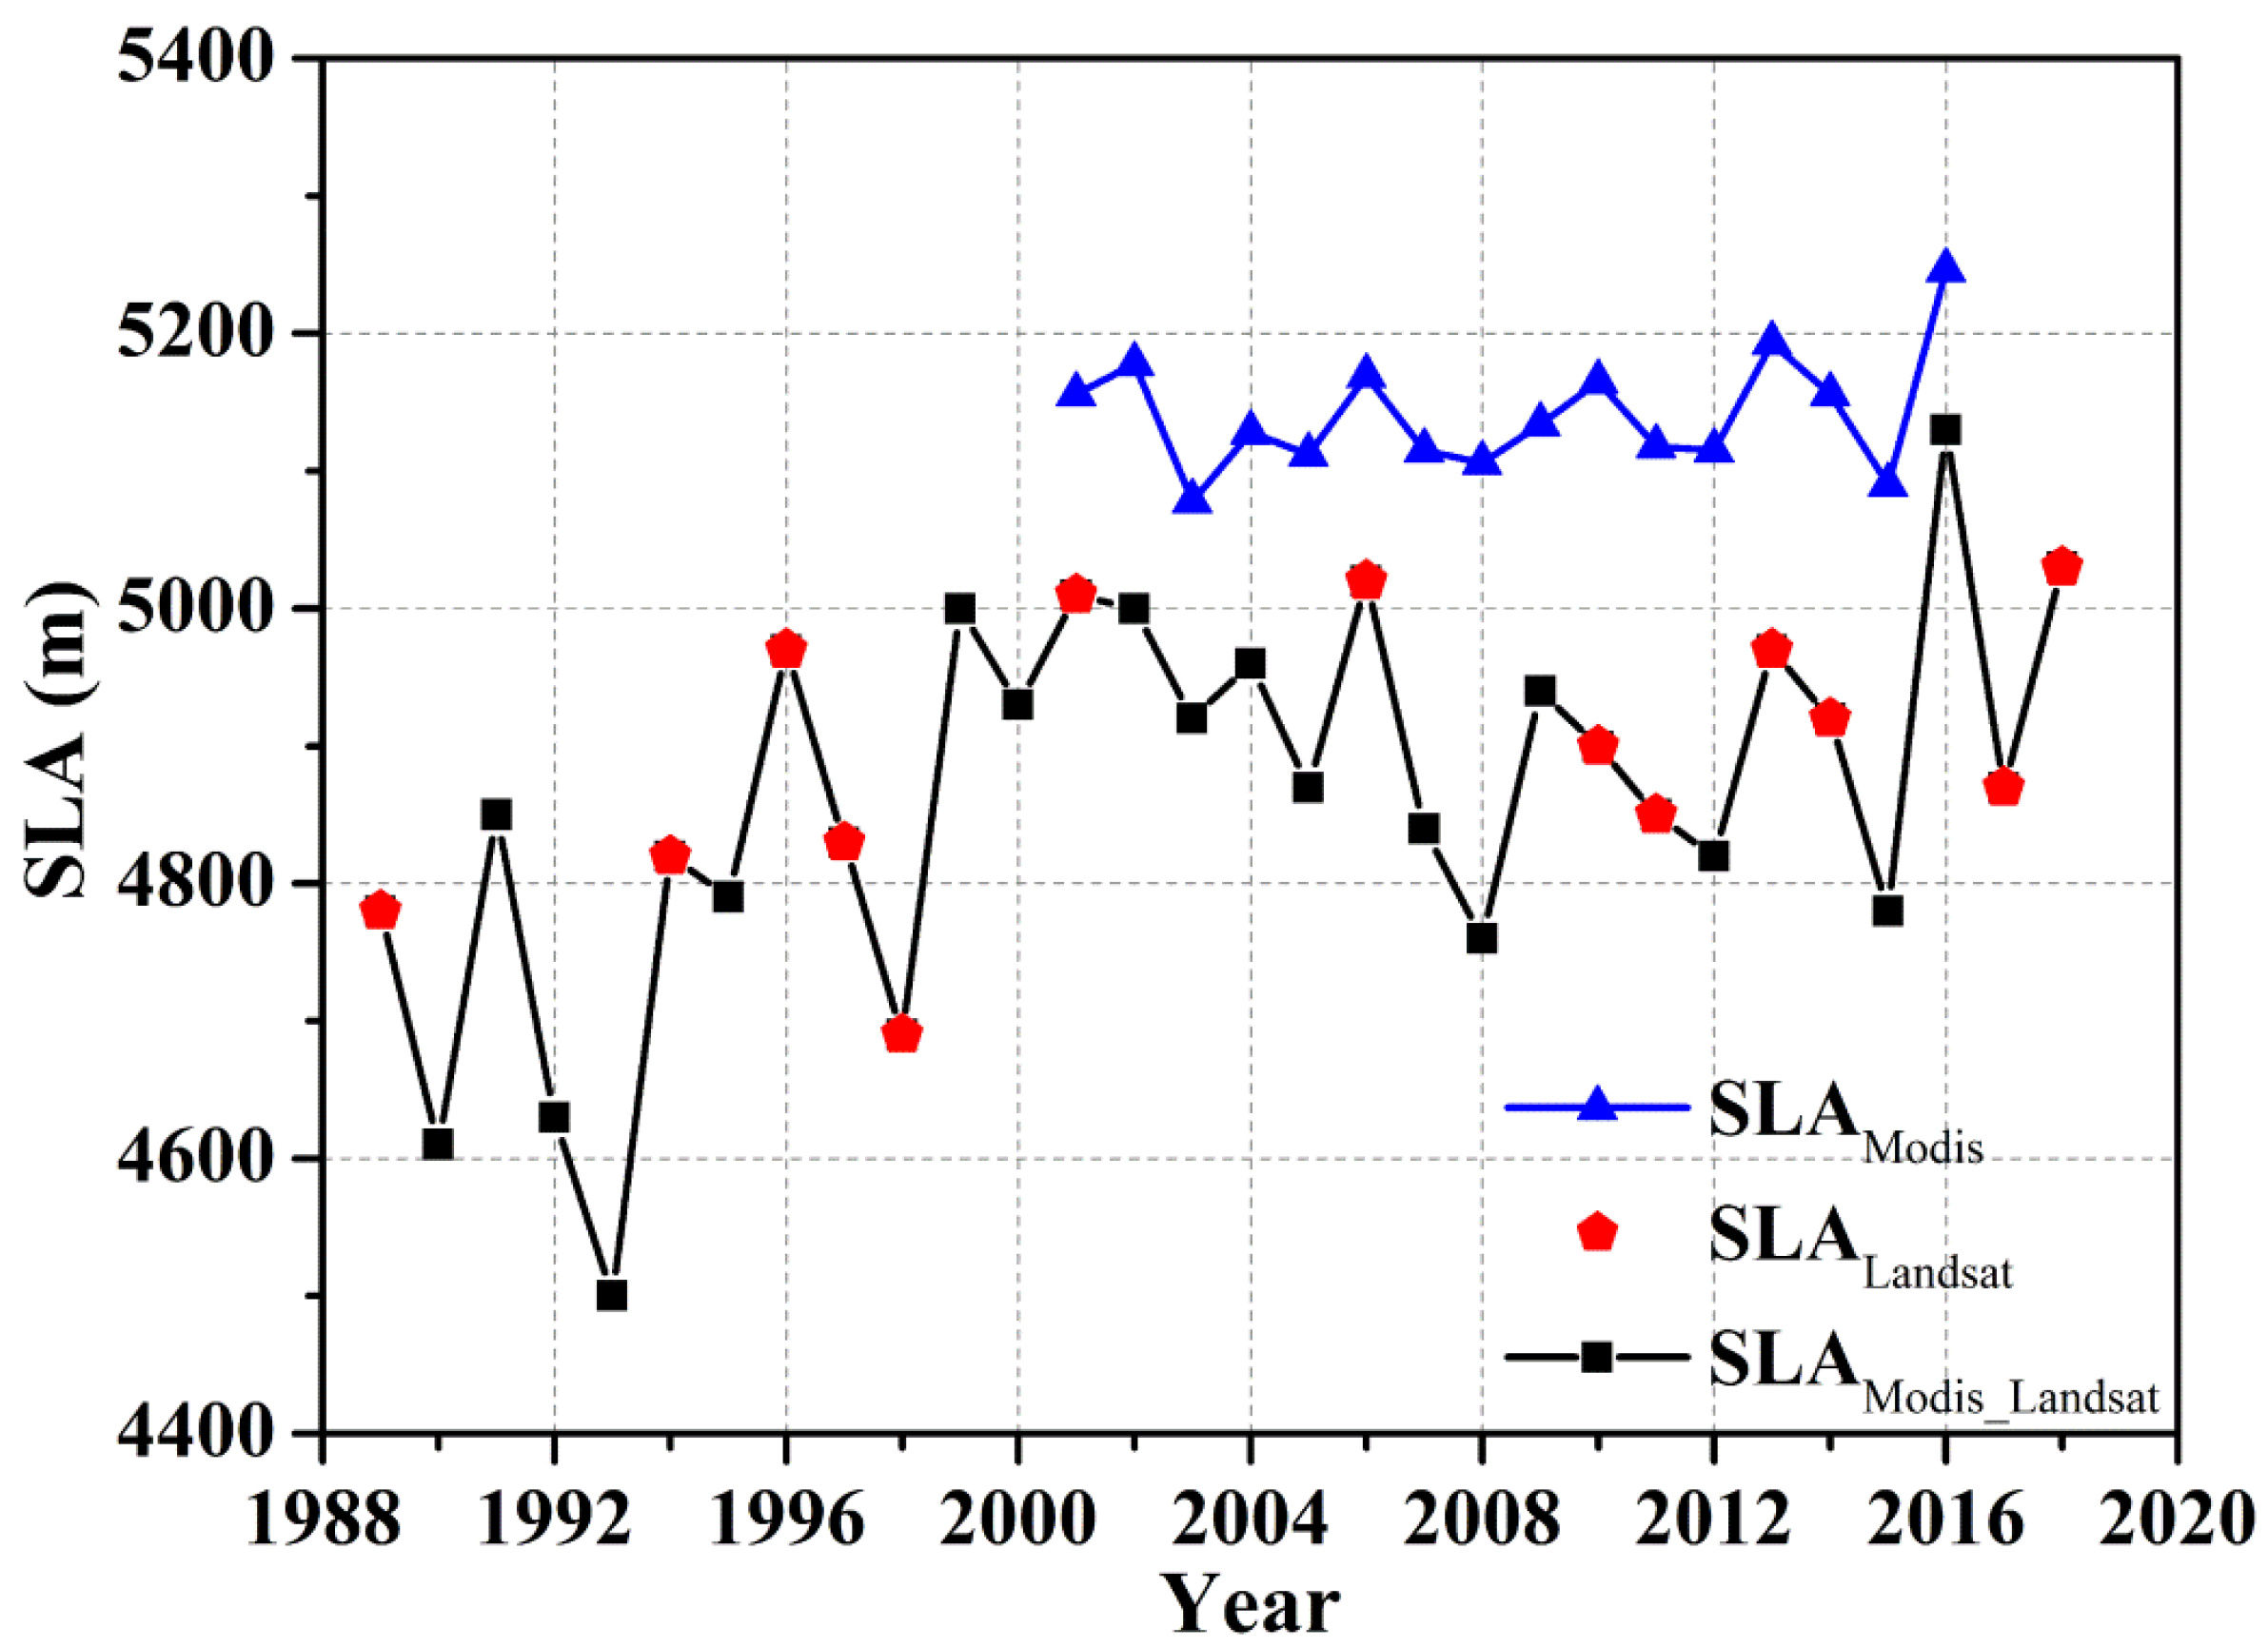
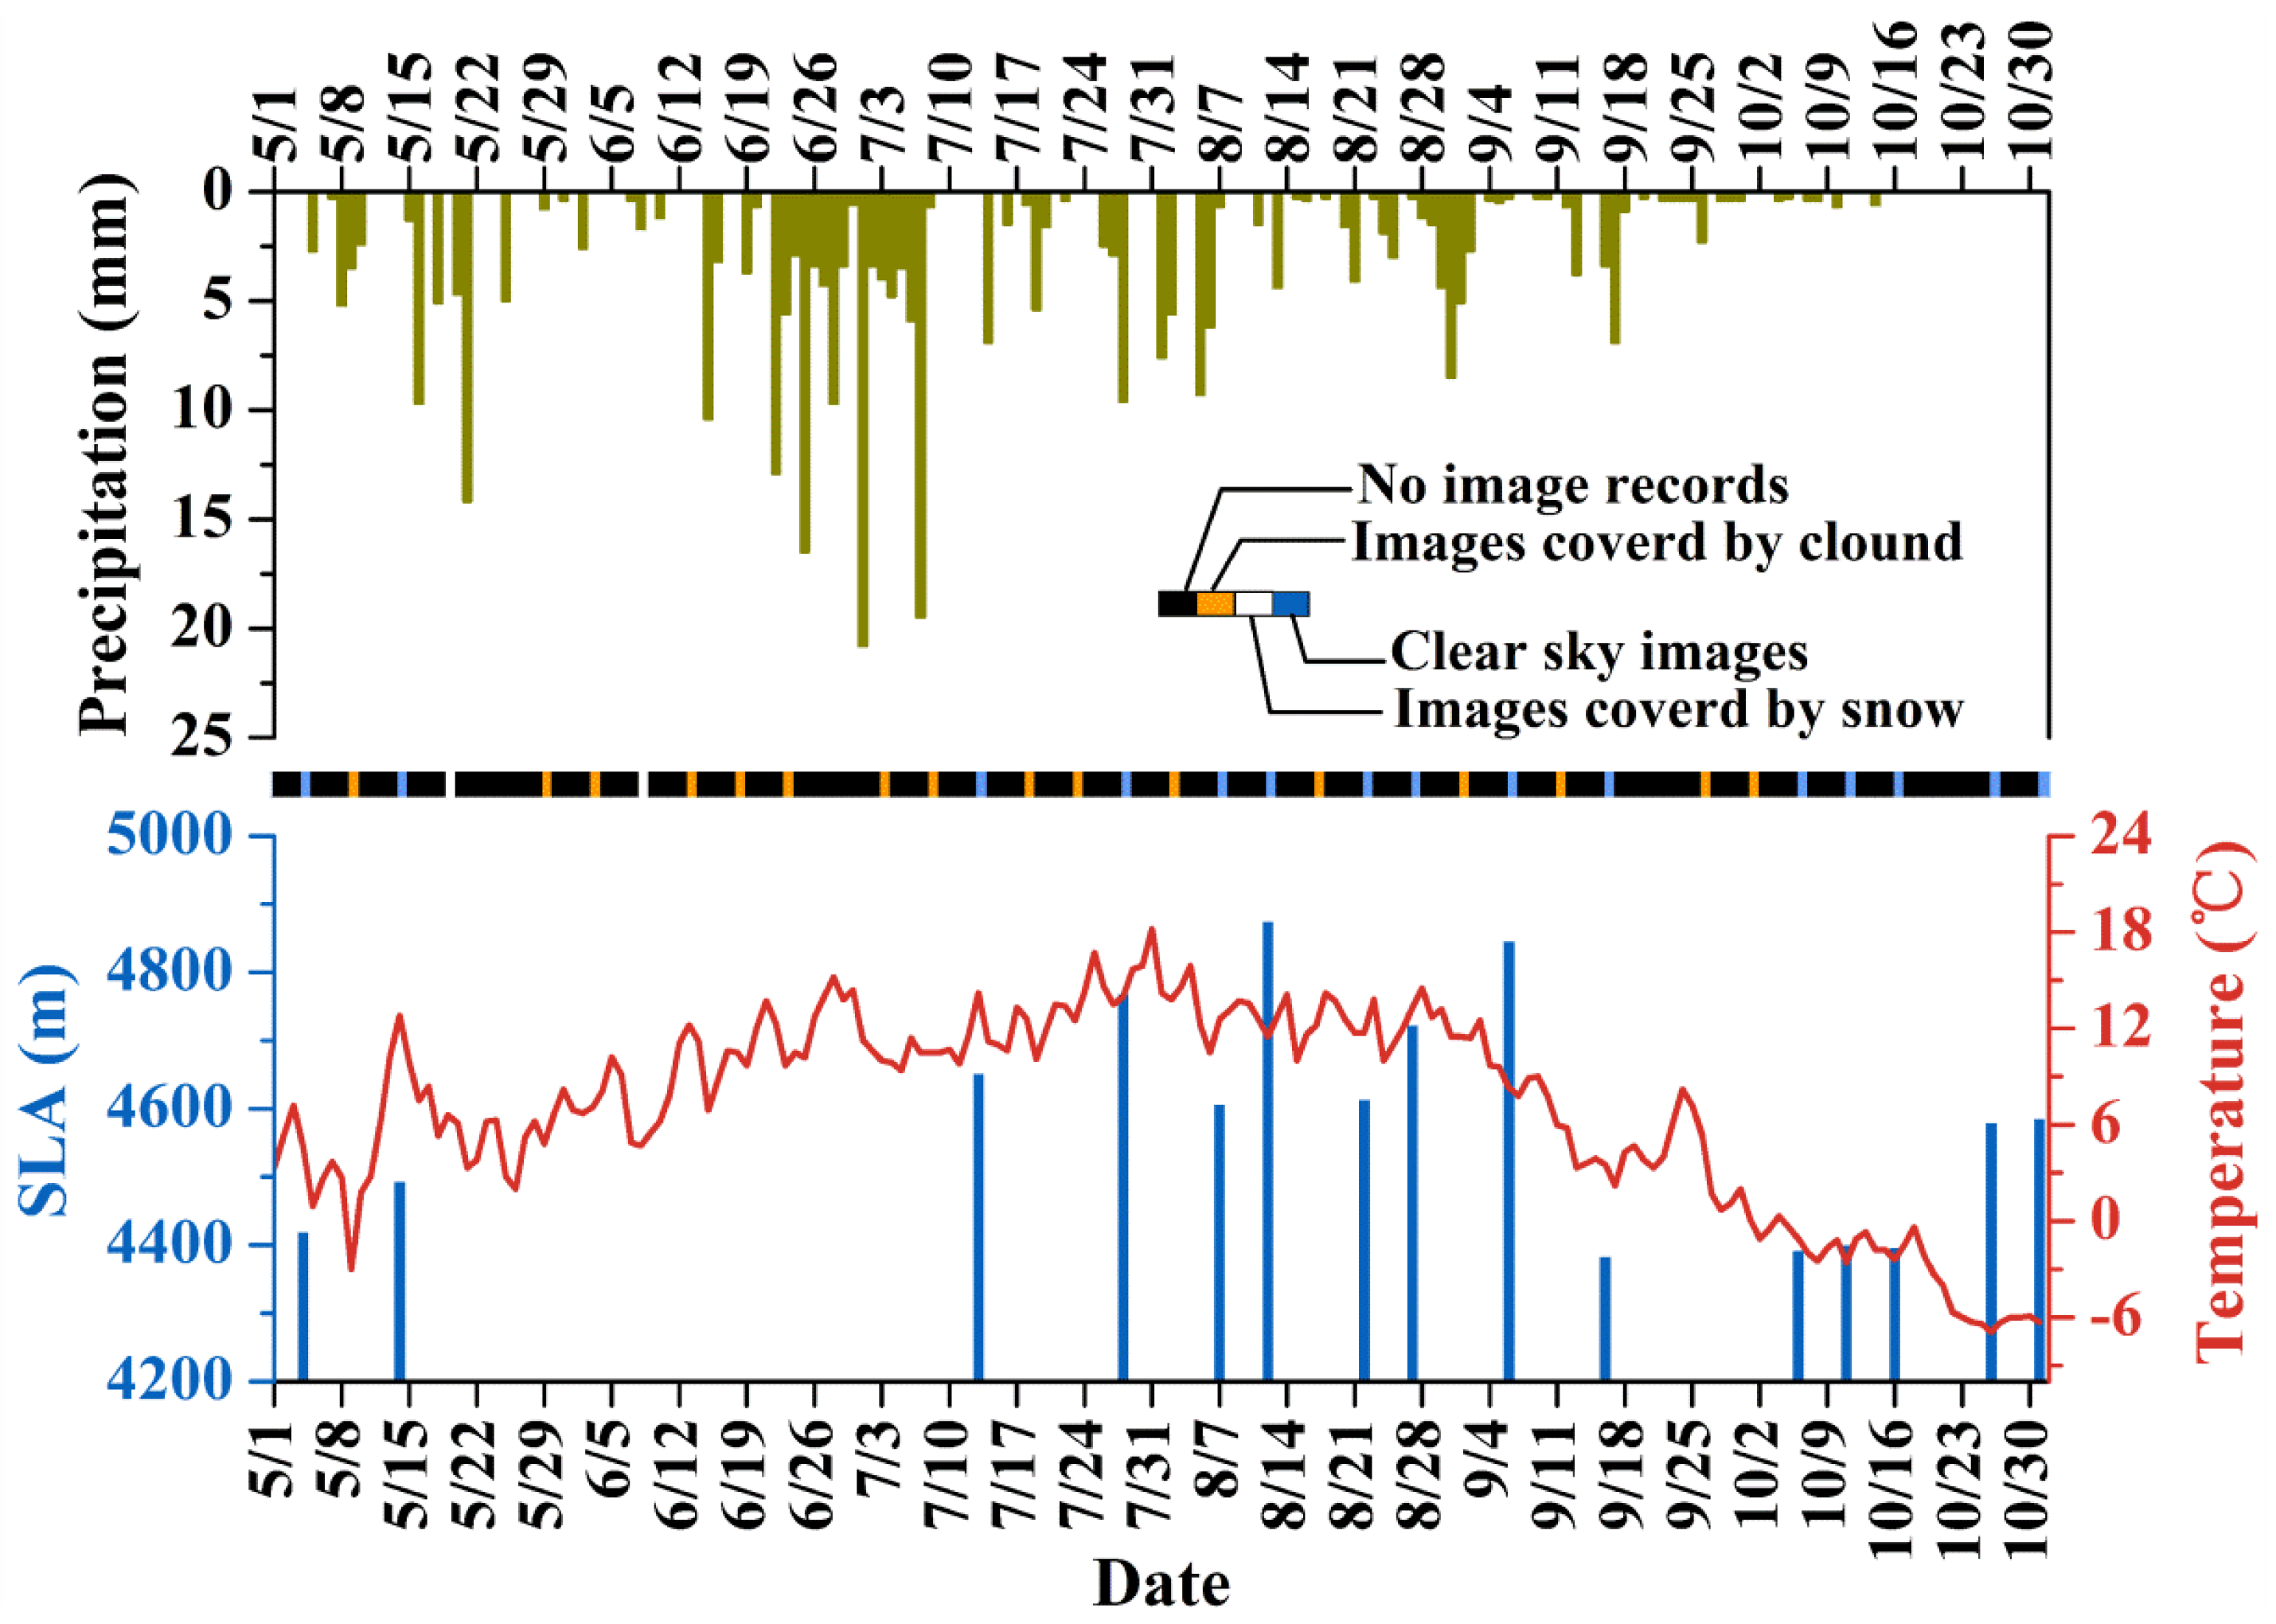
26]. Sentinel-2 images (1 May–31 October 2018) were used to evaluate the uncertainty in the Landsat-derived glacier SLA that arose from inconsistent Landsat data acquisition times since Sentinel-2 images possess a considerably higher spatiotemporal resolution (≥60 m, 5 d) (Figure 5). The glacier SLA was above 4600 m from July 28 to September 6, with a maximum SLA of 4873 m observed on 12 August. The results indicated that the average variability from the highest SLA (12 August) during the late July–August timeframe was 132 m, with minimum and maximum variations of 29 and 268 m, respectively. These Sentinel-2-derived glacier SLA data suggest that our analysis of the Landsat scenes that were mainly acquired in August to extract glacier SLA could extract the highest glacier SLA.
We set up six scenarios to evaluate the accuracy of our remote sensing SLA for SLA of all years, Remove SLAs of 1989 and 2019, Remove the minimum SLA (Remove SLAmin), Remove the maximum SLA (Remove SLAmax), Remove the minimum and sub-minimum SLA (Remove SLAmin and SLAsub-min), and Remove the maximum and sub-maximum SLA (Remove SLAmax and SLAsub-max) (Table 5). In these six scenarios, the SLA of Qilian Mountains has been on the rise since 1989–2018. However, the values of SLA change are different, and with the removal of SLAs of 1989 and 2019, SLA change is minimum (~8 m). When the smallest and second-smallest SLAs are removed, the maximum SLA change is about 76 m, and the SLA change is between them in the other four scenarios. Therefore, we can get the conclusion that the error may reach 78 m if the SLA sequence is incomplete.
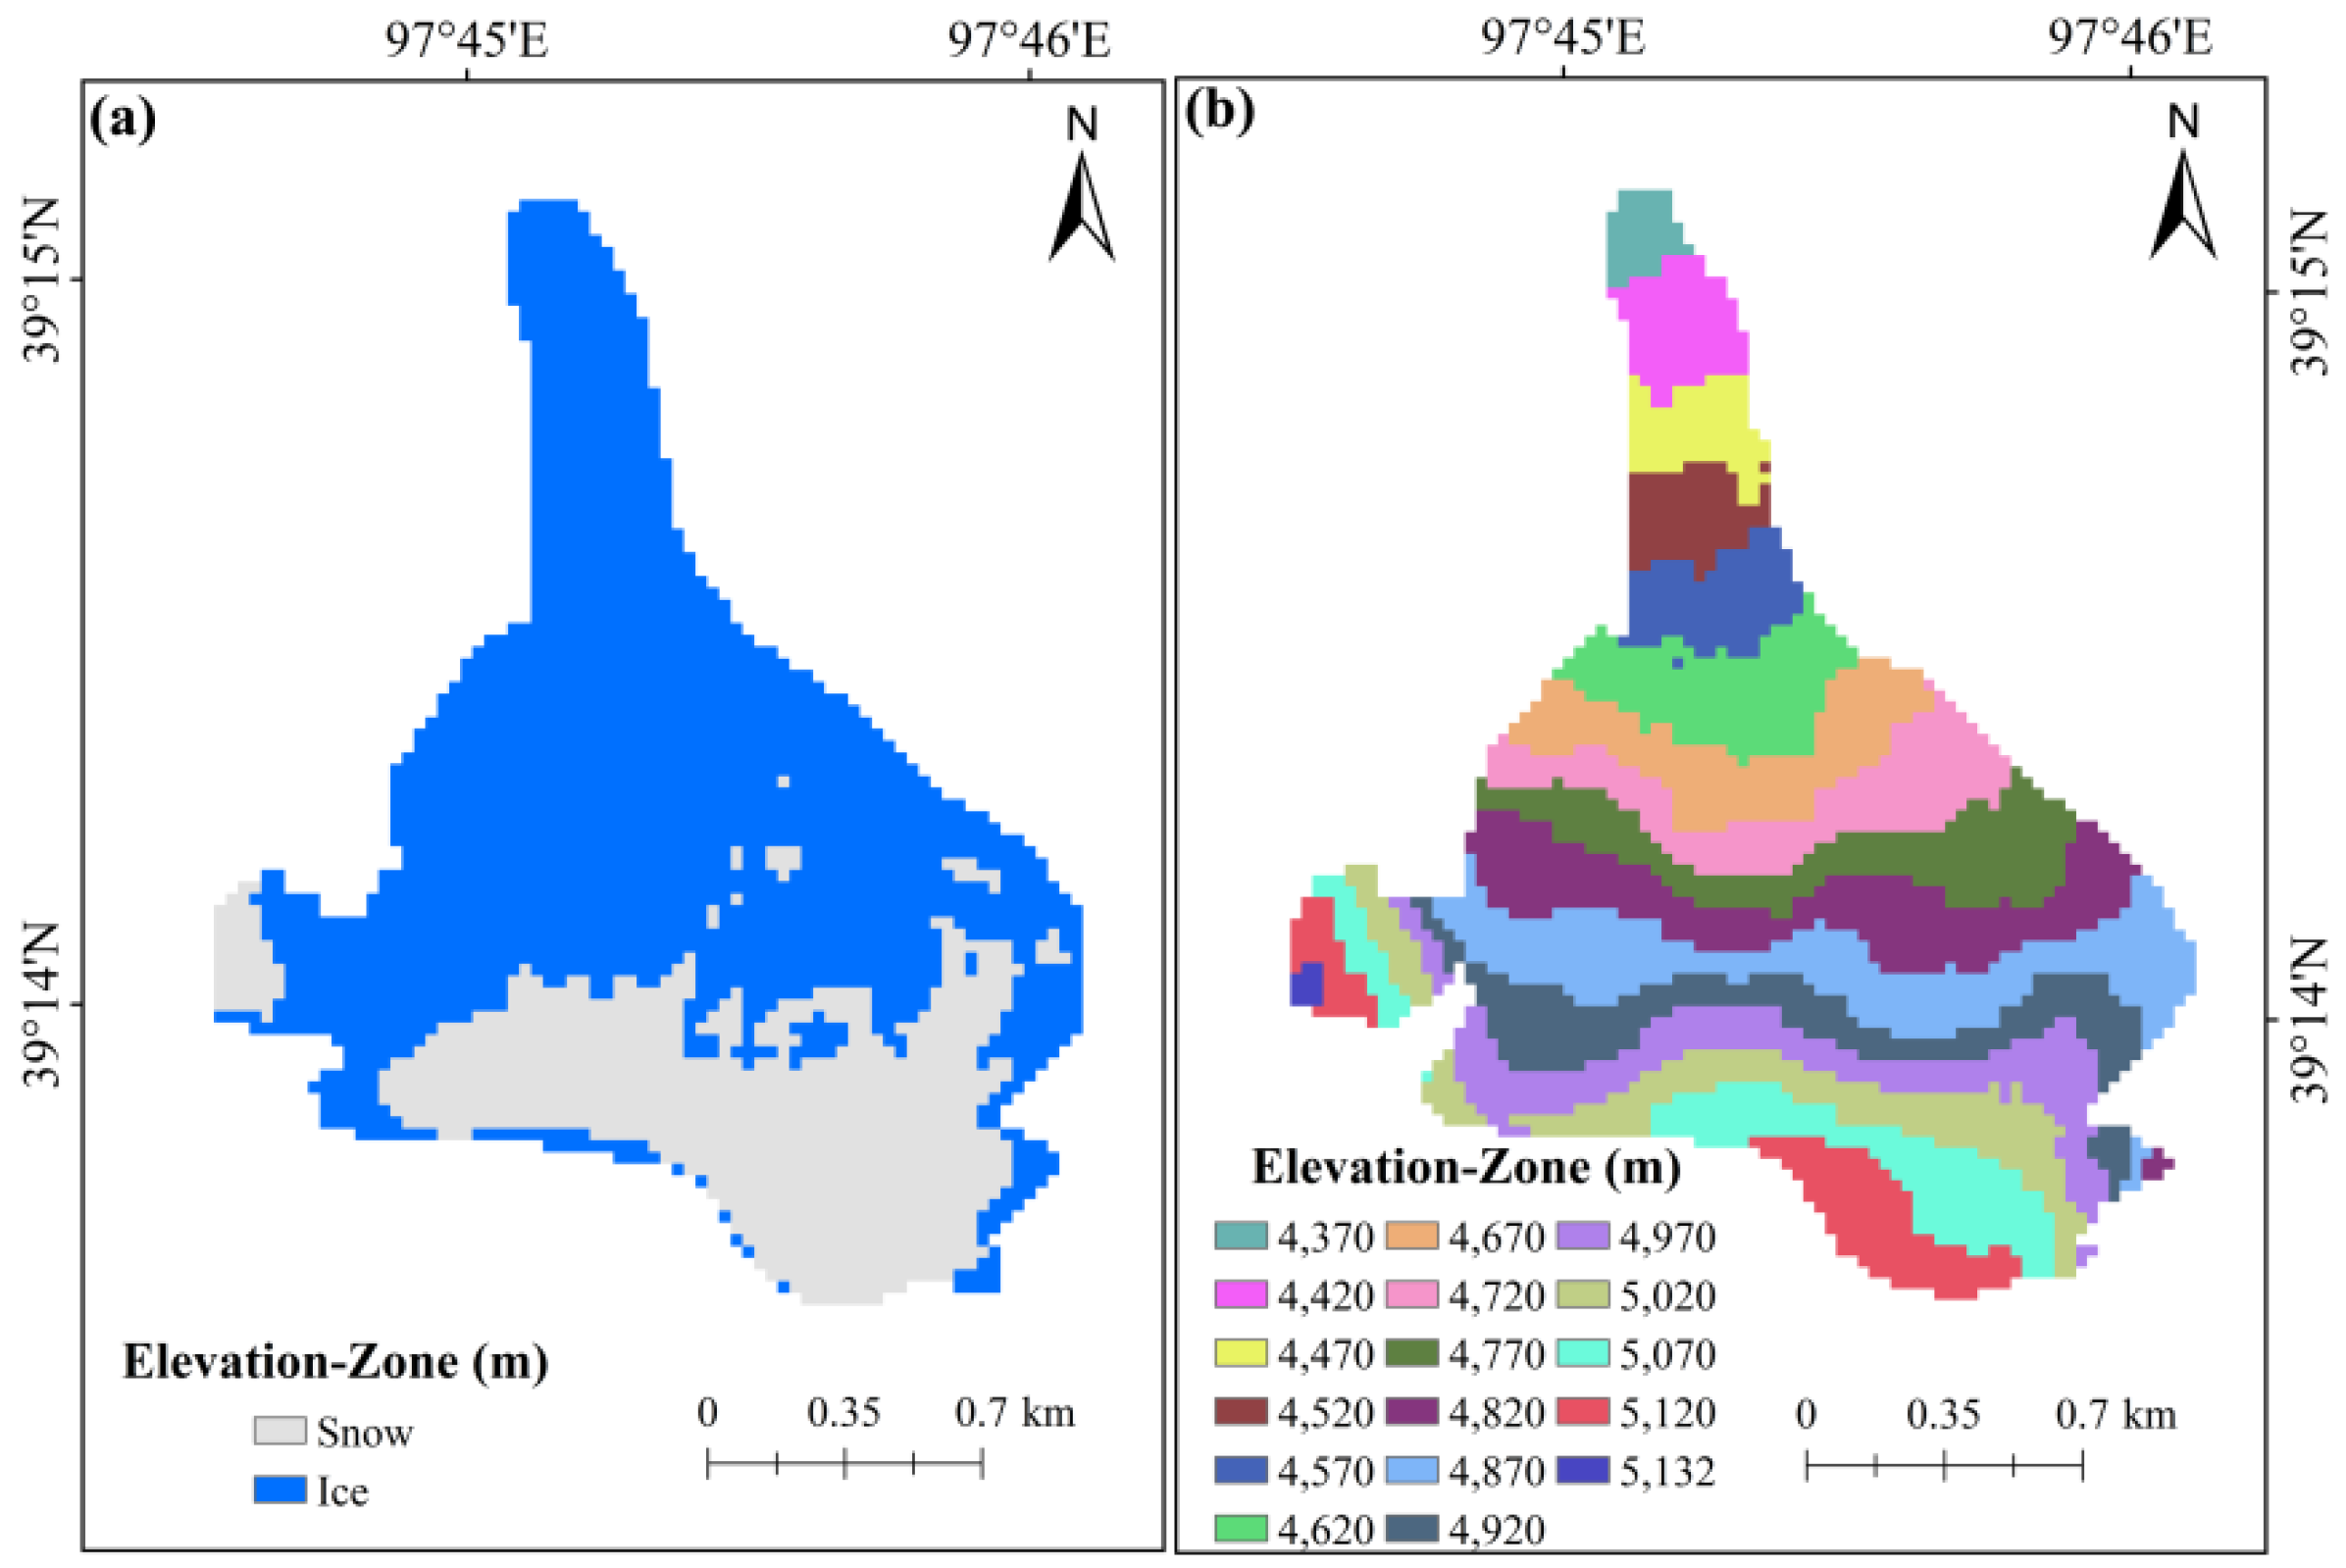
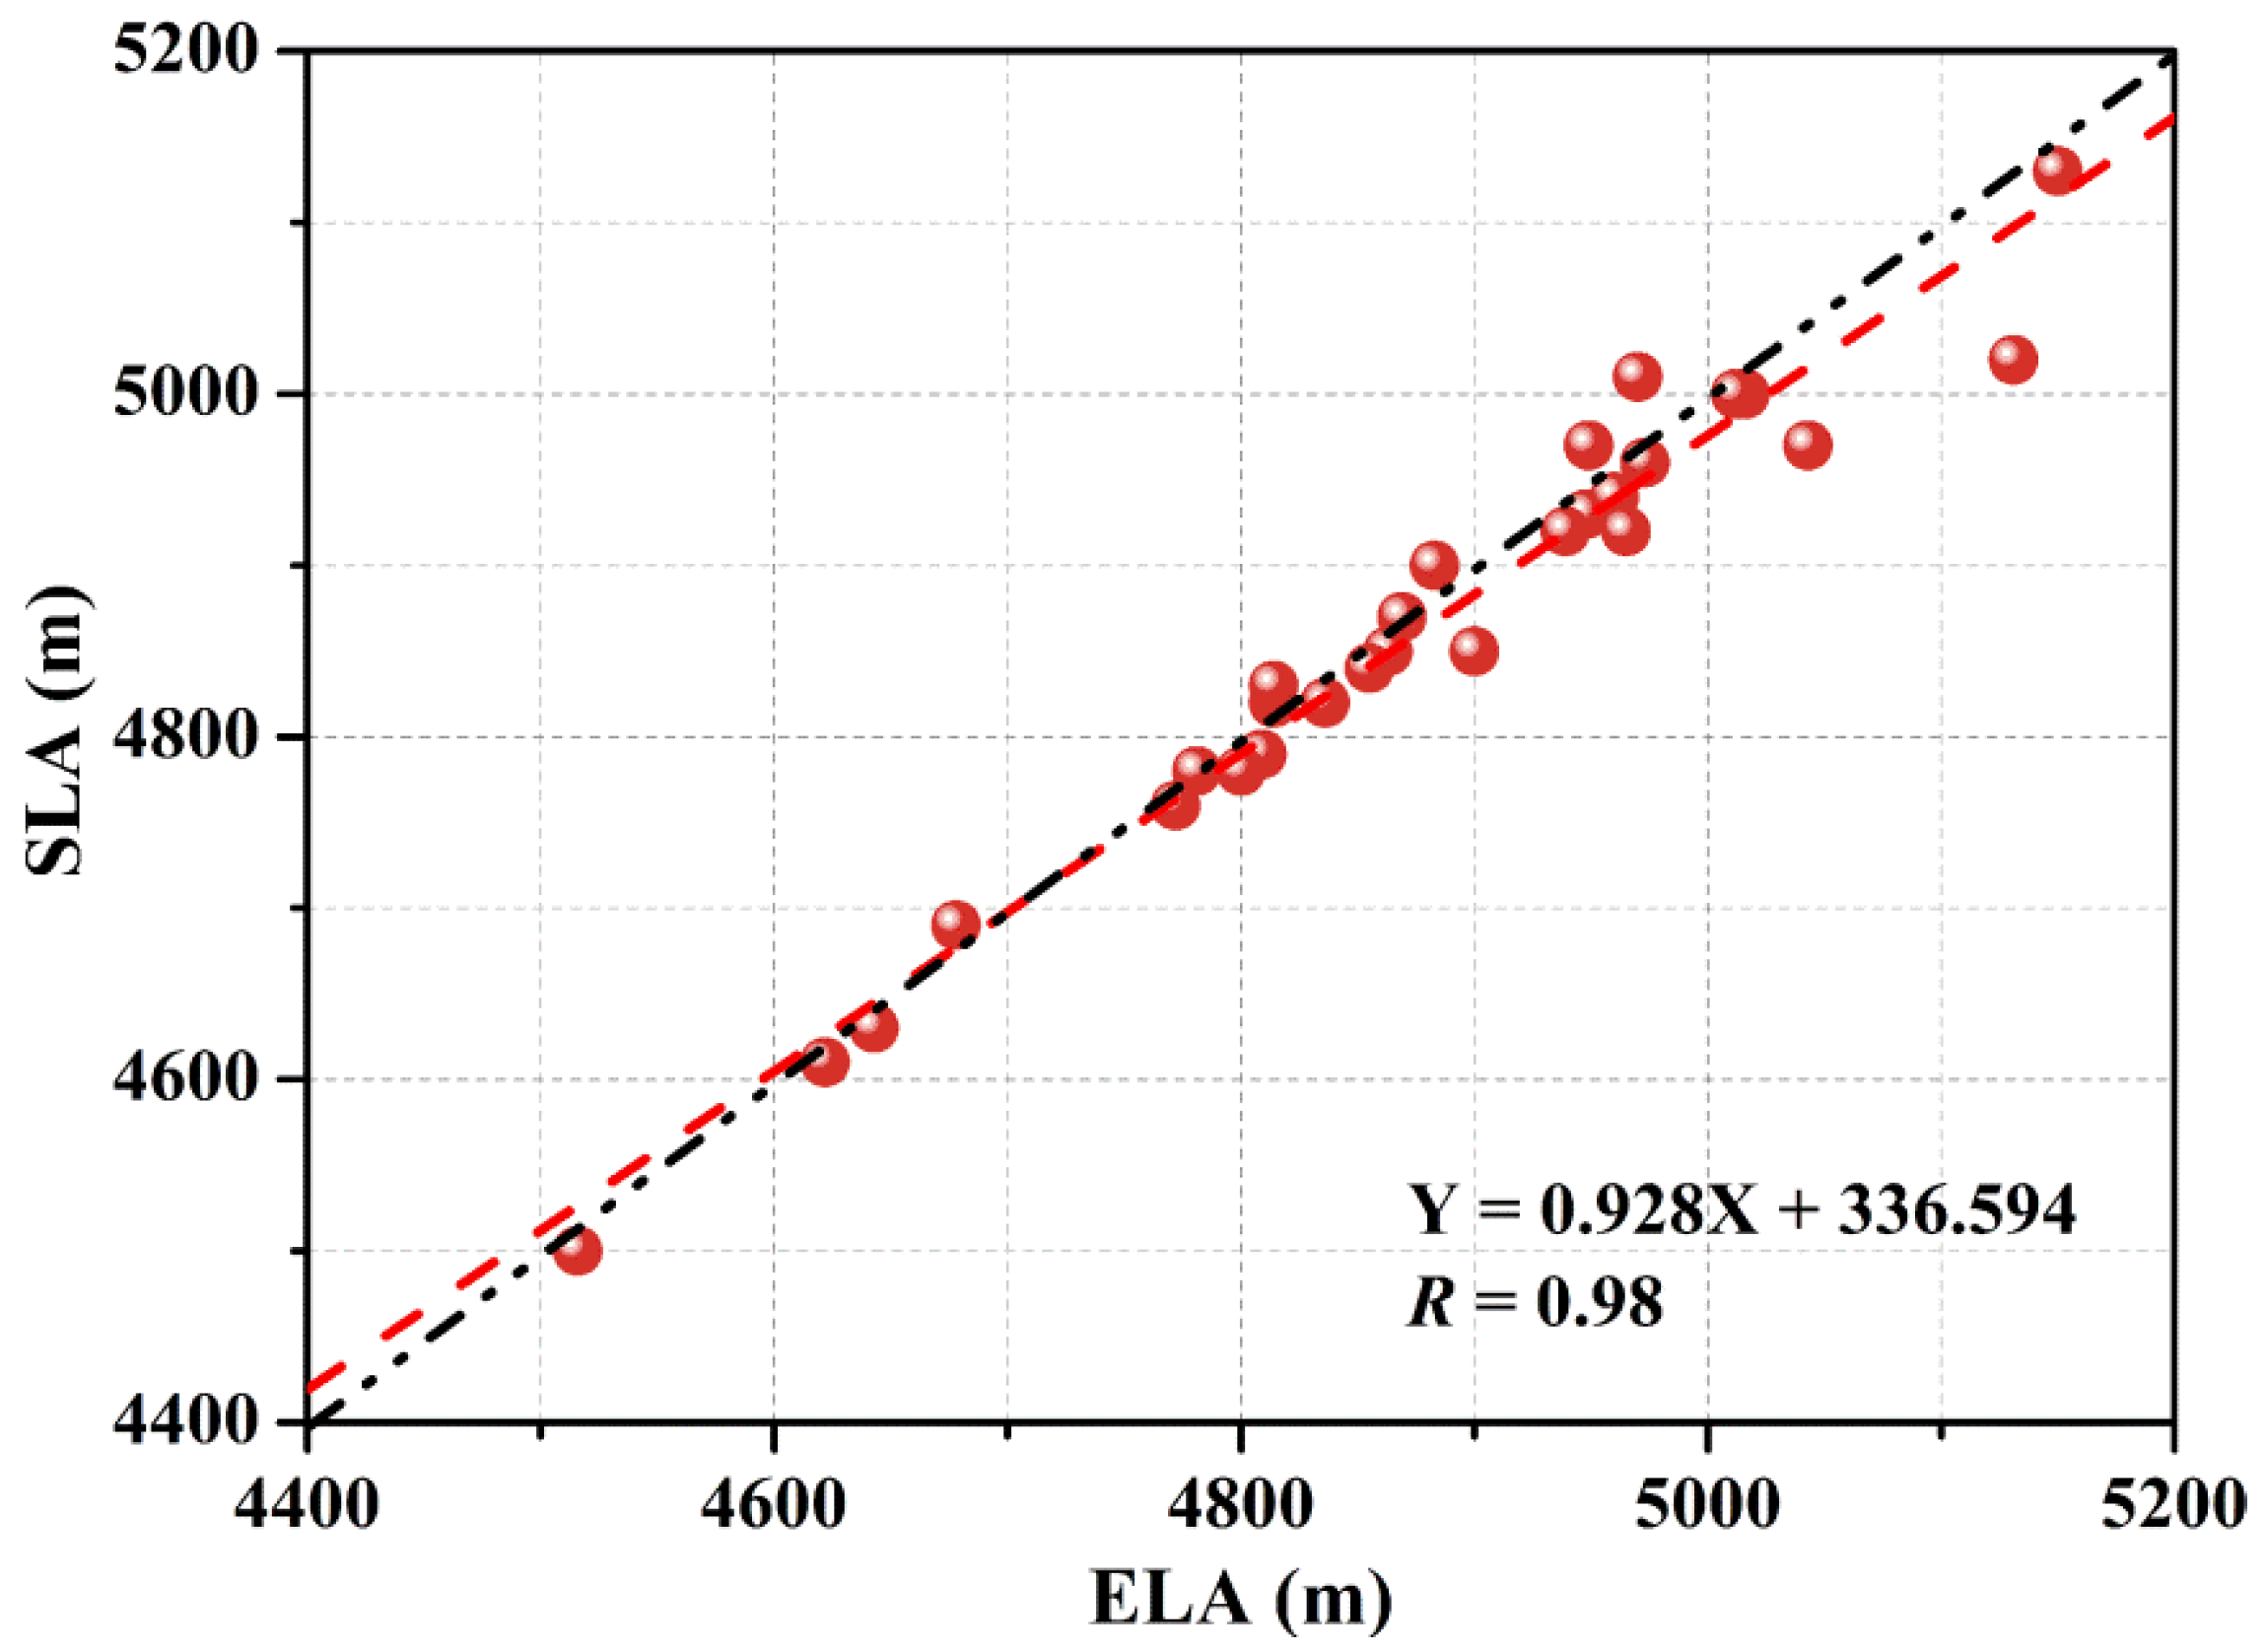
In addition, because it is the highest SLA at the end of the ablation season, it is approximately equal to ELA. Therefore, we used the measured ELA to verify and evaluate the remote-sensing-based Qiyi Glacier SLA (Figure 6). Both the SLA and ELA generally exhibited obvious upward trends during the 1989–2018 periods, which indicate that Qiyi Glacier was in a state of retreat during this 30–year time period. The average SLA along Qiyi Glacier was 4900 ± 103 m, and the maximum and minimum SLAs were 5030 ± 25 m (2018) and 4690 ± 25 m (1998), respectively. A linear fit to the data yielded a 148 m rise in the SLA during the 30–year study period, at an average rate of 49 m/10a. Both the SLA and ELA exhibited the same change (increasing/ decreasing) over time, with a relatively small difference between the two (<50 m) in most instances. The largest difference was observed in 2006, when the ELA was 111 m higher than the SLA, which would place the ELA near the top of the mountain; however, the downloaded image did not yield any corresponding information, which may be a result of the insufficient temporal resolution of the 2006 image. There is a strong linear relationship between ELA and SLA (r = 0.98), with most of the points falling near the 1:1 line. ELA is the altitude corresponding to the place where the glacier accumulation amount and the ablation amount are equal. The SLA at the end of the ablation season is the lower boundary of the perennial snowpack. Superimposed ice is ice formed by freezing a mixture of melt water and grain snow, forming a superimposed ice zone between the glacier ELA and SLA. The melting of snow causes the SLA to rise, making the SLA higher than the ELA. The observed differences may be due to the presence of superimposed ice. This relationship indicates that the SLA and SLA trend at the end of melt season can serve as a proxy for the ELA and ELA trend, as they both have the small difference and same trend, and can also be used to reconstruct past climate change processes. Therefore, the SLA and SLA trend at the end of melt season can be identified as a particularly important parameter for characterizing glaciers in inaccessible areas where meteorological data are scarce.

4.2. Temporal Variations in Glacier SLA in the Qilian Mountains

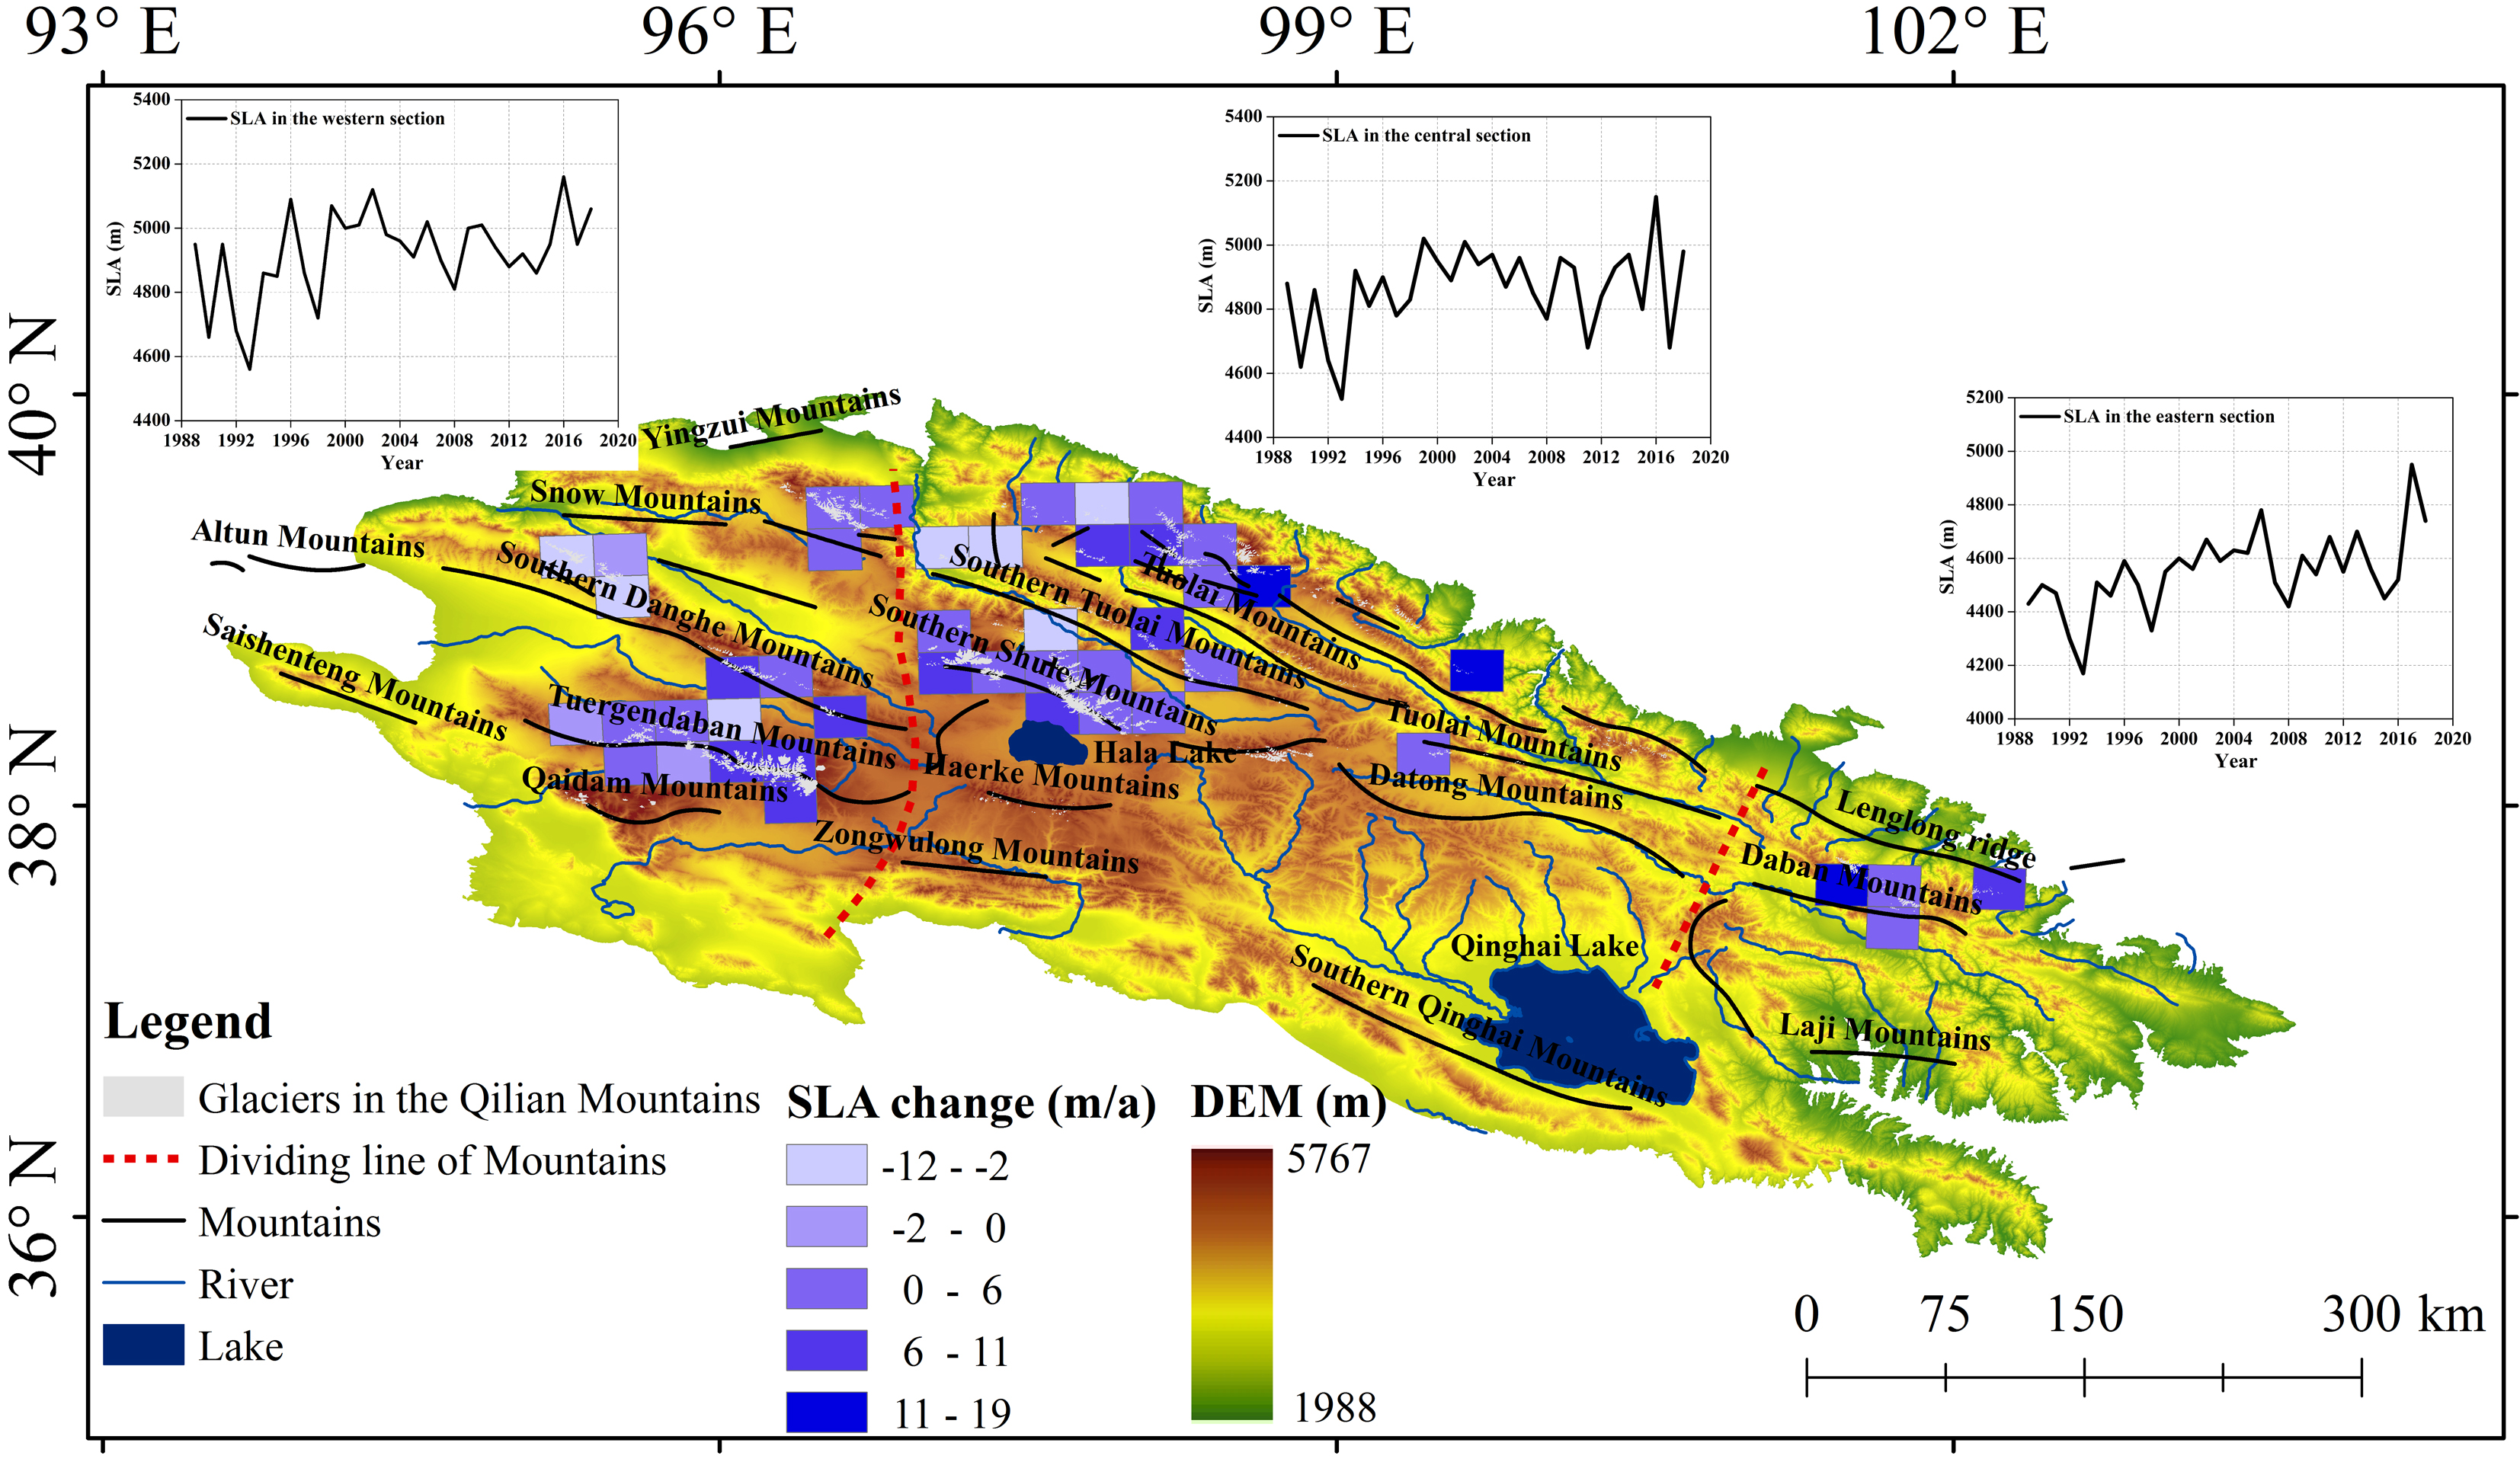
We studied the variations in mean SLA across the western, central, and eastern sections of the Qilian Mountains during the 1989–2018 period, with 14, 13, and 16 Landsat images screened and processed for the western (Path/Row: 136/33), central (Path/Row: 135/33), and eastern sections (Path/Row: 132/34), respectively.
We extracted the SLA of 520 glaciers in the western section of the Qilian Mountains (
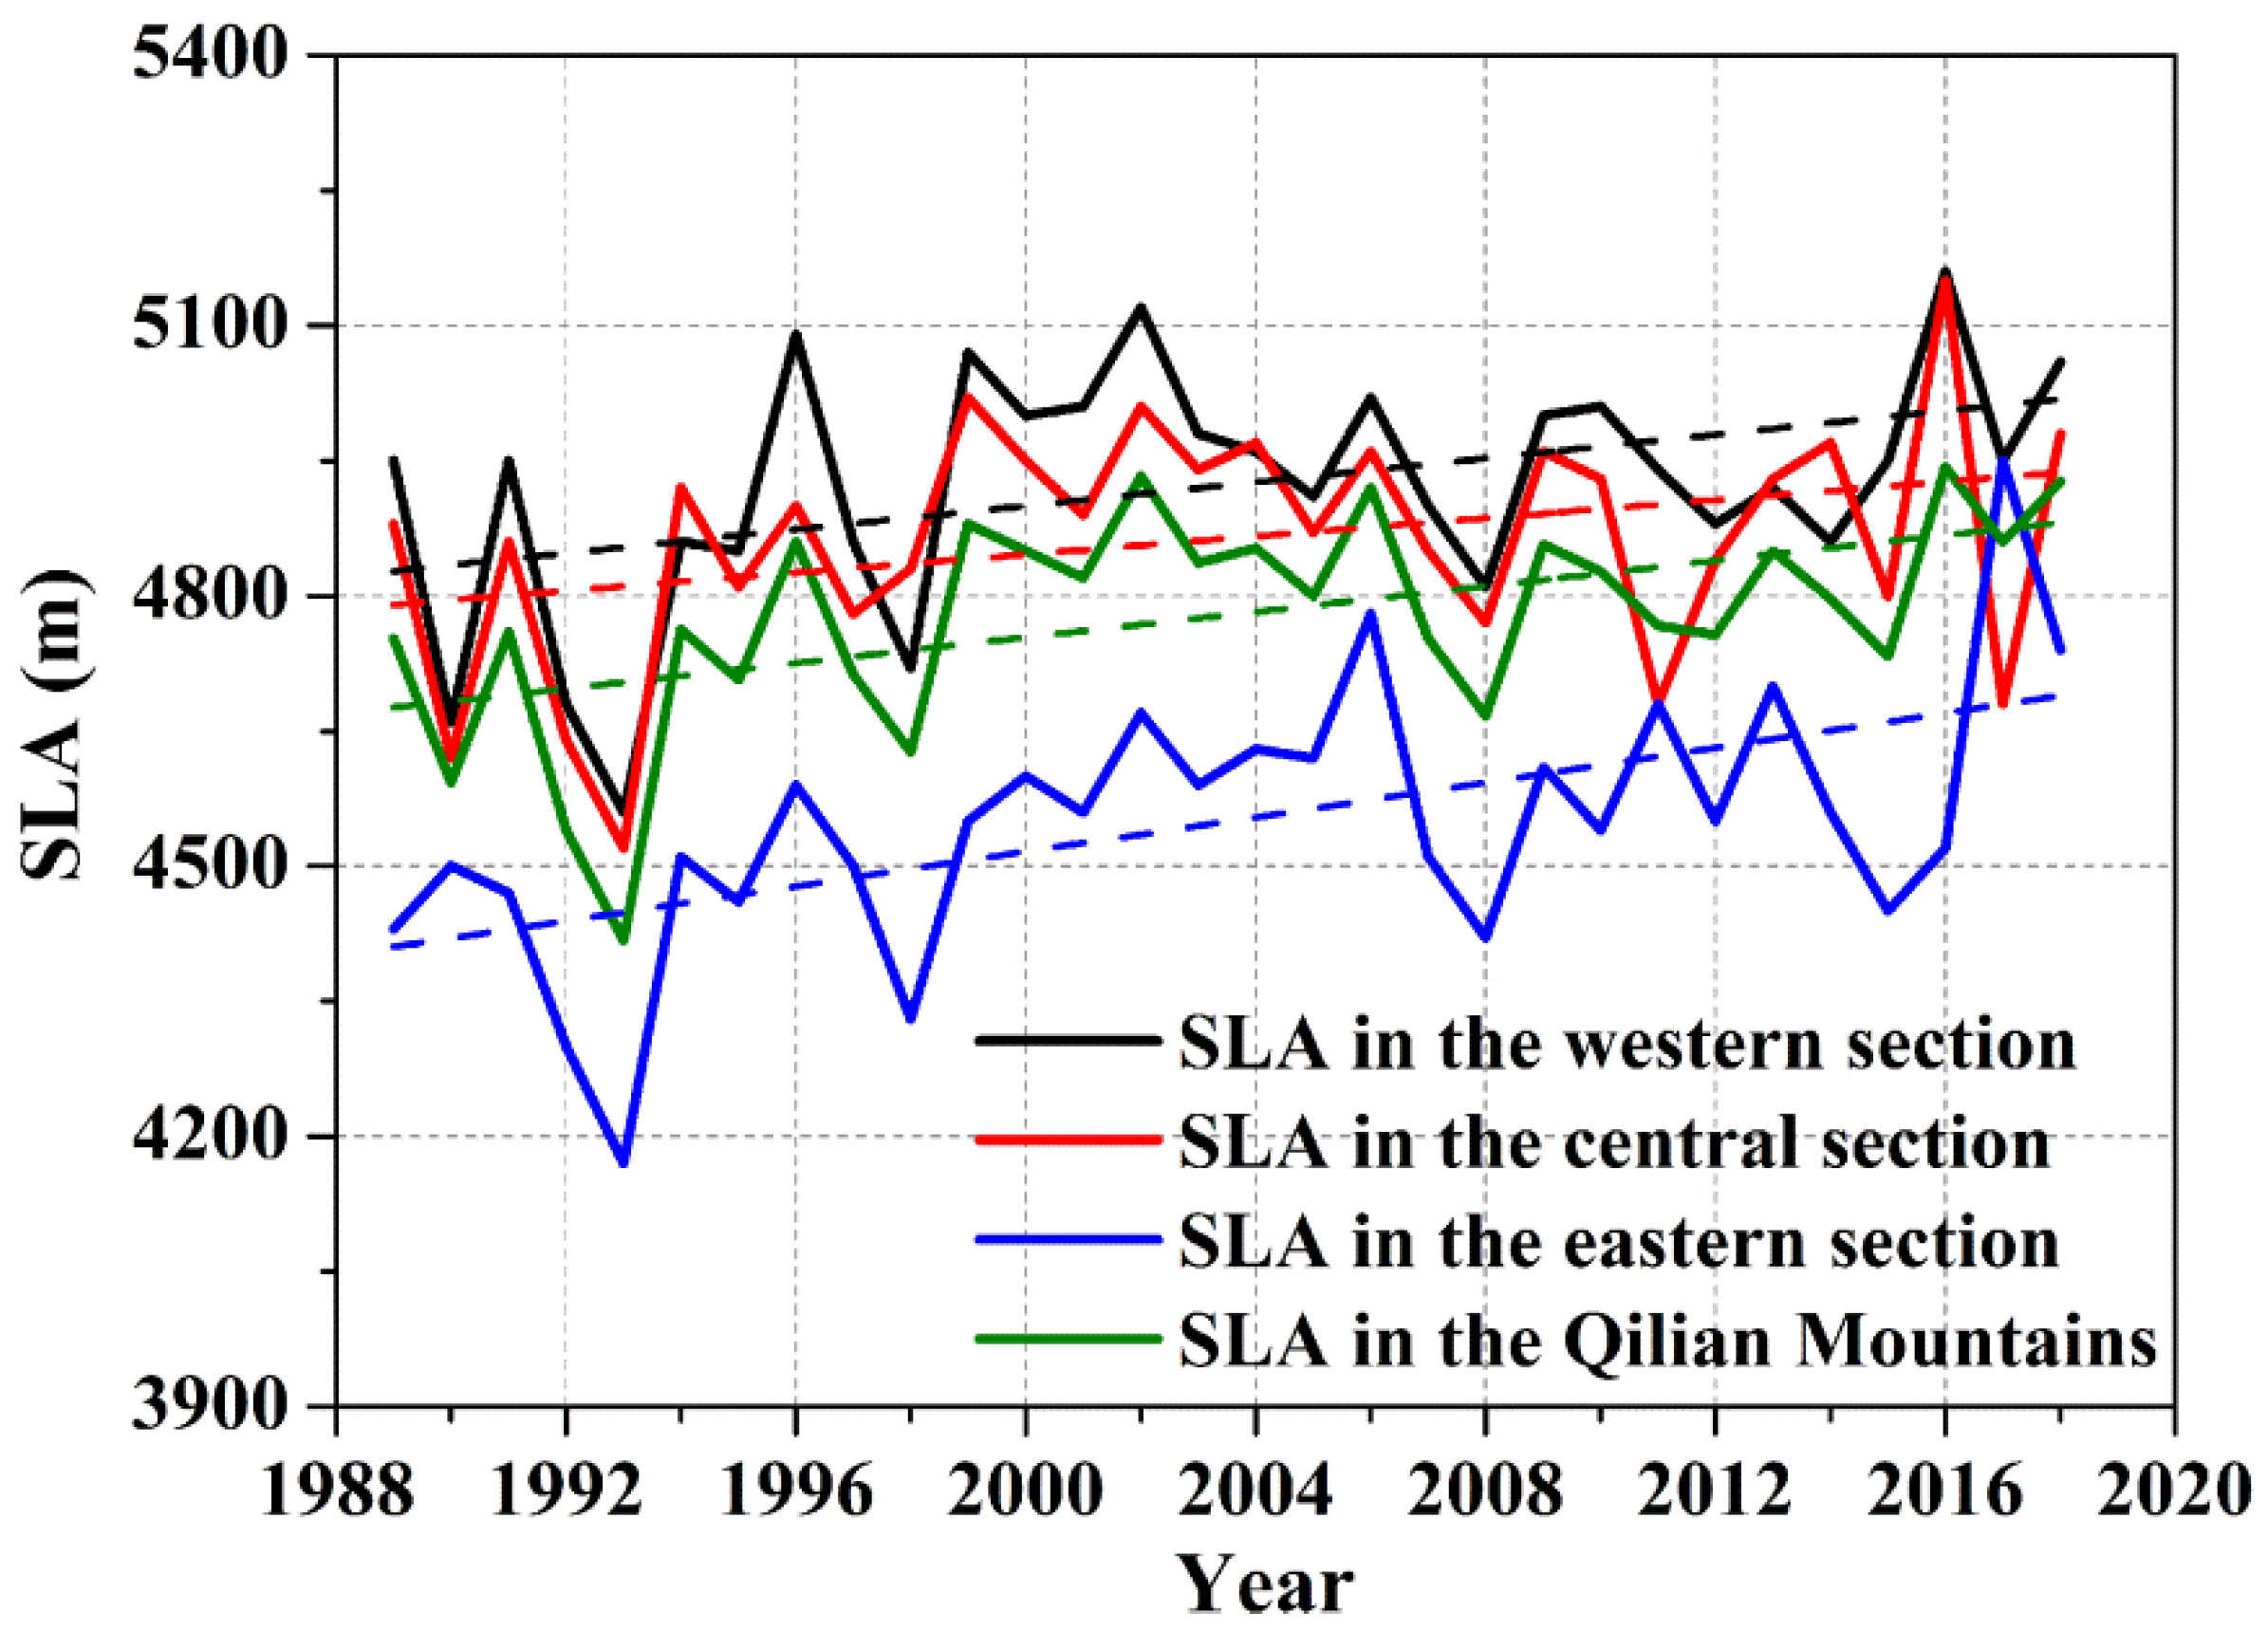
Figure 7). A rising trend of ~197 m was observed during the 1989–2018 period. The mean SLA was 4923 ± 137 m, and the highest and lowest SLAs were 5160 ± 25 m (2016) and 4560 ± 25 m (1993), respectively.
The mean SLA of 309 glaciers in the central section of the Qilian Mountains was extracted (Figure 7), with a ~151 m rise observed during the 1989–2018 period. The mean SLA was 4864 ± 135 m, and the maximum and minimum SLAs were 5150 ± 25 m (2016) and 4520 ± 25 m (1993), respectively.
The mean SLA of 94 glaciers in the eastern section of the Qilian Mountains was extracted (Figure 7), with a 289 m rise observed during the 1989–2018 period. The mean SLA was 4550 ± 149 m, and the highest and lowest SLAs were 4950 ± 25 m (2017) and 4170 ± 25 m (1991), respectively.
The changes in glacier SLA in the western, central, and eastern sections of the Qilian Mountains during the 1988–2018 period indicate a successive west-to-east decline in glacier SLA in the Qilian Mountains (Figure 7), which may be due to the higher-elevation mountains in the western section and the west-to-east increase in precipitation. In general, the SLA of the eastern section is the lowest, while that of the western section is the highest. Therefore, the reasons for this distribution trend are analyzed, mainly because of topography and precipitation. The overall trend of precipitation is decreasing from east to west. In terms of linear trend, the SLA in the eastern section has increased more than that in the western section and the middle section in the past 30 years. It may be because the temperature rise in the eastern section is higher than that in the western and middle section, or the precipitation in recent 30 years is less than that in the western and eastern section, or the combined effect of the two. There is also an upward trend in glacier SLA in the western, central, and eastern sections of the Qilian Mountains, which reinforces the interpretation that the glaciers in the Qilian Mountains have been in a state of retreat since the 20th century.
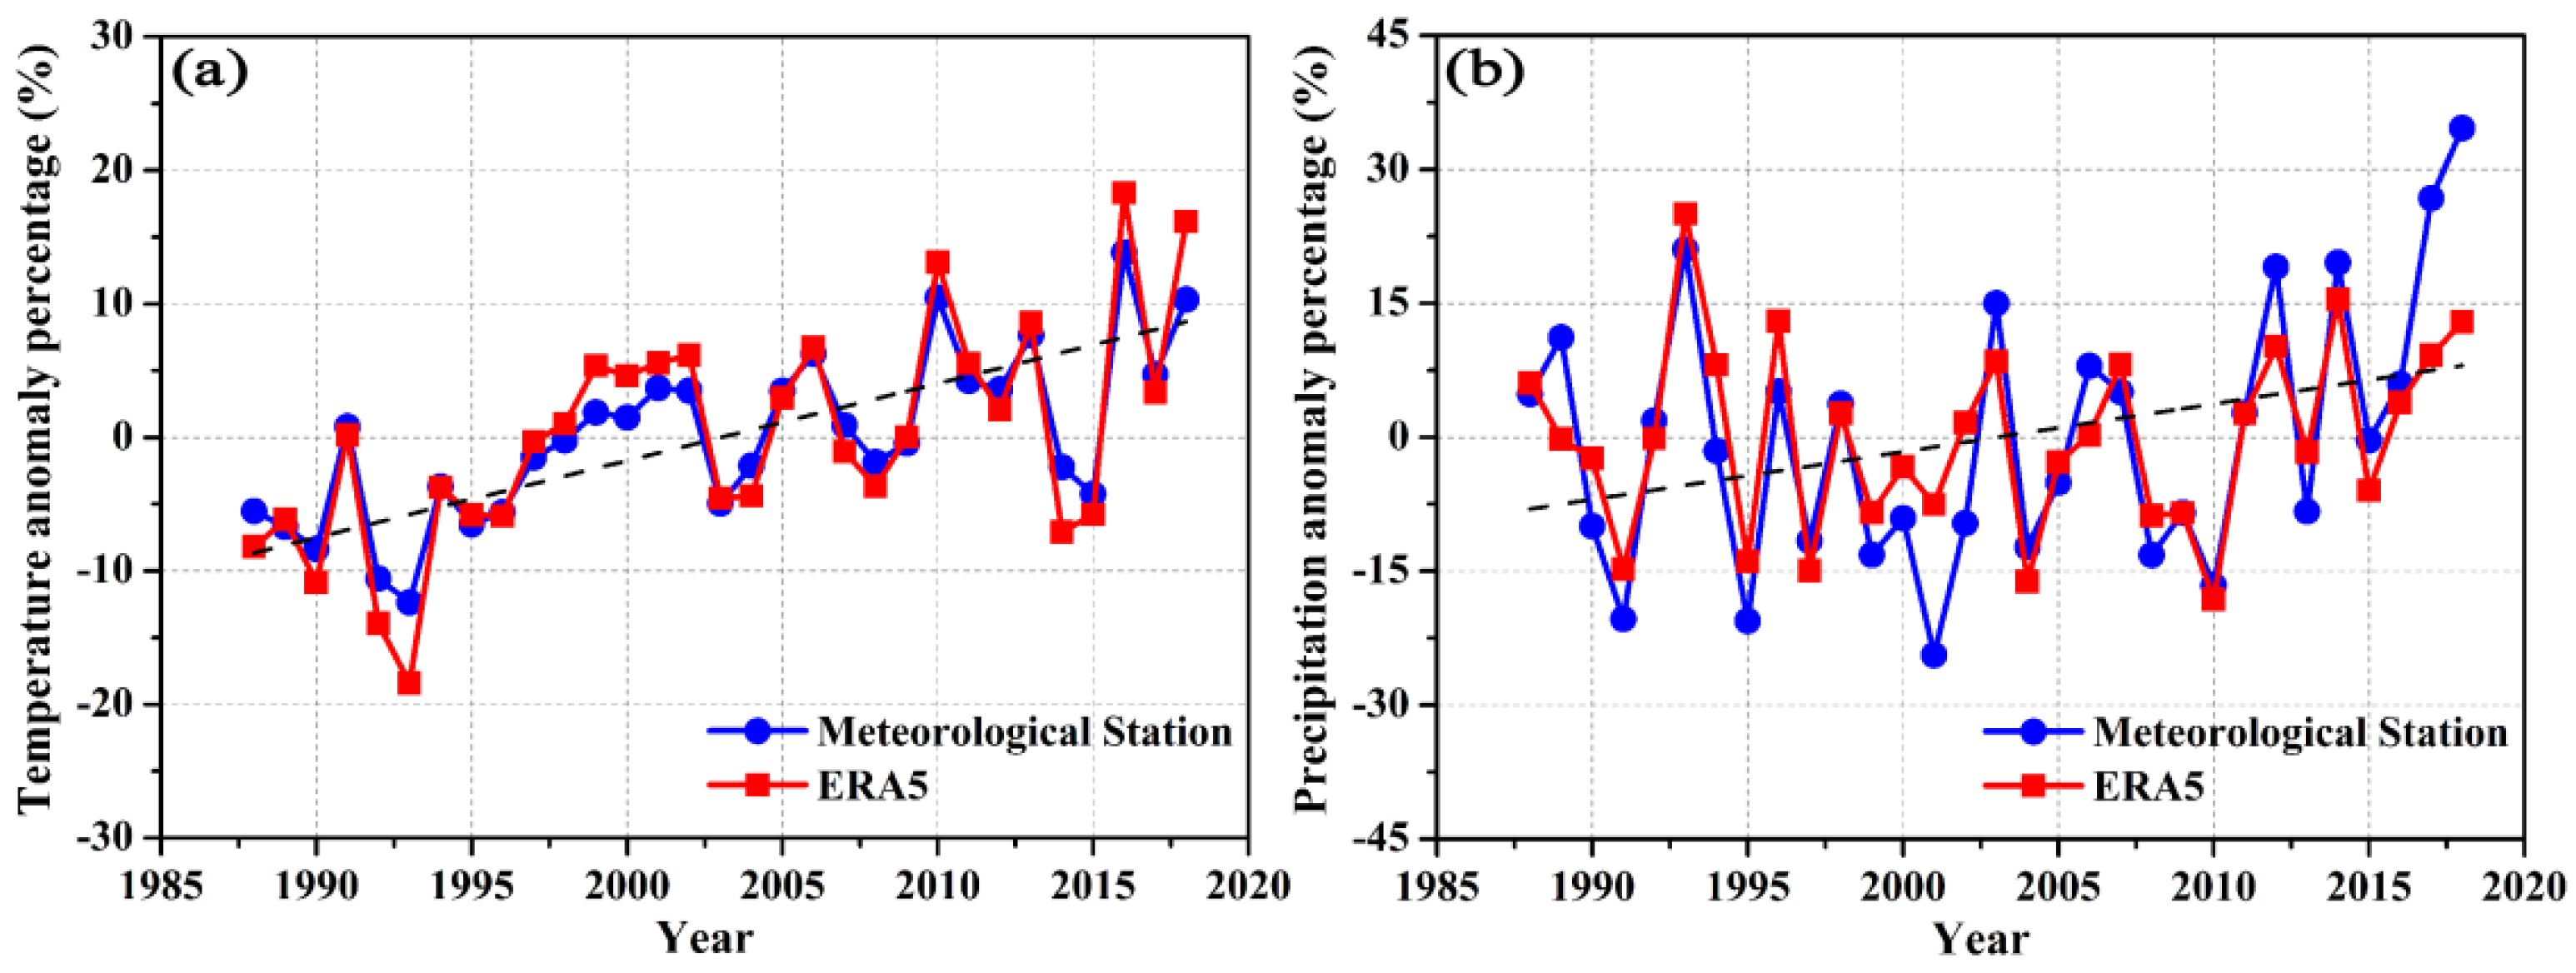
The Mean SLA in the whole Qilian Mountains also showed an upward trend, rising by 213 m from 1989 to 2018. The mean SLA was 4779 ± 149 m, the lowest mean SLA recorded was 4417 ± 25 m in 1993, whereas the highest was 4943 ± 25 m in 2016. To discuss the causes of SLA changes in the Qilian Mountains during 1989–2018, we collected and analyzed the data of summer mean temperature and annual total precipitation in the Qilian Mountains. The meteorological and ERA reanalysis data both exhibit trends of increasing summer mean air temperature and total summer precipitation amount during the 1989–2018 period (Figure 8). There was an obvious increase in temperature and a weaker increase in precipitation during this period. Furthermore, the SLA rose, and the glacier area decreased. The temperature in 1993 was the lowest, and the temperature in 1992 was also low. Besides, there was more precipitation in 1993, which led to the lowest SLA in 1993. The highest SLA occurred in 2016 and is associated with the highest summer mean air temperature and a comparably small total summer precipitation amount. In general, rising summer mean air temperatures and/or decreasing total summer precipitation amount cause SLA to climb. Therefore, it can be concluded that temperature is the main factor affecting glacier changes in the Qilian Mountains, with precipitation also playing a role in the glacier SLA changes.

4.3. Spatial Variations in Glacier SLA in the Qilian Mountains

SLA is the main parameter reflecting the hydrothermal conditions of glacier development, which is closely related to temperature and precipitation. At the same time, SLA is also affected by the orientation of glacier.
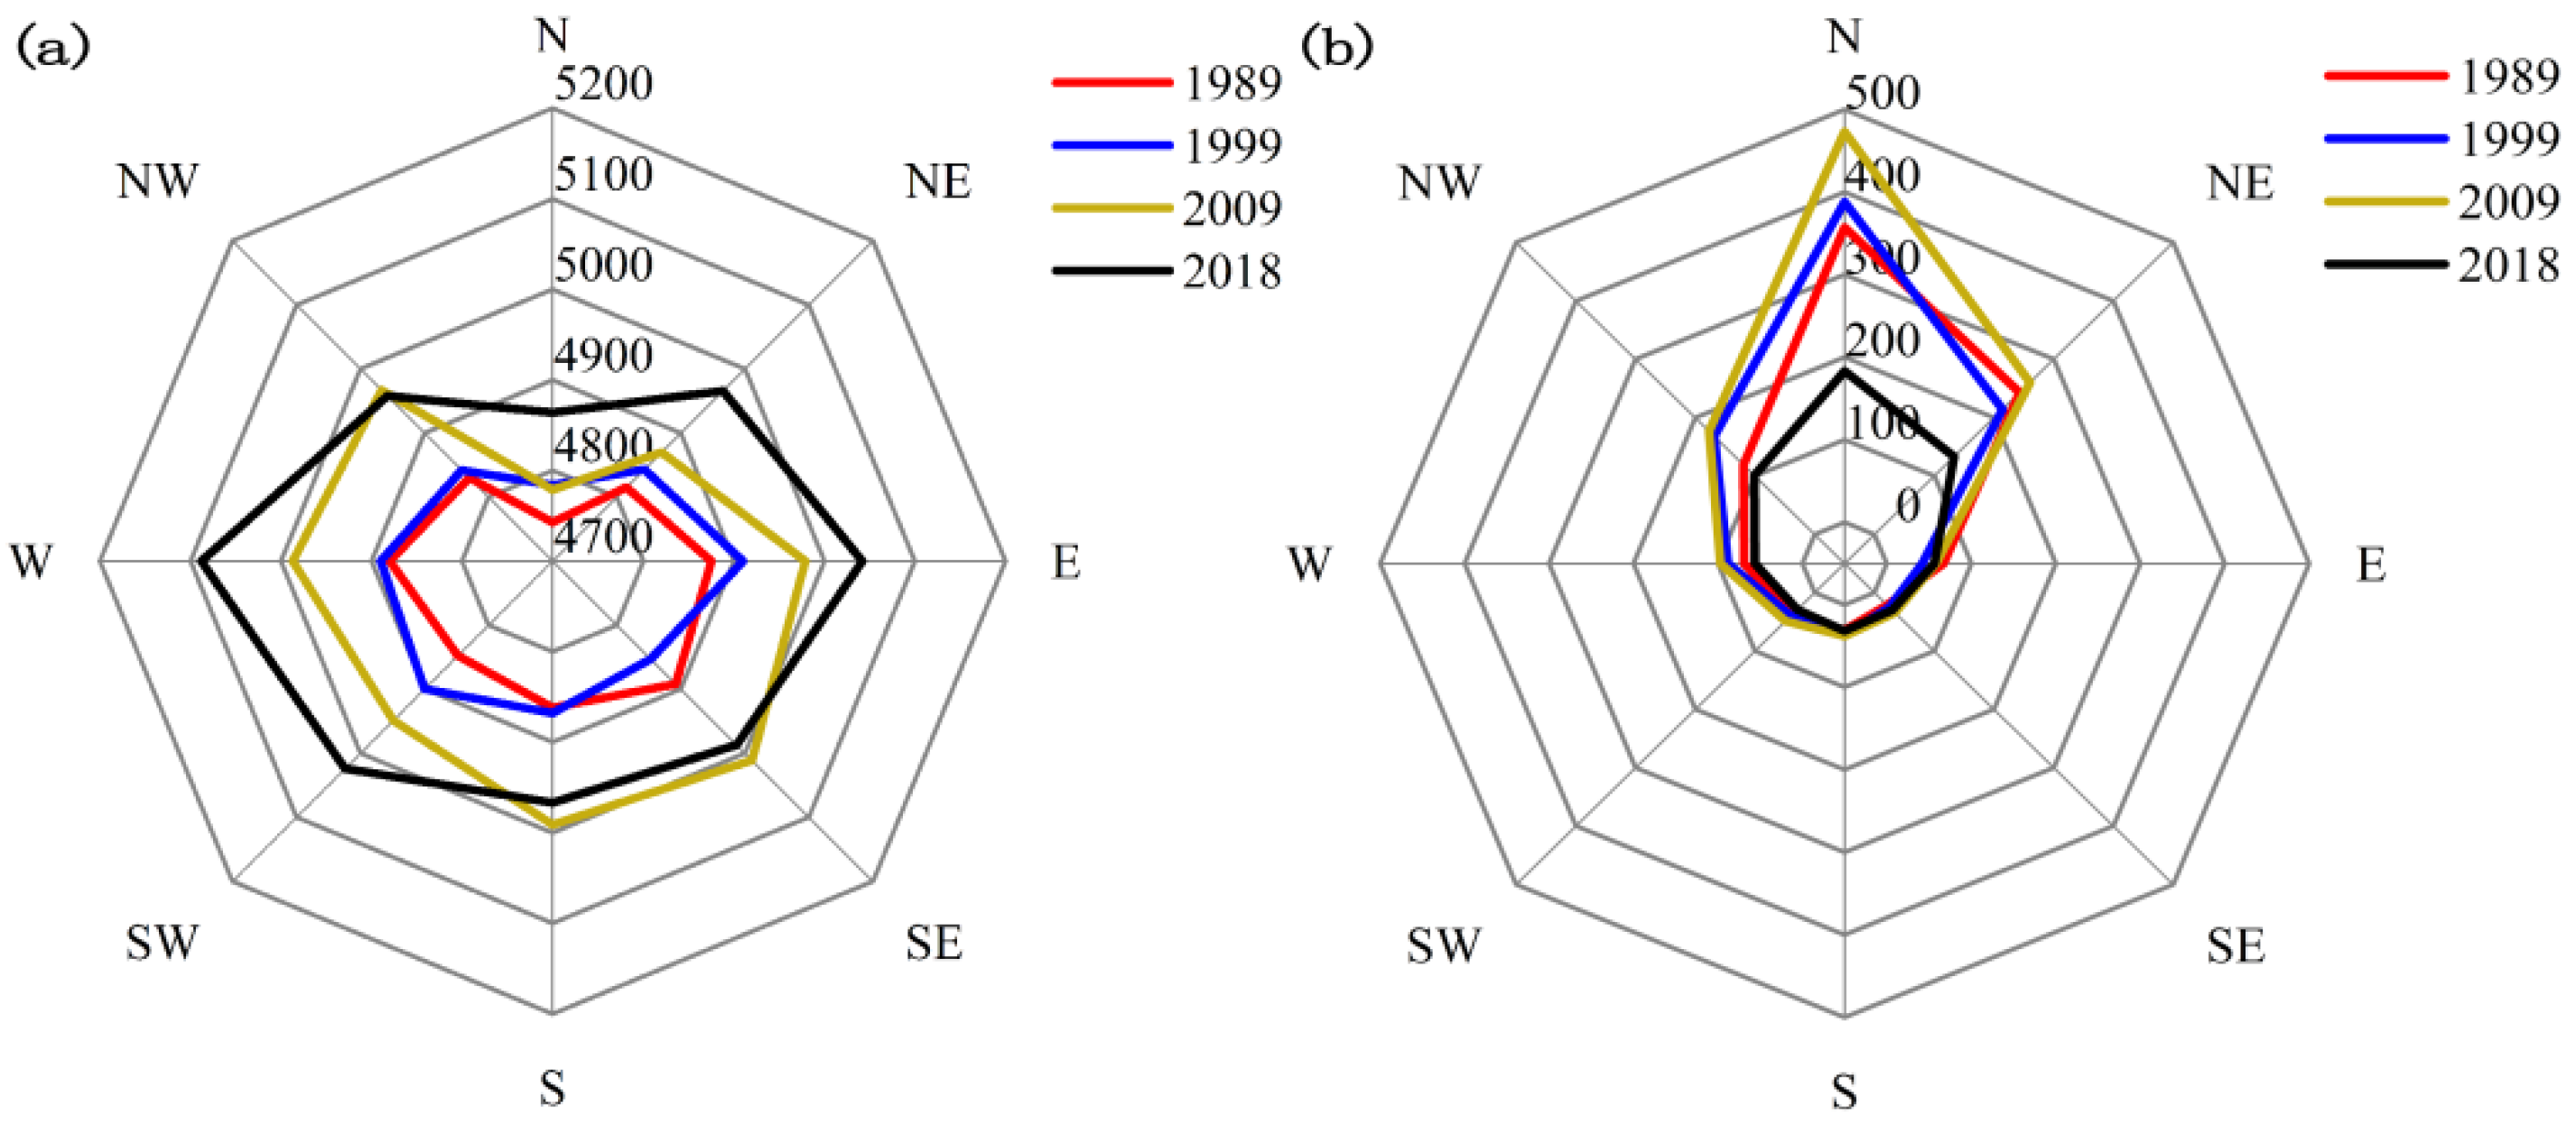
Glacier orientation includes ablation zone orientation and accumulation zone orientation. Since glaciers SLA is the lower limit of accumulation zone and is related to accumulation zone orientation, we select accumulation zone orientation to represent the orientation of glaciers. Most of the glaciers in the Qilian Mountains are situated on the north slope, and the glaciers face north. The orientation distribution and SLA for each orientation of the accumulation zone of the Qilian Mountains in 1989, 1999, 2009 and 2018 are shown in Figure 9. In general, except for individual orientation, the SLA of glaciers in all orientations increased gradually from 1989 to 2018. In any given year, the number of glaciers facing north is the most, followed by the glaciers facing northeast and northwest, while the number of glaciers facing south, southeast and southwest is less, especially the average number of glaciers facing the southeast at only 28. In 1989, 1999, 2009, and 2018, the northern-facing glaciers had the lowest SLA. The western-facing glacier SLA in 1989 was the highest (4920 m). The orientation of the highest SLAs was not consistent, with the highest SLAs of the glacier facing west in 1989 and 2018. In 1999 and 2009, the highest SLA was facing east and southeast, respectively. From 1989 to 2018, the SLA of the westward-facing glacier is 4971 m, which is the highest among the eight orientations, while the SLA of the northward-facing glacier is the lowest, which is 4793 m.
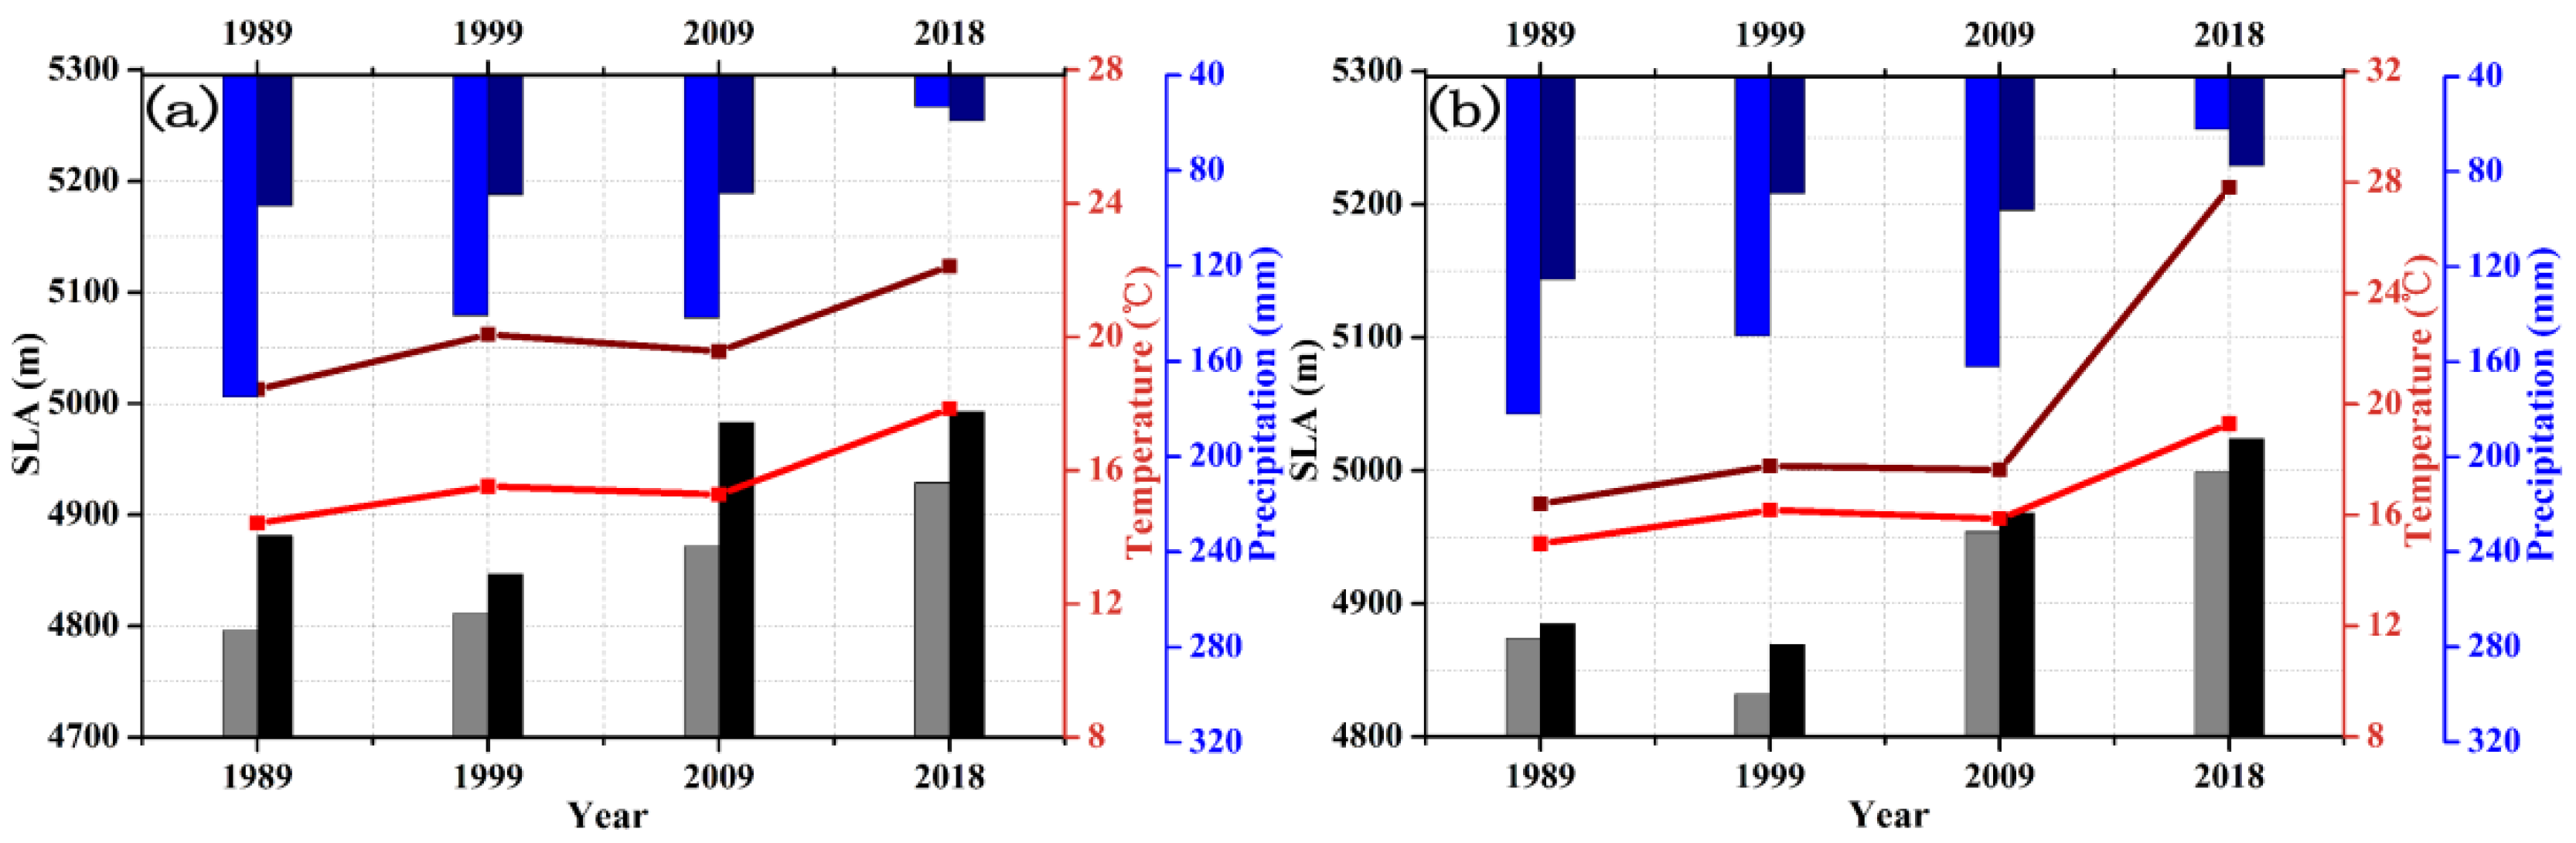
We also analyzed the relationship between glacier SLAs on the north slope (N, NE and NW), south slope (S, SE and SW), west slope (W, NW and SW) and east slope (E, NE and SE) and the temperature and precipitation of meteorological stations in these orientations in 1989, 1999, 2009 and 2018 (Figure 10). The SLA of glaciers distributed in these four orientations showed an upward trend from 1989 to 2018, and the temperature also showed an upward trend, and the precipitation showed a decreasing trend. The SLA of glaciers on the south, north, west and east slopes reached the highest in 2018, which were 4993 m, 4930 m, 5024 m and 4999 m, respectively. This is mainly because the summer mean temperature reached the highest value in 2018 and the annual total precipitation was the least (See Figure 8). The years of the lowest SLA in the four directions are not consistent, possibly because of the large year interval. In addition to the temperature and precipitation of the current year, the temperature and precipitation of the adjacent years also have an impact on SLA.
In 1989, 1999, 2009 and 2018, there were 704 glaciers on the north slope on average, accounting for 74.3% of the total number of glacier SLAs, and the average SLA was 4852 m. There were 100 glaciers on the south slope, accounting for 11.1% of the statistical glaciers, and the average SLA was 4926 m. This is because there are a large number of glaciers on the north slope, but they are mainly distributed in small glaciers and hanging glaciers, while the individual size of glaciers on the south slope is large, which increases the average size of glaciers on the south slope. From the northeast to the southwest of the Qilian Mountains, the glacier distribution height increases gradually, that is, it is higher in the south and lower in the north. In addition, we combined the meteorological station data of the south slope and the north slope and found that the temperature of the south slope was higher than that of the north slope and the precipitation was less than that of the north slope, concomitant with the glacier SLA of the south slope being higher than that of the north slope. The number of glaciers selected on the west and east slopes is 257 and 296, accounting for 27.6% and 32% of the statistical number, with an average SLA of 4936 m and 4915 m, respectively. The reason is that due to the influence of geological structure, the mountainous region of Qilian Mountains is high in the west and low in the east. By analyzing the temperature and precipitation data, the temperature of the west slope is higher than that of the east slope, the precipitation amount is smaller than at the east slope, and the SLA of the east slope is lower than that of the west slope.
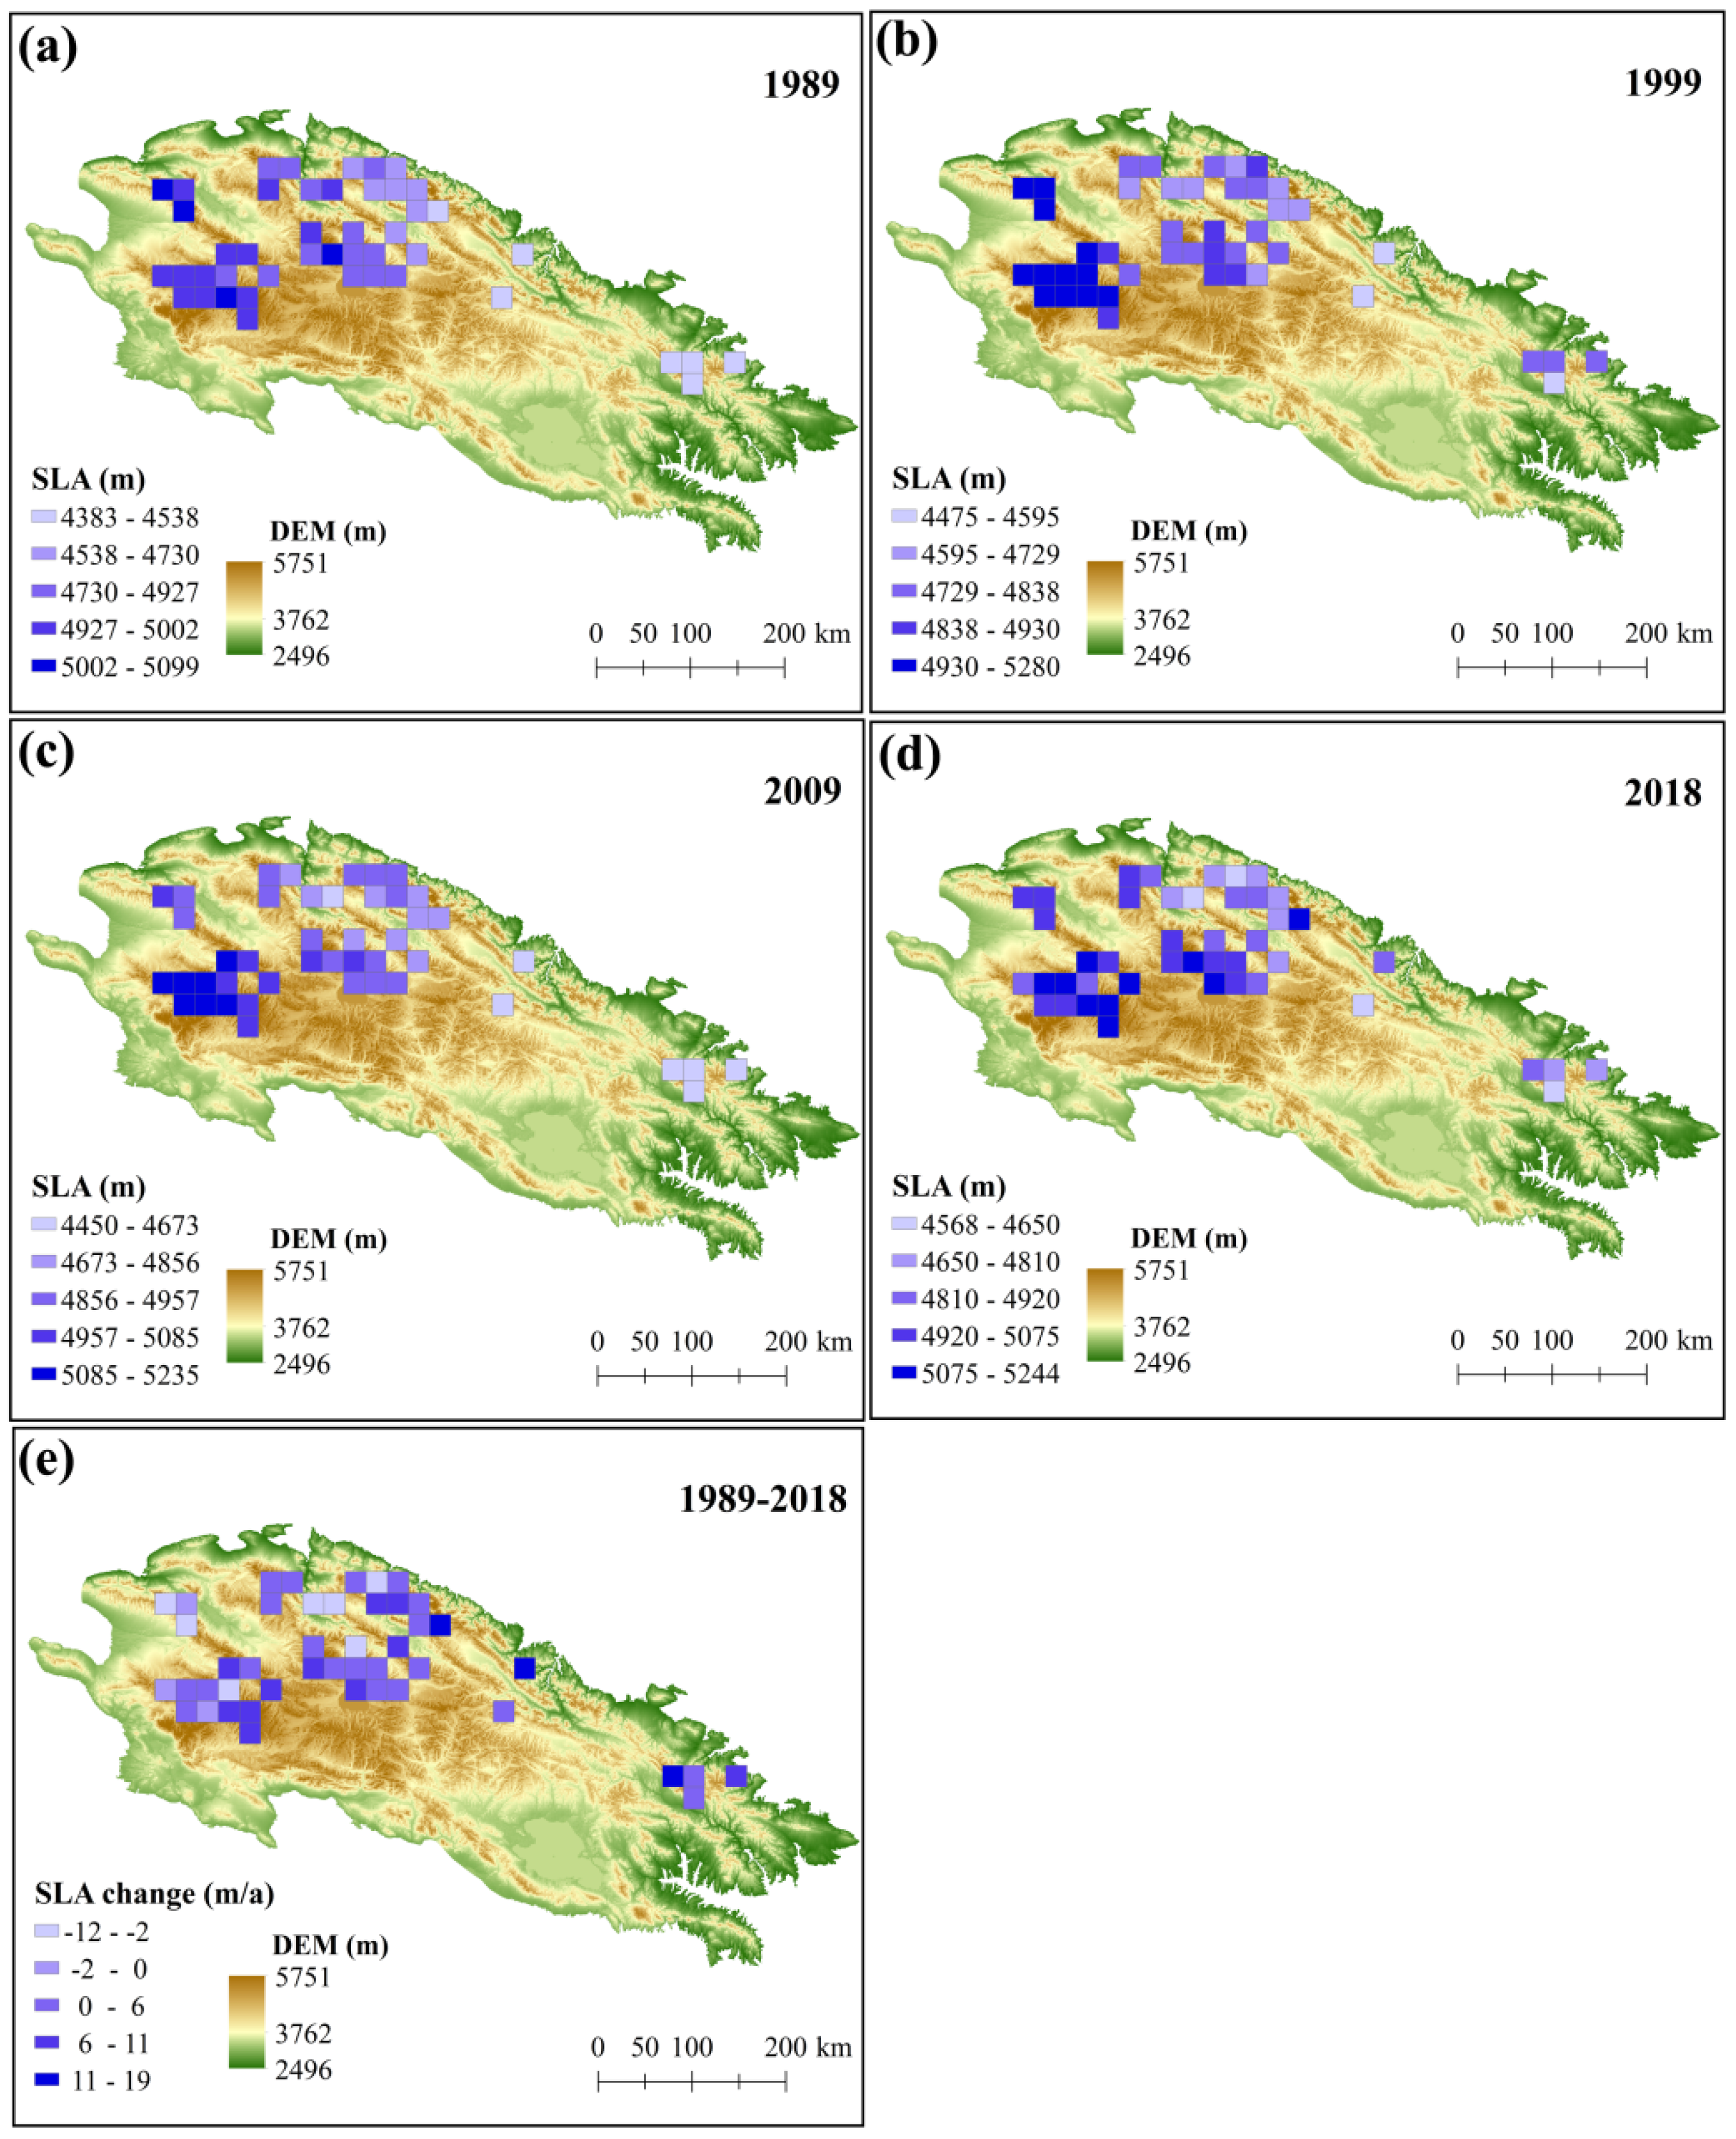
Spatial interpolation and grid method can be used to study the spatial change of SLA. In spatial interpolation, in addition to the glaciers in the study area, other mountain glaciers outside the study area must be considered, so that the interpolation results are more accurate. This study only extracts the glacier SLA within the study area. Therefore, this study uses the grid method to study its spatial changes. Arcgis software was used to construct the grid (23 km × 23 km) in the study area, and the average value of all glacier SLAs in each grid was calculated as the SLA of the grid. Therefore, we constructed a fishing net in the study area and obtained the mean glaciers SLA within the grid to reflect the spatial changes of the Qilian Mountain glaciers in 1989, 1999, 2009 and 2018 (Figure 11a–d). In 1989, 69% of the grids with an average SLA range of 4700–5100 m were glaciers (Table 6). Of these, 53% of the grid has an average glacial SLA between 4900 and 5100 m. No grid has an average SLA greater than 5100 m. In 1999, 78% of grids had a glacier SLA exceeding 4700 m, of which 44% had a glacier SLA between 4700 and 4900 m, and 7% had a glacier SLA exceeding 5100 m. In 2009, 84% of the grid glaciers had an average SLA of more than 4700 m, of which 69% had an average SLA of 4700–5100 m and 16% had an average SLA of more than 5100 m. In 2018, the average SLA of 91% grid glaciers exceeded 4700 m. Among them, 33% of the grid has an average SLA of 4900–5100 m and 22% of the grid has an average SLA of more than 5100 m. The glacier SLA of Tuergendaban Mountains and Southern Danghe Mountains was the highest in all four years, while that of Daban Mountains was the lowest in all four years. On the whole, the SLA of the glacier was high on the south slope and low on the north slope, and high on the west slope and low on the east slope in the four years. This can be explained according to Figure 10, mainly because the summer mean temperature of the southern slope is higher than that of the north slope, and the annual total precipitation is less than that of the north slope. The summer mean temperature of the west slope is higher than the east slope, and the annual total precipitation is less than the east slope.
The SLA changes of the Qilian Mountains during 1989–2018 are shown in Figure 11e. The variation of glacier SLA ranged from −12 to 19 m/a, which means that the SLA of the Qilian Mountains glaciers has both decreased and increased in the past 30 years. The SLA of the western and middle section of Tuergendaban Mountains and the western section of Southern Danghe Mountains decreased significantly. The SLA of the western section of Southern Tuolai Mountains also decreased by −2 m/a. SLA in the western and middle sections of Southern Zoulang Mountains increased most significantly, with a rate of about 11–19 m/a. The regions with SLA rising rates of about 6–11 m/a are mainly distributed in Tuergendaban Mountains and the eastern section of Southern Danghe Mountains, the western and middle section of Southern Shule Mountains, the middle section of Southern Tuolai Mountains, the western section of Tuolai Mountains and the eastern section of Daban Mountains.
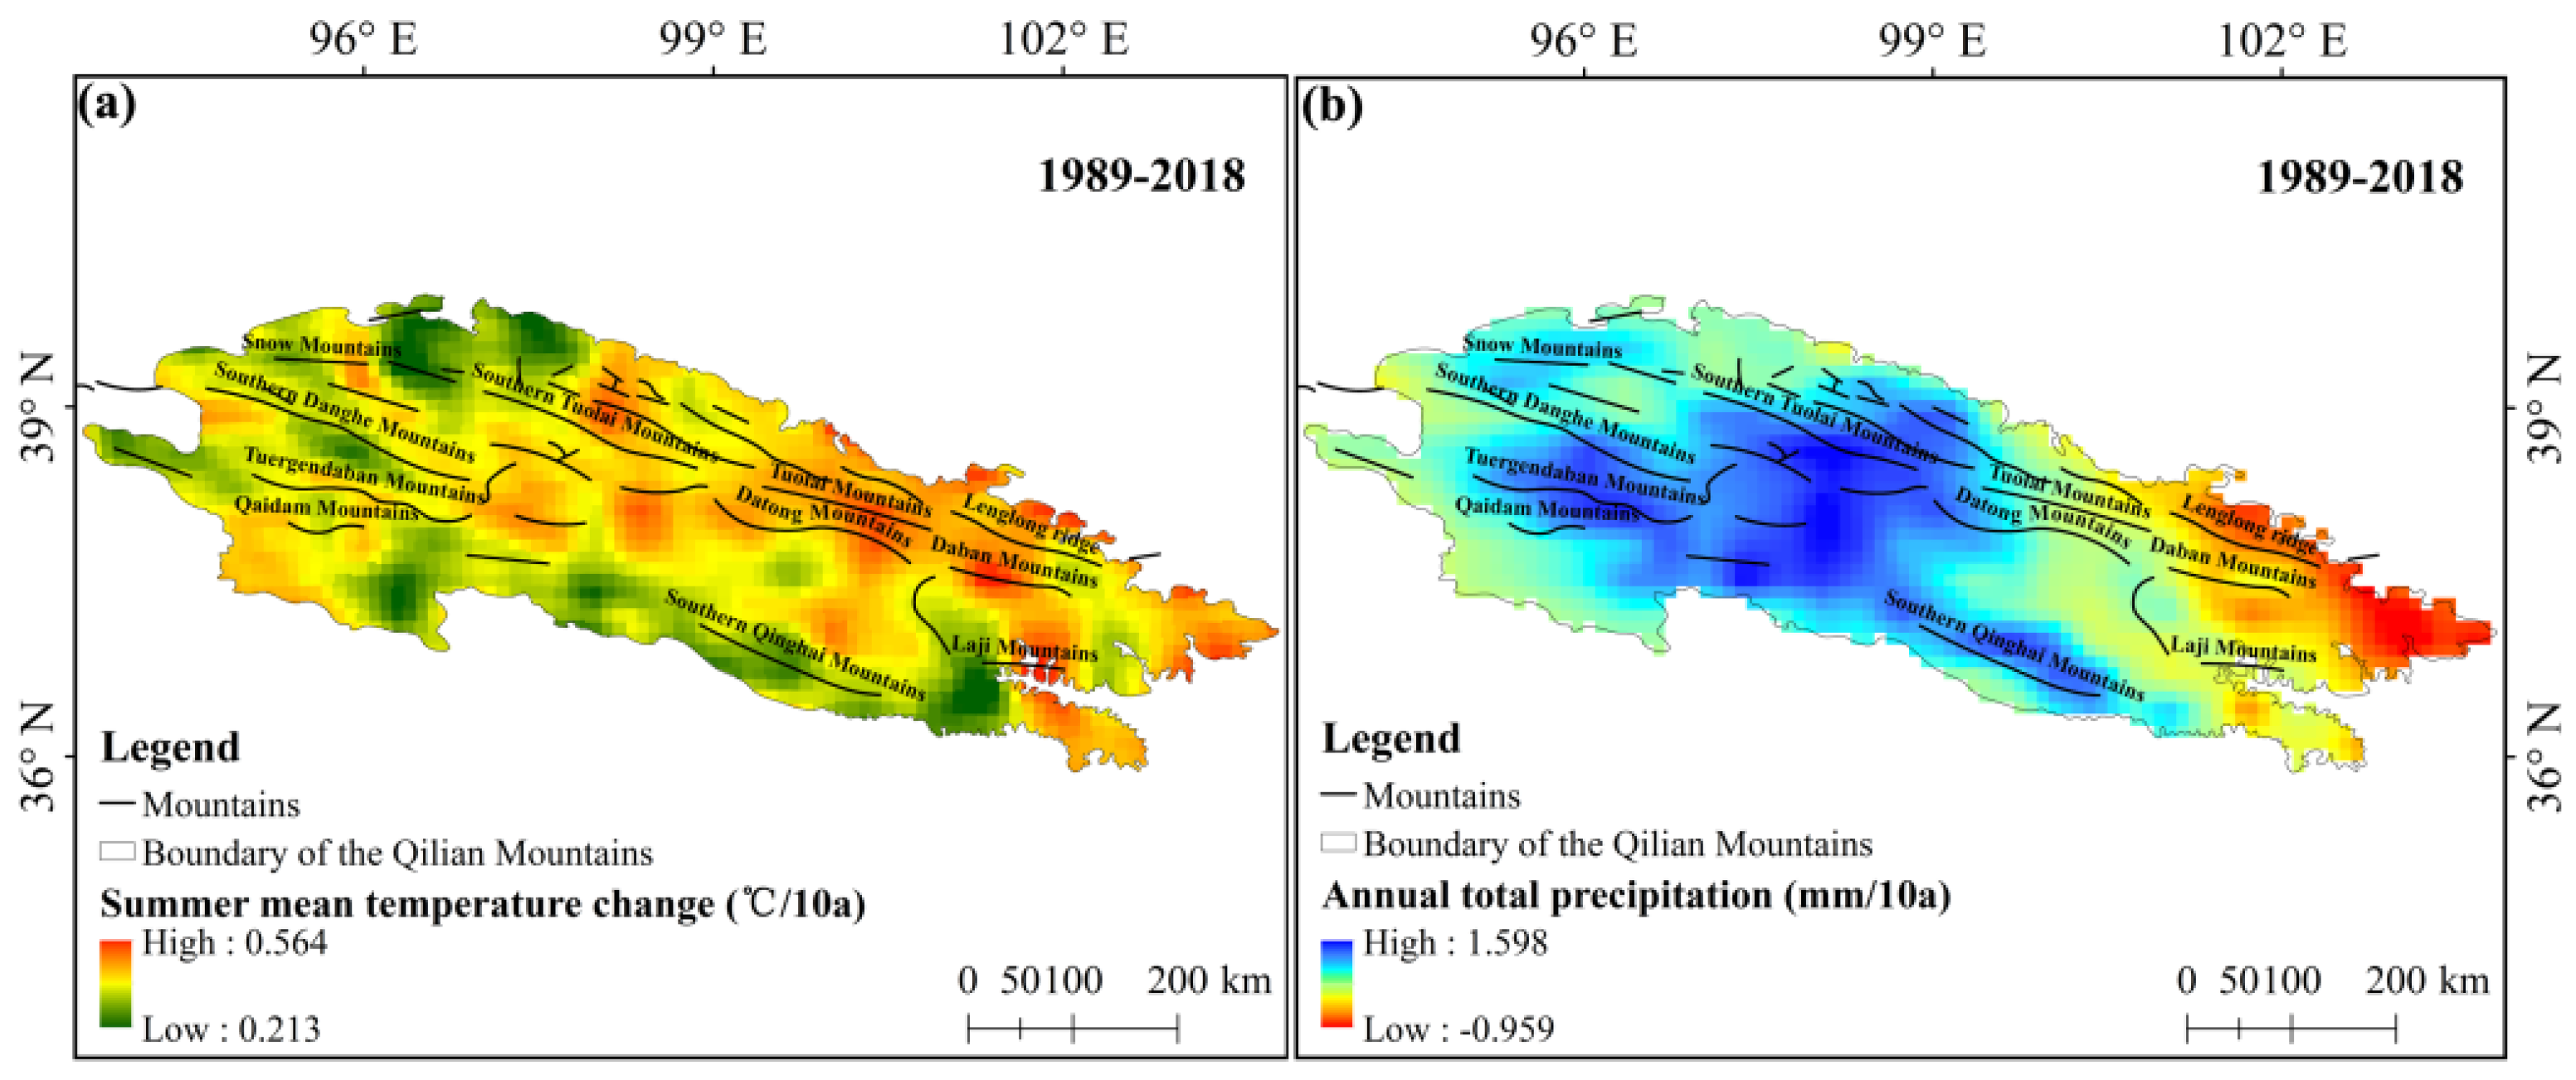
We also discussed the relationship between climate and SLA in combination with the changes of summer temperature and precipitation in Qilian Mountains during 1989–2018 (Figure 12). In the past 30 years, the temperature in Qilian Mountains has been increasing from south to north and from west to east, especially in several areas where the temperature has increased significantly. From 1989 to 2018, the annual total precipitation both increased and decreased in the regions, and showed an obvious increasing trend from east to west, especially in the south of Qaidam Mountains, the north of Southern Zoulang Mountains, and the west of Datong Mountains; north of Yema Mountains there is a region with significantly increased precipitation. However, to the east of Riyue Mountains, there is a region with significantly reduced precipitation. For example, the western and middle sections of Daban Mountains are located in the core region with obvious temperature warming in summer, and in the region with visible decrease in annual total precipitation. The combined effect of the two causes the most apparent increase in SLA in Daban Mountains during 1989–2018. Nevertheless, in the middle part of Tuerdaban Mountains and in the western part of Southern Danghe Mountains, the summer mean temperature rise is less and the annual total precipitation is more, which leads to an obvious downward trend of SLA in these regions. In order to further explain the impact of summer mean temperature and annual total precipitation on SLA, we calculated the correlation coefficient between summer mean temperature and annual total precipitation and SLA. The correlation coefficient between the change of SLA and summer mean temperature during 1989–2018 was 0.4, and the correlation coefficient between the change of SLA and annual total precipitation was −0.1, indicating that the spatial variation of SLA in the Qilian Mountains in the recent 30 years was mainly affected by summer mean temperature. Annual total precipitation is also associated with SLA changes. Once again, the glacier SLA in Qilian Mountain is affected by summer mean temperature and annual total precipitation in both time and space, but the summer mean temperature is the main factor affecting SLA.
Glaciers of 5Y4, 5Y5 and 5J4 water systems in the Qilian Mountains are divided into 11 sub-basins in total (Figure 13). They are Shiyang river basin (5Y41), Hei River Basin (5Y42), Beida River Basin (5Y43), Shule River Basin (5Y44), Danghe River Basin (5Y45), Buh River-Qinghai Lake Basin (5Y51), Haltang River Basin (5Y56), Har Lake Basin (5Y57), Iqe-Tatalin Gol River Basin (5Y58), Bayan Gol River Basin (5Y59) and Datong River Basin (5J42). Since there are only 10 glaciers in the Bayan Gol River Basin, with a total area of 2.11 km2, and due to the influence of clouds, there are fewer glaciers from which SLA can be extracted, so there is no SLA data in this basin. Therefore, we studied the glacier average SLA for the remaining 10 sub-basins from 1989 to 2018 (Figure 13a).
On the whole, at the watershed scale, the glacier SLA also showed a negative trend from west to east and from south to north. Among them, the highest SLA is 5110 m in the Iqe-Tatalin Gol River Basin. It is followed by 5068 m in the Haltang River Basin. The lowest SLA (4589 m) occurred in the Datong River Basin. The main reason is that the Qilian Mountain is affected by geological structure, which gradually decreases from southwest to northeast, that is, it is high in the west and low in the east, high in the south and low in the north. The average height of snow-covered peaks decreases from 5330 m in Snow Mountains to 4860 m in Lenglongling in the east, and from 5483 m in Qaidam Mountains in the south to 4937 m in Southern Zoulang Mountains in the northernmost of the Qilian Mountains. The main mountain ranges in the Iqe-Tatalin Gol River Basin and Haltang River Basin are the Qaidam Mountains and Tuergendaban Mountains, respectively. The Datong River Basin is mainly distributed in Datong Mountains and Daban Mountains, and the elevation is relatively low. This kind of mountain elevation gradually decreases from southwest to northeast, which directly affects the distribution characteristics of glaciers. We also studied the change of glacier SLA in each basin of Qilian Mountains from 1989 to 2018 (Figure 13b). Glacier SLA in 10 basins showed an upward trend during 1989–2018, with an upward range of 4–112 m/10a. The basins with a significant increase in SLA were Har Lake Basin (112 m/10a) and Beida River Basin (98 m/10a). Glacier changes were relatively stable in the Danghe River Basin and the Shule River Basin, and SLA increased by 4 m/10a and 12 m/10a, respectively. In order to analyze the reasons for the spatial distribution of SLA changes, we refer to the spatial changes of summer temperature and precipitation from 1989 to 2018 in Figure 12. It can be seen that the temperature in the basins with apparent SLA changes is generally higher, while the temperature in the basins with small SLA changes is generally lower, or the temperature increase is less, especially in the Shiyang River Basin, where the temperature rises markedly and the precipitation shows an obvious decreasing trend. Therefore, the temperature is the main reason for the inconsistent SLA changes in the basins. In order to further explain the impact of summer mean temperature and annual total precipitation change on SLA, we calculated the correlation coefficient between summer mean temperature change and SLA change in each basin, as well as the correlation coefficient between annual total precipitation change and SLA change (Table 7). The correlation coefficient between SLA and summer mean temperature change is 0.86, which is verified by the significance test with confidence level of 0.05. The correlation coefficient between SLA and annual total precipitation is −0.20, which passed the significance test with confidence level 0.5. The results further indicate that temperature is the main factor affecting SLA change, and precipitation also has a certain mitigating effect on glacier retreat caused by temperature rise.

4.4. Climate Sensitivity of Glacier ELA in Qilian Mountains

The SLA at the end of the ablation season is approximately equal to ELA. In order to reconstruct its past changes and analyze the climate sensitivity of ELA in the Qilian Mountains, we use the SLA obtained from remote sensing data, and the summer mean temperature TS and solid precipitation PS at the meteorological stations around the glacier, to establish a statistical relationship between them,
ELA = 3404.59 + 109.06TS − 0.868PS     (R = 0.729, n = 30)
The variance test results of this regression equation show that its significance level is 0.00001, indicating that there is a linear relationship between ELA, summer temperature and summer precipitation in this analysis. Ohmura et al. [47] have conducted statistical analysis on the observation data of more than 70 glaciers around the world, and the results also show that the response of ELA to the change of summer temperature and precipitation is linear. Therefore, Formula 5 can be used to analyze the sensitivity of glacier ELA to temperature and precipitation changes in Qilian Mountains. By inputting the average value of summer mean temperature and annual total solid precipitation from 1989 to 2018 into Formula 4, when the solid precipitation remains unchanged, it can be obtained that ELA will increase (decrease) by about 109 m for every 1 °C increase (decrease) in summer mean temperature. If the summer mean temperature remains unchanged, ELA will decrease (rise) by about 6 m for every 10% increase (decrease) of solid precipitation. This indicates that compared with summer temperature, ELA is less sensitive to precipitation. From the sensitivity of ELA to summer temperature and summer precipitation, it can be seen that summer temperature is the main climatic factor affecting ELA change. The sensitivity study of SLA and temperature in the middle Qilian Mountains shows that when the temperature changes by 1 °C in warm season (May to August), SLA in the middle Qilian Mountains will change by 58 m [48]. A study on ELA and climate sensitivity of Qiyi Glacier in Qilian Mountains shows that if the temperature increases (decreases) by 1 °C in warm season, the ELA of the glacier will increase (decrease) by about 172 m. If precipitation increases (decreases) by 10% from January to March, then ELA in this glacier will decrease (rise) by about 62 m [39]. The results of sensitivity study on the ELA of the No.1 Glacier at the Urumqi River Headwaters in Tianshan show that if the temperature increases (decreases) by 1 °C in warm season, the ELA of the Glacier will increase (decrease) by 61.7 m. If annual precipitation increases (decreases) by 10%, then glacial ELA will decrease (rise) by about 13.1 m [49]. Therefore, the sensitivity of ELA of different glaciers or glaciers in the same region to climate change is different, which may be caused by different responses of different glaciers to the same climate change.

5. Conclusions

The SLA can be used to estimate glacier mass balance and serves as an indicator of climate change. The continuous observation data of Qiyi Glacier can verify the feasibility and accuracy of our method. We extracted glacier SLAs in the Qilian Mountains at the end of the melt season from Landsat data, studied the SLA changes during the 1989–2018 period, and discussed the impact of climate on the SLA. The main conclusions are as follows:
(1) The uncertainty of SLA obtained by Landsat was controlled in the range of ± 25 m by using the height zone-area method after the DEM data were divided into 50 m intervals. The accuracy of glacier SLA obtained in 1989–2018 after adding MODIS SLA data to the years without Landsat data increased by about 78 m. Therefore, after the application of multi-source data combined with area-height band method, we obtained a more complete and accurate SLA sequence. The SLA sequence we constructed can be used to reconstruct and restore the ELA of the non-data area, and indicating mass balance.
(2) The SLA of Qiyi Glacier in the Qilian Mountains exhibited an overall upward trend during the 1989–2018 period. A linear fit to the data indicated that the SLA increased by ~148 m during the 30 year study period, at an average rate of 51 m/10a. The highest and lowest SLAs were 5030 ± 25 m (2018) and 4690 ± 25 m (1998), respectively, and the mean SLA was 4900 ± 103 m. A comparison of the remote-sensing-derived SLA with the measured ELA indicated that the SLA at the end of the ablation season could be used as a proxy for the ELA.
(3) The western, central, eastern sections and the whole range of the Qilian Mountains exhibited an upward trend in SLA during the 30 year study period. The mean glacier SLAs were 4923 ± 137, 4864 ± 135, 4550 ± 149 and 4779 ± 149 m for the western, central, eastern sections and the whole range, respectively.
(4) From the perspective of spatial distribution, regardless of the whole range, different orientation, grid scale and basin scale, the glacier SLA of Qilian Mountains showed an upward trend from 1989 to 2018, and the distribution pattern was high in the south and low in the north, high in the west and low in the east.
(5) The results of our study on the climate sensitivity of ELA in Qilian Mountains show that if the summer mean temperature increases (decreases) by 1 °C, then ELA will increase (decrease) by about 102 m. If the annual total precipitation increases (decreases) by 10%, then the glacier ELA will decrease (rise) by about 6 m. This indicates that compared with summer temperature, ELA is less sensitive to precipitation.
(6) Terrain and climate will influence the spatial and temporal distribution of SLA and ELA. The results indicate that temperature is the main factor affecting SLA change, and precipitation also has a certain mitigating effect on glacier retreat caused by temperature rise.
Regarding the climate sensitivity of the glaciers, in addition to temperature and precipitation, another parameter is gaining in importance, namely the strong increase in the water vapor content of the air in summer, which is also observed at higher altitudes. This significantly increases the efficiency of the melting of snow and ice, which leads to further ice losses. It therefore makes sense to also pay attention to this parameter in the future.

Author Contributions

Investigation, Y.W. and A.C.; Methodology, Z.G. (Zhujun Gu); Validation, N.W.; Writing—original draft, Z.G. (Zhongming Guo); Writing—review & editing, N.W. and B.S. All authors have read and agreed to the published version of the manuscript.

Funding

This research was funded by the Strategic Priority Research Program of the Chinese Academy of Sciences (Grant No. XDA19070302, XDA20060201), the National Natural Science Foundation of China (Grant No. 42130516, 41501069), the Second Tibetan Plateau Scientific Expedition and Research Program (2019QZKK020102), and Natural Science Basic Research Program of Shaanxi (Program No. 2021JQ-451).

Institutional Review Board Statement

Ethical review and approval were waived for this study, due to studies not involving humans or animals.

Informed Consent Statement

Informed consent was obtained from all subjects involved in the study.

Data Availability Statement

The data presented in this study are available on request from the corresponding author.

Acknowledgments

We thank the EROS Data Center-NASA/USGS and Geospatial data cloud for the use of available satellite imagery. We would also like to thank the China Meteorological Data Service Center for providing the meteorological data.

Conflicts of Interest

The authors declare no conflict of interest.

References

  1. Ding, Y.J.; Ye, B.S.; Liu, S.Y. Impact of climate change on the alpine streamflow during the past 40 a in the middle part of the QiIian Mountains, Northwestern China. J. Glaciol. Geocryol. 2000, 22, 193–199. [Google Scholar] [CrossRef]
  2. Chen, Y.N.; Li, W.H.; Deng, H.J.; Fang, G.H.; Li, Z. Changes in Central Asia’s water tower: Past, present and future. Sci. Rep. 2016, 6, 35458. [Google Scholar] [CrossRef]
  3. Immerzeel, W.W.; Lutz, A.F.; Andrade, M.; Bahl, A.; Biemans, H.; Bolch, T.; Hyde, S.; Brumby, S.; Davies, B.J.; Elmore, A.C.; et al. Importance and vulnerability of the world’s water towers. Nature 2020, 577, 364–369. [Google Scholar] [CrossRef] [PubMed]
  4. Pritchard, H.D. Asia’s shrinking glaciers protect large populations from drought stress. Nature 2019, 569, 649–654. [Google Scholar] [CrossRef]
  5. Duan, J.P.; Wang, L.L.; Ren, J.W.; Li, L. Progress in glacier variations in China and its sensitivity to climatic change during the past century. Prog. Geog. 2009, 28, 231–237. [Google Scholar] [CrossRef]
  6. Duan, K.Q.; Yao, T.D.; Shi, P.H.; Guo, X.J. Simulation and prediction of equilibrium line altitude of glaciers in the eastern Tibetan Plateau. Sci. China Earth Sci. 2017, 47, 104–113. [Google Scholar] [CrossRef]
  7. Pellitero, R.; Rea, B.R.; Spagnolo, M.; Bakke, J.; Hughes, P.; Ivy-Ochs, S.; Lukas, S.; Ribolini, A. A GIS tool for automatic calculation of glacier equilibrium-line altitudes. Comput. Geosci. 2015, 82, 55–62. [Google Scholar] [CrossRef]
  8. Brun, F.; Berthier, E.; Wagnon, P.; Kääb, A.; Treichler, D. A spatially resolved estimate of High Mountain Asia glacier mass balances, 2000–2016. Nat. Geosci. 2017, 10, 668–673. [Google Scholar] [CrossRef] [PubMed]
  9. Chen, A.A.; Wang, N.L.; Li, Z.; Wu, Y.W.; Zhang, W.; Guo, Z.M. Region-wide glacier mass budgets for the Tanggula Mountains between ~1969 and ~2015 derived from remote sensing data. Arct. Antarct. Alp. Res. 2018, 49, 551–568. [Google Scholar] [CrossRef] [Green Version]
  10. Zhou, Y.S.; Li, Z.W.; Li, J.; Zhao, R.; Ding, X.L. Glacier mass balance in the Qinghai–Tibet Plateau and its surroundings from the mid-1970s to 2000 based on Hexagon KH-9 and SRTM DEMs. Remote Sens. Environ. 2018, 210, 96–112. [Google Scholar] [CrossRef]
  11. Gao, X.; Ye, B.S.; Zhang, S.Q.; Qiao, C.J.; Zhang, X.W. Glacier runoff variation and its influence on river runoff during 1961–2006 in the Tarim River Basin, China. Sci. China Earth Sci. 2010, 53, 880–891. [Google Scholar] [CrossRef]
  12. Cogley, J.G.; Hock, R.; Rasmussen, L.A.; Arendt, A.A.; Bauder, A.; Braithwaite, R.J.; Jansson, P.; Kaser, G.; MÖler, M.; Nicholson, L.; et al. Glossary of Glacier Mass Balance and Related Terms, IHP-VII Technical Documents in Hydrology No. 86, IACS Contribution No. 2; UNESCO: Paris, France, 2011; p. 965. [Google Scholar]
  13. Lliboutry, L. Traite’de Glaciology. Tome II: Glaciers, Variations du Climat, Sols Gele’s; Masson et Cie: Paris, France, 1965. [Google Scholar]
  14. Rastner, P.; Prinz, R.; Notarnicola, C.; Nicholson, L.; Sailer, R.; Schwaizer, G.; Paul, F. On the automated mapping of snow cover on glaciers and calculation of snow line altitudes from multi-temporal Landsat data. Remote Sens. 2019, 11, 1410. [Google Scholar] [CrossRef] [Green Version]
  15. Barandun, M.; Huss, M.; Usubaliev, R.; Azisov, E.; Berthier, E.; Kääb, A.; Bolch, T.; Hoelzle, M. Multi-decadal mass balance series of three Kyrgyz glaciers inferred from modelling constrained with repeated snow line observations. Cryosphere 2018, 12, 1899–1919. [Google Scholar] [CrossRef] [Green Version]
  16. Žebre, M.; Colucci, R.R.; Giorgi, F.; Glasser, N.F.; Racoviteanu, A.E.; Gobbo, C.D. 200 years of equilibrium-line altitude variability across the European Alps (1901−2100). Clim. Dynam. 2021, 56, 1–19. [Google Scholar] [CrossRef]
  17. Pattanaik, S.R.; Singh, S.K.; Bahuguna, I.M.; Shah, R.D. Spatial and temporal variability of Accumulation Area Ratio (AAR) of glaciers in Nubra, Chandra and Bhagirathi sub-basins in the Himalayan region (2008–2013). Them. J.Geogr. 2019, 8, 93–106. [Google Scholar]
  18. Wunderle, S.; Droz, M.; Kleindienst, H. Spatial and temporal analysis of the snow line in the Alps based on NOAA-AVHRR data. Geogr. Helv. 2002, 57, 170–183. [Google Scholar] [CrossRef] [Green Version]
  19. Wu, Y.W.; He, J.Q.; Guo, Z.M.; Chen, A.A. Limitations in identifying the equilibrium-line altitude from the optical remote-sensing derived snowline in the Tien Shan, China. J. Glaciol. 2014, 60, 1093–1100. [Google Scholar] [CrossRef] [Green Version]
  20. Prantl, H.; Nicholson, L.; Sailer, R.; Hanzer, F.; Juen, I.; Rastner, P. Glacier snowline determination from terrestrial laser scanning intensity data. Geosciences 2017, 7, 60. [Google Scholar] [CrossRef] [Green Version]
  21. Parajka, J.; Pepe, M.; Rampini, A.; Rossi, S.; Blöschl, G. A regional snow-line method for estimating snow cover from MODIS during cloud cover. J. Hydrol. 2010, 381, 203–212. [Google Scholar] [CrossRef]
  22. McFadden, E.M.; Ramage, J.; Rodbell, D.T. Landsat TM and ETM+ derived snowline altitudes in the Cordillera Huayhuash and Cordillera Raura, Peru, 1986–2005. Cryosphere 2011, 4, 1931–1966. [Google Scholar] [CrossRef] [Green Version]
  23. Pelto, M. Utility of late summer transient snowline migration rate on Taku Glacier, Alaska. Cryosphere 2011, 5, 1127–1133. [Google Scholar] [CrossRef]
  24. De Angelis, H.; Rau, F.; Skvarca, P. Snow zonation on Hielo Patagónico Sur, Southern Patagonia, derived from Landsat 5 TM data. Glob. Planet. Chang. 2007, 59, 149–158. [Google Scholar] [CrossRef]
  25. Kaur, R.; Saikumar, D.; Kulkarni, A.V.; Chaudhary, B.S. Variations in snowcover and snowline altitude in Baspa Basin. Curr. Sci. 2009, 96, 1255–1258. [Google Scholar]
  26. Guo, Z.M.; Geng, L.; Shen, B.S.; Wu, Y.W.; Chen, A.A.; Wang, N.L. Spatiotemporal Variability in the Glacier Snowline Altitude across High Mountain Asia and Potential Driving Factors. Remote Sens. 2021, 13, 425. [Google Scholar] [CrossRef]
  27. Bao, W.J.; Liu, S.Y.; Wu, K.P.; Wang, R.J.; Jiang, Z.L. A method for extracting snow line altitude based on MODIS snow product. J. Glaciol. Geocryol. 2017, 39, 259–272. [Google Scholar] [CrossRef]
  28. Tang, Z.G.; Wang, X.R.; Wang, J.; Wang, X.; Wei, J.F. Investigating spatiotemporal patterns of snowline altitude at the end of melting season in High Mountain Asia, using cloud-free MODIS snow cover product, 2001–2016. Cryosphere Discuss. 2019, 1–24. [Google Scholar] [CrossRef]
  29. Fausto, R.S.; Andersen, S.B.; Ahlstrøm, A.P.; van As, D.; Box, J.E.; Binder, D.; Citterio, M.; Colgan, W.; Haubner, K.; Hansen, K. Greenland ice sheet–snowline elevations at the end of the melt seasons from 2000 to 2017. Geol. Surv. Den. Greenl. 2018, 41, 71–74. [Google Scholar]
  30. Sun, M.P.; Liu, S.Y.; Yao, X.J.; Guo, W.Q.; Xu, J.L. Glacier changes in the Qilian Mountains in the past half-century: Based on the revised First and Second Chinese Glacier Inventory. J. Geogr. Sci. 2018, 28, 206–220. [Google Scholar] [CrossRef] [Green Version]
  31. Guo, Z.M.; Wang, N.L.; Wu, H.B.; Wu, Y.W.; Wu, X.J.; Li, Q.L. Variations in firn line altitude and firn zone area on Qiyi Glacier, Qilian Mountains, over the period of 1990 to 2011. Arct. Antarct. Alp. Res. 2015, 47, 293–300. [Google Scholar] [CrossRef] [Green Version]
  32. Wang, Z.T.; Liu, C.H.; You, G.X.; Pu, J.C.; Yang, H.A.; Tian, P.Y. Glacier Inventory of China I Qilian Mountains; Lanzhou Institute of Glaciology and Cryopedology, Chinese Academy of Sciences: Lanzhou, China, 1981. [Google Scholar]
  33. He, J.; Wang, N.L.; Chen, A.A.; Yang, X.W.; Hua, T. Glacier changes in the Qilian Mountains, Northwest China, between the 1960s and 2015. Water 2019, 11, 623. [Google Scholar] [CrossRef] [Green Version]
  34. Shi, Y.F. A Concise China Glacier Inventory; Shanghai Science Popular Press: Shanghai, China, 2005. [Google Scholar]
  35. Lan, Y.C.; Kang, E.S.; Zhang, J.S.; Cheng, R.S. Air temperature series and its changing trends in Qilian Mountains area since 1950s. J. Desert Res. 2001, 21, 53–57. [Google Scholar]
  36. Shi, Y.F.; Liu, C.H.; Kang, E.S. The Glacier Inventory of China. Ann. Glaciol. 2009, 50, 1–4. [Google Scholar] [CrossRef] [Green Version]
  37. Wang, N.L.; He, J.Q.; Pu, J.C.; Jiang, X.; Jing, Z.F. Variations in equilibrium line altitude of the Qiyi Glacier, Qilian Mountains, over the past 50 years. Chin. Sci. Bull. 2010, 55, 3810–3817. [Google Scholar] [CrossRef]
  38. Davaze, L.; Rabatel, A.; Dufour, A.; Hugonnet, R.; Arnaud, Y. Region-wide annual glacier surface mass balance for the European Alps from 2000 to 2016. Front. Earth Sci. 2020, 8, 149. [Google Scholar] [CrossRef]
  39. Deng, G.; Tang, Z.G.; Hu, G.J.; Wang, J.W.; Sang, G.Q.; Li, J. Spatiotemporal dynamics of snowline altitude and their Responses to climate change in the Tienshan Mountains, Central Asia, during 2001–2019. Sustainability 2021, 13, 3992. [Google Scholar] [CrossRef]
  40. Chen, J.; Zhu, X.L.; Vogelmann, J.E.; Gao, F.; Jin, S.M. A simple and effective method for filling gaps in Landsat ETM+ SLC-off images. Remote Sens. Environ. 2011, 115, 1053–1064. [Google Scholar] [CrossRef]
  41. Paul, F.; Kääb, A.; Maisch, M.; Kellenberger, T.; Haeberli, W. The new remote-sensing-derived Swiss glacier inventory: I. Methods. Ann. Glaciol. 2002, 34, 355–361. [Google Scholar] [CrossRef] [Green Version]
  42. Tian, H.Z.; Yang, T.B.; Liu, Q.P. Climate change and glacier area shrinkage in the Qilian mountains, China, from 1956 to 2010. Ann. Glaciol. 2014, 55, 187–197. [Google Scholar] [CrossRef] [Green Version]
  43. Bolch, T.; Menounos, B.; Wheate, R. Landsat-based inventory of glaciers in western Canada, 1985–2005. Remote Sens. Environ. 2010, 114, 127–137. [Google Scholar] [CrossRef]
  44. Guo, W.Q.; Liu, S.Y.; Yu, P.C.; Xu, J.L. Automatic extraction of ridgelines using on drainage boundaries and aspect difference. Sci. Surv. Mapp. 2011, 36, 210–212. [Google Scholar] [CrossRef]
  45. Guo, W.Q.; Liu, S.Y.; Xu, J.L.; Wu, L.Z.; Shangguan, D.H.; Yao, X.J.; Wei, J.F.; Bao, W.J.; Yu, P.C.; Liu, Q.; et al. The second Chinese glacier inventory: Data, methods and results. J. Glaciol. 2015, 61, 357–372. [Google Scholar] [CrossRef] [Green Version]
  46. Han, C.T.; Chen, R.S.; Liu, J.F.; Yang, Y.; Qing, W.W. A discuss of the separating solid and liquid precipitations. J. Glaciol. Geocryol. 2010, 32, 249–256. [Google Scholar]
  47. Ohmura, A.; Kasser, P.; Funk, M. Climate at the Equilibrium Line of Glaciers. J. Glaciol. 1992, 38, 397–411. [Google Scholar] [CrossRef] [Green Version]
  48. Zhao, J.; Huang, Y.S.; Shi, Y.F.; Li, L. Relationship between snow line change and climate change in the middle of Qilian Mountains during 2000-2012. Mt. Res. 2015, 33, 683–689. [Google Scholar] [CrossRef]
  49. Dong, Z.W.; Qin, D.H.; Ren, J.W.; Li, K.M.; Li, Z.Q. Variations in the equilibrium line altitude of Urumqi Glacier No.1, Tianshan Mountains, over the past 50 years. Chin. Sci. Bull. 2012, 57, 4776–4783. [Google Scholar] [CrossRef] [Green Version]
Figure 1. Location of the study area in the Qilian Mountains, with the glaciers and meteorological stations shown.
Remotesensing 13 04935 g001
Figure 2. Classification results of Landsat images of Qiyi Glacier in Qilian Mountains by maximum likelihood method (Landsat images of 2013, LC0820130820) (a), and height zones of DEM images reclassified at 50 m intervals (b).
Remotesensing 13 04935 g002
Figure 3. Glacier SLA obtained by using Landsat data and MODIS data, and SLA sequence of Qiyi Glacier in Qilian Mountains from 1989 to 2018 extracted by using Landsat data as the “ reference value” assisted by MODIS data.
Remotesensing 13 04935 g003
Figure 4. The time distribution of the selected Landsat images to derive SLA.
Remotesensing 13 04935 g004
Figure 5. The SLAs extracted from Sentinel-2 images in warm season [26].
Remotesensing 13 04935 g005
Figure 6. Relationship between the remote-sensing-derived SLA and measured ELA of Qiyi Glacier in the Qilian Mountains. The black dot–dash line represents the 1:1 line.
Remotesensing 13 04935 g006
Figure 7. Glacier SLA in the western section, central section, eastern section of the Qilian Mountains and the Qilian Mountains during the 1989–2018 period. Dashline represent the linear fit line of the SLA.
Remotesensing 13 04935 g007
Figure 8. Summer mean temperature (a) and annual total precipitation anomalies (b) from the meteorological stations and ERA5 data near the glaciers in the Qilian Mountains. The black dash line represents the linear fit line of summer mean temperature or annual total precipitation anomalies of the meteorological station.
Remotesensing 13 04935 g008
Figure 9. Glacier SLA (a) and number of glaciers with different orientations (b) in the Qilian Mountains in 1989, 1999, 2009 and 2018.
Remotesensing 13 04935 g009
Figure 10. The glacier SLA in 1989, 1999, 2009 and 2018 (gray and black bars), summer temperature (red and dark red lines) and annual total precipitation (dark blue and light blue bars) on the south and north slopes (a), and on the east and west slopes (b), with light colors representing the north and east slopes (light gray, red and light blue), respectively. Dark colors represent south slope and west slope (black, dark red, dark blue).
Remotesensing 13 04935 g010
Figure 11. Spatial changes in the mean glacier SLA in the Qilian Mountains in 1989, 1999, 2009 and 2018 (ad), and SLA change from 1989–2018 (e).
Remotesensing 13 04935 g011
Figure 12. Changes of summer mean temperature (a) and annual total precipitation (b) in Qilian Mountains during 1989–2018.
Remotesensing 13 04935 g012
Figure 13. The glacier mean SLA of 10 sub-basins of the Qilian Mountains during 1989–2018 (a), and the variation of glacier SLA of 10 sub-basins during 1989–2018 (b).
Remotesensing 13 04935 g013
Table 1. Screened Landsat data that were used to determine the SLA in the Qilian Mountains during the 1989–2018 period.
Path/RowDateSensor
136/3325 August 1989Landsat TM5
14 July 1991Landsat TM5
12 August 1996Landsat TM5
21 August 1999Landsat TM5
31 August 2000Landsat ETM+
29 August 2002Landsat TM5
2 August 2004Landsat TM5
31 July 2006Landsat ETM+
27 August 2007Landsat TM5
21 July 2009Landsat ETM+
27 August 2010Landsat ETM+
11 August 2013Landsat OLI
29 July 2014Landsat OLI
25 August 2015Landsat ETM+
27 August 2016Landsat ETM+
14 August 2017Landsat ETM+
10 September 2018Landsat OLI
135/332 August 1989Landsat TM5
31 July 1994Landsat TM5
22 September 1996Landsat TM5
9 September 1997Landsat TM5
28 September 1998Landsat TM5
24 June 2001Landsat ETM+
17 August 2006Landsat TM5
28 August 2010Landsat TM5
31 August 2011Landsat TM5
20 August 2013Landsat OLI
30 July 2014Landsat ETM+
15 August 2017Landsat OLI
10 August 2018Landsat ETM+
132/3410 August 1988Landsat TM5
16 August 1990Landsat TM5
3 August 1991Landsat TM5
27 August 1994Landsat TM5
16 August 1996Landsat TM5
3 August 1997Landsat TM5
1 August 1999Landsat ETM+
14 August 2001Landsat TM5
24 July 2002Landsat ETM+
9 August 2005Landsat TM5
12 August 2009Landsat ETM+
10 August 2011Landsat TM5
4 August 2012Landsat ETM+
18 August 2014Landsat OLI
7 August 2016Landsat OLI
28 July 2018Landsat OLI
134/3327 August 1989Landsat TM5
30 July 1999Landsat ETM+
17 July 2009Landsat TM5
19 August 2018Landsat ETM+
133/3331 July 1999Landsat TM5
11 August 2009Landsat TM5
19 July 2018Landsat OLI
135/342 August 1989Landsat TM5
30 August 1999Landsat TM5
13 September 2018Landsat OLI
Table 2. Details of the meteorological stations near glacier areas in the Qilian Mountains.
Station IDLatitude (°)Longitude (°)Elevation (m)AspectNameProvince
5263338.4998.253367NTuoleQinghai
5264538.2699.363314NEYeniugouQinghai
5265738.18100.253597WQilianQinghai
5267937.92102.671531WWuweiGansu
5271337.8595.373173SWDachaidanQinghai
5276537.38101.623502SEMenyuanQinghai
5278737.20102.873045NEWushaolingGansu
Table 3. Band, wavelengths and spatial resolution of Landsat TM5, ETM+, and OLI data.
SensorBand NumberBandWavelengts (μm)Resolution (m)
TM51Blue0.45~0.5230
2Green0.52~0.6030
3Red0.63~0.6930
4Near-Infrared0.76~0.9030
5Near-Infrared1.55~1.7530
6Thermal10.40~12.50120
7Mid-Infrared2.08~2.3530
ETM+1Blue0.45~0.5330
2Green0.52~0.6030
3Red0.63~0.6930
4Near-Infrared0.77~0.9030
5SWIR1.55~1.7530
6Thermal10.40~12.5060
7Mid-Infrared2.08~2.3530
8Panchromatic0.52~0.9015
OLI1Coastal0.43~0.4530
2Blue0.45~0.5130
3Green0.53~0.5930
4Red0.64~0.6730
5Near-Infrared0.85~0.8830
6SWIR 11.57~1.6530
7SWIR 22.11~2.2930
8Panchromatic0.50~0.6815
9Cirrus1.36~1.3830
Table 4. Threshold for determining the position of the snow line and SLA of Qiyi Glacier in the Qilian Mountains during the 1989–2018 period.
YearSLA (m)Threshold (%)
19894780 ± 2570
19944820 ± 2565
19964970 ± 2560
19974830 ± 2540
19984690 ± 2545
20015010 ± 2560
20065020 ± 2580
20104900 ± 2550
20114850 ± 2540
20134970 ± 2565
20144920 ± 2570
20174870 ± 2565
20185030 ± 2565
Table 5. Under six different scenarios, SLA changes in Qilian Mountains from 1989 to 2018.
IDScenarioLinear Fitting EquationSLA Change (m)
1SLA of all yearsY = 7.0945x − 9435.1212.84
2Remove SLAs of 1989 and 2019Y = 7.3465x − 9944.2220.40
3Remove SLAminY = 5.6318x − 6494168.95
4Remove SLAmaxY = 6.6264x − 8500198.79
5Remove SLAmin and SLAsub-minY = 4.4916x − 4202.2134.75
6Remove SLAmax and SLAsub-maxY = 6.7150x − 8683.5201.45
Table 6. The number of grid SLAs in different elevation ranges of Qilian Mountains in 1989, 1999, 2009 and 2018.
Grid SLA (m)Grid Number
1989199920092018
≤4700141074
4700–49007201416
4900–510024121715
≥510003710
Table 7. SLA, summer average precipitation and annual total precipitation change in each basin of Qilian Mountains from 1989 to 2018.
Basin IDSLA Change (m)Summer Mean Temperature Change (°C/10a)Annual Total Precipitation Change (mm/10a)
5Y51680.4020.857
5Y56570.3790.806
5Y58660.3950.822
5Y45440.3780.739
5Y44120.3650.858
5Y571120.4321.251
5Y43980.4220.845
5Y42850.4440.471
5J42840.4390.161
5Y41970.441−0.538
Publisher’s Note: MDPI stays neutral with regard to jurisdictional claims in published maps and institutional affiliations.

