Article

Business Circle Identification and Spatiotemporal Characteristics in the Main Urban Area of Yiwu City Based on POI and Night-Time Light Data

College of Surveying and Geo-Informatics, Tongji University, Shanghai 200092, China
*
Author to whom correspondence should be addressed.
Remote Sens. 2021, 13(24), 5153; https://0-doi-org.brum.beds.ac.uk/10.3390/rs13245153
Submission received: 20 November 2021 / Revised: 16 December 2021 / Accepted: 17 December 2021 / Published: 18 December 2021

Abstract

:
The activity of the urban night-time economy is one of the most important indicators reflecting the prosperity of an urban economy. The business circle is an important carrier of urban commercial activities and the core area of urban nightlife. This paper takes the main urban area of Yiwu city as the research object. Based on POI data and night-time light remote sensing data, two-factor mapping, kernel density analysis, DBSCAN clustering, and local contour tree methods are adopted to identify the business circle structure of the main urban area of Yiwu city and analyse the relationship between business circle characteristics and the night-time economy. The following conclusions can be drawn. (1) The spatial superimposition relationship between the night-time remote sensing data and points of interest (POI) data in the main urban area of Yiwu city is good, and the overall coupling results show obvious circle structure characteristics. (2) The spatial distribution of different business combinations has obvious regularity: comprehensive shopping business shows a multicentre distribution pattern and has a hierarchical feature. In contrast, professional food and beverage and leisure and entertainment businesses are close to urban residential areas, and different groups of people live in different places with their own characteristics. (3) From 2015 to 2019, the brightness value of each business circle showed a continuously increasing trend. In 2020, due to the impact of COVID-19, most of them declined. (4) Overall, the difference in business circle tiers reflects the difference in the level of night-time economic activities.

Graphical Abstract

1. Introduction

The term night-time economy emerged in the United Kingdom in the 1970s and was initially a concept aimed at improving the empty nest phenomenon in urban areas and achieving an urban renaissance [1,2,3]. At present, there is no unified definition of the night-time economy in the academic community. Essentially, it refers to the economic, social, and cultural activities conducted from 6 p.m. of the current day to 6 a.m. of the next day. Its business forms include night-time shopping, dining, tourism, learning, watching films and television, leisure and entertainment, etc. [4,5,6,7]. With the continuous development of the urban economy, the connotation of the night-time economy has expanded, revealing both economic and social attributes as a whole [8,9]. Economic attributes emphasise the economic activities that occur at night, mainly referring to production or consumption behaviours related to leisure, entertainment, and other service industries; social attributes emphasise various daily activities and social behaviours that occur in the public space of the city at night. Vibrant night-time consumption can reflect the prosperity of a city’s economy. Since the 1990s, the night-time economy has received increasing attention from Western policy-makers and scholars. Montgomery, Lovatt, and O’Connor developed the “24-h city” concept, and encouraged a range of economic, social, and cultural activities in urban centres [1,4]. Bianchini studied night-time culture and economy and advocated the diversification of night-time activities in cities [5]. Chatterton and Hollands systematically studied the relationship between young people and urban night-time leisure spaces, proposed a systematic theory of production, regulation, and consumption of urban nightlife spaces, and pointed out the necessity of urban night-time leisure planning [10]. Some scholars began to focus on the safety of night-time economic activities [11,12,13,14]. Since London formally incorporated the night-time economy into its urban development strategy in 1995, the city’s night-time economy has generated revenues of £26.3 billion in 2017, accounting for 6% of the UK’s GDP, and is expected to reach £30 billion by 2030 [15]. High-quality cultural resources and industrial bases have become major features of London’s night-time economic development.
The rudimentary “night market” of China’s night-time economy has existed since ancient times. From the Yin and Zhou Dynasties to the Sui and Tang dynasties, its scale gradually grew. The Southern Song dynasty was even more prosperous than ever. During the Ming Dynasty, the city’s night market continued to prosper [16]. Since the reform and opening up, China’s night-time economy has been mainly manifested in three aspects: extending operating hours, enriching management modes, and improving consumption quality. Studies show that approximately 60% of the consumption of urban residents in China occurs at night; there is a night peak at approximately 18:00 and a night peak between 21:00 and 22:00; the night consumption in the eastern region is higher than that in the western region [14].
As an important vehicle for meeting people’s needs for a better life, a powerful engine for regional economic development and a core space for night-time economic activities, urban shopping districts continue to attract the research interest of scholars [17,18,19,20,21,22,23]. In recent years, some scholars have explored the identification of urban commercial centres and retail agglomerations using points of interest (POI) data and the kernel density estimation method [24,25,26,27]. Cui et al. identified and extracted commercial centres in Beijing using kernel density analysis and the contour tree method based on POI data [28]. Based on the theory of central place and the theory of agglomeration economy, Shi Y. et al. used geographic information systems (GIS) and spatial analysis methods to quantitatively measure and analyse the spatial gravity, expansion direction, agglomeration characteristics, and hierarchical structure of Shanghai shopping malls [29]. In addition, they used Meituan’s takeaway data as the basis and a spatial measurement model to quantitatively analyse the spatial differences between the number of takeaways and neighbourhood characteristics on the scale of Shanghai’s business circles [30]. In recent years, the application of remote sensing technology and methods to the quantitative study of urban spatial structure and socioeconomic development has gradually increased [31,32,33,34,35,36,37,38,39,40].
In general, on the one hand, most of the previous urban business circle structures were qualitatively identified based on the commercial centre level or its administrative level or were quantitatively divided based only on POI data, but rarely based on the combination of noctilucent remote sensing data and POI data [19,20,21,22,23,24,26,28,31,41,42]. On the other hand, in the past 30 years, the night-time economy has gradually received academic attention. Still, most of the research is limited to the business type, the spatial layout of the night-time economy and its relationship with urban security, or the application of nightlight remote sensing data to identify the central urban area, rarely using it to classify the level of the urban business circle. In addition, most Chinese scholars pay more attention to the business circles of big cities than to those of small and medium-sized cities. Therefore, the purpose of this article is as follows: (1) to explore a new method to classify the hierarchical structure of urban business circles based on multi-source data fusion. (2) to analyse the combination of the night-time economy and urban business circle and their interrelation, deepening the comprehensive cognition of the hierarchical structure of the urban business circle and providing technical support for future urban business planning.
A business circle refers to the radiation area where stores expand in a certain direction and distance to attract customers. In this study, the determination of a business circle boundary mainly considers three types of business of night-time economy, i.e., shopping (including shopping malls, department stores, characteristic commercial streets, speciality stores, supermarkets, convenience stores, shops, night markets), catering (including Chinese restaurants, western restaurants, snacks and fast-food restaurants, cold drinks shops, coffee shops, cafes, dessert shops), and leisure and entertainment (including cinema, KTV, foot bath and leisure, fitness club, beauty care, sports venues, game hall). The DBSCAN Clustering method and Local Contour Tree method, combined with the urban road network, are adopted to quantitatively identify them.

2. Data Sources and Research Methodology

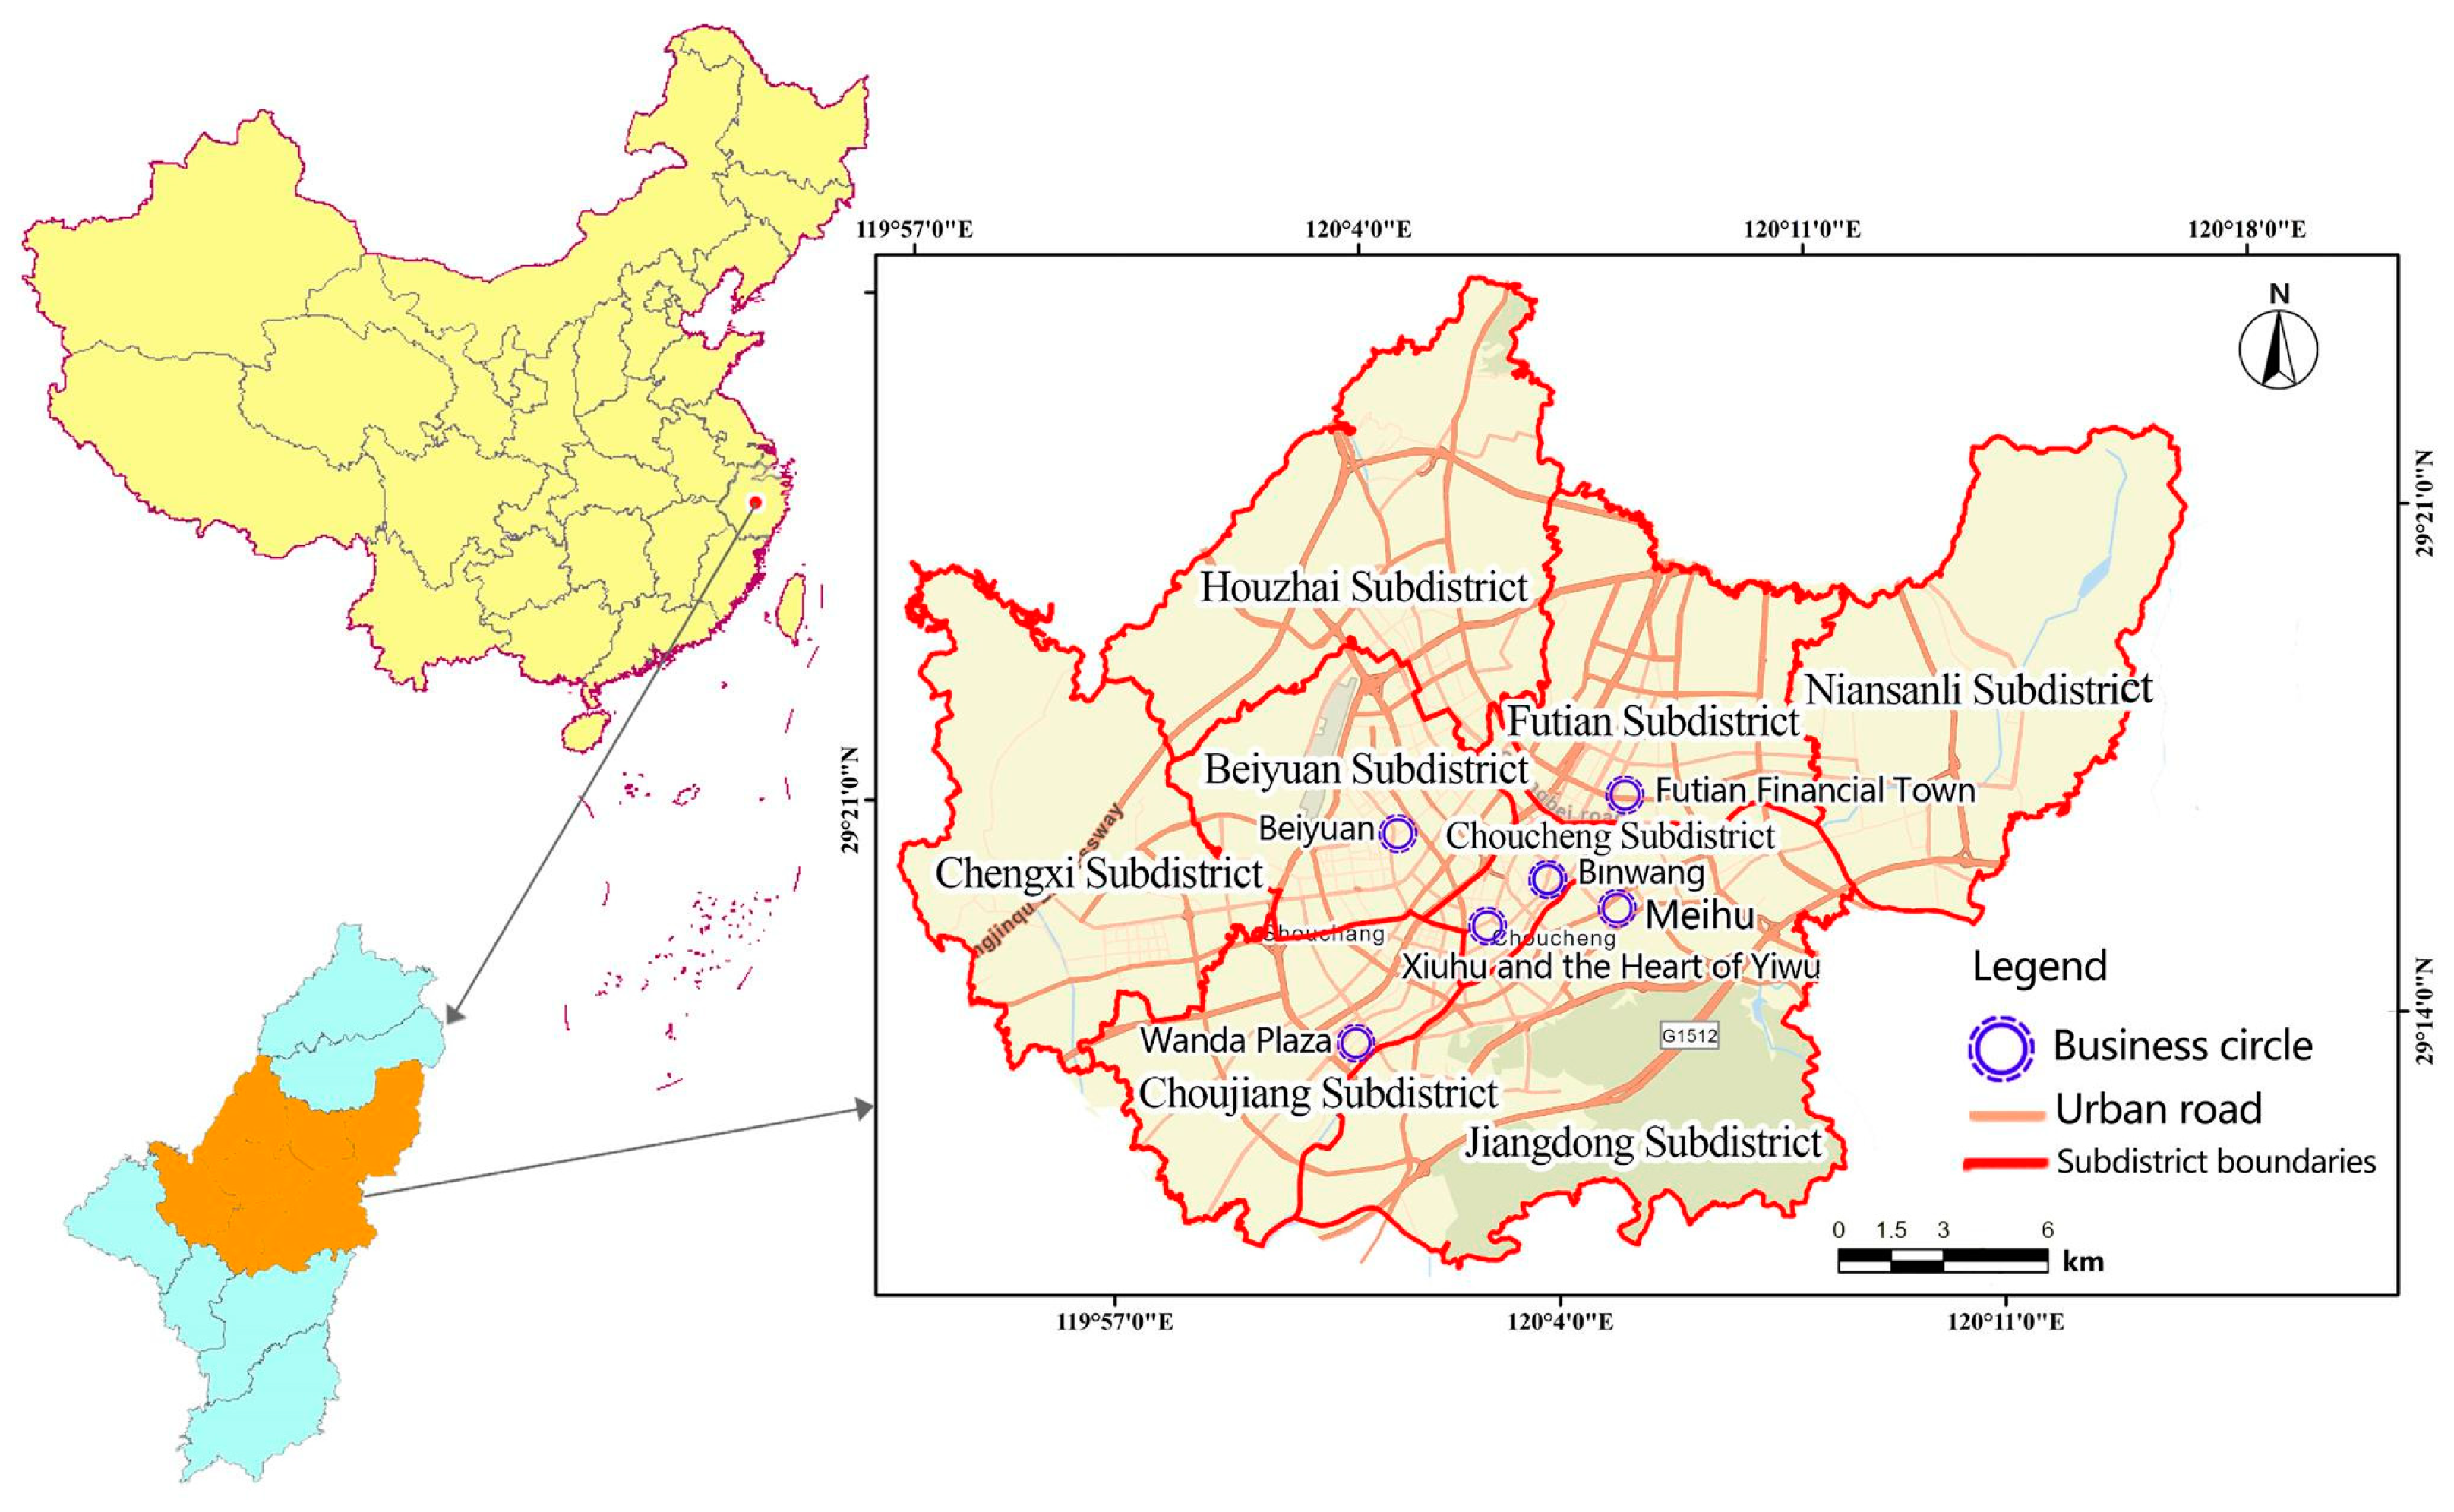
2.1. Study Area Selection

Yiwu city is a county-level city located in the middle of Zhejiang Province, adjacent to Dongyang city in the east, Yongkang city and Wuyi county in the south, Jindong district and Lanxi city in the west, and Pujiang county and Zhuji city in the north. Yiwu city covers a total area of 1105 square kilometres, under the jurisdiction of eight subdistricts (Choucheng, Beiyuan, Choujiang, Jiangdong, Houzhai, Chengxi, Niansanli, and Futian) and six towns (Dachen, Shangxi, Yiting, Fotang, Chian, and Suxi). Yiwu ranks among the top 100 counties in China and is known as an international trade city. It has the largest wholesale market for small commodities in China and is one of the cities with a developed night-time economy in China. According to the Yiwu Comprehensive Administrative Law Enforcement Bureau, there are 49 night markets in Yiwu, with entrepreneurs from home and abroad. The night markets operate in daily consumer goods, clothing, small household appliances, accessories and pendants, audio and video products, and food stalls. As shopping districts are generally found in the main urban area, this paper takes the main urban area of Yiwu (i.e., eight subdistricts) as the main object of study. There are various types of established and emerging shopping districts distributed in the main urban area of Yiwu city (Figure 1).

2.2. Data Sources

2.2.1. Basic Geographic Data

The administrative division map of Yiwu city used in this article comes from the National Geographic Information Resource Database (https://www.webmap.cn/. Accessed on 5 August 2021).

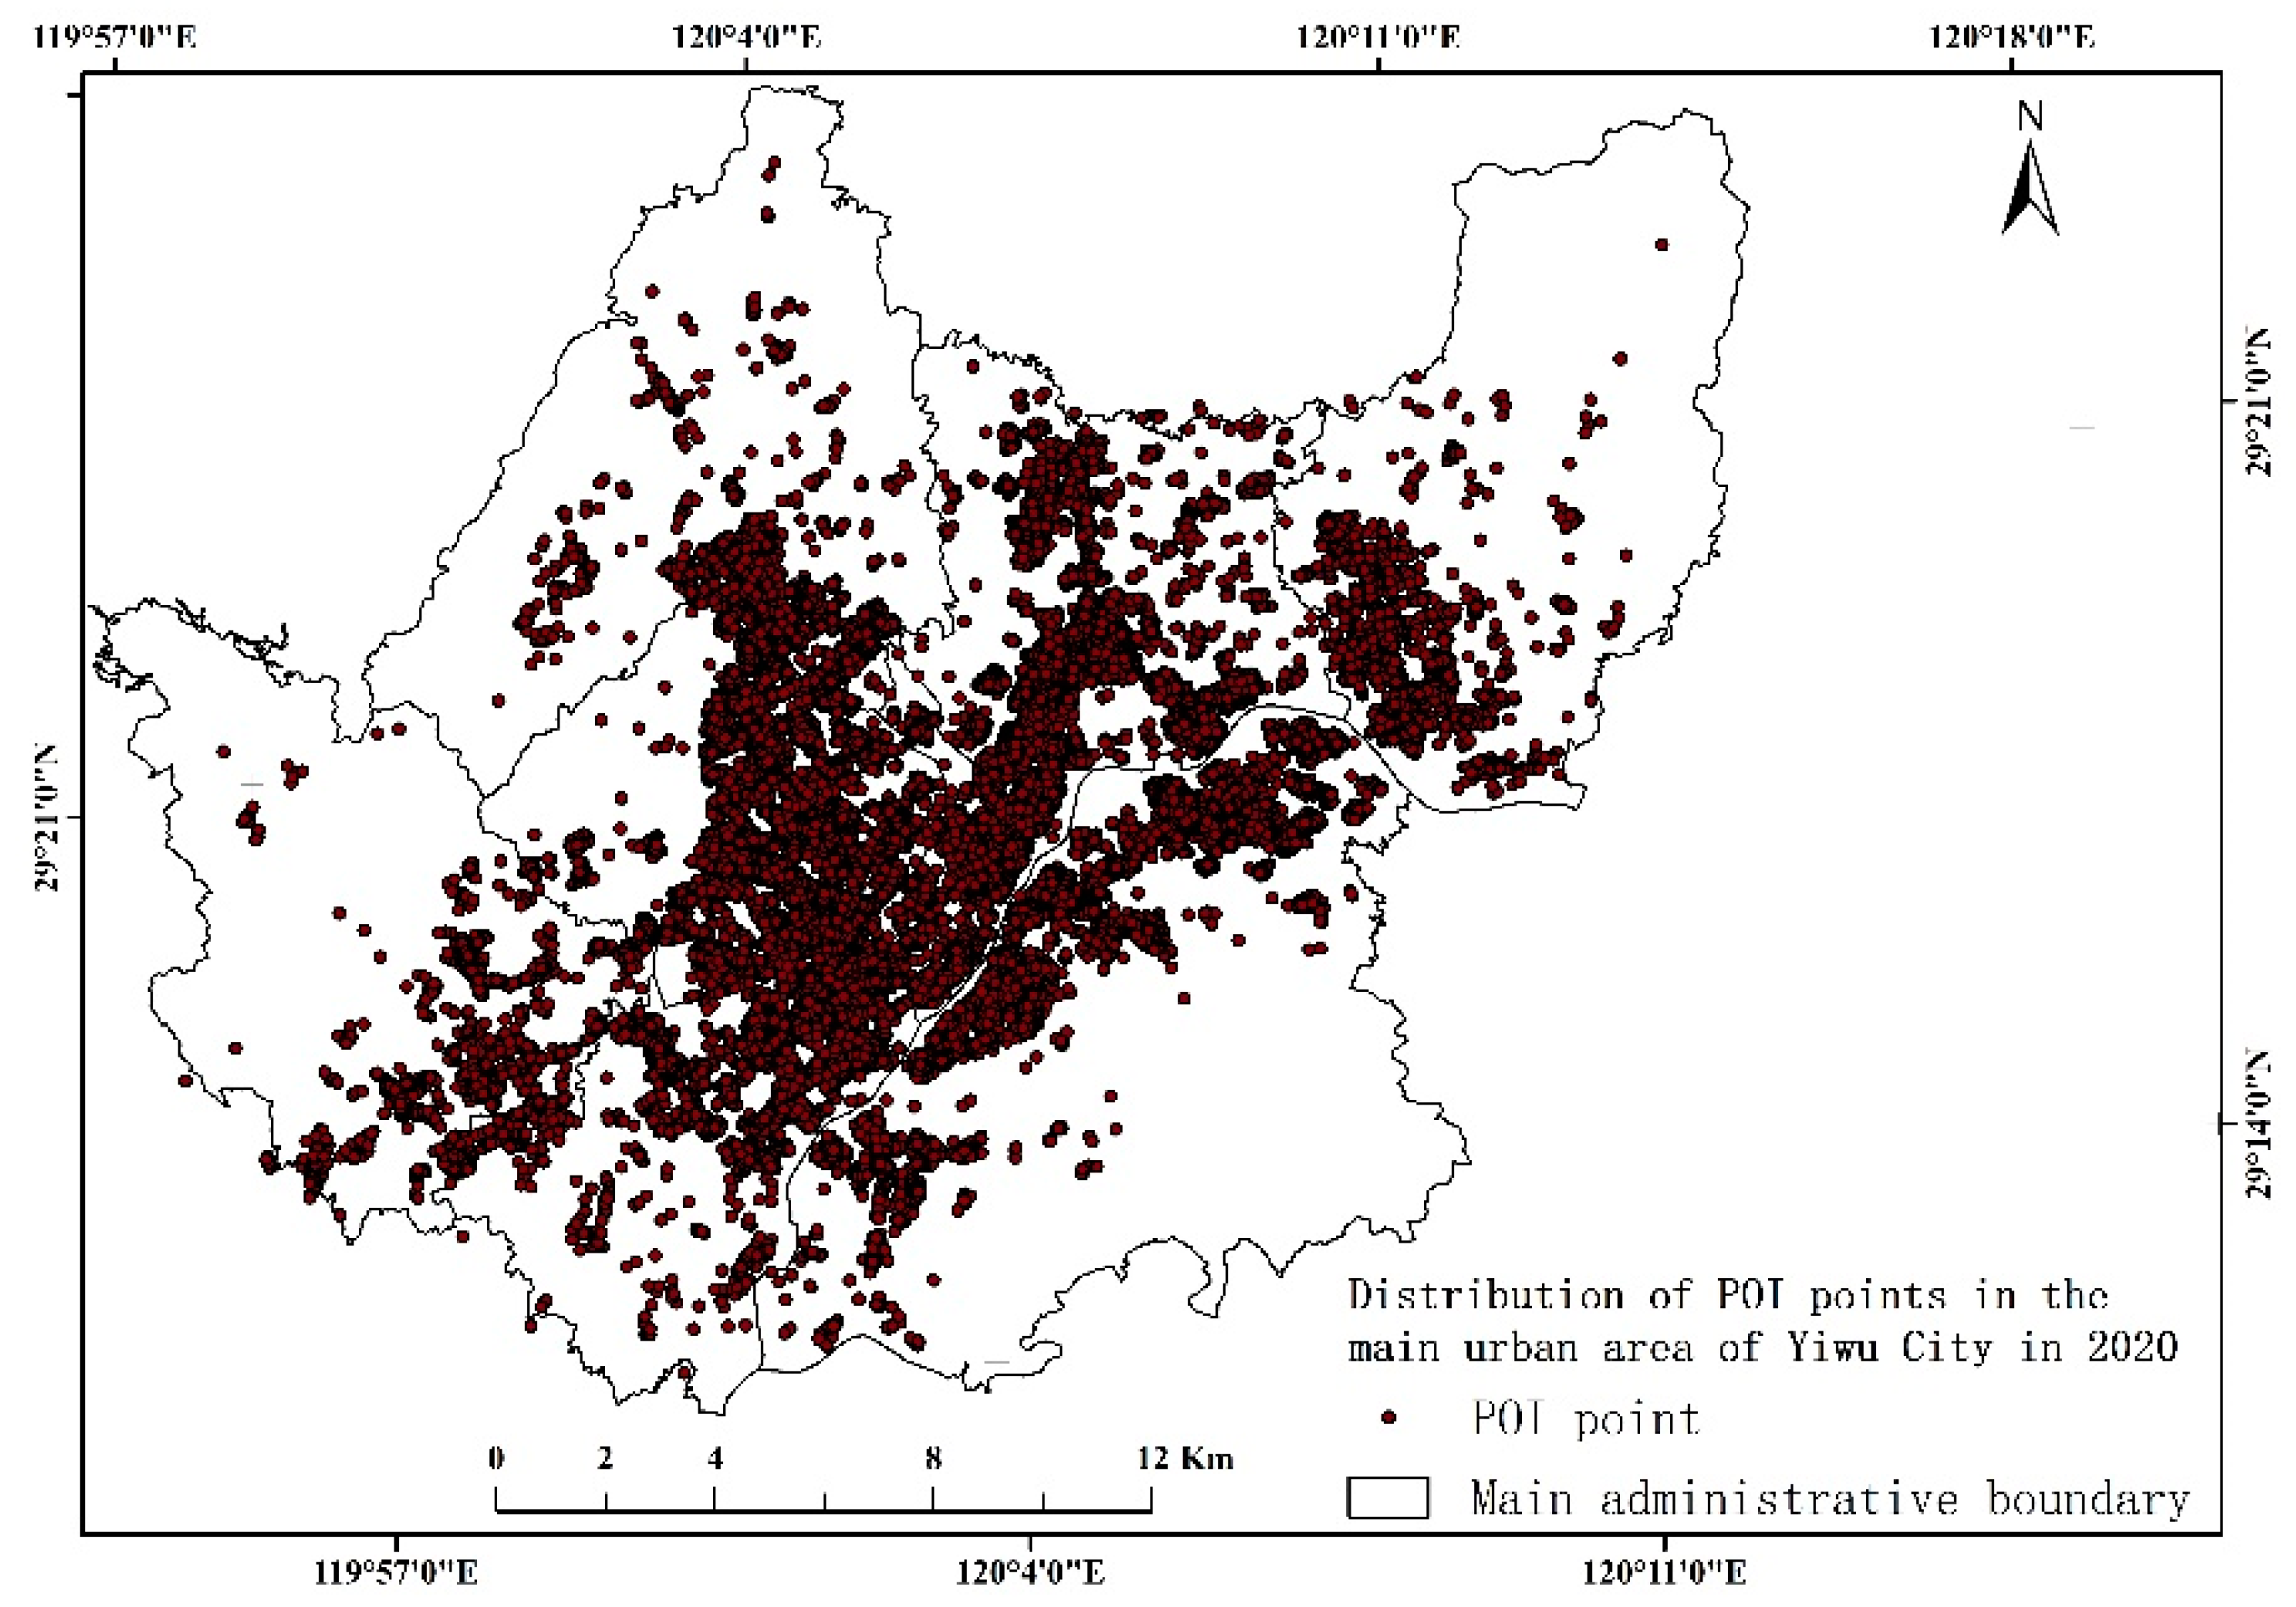
2.2.2. Points of Interest (POI) Data

POIs are widely used geographic big data with high spatial accuracy. They are usually associated with urban functions, urban planning, and population distribution and are widely used in urban research. Each piece of POI data contains rich and valuable object attribute information (such as land-use type, text address, etc.) and spatial location information (such as latitude and longitude, geographic features, etc.). Specific POI types are closely related to human activities. The POI data used in this article come from AutoNavi Map Service, collected through its application program interface, and the acquisition time is 2020. In view of the characteristics of the night-time economy in Yiwu city, POI data were screened and processed from three aspects: shopping, dining, and leisure and entertainment. A total of 84,445 pieces of POI data in the main urban area of Yiwu city were obtained (Figure 2).

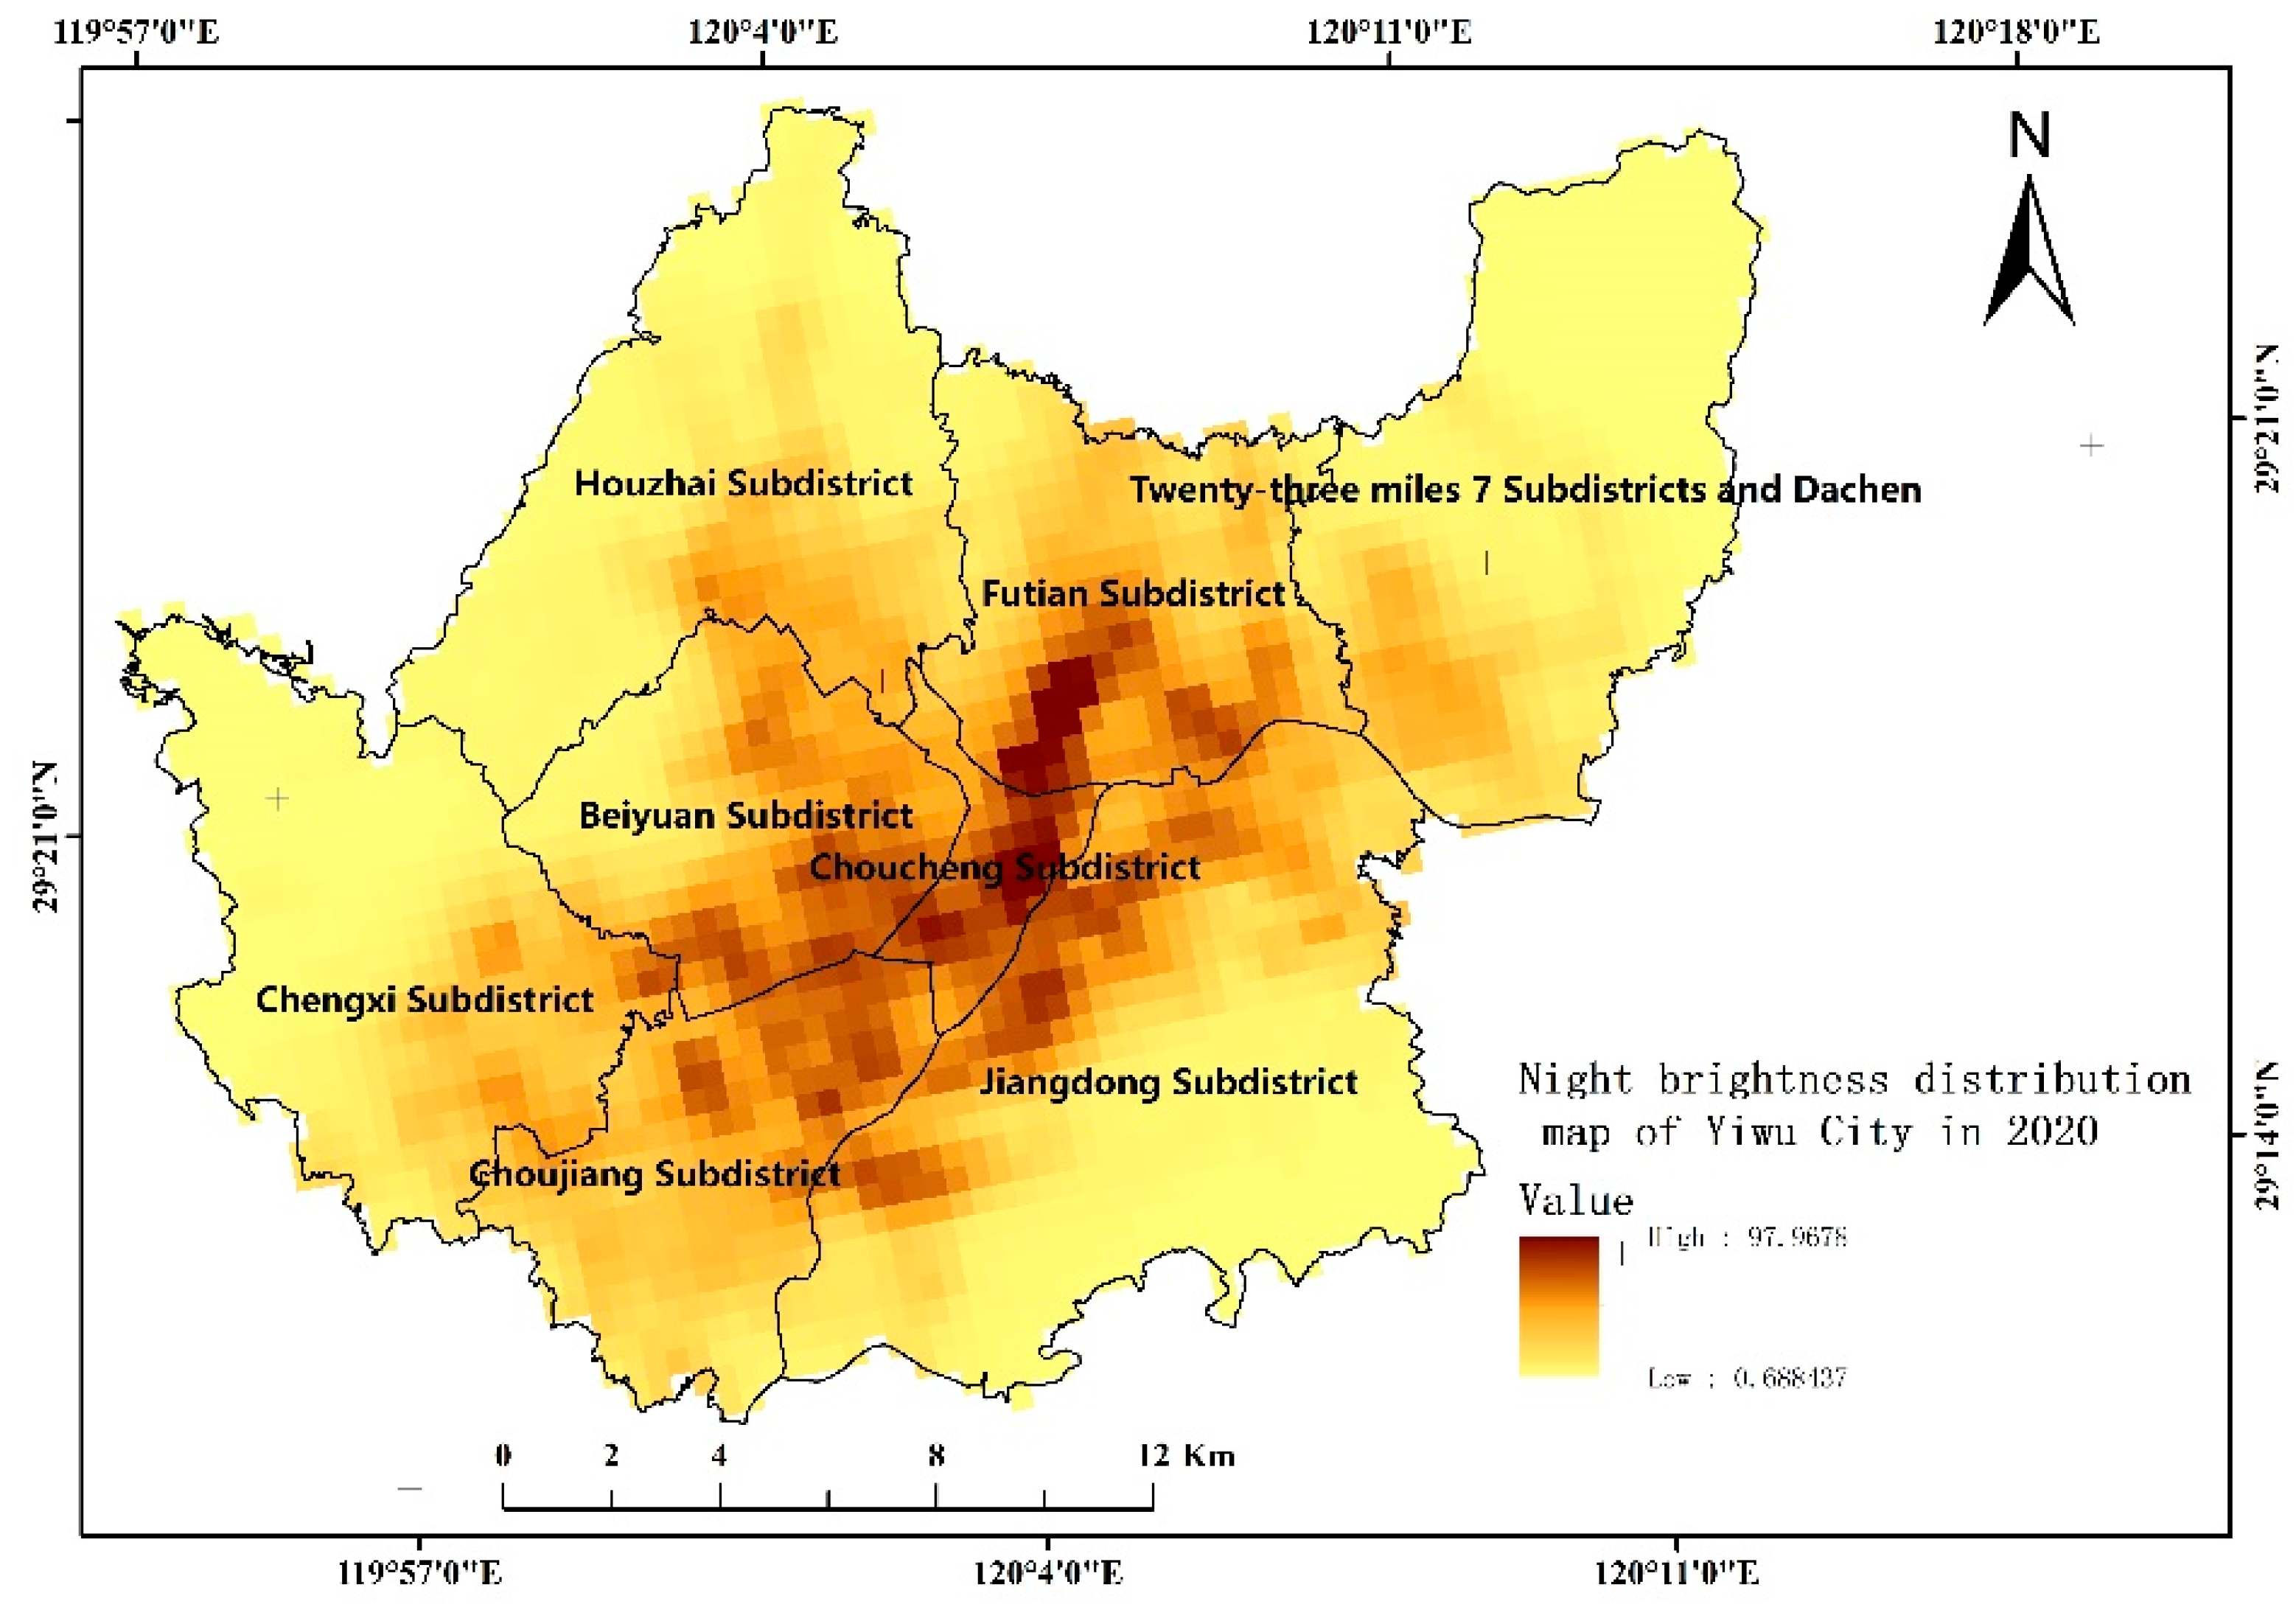
2.2.3. Nighttime Light Remote Sensing Data

The NPP-VIIRS night-time light data come from the National Oceanic and Atmospheric Administration (https://0-doi-org.brum.beds.ac.uk/10.7910/DVN/YGIVCD. Accessed on 7 August 2021). We selected the data from 2015 to 2020 as the basic data of this study. Through cropping and projection transformation processing, the resolution is set to 300 m, and the night-time light data of Yiwu city were obtained (Figure 3). To avoid the influence caused by the deformation of the image grid, the image coordinate system was converted to Lambert projection.

3. Research Methods

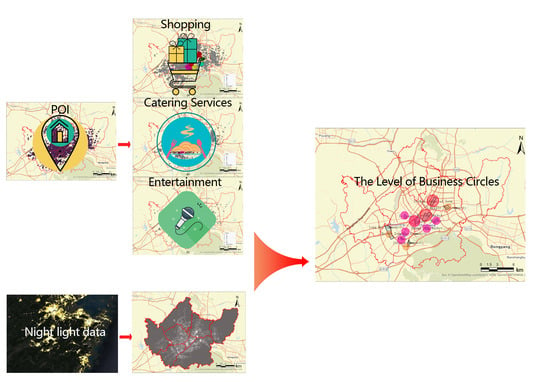
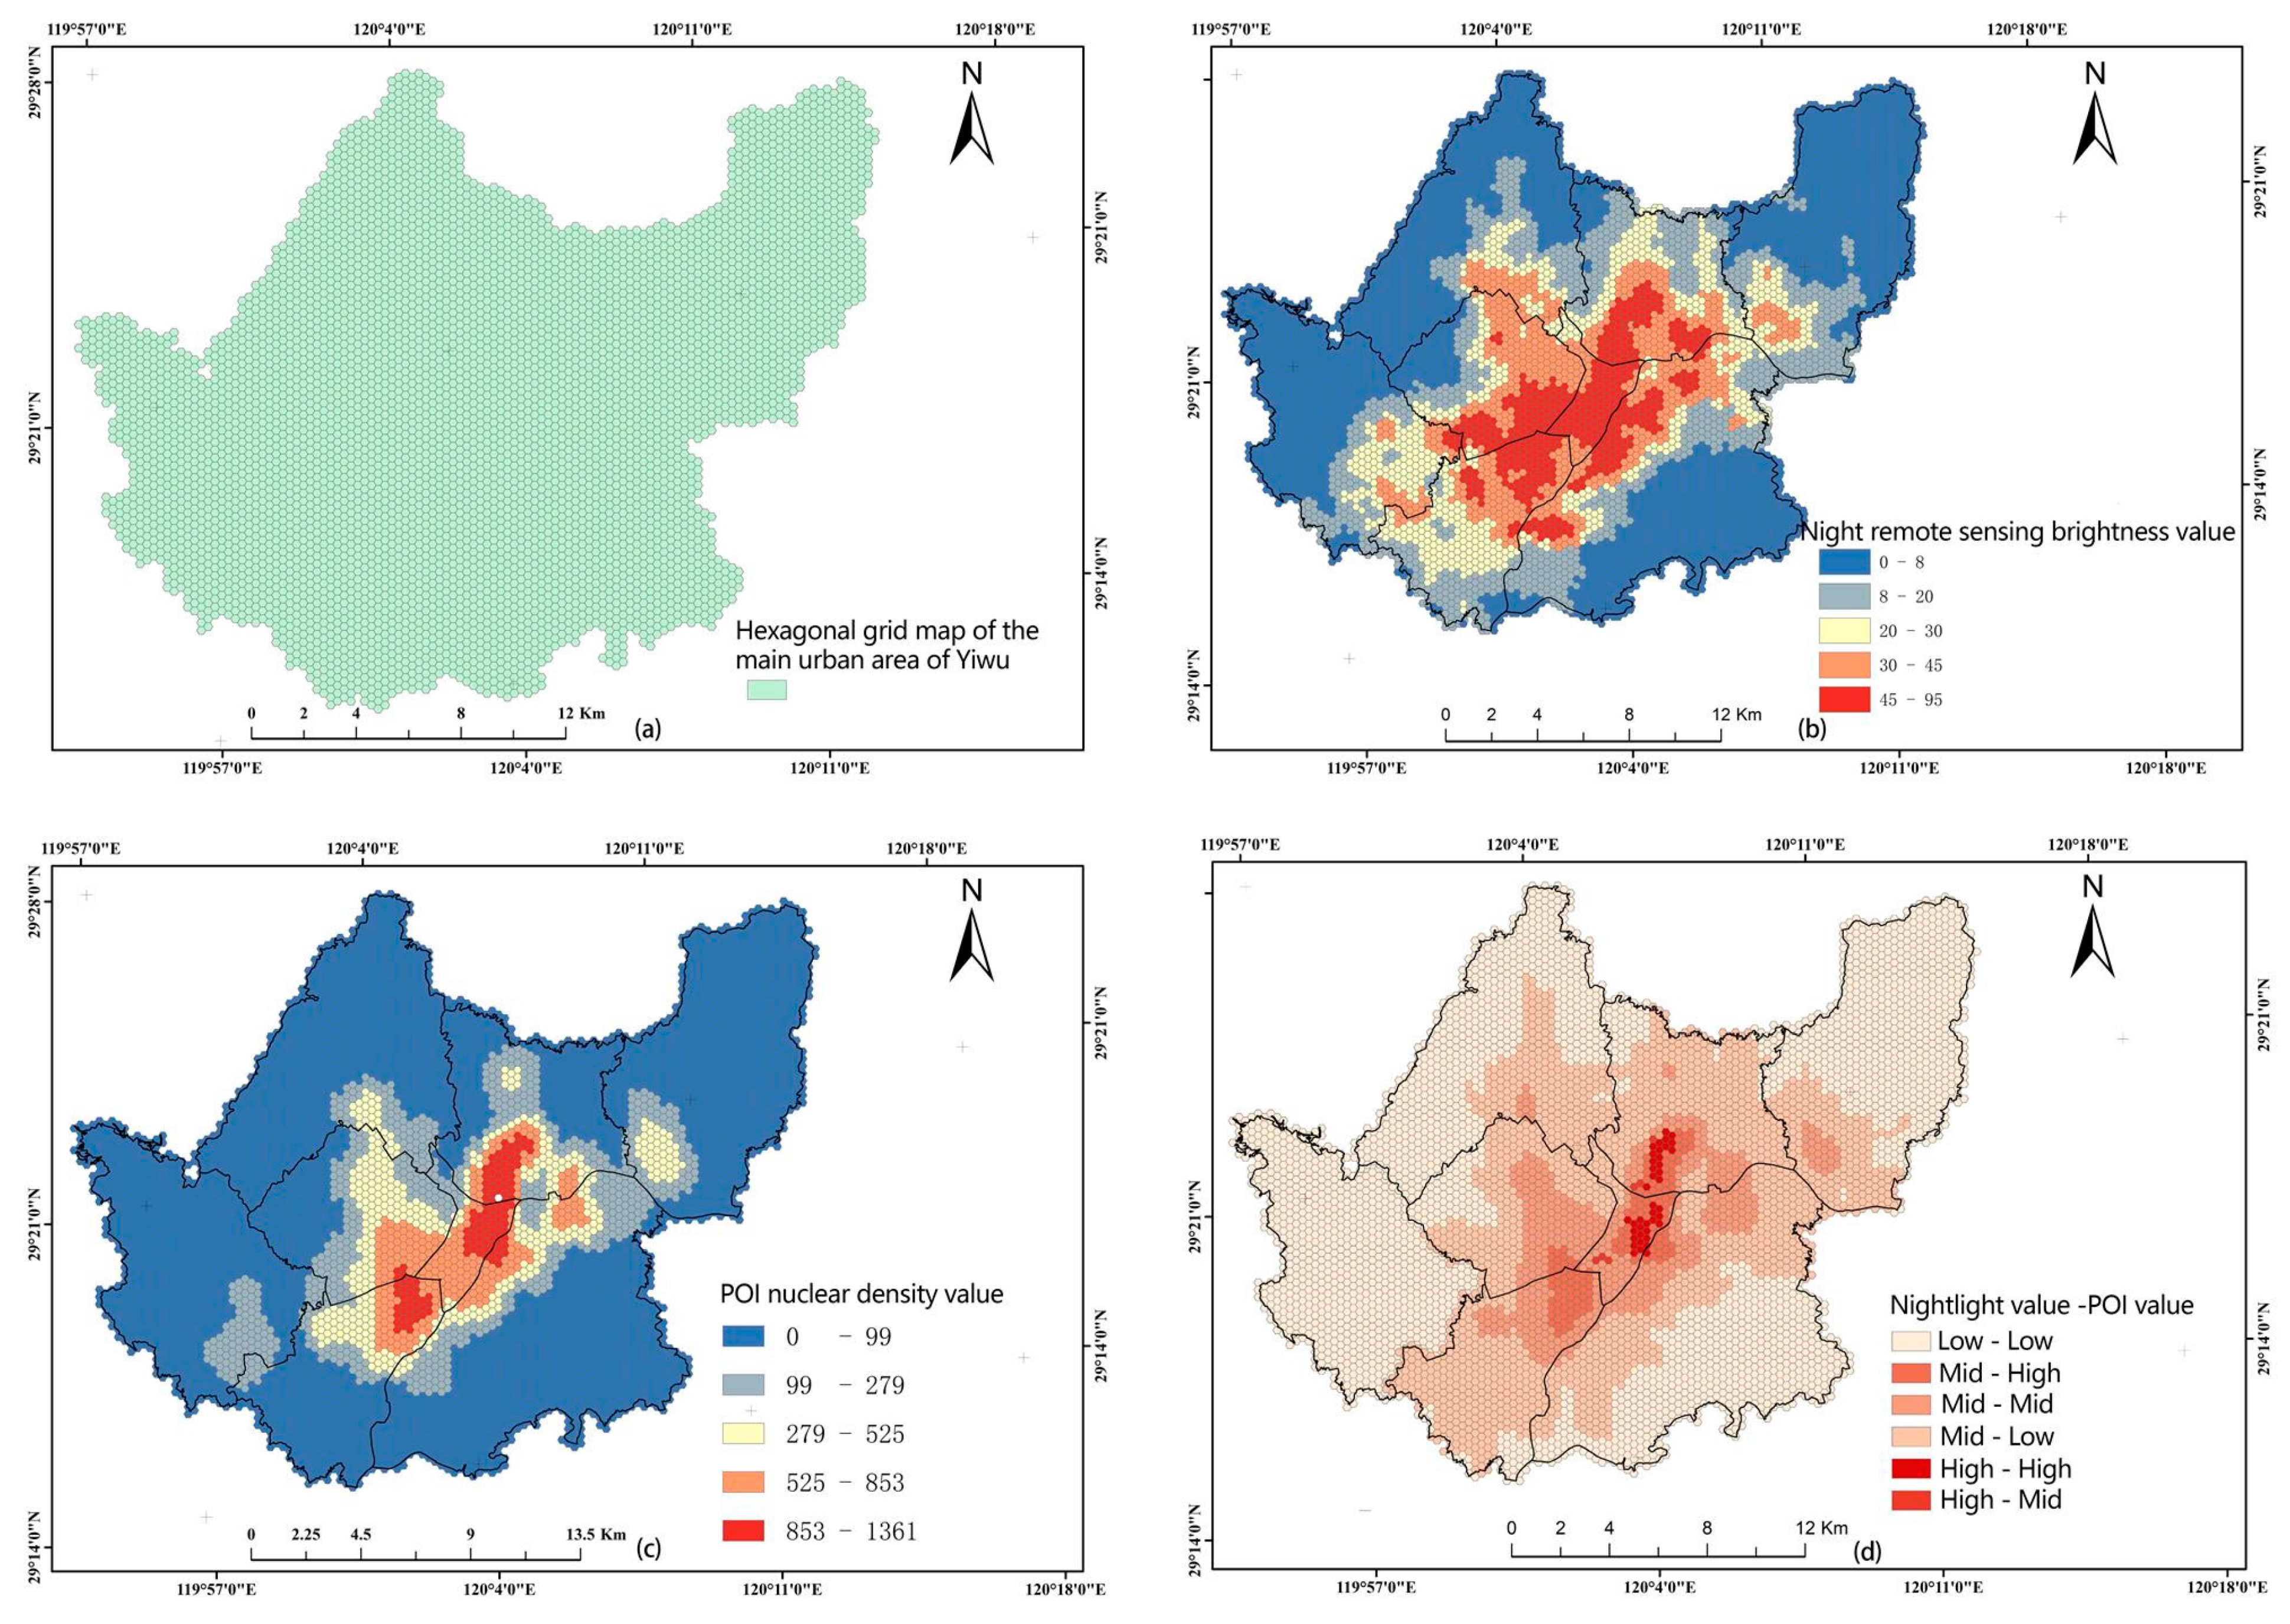
3.1. Two-Factor Mapping

Data gridding refers to the process of transforming point data into surface data through spatial topological relationship analysis [31]. The grids used in the conversion include squares, triangles, and regular hexagons. Since regular hexagonal grids are closer to circles and have richer topological relationships, they have gradually been widely used [32]. Therefore, this paper selects a regular hexagon as the data grid. The radius of the grid was set to 300 m.
The specific steps are as follows: first, a hexagonal grid of the main urban area of Yiwu city was established, and a total of 4882 regular positive hexagonal grids with an area of 0.077 km2 were obtained (Figure 4a). Then, the POI and NPP-VIIRS data were normalised using Formula (1), spatially superimposed and graded with the hexagonal grid map to obtain the night-time light remote sensing brightness hexagonal grid map (Figure 4b) and the POI kernel density hexagonal grid map (Figure 4c), respectively.
x = x x m i n x m a x x m i n
where x represents the normalised value, x is the original value, x m i n is the minimum value, and x m a x is the maximum value.
Next, the standard deviation grading method was divided into high, medium, and low levels according to the ±1.5 times standard deviation commonly used as the grading boundary. The spatial superimposition relationship between night-time light remote sensing data and POI data kernel density values in the main urban area of Yiwu city in 2020 was obtained by using the combined mapping of dual-attribute relationships (Figure 4d).
Figure 4d show that the regions with the same spatial superimposition relationship (low–low, medium–medium, high–high) account for the largest proportion, and the overall coupling result presents an obvious circular structure. The high–high coupling relationship was concentrated in the downtown area, namely, near the Yiwu Global Commodity Market on Futian Subdistrict and the surrounding area of Binwang Market. The high–middle coupling was concentrated only in a dotted pattern in the area around the Choucheng Subdistrict, Xiuhu and the Heart of Yiwu shopping mall; the medium–high coupling appears around the Rattlesnake Mall in Niansanli Subdistrict, on both sides of Shangbo Road in Jiangdong Subdistrict and Futian Subdistrict, around the area along Beicun Road in Choujiang Subdistrict and Beiyuan Subdistrict, and around the area along North Fulongshan Road in Chengxi Subdistrict, which corresponds to the downtown area of each Subdistrict. Further outwards, the other vast areas are in a medium–middle and low–low coupling relationship. This shows that the night-time light remote sensing data of the main urban area of Yiwu city have a good spatial superimposition relationship with the POI data.

3.2. Kernel Density Analysis Method

The kernel density analysis was performed by calculating the density of point elements around each output raster element, determining the minor surfaces from the boundary parameters, point weights and kernel functions. Each point corresponds to a minor surface. Overlapping minor surface values were accumulated to form a major surface, and the major surface values were normalised to produce the kernel density, thus visualising the degree of aggregation and spatial distribution of each data point in the study area. The kernel density was calculated as follows [19,24,26,43]:
f ( x ) = 1 n h i = 1 n K n ( x i x h )
where f ( x ) is the kernel density estimation function at x in the research space, K is the space weight function value, h is the search interval threshold of the kernel density function, n is the number of samples, and x i x is the sample point x to the spatial distance of the sample point x i .
This paper used kernel density analysis software in the ArcGIS Pro spatial analysis tool to analyse the kernel density of POI data points in a fixed area. Relevant studies have shown that the choice of bandwidth h has an important impact on the results of nuclear density analysis [33,44,45]. A smaller bandwidth is suitable for reflecting local changes in the density distribution, while a larger bandwidth can effectively reflect the spatial changes of the global scale. After considering the spatial resolution of the luminous remote sensing data and conducting many experiments, 1500 m was selected as the bandwidth of the POI kernel density analysis, and the spatial resolution was set to 300 m. Finally, the grid result of the POI kernel density analysis in the main urban area of Yiwu city was obtained (Figure 5).

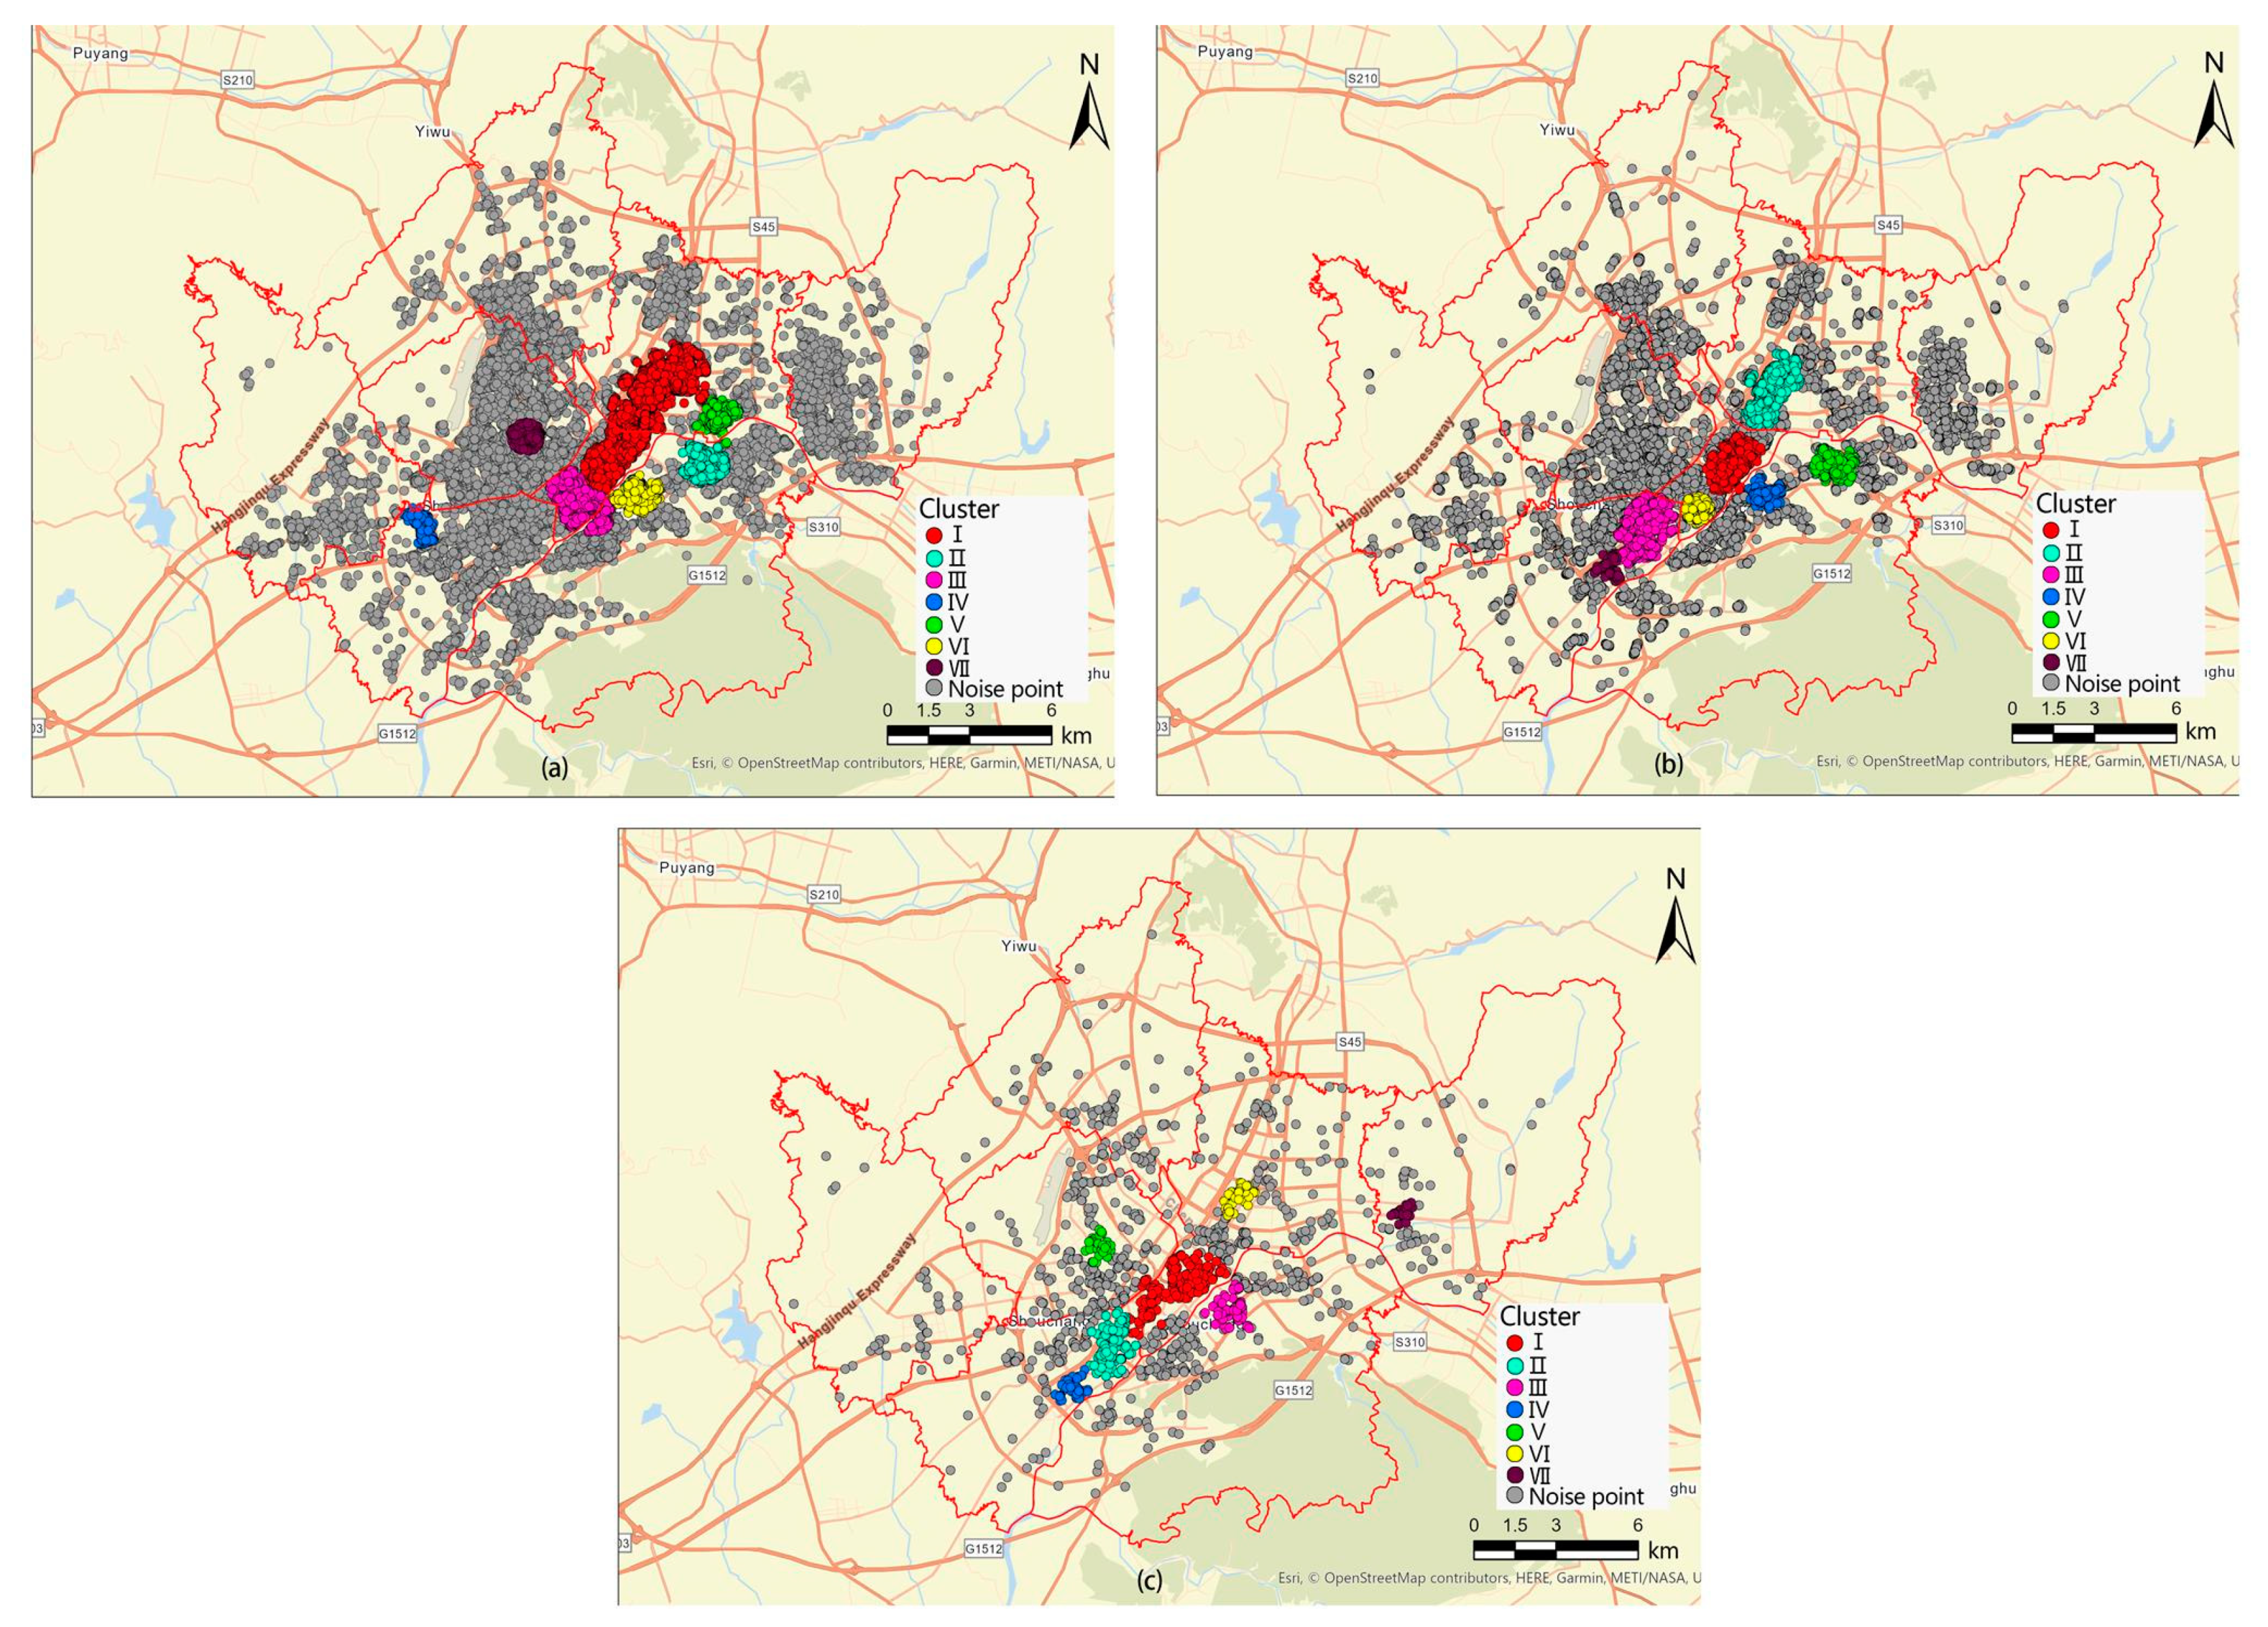
3.3. DBSCAN Clustering Method

Computer crawler technology was used to collect data on the business formats related to the night-time economy in the main urban area of Yiwu city (Table 1). Business types such as shopping malls, night markets, supermarkets, convenience stores, restaurants, and leisure and entertainment venues were selected, and the kernel density values of the distribution of each business were calculated in turn (Table 2). Using the DBSCAN clustering algorithm, and referring to the adaptive parameter selection algorithm [46,47,48], when the step length was set to 500 m, according to the POI distribution of different types of business, the shopping POI minimum element class was set to 1000, the catering service POI was set to 450, the entertainment and leisure POI was set to 40, the clustering effect was ideal. Each type of business had seven clusters and the boundary between each cluster was clear (Figure 5).
Figure 5 show the following: (1) There is a certain gradient effect in the spatial layout of shopping malls in Yiwu city. The two streets of Choucheng and Choujiang are highly concentrated, and the gradient of the surrounding streets is reduced. From the business circle of Futian Financial Town along Chouzhou North Road and Gongong North Road to Yidong Road, there are densely distributed shopping malls. (2) The catering industry in Yiwu has a band-like distribution in its spatial layout. It is mainly distributed along the areas on both sides of the axis of several main roads from northeast to southwest. It should be noted that foreign businessmen account for a large proportion of the business population in Yiwu city, mainly from the Middle East, East Asia, South Asia, South America, and other regions. The agglomeration of foreign businessmen has also brought a gathering of catering. For example, halal restaurants are mainly concentrated in the Binwang Business circle and Wuai Community; the highest nuclear density of Korean restaurants appears in the Nanyuan Community, Jiangdong Subdistrict. (3) Although the leisure and entertainment industry in Yiwu city has a strip-like distribution in the spatial layout, it is also arranged along the axis of several main roads from northeast to southwest. Still, there is a relatively obvious separation in the middle. As a city of business, most business activities between businessmen are carried out in leisure places. Business negotiations take a certain amount of time. After a whole day of intensive investigations, they will continue to negotiate at leisure places at night to eliminate tiredness. Therefore, the night lights in leisure and entertainment venues are relatively eye-catching.
The spatial distribution of the various abovementioned types of businesses in the main urban area of Yiwu city has obvious heterogeneity: comprehensive shopping malls present a multicentre distribution pattern and have a hierarchical relationship. At the same time, professional catering and leisure entertainment are located close to urban residential areas and different ethnic settlements have their own characteristics.

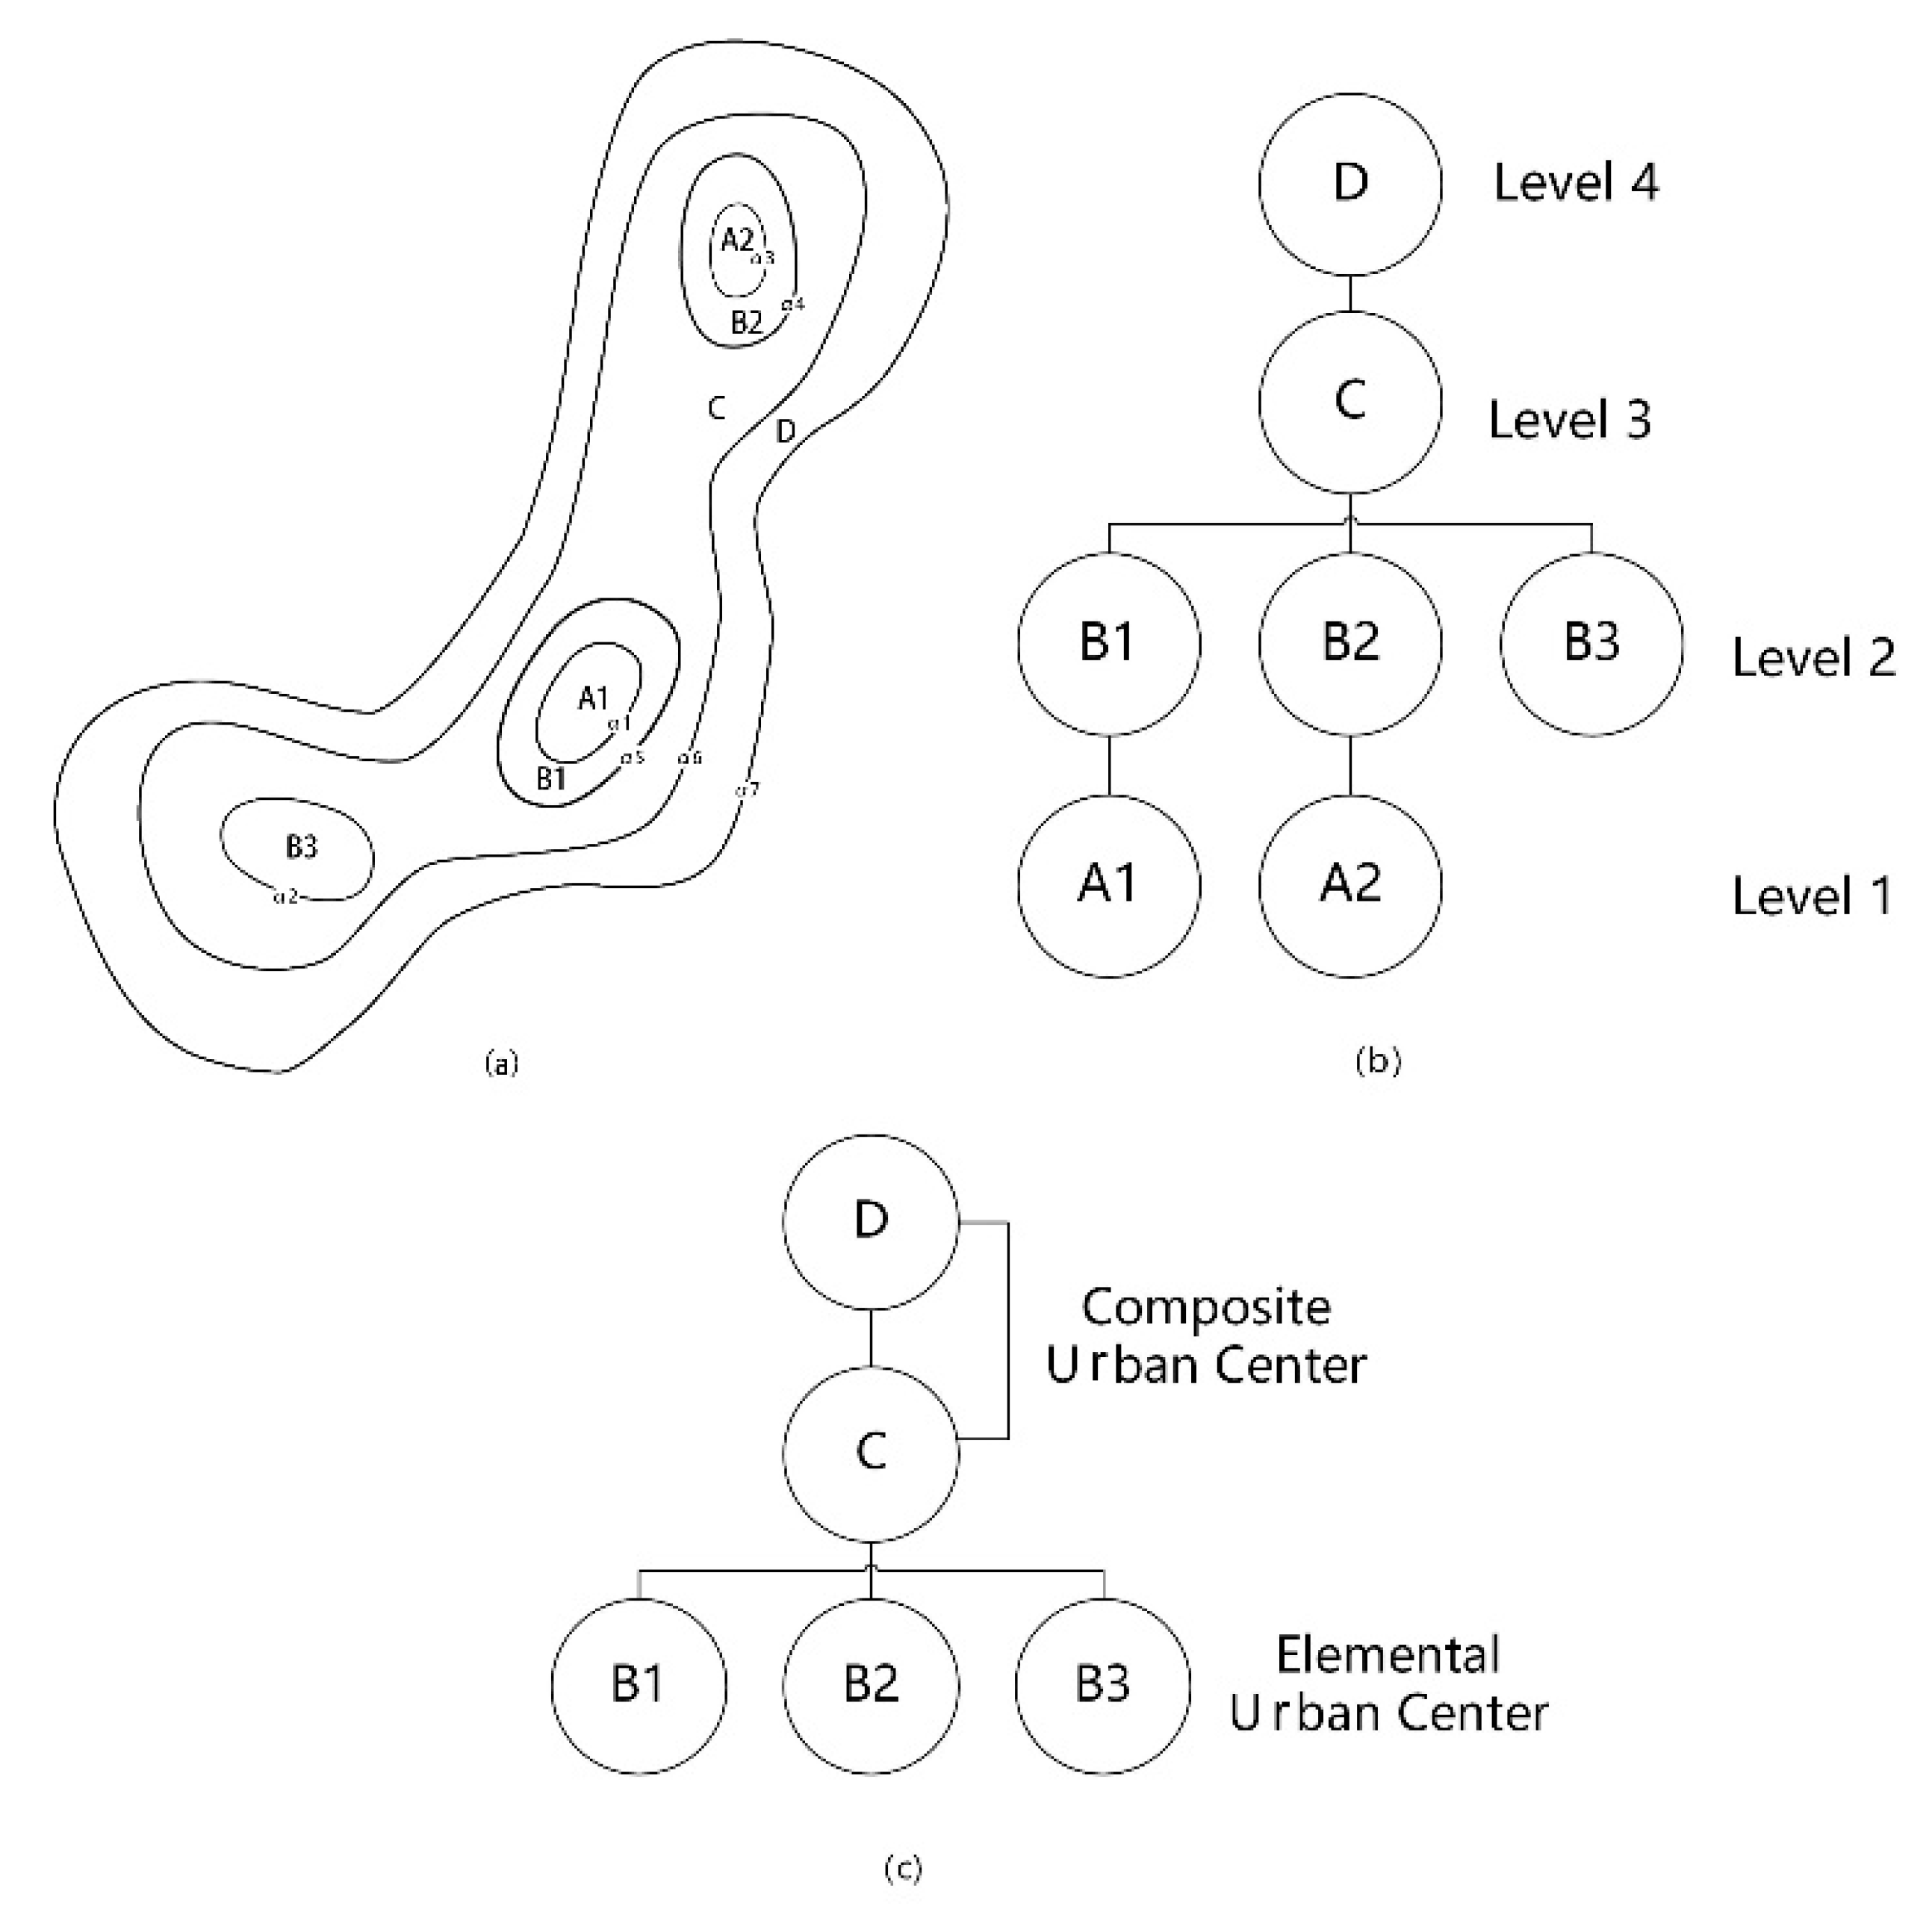
3.4. Local Contour Tree Method

The spatial hierarchical structure can be identified using the local contour tree method. The algorithm includes three steps: locating the “seed” contour, generating a local contour tree, and simplifying the contour tree. As shown in Figure 6a, the highest value contours α1, α2, and α3 of the local area are used as “seed” contours, and then regular contours are continuously constructed outwards until the contours α7. In the same way, the contours formed by the expansion of other seeds are constructed to generate a local contour tree (Figure 6b). According to whether there are branches, the hierarchy is divided to highlight the differences within the tree’s hierarchy (Figure 6c). A1 and A2 are first-level nodes, B1, B2, and B3 are second-level nodes. First-level and second-level nodes are regarded as urban centres, and third-level and above nodes are composite urban centres. This sample area has three basic urban centres (B1, B2, and B3), which are contained in a larger composite urban centre (C).

4. Results

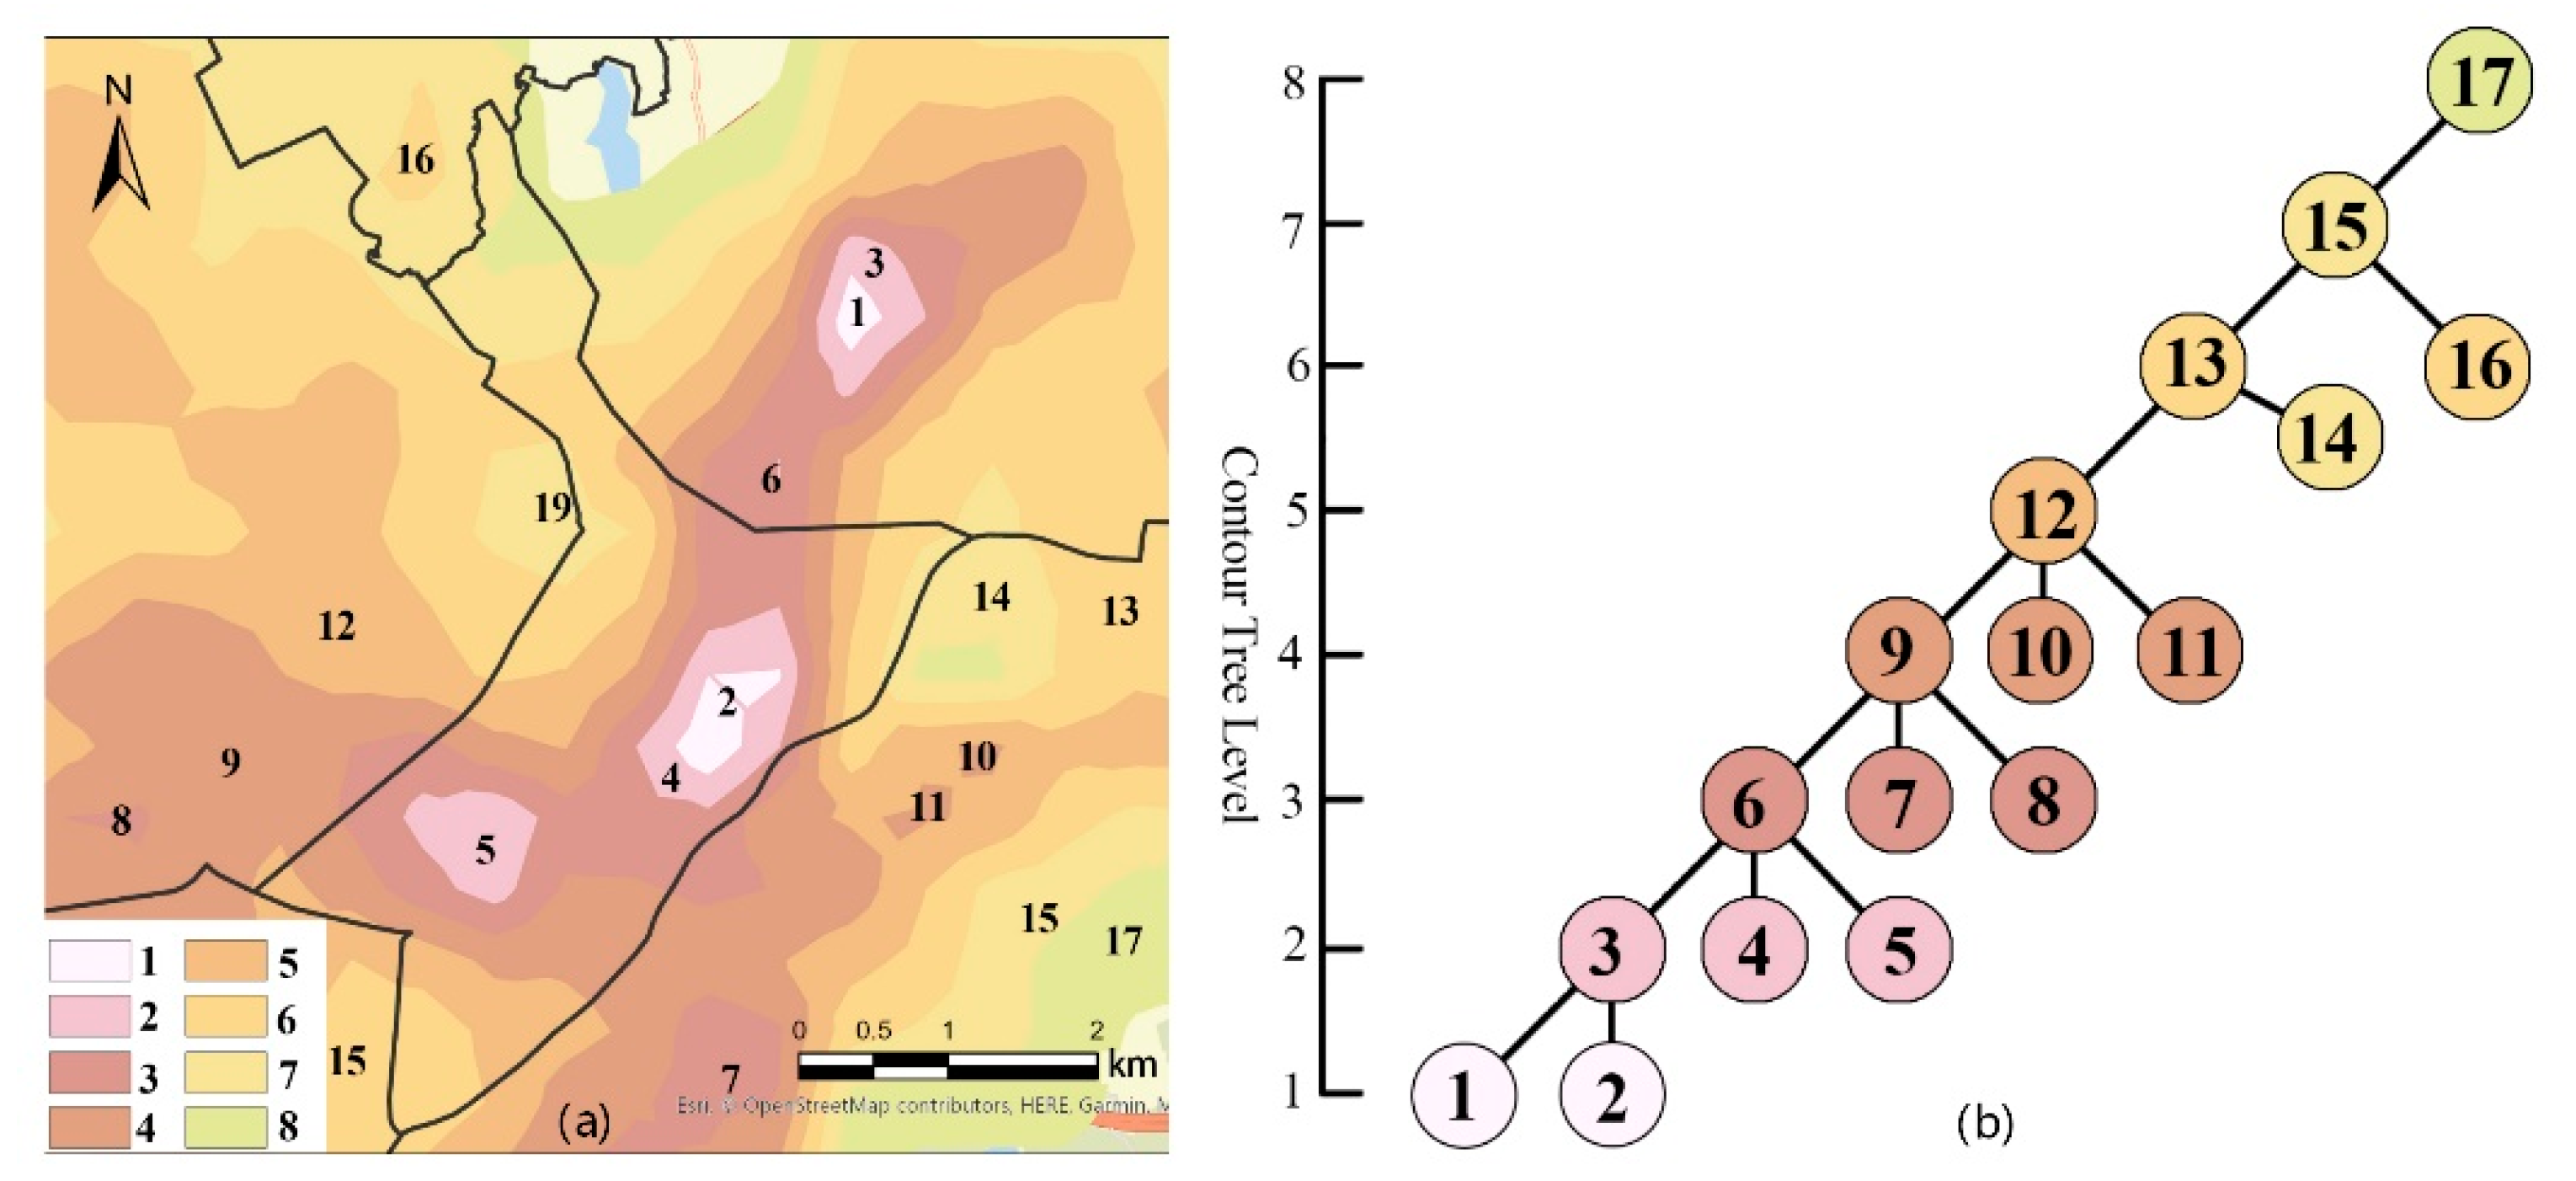
4.1. Obtain the Local Contour Tree

According to the local contour tree algorithm, based on the preprocessed night-time light data, the contour tree map (Figure 7) was generated. The multicentre structure of the main contour tree A, which is the largest in the main urban area of Yiwu city, was obtained. Figure 7 is the contour line of the main tree A and a nested hierarchical structure of 17 nodes and 8 levels of the main tree A. Only the first five levels of nodes are discussed here to illustrate the nested hierarchical structure. Nodes 1 and 2 represent two independent basic urban centres. Nodes 3 and 4 have nested nodes 1 and 2 in the city centre of level 2, respectively. Node 5 is also in the second-level city centre, and it forms a separate contour. Node 6 at level 3 is a complex urban centre composed of broader and more complex elements. Nodes 7 and 8 are in the same level 3 city centre because they each form an independent contour. However, judging from the area enclosed by the contour, it is obvious that the centre formed by node 7 is larger. Node 9 at level 4 is a complex urban centre composed of broader and more complex elements. It is nested by the city centre (nodes 5, 7, 8) and the compound city centre (node 6). Nodes 10 and 11 are in the same level 4 city centre. Similarly, the multicity centre formed by fifth-level node 12 can be regarded as the most complex composite city centre in this empirical study. Seven basic urban centres and five composite urban centres are nested on different levels and spatial scales.
In 2020, due to the impact of the pandemic, noctilucent intensity in the business circle was mostly lower than that in 2019, and the urban road network was basically stable in recent years. Therefore, POI data and night-time light data in 2019 were selected to identify the approximate scope of the business circle, and then the night-time light brightness values in 2015, 2017, and 2020 were calculated. Figure 8a show the urban centre detected by the contour tree algorithm using night-time light data in 2019, where the “seed” contour coincides with the real city business circles. The authors superimposed the results of the kernel density analysis and the “seed” contour analysis, extracted the hotspot distribution area common to the two data, initially identified the range of the night business circles, and finally performed it based on the actual spatial boundaries such as remote sensing images and urban traffic road boundary data. Fine-tuning, in-depth screening of the night business circles identified in the previous step, and finally a clear location and clear boundary of the night business circles.

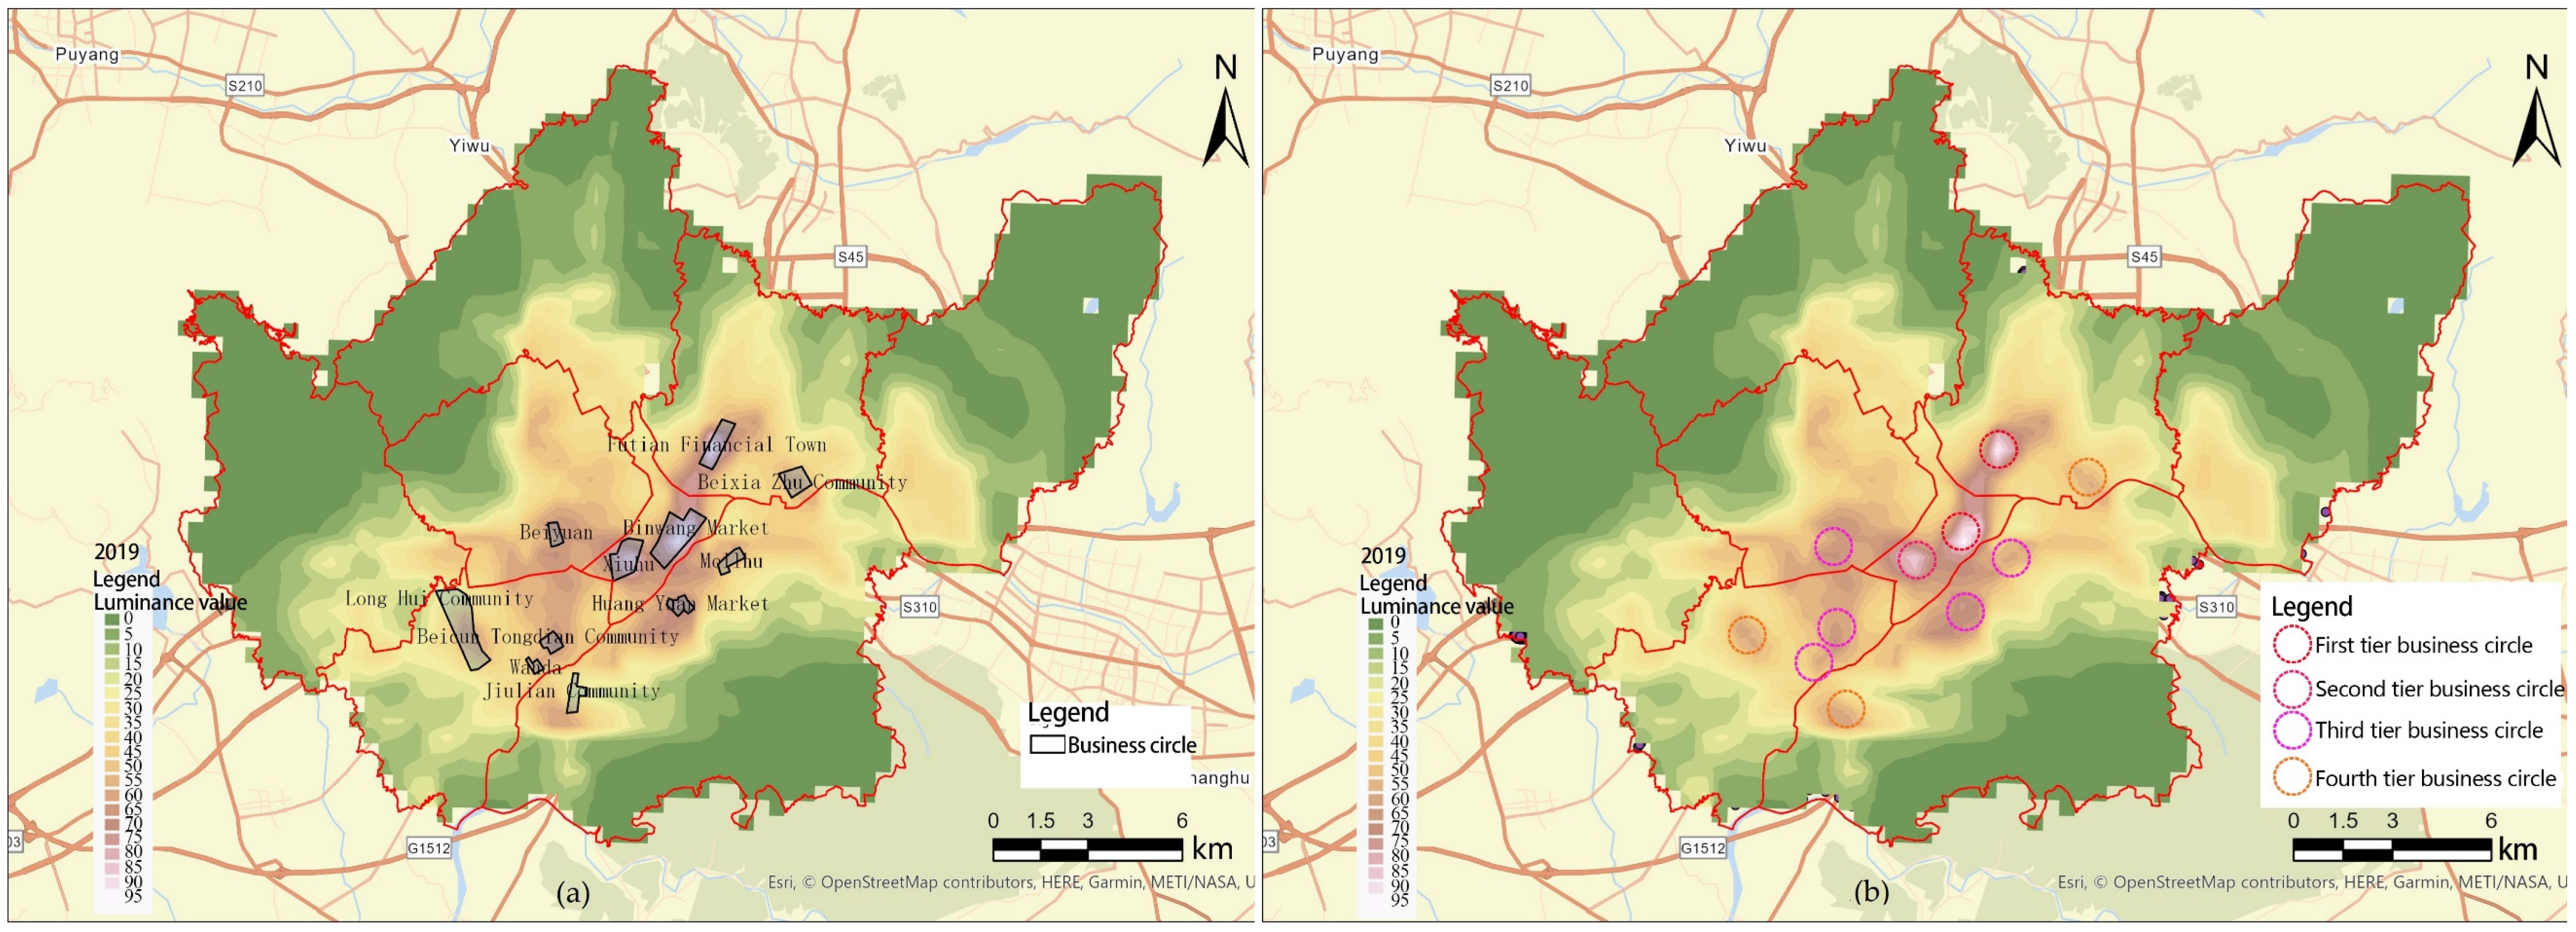
4.2. Dividing the Spatial Agglomeration Levels of Business Circle Elements

At this stage, there were tiered differences in the popularity of the business circle in the streets of Yiwu city. With the help of the night-time light index, it can be roughly divided into four levels at the spatial scale (Table 3, Figure 8b). Among them, Binwang Business circle and Futian Financial Town have the highest brightness and are the first-tier business circles; the second-tier business circles are Xiuhu and the Heart of Yiwu shopping mall business circle; the third-tier is the Huangyuan business circle, Beicun Tongdian Community business circle, Beiyuan business circle, Wanda Plaza business circle, and Meihu business circle; the fourth-tier includes business circles such as the Beixiazhu Community business circle, Longhui Community business circle, and Jiulian Community business circle, which show agglomeration characteristics but not obvious brightness. The overall brightness presents a trend from bright to dark at both ends of the main road from the city centre to the east and west.

5. Discussion

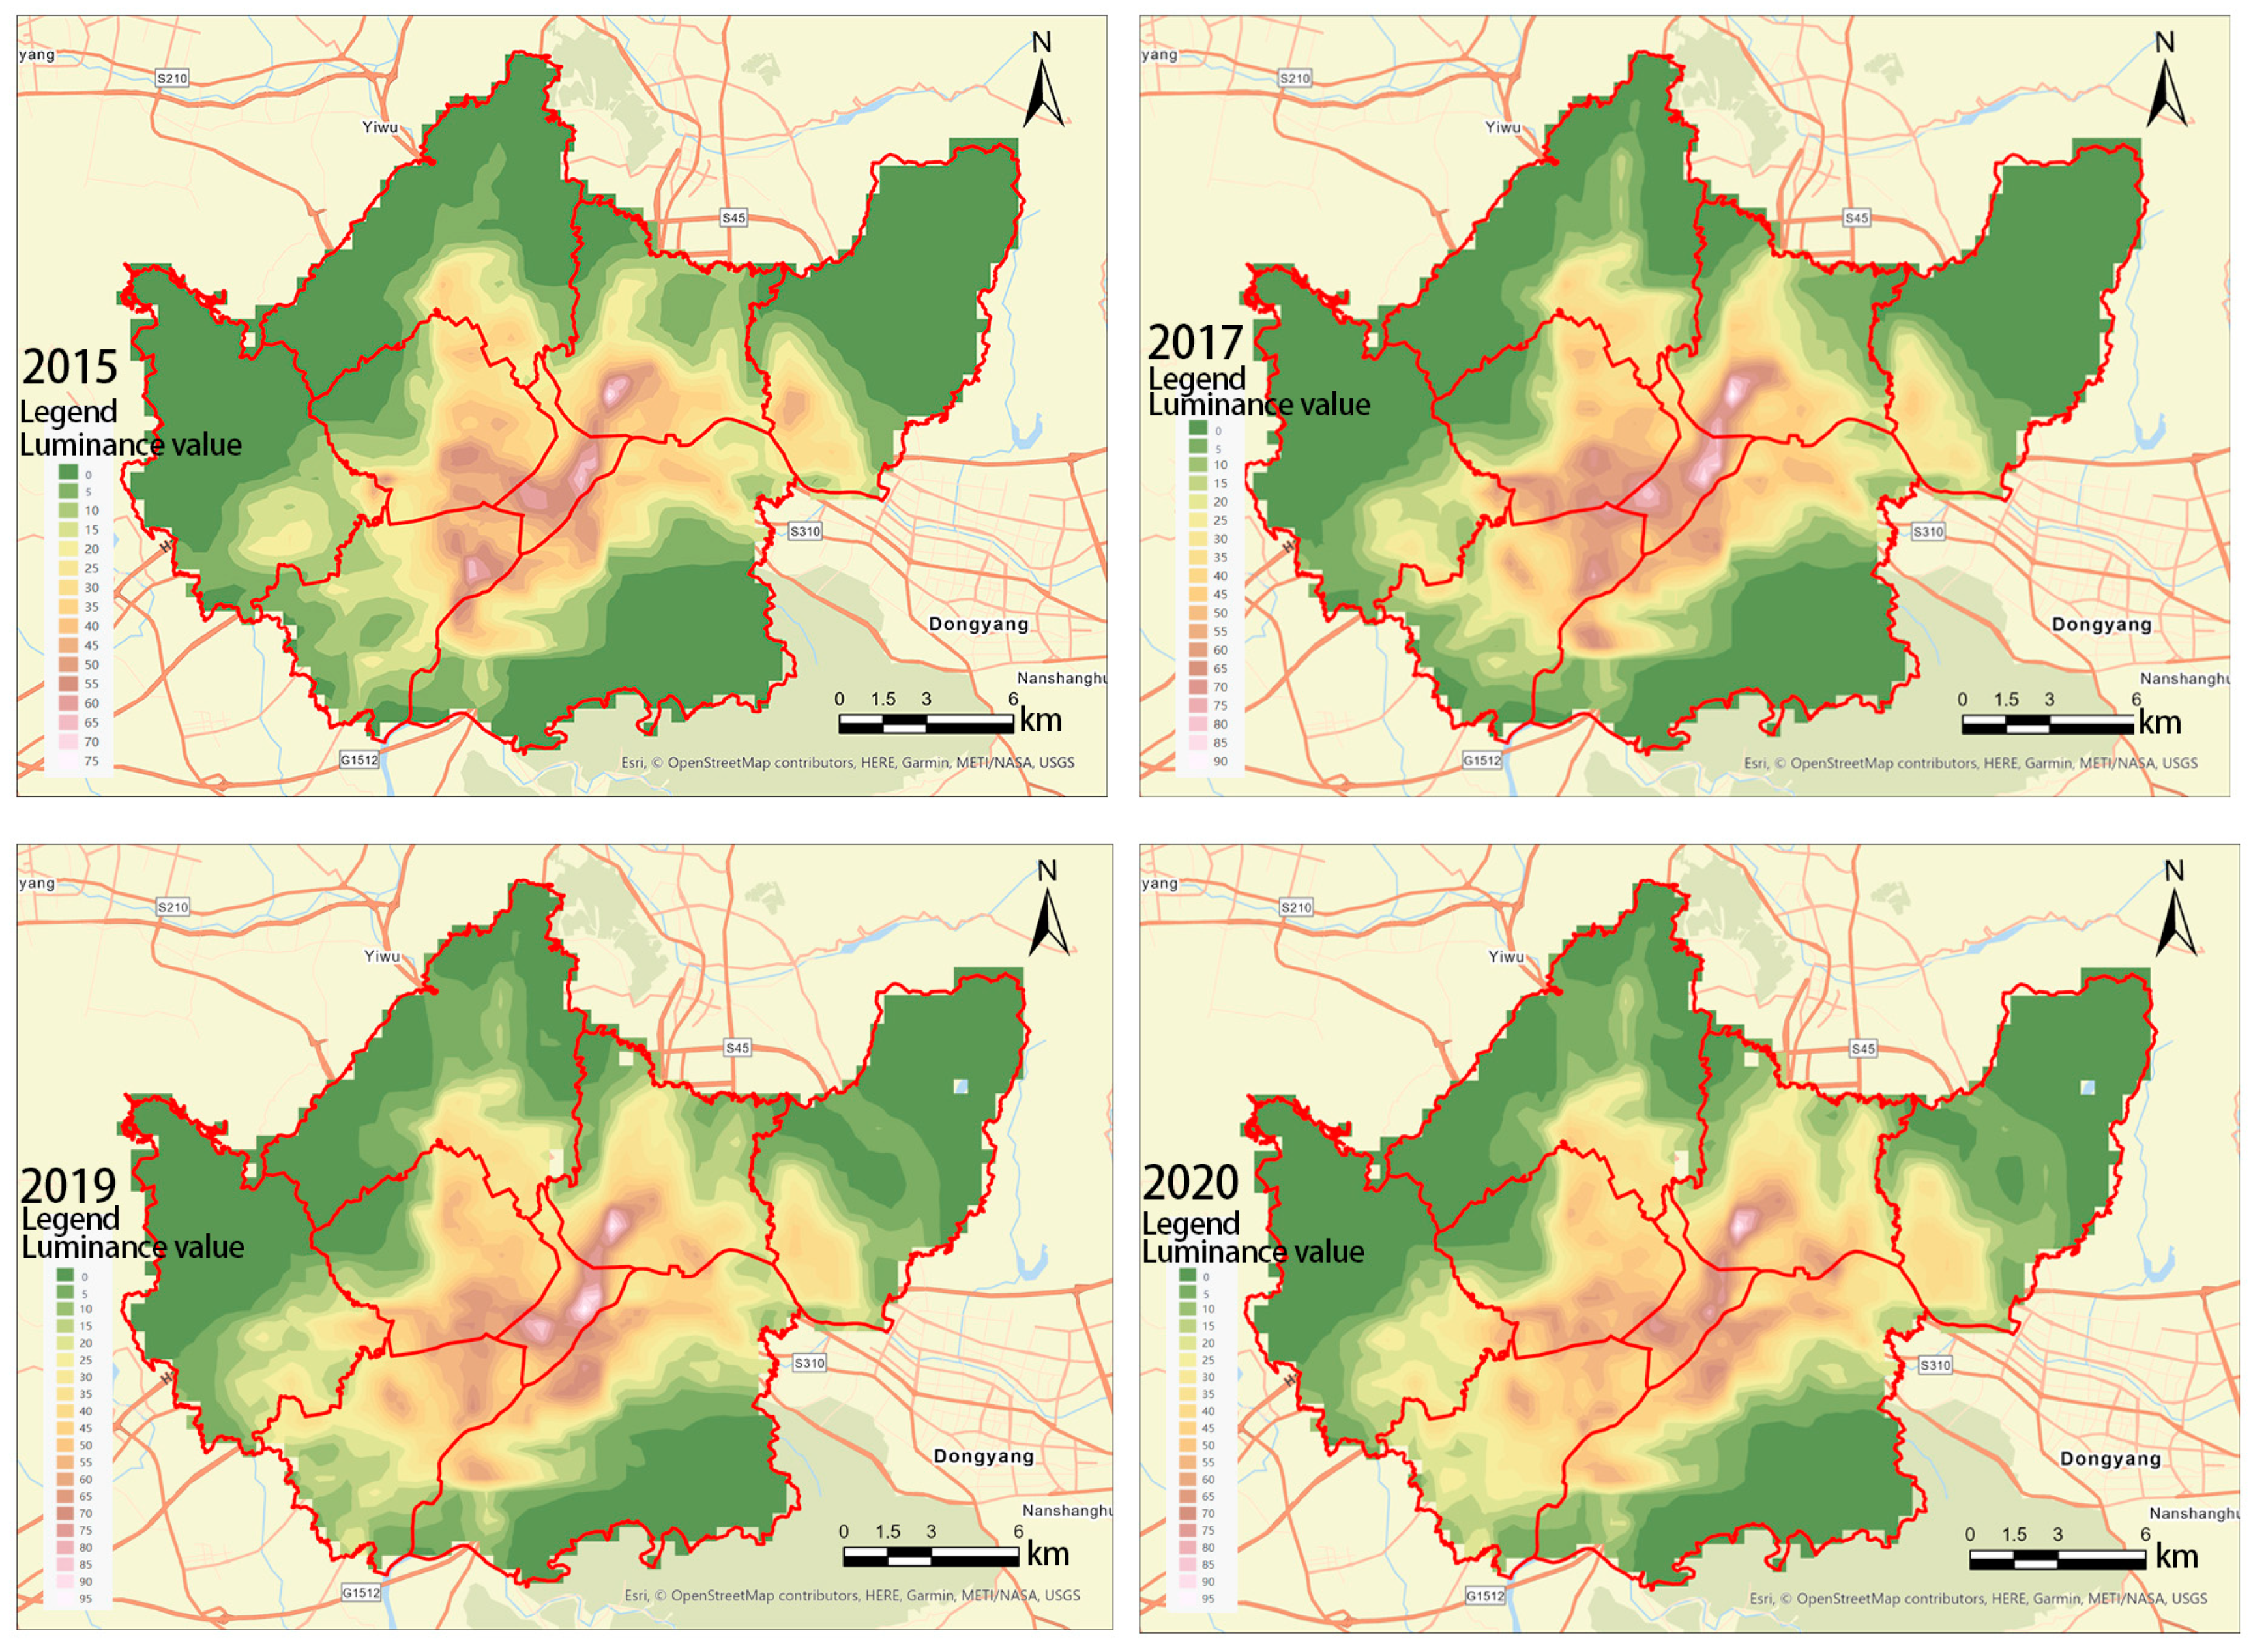
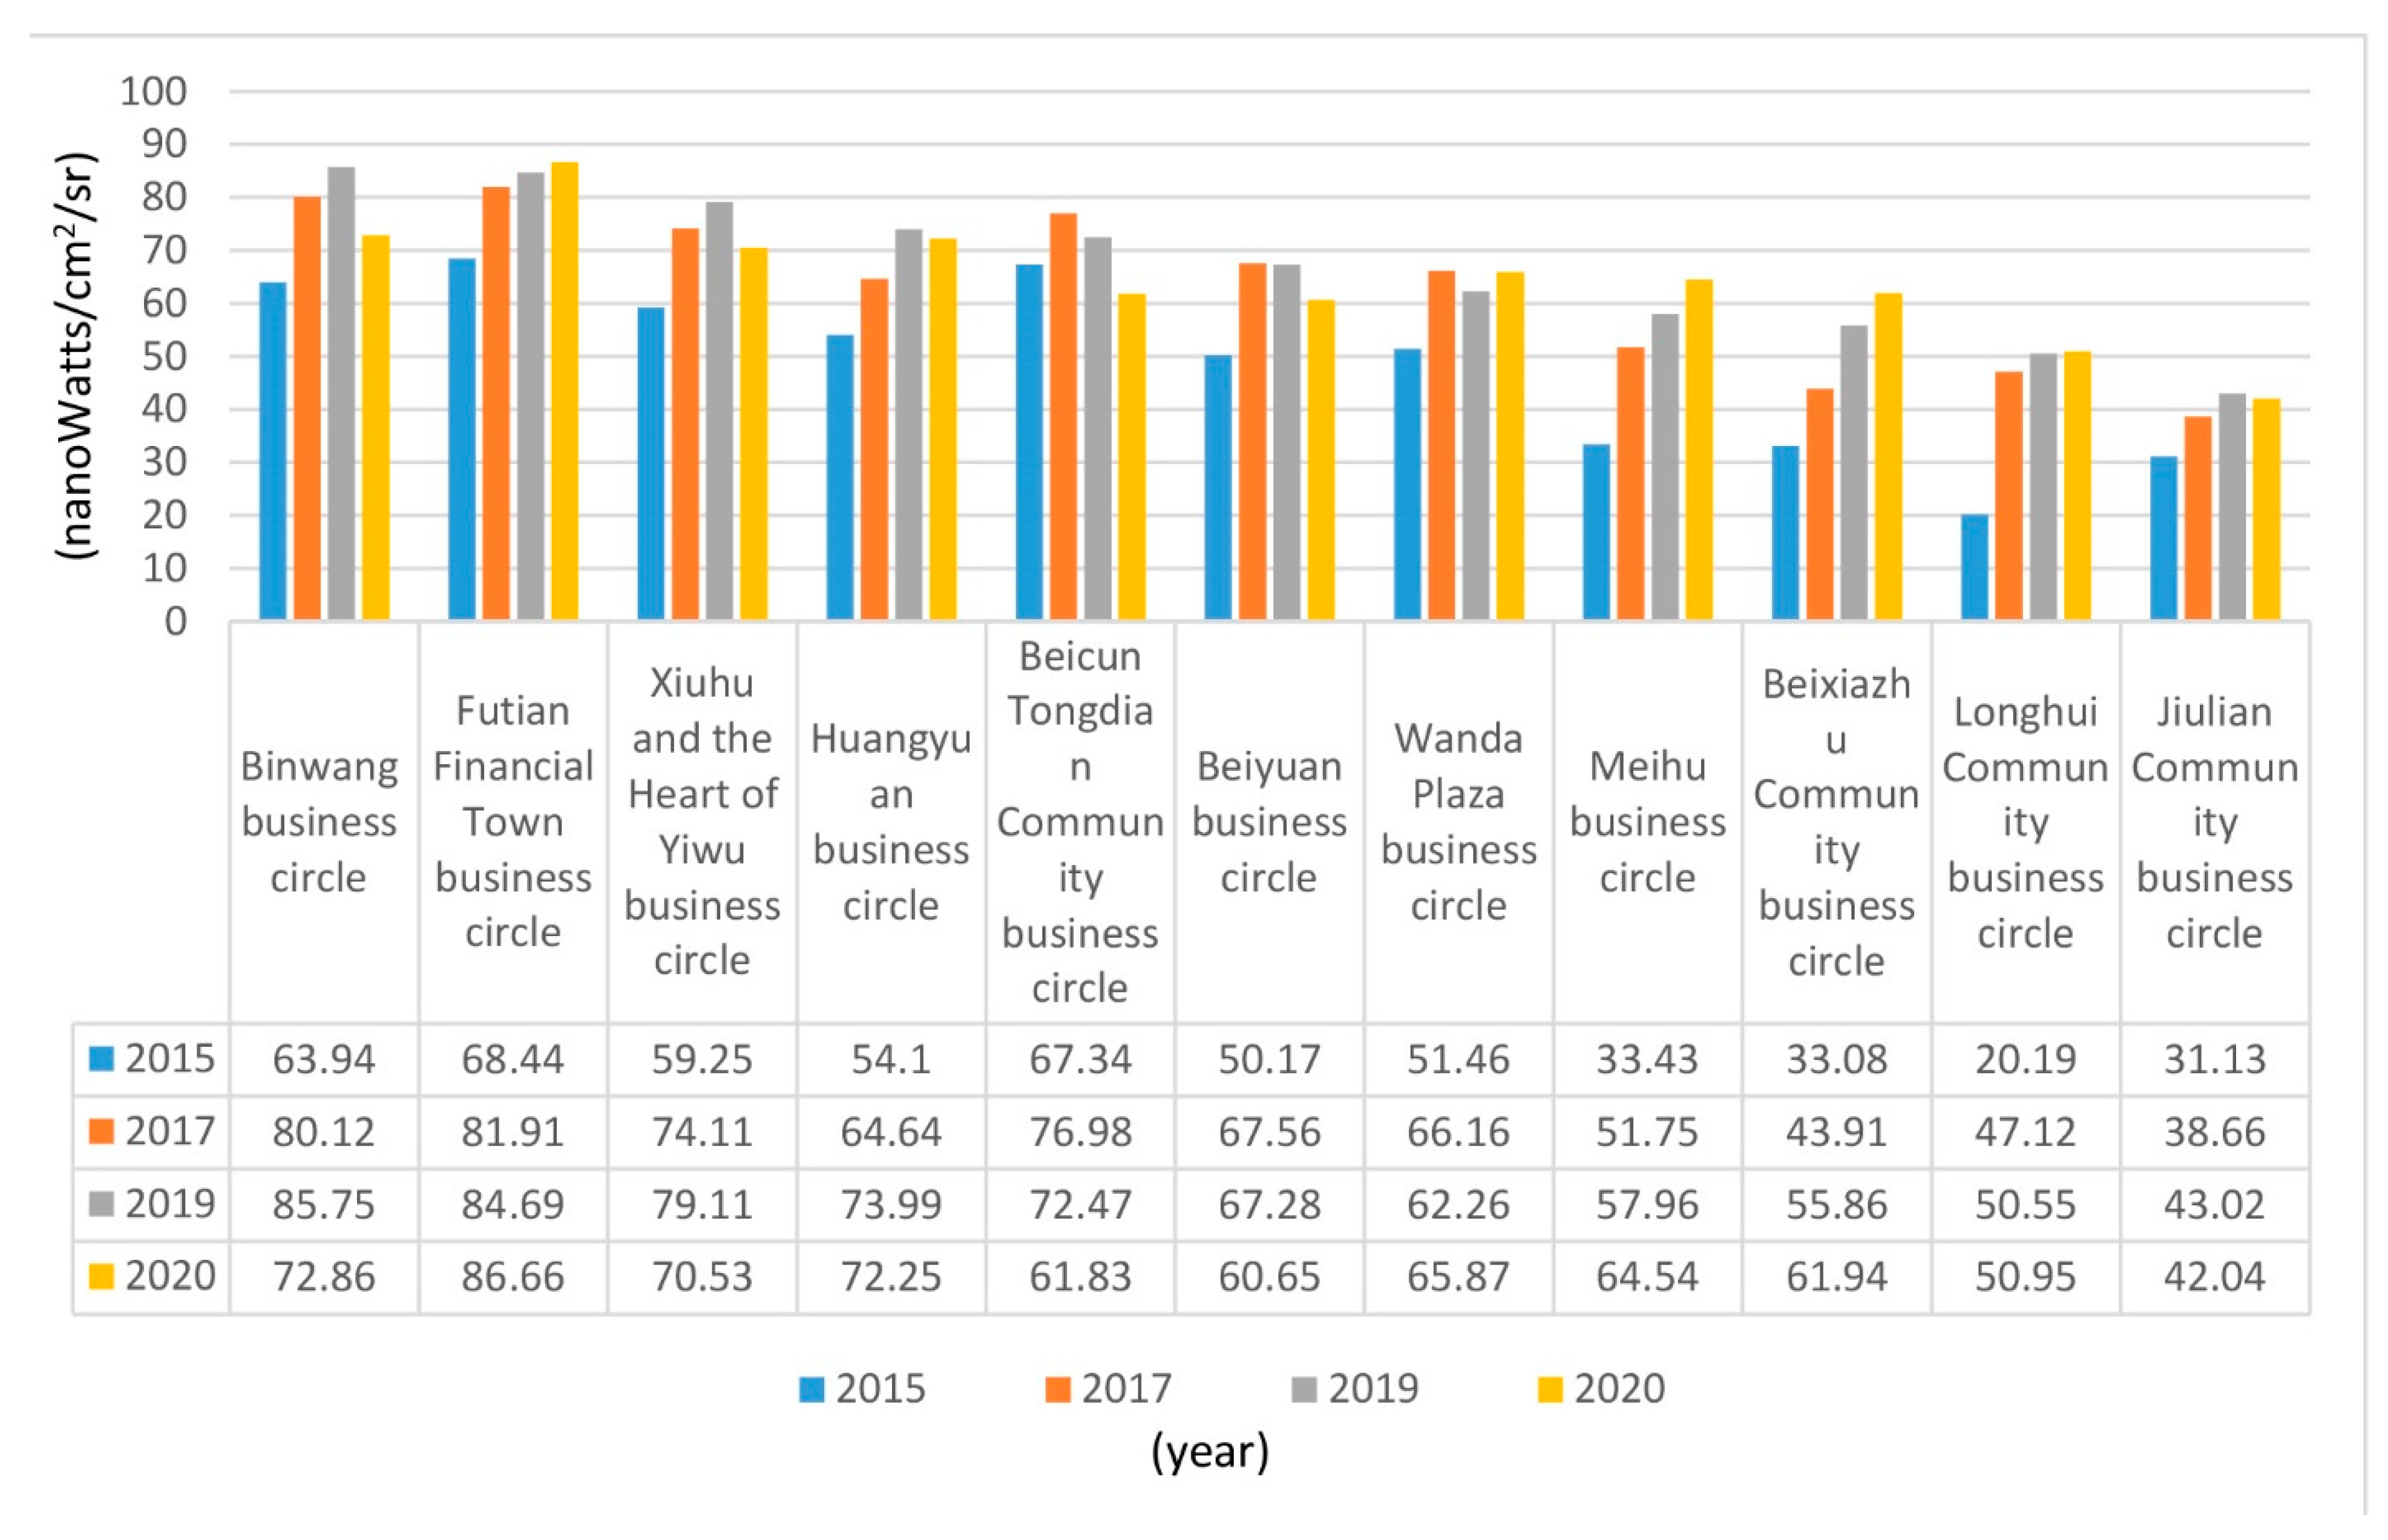
Timing Changes of Brightness Values in Business Circles

Combined with the local contour tree algorithm, the preprocessed night light data were used to generate contour tree maps for 2015, 2017, 2019, and 2020. Figure 9 show that except for 2020, the brightness value of each business circle was increasing, indicating that the activity of the business circle was also increasing. Choucheng Subdistrict and Futian subdistrict formed the BinWang business circle and the Futian financial town business circle. The brightness value of the Xiuhu Heart of the Yiwu shopping mall business circle increased significantly from 2015 to 2019, which is related to the popularity of the Heart of the Yiwu shopping mall commercial complex. It can also be seen from Figure 9 that in 2020, affected by the new coronavirus epidemic, the average brightness of several business circles, except for the Futian Financial Town business circle, Wanda Plaza business circle, Meihu business circle, and Beixiazhu community business circle, were lower than that of 2019.
Related to an analysis of the reasons for the different brightness values, the first-level Binwang Business circle has always been the most vibrant night consumption areas in Yiwu city. This area is connected to the exotic street, Yijiashan and Santing Road night market for night shopping, an integrated dining and leisure gathering area for night food. Foreign businessmen from the Middle East gather here. There are 33 Middle Eastern restaurants on exotic streets, 26 of which are operated by foreigners. Binwang Night Market is large and concentrated. It is also the most well-known night market in Yiwu. Most of the stalls are open-air and open for a long time. Shopping and food are for mass consumption. It is a place for out-of-town tourists to check-in for night trips; Futian Financial Town, The Circle, is located in the Silk Road New District, where the Yiwu International Commodity Market is located. It is an international commodity circulation, information and exhibition centre. There are many large-scale hotels, entertainment, and leisure establishments in the surrounding area, and business buildings and commercial complexes are concentrated here.
The second-level Xiuhu Lake and the Heart of Yiwu shopping mall business circle are located in the centre of the city. This area is equipped with leisure and entertainment functional areas such as Xiuhu Park and Xiuhu Square and high-end urban complexes such as the Heart of Yiwu and the Intime Department Store. High-quality communities such as the Century Apartment, Metropolitan Apartment, Xiuhu Apartment, and other high-quality communities around the business circle constitute the residential centre of Yiwu and the administrative office area of the municipal government. In the high-end consumer market, although the facilities are complete and the entire block area is large, the layout of several commercial centres is relatively scattered. Compared with the Binwang Business circle, the night light index is slightly lower.
The third level is Huangyuan Market business circle, Beicun Tongdian Community business circle, Beiyuan Business circle, WandaPlazaBusiness circle, and Meihu business circle; this business circle is mostly dominated by single or multiple shopping mall complexes, radiating the surrounding areas around which the area is formed.
The Huangyuan Market business circle is the main body of the Huangyuan Clothing Market of China Commodity City. It is known as “the flagship of clothing wholesale and the first choice for foreign trade procurement”. A street of home textile brand shops is formed in the surrounding area. There are also many hotels and tea markets.
The Beicun Tongdian community business circle is the second-largest night market in Yiwu. There are many business households with nearly a thousand stalls in ordinary department stores, and the flow of people is large. The closing business hours of the business households are usually approximately 1 a.m.
The business circle of Choujiang Wanda Plaza, centred on the Wanda Mall commercial complex, is surrounded by industrial parks such as Yiwu Development Zone Science and Technology Industry Cluster Park, Choujiang Cross-border E-commerce Pioneer Park, Yiwu High-level Talent Pioneer Park, and national-level Yiwu Economic and Technological Park. The headquarters of the economic park are a 5A-level office building park, which is the key construction of the development zone. Although entrepreneurs have a large scale, they still work indoors, and their business types are relatively single.
The Beiyuan business circle serves entrepreneurs and mass consumption, and the scale effect is not yet obvious. The night light index is similar to that of the business circle of Wanda Plaza.
The Jiangdong Meihu cultural, sports and entertainment business circle is dominated by cultural, sports, and fitness shopping. There are shopping and leisure centres such as the Wuyue Star City Commercial Complex. The lighting is mainly based on the main road and landscape lights around Meihu Stadium. In addition, the commercial complex only exists at a single point, which fails to form strong night light radiation.
One of the contributions of this study is that we detected multiple “existing business circles that were not identified by traditional methods”. In other words, those business circles that have not yet been included in Yiwu’s business development plan. For example, in the Yiwu City Master Planning (2013–2030) (http://www.yw.gov.cn/art/2015/4/13/art_1229143251_1381321.html. Accessed on 9 October 2021), the Yiwu city government plans to focus on six traditional business circles, such as Xiuhu, Wanda plaza, Beiyuan, Binwang, Huangyuan, and Tutian. Our method also identifies other secondary business circles, such as Meihu, Beicun Tongdian Community, Beixiazhu Community, Longhui community, and Jiulian community business circles. This kind of business circle is densely populated and mainly appears in the community. Although it is not as recognisable as the traditional business circles, it already has a certain scale of commercial agglomeration. There are a number of business circles where the business density and night light brightness index have exceeded or approached the traditional business circles (Figure 10). Community business circles have a certain spontaneity, which have a close relationship with the immigrant population and business contacts. As long as the government guides these areas, they can become typical business circles.
Another contribution of this paper is that we distinguish the hierarchical structure of business circles and analyse their relationship with regards to night-time economic development. Due to the relatively single data source (POI data or noctilucent remote sensing data), some scholars failed to correlate the hierarchical structure of urban business circles with night-time economic development [19,20,23,24,25,26,27,28,31,33]. Previous studies only focused on the identification or geographical distribution of business circles without further analysis of the hierarchical structure of business circles [20,24,25,26,27]. Other scholars only used quantitative research methods to identify business circles based on other data sources, such as check-in data for social networking services and location services [20] or mobile location data [49].
This study also has the following shortcomings: (1) this paper only considers three types of business, which fails to reflect the overall picture of the night-time economy. (2) Since it is difficult to obtain earlier POI data, we only make dynamic analyses of night-time light data not POI data. (3) In future studies, we will combine social and economic surveys to better reveal the systematic characteristics of business circles.

6. Conclusions and Policy Recommendations

6.1. Main Conclusions

Urban business circles are places where commercial facilities gather, with important functions such as meeting shopping needs and leisure and entertainment. The use of big data for business circle research is a new trend. This paper uses web crawlers and other methods to extract urban POI data, combined with night light remote sensing data. We used ArcGIS Pro software to quantitatively identify the structure of the business circle in the main urban area of Yiwu city and analysed the relationship between the characteristics of the business circle and the night economy. The main conclusions are as follows. (1) The spatial superimposition relationship between luminous remote sensing data and POI data in the main urban area of Yiwu city is good, and the overall coupling results show obvious characteristics of circle structure. (2) The combination of different business formats has obvious spatial heterogeneity: the comprehensive shopping format presents a multicentre distribution pattern and is hierarchical. In contrast, the professional catering and leisure entertainment formats are located next to urban residential areas, and different ethnic groups have their own characteristics. (3) From 2015 to 2019, the brightness value of each business circle shows a continuously increasing trend; in particular, the completion and opening of large commercial projects during this period have a significant driving effect on the business circle in the region. The year 2020 was somewhat exceptional due to the impact of the coronavirus pandemic, in which the brightness value of shopping areas, mainly for e-commerce trade, still displayed an increasing trend. (4) The differences in the levels of business circles reflect the differences in the degree of economic activity at night. The night economy business’s spatial agglomeration characteristics are consistent with their market positioning, population distribution characteristics, and location strategies.

6.2. Policy Recommendations

In recent years, the Yiwu Municipal Government has vigorously developed new business forms and models for the night economy to build the “Never Night Mall” brand. It has made great efforts to become a well-known night economy demonstration city at home and abroad as soon as possible. It has made significant progress, but it still needs the following to continue its development.
Focus on building the overall layout framework of the night economy “dual-core, multiband, and multinode”. The serves to build a core gathering area for the night economy, to create an international financial, business, and leisure cluster in the Futian Financial Town business circle, and gradually form a high-end business and leisure core area; creating an international dining and leisure cluster in Binwang Business circle, Exotic Street and other areas, and gradually optimising the core space pattern of night shopping. The second is to innovate and upgrade the economic vitality belt at night. By combining the opportunities of urban renewal, we will strive to enhance the Xiuhu business circle and the Heart of Yiwu shopping mall business circle for high-end consumers, continue to optimise the Beiyuan business circle and Wanda Plaza business circle for the mass consumer group of entrepreneurs, and carefully cultivate cultural and sports-oriented facilities. There are many night-economy vitality belts such as the Jiangdong Meihu Cultural, Sports and Entertainment Business circle for fitness shopping professionals [50]. The third is to deploy night-economy gathering points in other cities, and towns within the city, and gradually improve the night-economy network nodes.
Work together to build a comprehensive, professional night-economy industrial cluster with shopping, catering, leisure, and entertainment as the core. Accelerate the promotion of investment, the promotion of characteristic commercial complex projects, and pay particular attention to the increase of heterogeneous projects and products to ensure the sustainable and healthy development of the night economy, including the introduction of the first stores of domestic and foreign brands, the development of high-quality night entertainment projects and characteristic catering projects, and construction system engineering such as the signboard night market [50]. Prioritise the layout of emerging fashion formats, promote the full integration of night tours, night entertainment, night food, night markets, and night broadcasts, and cultivate a diversified new mode of night consumption.
Further improve public service systems such as night transportation, public safety, laws and regulations, and accelerate the creation of a world-class model city for the business environment and a model night-economy city.
Improve the quality of night lighting and create a new pattern of night travel for Yiwu cultural and tourism integration. Yiwu is a well-known convention and exhibition capital at home and abroad. Light shows can be created in several business circles near the Yiwu River to attract buyers and local citizens at home and overseas, relying on its exhibition opportunities at different times throughout the year. At the same time, it should also combine Yiwu’s technological, fashionable, and cultural characteristic blocks and foreign cultural exhibition activities to create several brand night festival activities through the combination of Chinese and Western cultures, highlighting the unique charm of Yiwu’s night economy.

Author Contributions

Conceptualisation: L.Z. and Y.S.; methodology, L.Z. and J.Z.; software, L.Z. and J.Z.; validation, L.Z. and J.Z.; formal analysis, Y.S.; investigation, L.Z.; writing—original draft preparation, L.Z. and Y.S.; writing—review and editing, Y.S.; visualisation, L.Z. and J.Z.; project administration, Y.S.; funding acquisition, Y.S. All authors have read and agreed to the published version of the manuscript.

Funding

This research was supported by the Open Project of Yiwu Urban Planning and Design Institute of 2020, “Research on the Distribution and Planning of Night Economy in Yiwu Based on RS and GIS” (Project number: KT2020008).

Institutional Review Board Statement

Not applicable.

Informed Consent Statement

Not applicable.

Data Availability Statement

The data presented in this study are available on request from the first author.

Acknowledgments

We thank the anonymous reviewers for their constructive comments that greatly improved the quality of our manuscript.

Conflicts of Interest

The authors declare no conflict of interest.

References

  1. Montgomery, J. The evening economy of cities. Town Ctry. Plan. 1994, 63, 302–307. [Google Scholar]
  2. Brabazon, T.; Mallinder, S. Into the night-time economy: Work, leisure, urbanity and the creative industries. Nebula 2007, 4, 161–178. [Google Scholar]
  3. Fan, Z.; Liu, J. The “night-time economy”: Occurrence, evolution and governance. Masses 2019, 26, 47–49. (In Chinese) [Google Scholar]
  4. Lovatt, A.; O’Connor, J. Cities and the night-time economy. Plan. Pract. Res. 1995, 10, 127–135. [Google Scholar] [CrossRef]
  5. Bianchini, F. Night cultures, night economies. Plan. Pract. Res. 1995, 10, 121–126. [Google Scholar] [CrossRef]
  6. Ye, D. Night-time Economics. Harbin: North Literature and Art Publishing House; Shandong Literature and Art Publishing House Co., Ltd.: Jinan, China, 2019. (In Chinese) [Google Scholar]
  7. Shaw, R. Beyond night-time economy: Affective atmospheres of the urban night. Geoforum 2014, 51, 87–95. [Google Scholar] [CrossRef] [Green Version]
  8. Jayne, M. Regulating the night: Race, culture and exclusion in the making of the night-time economy. Crime Media Cult. 2008, 4, 434–436. [Google Scholar] [CrossRef]
  9. Zuo, Y. Nighttime economy: A new windfall for urban development under the lights. New Ind. Econ. 2019, 8, 79–81. (In Chinese) [Google Scholar]
  10. Chatterton, P.; Hollands, R. Theorising urban playscapes: Producing, regulating and consuming youthful nightlife city spaces. Urban. Stud. 2002, 39, 95–116. [Google Scholar] [CrossRef]
  11. Bromley, R.; Thomas, C.; Millie, A. Exploring safety concerns in the night-time city: Revitalising the evening economy. Town Plan. Rev. 2000, 71, 71–96. [Google Scholar] [CrossRef]
  12. Tomsen, S. Bouncers: Violence and Governance in the Night-Time Economy; University of Sydney, Institute of Criminology: Sydney, Australia, 2003. [Google Scholar]
  13. Hadfield, P.; Lister, S.; Traynor, P. ‘This town’s a different town today’ policing and regulating the night-time economy. Criminol. Crim. Justice 2010, 9, 465–485. [Google Scholar] [CrossRef]
  14. Zou, T. China’s nighttime economy development status, problems and countermeasures. China Tourism News, 16 April 2019. (In Chinese) [Google Scholar]
  15. Liu, L. UK: Innovative planning to support the night-time economy. Urban. Plan. Int. 2018, 40, 146. (In Chinese) [Google Scholar]
  16. Wang, C. The night market in ancient times. Price Mon. 2003, 24, 46. (In Chinese) [Google Scholar]
  17. Whysall, P. Commercial change in a central area: A case study. Int. J. Retail. 1989, 4, 45–61. [Google Scholar] [CrossRef]
  18. Kawanabe, M.; Kawashima, K. A study on rambling activities of visitor by tram in central commercial district: Focusing on behavioral characteristics of visitor and spatial composition in Hiroshima city. J. City Plan. Inst. Jpn. 2012, 47, 539–550. [Google Scholar] [CrossRef]
  19. Yu, W.; Ai, T.; Shao, S. The analysis and delimitation of central business district using network kernel density estimation. J. Transport. Geogr. 2015, 45, 32–47. [Google Scholar] [CrossRef]
  20. Hu, Q.; Wang, M.; Li, Q. Urban hotspot and commercial area exploration with check-in data. Acta Geod. Cartogr. Sin. 2014, 43, 314–321. [Google Scholar]
  21. Alperovich, G. Density gradients and the identification of the central business district. Urban. Stud. 1982, 19, 313–320. [Google Scholar] [CrossRef]
  22. Ning, Y.; Huang, S. The hierarchy of commercial centres in Shanghai and their changing characteristics. Reg. Res. Dev. 2005, 24, 15–19. (In Chinese) [Google Scholar]
  23. Wu, K.; Zhang, H.; Wang, Y.; Wu, Q.; Ye, Y. Identification and spatial patterns of multiple types of commercial centres in Guangzhou City. Prog. Geogr. 2016, 35, 963–974. (In Chinese) [Google Scholar]
  24. Chen, W.; Liu, L.; Liang, Y. Analysis of hotspot identification and industry clustering characteristics of retail commercial centres in Guangzhou based on POI data. Geogr. Res. 2016, 35, 703–716. (In Chinese) [Google Scholar]
  25. Yin, X.; Wang, J. Study on spatial pattern and agglomeration of retail industry—Take the main urban area of Shijiazhuang as an example. J. Commer. Econ. 2018, 37, 158–161. (In Chinese) [Google Scholar]
  26. Huo, G.; Chen, L. Regional commercial center identification based on POI big data in China. Arab. J. Geosci. 2021, 14, 1360. [Google Scholar]
  27. Hao, F.; Wang, S.; Xie, D.; Yu, T.; Feng, Z. Analysis of the accessibility of Changchun’s commercial centres based on Internet map services. Econ. Geogr. 2017, 37, 68–75. (In Chinese) [Google Scholar]
  28. Cui, T.; Liu, J.; Li, W.; Xu, S.; Luo, A. Research on extraction of multiple commerce center based on contour tree method. Sci. Surv. Mapp. 2020, 45, 150–155. (In Chinese) [Google Scholar]
  29. Shi, Y.; Wu, J.; Wang, S. Spatio-temporal features and the dynamic mechanism of shopping center expansion in Shanghai. Appl. Geogr. 2015, 65, 93–108. [Google Scholar] [CrossRef]
  30. Shi, Y.; Tao, T.; Cao, X.; Pei, X. The association between spatial attributes and neighborhood characteristics based on Meituan take-out data: Evidence from Shanghai business circles. J. Retail. Consum. Serv. 2021, 58, 102302. [Google Scholar] [CrossRef]
  31. Chen, Z.; Yu, B.; Wei, S.; Liu, H. A new approach for detecting urban centers and their spatial structure with nighttime light remote sensing. IEEE Trans. Geosci. Remote Sens. 2017, 55, 6305–6319. [Google Scholar] [CrossRef]
  32. Gao, S.; Janowicz, K.; Montello, D.R.; Hu, Y.; Yang, J.; Kenzie, G.; Ju, Y.; Gong, L.; Adams, B.; Yan, B. A data-synthesis-driven method for detecting and extracting vague cognitive regions. Int. J. Geogr. Inf. Sci. 2017, 31, 1245–1271. [Google Scholar] [CrossRef]
  33. Lei, Y.; Tian, J.; Lin, G.; Reng, C. A method of urban centre extraction by combining road network and interest points. Acta Geod. Cartogr. Sin. 2015, 44, 42–48. (In Chinese) [Google Scholar]
  34. Small, C.; Pozzi, F.; Elvidge, C.D. Spatial analysis of global urban extent from DMSP-OLS night lights. Remote. Sens. Environ. 2005, 96, 277–291. [Google Scholar] [CrossRef]
  35. Yu, B.; Shu, S.; Liu, H. Object-based spatial cluster analysis of urban landscape pattern using nighttime light satellite images: A case study of China. Int. J. Geogr. Inf. Sci. 2014, 28, 2328–2355. [Google Scholar] [CrossRef]
  36. Sutton, P.C. A scale-adjusted measure of “urban sprawl” using nighttime satellite imagery. Remote Sens. Environ. 2003, 86, 353–369. [Google Scholar] [CrossRef]
  37. Bennett, M.M.; Smith, L.C. Advances in using multitemporal night-time lights satellite imagery to detect, estimate, and monitor socioeconomic dynamics. Remote Sens. Environ. 2017, 192, 176–197. [Google Scholar] [CrossRef]
  38. Shi, K.; Huang, C.; Yu, B.; Yin, B.; Huang, Y.; Wu, J. Evaluation of NPP-VIIRS night-time light composite data for extracting built-up urban areas. Remote Sens. Lett. 2014, 5, 358–366. [Google Scholar] [CrossRef]
  39. Yu, B.; Shi, K.; Hu, Y.; Huang, C.; Chen, Z.; Wu, J. Poverty evaluation using NPP-VIIRS nighttime light composite data at the county level in China. IEEE J. Sel. Top. Appl. Earth Obs. Remote Sens. 2017, 8, 1217–1229. [Google Scholar] [CrossRef]
  40. Chen, Z.; Yu, B.; Hu, Y.; Huang, C.; Shi, K.; Wu, J. Estimating house vacancy rate in metropolitan areas using NPP-VIIRS nighttime light composite data. IEEE J. Sel. Top. Appl. Earth Obs. Remote Sens. 2015, 8, 2188–2197. [Google Scholar] [CrossRef]
  41. Zhang, X.; Du, S.; Wang, Q. Hierarchical semantic cognition for urban functional zones with VHR satellite images and POI data. ISPRS J. Photogramm. Remote Sens. 2017, 132, 170–184. [Google Scholar] [CrossRef]
  42. Deng, Y.; Liu, J.; Liu, Y.; Lou, A. Detecting urban polycentric structure from POI Data. Int. J. Geo-Inf. 2019, 8, 283. [Google Scholar] [CrossRef] [Green Version]
  43. Liu, J.; Deng, Y.; Wang, Y.; Huang, H.; Du, Q.; Ren, F. Urban nighttime leisure space mapping with nighttime light images and POI data. Remote. Sens. 2020, 12, 541. [Google Scholar] [CrossRef] [Green Version]
  44. Liu, Y.; Lin, J.; Guo, L.; Cai, N.; Tong, X.; Meng, X.; Zhang, Y.; Jiang, W. Performance analysis and case validation of anti-differential state estimation based on adaptive kernel density estimation theory. Chin. J. Electr. Eng. 2016, 36, 3845–3856. (In Chinese) [Google Scholar]
  45. Han, C.; Liu, H.; Zhang, Y.; Wang, J. Spatial distribution analysis of multi-scale leisure agriculture in Beijing based on kernel density function. Trans. Chin. Soc. Agric. Eng. 2019, 35, 271–278. (In Chinese) [Google Scholar]
  46. Rong, Q.; Yan, J.; Guo, G. Research and implementation of DBSCAN-based clustering algorithm. Comput. Appl. 2004, 24, 45–46. (In Chinese) [Google Scholar]
  47. Yang, F.; Xu, J.; Zhou, L. Identification and spatial characteristics analysis of restaurant clusters in Guangzhou based on DBSCAN spatial clustering. Econ. Geogr. 2016, 36, 110–116. (In Chinese) [Google Scholar]
  48. Ma, X.; Hou, G.; Li, L.; Yang, Y. Identification, distribution pattern and influencing factors of B&B clusters based on DBSCAN algorithm—An example of Nanjing city. Hum. Geogr. 2021, 36, 84–93. (In Chinese) [Google Scholar]
  49. Yan, N.; Wen, A. Analysis of mobile big data shopping area based on R+ Hadoop. Inf. Technol. 2018, 25, 95–99. (In Chinese) [Google Scholar]
  50. Gong, Y. Yiwu Makes Every Effort to Build A Famous Night Economy City in China. Yiwu Business News. Available online: http://www.yw.gov.cn/art/2020/12/14/art_1229187636_59213647.html (accessed on 14 December 2020). (In Chinese)
Figure 1. Geographical location and distribution of business circles in the main urban area of Yiwu city.
Remotesensing 13 05153 g001
Figure 2. Distribution of POI points in the main urban area of Yiwu city in 2020.
Remotesensing 13 05153 g002
Figure 3. Night-time light brightness distribution map of Yiwu city in 2020.
Remotesensing 13 05153 g003
Figure 4. Hexagonal grid, nightlight brightness, POI kernel density, and their spatial superimposition relationship in the main urban area of Yiwu city in 2020. (a) Hexagonal grid map. (b) Hexagonal grid of nightlight brightness. (c) Hexagonal grid of POI kernel density. (d) The spatial superimposition relationship between the luminous brightness value and the POI value.
Remotesensing 13 05153 g004
Figure 5. POI density cluster diagram of various business types in Yiwu city. (a) Shopping POI density clustering map; (b) Catering Services POI Density Clustering map; (c) Entertainment POI density clustering map.
Remotesensing 13 05153 g005
Figure 6. Local contour tree formation and simplification process. (a) “Seed” contour. (b) A local contour tree. (c) The tree’s hierarchy.
Remotesensing 13 05153 g006
Figure 7. The contour tree and nesting hierarchy of the Yiwu city centre. (a) The main contour lines in the core area. (b) The hierarchical nested structure of contour lines.
Remotesensing 13 05153 g007
Figure 8. The identification and hierarchical distribution of Yiwu business circles. (a) Identification of Yiwu city’s commercial circles. (b) Hierarchical distribution map of Yiwu city’s business circles.
Remotesensing 13 05153 g008
Figure 9. Change in the brightness values of business circles in the main urban area of Yiwu city in 2015, 2017, 2019 and 2020.5.2. The Relationship between the Level of Business Circles and the Nighttime Economy.
Remotesensing 13 05153 g009
Figure 10. The average brightness of night lights in various business circles in Yiwu city in 2015, 2017, 2019 and 2020.
Remotesensing 13 05153 g010
Table 1. Classification of POI business types in the main urban area of Yiwu city.
CategoryPOI SubclassNumber (pcs)
ShoppingShopping malls, department stores, characteristic commercial streets, speciality stores, supermarkets, convenience stores, shops, night markets61,745
Catering ServicesChinese restaurants, western restaurants, snacks and fast-food restaurants, cold drinks shops, coffee shops, cafes, dessert shops20,939
EntertainmentCinema, KTV, foot bath and leisure, fitness club, beauty care, sports venues, game hall1761
Table 2. DBSCAN clustering results for various types of businesses in the main urban area of Yiwu city (unit: one).
CategoryShoppingCatering ServicesEntertainment
Total61,74520,9391761
Noise points27,42413,300938
ClusterI22,0751622313
II21291666175
III35732058109
IV123959379
V152771448
VI266346160
VII111552539
Table 3. Business circles form the types, size, density, and brightness of night light in the main urban area of Yiwu city.
Business CircleBusiness TypeTotalArea
(m2)
Density
(Units/km2)
Brightness of Night Lighting (NanoWatts/cm2/sr)Level
ShoppingCatering ServicesEntertainment
Binwang298913691284486476,034.97942485.75I
Futian Financial Town1794962492805710,884.60394684.69I
Xiuhu and the Heart of Yiwu1151436981685864,314.38195079.11II
Huangyuan384965485310,061.53156473.99III
Beicun Tongdian Community4011576564282,923.75199372.47III
Beiyuan18916725381246,926.89154367.28III
Wanda Plaza32327144638164,814.78387162.26III
Meihu34122537603313,826.49192157.96III
Beixiazhu Community131319191513565,426.51267655.86IV
Longhui Community1451331101792786,808.35227850.55IV
Jiulian Community2719910380380,219.5999943.02IV
Publisher’s Note: MDPI stays neutral with regard to jurisdictional claims in published maps and institutional affiliations.

