
Automated Mapping for Long-Term Analysis of Shifting Cultivation in Northeast India
by
 , , and
Pulakesh Das
1, 
Sujoy Mudi
2 ,
,
Mukunda D. Behera
2,* ,
,
Saroj K. Barik
3,
Deepak R. Mishra
4 and
Parth S. Roy
1 
1
World Resources Institute, New Delhi 110016, India
2
Centre for Oceans, Rivers, Atmosphere and Land Sciences, IIT Kharagpur, Kharagpur 721302, India
3
CSIR-National Botanical Research Institute, Lucknow 226001, India
4
Department of Geography, University of Georgia, Athens, GA 30602, USA
*
Author to whom correspondence should be addressed.
Remote Sens. 2021, 13(6), 1066; https://0-doi-org.brum.beds.ac.uk/10.3390/rs13061066
Submission received: 21 January 2021
/
Revised: 15 February 2021
/
Accepted: 9 March 2021
/
Published: 11 March 2021
(This article belongs to the Special Issue Geospatial Monitoring on Local to Global Scale Impacts of Anthropogenic Landscape Changes)
Abstract
:Assessment of the spatio-temporal dynamics of shifting cultivation is important to understand the opportunities for land restoration. The past studies on shifting cultivation mapping of North-East (NE) India lack systematic assessment techniques. We have developed a decision tree-based multi-step threshold (DTMT) method for consistent and long-term mapping of shifting cultivation using Landsat data from 1975 to 2018. Widely used vegetation indices such as normalized difference vegetation index (NDVI), Normalized Burn Ratio (NBR) and its relative difference NBR (RdNBR) were integrated with the suitable thresholds in the classification, which yielded overall accuracy above 85%. A significant decrease in total shifting cultivation area was observed with an overall reduction of 75% from 1975–1976 to 2017–2018. The methodology presented in this study is reproducible with minimal inputs and can be useful to map similar changes by optimizing the index threshold values to accommodate relative differences for other landscapes. Furthermore, the crop-suitability maps generated by incorporating climate and soil factors prioritizes suitable land use of shifting cultivation plots. The Google Earth Engine (GEE) platform was employed for automatic mapping of the shifting cultivation areas at desired time intervals for facilitating seamless dissemination of the map products. Besides the novel DTMT method, the shifting cultivation and crop-suitability maps generated in this study, can aid in sustainable land management.

1. Introduction
Shifting cultivation refers to a type of agricultural system where a patch of vegetation is cleared by the slash-and-burn method, growing assorted varieties of crops in the cleared land for a few seasons and then moving to a new patch of land on a rotational basis. This type of agriculture is a transitional stage in the process of evolution from hunting and food gathering to sedentary farming [1]. Intensive cultivation of crops is undertaken on such fertile land parcels for two to three years before the land parcels are abandoned for natural forest regeneration, which is referred to as the fallow period. Depending on the availability of land and population size, the fallow period may range from 3 to 15 years, after which the vegetation is slashed and burned again. The period from one slash to the next slash, i.e., slash-cropping-fallow-slash makes one shifting cultivation cycle [2]. Intensive shifting cultivation and reduced period of jhum cycle has been imposing a serious threat to ecosystems such as declining soil fertility and crop yield, and increasing soil erosion [3]. Accurate and periodic mapping of the shifting cultivation areas is vital for assessing their spatio-temporal dynamics for effective management of land use, and more so for the jhum-dominated landscape of northeast (NE) India.
Remote sensing images are widely used to accurately map shifting cultivation areas in contrast to the labor-intensive field survey [4]. The differential spectral response of various land surface features allows mapping of shifting cultivation patches through visual image interpretation [5] and hybrid classification [6]. Such processes are time-consuming and encompass biases due to the interpreter’s knowledge, and limit the scope of repetition or automation. The Global Land Cover 2000 (GLC2000) maps derived with 14 months of global daily images acquired by the 1 km spatial resolution VEGETATION instrument onboard SPOT-4 satellite between November 1999 and December 2000 have isolated the jhum pixels, based on ISODATA unsupervised classifiers on normalized difference vegetation index (NDVI) [7]. Hartter, et al. [8] combined three remote sensing techniques such as vegetation indices, principal components analysis, and texture analysis, to distinguish forest fallow length in a landscape of smallholder shifting cultivation in the Central Yucatán Peninsula. The spatio-temporal pattern of the annual deforestation data from 2000 to 2014 provided the basis for generating shifting cultivation areas at 1 km grid for Global Forest Change (GFC) study [9]. In India, the Forest Survey of India (FSI) demarcated shifting cultivation between 1987–1997 using visual image interpretation of Landsat imageries at 1:1 million scale (FSI 2017). Indian Institute of Remote Sensing (IIRS) used a hybrid classification technique (i.e., unsupervised, supervised, visual, and knowledge-based) of IRS-IC/ID LISS-III (resolution 23.5 m) and Landsat TM data at 1:250,000 scale to map the shifting cultivation areas in NE India (IIRS 2002). Pasha, et al. [10] applied an integrated spectral enhancement technique to map the shifting cultivation fallow/current jhum area in NE India for 2014, 2016, and 2018 using Landsat-8 data. Though remote sensing-based land use and forest cover maps including the shifting cultivation areas have been generated from a regional to a national scale in India [11,12,13], none of the studies to the best of our knowledge, have worked on a fully automated protocol for mapping shifting cultivation areas for the NE India, and across such a large temporal window of 1975 to 2018.
The NDVI, normalized difference between NIR and red band), and Soil Adjusted Vegetation Index (SAVI, modified NDVI with background soil correction factor, L) and their temporal changes are widely used for vegetation categorization and change mapping [14,15]. The positive gradient in spectral reflectance from red to NIR band induces positive values in NDVI and SAVI for both vegetation and burned area (with the high and low values corresponding to vegetation and burn area, respectively), inducing overlaps in index values between them. In comparison, the negative gradient from NIR to SWIR band for vegetation and low negative gradient for the burned area is used in Normalized Burn Ratio (NBR; normalized difference between NIR and SWIR band) and highlights the deforested burned areas [16]. Though Schneibel, et al. [17] used NBR to study the temporal dynamics of shifting cultivation, the similarity in spectral responses of burned areas with rocky outcrops and fallow/barren land induced inaccuracies in shifting cultivation mapping using single-time data. Furthermore, the difference between pre- and post-event NBR (dNBR) and its relative difference NBR (RdNBR) improved estimates of the burn severity and mapping accuracy [18,19]. In addition to single-time data limitation, the factors that induce error include heterogeneous vegetation type and density, complex topography, variations in solar illumination, weather condition, surface soil moisture content, differences in imaging date, deforestation intensity, and severity of burning [18,20]. To reduce the influence of other land cover features, Armenteras, et al. [21] masked out such classes as water body, rocky outcrops, and urban areas from the image before applying NBR, and obtained a classification accuracy of >82%. Tansey, et al. [22] reviewed and reported that NBR, dNBR, and NDVI are the widely used indices for burned area mapping. Boschetti, et al. [23] integrated multiple indices as NBR, burned area index (BAI), Char Soil Index (CSI), SAVI, and mid-infrared burn index (MIRBI) employing the fuzzy classification technique to map the burned areas and concluded that in comparison to a single index, multi-criteria approach better identifies the burned areas. Employing the cascaded threshold values in NDVI, NBR, and dNBR, Escuin, et al. [20] distinguished the severity of burning with an accuracy of 86.42% (±4.31%). Li & Feng [24] applied a multi-step thresholding method using indices such as NDVI, Normalized Difference Moisture Index (NDMI), NBR, and SAVI for shifting cultivation mapping. Recently, Long, et al. [15] generated a global burn area map applying the Random Forest (RF) machine learning algorithm on globally trained points employing several indices.
The socio-economic condition of the inhabitants in most part of NE India is dependent on various forest ecosystem services, agriculture, and allied sectors. Two kinds of agriculture are generally practiced in hilly terrains of NE India: (i) crop fields in the valleys and flat terrain between the hills, and (ii) shifting cultivation (jhum) in hilly terrain [25]. Singh [26] reported that 85% of the total agriculture in NE India is shifting cultivation. The observed jhum cycle in NE India in the past varied between 4 to 50 years [1,27]. However, a significant reduction (2–3 years) in the fallow period in recent decades has led to the creation of many degraded ecosystems [28,29]. The majority of deforested and/or burned areas in NE India are highly fragmented and small in size, which is hardly separable owing to the minimum mappable unit, on coarse resolution data such as Moderate Resolution Imaging Spectroradiometer (MODIS) burned area products [MCD45 (500 m) and MCD64 (500 m)] or other global burned area products such as GBS (8 km), Global Burned Area 2000 (GBA2000, 1 km), GLOBSCAR (1 km), GlobCarbon (1 km), L3JRC (1 km) and Fire_CCI (250 m) [15]. The satellite-derived shifting cultivation maps at a global scale may encompass biases at the local scale due to a smaller number of locally trained samples, for example, only 5 sample points were used by Long, et al. [15] from the entire NE India, which is not sufficient to capture the spatial distribution and spectral variability in this region. Moreover, the shifting cultivation areas identified employing survey-based methods may include biases due to less sampling in inaccessible areas.
One of the major purposes of shifting cultivation dynamics study in NE India is to optimize crop production based on the available land resources. The steep slope, high soil erosion, and poor soil fertility encourage the inhabitants to develop new farmlands after 2–3 years of cropping. The alternatives to shifting cultivation are through permanent cropping, agroforestry, and allied developmental activities those aim at reducing environmental degradation. Many government and non-government programs such as Indo-Danish International Development Agency (DANIDA), Mahatma Gandhi National Rural Employment Guarantee Scheme (MGNREGS), Joint Forest Management (JFM), Japan International Cooperation Agency (JICA), and Indo-German Development Cooperation Project (IGDC), etc. have been implemented in India to improve the forest and soil resources for sustainable livelihood of the inhabitants [30]. The shifting cultivation lands of NE India accommodate mixed crops such as principal food grain (rice, maize, millets) with vegetables (potato, pumpkins, cucumbers, yams, tapioca, chilies, onion, etc.) and cash crops (cotton, ginger, turmeric, pineapple, orange, jute, etc.) [31]. The crop types are mostly decided based on locational suitability and local preferences or consumption. Moreover, these croplands are used for multiple cropping based on seasonal climate conditions to maximize land use. The suitable areas for different crops are identified based on the environmental parameters such as climate (precipitation and temperature) and its seasonality and soil characteristics (soil type and pH). Several GIS-based methods are widely used in crop-suitability analysis, such as fuzzy set, threshold or range values or condition operators, multi-criteria evaluation [MCE] [32,33]. The EcoCrop tool developed by Food and Agriculture Organization (FAO) identifies the crop suitability based on the specific habit of growth and defined use employing several environmental determinants on the climate, soil, phenology, and topography (https://www.echocommunity.org/en/resources/a070531b-0b0c-455c-b6b5-e59bc0b3bdb0 assessed on 20 September 2020); [34]). However, a crop-suitability map for NE India based on the integration of soil, climate, and physiography variables for the shifting cultivation areas would provide cropping guidance to the landholders and is not yet available.
The study develops an automated method using a decision tree-based multi-step threshold to map the shifting cultivation areas at decadal interval using moderate resolution satellite data. This was achieved through an evaluation study from a test site on repetition and alternation of shifting cultivation patches at different temporal intervals. Four field visits were carried out. The threshold ranges for various indices were fixed using visually interpreted training data points for different periods using R. Furthermore, a new code was developed and executed using the Google Earth Engine (GEE) platform for classification of the shifting cultivation areas for the whole of NE India. A map was derived by integrating soil, climate, and physiography variables to prescribe crop suitability to the landholders. The overarching study objective was to develop an automated GEE framework for mapping long-term shifting cultivation pattern in NE India, thereby prescribing crop suitability to the landholders.
2. Materials and Methods
2.1. Study Area
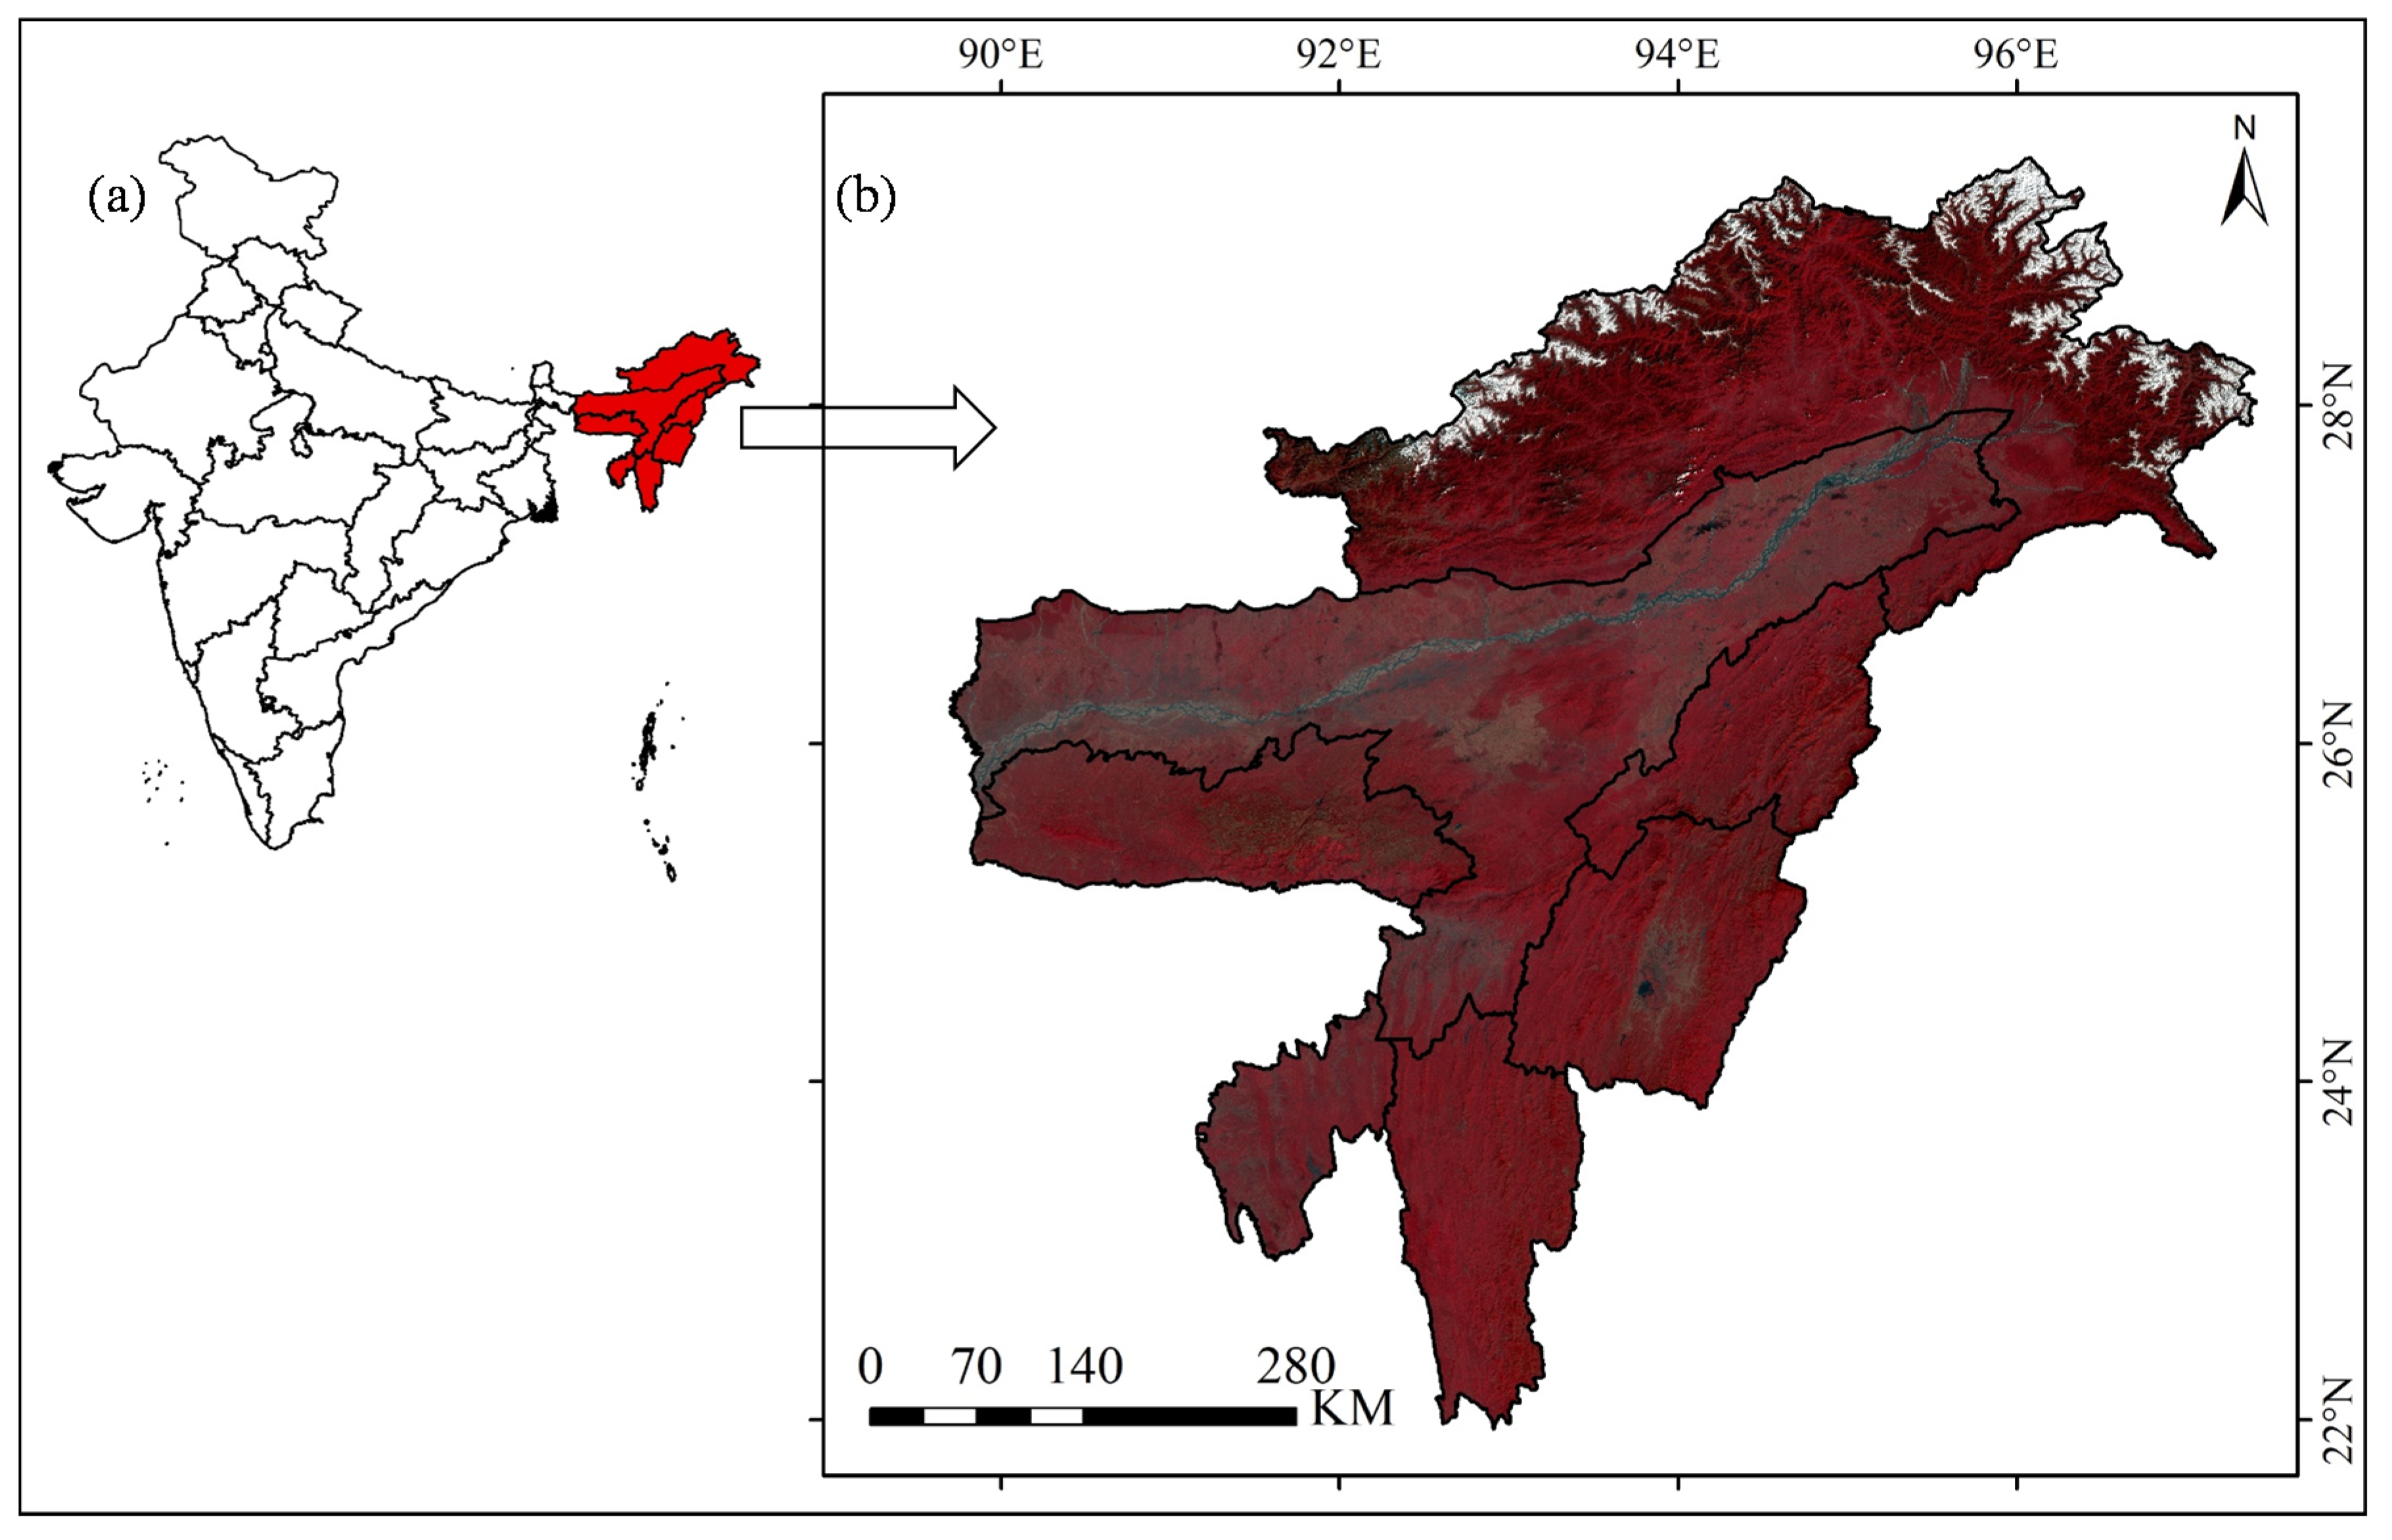
The forest cover of NE India provides important ecosystem services to a large population (about 45 million) and hosts exceptionally high species diversity [13,35]. All the seven states of NE India were chosen for the current analysis. The study area is extended between 21°56′15″ N and 29°29′46″ N latitude, and 89°41′57″ E and 97°26′16″ E longitudes, covering a geographic area of 262,179 km2, accounting for 7.9% of India’s total geographical area (Figure 1). The NE India is classified under the warm temperate humid and winter dry climate region [36]. According to the Indian Meteorological Department (IMD) climate data, the annual precipitation in NE India varied between 1000 mm and 7000 mm, (average of 1985 to 2005); however, the mean annual temperature varied between 7 °C and 26 °C. The landscape is dominated by natural forest (>60%) and cropland (>17%), where vast cropland areas are seen along the flood plain of the Brahmaputra River [37].
2.2. Data and Methodology
The 30 m Landsat data were used for (i) detecting the repetition and alternation pattern of shifting cultivation patches in a few test sites, (ii) testing the suitability of threshold ranges of various indices to stabilize the decision tree-based multi-step threshold (DTMT) classification scheme as per ground reality during field visits in 2017–2018, and (iii) classifying the shifting cultivation patches in NE India. The Landsat data for the three different sensors (MSS, TM and 8) were employed to map the shifting cultivation areas in different time periods from 1975 to 2018. NDVI-based masking of the shifting cultivation patches was performed, following the logic, (A∧B) and (AUB-A∧B) (wherein, A and B denote the presence of shifting cultivation patches in the time periods, T1 and T2), to understand the repetition and alternation pattern of shifting cultivation over different temporal intervals in a few test sites (Figure 2 and Figure 3). Furthermore, we used the widely used vegetation index NDVI for its sensitivity to vegetation status, and burn index NBR [16] and its difference RdNBR [18] to develop a classification framework for automatic identification of shifting cultivation patches.
NDVI = (NIR − Red)/(NIR + Red)
NBR = (NIR − SWIR2)/(NIR + SWIR2)
RdNBR = dNBR/[√{ABS(pre-fireNBR/1000)}]
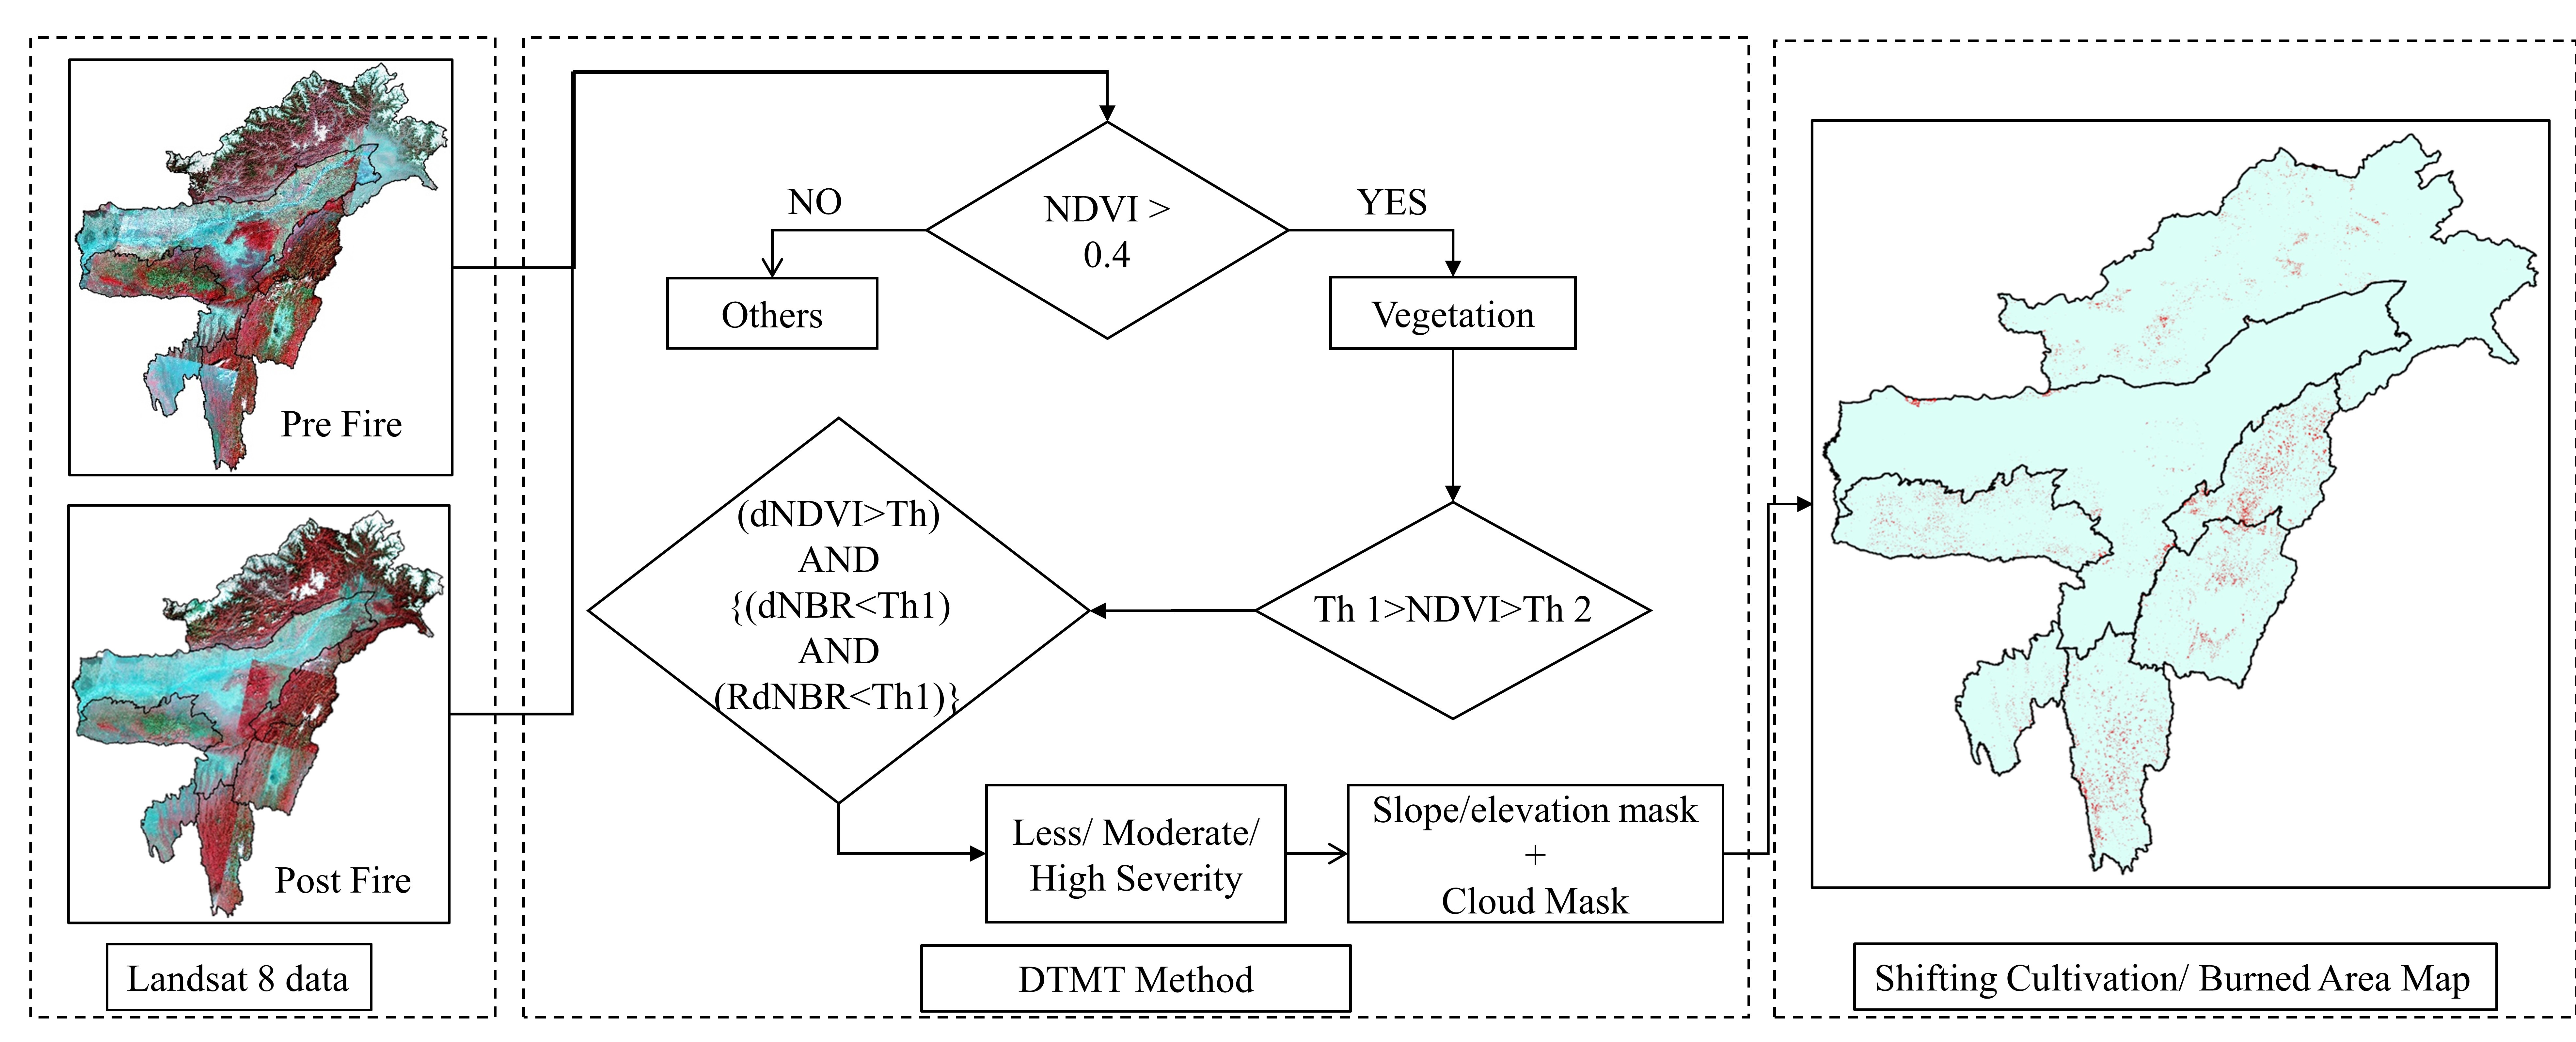
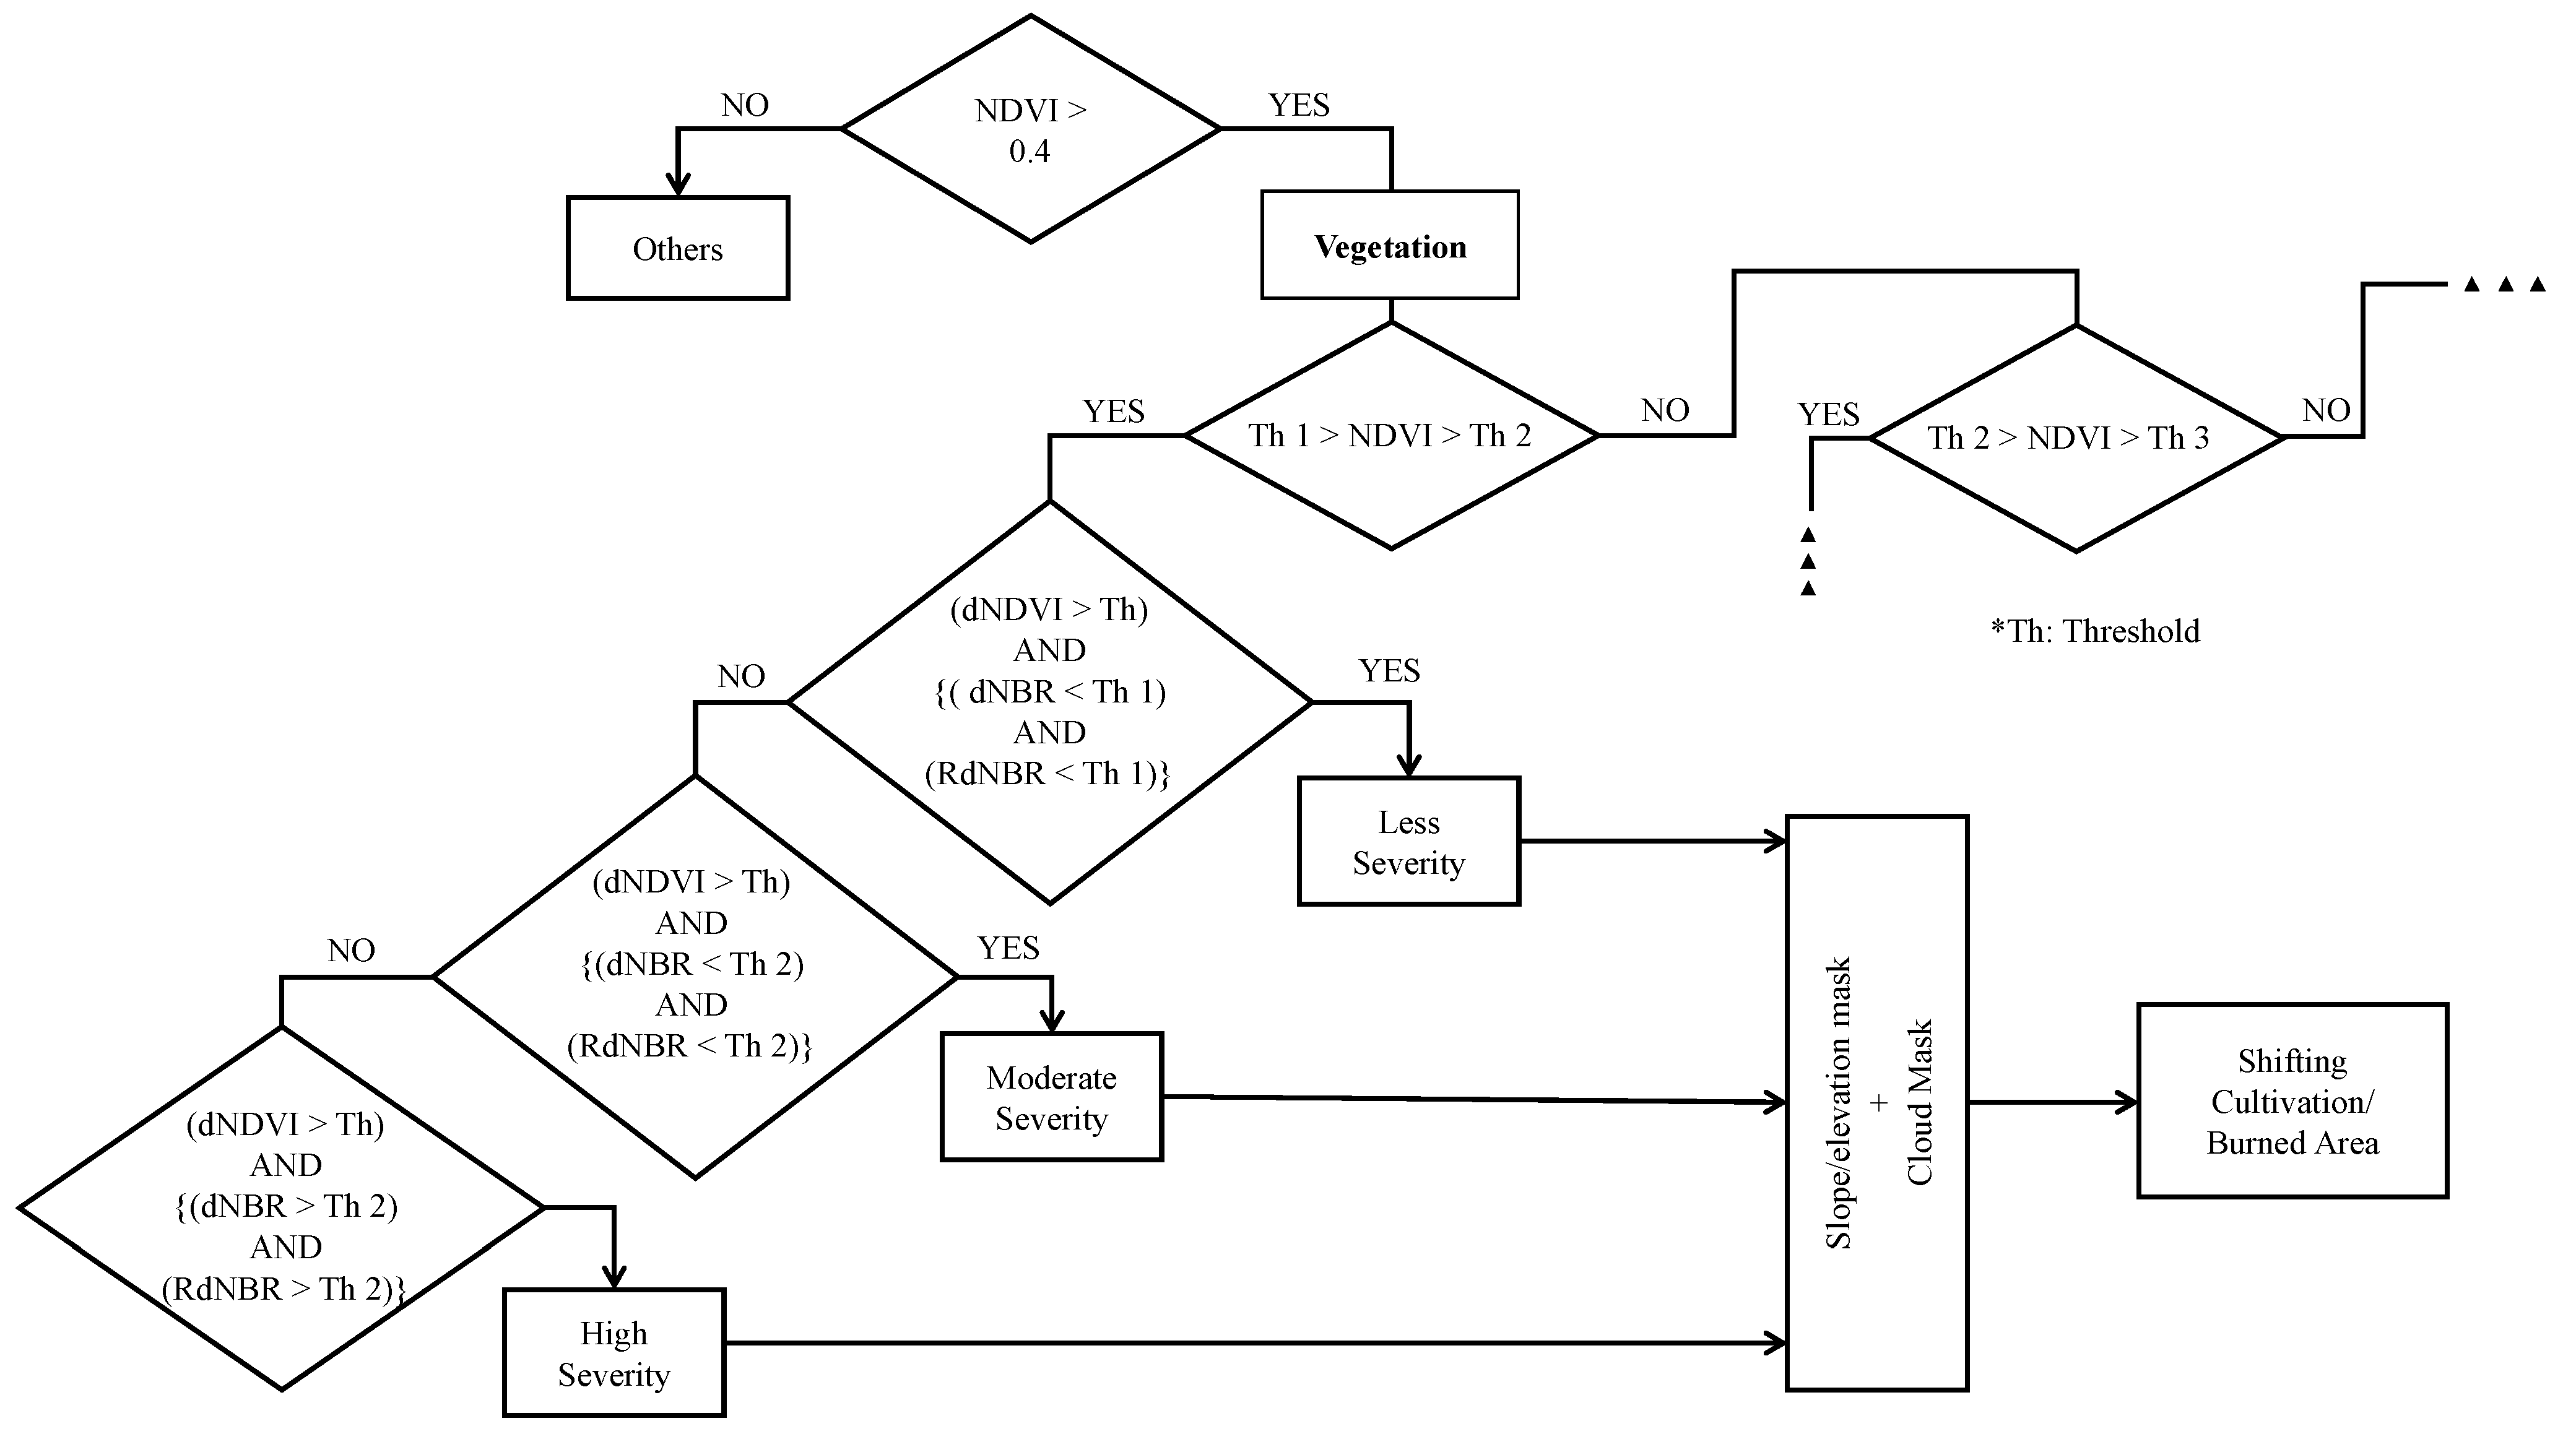
The DTMT method was adopted for automated identification, classification, and mapping of shifting cultivation patches as per the following logic and threshold determination. As a principle, the satellite data of two consecutive years were selected as per field visit and analyzed for the identification of shifting cultivation areas owing to significant relative differences in surface reflectance values of vegetation, and used to derive shifting cultivation patches. First, the vegetation cover was masked out by applying a threshold of ≥0.4 for the T0 NDVI image, such as to the 2017 image for the change detection between 2017 and 2018. Furthermore, the changes in NDVI values due to vegetation loss were derived using the pre- (e.g., 2017) and post- (e.g., 2018) NDVI image pairs. Furthermore, under each NDVI change values, the reduction in vegetation greenness (NDVI difference), the severity of burning (NBR), and the relative difference in NBR (RdNBR) were adjudged to register and account for any change pixels due to vegetation clearance and burn for shifting cultivation (Figure 4). Such changes in index value ranges were optimized based on their occurrences on various images across 2017–2018 and accommodated as threshold ranges with a categorization of less, moderate, and high severity, which were confirmed during field visits in 2017–2018. In addition to the field collected ground control points, visual image interpretation method was applied to generate training sites (>300 samples/each tile) within the study area. For each time period, >5000 training data points were generated for statistical analysis (model building and validation) from the high-resolution Google Earth (GE) images as reference. Furthermore, the elevation (300 m and 1900 m above MSL) and slope (0° to 40°) attributes were used to filter a few misclassified patches.
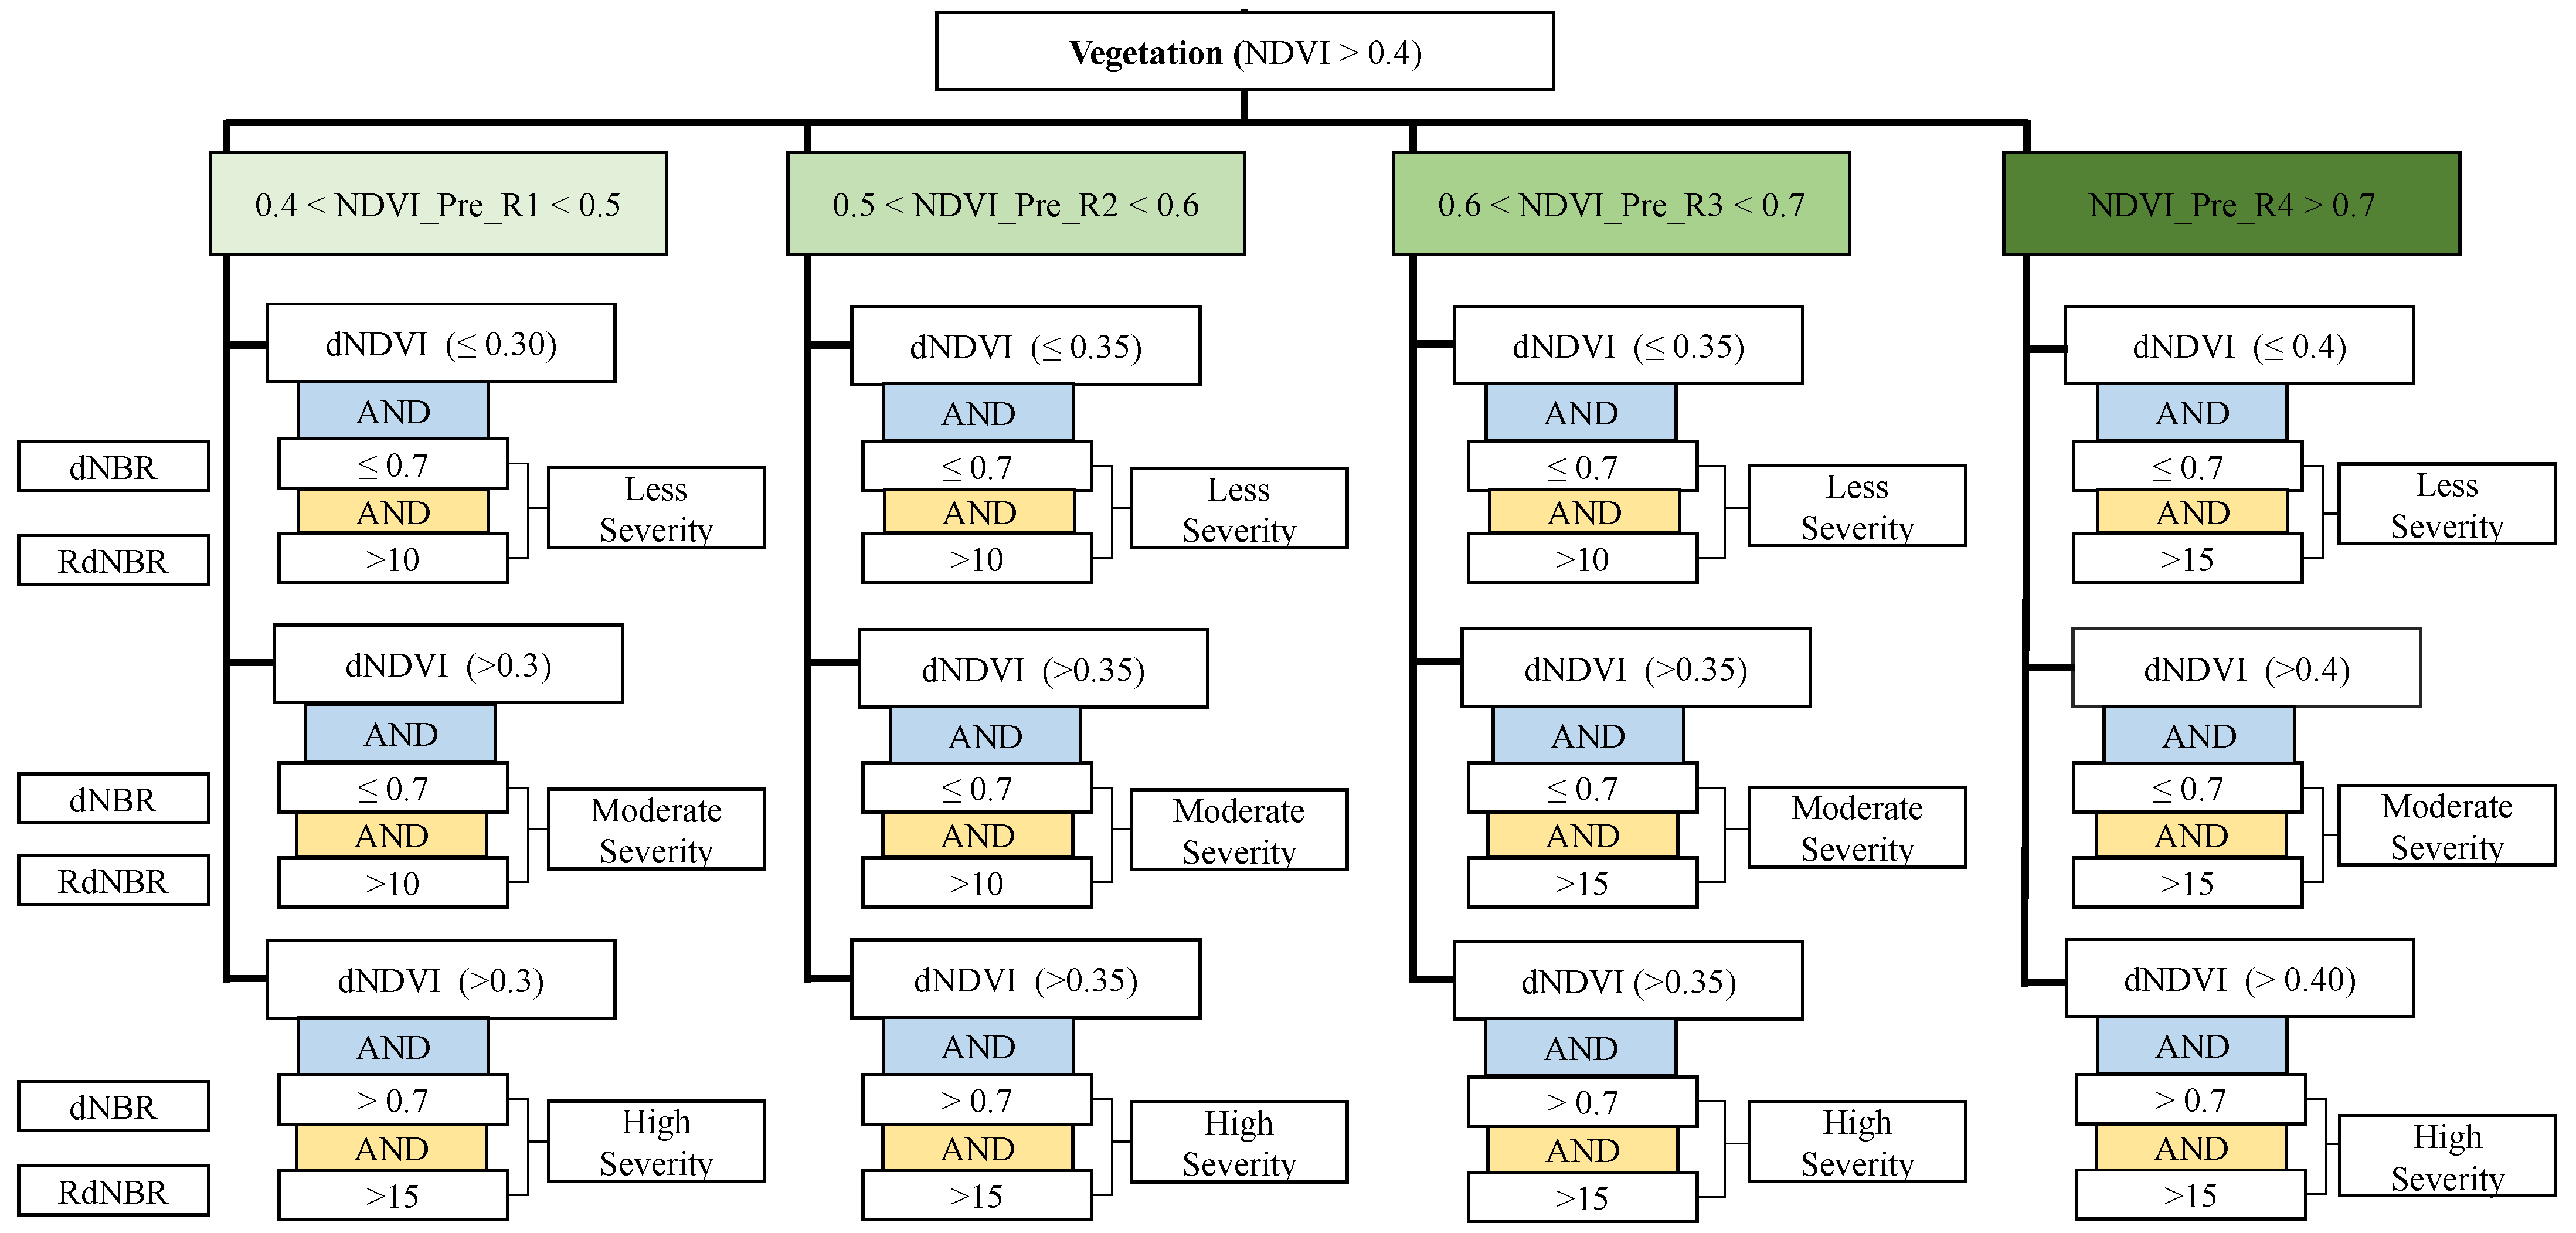
The cascading threshold value and ruleset followed for the classification of shifting cultivation patches is given in Figure 5. First, the NDVI image was segregated into four classes (e.g., 0.4–0.5, 0.5–0.6, 0.6–0.7, and >0.7) by applying a threshold of >0.4 to the pre-fire data. Furthermore, each NDVI class was subdivided into three sub-classes owing to the changes in dNDVI by applying threshold values between 0.3 and 0.4. Furthermore, within each sub-class, the corresponding threshold values of dNBR and RdNBR were applied to confirm the vegetation cover loss and burn. The optimum value of dNBR (0.7) and RdNBR (10 and 15) were integrated to characterize the burn severity of the sub-classes. Thus, the three dNDVI classes along with the dNBR and RdNBR consider the mutual and combined effects of greenness changes with burn severity, which was categorized as less, moderate, and high severity class. Similarly, dNDVI, dNBR, and RdNBR threshold values were used to define the severity classes for the rest of the two NDVI ranges as 0.6 to 0.7 and >0.7 and segregated into three burn severity classes. The DTMT classifier was tested using R for classification and mapping of images corresponding to the field visit sites with visually interpreted training data and further extended to the entire NE India for classification using the GEE platform. Separate codes were written in R and GEE for testing and execution of the DTMT-based automated classification scheme, and the latter (GEE) helped in the reduction of time and effort of data downloading, processing, computation, storage, and dissemination through remote access.
It is important to suggest a viable and effective land use plan to the local landholders for shifting cultivation plots as per various crop suitability. Therefore, a crop-suitability map was generated using soil types and pH, precipitation, and temperature data (Table S1). The soil type and pH information were obtained from the soil map generated by the National Bureau of Soil Survey and Land Use Planning (NBSS and LUP), India. The high-resolution Worldclim climate data (1 km, version 2.1) were used to calculate the average climate variables from 1970 to 2000. The crop types were identified based on literature survey where rice, sugarcane, maize, chilies, pineapple, ginger, etc., were reported as the dominant crops on various shifting cultivation plots in Mizoram state of NE India [38]. The information on suitable soil and climate conditions for different mono-crop and multi-crop was collected for integrated analysis using a conditional approach. Based the published literature, the thematic and continuous variables as soil type, pH, precipitation and temperature were used to develop the decision rule [39,40]. The decision rules primarily indicated the threshold criteria for various food grains, cash crops, and vegetables, which are commonly grown in NE India. For example, the rice is grown in riverine or alluvial soil with a suitable pH range (4–8), total annual precipitation >1000 mm, and mean annual temperature varies between 25 °C–35 °C. Similarly, the crop-suitability maps were developed for other food grains, cash crops, and vegetables employing the corresponding threshold criteria. The crop-suitability maps were then masked with the latest shifting cultivation map of 2018.
3. Results
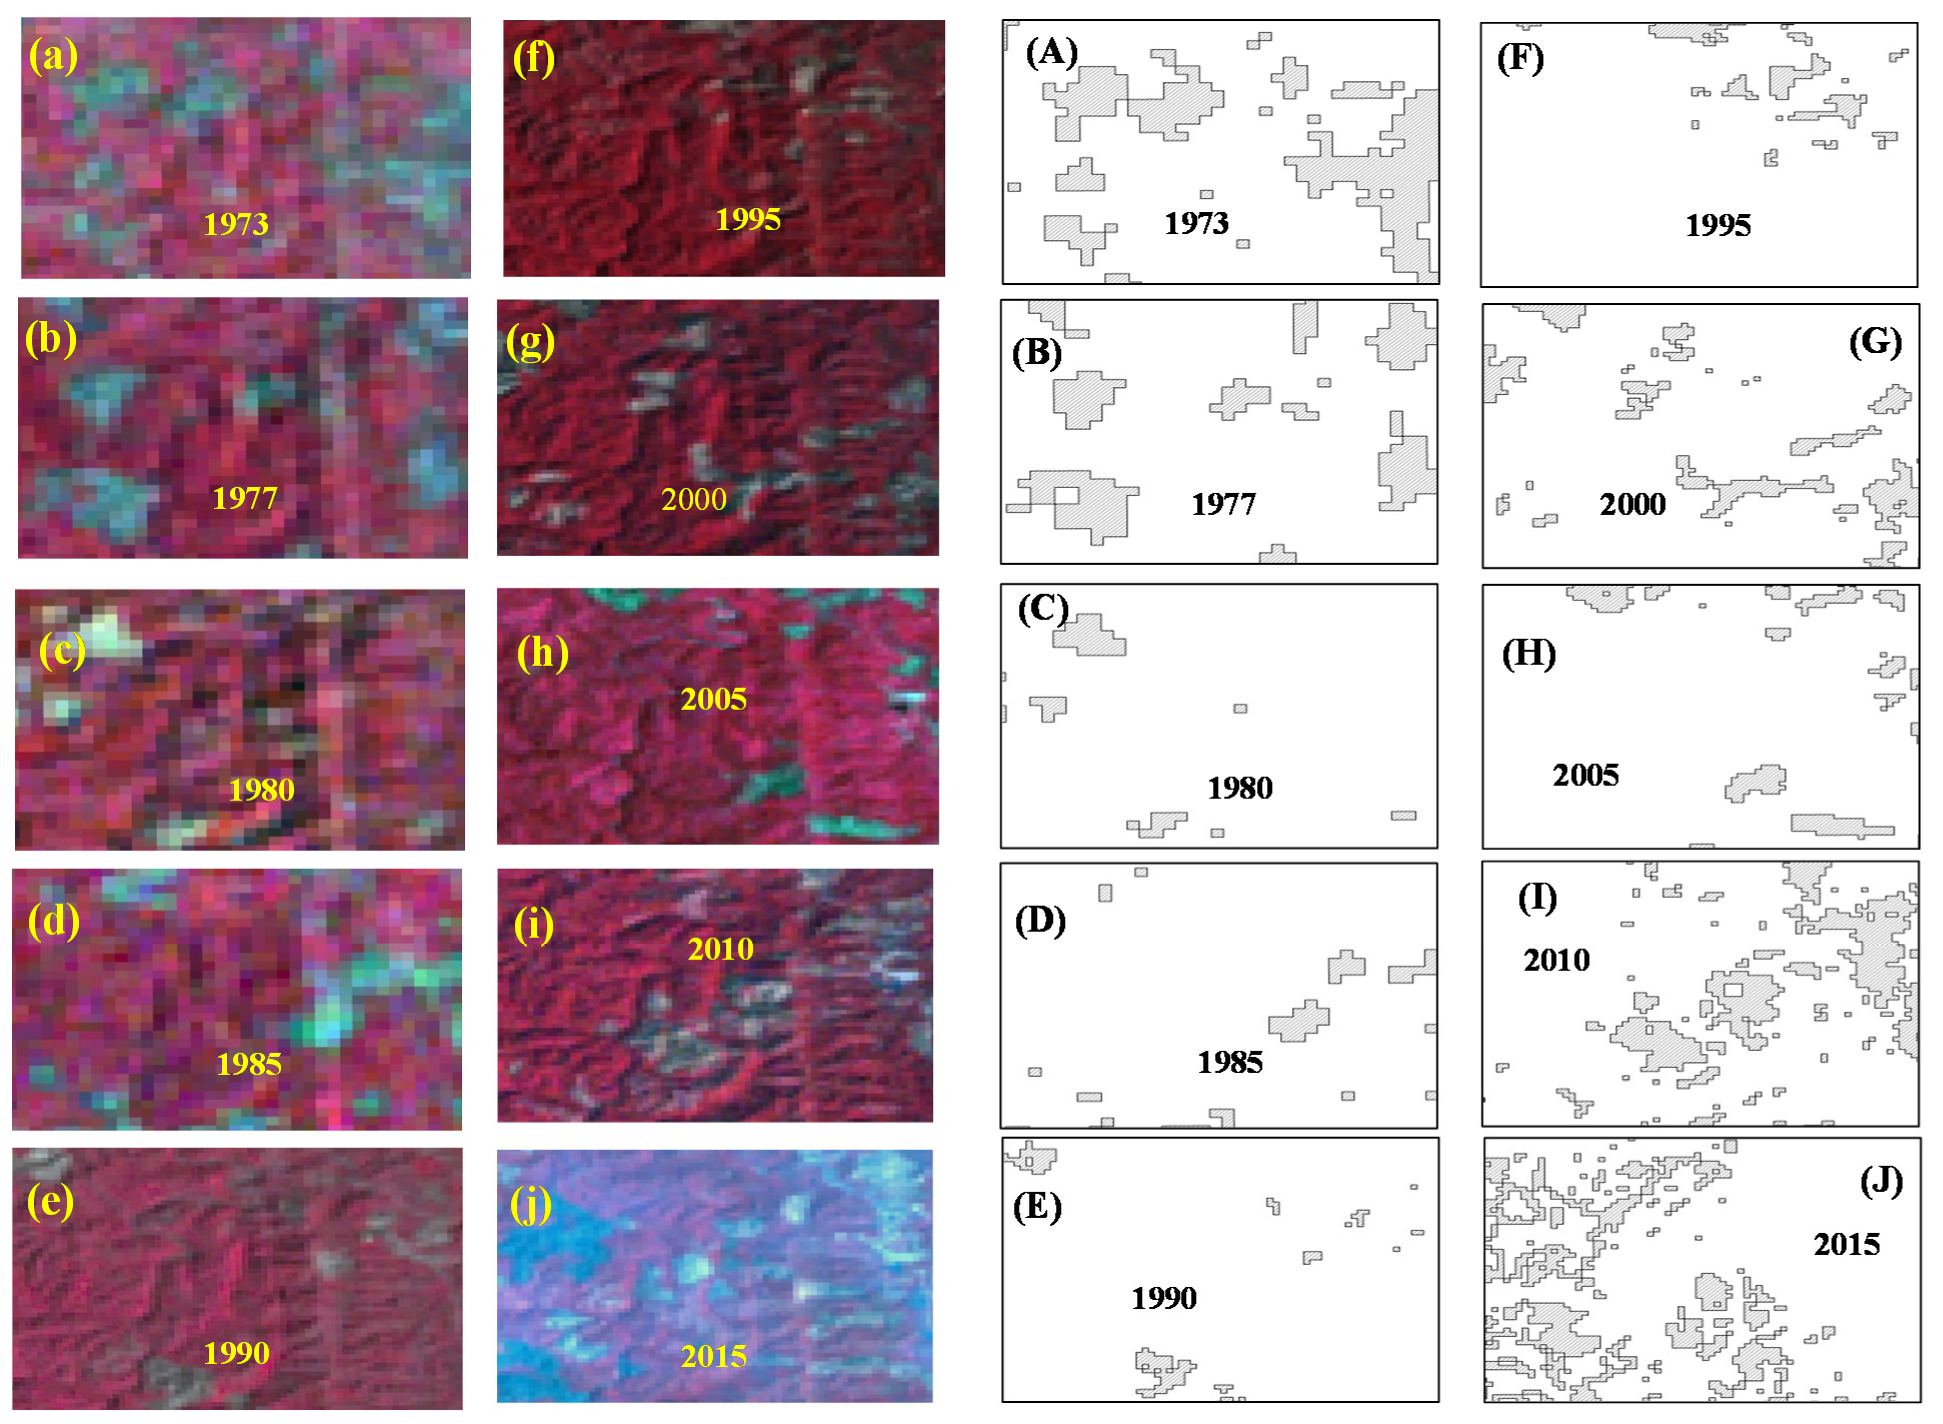
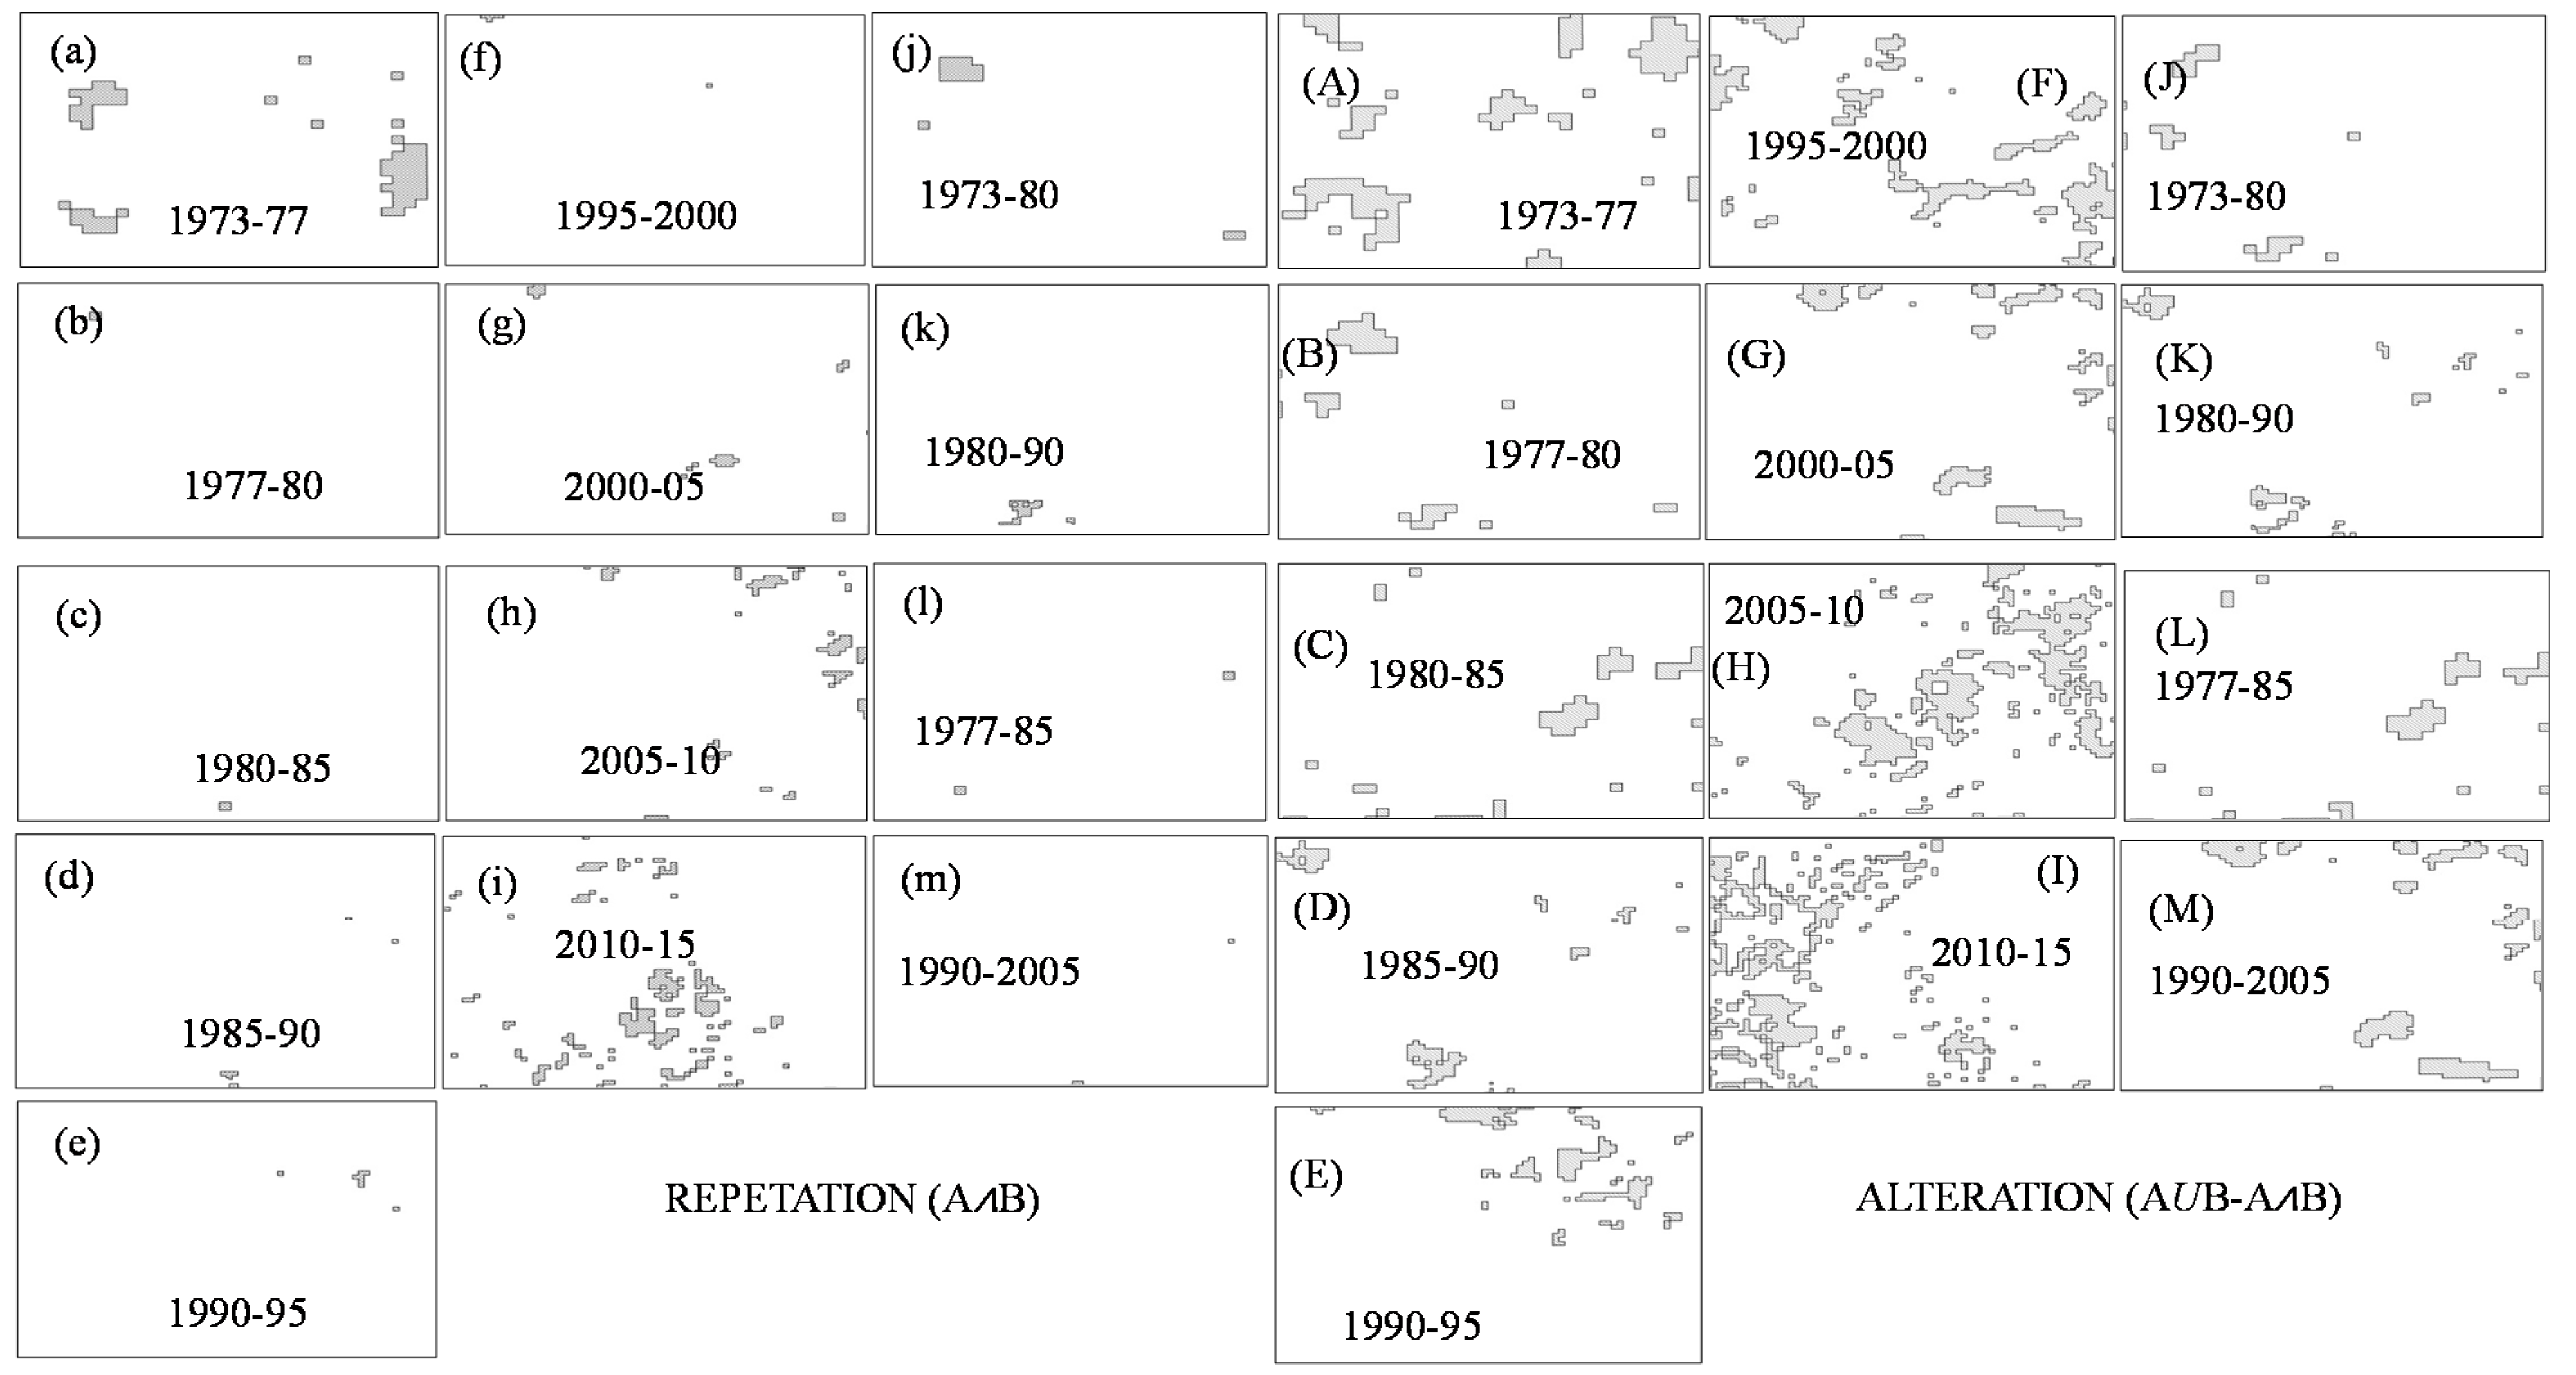
The visualization of the Landsat images on standard false color composites provided evidence of the conversion of forest cover (red color) to non-forest fallow land (green/cyan). The NDVI derived shifting cultivation patches occurred with varied shape, size, and number in different years in selected test sites in NE India (Figure 2). Furthermore, the alternation and repetition pattern of shifting cultivation patches indicates irregularity in the pattern from 1973 to 2015 in the test sites in NE India, with larger patches during the early decades and relatively smaller patches beyond 2010. The repetition and alternation of shifting cultivation patches over selected test sites also demonstrated very irregular change patterns for <5 years, 5 years and >5 years period, indicating inherent difficulty in mapping and monitoring shifting cultivation dynamics using satellite data (Figure 3).
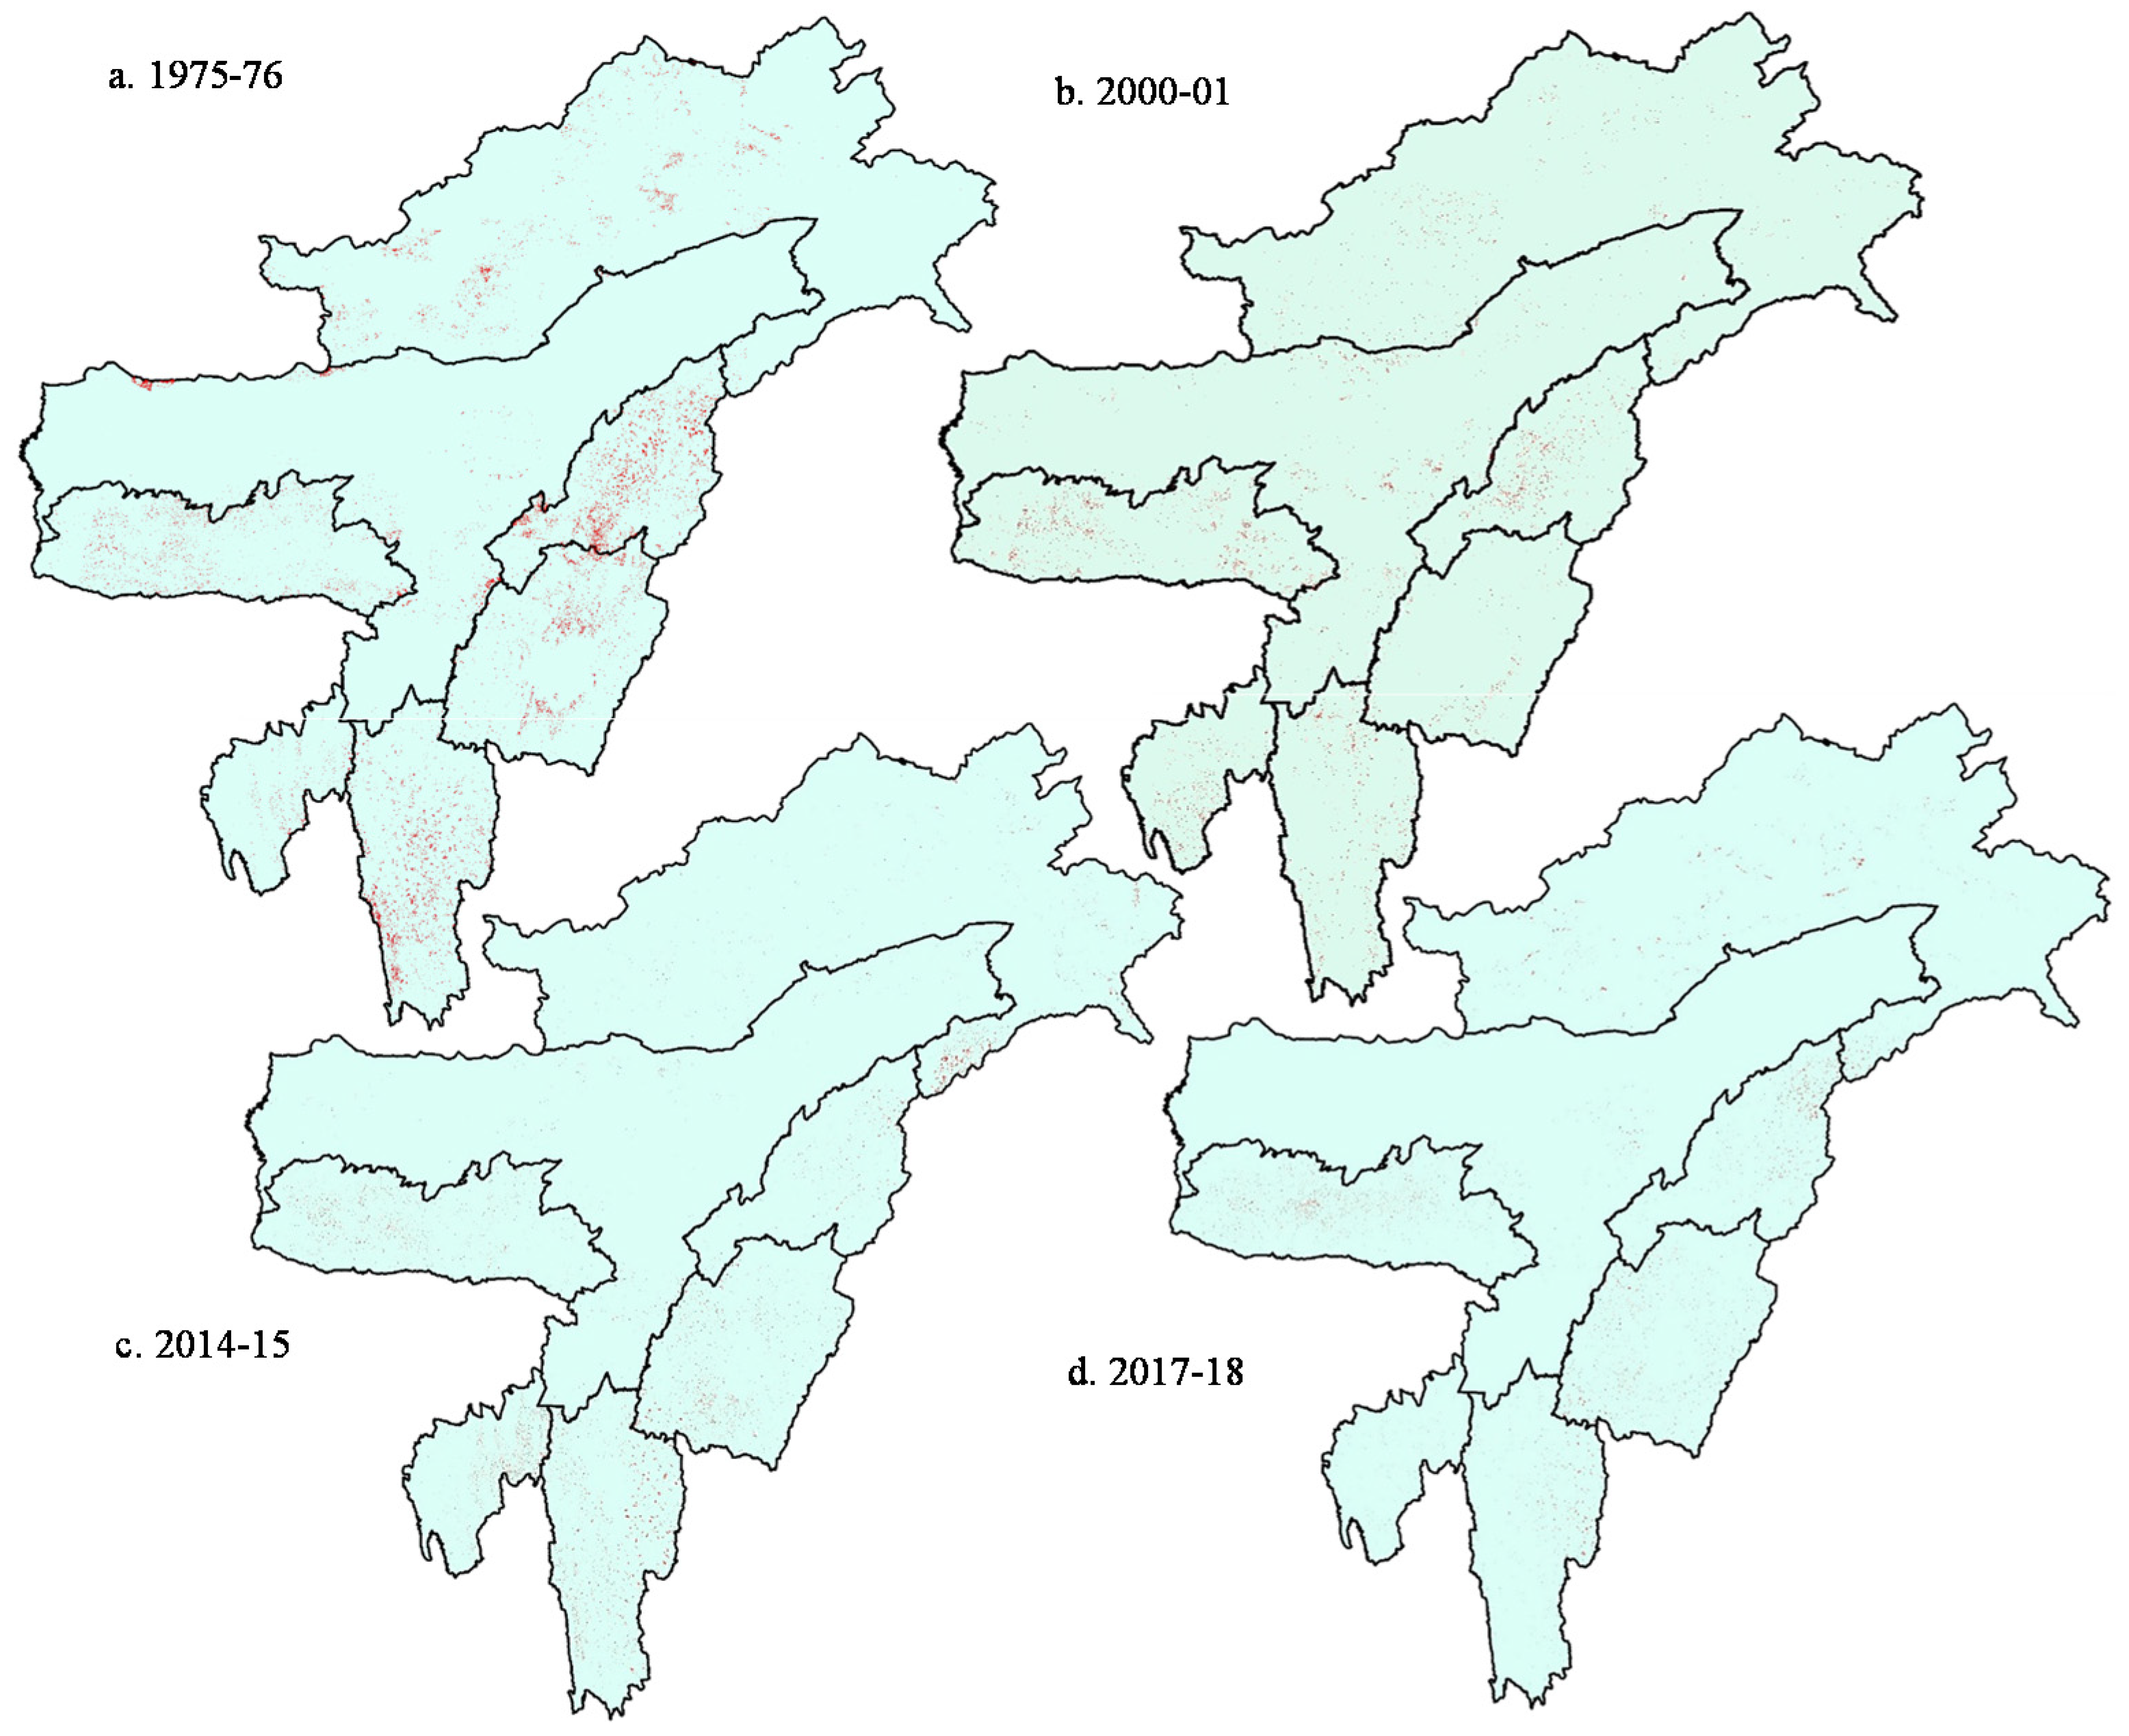
The shifting cultivation maps were generated for seven states of NE India for four time periods including 1975–1976, 2000–2001, 2014–2015, and 2017–2018 with over 85% of classification accuracy (Figure 6, Table 1). The highest classification accuracy was obtained for 2017–2018 with an overall accuracy of 89% and kappa value of 0.79, while the lowest was obtained for 2000–2001, with the overall accuracy and kappa values of 85.12% and 0.69, respectively (Table 1). The high User’s and Producer’s accuracy obtained for the entire NE India indicated the DTMT model’s suitability for mapping shifting cultivation areas even in highly rugged and heterogeneous landscape (Figure 4 and Figure 5). The lowest average reduction in NDVI value due to vegetation loss was 0.3, leading to the formulation of the threshold criteria of 0.4 < NDVI_Pre_R1 < 0.5 to define the sub-classes (Figure 4). Similarly, the average change in NDVI values was moderate (dNDVI, 0.35) for NDVI_Pre_R2 (0.5–0.6) and NDVI_Pre_R3 (0.6–0.7), and maximum (dNDVI, 0.4) for the higher NDVI classes (NDVI_Pre_R4 > 0.7), which were used to define the sub-classes in each category. In the dNDVI sub-class 1 and 2, the dNBR and RdNBR values ranged between ≤0.7 and >10, and varied between >0.7 and >15 for sub-class 3 (Figure 5). Similarly, in the NDVI value range of 0.5–0.6 (NDVI_ Pre _R2), the dNDVI image was categorized into three sub-classes with a threshold value of 0.35 along with the dNBR threshold value of 0.7 and RdNBR threshold values between 10 and 15 (Figure 5).
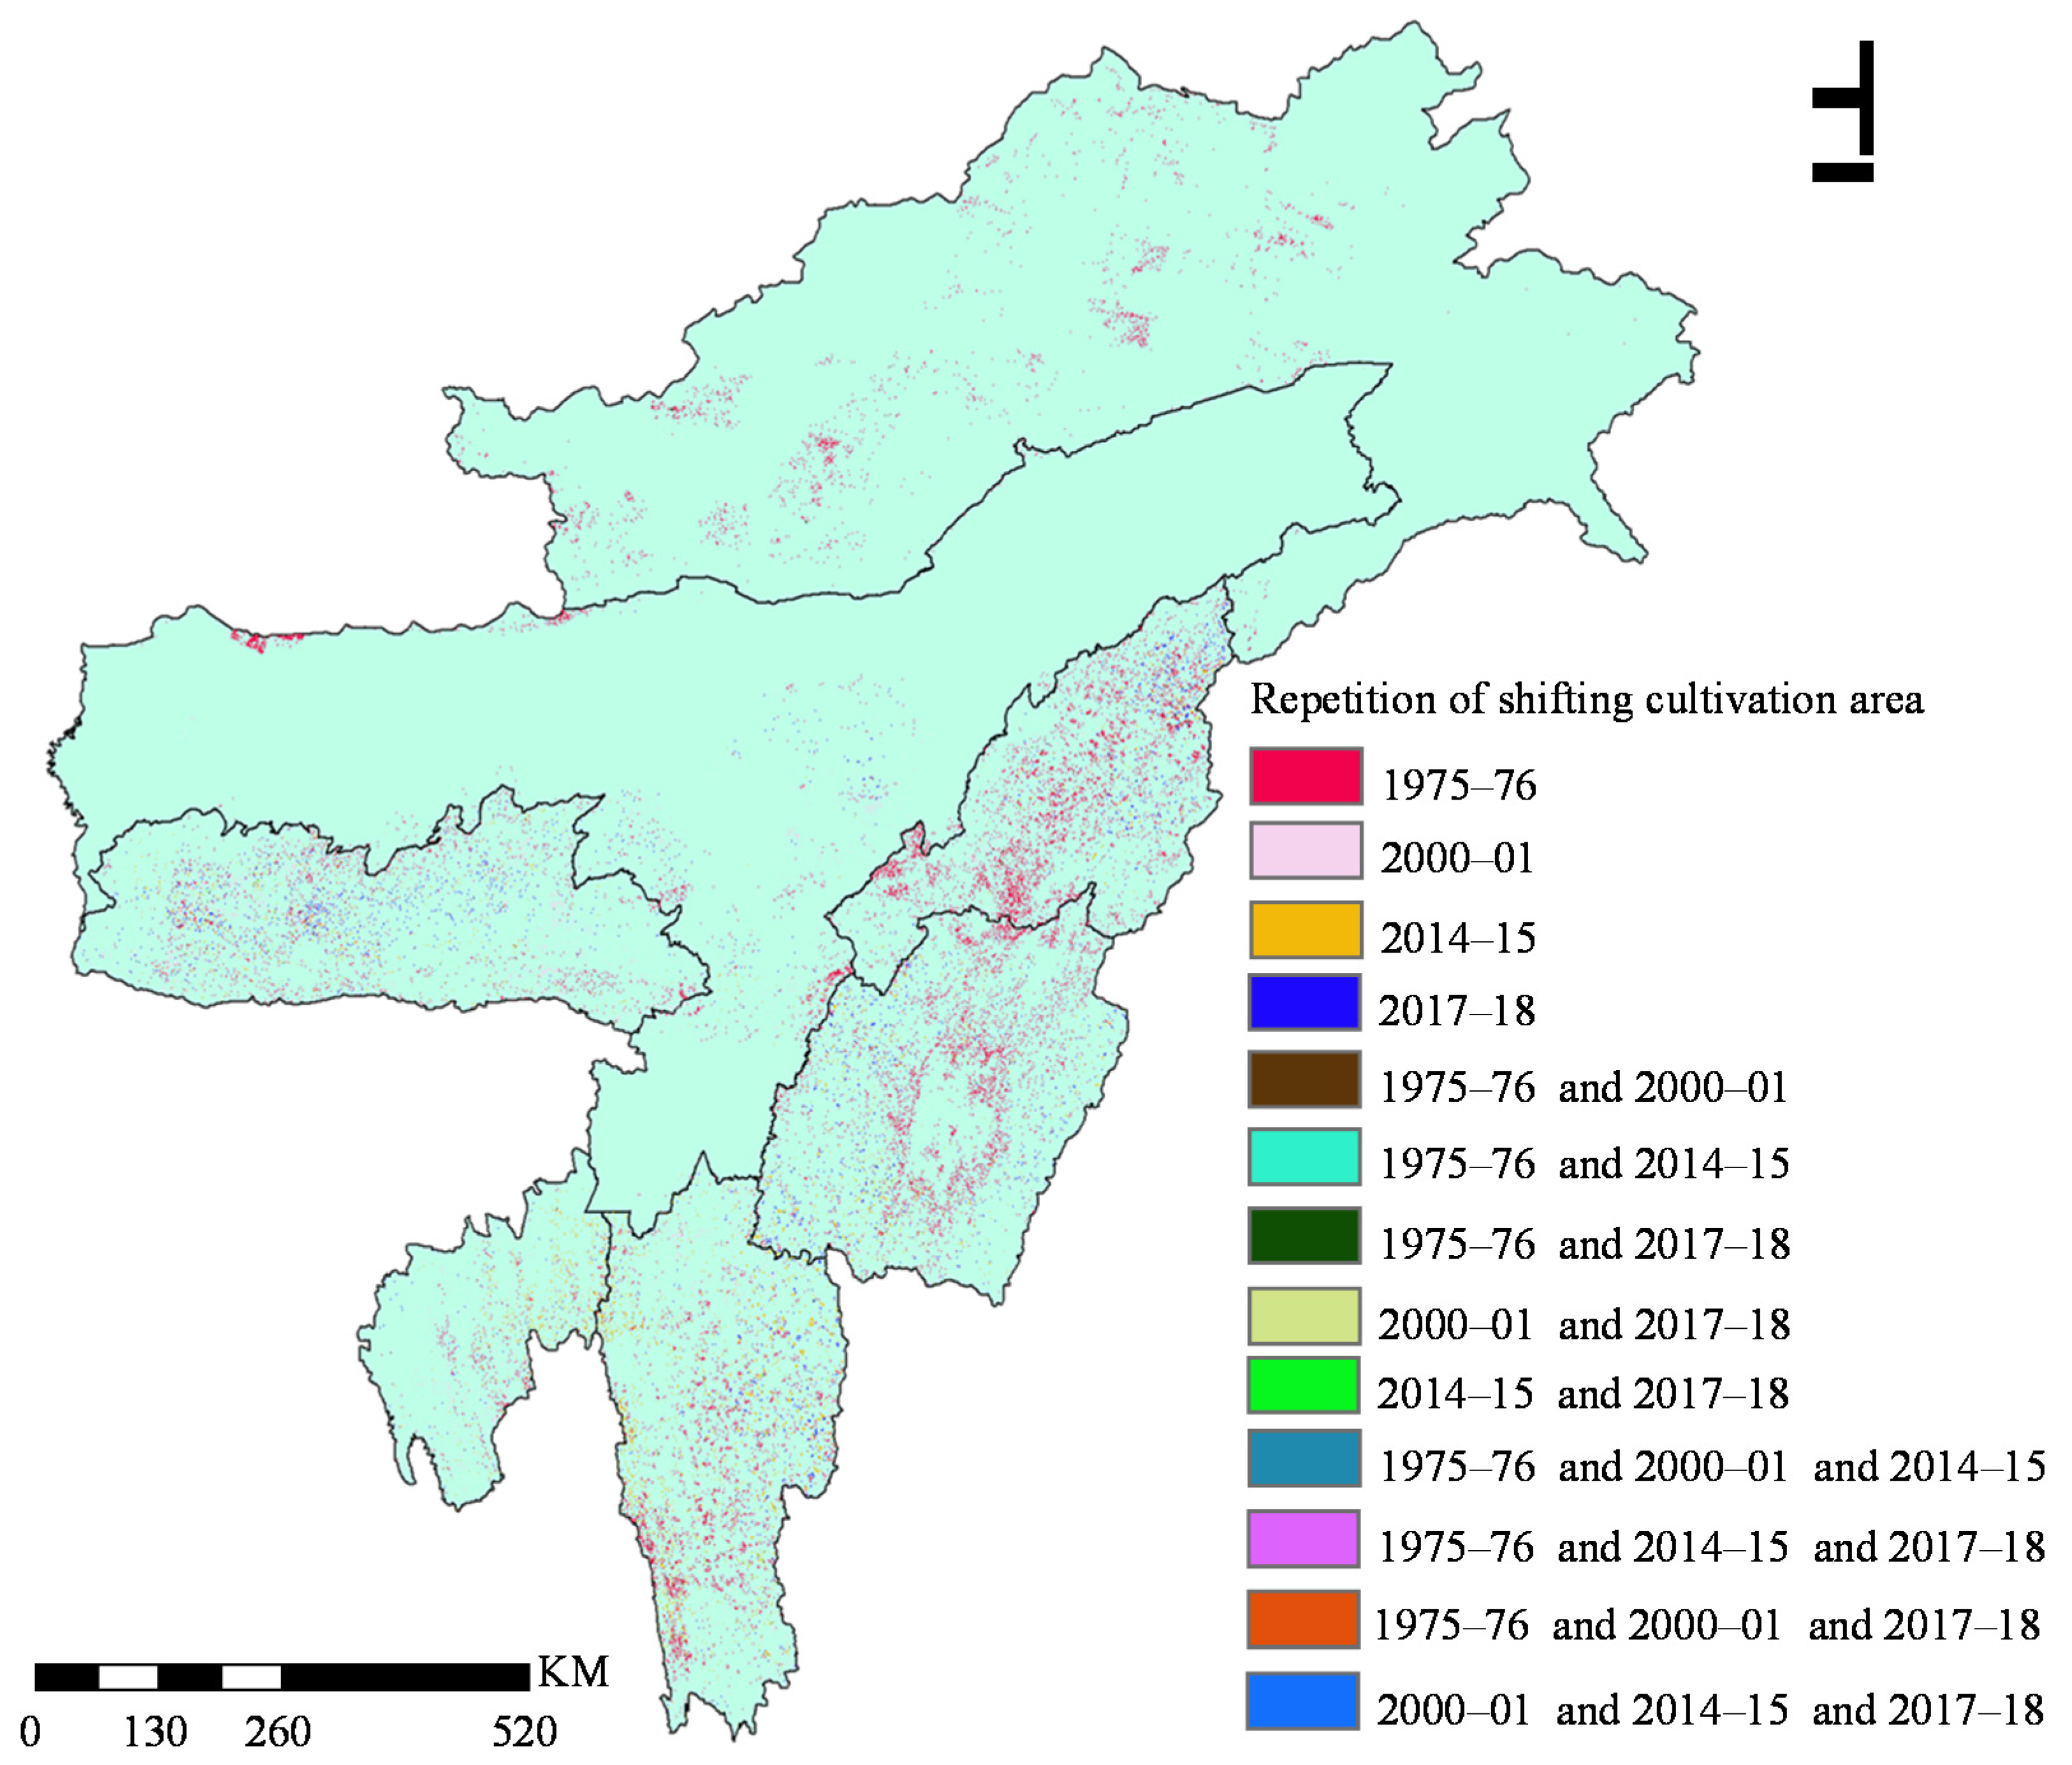
A maximum of 3505.86 km2 deforested area was observed for NE India during 1975–1976, which was reduced to 1511.88 km2, 1147.77 km2, and 878.72 km2 during 2000–2001, 2014–2015 and 2017–2018 respectively (Figure 6; Table 2). The dimensions of the shifting cultivation patches were too small to be noticed on the map (Figure 6). The state-wise maximum deforested area during 1975–1976 was recorded for Nagaland as 837.85 km2 with the lowest area for Tripura (122.47 km2) and Assam (288.22 km2). A significant reduction in the total shifting cultivation area (about 1994 km2) was observed between 1975–1976 and 2000–2001 with an overall decreasing trend during the entire period of 1975–1976 to 2017–2018. The maximum repetition in shifting cultivation of 55.78 km2 was observed between 1975–1976 and 2014–2015 followed by 49.24 km2 between 1975–1976 and 2000–2001, and 25.64 km2 between 1975–1976 and 2017–2018 (Figure 7; Table 3). However, such repetition between 2000–2001 and 2014–2015, and between 2000–2001 and 2017–2018 was comparatively less with an area of 17.71 km2 and 10.25 km2, respectively. Most of the repetitions were found in Meghalaya, Manipur, Nagaland, and Mizoram states. This pattern indicated a higher alteration in shifting cultivation patches than repetition over any specific area (Figure 7).
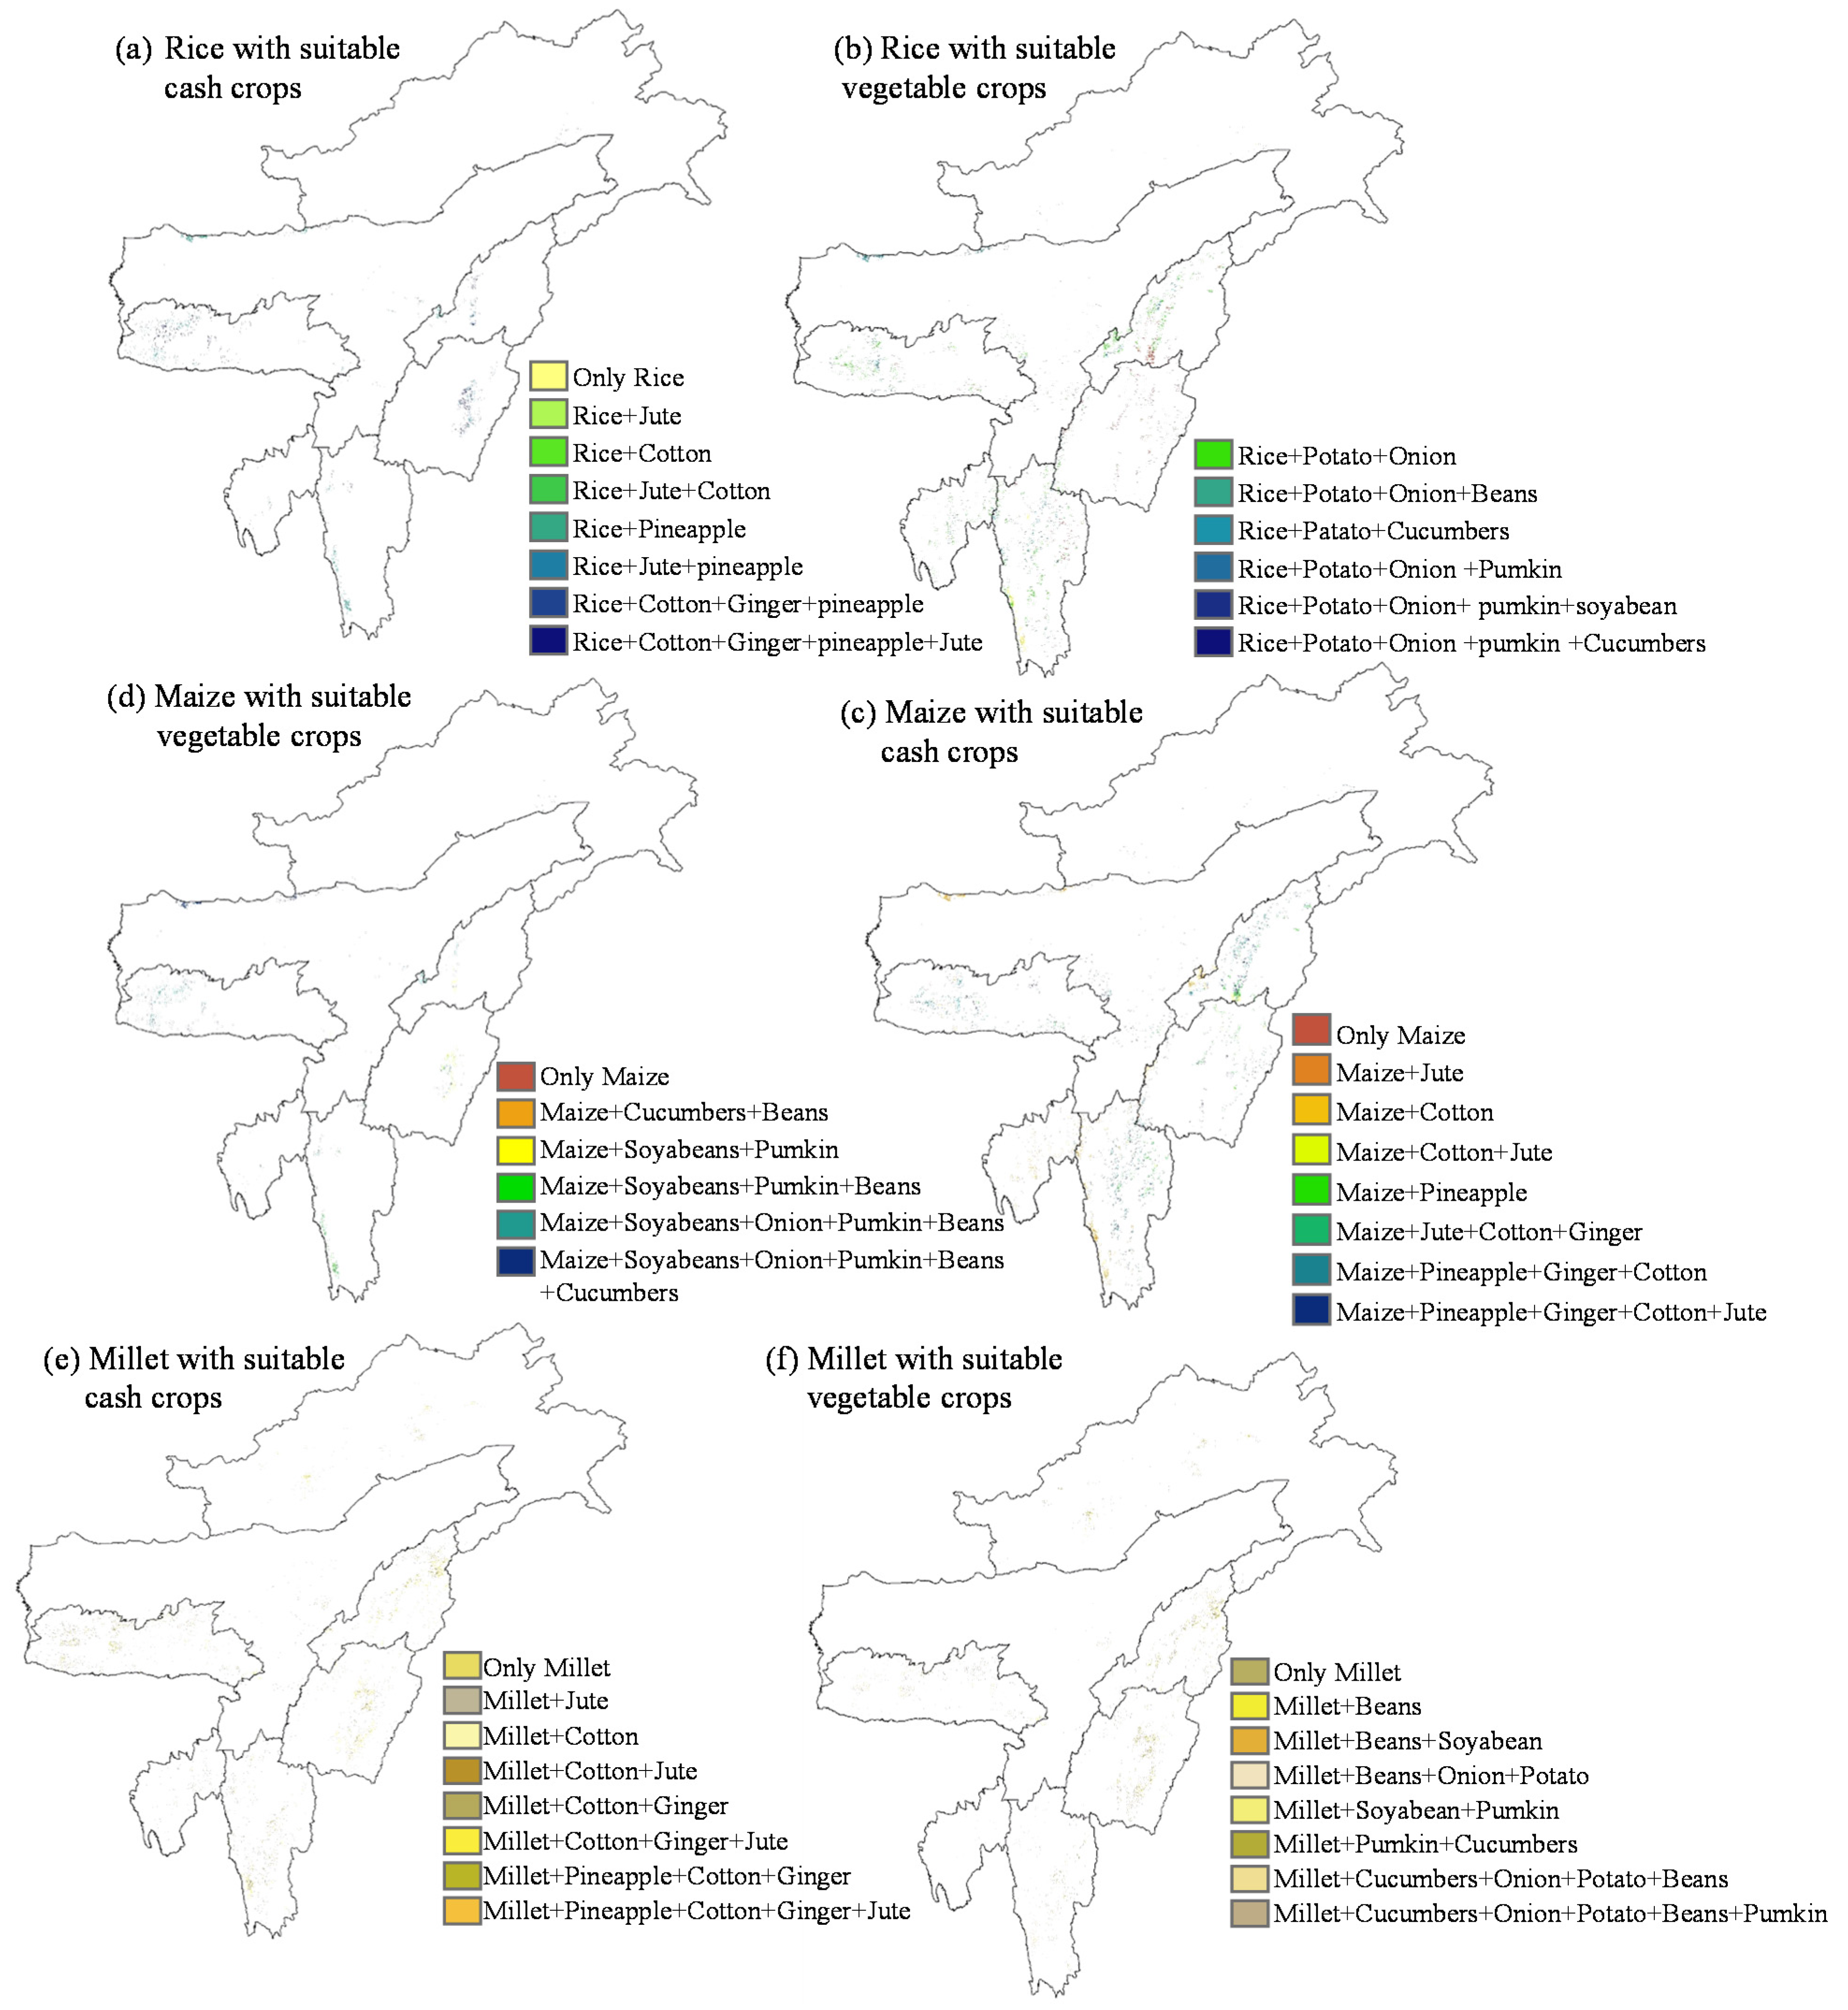
An ideal combination of soil types and pH with seasonal precipitation and temperature provided a suitable hydro-climatic set-up for the cultivation of food grains, cash crops, and vegetables (Figure 8). The suitable rice-growing regions with various cash crops and vegetables could potentially be around the Brahmaputra River valley owing to riverine alluvial soil and higher mean annual temperature, including the western part of Meghalaya and southern part of Assam (Figure 8a,b). However, the area suitability under maize crop along with various cash crops and vegetables may be prioritized in Assam, Tripura, Mizoram, and partly in Arunachal Pradesh, Meghalaya, Manipur, and Nagaland states (Figure 8c,d). Alternatively, the other hilly areas beyond the Brahmaputra River were suitable for millet with various cash crops and vegetables (Figure 8e,f). Two major crop types, maize and millet with vegetables and cash crops were projected for the dominant shifting cultivation areas in all the NE Indian states. In comparison to maize, millet-based suitable croplands were mostly observed for Arunachal Pradesh, Meghalaya, Manipur, and Nagaland. However, maize-based suitable croplands are dominantly estimated for Assam, Mizoram, and Tripura. The high altitudes in Arunachal Pradesh have been assessed more suitable for millet with multiple vegetables compared to cash crops, and the lower altitudes are seen as more suitable for rice and maize-based cash crops and vegetables. Similarly, most of the shifting cultivation areas in high altitudes of Nagaland and Manipur were deemed suitable for millet with vegetables compared to the cash crops, where the western parts of the state observed to be ideal for maize and rice with cash crops and vegetables. Most shifting cultivation areas in Mizoram were estimated as suitable for either maize or millet with cash crops and vegetables. The dimensions of the suitable crop patches are so small that they could hardly be noticed on the maps (Figure 8).
4. Discussion
The process of shifting cultivation essentially involves clearing of trees followed by burning of the dead plant materials during the dry post-monsoon seasons. Such productive land parcel is then used for agriculture for the next few years before being abandoned for natural forest regeneration for a varied number of years before the entire process is repeated. Less shifting cultivation area under repetition in the past 30 years indicates a higher alteration or clearing of new patches adjacent to existing patches. The minimal repetition area below 15 years period indicates long fallow periods, which is essential for reclamation of the biodiversity loss due to shifting cultivation, while less area below 30 years period allows for the recovery of the forest type as similar to the native primary forest. Though Ramakrishnan [1] reported on the increased repetition of shifting cultivation patches, no studies in the past have tried to map the patterns of repetition. Most of the past studies carried out on shifting cultivation area mapping in NE India using satellite data-based approaches used the visual image interpretation techniques. Such efforts lack reproducibility at a frequent temporal interval and acceptable accuracy (i.e., >85%). The DTMT classification framework applied here implied a broader application potential for shifting cultivation area mapping as it is based on vegetation indices. However, the various threshold ranges used here might deviate marginally based on atmospheric and topographic conditions. The deforested area with NDVI values >0.4 indicated loss of relatively healthy forest for shifting cultivation, while the exclusion of other sparse vegetation areas with NDVI > 0.3 reduced the chances of misclassification. Thus, the DTMT method-based classification might have missed clearing of some open forest or sparse scrubland for shifting cultivation. The consistency of mapping is attributed to the use of the difference in index values and high overall classification accuracy. The high overall accuracy of >85% is comparable with a few studies done on burned area mapping using the multiple thresholding method [24]. However, Mananze et al. [41] reported more than 89% overall accuracy while executing the RF machine learning model for shifting cultivation mapping in Mozambique using Landsat data. The varied approaches in mapping forest clearing and the time of clearing led to the incorporation of a range of threshold values, for example, the spectral response of recently burned areas would greatly differ from the old burned areas. The number of possible changes in land cover types such as clear tree felling, partial deforestation, presence of grassland after tree removal, etc., were accommodated with a range of threshold values leading to high overall classification accuracy.
In the current study, the NDVI threshold for pre-event and changes in indices (Pre- and post-event values of NDVI, NBR, and RdNBR) was used in categorizing the shifting cultivation areas. The least severely burned areas were identified with the thresholds value of ≤0.3, ≤0.7 and >10 corresponds to dNDVI, dNBR, and RdNBR. However, the corresponding thresholds values were >0.3, ≤0.7, and >10 for moderately burned areas, and >0.3, >0.7, and >15 for severely burned areas. Escuin, et al. [20] employed the changes (pre- and post-event) in index values of NBR and NDVI for burn severity mapping in three study sites. They classified the moderately burned areas with a mean dNDVI as ~0.238 and dNBR as ~0.275, and extremely burned areas with a comparatively higher value (mean dNDVI as ~0.368 and dNBR as ~0.594). In comparison, Li & Feng [24] developed a multi-step threshold (MST) classification scheme employing >10,000 training data points classified against one-time index values (NDVI, NBR, NDMI, and SAVI). They categorized the patches into five classes, where a lower NDVI threshold (≥0.10) was applied with the maximum NBR value of 0.40. Boschetti, et al. [23] employed a fuzzy classification technique for burned area mapping using the Advanced Spaceborne Thermal Emission and Reflection Radiometer (ASTER) data derived indices, where the values correspond to NBR varied between −0.21 and 0.31.
The total shifting cultivation area in NE India has experienced a significant reduction of 57% from 1975–1976 to 2000–2001. However, the reduction was 24% from 2000–2001 to 2014–2015, which further experienced a reduction of 23% from 2014–2015 to 2017–2018, respectively. The overall reduction in 32 years in shifting cultivation areas in NE India could be attributed to governmental and non-governmental initiatives, effective forest conservation and management activities, national and state policies, and improved shifting cultivation practices [38,42]. Pasha et al. [10] reviewed the reports on shifting cultivation areas for NE India generated by several agencies using two broad approaches as (i) survey-based analysis and (ii) satellite imagery-based mapping. Pasha, et al. [10] have applied an integrated spectral enhancement technique to map the shifting cultivation fallow in NE India, and reported 4479.8 km2 in 2016, and 4271.3 km2 in 2018. The area seemed overestimated as they neither considered the image pairs nor accounted for the differences in burned indices into their mapping protocol, leading to the inclusion of a few open or barren patches not of slash-and-burn origin. However, the FSI estimated 1730 km2 area under shifting cultivation using onscreen visual interpretation technique from 23.5m IRS 1C/1D data, which is comparable to our estimates of 1148 km2, and 879 km2 during 2014–2015 and 2017–2018 respectively using Landsat 30 m data.
The analysis of satellite image pairs of the same season from consecutive years allowed reliable classification of shifting cultivation areas. However, several factors affect the accuracy of shifting cultivation area mapping in NE India, such as the availability of cloud-free satellite data, the influence of topography and climate, different forest clearing approaches, temporal lag in deforestation events, and satellite data capture. One of the major issues with optical satellite-based mapping in NE India is cloud-free data availability, where the data captured between mid-January and March (the drier period) is most suitable for shifting cultivation mapping. The scenes with <20% cloud cover were only used in this study, and the cloud and cloud shadows were masked using suitable bands (Quality Control; QC layer). Moreover, temporal mismatch in images between two successive years could be a source of biases in the threshold values and lead to minor misclassification.
Landsat data archive has been proven as one of the potential data sources for long-term land surface mapping and monitoring at monthly to decadal scale at moderate resolution, where the use of GEE platform provides the opportunity for quick data processing without using local computing resources [43]. Several studies have used the Landsat data for various applications including long-term shifting cultivation mapping [44,45]. The formulation of the DTMT method within the GEE platform for automatic mapping helped overcome the typical obstacles encountered for reproducing such large-scale classification and change detection map products (Figure 6).
5. Conclusions
There is a lack of systematic assessment of shifting cultivation areas in NE India. Several attempts have been made to map shifting cultivation areas by various agencies, which have followed various methods, provided different area estimates and a lack of reliable and repeatable approach. We presented a DTMT approach employing multitemporal satellite data derived from various spectral indices and topographic proxies. The verification of the shifting cultivation maps for different periodic intervals and input data resolution with the field observations and high-resolution GE imagery indicated high mapping accuracy (overall accuracy >85%). The developed DTMT approach automatically identifies the shifting cultivation with minimal inputs and provides a reliable tool for systematic assessment at desired time intervals. The moderate resolution Landsat data achieve allowed for the generation of the shifting cultivation maps at decadal intervals. The GEE platform allowed to generate the shifting cultivation maps for broader dissemination. The GEE platform allows the replication of the process at desired time intervals, and the output maps can be accessed with a simple internet browser without needing specialized software. Most of the shifting cultivation areas in recent times have been observed in Mizoram, Arunachal Pradesh, and Manipur compared to the rest of the NE Indian states. Moreover, a significant rate of reduction was observed in the total shifting cultivation areas in all the states. The patch dynamics study indicated a long jhum cycle (less repetition) and high spatial autocorrelation between the current and previous deforested patches. The reproducible methodology and high accuracy with long-term Landsat data provided the opportunity to generate shifting cultivation maps for the past four decades, which can be transferred in other landscapes with minor modification in the threshold values. In addition to Landsat data, the latest Sentinel-2 data available since 2015 can be employed to identify patches with a finer spatial resolution. The use of the index-based method requires minimal modification in the threshold values, even for new satellite sensors.
The use of the high temporal resolution Sentinel-2 data would facilitate more cloud-free images and near real-time monitoring. Moreover, the errors may be minimized due to high temporal resolution. The future scope of the current study may include mapping of shifting cultivation areas and fallow period length at different scales. The generated maps and spatial statistics are useful for various scientific studies, forest resource management, sustainable land use planning, developing suitable plans for livelihood sustenance, and land restoration. Moreover, these maps offer high potential as inputs to the policy-making processes for shifting cultivation management in NE India. The crop-suitability maps generated in the current study are also important for agriculture and water resource managers and jhumias (cultivators engaged in shifting cultivation) for ecosystem restoration.
Supplementary Materials
The following are available online at https://0-www-mdpi-com.brum.beds.ac.uk/2072-4292/13/6/1066/s1, Table S1. Criteria used to prescribe suitable areas for shifting cultivation of staple crops along with cash crops and vegetables.
Author Contributions
Conceptualization, P.D., S.M., M.D.B. and S.K.B.; methodology, P.D., S.M. and M.D.B.; software, P.D. and S.M.; validation, P.D. and S.M.; formal analysis, P.D., S.M. and M.D.B.; investigation, P.D., S.M. and M.D.B.; resources, M.D.B. and S.K.B.; data curation, P.D. and S.M.; writing—original draft preparation, P.D., S.M. and M.D.B.; writing—D.R.M., S.K.B. and P.S.R.; visualization, P.D., S.M. and M.D.B.; supervision, M.D.B., D.R.M., S.K.B. and P.S.R.; project administration, M.D.B. and S.K.B.; funding acquisition, M.D.B. and S.K.B. All authors have read and agreed to the published version of the manuscript.
Funding
This research was funded by National Mission on Himalayan Studies (Ministry of Environment, Forest and Climate Change [MoEF & CC], India), grant number NMHS/LG-2016/005, and The APC was funded by DM.
Institutional Review Board Statement
Not applicable.
Informed Consent Statement
Not applicable.
Data Availability Statement
Not applicable.
Acknowledgments
The first and second authors acknowledge the ‘National Mission on Himalayan’ Studies (MOEF and CC, India) for providing Fellowships to conduct the study. We acknowledge the facilities provided by the authorities of Indian Institute of Technology Kharagpur, to undertake this study. The authors are grateful to North-Eastern Hill University (NEHU), Shillong, Meghalaya, Tripura State Forest Department, Central University of Nagaland, Mizoram, and Manipur for support during field sampling.
Conflicts of Interest
The authors declare no conflict of interest. The funders had no role in the design of the study; in the collection, analyses, or interpretation of data; in the writing of the manuscript, or in the decision to publish the results.
References
- Ramakrishnan, P.S. The Science behind Rotational Bush Fallow Agriculture System (Jhum). Proc. Plant Sci. 1984, 93, 379–400. [Google Scholar]
- Ralte, V.; Pandey, H.; Barik, S.; Tripathi, R.; Prabhu, S.D. Changes in microbial biomass and activity in relation to shifting cultivation and horticultural practices in subtropical evergreen forest ecosystem of north-east India. Acta Oecol. 2005, 28, 163–172. [Google Scholar] [CrossRef]
- Saha, R.; Chaudhary, R.S.; Somasundaram, J. Soil Health Management under Hill Agroecosystem of North East India. Appl. Environ. Soil Sci. 2012, 2012, 1–9. [Google Scholar] [CrossRef] [Green Version]
- Roy, P.S.; Behera, M.D. Assessment of Biological Richness in Different Altitudinal Zones in the Eastern Himalayas, Arunachal Pradesh, India. Curr. Sci. 2005, 250–257. [Google Scholar]
- Roy, P.S.; Kaul, R.N.; Roy, M.R.S.; Garbyal, S.S. Forest-type stratification and delineation of shifting cultivation areas in the eastern part of Arunachal Pradesh using LANDSAT MSS data. Int. J. Remote Sens. 1985, 6, 411–418. [Google Scholar] [CrossRef]
- Behera, M.D.; Kushwaha, S.P.S.; Roy, P.S. Forest Vegetation Characterization and Mapping Using IRS-1C Satellite Images in Eastern Himalayan Region. Geocarto Int. 2001, 16, 53–62. [Google Scholar] [CrossRef]
- Bartholomé, E.; Belward, A.S. GLC2000: A new approach to global land cover mapping from Earth observation data. Int. J. Remote Sens. 2005, 26, 1959–1977. [Google Scholar] [CrossRef]
- Hartter, J.; Lucas, C.; Gaughan, A.E.; Aranda, L.L. Detecting tropical dry forest succession in a shifting cultivation mosaic of the Yucatán Peninsula, Mexico. Appl. Geogr. 2008, 28, 134–149. [Google Scholar] [CrossRef]
- Heinimann, A.; Mertz, O.; Frolking, S.; Christensen, A.E.; Hurni, K.; Sedano, F.; Chini, L.P.; Sahajpal, R.; Hansen, M.; Hurtt, G. A global view of shifting cultivation: Recent, current, and future extent. PLoS ONE 2017, 12, e0184479. [Google Scholar] [CrossRef] [Green Version]
- Pasha, S.V.; Behera, M.D.; Mahawar, S.K.; Barik, S.K.; Joshi, S.R. Assessment of shifting cultivation fallows in Northeastern India using Landsat imageries. Trop. Ecol. 2020, 61, 65–75. [Google Scholar] [CrossRef]
- Lele, N.; Joshi, P.; Agrawal, S. Assessing forest fragmentation in northeastern region (NER) of India using landscape matrices. Ecol. Indic. 2008, 8, 657–663. [Google Scholar] [CrossRef]
- Reddy, C.S.; Jha, C.S.; Diwakar, P.G.; Dadhwal, V.K. Nationwide classification of forest types of India using remote sensing and GIS. Environ. Monit. Assess. 2015, 187, 1–30. [Google Scholar] [CrossRef]
- Roy, P.; Behera, M.; Murthy, M.; Roy, A.; Singh, S.; Kushwaha, S.; Jha, C.; Sudhakar, S.; Joshi, P.; Reddy, C.S.; et al. New vegetation type map of India prepared using satellite remote sensing: Comparison with global vegetation maps and utilities. Int. J. Appl. Earth Obs. Geoinform. 2015, 39, 142–159. [Google Scholar] [CrossRef]
- Murphy, K.A.; Reynolds, J.H.; Koltun, J.M. Evaluating the ability of the differenced Normalized Burn Ratio (dNBR) to predict ecologically significant burn severity in Alaskan boreal forests. Int. J. Wildland Fire 2008, 17, 490–499. [Google Scholar] [CrossRef]
- Long, T.; Zhang, Z.; He, G.; Jiao, W.; Tang, C.; Wu, B.; Zhang, X.; Wang, G.; Yin, R. 30 m Resolution Global Annual Burned Area Mapping Based on Landsat Images and Google Earth Engine. Remote Sens. 2019, 11, 489. [Google Scholar] [CrossRef] [Green Version]
- Key, C.H.; Benson, N.C. Landscape Assessment: Ground Measure of Severity, the Composite Burn Index; and Remote Sensing of Severity, the Normalized Burn Ratio. In FIREMON: Fire Effects Monitoring and Inventory System; USDA Forest Service, Rocky Mountain Research Statio: Ogden, UT, USA, 2006. [Google Scholar]
- Schneibel, A.; Stellmes, M.; Röder, A.; Frantz, D.; Kowalski, B.; Haß, E.; Hill, J. Assessment of spatio-temporal changes of smallholder cultivation patterns in the Angolan Miombo belt using segmentation of Landsat time series. Remote Sens. Environ. 2017, 195, 118–129. [Google Scholar] [CrossRef] [Green Version]
- Miller, J.D.; Thode, A.E. Quantifying burn severity in a heterogeneous landscape with a relative version of the delta Normalized Burn Ratio (dNBR). Remote Sens. Environ. 2007, 109, 66–80. [Google Scholar] [CrossRef]
- Kolden, C.A.; Smith, A.M.S.; Abatzoglou, J.T. Limitations and Utilization of Monitoring Trends in Burn Severity Products for Assessing Wildfire Severity in the USA. Int. J. Wildland Fire 2015, 24, 1023–1028. [Google Scholar] [CrossRef]
- Escuin, S.; Navarro, R.; Fernández, P. Fire severity assessment by using NBR (Normalized Burn Ratio) and NDVI (Normalized Difference Vegetation Index) derived from LANDSAT TM/ETM images. Int. J. Remote Sens. 2007, 29, 1053–1073. [Google Scholar] [CrossRef]
- Armenteras, D.; Rodriguez, N.; Retana, J. Landscape Dynamics in Northwestern Amazonia: An Assessment of Pastures, Fire and Illicit Crops as Drivers of Tropical Deforestation. PLoS ONE 2013, 8, e54310. [Google Scholar] [CrossRef] [PubMed] [Green Version]
- Tansey, K.; Beston, J.; Hościło, A.; Page, S.E.; Hernández, C.U.P. Relationship between MODIS fire hot spot count and burned area in a degraded tropical peat swamp forest in Central Kalimantan, Indonesia. J. Geophys. Res. Space Phys. 2008, 113, 113. [Google Scholar] [CrossRef] [Green Version]
- Boschetti, M.; Stroppiana, D.; Brivio, P.A. Mapping Burned Areas in a Mediterranean Environment Using Soft Integration of Spectral Indices from High-Resolution Satellite Images. Earth Interact. 2010, 14, 1–20. [Google Scholar] [CrossRef]
- Li, P.; Feng, Z. Extent and Area of Swidden in Montane Mainland Southeast Asia: Estimation by Multi-Step Thresholds with Landsat-8 OLI Data. Remote Sens. 2016, 8, 44. [Google Scholar] [CrossRef] [Green Version]
- Toky, O.; Ramakrishnan, P. Cropping and yields in agricultural systems of the north-eastern hill region of India. Agro-Ecosystems 1981, 7, 11–25. [Google Scholar] [CrossRef]
- Singh, J.S. Forests of Himalaya: Structure, Functioning and Impact of Man. Gyanodaya Prakashan. 1992. Available online: https://lib.icimod.org/record/3851 (accessed on 20 September 2020).
- Ramakrishnan, P.S.; Toky, O.P. Soil Nutrient Status of Hill Agro-Ecosystems and Recovery Pattern after Slash and Burn Agriculture (Jhum) in North-Eastern India. Plant Soil 1981, 60, 41–64. [Google Scholar] [CrossRef]
- Ranjan, R.; Upadhyay, V.P. Ecological Problems Due to Shifting Cultivation. Curr. Sci. 1999, 77, 1246–1250. [Google Scholar]
- Tripathi, R.S.; Barik, S.K. Shifting Cultivation in North East India. In Approaches for Increasing Agricultural Productivity in Hill and Mountain Ecosystem; ICAR: New Delhi, India, 2003; pp. 317–322. [Google Scholar]
- Behera, M.D.; Gupta, A.K.; Barik, S.K.; Das, P.; Panda, R.M. Use of satellite remote sensing as a monitoring tool for land and water resources development activities in an Indian tropical site. Environ. Monit. Assess. 2018, 190, 401. [Google Scholar] [CrossRef] [PubMed]
- Pant, R.M.; Tiwari, B.K.; Choudhury, D. Report of Working Group III Shifting Cultivation: Towards a Transformational Approach. In NITI Aayog New Delhi; 2018. Available online: https://niti.gov.in/writereaddata/files/document_publication/doc3.pdf (accessed on 20 September 2020).
- Luo, Q. Temperature thresholds and crop production: A review. Clim. Chang. 2011, 109, 583–598. [Google Scholar] [CrossRef]
- Sarkar, A.; Ghosh, A.; Banik, P. Multi-criteria land evaluation for suitability analysis of wheat: A case study of a watershed in eastern plateau region, India. Geo-Spat. Inf. Sci. 2014, 17, 119–128. [Google Scholar] [CrossRef] [Green Version]
- Hunter, R.; Crespo, O. Large Scale Crop Suitability Assessment Under Future Climate Using the Ecocrop Model: The Case of Six Provinces in Angola’s Planalto Region. In The Climate-Smart Agriculture Papers; Springer International Publishing: Berlin/Heidelberg, Germany, 2018; pp. 39–48. [Google Scholar]
- India, P. Census of India 2011 Provisional Population Totals; Office of the Registrar General and Census Commissioner New Delhi: New Delhi, India, 2011.
- Peel, M.C.; Finlayson, B.L.; McMahon, T.A. Updated World Map of the Köppen-Geiger Climate Classification. Hydrol. Earth Syst. Sci. 2007, 11, 1633–1644. [Google Scholar] [CrossRef] [Green Version]
- Grogan, P.; Lalnunmawia, F.; Tripathi, S.K. Shifting cultivation in steeply sloped regions: A review of management options and research priorities for Mizoram state, Northeast India. Agrofor. Syst. 2012, 84, 163–177. [Google Scholar] [CrossRef]
- Behera, M.D.; Tripathi, O.P.; Das, P.; Srivastava, S.; Roy, P.; Joshi, C.; Behera, P.; Deka, J.; Kumar, P.; Khan, M.; et al. Remote sensing based deforestation analysis in Mahanadi and Brahmaputra river basin in India since 1985. J. Environ. Manag. 2018, 206, 1192–1203. [Google Scholar] [CrossRef]
- Vikaspedia. Available online: https://vikaspedia.in/agriculture/crop-production/technologies-for-ne-india/rice-seed-production/ (accessed on 20 September 2020).
- Agricare. Available online: https://agricare.kisanhelp.in/ (accessed on 20 September 2020).
- Mananze, S.; Pôças, I.; Cunha, M. Mapping and Assessing the Dynamics of Shifting Agricultural Landscapes Using Google Earth Engine Cloud Computing, a Case Study in Mozambique. Remote Sens. 2020, 12, 1279. [Google Scholar] [CrossRef] [Green Version]
- Gupta, A.K. Shifting Cultivation and Conservation of Biological Diversity in Tripura, Northeast India. Hum. Ecol. 2000, 28, 605–629. [Google Scholar] [CrossRef]
- Gumma, M.K.; Thenkabail, P.S.; Teluguntla, P.G.; Oliphant, A.; Xiong, J.; Giri, C.; Pyla, V.; Dixit, S.; Whitbread, A.M. Agricultural Cropland Extent and Areas of South Asia Derived Using Landsat Satellite 30-m Time-Series Big-Data Using Random Forest Machine Learning Algorithms on the Google Earth Engine Cloud. GISci. Remote Sens. 2020, 57, 302–322. [Google Scholar] [CrossRef] [Green Version]
- Röder, A.; Hill, J.; Duguy, B.; Alloza, J.A.; Vallejo, R. Using long time series of Landsat data to monitor fire events and post-fire dynamics and identify driving factors. A case study in the Ayora region (eastern Spain). Remote Sens. Environ. 2008, 112, 259–273. [Google Scholar] [CrossRef]
- Thong, P.; Sahoo, U.K.; Pebam, R.; Thangjam, U. Spatial and temporal dynamics of shifting cultivation in Manipur, Northeast India based on time-series satellite data. Remote Sens. Appl. Soc. Environ. 2019, 14, 126–137. [Google Scholar] [CrossRef]
Figure 1.
(a) Location map of seven sister states (shaded with light red color) of Northeastern India (b) A standard false color composite, SFCC generated by mosaicking many Landsat images (year: 2018).
Figure 1.
(a) Location map of seven sister states (shaded with light red color) of Northeastern India (b) A standard false color composite, SFCC generated by mosaicking many Landsat images (year: 2018).

Figure 2.
SFCC Landsat images for different time periods (LHS; a–j) and the corresponding shifting cultivation patches identified from the NDVI change analysis (RHS; A–J).
Figure 2.
SFCC Landsat images for different time periods (LHS; a–j) and the corresponding shifting cultivation patches identified from the NDVI change analysis (RHS; A–J).

Figure 3.
Demonstration of the repetition (LHS; a–m) and corresponding alternation (RHS; A–M) pattern of shifting cultivation patches at different intervals over a test site in NE India.
Figure 3.
Demonstration of the repetition (LHS; a–m) and corresponding alternation (RHS; A–M) pattern of shifting cultivation patches at different intervals over a test site in NE India.

Figure 4.
Conceptual diagram of the decision tree-based multi-step threshold (DTMT) methodology adopted for mapping of shifting cultivation areas in NE India.
Figure 4.
Conceptual diagram of the decision tree-based multi-step threshold (DTMT) methodology adopted for mapping of shifting cultivation areas in NE India.

Figure 5.
Decision Tree-based Multi-Threshold (DTMT) values for shifting cultivation area mapping; the pixel values for burned areas were negative in difference images (dNDVI, dNBR and RdNBR), which were converted into absolute values for convenience of representation.
Figure 5.
Decision Tree-based Multi-Threshold (DTMT) values for shifting cultivation area mapping; the pixel values for burned areas were negative in difference images (dNDVI, dNBR and RdNBR), which were converted into absolute values for convenience of representation.

Figure 6.
The shifting cultivation maps were generated for seven states of NE India for four time periods (a) 1975–1976, (b) 2000–2001, (c) 2014–2015, and (d) 2017–2018 with over 85% of classification accuracy.
Figure 6.
The shifting cultivation maps were generated for seven states of NE India for four time periods (a) 1975–1976, (b) 2000–2001, (c) 2014–2015, and (d) 2017–2018 with over 85% of classification accuracy.

Figure 7.
Repetition map of shifting Cultivation areas demonstrated that overall there is higher alternation of shifting cultivation patches than repetition during the period of 1975 to 2018.
Figure 7.
Repetition map of shifting Cultivation areas demonstrated that overall there is higher alternation of shifting cultivation patches than repetition during the period of 1975 to 2018.

Figure 8.
Various crop-suitability maps (a) Rice with cash crops (b) Rice with vegetable crops (c) Maize with cash crops (d) Maize with vegetable crops (e) Millet with cash crops (f) Millet with vegetable crops for shifting cultivation areas in NE India.
Figure 8.
Various crop-suitability maps (a) Rice with cash crops (b) Rice with vegetable crops (c) Maize with cash crops (d) Maize with vegetable crops (e) Millet with cash crops (f) Millet with vegetable crops for shifting cultivation areas in NE India.


Table 1.
Classification accuracy assessment of shifting cultivation mapping in NE India.
| Year | User’s Accuracy | Producer’s Accuracy | Overall Accuracy | Kappa |
|---|---|---|---|---|
| 1975–1976 | 85.19% | 88.46% | 85.77% | 0.71 |
| 2000–2001 | 87.86% | 84.83% | 85.12% | 0.69 |
| 2014–2015 | 89.66% | 89.27% | 88.52% | 0.77 |
| 2017–2018 | 91.55% | 89.44% | 89.64% | 0.79 |
Table 2.
Shifting cultivation area statistics as mapped using DTMT method from Landsat data.
| State Name | Area (km2) | Change (in %) | |||||
|---|---|---|---|---|---|---|---|
| 1975–1976 | 2000–2001 | 2014–2015 | 2017–2018 | (2000–2001)–(1975–1976) | (2014–2015)–(2000–2001) | (2017–2018)–(2014–2015) | |
| Arunachal Pradesh | 538.54 | 218.67 | 233.50 | 214.21 | −59.40 | 6.78 | −8.26 |
| Assam | 288.22 | 276.05 | 63.11 | 30.79 | −4.22 | −77.14 | −51.21 |
| Manipur | 509.72 | 88.01 | 194.58 | 161.59 | −82.74 | 121.11 | −16.95 |
| Meghalaya | 447.24 | 383.18 | 179.52 | 102.15 | −14.32 | −53.15 | −43.10 |
| Nagaland | 837.85 | 212.55 | 79.18 | 119.38 | −74.63 | −62.75 | 50.77 |
| Tripura | 122.47 | 118.02 | 77.84 | 26.87 | −3.63 | −34.05 | −65.48 |
| Mizoram | 761.82 | 215.40 | 320.04 | 223.73 | −71.73 | 48.58 | −30.09 |
| Total | 3505.86 | 1511.87 | 1147.76 | 878.72 | −56.88 | −24.08 | −23.44 |
Table 3.
Area estimates of shifting cultivation repetition patches in NE India.
| Repetition Year | Area in km2 |
|---|---|
| 1975–1976 and 2014–2015 | 55.78 |
| 1975–1976 and 2000–2001 | 49.24 |
| 1975–1976 and 2017–2018 | 25.64 |
| 2000–2001 and 2014–2015 | 17.71 |
| 2000–2001 and 2017–2018 | 10.25 |
| 2014–2015 and 2017–2018 | 5.21 |
| 1975–1976 and 2014–2015 and 2017–2018 | 0.82 |
| 1975–1976 and 2000–2001 and 2014–2015 | 0.62 |
| 1975–1976 and 2000–2001 and 2017–2018 | 0.38 |
| 2000–2001 and 2014–2015 and 2017–2018 | 0.18 |
Publisher’s Note: MDPI stays neutral with regard to jurisdictional claims in published maps and institutional affiliations. |
© 2021 by the authors. Licensee MDPI, Basel, Switzerland. This article is an open access article distributed under the terms and conditions of the Creative Commons Attribution (CC BY) license (http://creativecommons.org/licenses/by/4.0/).
Share and Cite
MDPI and ACS Style
Das, P.; Mudi, S.; Behera, M.D.; Barik, S.K.; Mishra, D.R.; Roy, P.S. Automated Mapping for Long-Term Analysis of Shifting Cultivation in Northeast India. Remote Sens. 2021, 13, 1066. https://0-doi-org.brum.beds.ac.uk/10.3390/rs13061066
AMA Style
Das P, Mudi S, Behera MD, Barik SK, Mishra DR, Roy PS. Automated Mapping for Long-Term Analysis of Shifting Cultivation in Northeast India. Remote Sensing. 2021; 13(6):1066. https://0-doi-org.brum.beds.ac.uk/10.3390/rs13061066
Chicago/Turabian StyleDas, Pulakesh, Sujoy Mudi, Mukunda D. Behera, Saroj K. Barik, Deepak R. Mishra, and Parth S. Roy. 2021. "Automated Mapping for Long-Term Analysis of Shifting Cultivation in Northeast India" Remote Sensing 13, no. 6: 1066. https://0-doi-org.brum.beds.ac.uk/10.3390/rs13061066
Note that from the first issue of 2016, this journal uses article numbers instead of page numbers. See further details here.