Article

Urban Thermal Characteristics of Local Climate Zones and Their Mitigation Measures across Cities in Different Climate Zones of China

1
Institute of Urban Meteorology, China Meteorological Administration, Beijing 100089, China
2
Human Settlements Research Center, Liaoning Normal University, Dalian 116029, China
3
Jangho Architecture College, Northeastern University, Shenyang 110169, China
4
School of Environmental Science and Engineering, Tianjin University, Tianjin 300350, China
5
School of Atmospheric Physics, Nanjing University of Information Science and Technology, Nanjing 210044, China
*
Author to whom correspondence should be addressed.
Submission received: 1 March 2021 / Revised: 6 April 2021 / Accepted: 8 April 2021 / Published: 10 April 2021

Abstract

:
Understanding the urban thermal environment is vital for improving urban planning and strategy development when mitigating urban heat islands. However, urban thermal characteristics of local climate zones (LCZ) are different within cities and most studies lack regional perspective. This study explored surface thermal performances of cities in three urban agglomerations (Jing-Jin-Ji, Yangtze River Delta and Pearl River Delta) in China using MODIS land surface temperature (LST). Besides that, the diurnal and seasonal LST variations of LCZs are also studied. Moreover, the optimal LCZs for better urban cooling are also investigated in this study. Although the thermal distributions of LCZs are different in China, there are still some similar features. Our four key findings were as follows. (1) LCZs in China are well classified, with average overall accuracy of 82% being higher than that in some previous studies. (2) The LST of mid-rise (LCZ 2, 5) is higher than that of high- and low-rise buildings (LCZ 1, 3, 4, 6); and compact buildings are warmer than open buildings (LCZ 1–3 > LST 4–6) in summer of China. That shows both mid-rise and compact buildings are not beneficial to cool urban. In addition, LST variations at daytime and in summer are more significant than nighttime and other seasons. (3) LST differences within LCZs are significant at p < 0.05, and are most significant in Jing-Jin-Ji (JJJ). The LST difference within built types (LCZ 1–10) is more significant than within natural types (LCZ A–G), showing that built types alteration will be more effective for thermal environmental improvement. (4) Under the current population and urban area, increasing greenness and water area in compact high-rise buildings are the most effective strategies for urban cooling in all three urban agglomerations, with the largest reduction in LST of 4.11 K in JJJ. These findings will provide support for thermal environment mitigation, urban planning and sustainable urban development.

Graphical Abstract

1. Introduction

By 2050, 68% of the world’s population will live in urban areas, with 255 million living in China (https://www.un.org/development/desa/en/news/population/2018-revision-of-world-urbanization-prospects.html). Urbanization and population growth have brought a series of urban ecosystem problems, particularly in the urban thermal environment where urban heat islands (UHIs) have an important impact on public health and energy security [1]. This phenomenon is more significant in China, which has a greater urban population than many other counties and more rapid urban growth [2]. Previous studies have shown that the three-dimensional (3D) urban infrastructure affected land surface temperature (LST) more strongly than the 2D structure [3,4]. The 3D urban surface decreases surface albedo, storing more energy in the urban canopy, which further boosts the thermal environment [5]. In addition, the 3D urban surface affects urban ventilation by increasing surface roughness, which also affects the thermal environment [6]. Moreover, the impact of the 3D structure on UHIs varies depending on temporal scale, e.g., day and night [7]. Obtaining regional 3D surface information is usually difficult: for example, the building height, building density, etc. are mostly derived from digital surface models (DSMs), these in turn are based on airborne LiDAR data which are often limited [3,4].
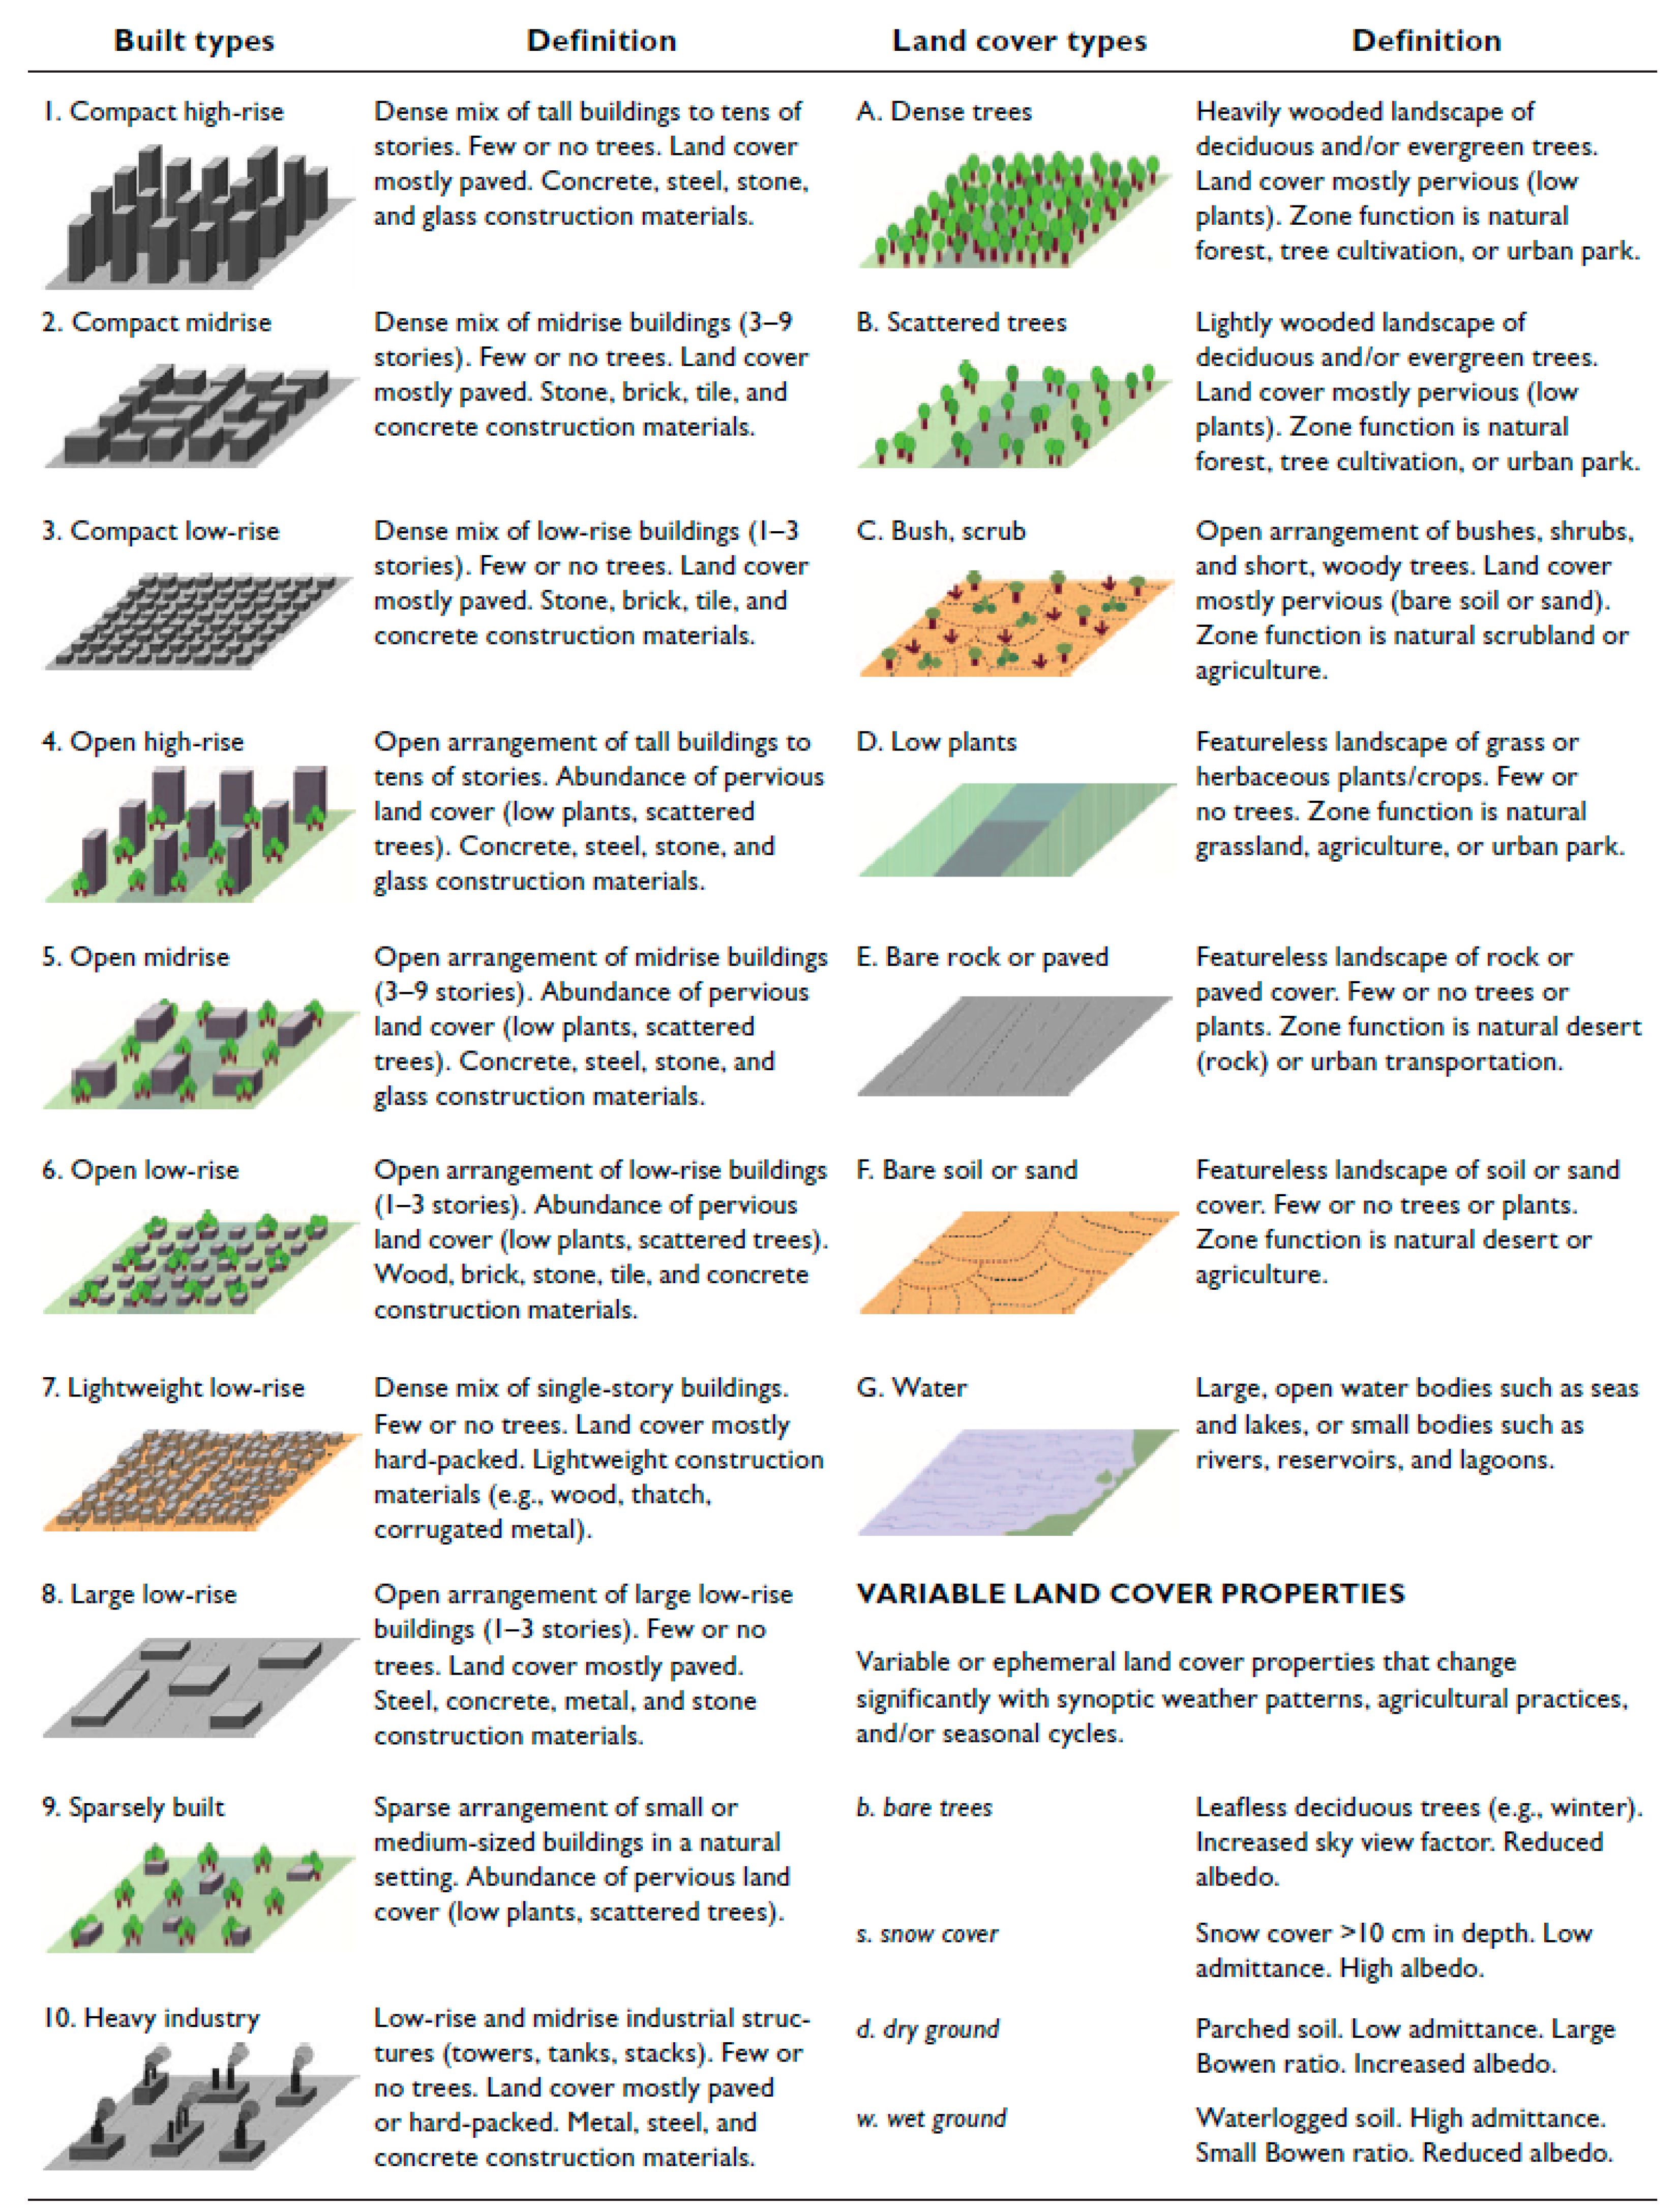
The local climate zone (LCZ) scheme provided by Stewart and Oke [8] categorizes urban surfaces into 10 building types and 7 natural types based on their surface morphology. LCZ enriches the normal 2D land use/land cover classification and provides more focus on the 3D spatial distribution. Moreover, the LCZ can be mapped using available satellite remote sensing data. Future 3D urban growth is an inevitable trend, and the LCZ will help to investigate urban thermal environmental processes and then to develop mitigation measures. LCZ has been popularly used in studies of urban LST features [9,10,11,12], UHI [13,14], urban ventilation [6], outdoor thermal comfort [15], and urban energy budgets [16,17]. WUDAPT (the World Urban Database and Access Portal Tools) provide a standard workflow for LCZ classification from free satellite remote sensing data (e.g., Landsat), using Google Earth images for sampling selection and SAGA software for classification [18]. The advantage of this approach is that it does not depend on city DSMs and can be applied to any city, using satellite images. An LCZ product of not less than 120 cities in different continents, established using the WUDAPT method as a supervised image classification, is being uploaded to the WUDAPT portal [19]. This method is also widely used in China [10,11]. LST varies among different LCZs with higher LST over built-type LCZs and lower LST over natural-type LCZs [9,20,21]. However, the spatiotemporal variations of LST based on LCZs are different across different cities [22,23,24]. Du et al. [25] showed that remote-sensed LST varied with LCZ and seasons in Nanjing, China, with the largest LST difference in summer. However, LST is negatively correlated with building height in all seasons, with the highest mean LST for large low-rise buildings (LCZ 8). Chen et al. [10] showed that the remote-sensed LST distribution was quite different during day and night in Guangzhou and Hongkong. The highest daytime LST was usually obtained in high-density and low-rise areas (e.g., LCZ 3 and 8), while the highest night time LST was observed in high-density and high- or mid-rise urban areas (e.g., LCZ 1 and 2). However, Yang et al. [6] showed high-density high-rise buildings had higher LSTs than other building types in Shanghai, China. Yang et al. [9] reported that LCZ 7 (industry) had the highest LST derived from Landsat 8, in a study of Pearl River Delta cities; they also showed that cities with larger areas usually had higher LSTs. To enhance outdoor thermal comfort, cool cities and cool communities should be promoted with increasing water and vegetation area [26]. While, for developing countries with densely population, there should have enough built area to accommodate population. Therefore, the reasonable configuration of built and natural surfaces with current urban area and population is essential for mitigating urban heat island and urban planning [27].
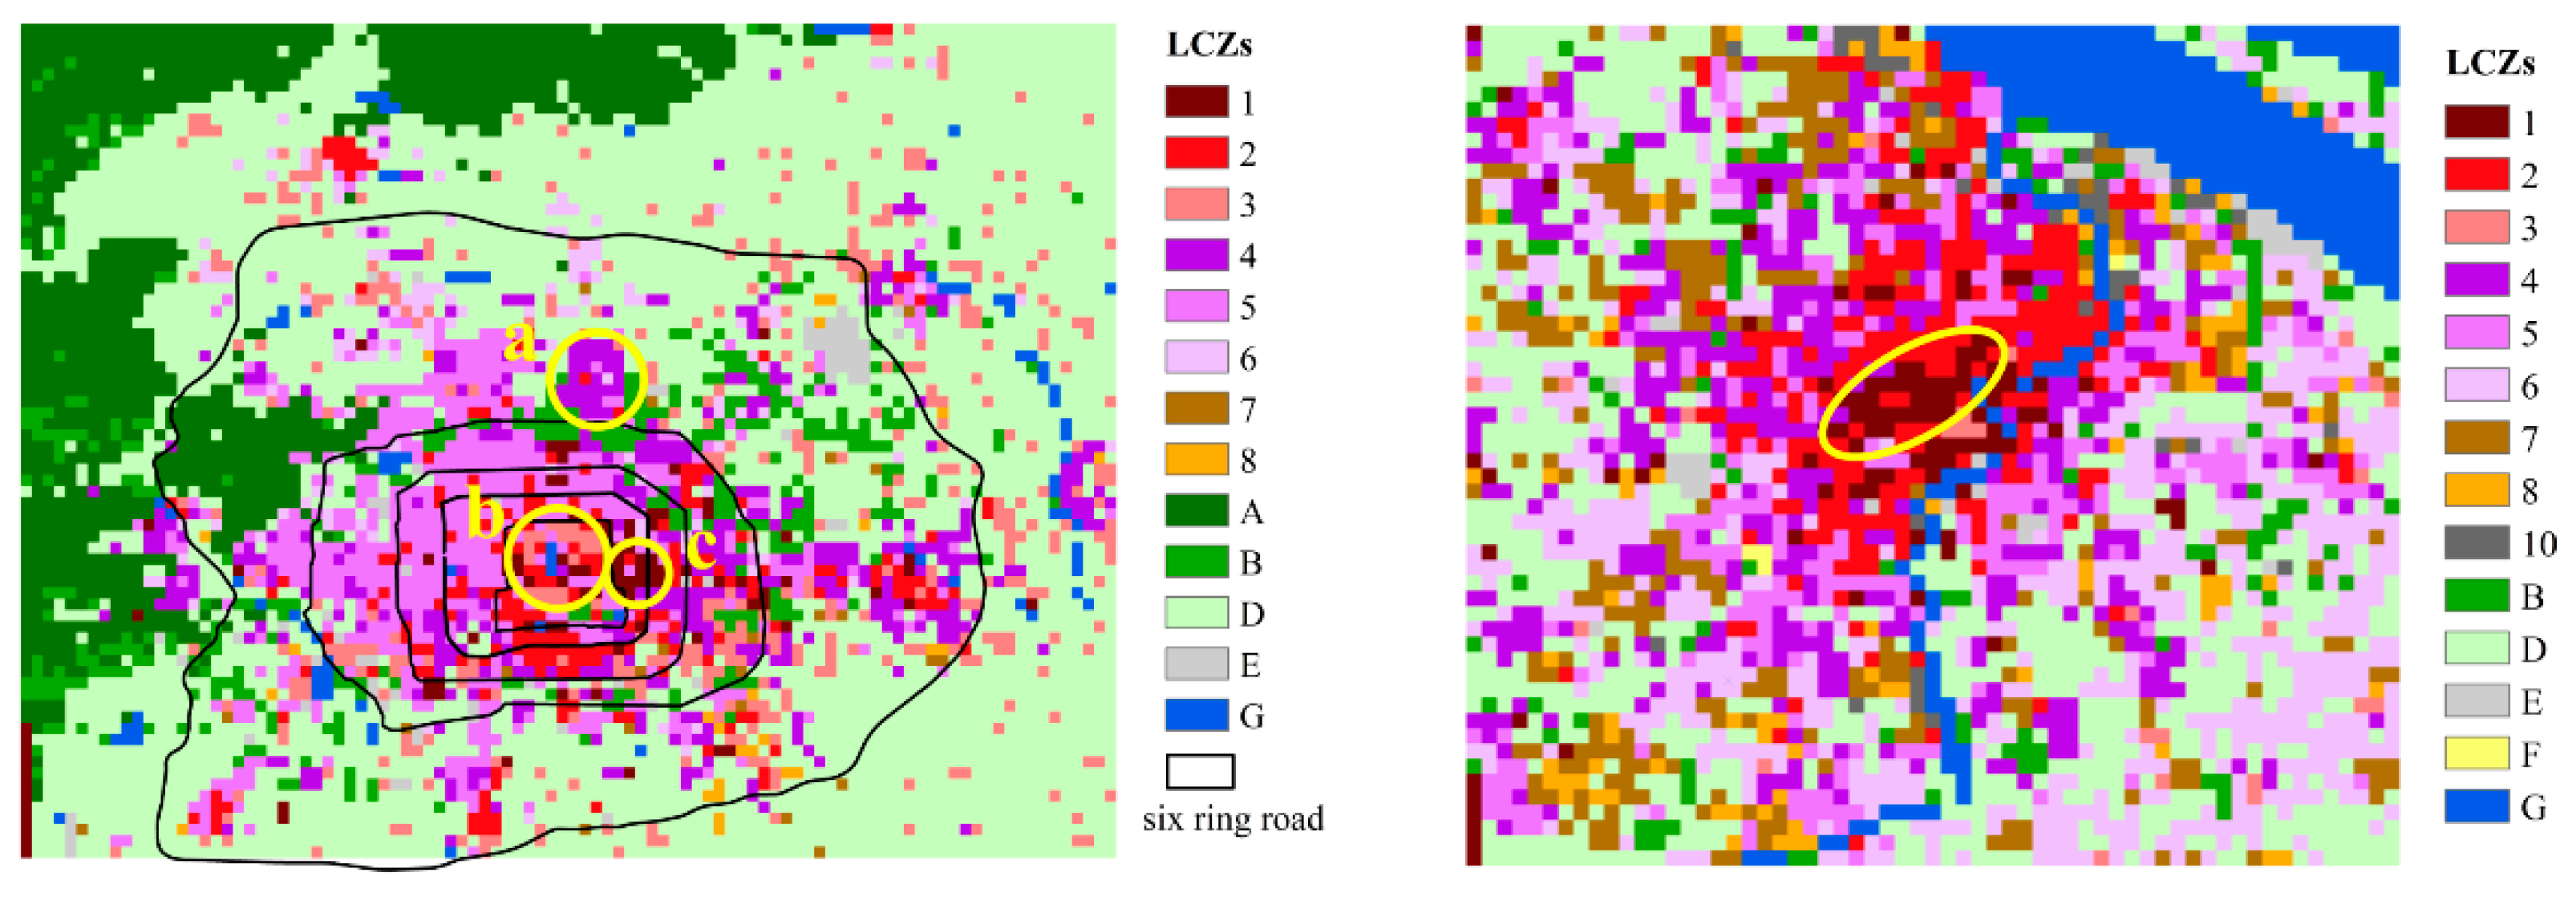
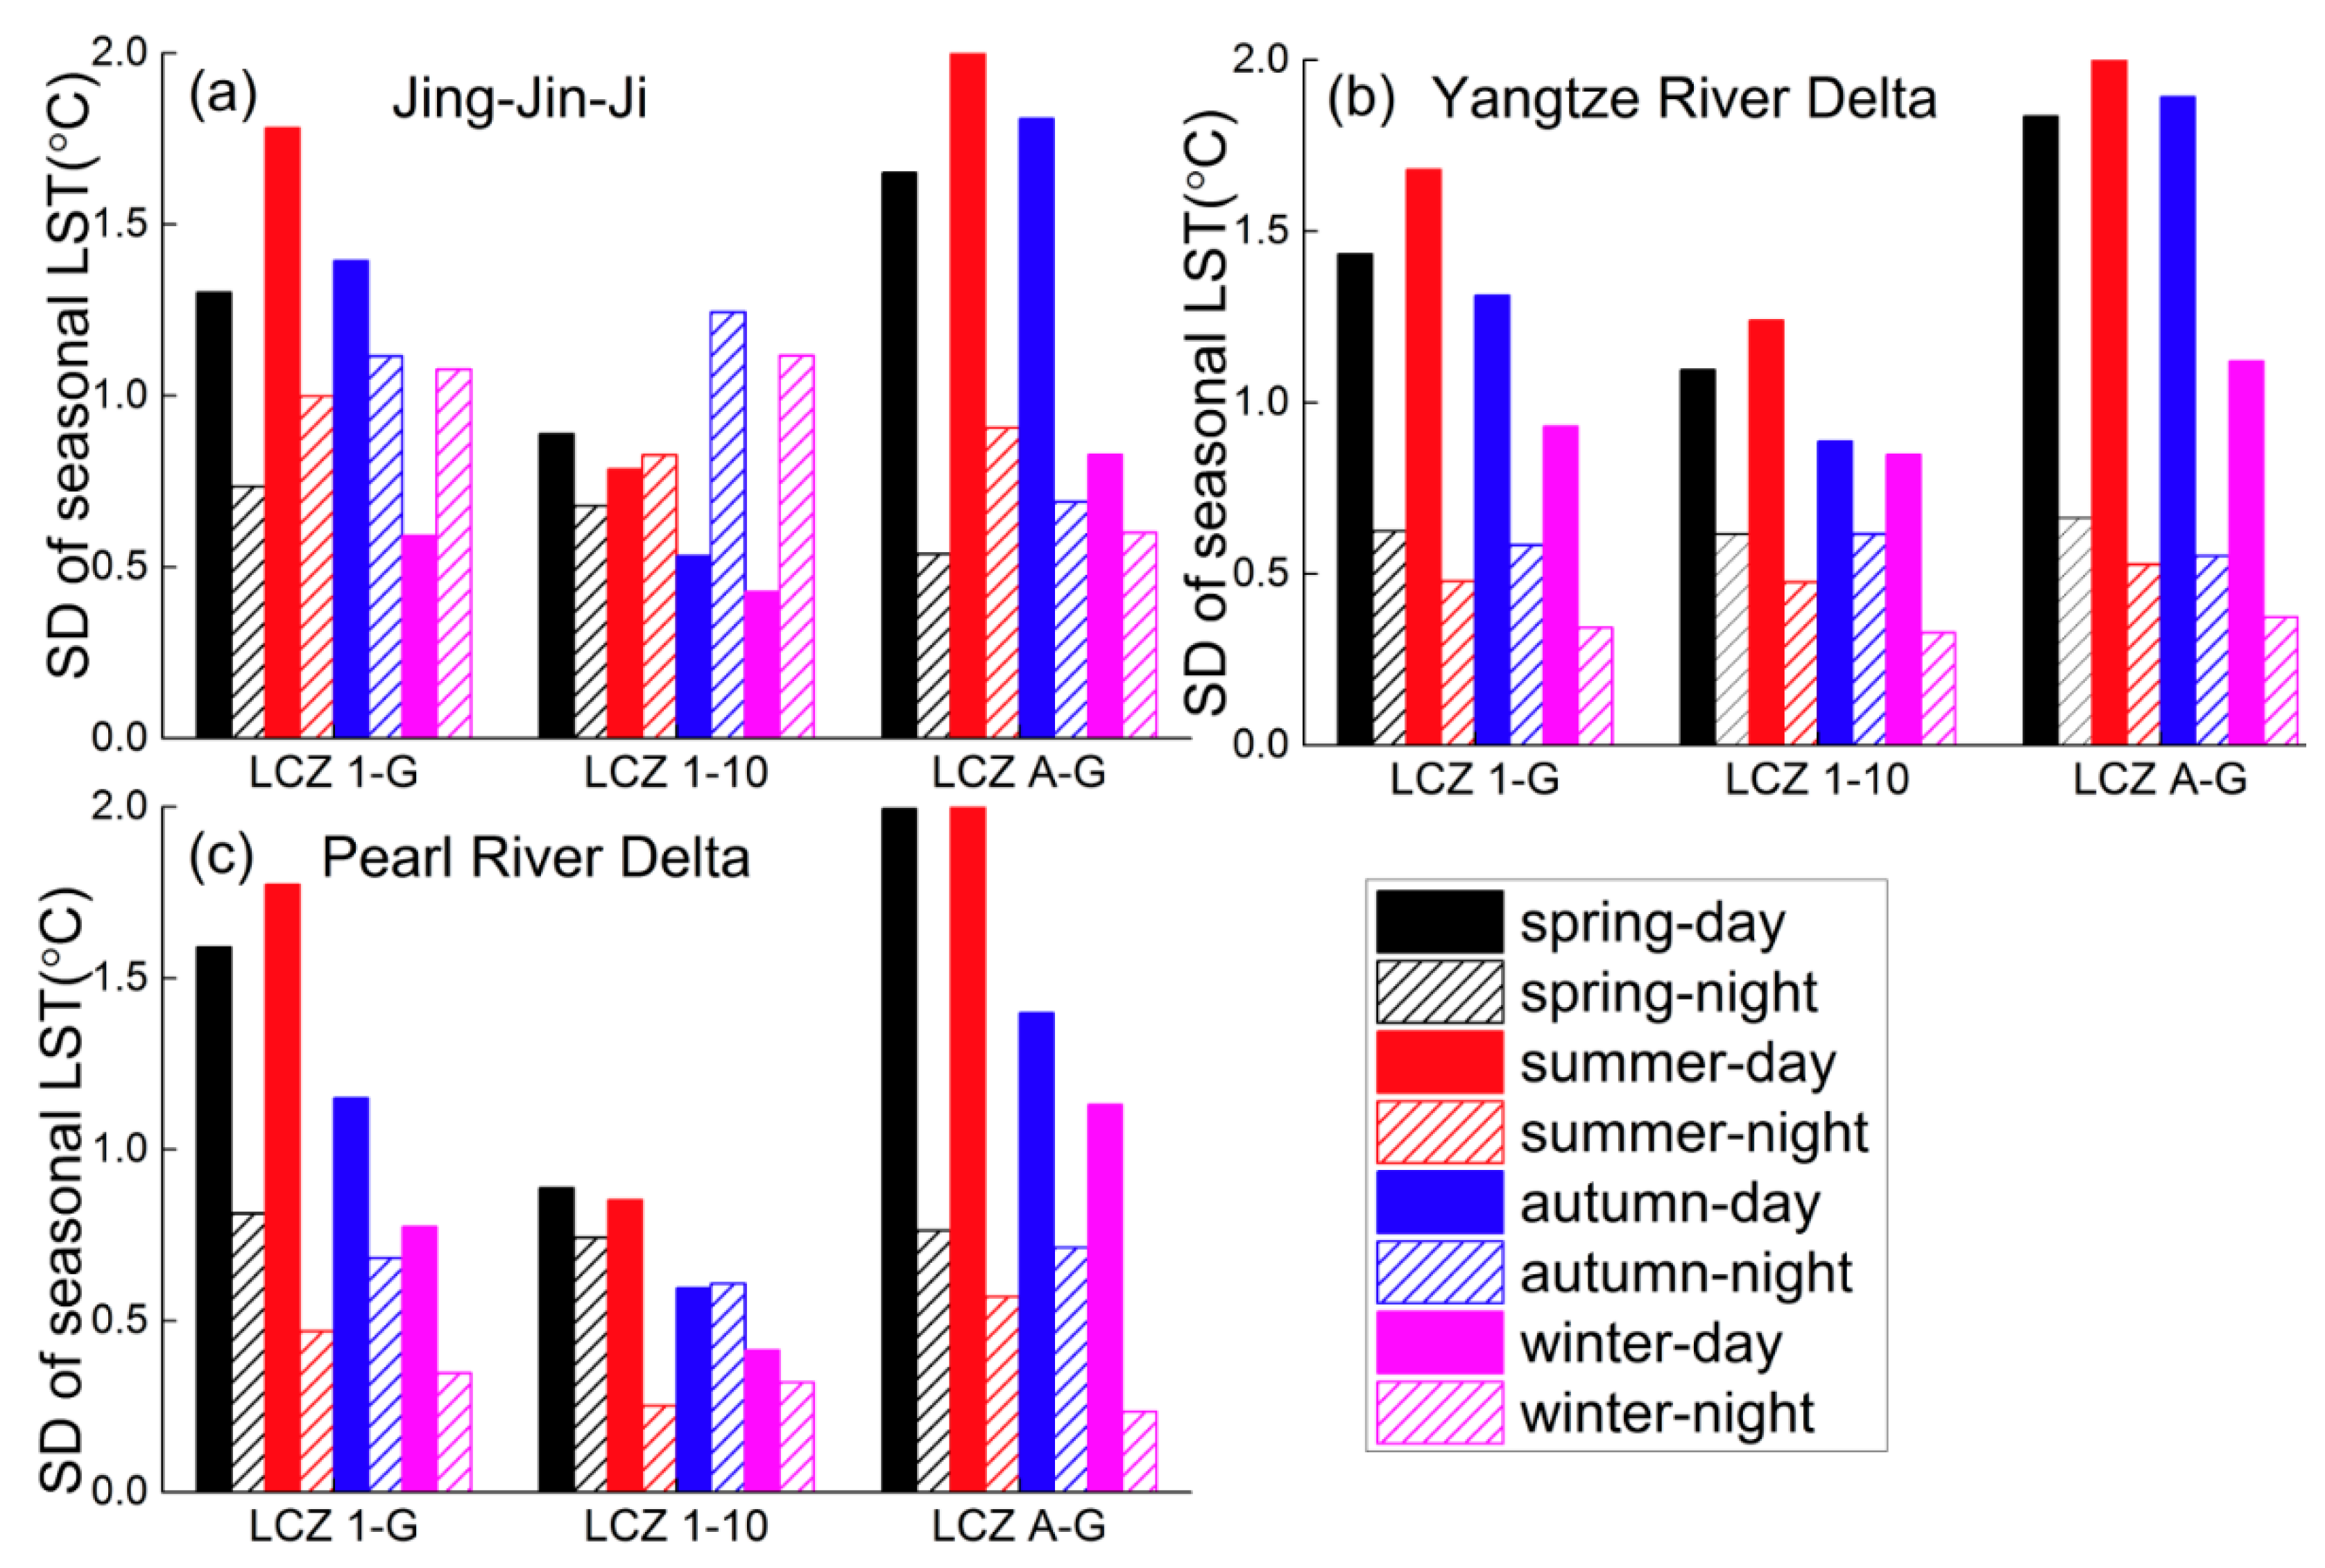
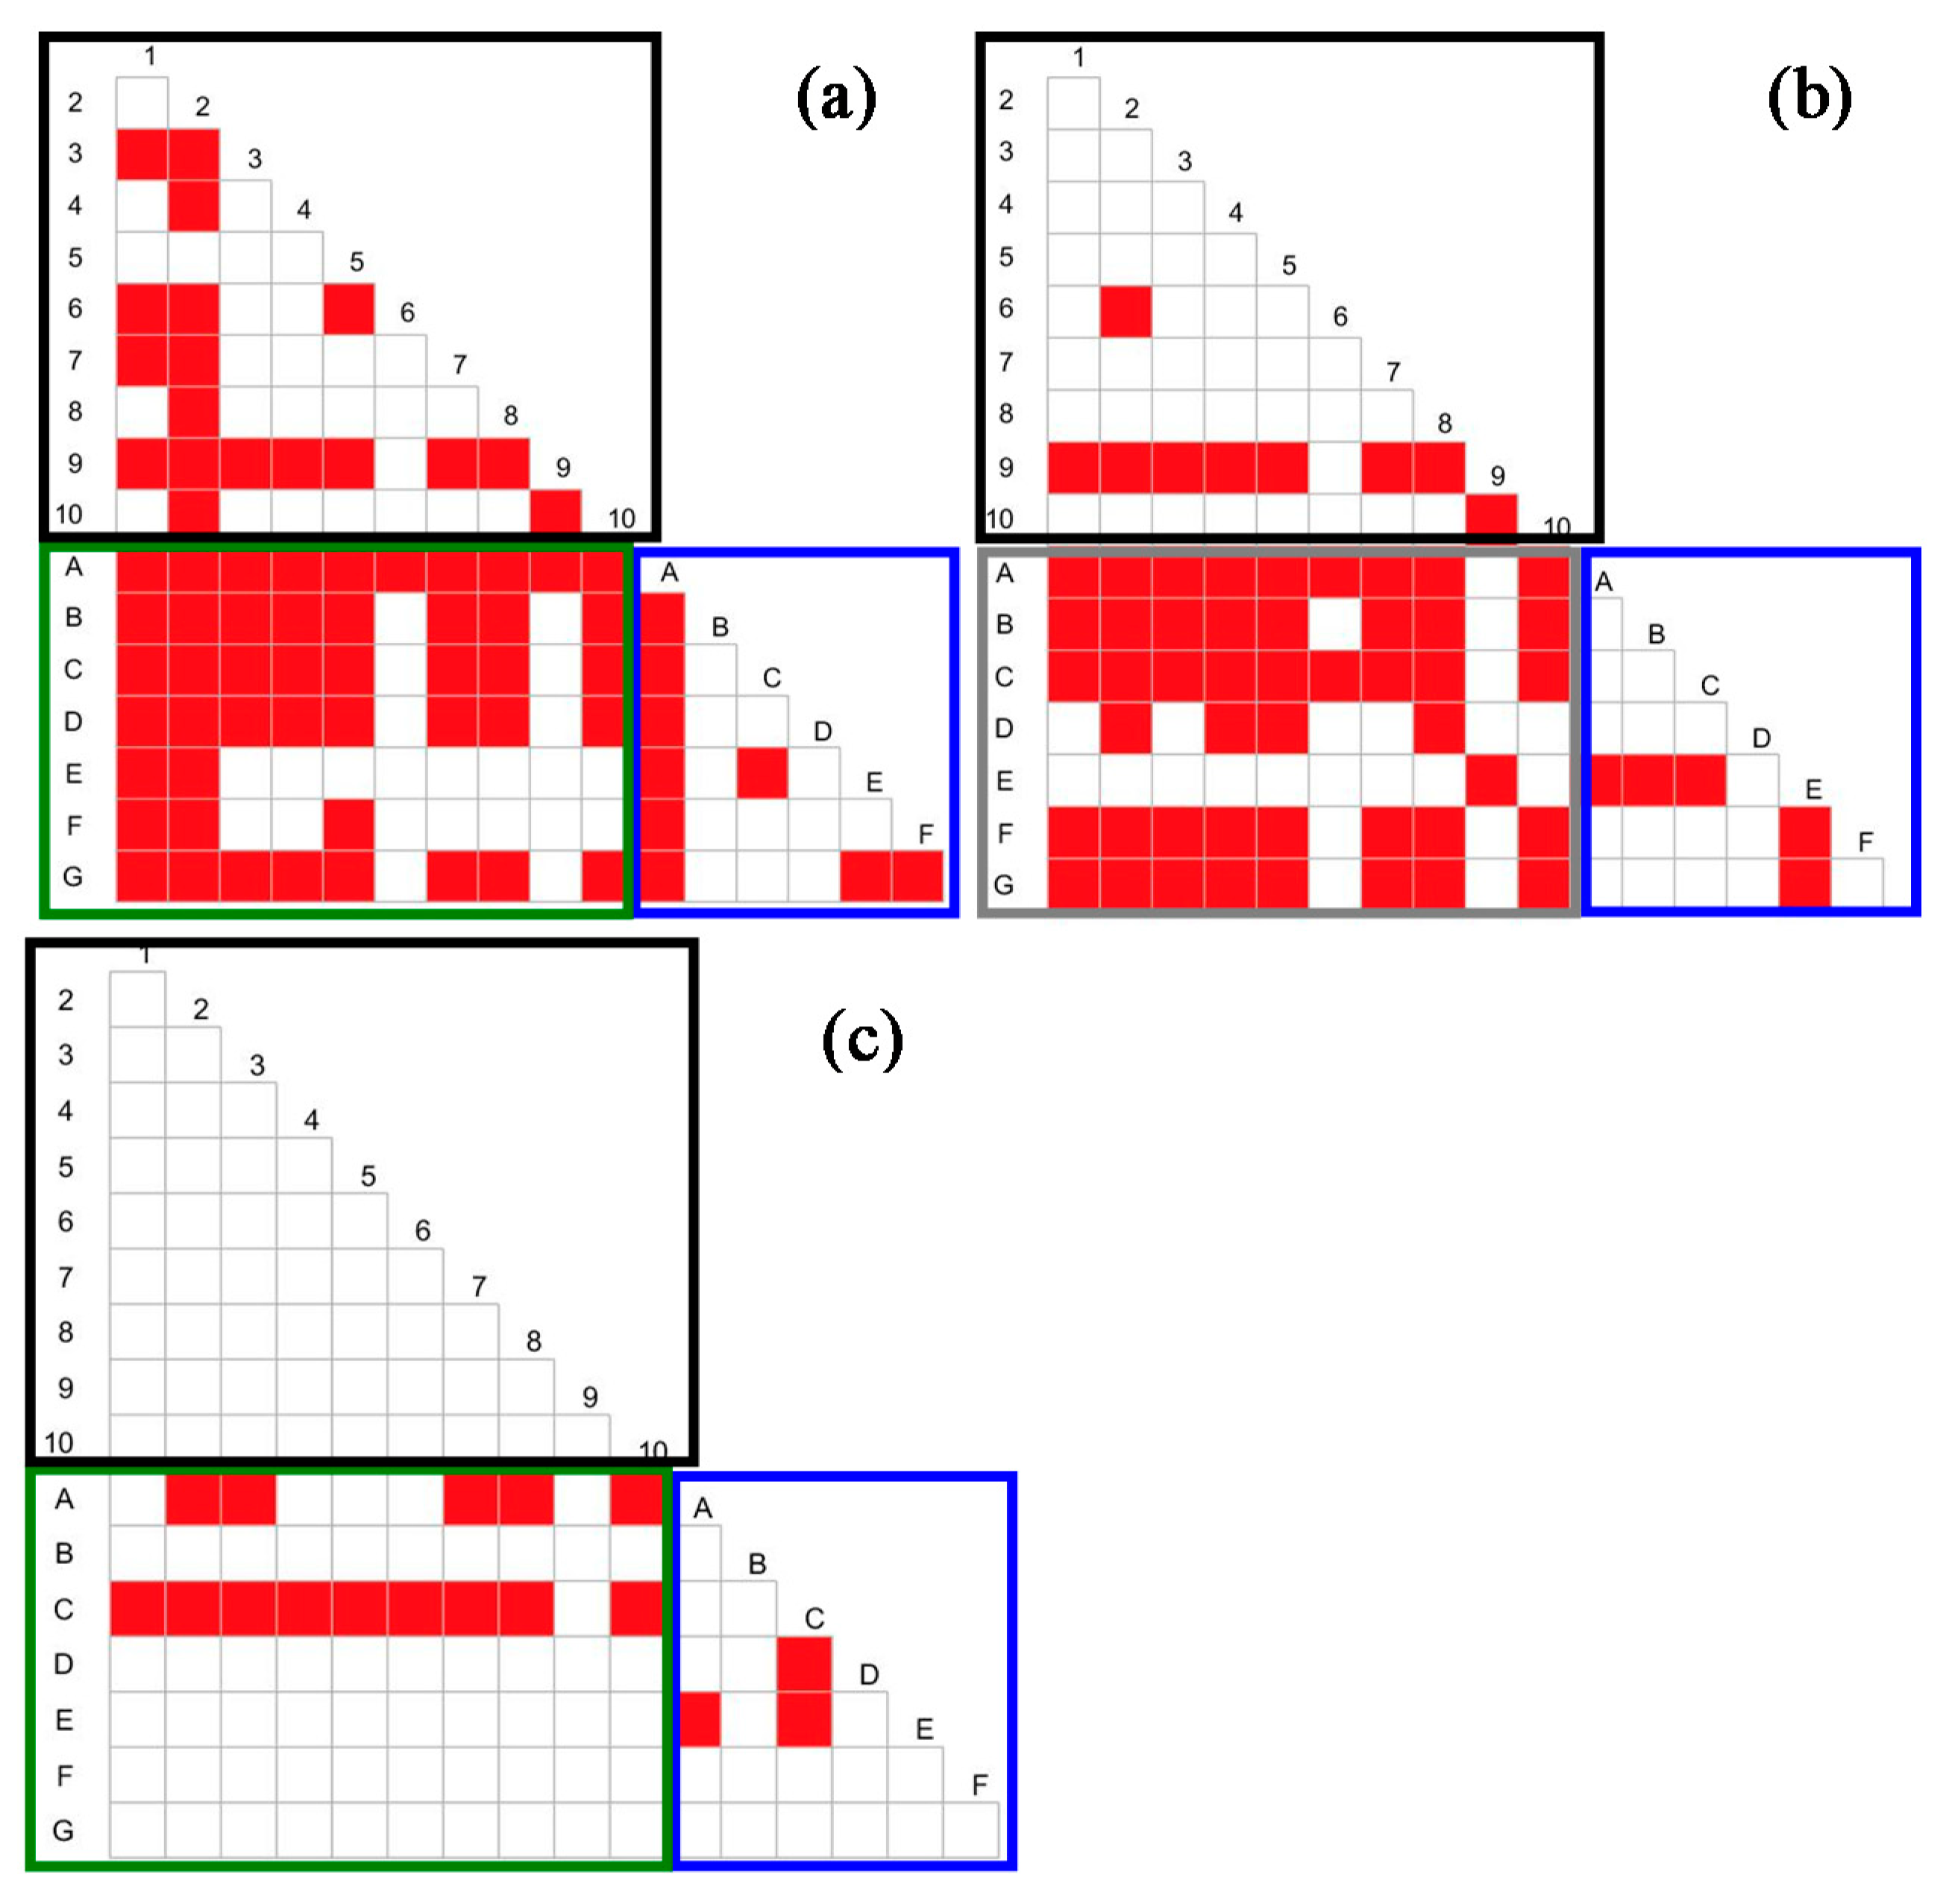
Previous studies in China mainly focused on a particular city or an urban agglomeration. However, the thermal distribution of LCZs differs with different cities in different climate zones and also differs temporally, there is a lack of comprehensive understanding it. This study comprehensively investigated diurnal and seasonal variations in MODIS LST between LCZ types among cities in three urban agglomerations in China. In addition, we also discussed the optimal LCZ combination for better urban cooling by altering urban area and population of each LCZ type. Firstly, we categorize LCZs across 63 major cities in China, mostly covered with provincial capital cities with superior economy and larger population, using Landsat 8 data. Secondly, we study the diurnal and seasonal relationships between LCZs and LST in the three most important urban agglomerations in China (Jing-Jin-Ji, Yangtze River Delta, Pearl River Delta). In addition, MODIS quality control (QC) is important for LST temporal aggregation. Lai et al. [28] showed that seasonal surface urban heat island (SUHI) differences with and without QC accounted for 29.9% of the total SUHI in China during night time and exceeded 5.0 K in northern cities. Therefore, QC is employed for seasonal LST calculations in this study. Finally, we explore the optimal combination of LCZs with minimum LST value for cool urban. This study will help us to comprehensively understand the urban surface thermal configuration of various LCZs in Chinese cities. Furthermore, it will be beneficial for planners and policy makers devising appropriate strategies to mitigate the urban thermal environment.

2. Materials and Methods

2.1. Study Area

The study area includes 63 major cities, covering provincial capital cities and economically developed cities in each province. We focus on three main urban agglomerations covering 28 cities (Table 1), specifically 5 cities in Jing-Jin-Ji urban agglomeration (JJJ), 15 cities in the Yangtze River Delta (YRD) and 8 cities in the Pearl River Delta (PRD) (Figure 1). JJJ has an area of 21.8 × 10⁴ km2, is located in northeast China, and is the political, cultural and economic center of China. In 2016, JJJ had population of 112 million and is planned to increase to 130 million by 2050. GDP was about 8.5 × 10³ billion in 2019. According to a strategic report, JJJ will be developed as one of three key infrastructure projects aimed at boosting the Chinese economy over the next 100 years, along with the YRD economic region and “One Belt, One Road” program (http://theory.people.com.cn/n1/2017/0703/c412914-29377905.html). The climate of JJJ is humid continental, with hot summers and cold winters.
The YRD has an area of 11.8 × 10⁴ km2 and population of 225 million, and lies adjacent to the East China Sea. It has a marine monsoon subtropical climate with humid, hot summers and dry, cold winters. The mean annual air temperature is about 18–23 °C and the mean annual precipitation is 1500 mm. Heat waves are quite common in this area because the western Pacific subtropical pressure zone makes it one of the warmest regions in summer over mainland China [29].
The PRD has an area of 5.5 × 10⁴ km2, and is located in the southeast of Guangdong Province. GDP was about 8.7 × 10³ billion in 2019 and the population is 57 million (https://baike.baidu.com/). PRD has a subtropical monsoon climate with the highest rainfall and temperature in summer. PRD is humid and warm throughout the year, with a mean annual air temperature of 21–23 °C.

2.2. Data

The MODIS eight-day LST product (MOD11A2 and MYD11A2) in 2018 are used in this study (Table 2). Landsat 8 OLI data are employed for LCZ classification, in order to better divide impervious surfaces and vegetations, summer data are selected. However, the revisit period of Landsat is 16-day and there are more cloudy and rainy days in summer, less clear images for classification. Therefore, Landsat data in period of summer 2017–2019 are used for classification. Only those images with cloud cover less then 3% are used. Landsat data pre-processing includes radiometric calibration, atmospheric correction, seamless mosaic, projection conversion and resampling. MODIS LST is also pre-processed with seamless mosaic and projection conversion using the MRT tool. For comparison with MODIS LST, the LCZ derived from Landsat is resampled to 1 km. In addition, the QC band of the MODIS LST is used to obtain a weighting for the seasonal LST calculation. Each pixel in the QC is an 8-bit binary number including four flags as mandatory QA, a data quality flag, emissivity error flag, and LST error flag. In this study, LST pixels with a corresponding QA flag of “10” or “11”, emissivity error flag of “11” (>0.04) or LST error flag of “11” (>3.0 K) are excluded. Daytime LSTs are averages of Terra and Aqua images, as well as nighttime LSTs.
The gridded China population with 1 km resolution is used for optimal LCZ analysis. The population data is estimated from land use data, night time light satellite images, and county populations in census data.

2.3. Methods

(1)
LCZ Classification
According to the WUDAPT workflow of the LCZ classification [18] and the classification scheme developed by [8], LCZ is classified to 17 types (10 building types and 7 natural types) using the Landsat 8 data (Figure 2). Firstly, development of training samples is pivotal to the accuracy of LCZ classification. More than 5 × 10⁴ total samples are selected from Google Earth by visual interpretation. The average number of samples for each LCZ type is over 3000 in this study, and WUDAPT requires 5–15 per types. WUDAPT was originally applied in Europe, but the urban morphology in China is more complicated than in Europe. Therefore, it is essential to acquire a greater number of samples for China. In addition to the quantity of samples, quality is also important. It is best to select samples from the largest areas of the same type, with minimum sample polygon length scales of more than 200 m. We have tested how sample quantity and quality impacts the accuracy of classification in Xi’an and Changsha, confirming both quantity and quality are important for classification. Secondly, the random forest classifier in the SAGA GIS software is used for China LCZ classification, based on the training samples. Thirdly, 5‰ of pixels in each LCZ type are randomly selected and compared to Google Earth for validation. Indicators for accuracy assessment including OA (overall accuracy of all types), OAu (overall accuracy of built types) and OAn (overall accuracy of natural types). Detailed information of LCZ mapping is provided in our other study [30]. LCZ is re-classified by modifying the training samples if accuracy is too poor. The three indicators are calculated as follows:
O A = l = 1 17 n l N l p l
O A u = l = 1 10 n l N l p l
O A n = l = 11 17 n l N l p l
where l = 1, 2, …, 17 is LCZ 1–17, respectively. nl and Nl are numbers of pixels that are correctly classified and the total samples for type l, respectively. pl is the ratio of the area of type l to the area of all types.
(2)
Temporal Aggregation of LST
The monthly and seasonal LST are calculated by the following equations [28,31], and taking LST QC into account.
T i ¯ ( t 1 , t 2 ) = t 1 t 2 T i ( t ) ω i ( t ) d t t 1 t 2 ω i ( t ) d t
{ ω = q 2 , L S T e r r o r 3   K ω = 0 , L S T e r r o r > 3   K }
where T i ¯ ( t 1 , t 2 ) is the temporally averaged LST in pixel i between time t1 and t2, and is the monthly average in this study. Ti (t) and ωi (t) are the LST and its associated weight in pixel i at time t. Weight ω depends on QC: ω = q−2 for pixels with LST error ≤ 3 K and ω = 0 when LST error > 3 K. q = 1, 2, 3 for LST errors ≤1 K, ≤2 K, ≤3 K, respectively. The pixels with LST error > 3 K are excluded from this study.
MODIS LST outlier values of each LCZ type are removed before seasonal and diurnal aggregation, using the quartile method [32]. Only LST data within 1.5 times the interquartile range (Q3–Q1) are used in this study. Here, Q1 and Q3 are the first and third quartiles, and IQR = Q3 − Q1; LST values between Q1 − 1.5 * IQR and Q3 + 1.5 * IQR are retained as valid data.
(3)
Optimal LCZ Combination
Identifying the optimal LCZ combination can help mitigate UHIs. With the current population and urban area, the LCZ can be regrouped with a variable area of each LCZ type for reducing urban LST. The optimal LCZs with minimum LST can be calculated by solving the optimal solution of Equation (11) with varied area of each LCZ type. This study supposes that the urban area and population of each city are fixed, but that of each LCZ type are varied. This method would obtain area of each LCZ type after optimization, meanwhile, the optimal LCZs should accommodate the total population. It also assumes that the population per unit area before and after optimization are same, the population of each LCZ type is equal to population per unit area multiplies area of each LCZ type.
The constraint conditions are:
s 1 + s 2 + s 3 + + s 17 = A
s 1 f p 1 + s 2 f p 2 + + s 9 f p 9 = P O P
A = A 1 + A 2 + + A 17
f p i = p o p i A i ( i = 1 , 2 , , 9 )
i = 1 9 p o p i = P O P
where A is total urban area, equal to the sum of areas of each LCZ type; s1, s2, …, s17 and A1, A2, …, A17 are each LCZ area after and before optimization. si needs to be solved, while Ai can be derived from the LCZ map. POP is the total population in urban areas, and is assumed to distributed in LCZ 1–9 in this study. fpi is the ratio of population and urban area for each LCZ type (i = 1, 2, …, 9) and is kept fixed before and after optimization. Thus, fpi is derived from population (popi) and urban area (Ai) before optimization (Equation (9)).
The objective function is:
min ( T m e a n ) = T 1 s 1 A + T 2 s 2 A + + T 17 s 17 A
where Ti is the mean LST at LCZ type i. Tmean is the mean LST for all LCZ types (total urban area).
(4)
Statistical Analysis
LST differences between any two LCZ types are analyzed using the one-way analysis of variance (ANOVA). The test of homogeneous of LST variance between different LCZs, and the normality test, are carried out using SPSS software prior to ANOVA. The Tukey and Sidak tests are used to test whether LSTs are homogeneous, and are adopted for pairwise comparisons of average LSTs between any two LCZs, to identify which LCZs are significantly different. Tamhane’s T2 test is adopted when LSTs are not homogeneous.

3. Results and Discussion

3.1. LCZ Mapping

Across the 63 cities, OA is 71–93% with an average of 82%, OAu is 57–83% with average of 72% and OAn is 70–99% with average of 90%. Details of the classification accuracies in three urban agglomerations are listed in Table 3. Urban layouts are diverse among cities in China; some have a block distribution (e.g., Beijing, Tianjin) and some have a zonal distribution along river valleys (e.g., Lanzhou, Taiyuan). Furthermore, the same LCZ type may have multiple urban forms. This diversity increases the difficulty of LCZ classification in China. Nonetheless, OAu in this study is higher than that in some other studies of Chinese city classification [19,33], owing to the comprehensive set of training samples for all urban forms in the present study.
Taking Beijing and Shanghai as examples, LCZ results can closely reflect the actual land cover configuration (Figure 3). LCZ maps with pixel sizes of 1 km are shown here; some minor LCZ types are eliminated, e.g., LCZ 9, 10 in Beijing. Three typical areas are labelled in Beijing: Area “a” with LCZ 4 is Tiantongyuan community with a high population density and high-rise buildings, known as the largest community in Asia, that is a residential area, occupied mostly by commuters. Area “b” within the 2nd ring road is mostly comprised of compact low-rise buildings (LCZ 3), which are representative of ancient architectures called Courtyard Houses. Area “c” contains commercial offices with compact high-rise buildings (LCZ 1), e.g., Beijing CBD (Central Business District). The labelled area in Shanghai (yellow circle) with compact high-rise buildings (LCZ 1) covers some business centers, e.g., Nanjing Road CBD, Huaihai Road CBD and People’s Square CBD.

3.2. Diurnal and Seasonal Thermal Performance of LCZs

The LST of LCZs varies evidently with season, reaching the highest LST in summer, moderate in spring and autumn, and lowest in winter (Figure 4a,c,e). Although LST distributions of inter-LCZ are similar in each urban agglomeration, with similar fluctuations in summer, spring and autumn and stable LSTs in winter, the magnitudes of the fluctuations are different. However, the largest magnitudes are all in summer for JJJ, YRD and PRD (Figure 4b,d,f). At this time the evapotranspiration is high, which lowers the LST of natural surfaces and enhances the LST contrast between impervious surfaces and natural surfaces. For example, the LST difference in summer in JJJ is 5.85 °C, with the highest LST in compact mid-rise buildings (LCZ 2) and lowest LST in dense trees (LCZ A) (Figure 4b). In addition, the building height and density also affect LST. During summer in the three urban agglomerations, the LST of mid-rise buildings is generally higher than that of high and low-rise (LCZ 2 > LCZ 1, 3; LCZ 5 > LCZ 4, 6), and compact building LST is higher than that of open building (LCZ 1–3 > LCZ 4–6). The highest average LST is in the compact building area. The surface albedo of compact building areas is usually lower than that of open areas, leading to greater urban energy storage.
The LCZ thermal performance varies diurnally. The standard deviation (SD) of seasonal mean LST for LCZ 1–17, as well as that of LCZ 1–10 (built surface) and LCZ A–G (natural surface), is calculated for the three urban agglomerations (Figure 5). The extent of seasonal LST difference for LCZ 1–17 in the daytime is larger than that of the night time, as shown by the larger SD, except for winter in JJJ. For natural surfaces (LCZ A–G), mean LST difference in daytime is larger (higher SD) than in night time in all four seasons. The largest difference is in summer, because dense vegetation with a lower LST enhances the LST difference between vegetation and bare soil surfaces.
For built surfaces (LCZ 1–10), mean LST difference in daytime is larger than that in the night time for all seasons in YRZ and PRD (Figure 5b,c). However, in the JJJ area, the difference is lower in daytime than at night during autumn and winter (Figure 5a). This is because of the use of heating in winter in northern China, whereas heating is used less in YRZ and PRD.
The LSTs of compact low-rise (LCZ 3) and lightweight low-rise (LCZ 7) in JJJ are lower than those in other built types at night during winter and autumn. Because the government’s unified heating scheme providing continuous heating day and night, does not cover these low-rise buildings in this area. The heating in these low-rise building is intermittent. Convective heat transfer from the land surface to lower atmosphere may increase further at lower air temperatures in areas of low-rise buildings than in other urban areas. Therefore, the LST of low-rise built areas would decrease.

3.3. LST Differences within LCZs

According to the results discussed above, LST varies most widely in summer. Therefore, the summer data are analyzed in more detail here. The Kolmogorov-Smirnov test of normality is applied to the mean LST of each LCZ type. The Levene statistic in the one-way ANOVA is used for the homogeneous of variance test. The mean LSTs of each LCZ type follow a normal distribution and are homogeneities in JJJ, YRD and PRD, thus meeting the requirements of ANOVA. Therefore, Tukey and Sidak tests are utilized for pairwise comparisons of the mean LSTs between LCZs, as shown in Figure 6. In this figure, red indicates significant differences in LST at the 95% confidence level (p < 0.05). White indicates there is no statistically significant difference between mean LSTs.
The number of LST differences vary between urban agglomerations and LCZ types. The percentage of significant LST differences (the proportion of red-colored numbers) in JJJ is 54.4%, and is thus larger than that in YRD and PRD (44.9% and 12.5%, respectively) (Table 4). Although the mean LST is different between any two given LCZ types, the greatest difference is that between built surfaces (LCZ 1–10) and natural surfaces (LCZ A–G) (green square in Figure 6). The LST differences within LCZ 1–10 (black square in Figure 6) are more significant than those within LCZ A–G (blue square), with a larger number of red colors, in JJJ and YRD (Table 4). The opposite pattern is observed in PRD. This illustrates that changing the proportions of built surface types will play a more important role in the LST distribution than changing natural surfaces in JJJ and YRD. Therefore, urban planning managers should pay more attention to built surface types when mitigating urban cooling. The LST differences amongst LCZ 1–10 and amongst LCZ A–G are significant, and decrease as JJJ > YRD > PRD (Table 4); this shows that LST changes achieved through changing built area types or natural surface types will be greatest in JJJ and smallest in PRD.

3.4. Dominant LCZ Types for Urban Heating and Cooling

The dominant LCZ types in summer daytime are analyzed here, to help improve our understanding of the main drivers of land cover LSTs in the warm season and to in implementing measures for urban cooling. The mean LST of each LCZ type is denoted as LST_lczi, the mean LST for all LCZ types id denoted as LST_lcz, and finally the deviation LST_lczi minus LST_lcz is used to judge the importance of the LCZs for LST. The higher the deviation, the greater the attribution of LCZs for LST. Generally, the built types increase LST while the natural types cool LST. Due to the different LCZ configurations and different climate zones in the three urban agglomerations, the influences of the LCZs on LST are different (Figure 7). The dominant LCZs for heating urban surfaces are LCZ 2 in JJJ and LCZ 8 in YRD and PRD (Table 5). The dominant LCZs for cooling urban surfaces are LCZ A and LCZ G. This result is reasonable when considering the real urban environment: industry is well developed in YRD and PRD, and is associated with many large, low-rise buildings. Urban transportation is also well developed in YRD, and here the paved land surfaces and vehicle exhausts will further increase LST; consequently, LCZ E is important for LST in YRD. There are many factors affecting LST, but if only considering land cover changes then we propose planting more trees amongst compact mid-rise, large low-rise buildings and also besides roads.

3.5. Optimal LCZ Combination for Urban Cooling

The optimal LCZ combination for reducing LST comprises compact high-rise buildings and dense trees or water (Table 6). Because the total population and urban area are fixed in this study, the choice of higher, compact buildings with lower temperatures is based on accommodating the present population. The dominant cooling surface types play a vital role in urban cooling. In JJJ and PRD, more trees planted amongst compact high-rise buildings and an increased area of urban parks will be beneficial for reducing LST. In YRD, increasing the water area amongst compact high-rise buildings and in other urban areas is recommended. Cities in PRD are mostly adjacent to the ocean, while cities in YRD are more dispersed in areas further from water than those in PRD. Therefore, the urban cooling effect of water is more evident in YRD than in PRD. The water area in JJJ is small; thus, the urban cooling effect of trees is significant. The greatest reduction in LST is 4.11 K in JJJ, followed by 3.49 K and 3.91 K in YRD and PRD, respectively.

4. Discussion

The surface thermal characteristics of the LCZs between different cities are affected not only by urban climate zones, but also by temporal scale. Compared to previous studies focusing on a single city [25], or a single urban agglomeration [9,34], or daytime and nighttime [10], or seasonal variations [25], this study comprehensively researched three urban agglomerations in China covering 28 cities and both day/night and seasons. In addition, most studies only focused on LST variations based on LCZs, besides it, this study also investigated the main LCZ types associated with surface heating and cooling, as well as appropriate mitigation measures for urban cooling with optimal LCZ combinations. Some research showed LCZ 3 had highest LST during daytime within LCZ 1-6 in Guangzhou and Hongkong [10], yet, this study showed LCZ 2 was the warmest area in Pearl River Delta which is consist with Wang et al. [11]. Wang et al. [11] presented that LCZ 2, 8 and 10 had the highest LST at both daytime and nighttime, however, our study showed LST variations of LCZs at daytime were not always consistent with that at nighttime, which depend on cities and seasons. This study also showed LST varied significantly in summer, that is consist with Du et al. [25]. Nonetheless, there are still some limitations of the present study which should be improved in future. (1) Only the spectral properties of land cover are used for LCZ mapping, which may introduce classification errors if different land covers have the same spectral signature or if the same land cover has a range of signatures. The urban 3D structural information should also be taken into account for better LCZ classification, e.g., building height, building density, SVF (Sky View Factor), etc.; this information can be derived from an urban digital surface model (DSM) established by airborne LiDAR and stereo imaging, etc. (2) The optimal LCZ combination for urban cooling is derived from linear optimization, which is simple and effective. Nonlinear optimization will be employed in the next study.

5. Conclusions

LCZ mapping of 63 major cities in China was firstly achieved using Landsat 8 and Google Earth data, based on the WUDAPT method. The average overall accuracy was 82% for all LCZs types and 72% for urban types, when using in-situ data from Google Earth; this accuracy is higher than that of some previous studies. Then, thermal characteristics of LCZs were studied, based on MODIS LST in three main urban agglomerations (JJJ, YRD and PRD) covering different climate zones.
Although the thermal properties of LCZs varied considerably among the three agglomerations at the seasonal and diurnal scale, there still exist some common characteristics. The MODIS LST changes within LCZs in spring, autumn and summer were similar, with the average LST of natural surfaces lower than that of built surfaces, and the lowest LST was in LCZ A. LSTs were steady in winter. The range of LSTs between the maximum and minimum LCZs is largest in summer, when strong evapotranspiration enhances the LST difference between natural and impervious surfaces. In summer, mid-rise buildings have higher LSTs than high- and low-rise buildings (LCZ 2 > LCZ 1, 3; LCZ 5 > LCZ 4, 6), and compact buildings have higher LSTs than open buildings (LCZ 1–3 > LCZ 4–6). In addition, LST differences within LCZs during the day and night also vary considerably. The daytime LST differences within all LCZs, or within built types (LCZ 1–10) or natural surfaces (LCZ A–G), are all larger than those at night, according to their SD values. Thus, the impact of the 3D structure of built surfaces and natural surfaces on LST during daytime is higher than that at night. The number of significant LST differences within LCZs (the number with p < 0.05) varies amongst climate zones and LCZ types. Generally, the most frequent significant differences are found in JJJ and between natural and built types in all three agglomerations. LST differences within built surfaces (LCZ 1–10) are more significant than those within natural surfaces (LCZ A–G), which shows that LST changes caused by changing the built surface types are greater and more beneficial for improving thermal performance than changing the natural surface types.
The strongest LCZs for urban heating in summer daytime are LCZ 2 in JJJ and LCZ 8 in YRD and PRD. For urban cooling, the best LCZs are LCZ A and LCZ G in all three urban agglomerations. With the current urban area and population, the best LCZ combinations for urban cooling in summer daytime are LCZ 1 + LCZ A in JJJ and PRD, with reduced LSTs of 4.11 K and 3.91 K, and LCZ 1 + LCZ G in YRD, with a reduced LST of 3.49 K. Increasing tree cover and water area in compact high-rise building communities can evidently mitigate surface thermal heating.
This study comprehensively analyzed diurnal and seasonal thermal characteristic of different LCZs among different climate zones in China. The findings will facilitate development of spatio-temporal urban planning for improving the urban thermal environment. Further studies might take advantage of the higher spatial resolution of satellite data (e.g., Landsat, ASTER) to investigate the spatial scale effect of LCZ thermal characteristics, which will help in finding the best LCZ combinations for urban cooling at different scales.

Author Contributions

Conceptualization, N.L. and Z.Q.; methodology, N.L. and J.Y.; formal analysis, N.L.; resources, Y.W.; data curation, N.L.; writing—original draft preparation, N.L.; writing—review and editing, S.M.; visualization, Y.W.; project administration, S.M.; funding acquisition, S.M. All authors have read and agreed to the published version of the manuscript.

Funding

This work was supported by the Beijing Municipal Science and Technology Commission under Grant Z201100008220002 and the Youth Beijing Scholars Program under Grant 2018-007.

Institutional Review Board Statement

Not applicable.

Informed Consent Statement

Not applicable.

Conflicts of Interest

The authors declare no conflict of interest.

References

  1. Goggins, W.B.; Chan, E.Y.; Ng, E.; Ren, C.; Chen, L. Effect modification of the association between short-term meteorological factors and mortality by urban heat islands in Hong Kong. PLoS ONE 2012, 7, e38551. [Google Scholar] [CrossRef] [Green Version]
  2. Ng, E.; Ren, C. The Urban Climatic Map: A Methodology for Sustainable Urban Planning; Routledge: Stockport, UK, 2015; p. 1. [Google Scholar] [CrossRef]
  3. Alavipanah, S.; Schreyer, J.; Haase, D.; Lakes, T.; Qureshi, S. The effect of multi-dimensional indicators on urban thermal conditions. J. Clean. Prod. 2018, 177, 115–123. [Google Scholar] [CrossRef]
  4. Berger, C.; Rosentreter, J.; Voltersen, M.; Baumgart, C.; Schmullius, C.; Hese, S. Spatio-temporal analysis of the relationship between 2D/3D urban site characteristics and land surface temperature. Remote Sens. Environ. 2017, 193, 225–243. [Google Scholar] [CrossRef]
  5. Taha, H. Urban climates and heat islands: Albedo, evapotranspiration, and anthropogenic heat. Energy Build. 1997, 25, 99–103. [Google Scholar] [CrossRef] [Green Version]
  6. Yang, J.; Jin, S.; Xiao, X.; Jin, C.; Xia, J.; Li, X.; Wang, S. Local climate zone ventilation and urban land surface temperatures: Towards a performance-based and wind-sensitive planning proposal in megacities. Sustain. Cities Soc. 2019, 47, 101487. [Google Scholar] [CrossRef]
  7. Li, N.; Li, X. The impact of building thermal anisotropy on surface urban heat island intensity estimation: An observational case study in Beijing. IEEE Geosci. Remote Sens. Lett. 2020, 7, 2030–2034. [Google Scholar] [CrossRef]
  8. Stewart, I.D.; Oke, T.R. Local Climate Zones for Urban Temperature Studies. Bull. Am. Meteorol. Soc. 2012, 93, 1879–1900. [Google Scholar] [CrossRef]
  9. Yang, J.; Zhan, Y.; Xiao, X.; Xia, J.C.; Sun, W.; Li, X. Investigating the diversity of land surface temperature characteristics in different scale cities based on local climate zones. Urban Clim. 2020, 34, 100700. [Google Scholar] [CrossRef]
  10. Chen, X.; Xu, Y.; Yang, J.; Wu, Z.; Zhu, H. Remote sensing of urban thermal environments within local climate zones: A case study of two high-density subtropical Chinese cities. Urban Clim. 2020, 31, 100568. [Google Scholar] [CrossRef]
  11. Wang, R.; Cai, M.; Ren, C.; Bechtel, B.; Xu, Y.; Ng, E. Detecting multi-temporal land cover change and land surface temperature in Pearl River Delta by adopting local climate zone. Urban Clim. 2019, 28, 100455. [Google Scholar] [CrossRef]
  12. Hu, J.; Yang, Y.; Pan, X.; Zhu, Q.; Zhan, W.; Wang, Y.; Ma, W.; Su, W. Analysis of the Spatial and Temporal Variations of Land Surface Temperature Based on Local Climate Zones: A Case Study in Nanjing, China. IEEE J. Sel. Top. Appl. Earth Obs. Remote Sens. 2019, 12, 4213–4223. [Google Scholar] [CrossRef]
  13. Nassar, A.K.; Blackburn, G.A.; Whyatt, J.D. Dynamics and controls of urban heat sink and island phenomena in a desert city: Development of a local climate zone scheme using remotely-sensed inputs. Int. J. Appl. Earth Obs. Geoinf. 2016, 51, 76–90. [Google Scholar] [CrossRef] [Green Version]
  14. Bechtel, B.; Demuzere, M.; Mills, G.; Zhan, W.; Sismanidis, P.; Small, C.; Voogt, J. SUHI analysis using Local Climate Zones—A comparison of 50 cities. Urban Clim. 2019, 28, 100451. [Google Scholar] [CrossRef]
  15. Lau, K.K.-L.; Chung, S.C.; Ren, C. Outdoor thermal comfort in different urban settings of sub-tropical high-density cities: An approach of adopting local climate zone (LCZ) classification. Build. Environ. 2019, 154, 227–238. [Google Scholar] [CrossRef]
  16. Alexander, P.J.; Mills, G.; Fealy, R. Using LCZ data to run an urban energy balance model. Urban Clim. 2015, 13, 14–37. [Google Scholar] [CrossRef] [Green Version]
  17. Quan, S.J.; Dutt, F.; Woodworth, E.; Yamagata, Y.; Yang, P.P.-J. Local Climate Zone Mapping for Energy Resilience: A Fine-grained and 3D Approach. Energy Procedia 2017, 105, 3777–3783. [Google Scholar] [CrossRef]
  18. Bechtel, B.; Alexander, P.J.; Böhner, J.; Ching, J.; Conrad, O.; Feddema, J.; Mills, G.; See, L.; Stewart, I. Mapping Local Climate Zones for a Worldwide Database of the Form and Function of Cities. ISPRS Int. J. Geo-Inf. 2015, 4, 199–219. [Google Scholar] [CrossRef] [Green Version]
  19. Ren, C.; Cai, M.; Li, X.; Zhang, L.; Wang, R.; Xu, Y.; Ng, E. Assessment of Local Climate Zone Classification Maps of Cities in China and Feasible Refinements. Sci. Rep. 2019, 9, 18848. [Google Scholar] [CrossRef] [Green Version]
  20. Zhang, Q.; Wu, Z.; Yu, H.; Zhu, X.; Shen, Z. Variable Urbanization Warming Effects Across Metropolitans of China and Relevant Driving Factors. Remote Sens. 2020, 12, 1500. [Google Scholar] [CrossRef]
  21. Kotharkar, R.; Bagade, A.; Singh, P.R. A systematic approach for urban heat island mitigation strategies in critical local climate zones of an Indian city. Urban Clim. 2020, 34, 100701. [Google Scholar] [CrossRef]
  22. Liu, Y.; Li, Q.; Yang, L.; Mu, K.; Zhang, M.; Liu, J. Urban heat island effects of various urban morphologies under regional climate conditions. Sci. Total Environ. 2020, 743, 140589. [Google Scholar] [CrossRef] [PubMed]
  23. Peng, J.; Ma, J.; Liu, Q.; Liu, Y.; Hu, Y.N.; Li, Y.; Yue, Y. Spatial-temporal change of land surface temperature across 285 cities in China: An urban-rural contrast perspective. Sci. Total Environ. 2018, 635, 487–497. [Google Scholar] [CrossRef]
  24. Geletič, J.; Lehnert, M.; Dobrovolny, P. Land Surface Temperature Differences within Local Climate Zones, Based on Two Central European Cities. Remote Sens. 2016, 8, 788. [Google Scholar] [CrossRef] [Green Version]
  25. Du, P.; Chen, J.; Bai, X.; Han, W. Understanding the seasonal variations of land surface temperature in Nanjing urban area based on local climate zone. Urban Clim. 2020, 33, 100657. [Google Scholar] [CrossRef]
  26. Gilbert, H.; Mandel, B.H.; Levinson, R. Keeping California cool: Recent cool community developments. Energy Build. 2016, 114, 20–26. [Google Scholar] [CrossRef] [Green Version]
  27. Yang, J.; Wang, Y.; Xiu, C.; Xiao, X.; Xia, J.; Jin, C. Optimizing local climate zones to mitigate urban heat island effect in human settlements. J. Clean. Prod. 2020, 275, 123767. [Google Scholar] [CrossRef]
  28. Lai, J.; Zhan, W.; Huang, F.; Quan, J.; Hu, L.; Gao, L.; Ju, W. Does quality control matter? Surface urban heat island intensity variations estimated by satellite-derived land surface temperature products. ISPRS J. Photogramm. Remote Sens. 2018, 139, 212–227. [Google Scholar] [CrossRef]
  29. Gao, J.; Sun, Y.; Liu, Q.; Zhou, M.; Lu, Y.; Li, L. Impact of extreme high temperature on mortality and regional level definition of heat wave: A multi-city study in China. Sci. Total Environ. 2015, 505, 535–544. [Google Scholar] [CrossRef] [PubMed]
  30. Ma, Q.; Wang, Y.; Miao, S.; Zhang, Y.; Mu, Q. Study on the Construction of Land Use Classification Dataset with Building Classification in China’s Large Cities. Transactions of Atmospheric Sciences. 2020. Available online: http://dqkxxb.cnjournals.org/dqkxxb/article/abstract/20200813001 (accessed on 9 April 2021). (In Chinese).
  31. Zhou, B.; Rybski, D.; Kropp, J.P. On the statistics of urban heat island intensity. Geophys. Res. Lett. 2013, 40, 5486–5491. [Google Scholar] [CrossRef]
  32. Hu, L.; Brunsell, N.A.; Monaghan, A.J.; Barlage, M.; Wilhelmi, O.V. How can we use MODIS land surface temperature to validate long-term urban model simulations? J. Geophys. Res. Atmos. 2014, 119, 3185–3201. [Google Scholar] [CrossRef] [Green Version]
  33. Cai, M.; Ren, C.; Xu, Y.; Lau, K.K.-L.; Wang, R. Investigating the relationship between local climate zone and land surface temperature using an improved WUDAPT methodology—A case study of Yangtze River Delta, China. Urban Clim. 2018, 24, 485–502. [Google Scholar] [CrossRef]
  34. Qiao, Z.; Liu, L.; Qin, Y.; Xu, X.; Wang, B.; Liu, Z. The Impact of Urban Renewal on Land Surface Temperature Changes: A Case Study in the Main City of Guangzhou, China. Remote Sens. 2020, 12, 794. [Google Scholar] [CrossRef] [Green Version]
Figure 1. Study area with cities in Jing-Jin-Ji (north), Yangtze River Delta (middle) and Pear River Delta (south) in China.
Remotesensing 13 01468 g001
Figure 2. Schematic of local climate zones, cited from Stewart and Oke [8].
Remotesensing 13 01468 g002
Figure 3. LCZ maps of Beijing (left) and Shanghai (right) with pixel sizes of 1 km, in 2018.
Remotesensing 13 01468 g003
Figure 4. Seasonal mean LST of each LCZ type in JJJ, YRD and PRD (a,c,e), and the seasonal LST difference between maximum and minimum LSTs in the three urban agglomerations (b,d,f).
Remotesensing 13 01468 g004
Figure 5. Standard deviation (SD) of seasonal daytime and night time mean LST for LCZs 1–17, LCZs 1–10 and LCZs A-G, respectively, in Jing-Jin-Ji (a), Yangtze River Delta (b) and Pearl River Delta (c).
Remotesensing 13 01468 g005
Figure 6. The pairwise comparison of mean LST differences within LCZ types in JJJ (a), YRD (b) and PRD (c) in summer, 2018. Red indicates that the LST difference is significant (p < 0.05), while, white is not significant. Black squares show LST differences within LCZ 1–10, green squares show LST differences between natural surfaces (LCZ A–G) and built surfaces (LCZ 1–10), and blue squares show differences within LCZ A–G.
Remotesensing 13 01468 g006
Figure 7. Departure of each LCZ type from the region’s mean LST in summer daytime in JJJ (a), YRD (b) and PRD (c).
Remotesensing 13 01468 g007
Table 1. Cities in three urban agglomerations.
Urban AgglomerationCity Names
Jing-Jin-Ji (5)Beijing, Tianjin, Shijiazhuang, Baoding, Tangshan
Yangtze River Delta (15)Shanghai, Nanjing, Changzhou, Suzhou, Yangzhou, Wuxi, Nantong, Hangzhou, Jiaxing, Ningbo, Shaoxing, Jinhua, Taizhou, Hefei, Wuhu
Peal River Delta (8)Guangzhou, Shenzhen, Foshan, Dongguan, Huizhou, Zhongshan, Zhuhai, Hongkong
Table 2. Data used in this study.
Data.ResolutionDateSources
MODIS 11A2 LST1 km2018http://earthdata.nasa.gov/
Landsat 8 OLI30 mSummer in 2017–2019http://www.usgs.gov
China population1 km2015http://www.resdc.cn/doi/doi.aspx?doiid=32
Table 3. The classification accuracies in three urban agglomerations.
RegionsOAOAuOAn
JJJ78.5%72.2%88.2%
YRD81.3%72.4%89.8%
PRD81.7%73.5%88.0%
Table 4. Percentage of significant differences between different land covers.
RegionNatural & Built Types (Green Square)Inter-Natural Types (Blue Square)Inter-Built Types (Black Square)Total
JJJ34.6%6.6%13.2%54.4%
YRD34.6%3.7%6.6%44.9%
PRD10.3%2.2%0%12.5%
Table 5. The dominant LCZ types in summer daytime, 2018.
RegionHeatingCooling
JJJLCZ 2LCZ A
YRDLCZ 8, LCZ ELCZ A, LCZ G
PRDLCZ 8LCZ A
Table 6. The optimal LCZ combinations and LST variations in three urban agglomerations, for summer daytime in 2018.
RegionOptimal CombinationLST before Optimization (K)LST after Optimization (K)Reduced LST (K)
JJJLCZ 1 + LCZ A 309.07304.964.11
YRDLCZ 1 + LCZ G309.31305.823.49
PRDLCZ 1 + LCZ A309.90305.993.91
Publisher’s Note: MDPI stays neutral with regard to jurisdictional claims in published maps and institutional affiliations.

