Article

Using a One-Dimensional Convolutional Neural Network on Visible and Near-Infrared Spectroscopy to Improve Soil Phosphorus Prediction in Madagascar

by
Kensuke Kawamura
1,*,
Tomohiro Nishigaki
1,
Andry Andriamananjara
2,
Hobimiarantsoa Rakotonindrina
2,
Yasuhiro Tsujimoto
1,
Naoki Moritsuka
3,
Michel Rabenarivo
2 and
Tantely Razafimbelo
2
1
Japan International Research Center for Agricultural Sciences (JIRCAS), 1-1 Ohwashi, Tsukuba, Ibaraki 305-8686, Japan
2
Laboratoire des Radio-Isotopes, Université d’Antananarivo, BP 3383, Route d’Andraisoro, Antananarivo 101, Madagascar
3
Faculty of Agriculture and Marine Science, Kochi University, Nankoku, Kochi 783-8502, Japan
*
Author to whom correspondence should be addressed.
Submission received: 5 March 2021 / Revised: 2 April 2021 / Accepted: 8 April 2021 / Published: 15 April 2021
(This article belongs to the Special Issue Remote and Proximal Sensing for Precision Agriculture and Viticulture)

Abstract

:
As a proximal soil sensing technique, laboratory visible and near-infrared (Vis-NIR) spectroscopy is a promising tool for the quantitative estimation of soil properties. However, there remain challenges for predicting soil phosphorus (P) content and availability, which requires a reliable model applicable for different land-use systems to upscale. Recently, a one-dimensional convolutional neural network (1D-CNN) corresponding to the spectral information of soil was developed to considerably improve the accuracy of soil property predictions. The present study investigated the predictive ability of a 1D-CNN model to estimate soil available P (oxalate-extractable P; Pox) content in soils by comparing it with partial least squares (PLS) and random forest (RF) regressions using soil samples (n = 318) collected from natural (forest and non-forest) and cultivated (upland and flooded rice fields) systems in Madagascar. Overall, the 1D-CNN model showed the best predictive accuracy (R2 = 0.878) with a highly accurate prediction ability (ratio of performance to the interquartile range = 2.492). Compared to the PLS model, the RF and 1D-CNN models indicated 4.37% and 23.77% relative improvement in root mean squared error values, respectively. Based on a sensitivity analysis, the important wavebands for predicting soil Pox were associated with iron (Fe) oxide, organic matter (OM), and water absorption, which were previously known wavelength regions for estimating P in soil. These results suggest that 1D-CNN corresponding spectral signatures can be expected to significantly improve the predictive ability for estimating soil available P (Pox) from Vis-NIR spectral data. Rapid and accurate estimation of available P content in soils using our results can be expected to contribute to effective fertilizer management in agriculture and the sustainable management of ecosystems. However, the 1D-CNN model will require a large dataset to extend its applicability to other regions of Madagascar. Thus, further updates should be tested in future studies using larger datasets from a wide range of ecosystems in the tropics.

1. Introduction

Phosphorus (P) deficiency is a major constraint for crop production in low-input agricultural systems in the tropics [1], and stems from the predominance of strongly weathered soils in which the availability of P is lowered by strong sorption to aluminum (Al) and iron (Fe) (hydr)oxides [2,3]. Even in natural ecosystems, limited soil available P can lead to a decline in the climax ecosystem by reducing biomass productivity [4]. Hence, rapid and quantitative information on soil fertility status is essential for improving biomass production in agricultural and natural ecosystems and developing sustainable land management. Among many extraction methods for evaluating available P, the method using acid ammonium oxalate solution is known to be suited to tropical weathered soils because it can solubilize the active reductant-soluble P, which is the dominant P pool for P cycling in tropical ecosystems [5,6].
Among the proximal soil-sensing techniques, laboratory visible and near-infrared (Vis-NIR) spectroscopy has long been adopted as a rapid, cost-effective, and quantitative analytical method for predicting soil properties [7]. Efforts have been made to characterize the chemical, physical, and mineralogical composition of soil using Vis-NIR spectra (400–2500 nm) [8]. However, making reliable predictions at larger scales requires a large spectral and reference dataset collected from various soil conditions, and this requires the development of a spectral library [9,10]. With the increasing number of data sources, a standard approach based on a spectral library is required [11]. Currently, soil spectral libraries are available at the country [11,12], continental [13,14], and global [15] scales. These spectral libraries allow the development of calibration models for predicting soil properties.
For the calibration method, the partial least squares (PLS) regression [16] has long been used as a standard approach in Vis-NIR spectroscopy because it can extract information on target soil properties from a spectral matrix with hundreds or even thousands of wavebands [17,18]. The predictive accuracy is improved by waveband selection in PLS analysis by removing redundant wavebands [19,20]. Our previous papers showed that the application of waveband selection improves the performance of PLS analysis for estimating the total carbon (TC) content of paddy soils in Madagascar [21,22,23]. However, as a linear multivariate calibration, the accuracy of PLS analysis tends to decrease because of the nonlinear nature of the relationship between spectral data and the dependent variable [24]. To overcome this issue, machine learning techniques have been increasingly adopted because they can account for the nonlinearity associated with soil spectral responses. The major machine learning approaches are artificial neural networks (ANNs) [25], support-vector machines (SVM) [26], and random forest (RF) [27,28,29].
More recently, deep learning approaches have rapidly evolved in machine learning techniques with promising results for data analysis in nature [30] and have also been tested for soil spectral calibration [31,32]. Among deep learning approaches, convolutional neural networks (CNNs) [33] are one of the most popular learning architectures. In the remote sensing of agriculture, CNN-based approaches have been applied to various images with different research objectives, such as land cover classification [34], weed mapping [35], and crop yield prediction [36]. CNN-based deep learning was originally suitable for 2D image data, but its applicability has been extended to one-dimensional (1D) spectral data in recent years. For example, Padarian et al. [32] demonstrated that the CNN model, by converting the 1D soil spectra into a 2D spectrogram as input, can predict the soil TC, cation exchange capacity (CEC), clay, sand, and pH with better accuracy than conventional methods (PLS and Cubist). Ng et al. [31] developed a 1D-CNN model and compared it with a 2D-CNN model to estimate the major soil properties (TC, organic carbon (OC), CEC, clay, sand, and pH)) based on the Kellogg Soil Survey Laboratory (KSSL) database. The results indicated that the 1D-CNN model was more effective than the 2D-CNN model. For areas not included in the soil spectral libraries, a local model can be developed or improved by transfer learning from the global model [37]. However, the prediction accuracy for P is lower than that for other soil components, and thus, improvements in predictive accuracy are required. Tsakiridis et al. [38] reported that the R2 for soluble P in sodium hydrogen carbonate was 0.42, while the R2 for clay content, soil organic carbon, and total nitrogen was 0.86, 0.86, and 0.83, respectively, using the visible, near-infrared and shortwave-infrared (VNIR-SWIR) spectra of the Land Use and Coverage Area Frame Survey (LUCAS) soil spectral library in combination with a localized multi-channel 1-D CNN model.
As mentioned above, state-of-the-art deep learning approaches with soil spectral libraries are currently available to construct models for predicting soil properties at local, regional, and global scales. However, soil P predictions remain challenging despite their importance to the sustainable management of agricultural systems aimed at addressing both soil degradation in the tropics and the environmental impacts of its excess use [39]. This is because soil P has no specific absorption in the Vis-NIR wavelength region [40]. Our previous studies in a range of rice cultivation soils in Madagascar identified the important wavelength for estimation and developed a reliable prediction model for oxalate-extractable P in soils, which is a suitable indicator of P availability for rice in the region [41], using PLS analysis with waveband selection [23,42]. Furthermore, different P cycling between natural and cultivated systems resulted in different soil P forms, which consequently decreased the accuracy of a common model in both land-use systems (cultivated vs. natural) [42]. The estimation accuracy should be improved by applying a comprehensive model to soil diagnosis in farm fields and other ecosystems for data compatibility and usability.
Therefore, the purpose of the present study was to develop a model based on the 1D-CNN architecture for estimating the soil available P content (Pox) in Madagascar. We used the dataset from our previous reports [23,42] because in Madagascar, only a small number of qualified datasets have been recorded in the soil spectral libraries: continent scale (n = 82) [13] and global scale (n = 18) [15]. Furthermore, because most soil spectral libraries use total P (TP) as reference data, the transfer learning approach cannot be applied to localize the model to Madagascar. Therefore, we compared the predictive ability of the 1D-CNN model to the previously used regression approaches, PLS and RF. We also performed a sensitivity analysis to identify the important wavebands used by the CNN model to predict soil Pox, and then evaluated the importance of the wavebands showing high sensitivity compared to PLS and RF.

2. Materials and Methods

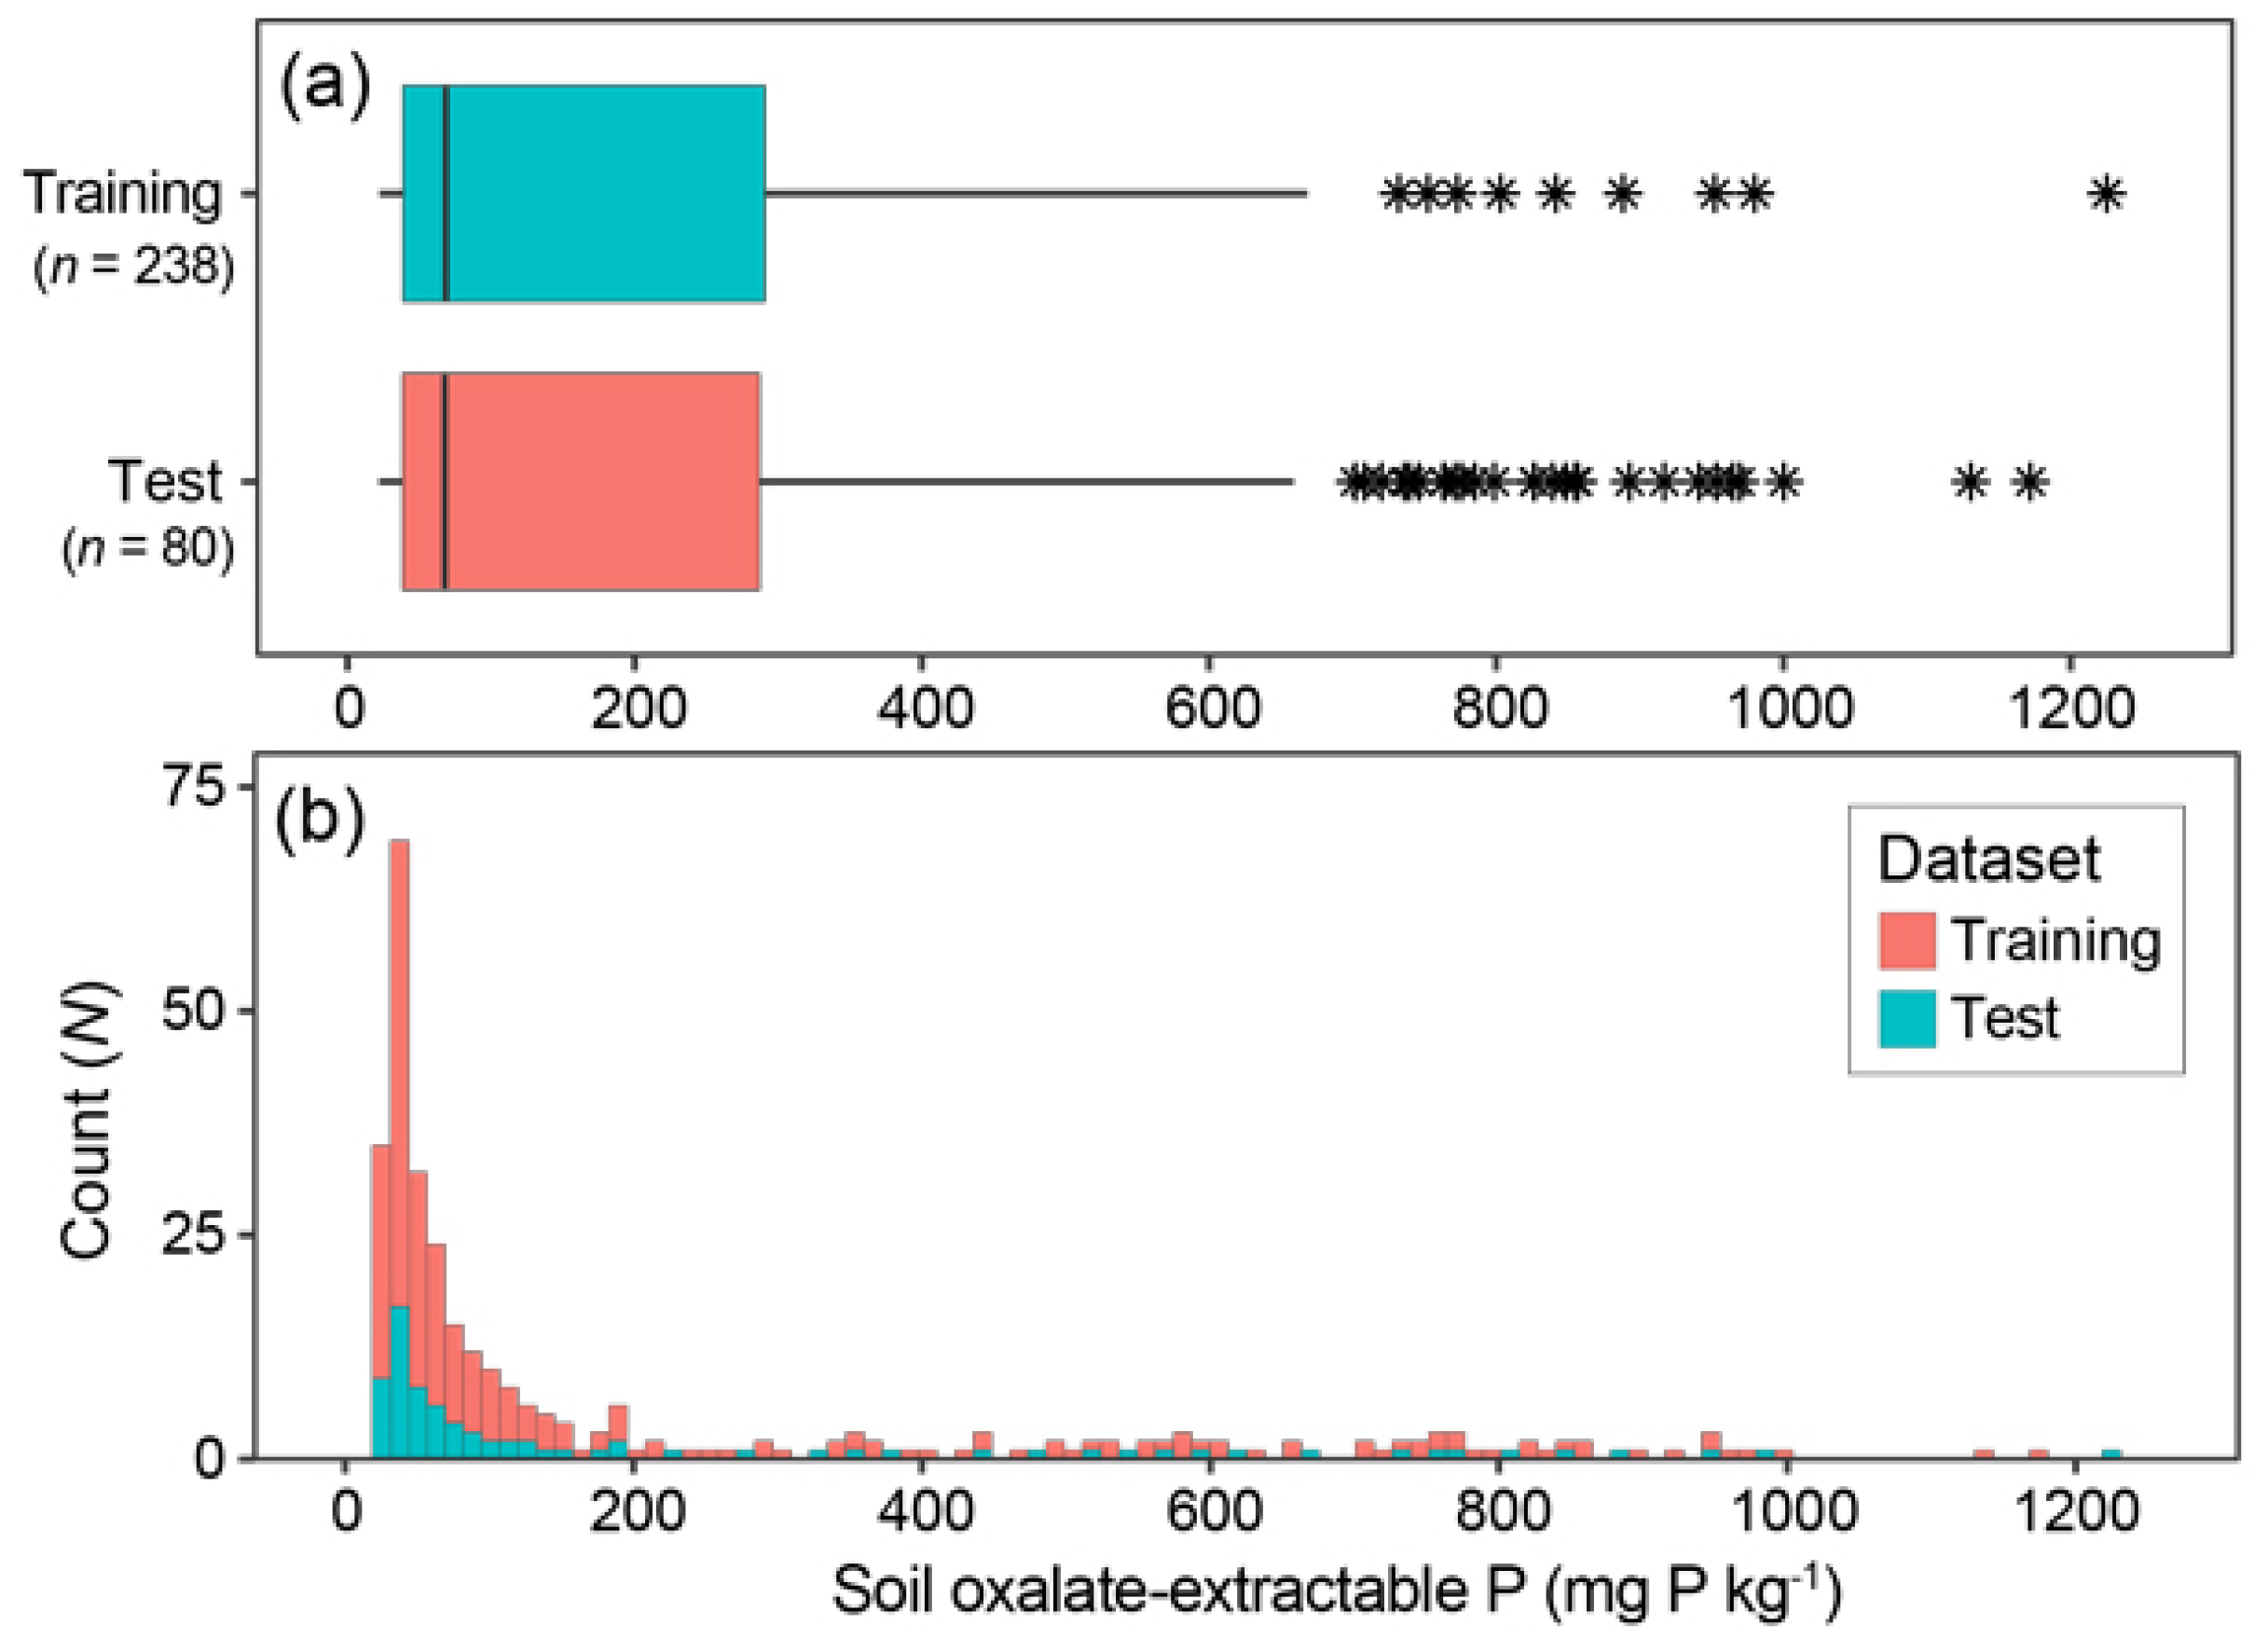
2.1. Study Site and Dataset

The combined dataset included soil Pox content and spectral measurement data from 318 sampling points from the central highlands and eastern forest regions in Madagascar (Figure 1). Soil sampling was carried out in cultivated (n = 244) and natural (n = 74) systems. The climate in the area is sub-humid to humid tropics with an annual rainfall of 1381–2500 mm and a mean annual temperature of 16.9–24.0°C, depending on the elevation (110–1667 m above sea level). The area is dominated by Geric Ferralsols, which are generally acidic with low available P [43,44].
In the central highlands, soil sampling was performed in farmers’ fields under irrigated (n = 173) and upland (n = 71) rice systems in 2015–2016 and 2018–2019. Surface soil samples were collected at a depth of 0–15 cm as composites of three to four cores in each field. In the eastern forest region, 74 soil samples were collected in 2014 and 2015 from forest (n = 16) and non-forest (n = 58) sites. The non-forest sites included fallow and degraded land. The soil samples were air-dried for 14 days and sieved to <2 mm. Soil P was extracted using the acid ammonium oxalate method [45], and the concentration of P in the oxalate extraction was analyzed using the malachite green colorimetric method [46].

2.2. Spectral Measurements and Preprocessing

Spectral measurements of soil samples were taken in dark rooms at the Japan International Research Center for Agricultural Science (JIRCAS) and the Laboratoire des Radioisotopes, Antananarivo University, Madagascar, using ASD FieldSpec 4 Hi-Res (ASD Inc., Longmont, CO, USA) and an ASD contact probe. Compared to multispectral sensors, the hyperspectral soil reflectance data in laboratory Vis-NIR spectroscopy has some advantages such as waveband richness, sharpness of wavebands, and spectral continuity [47]. The ASD FieldSpec measures the spectral reflectance in the 350–2500 nm wavelength region. The spectral resolution (full width at half maximum; FWHM) was 3 nm in the 350–2500 nm range and 6 nm in the 1000–2500 nm range, which were resampled to 1 nm resolution wavelengths for output data using the cubic spline interpolation function in ASD software (RS3 for Windows; ASD Inc.). A Spectralon (Labsphere Inc., Sutton, NH, USA) reference panel (white reference) was used to optimize the ASD instrument prior to taking Vis-NIR reflectance measurements for each sample.
Bulk soil samples (<2 mm) were filled into an optical-glass Petri dish with a diameter of 85 mm and pressed to form a layer about 19 mm tick. The soil surface reflectance measurements were done on the surface for 25 times with five replications for each soil sample, and the spectral readings were averaged.
During preprocessing, spectral data were initially converted from reflectance (R) to absorbance (A = log(1/R)). Then, the absorbance spectra were converted to the first derivative absorbance (FDA) spectra using a Savitzky-Golay smoothing filter [48] with a third-order, 15-band moving polynomial. In addition, FDA spectra were standardized using a standard normal variate transform (SNV) to reduce the particle size effect [49]. Finally, the FDA data of both edge wavelength regions (350–419 nm and 2401–2500 nm) were removed because of the low signal-to-noise ratios in the instruments. Thus, the remaining 1981 spectral bands between 420 and 2400 nm were used in the analyses.

2.3. Model Development

2.3.1. Partial Least Squares (PLS) Regression

PLS is one of the most widely used linear regression approaches to analyze high-dimensional datasets, such as hyperspectral and Vis-NIR data, because it combines all available waveband information without multicollinearity issues, unlike standard multiple linear regression analysis. The PLS regression treats each waveband as an independent explanatory variable for estimating the response variable of the target component (soil Pox in the present study). The regression coefficient of PLS is computed by weighting the optimal number of PLS factors; it is also called a weighted coefficient (βw). Here, a leave-one-out cross-validation (CV) method was used to select the optimal number of PLS factors to be included in the regression model. The important wavebands can be determined by the high absolute value of βw.

2.3.2. Random Forest (RF) Regression

RF is a machine-learning approach that uses a non-linear statistical ensemble method that builds a large number of decision trees (ntree) for classification or regression and then averages them [50]. This approach evaluates the relationship between explanatory and response variables using a set of decision rules constructed by recursively dividing the input space into smaller regions. In the procedure, the model is developed with a set of trees by selecting a subset based on a bagging approach. Each tree grows until it reaches a certain minimum number of nodes (node size). Then, the remaining subset (called the out-of-bag (OOB) sample) is used for internal cross-validation to assess the average accuracy and error rate over all predictions [51]. In addition, the OOB is used to estimate the variable (feature) importance. Finally, the output class is calculated using the maximum votes from the ntree in the forest. In this study, we set ntree = 5000 and node size = 5 to construct the RF model. The importance of spectral wavebands in the model was evaluated by the Gini impurity, which was calculated by summing all decreases in Gini impurity at each tree node split, normalized by the number of trees.

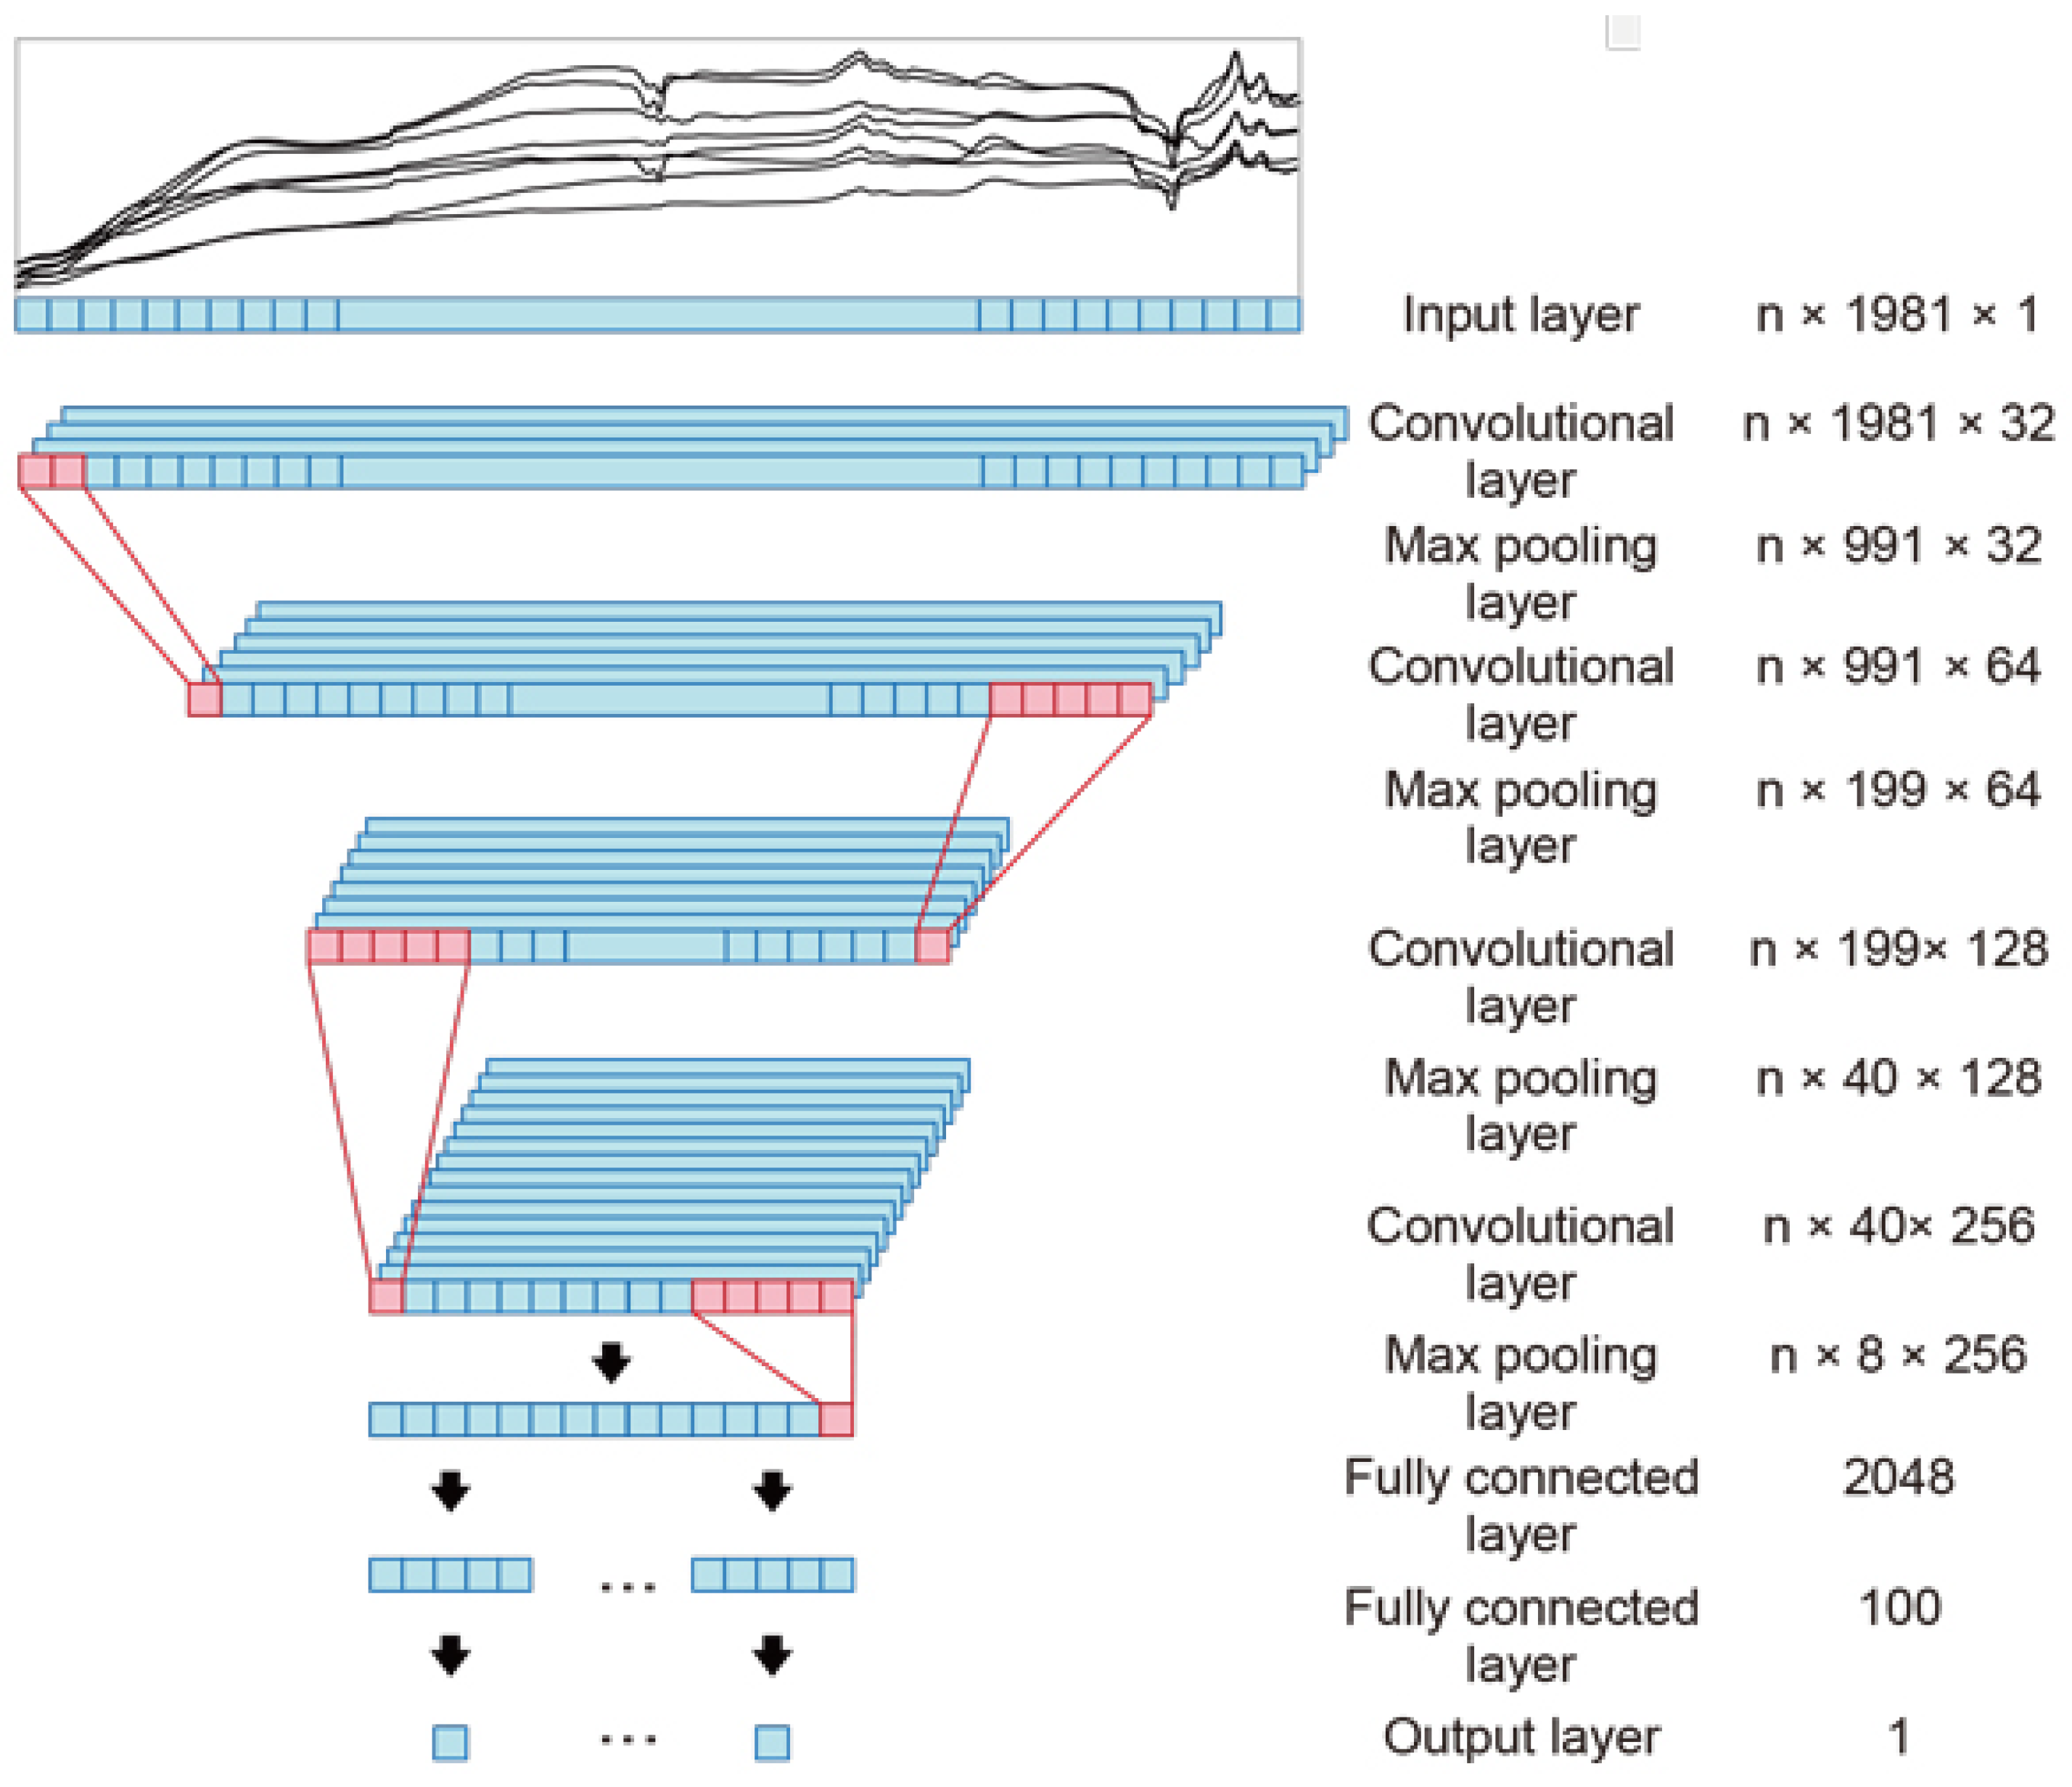
2.3.3. One-Dimensional Convolutional Neural Network (1D-CNN)

CNNs are the most widely used architectures in deep learning approaches. CNN architectures are generally composed of an input layer, several hidden layers (convolution layers, pooling, and fully connected), and an output layer. Among the CNNs, 1D-CNN has an input layer and 1D filters on the convolution layers suitable for one-dimensional spectral data [52]. In the present study, we used the 1D-CNN architecture proposed by Ng et al. [31] (Figure 2) because the structure is simple and well described, and there are existing reports on other soil properties. This is good to compare the accuracy of our newly performed soil oxalate-P estimation with the results of other soil properties. The architecture included 10 hidden layers (Table 1): four convolutional layers, four max-pooling layers, and two fully connected layers. The activation function used a rectified linear unit (ReLU) for all hidden layers [53]. Two dropout rates of 0.4 and 0.2 were used to avoid overfitting [31].

2.4. Data Handling and Implementation

Our whole dataset (n = 318) was split into training (n = 238) and test (n = 80) subsets. The training data were used to develop the PLS, RF, and 1D-CNN models. Then, the models were applied to the test dataset to assess the predictive abilities of the models for soil Pox prediction. Table 2 summarizes the minimum, maximum, median, mean, and standard deviation (SD) values of Pox (mg P kg–1) for the training (n = 238) and test (n = 80) datasets, including data collected from different land-use systems (natural and cultivated). Soils in cultivated systems showed higher Pox values and wider ranges compared with soils in natural systems, probably due to the effect of fertilization on cultivated land [42].
The data distributions of soil Pox for all systems in the training and test datasets are shown in Figure 3. The data range of soil Pox content was similar for the training (21.9–1172.0 mg P kg–1) and test (22.3–1225.2 mg P kg–1) datasets. Moreover, the SD (278.0 and 290.0 mg P kg–1) showed similar values. This is important for correct validation by applying the model created with the training data to the test data. The data distribution was left-skewed because of the predominance of strongly weathered soils in the region [43,44], with higher mean (214.7 and 220.9 mg P kg–1 for training and test datasets, respectively) than median (67.7 and 68.5 mg P kg–1) values. Theoretically, the SD, data range, and distribution pattern affect the accuracy of the regression analysis. Compared to previous studies (121–991 mg P kg–1) [54], our data set included a larger variance of Pox values, which can be expected to improve the predictive ability of a model.
In the present study, PLS and RF models were implemented using R ver. 3.6.3 [55] with the packages ‘pls’ ver. 2.7-2 [56] and ‘randomForest’ ver. 4.6-14 [57]. The CNN was implemented using Python ver. 3.6.9 [58] with the Keras library ver. 2.2.4 [59], and TensorFlow ver. 1.14.0 [60] backend. All computations were performed on a desktop PC with Intel® CoreTM i9-9900X 3.5 GHz processor, 64 GB RAM, and the NVIDIA GeForce RTX 2080 Ti.

2.5. Predictive Accuracy Evaluation

To assess the predictive accuracy of the PLS, RF, and 1D-CNN models, a 5-fold cross-validation was performed in the training dataset (n = 238). In the procedure, the training data were split randomly into 5-folds. Each model was built on 4 (=5 − 1) folds, and then the error of the remaining 1-fold was recorded as validation data. The process was repeated until each of the 5-folds served as a validation data set. The mean values of the coefficient of determination (R2), root mean squared error (RMSE), and bias were used to assess model accuracy. The RMSE and bias were defined as
RMSE = i = 1 n ( Y i Y ^ i ) 2 n ,
bias = i = 1 n ( Y ^ i Y i ) n ,
where Y and Ŷ are the observed and predicted soil Pox values, respectively, and n is the total number of observations i.
Moreover, the models were applied to the test dataset (n = 80), and then the predictive ability was evaluated from the R2, RMSE, bias, and the ratio of performance to the interquartile range (RPIQ) [61]. The RPIQ is an auxiliary indicator of the model, and the performance of predictive ability and future reliability can be judged as follows: (i) >2.5: excellent model, (ii) 2.0–2.5: very good model with predictive ability, (iii) 1.7–2.0: good model, (iv) 1.4–1.7: fair model in need of some improvement, and (v) <1.4: model with very poor predictive ability [62].

2.6. Sensitivity Analysis of 1D-CNN Model for Evaluating Important Wavebands

In the PLS and RF models, the importance of wavebands for estimating soil Pox can be assessed using PLS regression coefficients and RF importance (Gini purity index). However, it is difficult to directly evaluate the important wavebands in the 1D-CNN model. To assess the importance of wavebands in the 1D-CNN model, a sensitivity analysis was performed using the method proposed by Ng et al. [31], in which the sensitivity is calculated as a function of the variance of the model for each window of spectra [63]:
S i = V ( f ( X 1 , , X 2 , , X n ) f ( X ¯ ) ) V ( Y ) ,
where V is the variation calculation, f(X1,…X2,…, Xn) is the prediction of spectra due to variation in waveband i with the other wavebands held constant on average, f ( X ¯ ) is the prediction value using the mean values of the spectra, and Y is the observed value of the soil Pox. In essence, this approach compares the sensitivity of the wavebands and calculates how the model changes [31].

3. Results

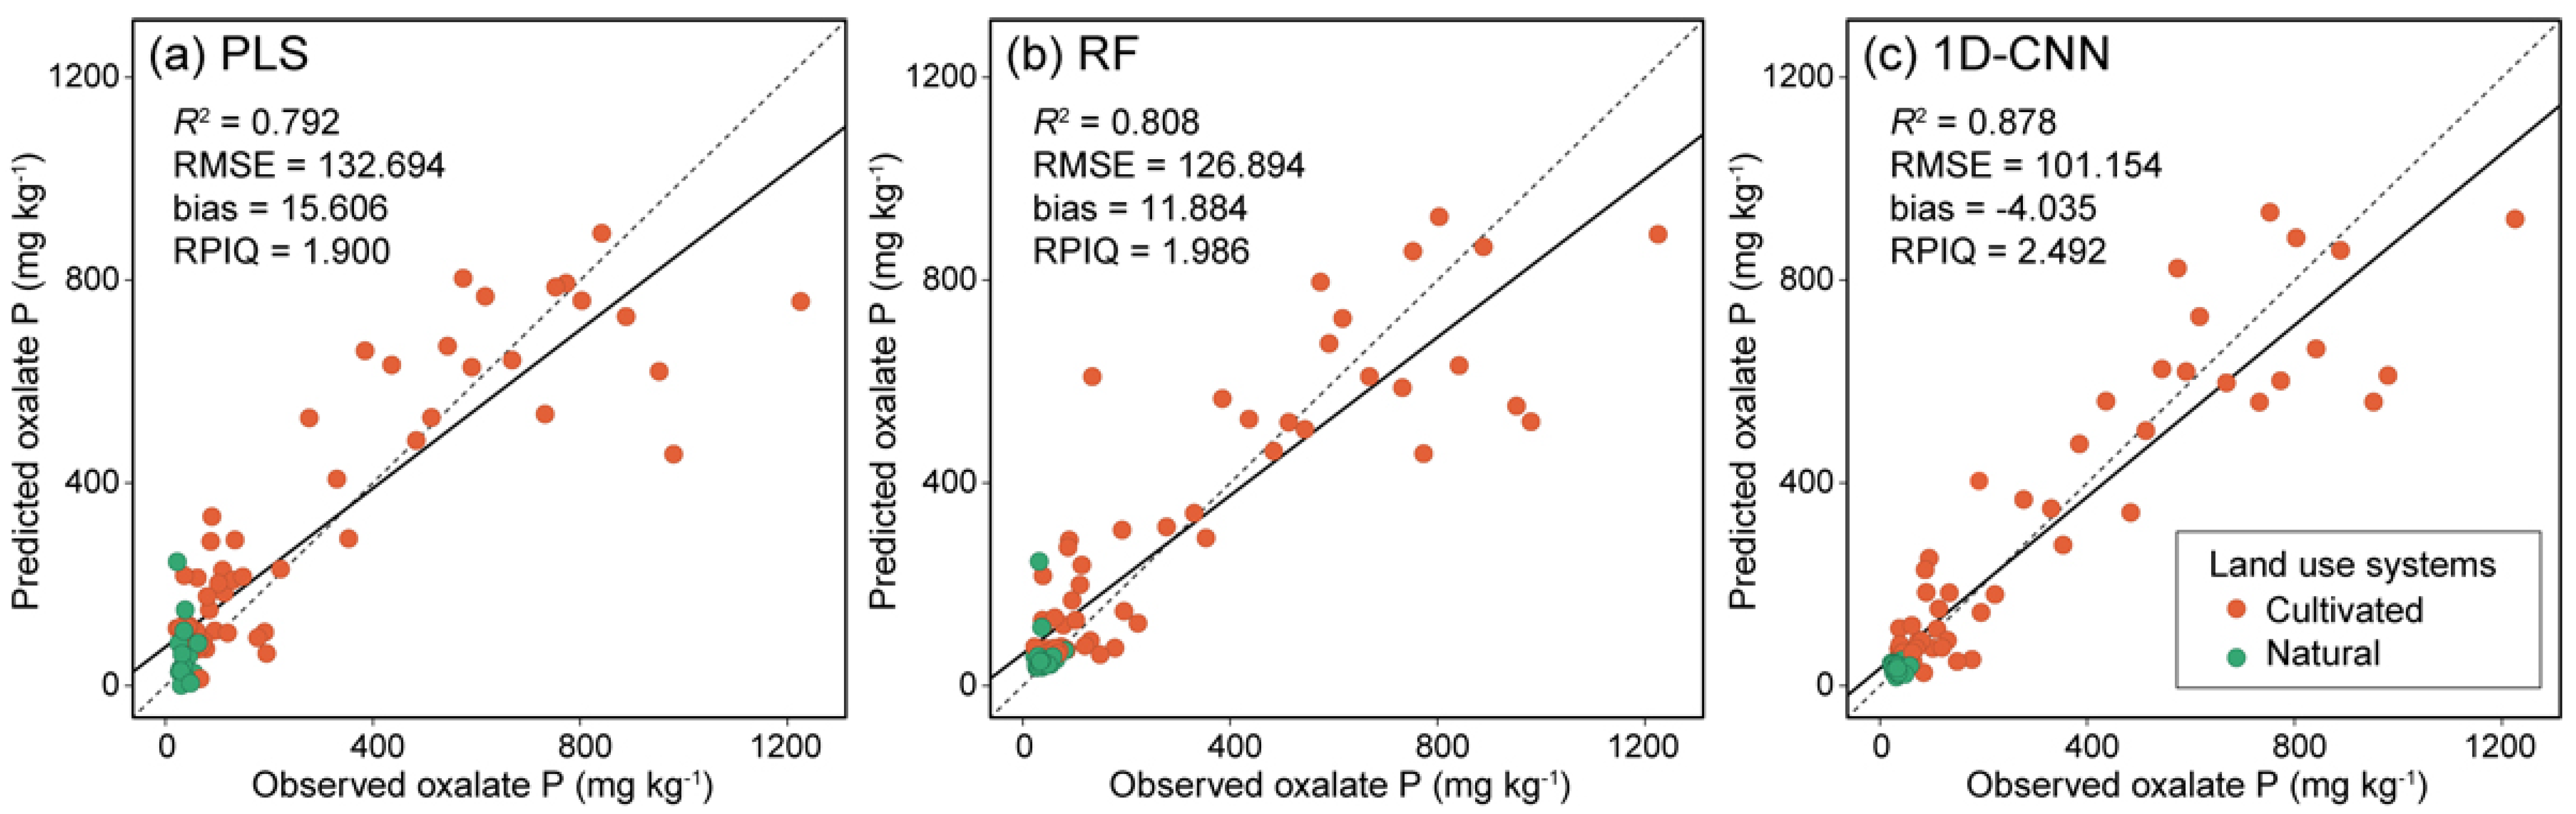
3.1. Comparison of Predictive Abilities in PLS, RF, and 1D-CNN Models

To compare the predictive accuracy in the PLS, RF, and 1D-CNN models using FDA spectral datasets, the mean values of R2, RMSE, bias, and the relative improvement (%RMSE) from 5-fold cross-validation were compared in the training dataset (n = 238) (Table 3). Computational times for developing the PLS, RF, and 1D-CNN models were 3.9, 264.1, and 5908.45 s (CPU time), respectively. Clearly, the 1D-CNN required a lot of learning time to develop the model, but it showed much better predictive accuracy (R2 = 0.989, RMSE = 35.636) than the RF (R2 = 0.842, RMSE = 108.820) and PLS (R2 = 0.827, RMSE = 114.854) models. Compared with the RMSE values of the PLS model, the RF model showed a slight improvement in accuracy (%RMSE = 5.254%), while the 1D-CNN model showed a significant improvement (68.973%).
In addition, to confirm the reliability of the models, predictive ability was assessed from the relationship between the observed and predicted soil Pox content from the PLS, RF, and 1D-CNN models in the individual test dataset (n = 80) (Figure 4). The R2, RMSE, bias, RPIQ, and the relative improvement in RMSE (%RMSE) are summarized in Table 4. Similarly to the cross-validation results in the training dataset, the 1D-CNN showed higher predictive accuracy (R2 = 0.878, RMSE = 101.154) than the RF (R2 = 0.808, RMSE = 126.894) and PLS (R2 = 0.792, RMSE = 132.694) models. Compared with the PLS model, the RF and 1D-CNN models indicated a 4.37% and 23.77% relative improvement in %RMSE, respectively. Based on the RPIQ values, the PLS and RF models (RPIQ < 2.0) could be judged as good models, but they required further work to improve quality and increase future applicability, while the 1D-CNN model (RPIQ = 2.492) was considered to be a very good model with high predictive ability.

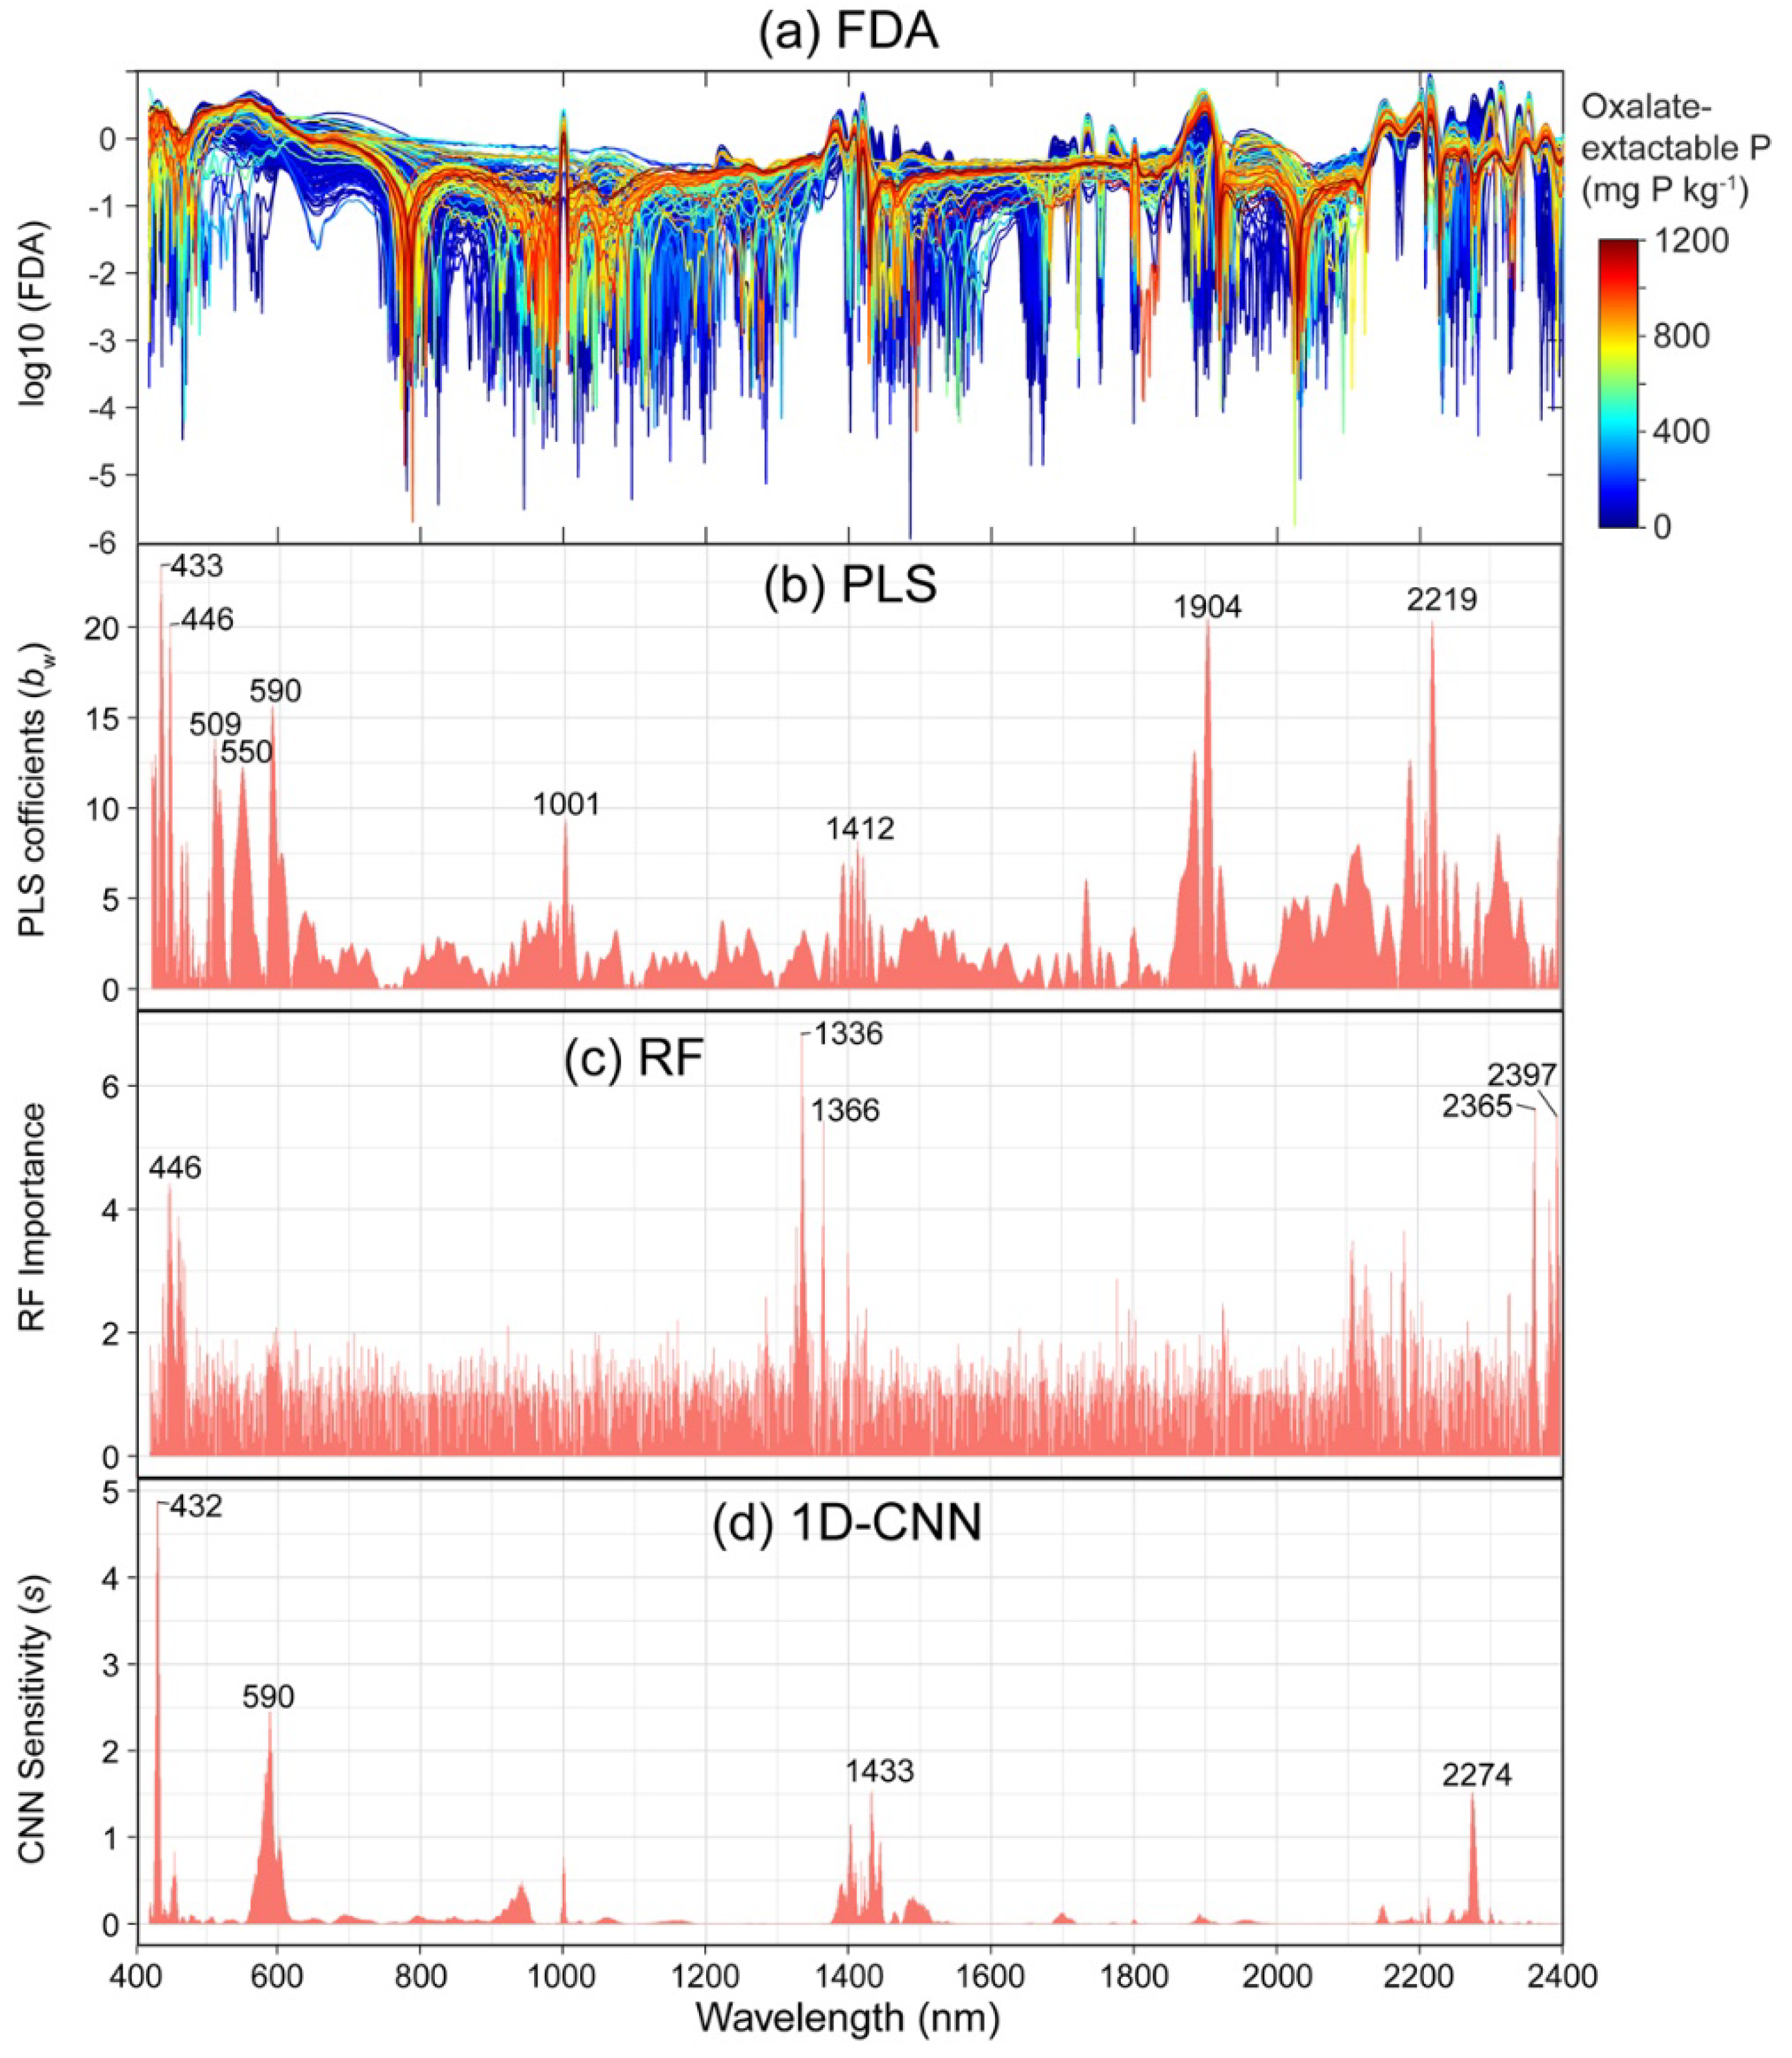
3.2. Important Wavelengths

The importance of each waveband in the models for soil Pox prediction was assessed. Figure 5 shows the FDA spectra in logarithmic form to easily refer to the wavelength characteristics depending on the soil P values, and the absolute values of PLS coefficients, RF importance (Gini purity index), and 1D-CNN sensitivity (s) as indicators of the importance of each waveband in the soil Pox estimation models.
The important wavebands for the PLS model were revealed in the visible (433, 446, 509, 550, and 590 nm) and NIR (1001, 1412, 1904, and 2219 nm) wavelength regions. The RF model showed constant values over the entire wavelength range, but the 446, 1336, 1366, 2365, and 2397 nm were particularly important. In the 1D-CNN model, high sensitivity was observed in the narrow and limited wavelength regions, with peaks at 432, 590, 1433, and 2274 nm. The three peaks (432, 590, and 1433 nm) did not exactly match but also showed a high value in PLS coefficients, and thus were considered to be important for estimating soil Pox.

4. Discussion

As a deep learning approach suitable for 1D spectral data, 1D-CNN with Vis-NIR spectral data was applied to predict soil Pox content in Madagascar, and its predictive ability was compared with that of PLS and RF models. The 5-fold cross-validation in the training dataset demonstrated that the 1D-CNN model can estimate soil Pox from Vis-NIR spectral data with improved accuracy compared to the other common methods of PLS and RF. Even though our soil samples were collected from different land- use systems, the best predictive ability in the 1D-CNN model was also confirmed in the individual test dataset. These results indicated that a comprehensive model to predict Pox in soils with high accuracy could be developed irrespective of land use systems using a deep learning approach with a 1D-CNN model rather than PLS (conventional method) and RF (another machine learning approach). Similarly, the lowest bias was observed in the 1D-CNN model. Based on the RPIQ value, our 1D-CNN model could be considered to have a very good predictive ability, and therefore could provide high-quality results in future applications. These results confirm that the CNN-based model can outperform PLS and other machine learning approaches for estimating soil properties, as suggested by previous studies [31,32]. Another update from our previous report using PLS regression analysis [42] was that the 1D-CNN model enabled the prediction of soil P as a single model, even based on the dataset collected from different land-use systems in Madagascar. These improvements are considered to be advances in the holistic understanding of soil P dynamics and their rational management in agriculture and natural ecosystems in Madagascar. Furthermore, the timely and accurate prediction of available P content in soils using our 1D-CNN model can be expected to contribute to effective fertilizer management in agriculture and the sustainable management of ecosystems.
We also assessed the important wavebands of the 1D-CNN model using a sensitivity analysis method developed by Ng et al. [63]. Assessing the important specific spectral features and their regions may help clarify the relationship between spectral signatures and underlying molecular activity within the spectral wavelength regions used in the calibration [64]. In the Vis-NIR wavelength region, theoretically, there is no specific absorption by Pox; thus, differences in spectral shape due to P content cannot be clearly determined [65,66,67]. However, indirect correlations between P forms and spectrally active soil properties can be studied. For example, Pätzold et al. [68] reported that the most relevant variables for the estimation of soil P by PLS were selected based on the variable importance in projection (VIP) method, and that PLS regression coefficients were located around 500 nm and 2200–2400 nm. Our previous study in Madagascar identified important Pox regions at 454–660 nm and 1732–2312 nm based on five runs of the variable selection method genetic algorithm followed by PLS regression [23].
In the present study, our 1D-CNN model showed high sensitivity in the narrow and limited wavelength regions with peaks at 432, 590, 1433, and 2274 nm. Since these wavebands correspond to the regions reported previously [23,68], it can be suggested that soil Pox tends to be primarily associated with the visible (400–660 nm) and longer NIR (1700–2400 nm) wavelength regions. The visible part of the spectral region was dominated by absorption due to organic matter (OM) and electronic transitions of Fe, and the selected wavebands at 432 and 590 nm were attributed to absorption by ferric oxide and OM, respectively [40,69,70,71]. Our previous study also reported that oxalate-extractable Al and Fe were positively correlated with soil TC and organic P content, respectively [5]. The longer NIR wavelength region (1700–2400 nm) was dominated by a combination of bands from intense fundamental vibrations of O-H, C-H bonds, and Al metal-OH groups [7,72]. The waveband at 1433 nm was attributed to sorptive water, and that at 2274 nm was associated with gibbsite (Al-oxide mineral) [73]. The significance of the sorptive water in air-dried soils for predicting Pox was corroborated by our previous finding that active Al was clearly correlated with air-dried soil moisture content (Nishigaki et al., under review).
Overall, our findings were in agreement with those of earlier studies that reported that machine learning outperformed PLS regression. However, such approaches may not be suitable for all situations because the deep learning approach requires large, qualified datasets to develop good prediction models [31]. Therefore, many CNN-based deep learning approaches have been performed using a large topsoil spectral dataset, such as the KSSL database (n = 14,594) [31] or LUCAS soil spectral libraries (n = 19,036) [32,37,38,74]. Our dataset collected from the central and eastern regions of Madagascar was relatively small (n = 318). This is a limitation of our study for developing a robust model on a larger spatial scale. However, the Pox targeted in our study was more highly correlated with other soil properties (e.g., oxalate-extractable Al and Fe, and soil pH) than total P or easily soluble P [5]. This possibly resulted in a higher prediction accuracy using spectral data for Pox than that achieved in previous reports. Further evaluation by updating the model with a larger dataset will be required in future studies to map and assess the spatial distribution of soil Pox status on a larger spatial scale in Madagascar.

5. Conclusions

The present study investigated the performance of a 1D-CNN model through comparison with two conventional methods, PLS and RF, for estimating soil Pox content with Vis-NIR spectral data in soil samples collected from cultivated (upland and flooded rice fields) and natural (forest and non-forest) systems in Madagascar. The main conclusions are as follows:
  • With the potential to provide high predictive ability and performance in deep learning approaches, Vis-NIR spectroscopy with 1D-CNN is a promising method for predicting soil Pox content.
  • Our 1D-CNN model provided the best predictive ability to estimate soil Pox content compared with the PLS and RF models.
  • The RPIQ value from the 1D-CNN is suggested to be a very good model with high predictive ability for future applicability.
  • The important wavebands from the sensitivity analysis of the 1D-CNN model were revealed in the visible region (432 and 590 nm) associated with Fe-oxides and diverse functional groups in soil OM; at 1433 nm, associated with water absorption; and at around 2270 nm with gibbsite (Al oxide mineral). These wavelength regions are known to be of high importance in the PLS model, and are in line with previous studies.
  • The 1D-CNN model we developed allowed soil P prediction based on a single model, even using data from different land-use systems.
Our findings illustrate the potential of deep learning approaches for predicting soil P availability using a proximal sensing technique. The main contribution from our study is the demonstration of a 1D-CNN model that can be applied to soil Pox prediction in different ecosystems from the central to eastern regions of Madagascar. Moreover, rapid and accurate prediction of soil Pox using our results can be expected to contribute to effective fertilizer management in agriculture and the sustainable management of ecosystems. Nevertheless, the 1D-CNN approach employed in this study should be updated with a larger dataset and further evaluated on a larger spatial scale in Madagascar.

Author Contributions

K.K., T.N., Y.T., N.M., and T.R. designed this study; Y.T., T.N., A.A., H.R., and M.R. performed the field work and carried out the soil chemical analyses; K.K., A.A., H.R., and M.R. performed the laboratory spectral measurements and data processing; K.K., T.N., and Y.T. wrote the manuscript; and all authors revised the paper. All authors have read and agreed to the published version of the manuscript.

Funding

This research was supported by the Science and Technology Research Partnership for Sustainable Development (SATREPS), Japan Science and Technology Agency (JST)/Japan International Cooperation Agency (JICA) (Grant No. JPMJSA1608).

Institutional Review Board Statement

Not Applicable.

Informed Consent Statement

Not applicable.

Data Availability Statement

Data sharing not applicable.

Acknowledgments

The authors would like to express their gratitude to Marie-Paule Razafimanantsoa and laboratory staff members of Laboratoire des Radio-Isotopes, Université d’Antananarivo, for their support in conducting the oxalate-extractable P analysis. We are grateful to the editor and anonymous reviewers.

Conflicts of Interest

The authors declare no conflict of interest.

References

  1. Koné, B.; Amadji, G.L.; Aliou, S.; Diatta, S.; Akakpo, C. Nutrient constraint and yield potential of rice on upland soil in the south of the Dahoumey gap of West Africa. Arch. Agron. Soil Sci. 2011, 57, 763–774. [Google Scholar] [CrossRef]
  2. Andriamananjara, A.; Rakotoson, T.; Razafimbelo, T.; Rabeharisoa, L.; Razafimanantsoa, M.P.; Masse, D. Farmyard manure improves phosphorus use efficiency in weathered P deficient soil. Nutr. Cycl. Agroecosyst. 2019, 115, 407–425. [Google Scholar] [CrossRef]
  3. Balemi, T.; Negisho, K. Management of soil phosphorus and plant adaptation mechanisms to phosphorus stress for sustainable crop production: A review. J. Soil Sci. Plant. Nutr. 2012, 12, 547–562. [Google Scholar] [CrossRef] [Green Version]
  4. Turner, B.L.; Engelbrecht, B.M.J. Soil organic phosphorus in lowland tropical rain forests. Biogeochemistry 2011, 103, 297–315. [Google Scholar] [CrossRef]
  5. Nishigaki, T.; Tsujimoto, Y.; Rinasoa, S.; Rakotoson, T.; Andriamananjara, A.; Razafimbelo, T. Phosphorus uptake of rice plants is affected by phosphorus forms and physicochemical properties of tropical weathered soils. Plant. Soil 2019, 435, 27–38. [Google Scholar] [CrossRef] [Green Version]
  6. Guo, F.; Yost, R.S. Quantifying the available soil phosphorus pool with the acid ammonium oxalate method. Soil Sci. Soc. Am. J. 1999, 63, 651–656. [Google Scholar] [CrossRef]
  7. Ben-Dor, E. Quantitative remote sensing of soil properties. In Advances in Agronomy; Academic Press: Cambridge, MA, USA, 2002; Volume 75, pp. 173–243. ISBN 9780120007936. [Google Scholar]
  8. Ben-Dor, E.; Banin, A. Visible and near-infrared (0.4–1.1 μm) analysis of arid and semiarid soils. Remote Sens. Environ. 1994, 274, 261–274. [Google Scholar] [CrossRef]
  9. Viscarra Rossel, R.A.; Walvoort, D.J.J.; McBratney, A.B.; Janik, L.J.; Skjemstad, J.O. Visible, near infrared, mid infrared or combined diffuse reflectance spectroscopy for simultaneous assessment of various soil properties. Geoderma 2006, 131, 59–75. [Google Scholar] [CrossRef]
  10. Nocita, M.; Stevens, A.; van Wesemael, B.; Brown, D.J.; Shepherd, K.D.; Towett, E.; Vargas, R.; Montanarella, L. Soil spectroscopy: An opportunity to be seized. Glob. Chang. Biol. 2015, 21, 10–11. [Google Scholar] [CrossRef] [PubMed] [Green Version]
  11. Romero, D.J.; Ben-Dor, E.; Demattê, J.A.M.; Souza, A.B.E.; Vicente, L.E.; Tavares, T.R.; Martello, M.; Strabeli, T.F.; da Silva Barros, P.P.; Fiorio, P.R.; et al. Internal soil standard method for the Brazilian soil spectral library: Performance and proximate analysis. Geoderma 2018, 312, 95–103. [Google Scholar] [CrossRef]
  12. Li, S.; Ji, W.; Chen, S.; Peng, J.; Zhou, Y.; Shi, Z. Potential of VIS-NIR-SWIR spectroscopy from the Chinese Soil Spectral Library for assessment of nitrogen fertilization rates in the paddy-rice region, China. Remote Sens. 2015, 7, 7029–7043. [Google Scholar] [CrossRef] [Green Version]
  13. Johnson, J.-M.; Vandamme, E.; Senthilkumar, K.; Sila, A.; Shepherd, K.D.; Saito, K. Near-infrared, mid-infrared or combined diffuse reflectance spectroscopy for assessing soil fertility in rice fields in sub-Saharan Africa. Geoderma 2019, 354, 113840. [Google Scholar] [CrossRef]
  14. Stevens, A.; Nocita, M.; Tóth, G.; Montanarella, L.; van Wesemael, B. Prediction of Soil Organic Carbon at the European Scale by Visible and Near InfraRed Reflectance Spectroscopy. PLoS ONE 2013, 8, e66409. [Google Scholar] [CrossRef]
  15. Viscarra Rossel, R.A.; Behrens, T.; Ben-Dor, E.; Brown, D.J.; Demattê, J.A.M.; Shepherd, K.D.; Shi, Z.; Stenberg, B.; Stevens, A.; Adamchuk, V.; et al. A global spectral library to characterize the world’s soil. Earth Sci. Rev. 2016, 155, 198–230. [Google Scholar] [CrossRef] [Green Version]
  16. Wold, S.; Sjöström, M.; Eriksson, L. PLS-regression: A basic tool of chemometrics. Chemom. Intell. Lab. Syst. 2001, 58, 109–130. [Google Scholar] [CrossRef]
  17. Conforti, M.; Buttafuoco, G.; Leone, A.P.; Aucelli, P.P.C.; Robustelli, G.; Scarciglia, F. Studying the relationship between water-induced soil erosion and soil organic matter using Vis-NIR spectroscopy and geomorphological analysis: A case study in southern Italy. Catena 2013, 110, 44–58. [Google Scholar] [CrossRef]
  18. Conforti, M.; Castrignanò, A.; Robustelli, G.; Scarciglia, F.; Stelluti, M.; Buttafuoco, G. Laboratory-based Vis–NIR spectroscopy and partial least square regression with spatially correlated errors for predicting spatial variation of soil organic matter content. Catena 2015, 124, 60–67. [Google Scholar] [CrossRef]
  19. Yang, H.; Kuang, B.; Mouazen, A.M. Quantitative analysis of soil nitrogen and carbon at a farm scale using visible and near infrared spectroscopy coupled with wavelength reduction. Eur. J. Soil Sci. 2012, 63, 410–420. [Google Scholar] [CrossRef]
  20. Vohland, M.; Ludwig, M.; Thiele-Bruhn, S.; Ludwig, B. Determination of soil properties with visible to near- and mid-infrared spectroscopy: Effects of spectral variable selection. Geoderma 2014, 223, 88–96. [Google Scholar] [CrossRef]
  21. Kawamura, K.; Tsujimoto, Y.; Rabenarivo, M.; Asai, H.; Andriamananjara, A.; Rakotoson, T. Vis-NIR spectroscopy and PLS regression with waveband selection for estimating the total C and N of paddy soils in Madagascar. Remote Sens. 2017, 9, 1081. [Google Scholar] [CrossRef] [Green Version]
  22. Kawamura, K.; Nishigaki, T.; Tsujimoto, Y.; Andriamananjara, A.; Rabenaribo, M.; Asai, H.; Rakotoson, T.; Razafimbelo, T. Exploring relevant wavelength regions for estimating soil total carbon contents of rice fields in Madagascar from Vis-NIR spectra with sequential application of backward interval PLS. Plant. Prod. Sci. 2021, 24, 1–14. [Google Scholar] [CrossRef]
  23. Kawamura, K.; Tsujimoto, Y.; Nishigaki, T.; Andriamananjara, A.; Rabenarivo, M.; Asai, H.; Rakotoson, T.; Razafimbelo, T. Laboratory visible and near-infrared spectroscopy with genetic algorithm-based partial least squares regression for assessing the soil phosphorus content of upland and lowland rice fields in Madagascar. Remote Sens. 2019, 11, 506. [Google Scholar] [CrossRef] [Green Version]
  24. Araújo, S.R.; Wetterlind, J.; Demattê, J.A.M.; Stenberg, B. Improving the prediction performance of a large tropical vis-NIR spectroscopic soil library from Brazil by clustering into smaller subsets or use of data mining calibration techniques. Eur. J. Soil Sci. 2014, 65, 718–729. [Google Scholar] [CrossRef]
  25. Kuang, B.; Tekin, Y.; Mouazen, A.M. Comparison between artificial neural network and partial least squares for on-line visible and near infrared spectroscopy measurement of soil organic carbon, pH and clay content. Soil Tillage Res. 2015, 146, 243–252. [Google Scholar] [CrossRef]
  26. Morellos, A.; Pantazi, X.E.; Moshou, D.; Alexandridis, T.; Whetton, R.; Tziotzios, G.; Wiebensohn, J.; Bill, R.; Mouazen, A.M. Machine learning based prediction of soil total nitrogen, organic carbon and moisture content by using VIS-NIR spectroscopy. Biosyst. Eng. 2016, 152, 104–116. [Google Scholar] [CrossRef] [Green Version]
  27. Cipullo, S.; Nawar, S.; Mouazen, A.M.; Campo-Moreno, P.; Coulon, F. Predicting bioavailability change of complex chemical mixtures in contaminated soils using visible and near-infrared spectroscopy and random forest regression. Sci. Rep. 2019, 9, 4492. [Google Scholar] [CrossRef] [PubMed]
  28. De Santana, F.B.; de Souza, A.M.; Poppi, R.J. Visible and near infrared spectroscopy coupled to random forest to quantify some soil quality parameters. Spectrochim. Acta Part A Mol. Biomol. Spectrosc. 2018, 191, 454–462. [Google Scholar] [CrossRef] [PubMed]
  29. Douglas, R.K.; Nawar, S.; Alamar, M.C.; Mouazen, A.M.; Coulon, F. Rapid prediction of total petroleum hydrocarbons concentration in contaminated soil using vis-NIR spectroscopy and regression techniques. Sci. Total Environ. 2018, 616–617, 147–155. [Google Scholar] [CrossRef] [PubMed] [Green Version]
  30. Lecun, Y.; Bengio, Y.; Hinton, G. Deep learning. Nature 2015, 521, 436–444. [Google Scholar] [CrossRef]
  31. Ng, W.; Minasny, B.; Montazerolghaem, M.; Padarian, J.; Ferguson, R.; Bailey, S.; McBratney, A.B. Convolutional neural network for simultaneous prediction of several soil properties using visible/near-infrared, mid-infrared, and their combined spectra. Geoderma 2019, 352, 251–267. [Google Scholar] [CrossRef]
  32. Padarian, J.; Minasny, B.; McBratney, A.B. Using deep learning to predict soil properties from regional spectral data. Geoderma Reg. 2019, 16, e00198. [Google Scholar] [CrossRef]
  33. LeCun, Y.; Bottou, L.; Bengio, Y.; Haffner, P. Gradient-based learning applied to document recognition. Proc. IEEE 1998, 86, 2278–2323. [Google Scholar] [CrossRef] [Green Version]
  34. Hsieh, T.-H.; Kiang, J.-F. Comparison of CNN Algorithms on Hyperspectral Image Classification in Agricultural Lands. Sensors 2020, 20, 1734. [Google Scholar] [CrossRef] [PubMed] [Green Version]
  35. Sa, I.; Popović, M.; Khanna, R.; Chen, Z.; Lottes, P.; Liebisch, F.; Nieto, J.; Stachniss, C.; Walter, A.; Siegwart, R. WeedMap: A large-scale semantic weed mapping framework using aerial multispectral imaging and deep neural network for precision farming. Remote Sens. 2018, 10, 1423. [Google Scholar] [CrossRef] [Green Version]
  36. Nevavuori, P.; Narra, N.; Lipping, T. Crop yield prediction with deep convolutional neural networks. Comput. Electron. Agric. 2019, 163, 104859. [Google Scholar] [CrossRef]
  37. Padarian, J.; Minasny, B.; McBratney, A.B. Transfer learning to localise a continental soil vis-NIR calibration model. Geoderma 2019, 340, 279–288. [Google Scholar] [CrossRef]
  38. Tsakiridis, N.L.; Keramaris, K.D.; Theocharis, J.B.; Zalidis, G.C. Simultaneous prediction of soil properties from VNIR-SWIR spectra using a localized multi-channel 1-D convolutional neural network. Geoderma 2020, 367, 114208. [Google Scholar] [CrossRef]
  39. MacDonald, G.K.; Bennett, E.M.; Potter, P.A.; Ramankutty, N. Agronomic phosphorus imbalances across the world’s croplands. Proc. Natl. Acad. Sci. USA 2011, 108, 3086–3091. [Google Scholar] [CrossRef] [PubMed] [Green Version]
  40. Stenberg, B.; Viscarra Rossel, R.A.; Mouazen, A.M.; Wetterlind, J. Visible and Near Infrared Spectroscopy in Soil Science. In Advances in Agronomy; Academic Press: Cambridge, MA, USA, 2010; Volume 107, pp. 163–215. [Google Scholar]
  41. Rabeharisoa, L.; Razanakoto, O.R.; Razafimanantsoa, M.-P.; Rakotoson, T.; Amery, F.; Smolders, E. Larger bioavailability of soil phosphorus for irrigated rice compared with rainfed rice in Madagascar: Results from a soil and plant survey. Soil Use Manag. 2012, 28, 448–456. [Google Scholar] [CrossRef]
  42. Rakotonindrina, H.; Kawamura, K.; Tsujimoto, Y.; Nishigaki, T.; Razakamanarivo, H.; Andrianary, B.H.; Andriamananjara, A. Prediction of soil oxalate phosphorus using visible and near-infrared spectroscopy in natural and cultivated system soils of madagascar. Agriculture 2020, 10, 177. [Google Scholar] [CrossRef]
  43. Andriamaniraka, H. Le Phosphore et la Fertilisation Phosphatée Dans les sols Ferrallitiques à Madagascar: Amélioration de la Fertilité des Sols; Université d’Antananarivo: Antananarivo, Madagascar, 2016. [Google Scholar]
  44. Nishigaki, T.; Ikazaki, K.; Tsujimoto, Y.; Andriamananjara, A.; Rakotoson, T.; Razafimbelo, T. Soil survey of the east coast and the central highlands indicates need to update Madagascar soil map. Soil Sci. Plant. Nutr. 2020, 66, 469–480. [Google Scholar] [CrossRef]
  45. Schwertmann, U. Differenzierung der Eisenoxide des Bodens durch Extraktion mit Ammoniumoxalat-Lösung. Zeitschrift für Pflanzenernährung Düngung Bodenkd. 1964, 105, 194–202. [Google Scholar] [CrossRef]
  46. Van Veldhoven, P.P.; Mannaerts, G.P. Inorganic and organic phosphate measurements in the nanomolar range. Anal. Biochem. 1987, 161, 45–48. [Google Scholar] [CrossRef]
  47. Inoue, Y.; Miah, G.; Sakaiya, E.; Kaneko, K.; Kawamura, K. NDSI map and IPLS using hyperspectral data for assessment of plant and ecosystem variables: With a case study on remote sensing of grain protein content, chloro. J. Remote Sens. Soc. Jpn. 2008, 28, 317–330. [Google Scholar]
  48. Savitzky, A.; Golay, M.J.E. Smoothing and Differentiation of Data by Simplified Least Squares Procedures. Anal. Chem. 1964, 36, 1627–1639. [Google Scholar] [CrossRef]
  49. Brunet, D.; Barthès, B.G.; Chotte, J.-L.; Feller, C. Determination of carbon and nitrogen contents in Alfisols, Oxisols and Ultisols from Africa and Brazil using NIRS analysis: Effects of sample grinding and set heterogeneity. Geoderma 2007, 139, 106–117. [Google Scholar] [CrossRef]
  50. Breiman, L. Random Forests. Mach. Learn. 2001, 45, 5–32. [Google Scholar] [CrossRef] [Green Version]
  51. Cutler, D.R.; Edwards, T.C.; Beard, K.H.; Cutler, A.; Hess, K.T.; Gibson, J.; Lawler, J.J. Random forests for classification in ecology. Ecology 2007, 88, 2783–2792. [Google Scholar] [CrossRef] [PubMed]
  52. Malek, S.; Melgani, F.; Bazi, Y. One-dimensional convolutional neural networks for spectroscopic signal regression. J. Chemom. 2018, 32, e2977. [Google Scholar] [CrossRef]
  53. Krizhevsky, A.; Sutskever, I.; Hinton, G.E. ImageNet classification with deep convolutional neural networks. Adv. Neural Inf. Process. Syst. 2012, 2, 1097–1105. [Google Scholar] [CrossRef]
  54. Sánchez-Esteva, S.; Knadel, M.; Kucheryavskiy, S.; de Jonge, L.W.; Rubæk, G.H.; Hermansen, C.; Heckrath, G. Combining Laser-Induced Breakdown Spectroscopy (LIBS) and Visible Near-Infrared Spectroscopy (Vis-NIRS) for Soil Phosphorus Determination. Sensors 2020, 20, 5419. [Google Scholar] [CrossRef]
  55. R Core Team. R: A Language and Environment for Statistical Computing; The R Foundation: Vienna, Austria, 2020. [Google Scholar]
  56. Mevik, B.-H.; Wehrens, R.; Liland, K.H. pls: Partial Least Squares and Principal Component Regression. J. Stat. Soft. 2019, 18. [Google Scholar] [CrossRef] [Green Version]
  57. Liaw, A.; Wiener, M. Classification and Regression by randomForest. R News 2002, 2, 18–22. [Google Scholar]
  58. Van Rossum, G.; Drake, F.L. Python 3 Reference Manual; ACM: Scotts Valley, CA, USA, 2009; ISBN 1441412697. [Google Scholar]
  59. Chollet, F. Keras 2015. Available online: https://github.com/keras-team/keras (accessed on 5 March 2021).
  60. Abadi, M.; Agarwal, A.; Barham, P.; Brevdo, E.; Chen, Z.; Citro, C.; Corrado, G.S.; Davis, A.; Dean, J.; Devin, M.; et al. TensorFlow: Large-Scale Machine Learning on Heterogeneous Distributed Systems. arXiv 2016, arXiv:1603.04467. [Google Scholar]
  61. Bellon-Maurel, V.; Fernandez-Ahumada, E.; Palagos, B.; Roger, J.M.; McBratney, A. Critical review of chemometric indicators commonly used for assessing the quality of the prediction of soil attributes by NIR spectroscopy. TrAC Trends Anal. Chem. 2010, 29, 1073–1081. [Google Scholar] [CrossRef]
  62. Nawar, S.; Mouazen, A.M. Predictive performance of mobile vis-near infrared spectroscopy for key soil properties at different geographical scales by using spiking and data mining techniques. Catena 2017, 151, 118–129. [Google Scholar] [CrossRef] [Green Version]
  63. Ng, W.; Minasny, B.; de Mendes, W.S.; Demattê, J.A.M. Estimation of effective calibration sample size using visible near infrared spectroscopy: Deep learning vs machine learning. SOIL Discuss. 2019, 1–21. [Google Scholar] [CrossRef] [Green Version]
  64. Ben-Dor, E.; Inbar, Y.; Chen, Y. The reflectance spectra of organic matter in the visible near-infrared and short wave infrared region (400–2500 nm) during a controlled decomposition process. Remote Sens. Environ. 1997, 61, 1–15. [Google Scholar] [CrossRef]
  65. Bogrekci, I.; Lee, W.S. Spectral soil signatures and sensing phosphorus. Biosyst. Eng. 2005, 92, 527–533. [Google Scholar] [CrossRef]
  66. Mouazen, A.M.; Kuang, B. On-line visible and near infrared spectroscopy for in-field phosphorous management. Soil Tillage Res. 2016, 155, 471–477. [Google Scholar] [CrossRef]
  67. Maleki, M.R.; van Holm, L.; Ramon, H.; Merckx, R.; de Baerdemaeker, J.; Mouazen, A.M. Phosphorus Sensing for Fresh Soils using Visible and Near Infrared Spectroscopy. Biosyst. Eng. 2006, 95, 425–436. [Google Scholar] [CrossRef]
  68. Pätzold, S.; Leenen, M.; Frizen, P.; Heggemann, T.; Wagner, P.; Rodionov, A. Predicting plant available phosphorus using infrared spectroscopy with consideration for future mobile sensing applications in precision farming. Precis. Agric. 2019, 21, 737–761. [Google Scholar] [CrossRef] [Green Version]
  69. Sherman, D.M.; Waite, T.D. Electronic spectra of Fe3+ oxides and oxide hydroxides in the near IR to near UV. Am. Mineral. 1985, 70, 1262–1269. [Google Scholar]
  70. Scheinost, A.C.; Chavernas, A.; Barrón, V.; Torrent, J. Use and limitations of second-derivative diffuse reflectance spectroscopy in the visible to near-infrared range to identify and quantify Fe oxide minerals in soils. Clays Clay Miner. 1998, 46, 528–536. [Google Scholar] [CrossRef]
  71. Viscarra Rossel, R.A.; Fouad, Y.; Walter, C. Using a digital camera to measure soil organic carbon and iron contents. Biosyst. Eng. 2008, 100, 149–159. [Google Scholar] [CrossRef]
  72. Daniel, K.W.; Tripathi, N.K.; Honda, K. Artificial neural network analysis of laboratory and in situ spectra for the estimation of macronutrients in soils of Lop Buri (Thailand). Aust. J. Soil Res. 2003, 41, 47–59. [Google Scholar] [CrossRef]
  73. Ramaroson, V.H.; Becquer, T.; Sá, S.O.; Razafimahatratra, H.; Delarivière, J.L.; Blavet, D.; Vendrame, P.R.S.; Rabeharisoa, L.; Rakotondrazafy, A.F.M. Mineralogical analysis of ferralitic soils in Madagascar using NIR spectroscopy. Catena 2018, 168, 102–109. [Google Scholar] [CrossRef]
  74. Li, R.; Yin, B.; Cong, Y.; Du, Z. Simultaneous prediction of soil properties using multi_cnn model. Sensors 2020, 20, 6271. [Google Scholar] [CrossRef]
Figure 1. Studied regions and soil sampling points. Sources of background image: Esri, DigitalGlobe, GeoEye, Earthstar Geographics, CNES/Airbus DS, USDA, AeroGRID, IGN, and the GIS User Community.
Remotesensing 13 01519 g001
Figure 2. One-dimensional neural convolutional network architecture (revised from the Figure 1 in Ng et al. [31]).
Remotesensing 13 01519 g002
Figure 3. Box-and-whiskers plot (a) and histogram (b) of soil oxalate-extractable P in the training and test datasets.
Remotesensing 13 01519 g003
Figure 4. Relationships between observed and predicted values of soil oxalate-extractable P contents with (a) partial least squares (PLS), (b) random forest (RF), and (c) one-dimensional convolutional neural network (1D-CNN) models. RMSE, root mean squared error; RPIQ, ratio of performance to the interquartile range
Remotesensing 13 01519 g004
Figure 5. (a) First derivative absorbance (FDA) spectra on log10 scale of soil oxalate-extractable P (Pox) content and importance of wavelength to (b) partial least squares (PLS), (c) random forest (RF), and (d) one dimensional convolutional neural network (1D-CNN) models in soil Pox estimation.
Remotesensing 13 01519 g005
Table 1. Architecture of one-dimensional convolutional neural network (CNN).
TypeFilter SizeNo. of FiltersActivation
Convolutional2032ReLU
Max-pooling2--
Convolutional2064ReLU
Max-pooling5--
Convolutional20128ReLU
Max-pooling5--
Convolutional20256ReLU
Max-pooling5--
Dropout (0.4)---
Flatten---
Fully-connected-100ReLU
Dropout (0.2)---
Fully-connected-1Linear
ReLU, rectified linear unit.
Table 2. Summary statistics of soil oxalate-extractable P data.
DatasetSystemnMinMaxMedianMeanSD
TrainingAll23821.91172.067.7214.7278.0
Cultivated18323.71172.0106.0268.7296.5
Natural5521.953.934.835.17.2
TestAll8022.31225.268.5220.9290.0
Cultivated6222.31225.2106.2274.8309.6
Natural1822.957.933.835.59.5
n, number of samples; SD, standard deviation
Table 3. Mean values of R2, RMSE, bias, and relative improvement (%RMSE) from 5-fold cross validation in the training dataset for developing the partial least squares (PLS), random forest (RF), and one dimensional convolutional neural network (1D-CNN) models.
ModelR2RMSEBias%RMSE 1
PLS0.827114.85416.577-
RF0.842108.82013.5175.254
1D-CNN0.98935.636-2.20268.973
1 Relative improvement (%RMSE) of the RF and CNN models in comparison to PLS model. RMSE, root mean squared error.
Table 4. Comparison of predictive abilities in the partial least squares (PLS), random forest (RF), and one dimensional convolutional neural network (1D-CNN) models.
ModelR2RMSEBiasRPIQ%RMSE 1
PLS0.792132.69415.6061.900-
RF0.808126.89411.8841.9864.371
1D-CNN0.878101.154−4.0352.49223.769
1 Relative improvement (%RMSE) of the RF and CNN models in comparison to PLS model. RMSE, root mean squared error; RPIQ, ratio of performance to the interquartile range.
Publisher’s Note: MDPI stays neutral with regard to jurisdictional claims in published maps and institutional affiliations.

