1. Introduction
Deterioration of water quality in rivers, lakes, and estuaries due to natural disasters such as landslides, floods, and pollution of various types and degrees, is a topic of interest to the public [
1]. Human interventions, such as land modifications and dumping of construction waste, alter the ecological conditions of an aquatic environment. In many low and middle-income countries, the scenic beauty of waterfronts has led to violation of rules and regulations when constructing water-front properties, designed for high-density human occupation. Such encroachments on the banks of water bodies and subsequent human activities often threaten the rich aquatic biodiversity in the vicinity of the construction sites, with the potential for the effect to spread to broader areas depending on the circulation patterns of the water bodies and the levels of pollutants introduced [
2]. In general, as we try to assess the impact of human activities on water quality and plan remedial and mitigation measures in the context of Sustainable Development Goals pertaining to water, it is essential to have simple, cost-effective methods for monitoring water quality, which can be achieved by the non-specialist. In this paper we present such an approach applied to a specific case from southwestern India.
In Kerala, a small state along the southwest coast of India, nearly 1800 such structures were identified as violating coastal regulation zone norms [
3], out of which, four were asked to be demolished by the apex court of the country. Although demolition of high-rise buildings is done in a controlled way [
4], introduction of waste into the surrounding water bodies is inevitable and may impact aquatic organisms and humans living in the vicinity. The dust generated during the demolition process can be deposited into adjoining water bodies and deteriorate water quality [
5]. The time lag from demolition to when the water becomes safe for consumption is often unknown and is a huge concern of people living on the banks of water bodies.
Turbidity, colour, and odour are considered to be primary properties that determine whether the water is fit for bathing or drinking [
6]. Although the standards vary with the socio-economic status of the population, more than 90% of people perceive a water body with Secchi depth of 1.5 m or greater as good for bathing [
7]. Equipping the public with simple and user-friendly tools to monitor the turbidity and colour of water could bring a significant change in their understanding of water quality and influence their decision making. Secchi disks and Forel-Ule colour scales have been used conventionally as tools to measure the clarity and colour of water respectively [
8,
9]. As part of a joint Indo–UK project ‘REVIVAL’, a 3D printed Mini Secchi disk (3DMSD) with a Forel-Ule (FU) colour scale for monitoring water clarity and colour in shallow water systems was designed and fabricated [
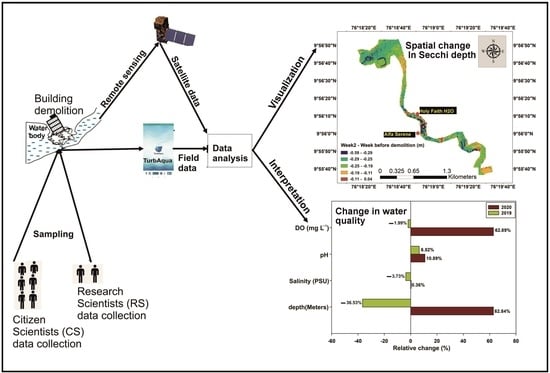
10]. To help involve citizen scientists in monitoring lake water quality, we developed a mobile application named ‘TurbAqua’ which can transfer photos taken using a phone camera, the GPS locations of the measurements, and 3DMSD data (Secchi depth as well as colour code) to a central database. Here, we tested the utility of the tool for monitoring the water quality of a lake polluted by demolition waste.
As the demolition and the subsequent pollution of the lake were of public concern, the clarity and colour of water in the Vembanad Lake in the vicinity of the demolished buildings was monitored using the 3DMSD [
10] with help from local people volunteering in the programme, for four weeks after the court-mandated demolitions. We hypothesized that many basic water-quality indicators of Vembanad Lake would be immediately affected by the demolition process and that the circulation dynamics of the estuary would help in restoring normalcy with time. This hypothesis was tested by assessing the percentage relative change in water quality between the weekly data sets collected for four weeks after demolition and comparing the post-demolition results with the situation at the same time the previous year. The results were compared with the turbidity values obtained from satellite remote sensing for affirmation.
2. Materials and Methods
2.1. Study Area and Sample Collection
Two apartment complexes, twin towers of “Alfa Serene” and “Holy Faith H
2O” were located on the shores of a narrow tributary opening into Vembanad Lake, the largest lake along the southwest coast of India. The northern arm of the lake opens into the Arabian Sea at two places, imparting estuarine features to the lake. The southern arm receiving the bulk of fresh water input from rivers has more features of a lake. Both arms are interconnected and are referred to as the Vembanad Lake [
11,
12]. At seven stations in the vicinity of the two apartment complexes marked for demolition, water quality was monitored for four weeks following the demolitions (
Figure 1). The apartment blocks were 280 m apart from each other. Sampling stations were numbered 1–7 based on the distance from the demolition site. Three buildings were knocked down on 11 January 2020 and the fourth on 12 January 2020, following protocols of controlled implosion using emulsion explosives.
Debris from the first Alfa Serene Tower, weighing ~76,000 tons, was made to fall into the backwaters during the second phase of the blast to protect the nearby buildings from physical and structural damages and other associated causalities. Sampling was not allowed in the lake area for one week after the implosion, as the authorities were taking action to remove rubble and prevent the dust from spreading. We started monitoring the water quality from the second week after the implosion. Daily sampling was conducted during the second week, and the sampling frequency was reduced from daily to once every three days in the subsequent weeks, for a total of four weeks. As the sampling was conducted from the second week after the demolition, weeks were numbered as 2 to 5, to denote the time after demolition.
The environmental data collected from the seven stations were compared with the corresponding data collected during the second to the fourth week of January 2019 and the first week of February 2019, one year prior to the demolition. Data from this period was chosen as a baseline, as there was no sampling directly prior to the demolition.
2.2. Methodolgy
Secchi depth (a measure of water clarity), FU index of water colour, salinity, dissolved oxygen (DO), and pH were measured in situ. A total of 12 samplings in duplicate were done during the four weeks for salinity, pH, Secchi depth, and FU index, and 11 samplings in duplicate for DO. As Secchi depth and FU index were recorded by the citizen scientists, 96 observations were available for the analysis. Salinity was measured using a handheld refractometer (Model Erma with automatic temperature compensation), pH was measured using a portable Elico pH meter, and DO was estimated using the Winkler method [
13]. The 3DMSD was used to measure water clarity and water colour [
10]. A FU colour scale sticker placed on the 3DMSD casing served as a simple tool to measure the colour of water bodies according to a broadly-used common standard that has been in use in the scientific community for over a century. The scale has a palette of 21 different colours ranging from indigo blue (1) through green (10) to cola brown (21). Colour measurements with the FU scale represents the colour of water above the Secchi disk positioned at half the Secchi depth. A photograph of the water body with Secchi disk in this position was also taken. The information collected using the 3DMSD was fed into a mobile app developed for the purpose, namely TurbAqua (
Supplementary Material Document). The application can be accessed from google play store,
https://play.google.com/store/apps/details?id=com.meridian.cmfri.survey&hl=en (accessed on 26 February 2020).
Details of the app are as follows:
Client side: Android App (TurbAqua) which is used to enter collected data on water colour code and Secchi depth, location of measurement, and colour images of the water body being sampled.
Hardware Requirement: mobile or tablet computer installed with Android 2.0 or above, GPS (for automatic detection of location of data collection) and internet connectivity.
Integrated Development Environment (IDE) used: Android Studio 3.5
Programming language used: Kotlin (a cross-platform, statically typed, general-purpose programming language for android application development).
Server Side: Apache HTTP web server to store/process the data submitted by TurbAqua users and generate reports. It is hosted in the data centre provided by Meridian Technologies, India for uninterrupted service (24/7, 365 days).
Database used: MySQL, for the structured storage of data submitted by TurbAqua users.
Server side development: PHP (general-purpose scripting language that is suited for web application development). This is to process the data request from the administrator and generate reports.
Administrative access: from any browser with internet connectivity.
All measurements for the present study were made during high tide. Data collection was done as a citizen science activity, and the measurements made during low tide were discarded. Local inhabitants who volunteered to undertake the measurements were given the 3DMSDs and data collection was supervised by our team [
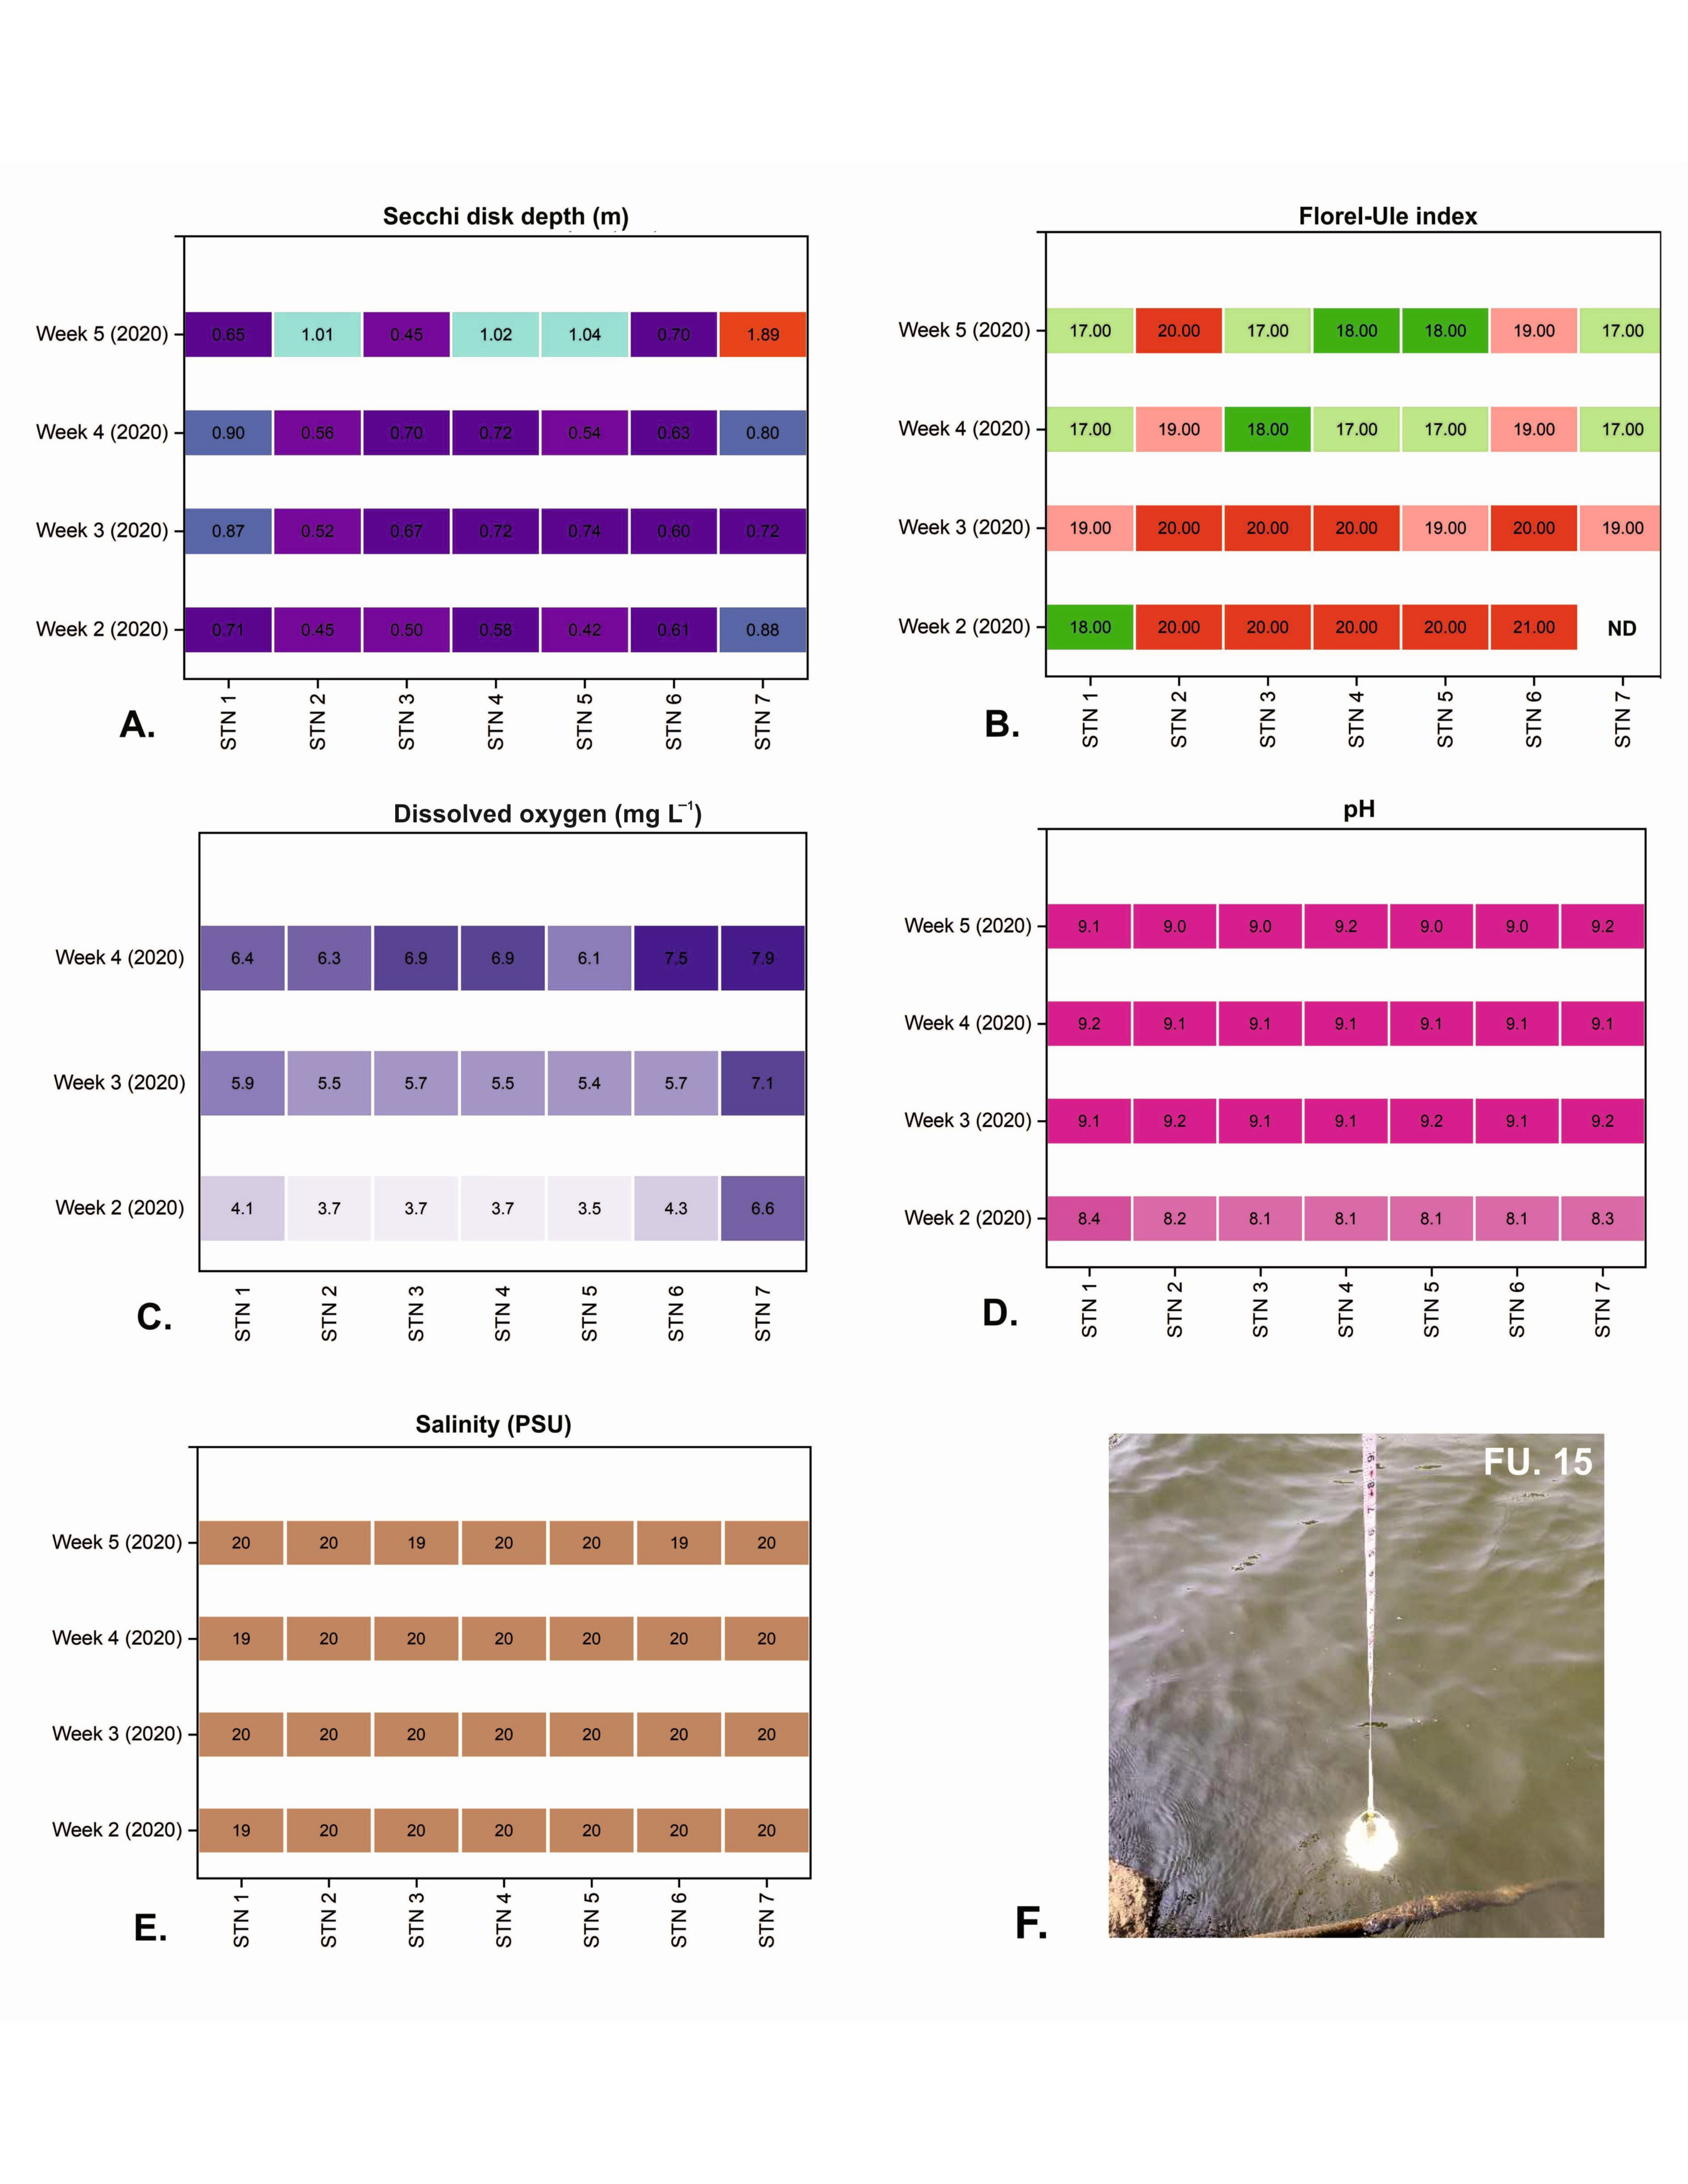
14]. Weekly averaged observations of Secchi depth, water colour, pH, salinity, and dissolved oxygen at the seven stations from week 2 to week 5 after demolition were plotted as split heat maps using the ‘pheatmap’ package [
15] in R. To evaluate the changes in water quality indicators with time after the demolition activities, a paired
t-test was conducted for observations over three to five weeks against observations from the second week, using SPSS v.21. The paired
t-test analysis was done at a 95% level of significance.
Percentage relative change in water quality post-demolition was calculated as:
Similarly, percentage relative change in the water quality during 2019 was calculated for the corresponding weeks as those of the post-demolition surveys, to check if the relative change during the post-demolition sampling period was different from those seen in 2019 over a similar period.
Satellite remote sensing match-ups for water quality of the study area were recorded from Sentinel 2A and 2B Level 1C, Top of Atmosphere products. Data for the 5 weeks after the demolition as well as the data for 1 week before the demolition were taken from the Copernicus Open Access hub in Sentinel SAFE format. All bands in the product were resampled to 10 m and spatially subsetted using the SNAP toolbox. The subsetted products were then processed using the C2RCC processor for thematic water processing to derive the L2 products including atmospherically-corrected water-leaving reflectance. The weekly averaged salinity and temperature values from our in situ observations were used as input into the C2RCC model [
16]. Weekly averaged Secchi depth products for the study area were then developed using the algorithm of Rodrigues et al., 2020 [
17]. This algorithm reportedly has a better validation result with r
2 = 0.86 and NRMSE = 17%, albeit for a different location. Though the match-up data available from the study were too limited for tuning the algorithm to our study area, the algorithm yielded Secchi depth values that were generally consistent with our observations. The algorithm used is as follows:
where, B2, B3, and B4 refer to the atmospherically corrected reflectances at 490, 560, and 665 nm respectively from Sentinel 2 satellite data.
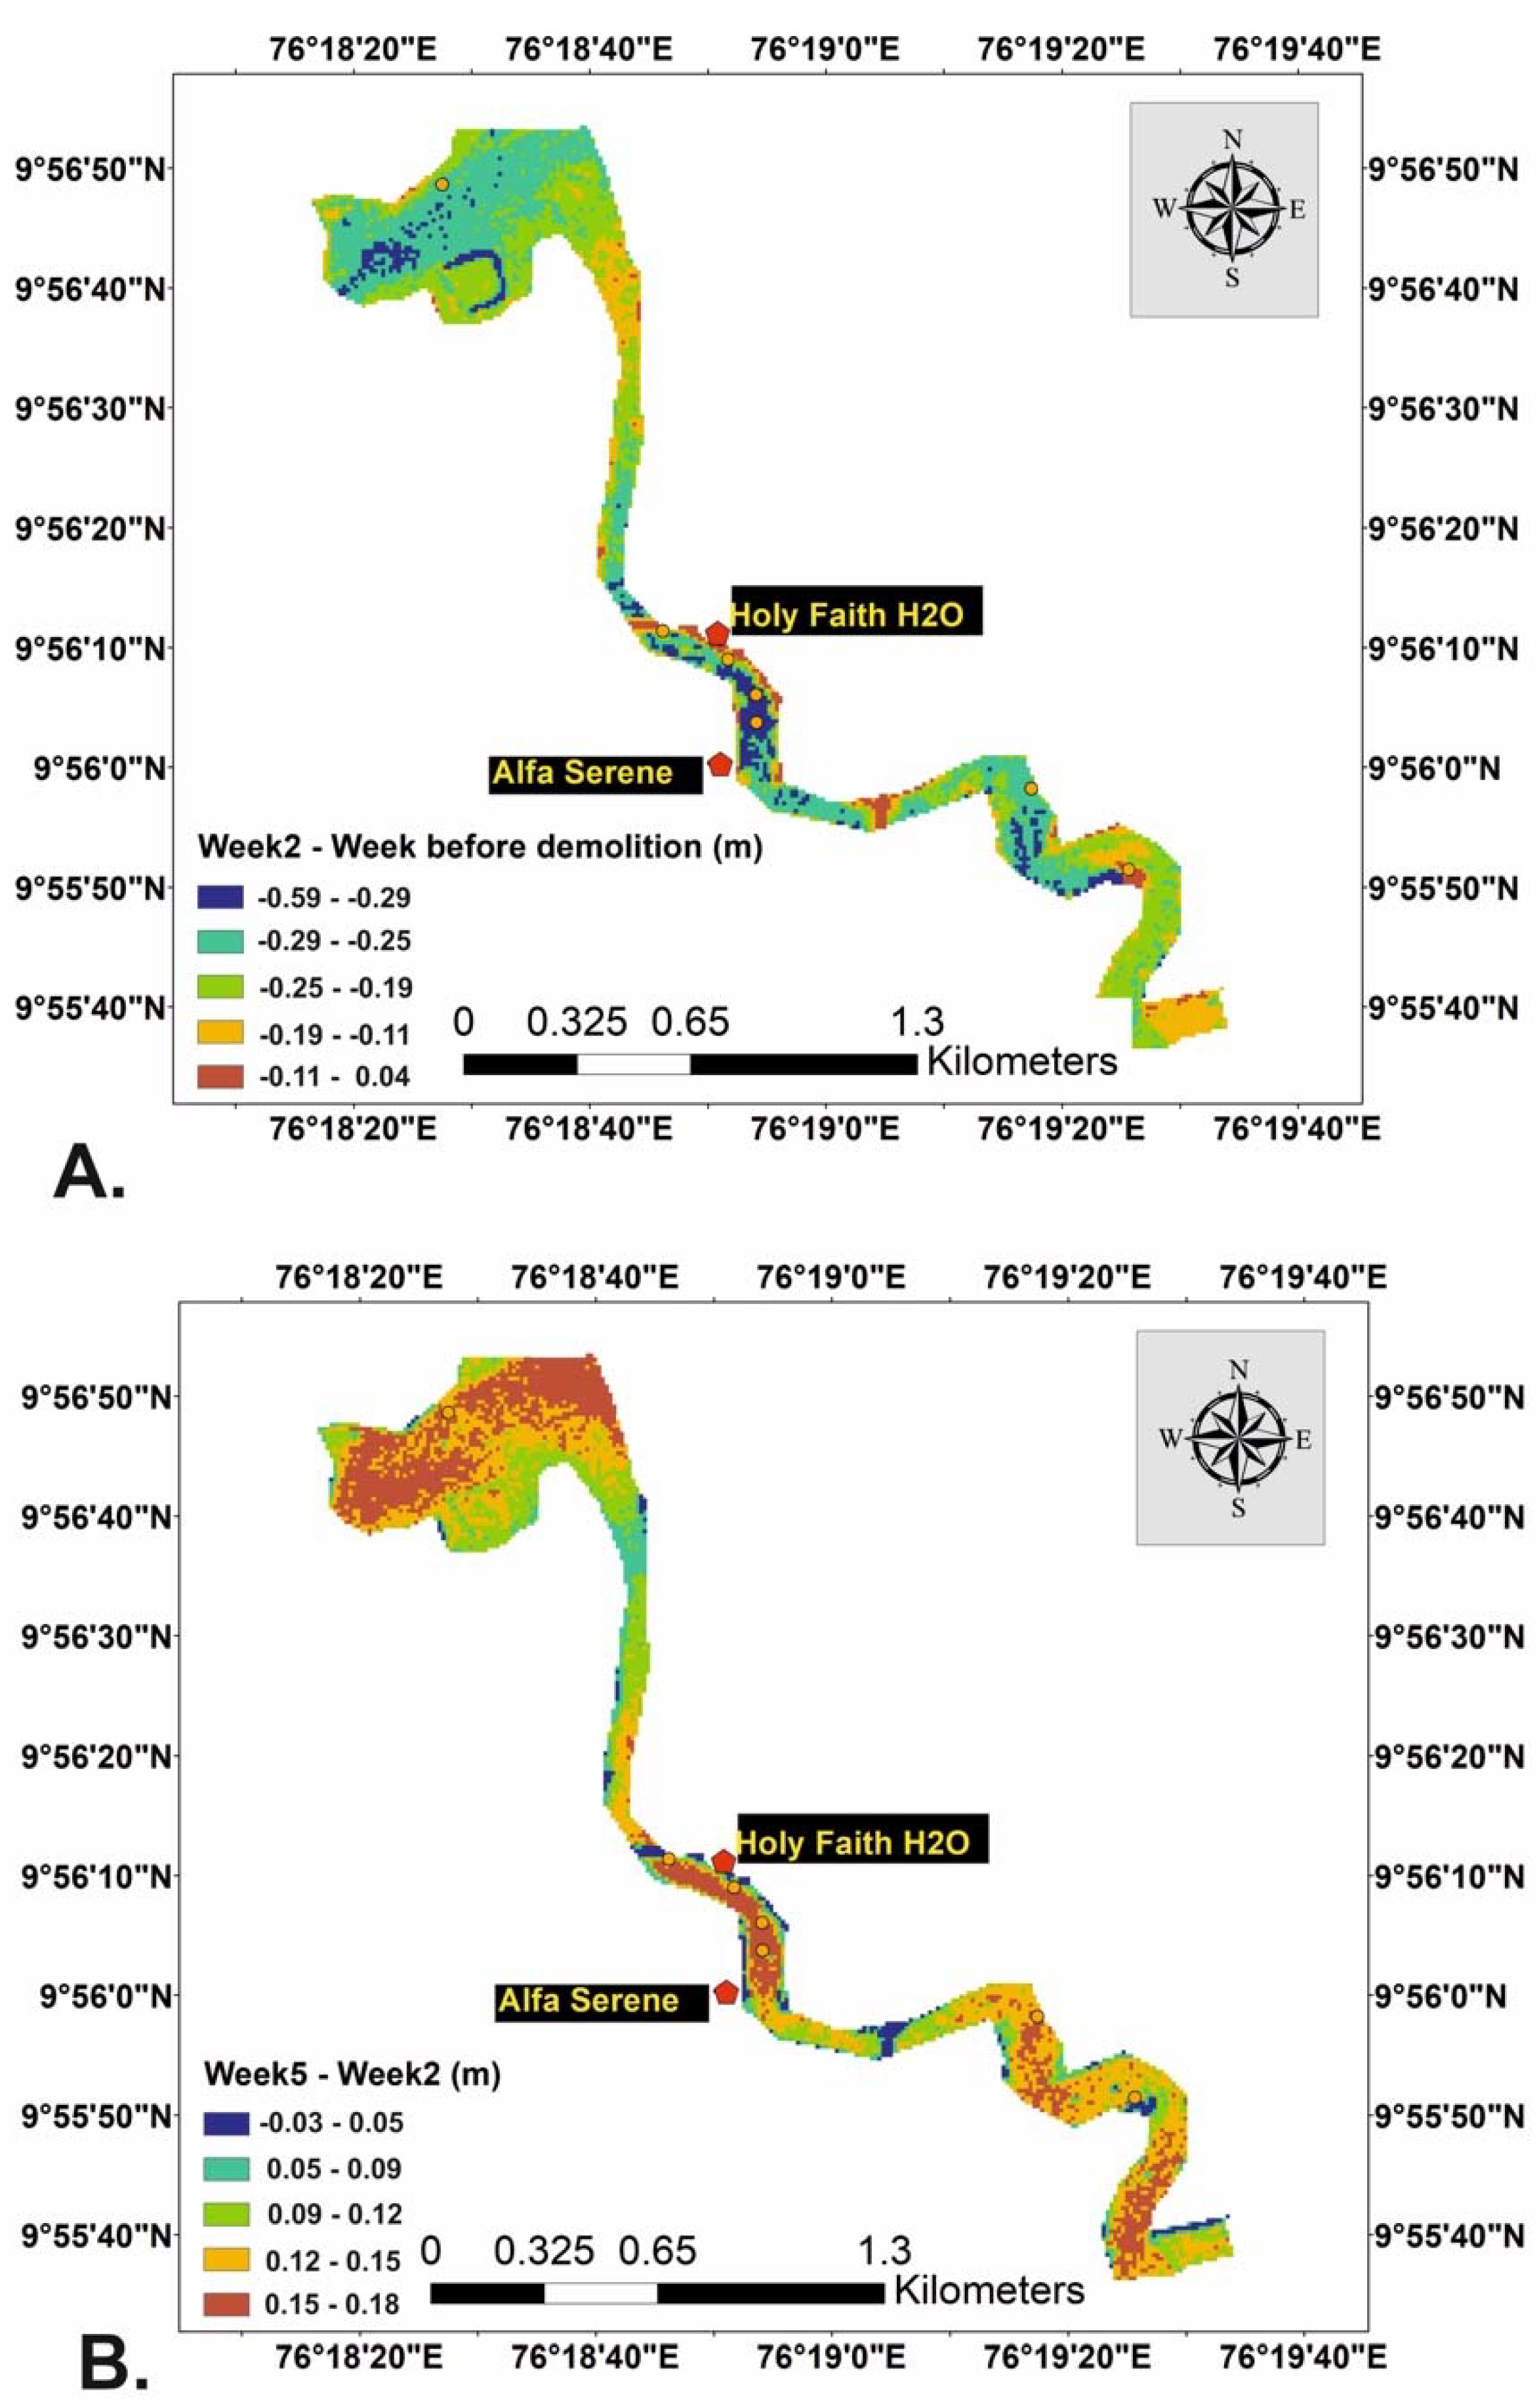
Weekly Secchi depth products were clipped to the study area and further processed to derive the change in the Secchi depth post demolition (week 2) compared with the week before demolition. Similarly, improvement in water quality with time was assessed from change detection of Secchi depth distribution between week 5 and week 2.
3. Results and Discussion
Secchi disk and Forel-Ule colour scale are conventional tools used by the general public for monitoring the clarity and colour of coastal waters and their findings have even been validated with those based on satellite ocean-colour remote sensing [
18]. Secchi depth is inversely proportional to the clarity or transparency of a water column. The Secchi depth within 2 km radius of the demolition sites ranged from 0.42 m at station 5 to 0.88 m at station 7 (farthest from the demolition site) in the second week after demolition (
Figure 2A). The Secchi depth increased progressively with time and reached more than 1 m in stations 2, 4, 5, and 7 within the duration of five weeks after demolition. It is evident from the paired
t-test analysis (
Table 1) that there is significant increase in the Secchi depth during the fourth (M = 0.69 ± 0.13,
p < 0.05) and fifth (M = 0.97 ± 0.47,
p < 0.05) weeks, compared with the second week post-demolition (M = 0.59 ± 0.16,
p < 0.05). The dust created from the demolition, and dirt from eroded soils, can disturb the delicate balance of the aquatic ecosystem, by reducing water clarity, decreasing the penetration of sunlight into the water, and reducing DO (as evidenced from
Figure 2C). Following demolition, visibility was very low in the water, and it took five weeks after demolition for the Secchi depth to increase beyond 1 m (
Figure 2A). By the fifth week, the overall water clarity had increased significantly when compared with the second week of observation (
Table 1).
Water was brown in colour (i.e., FU >18) as observed two weeks after demolition (
Figure 2B). This colour was due to a high load of suspended particles in the water column. Similar colour indices had been previously detected in the Vembanad Lake only in June and were attributed to resuspension of sediment due to high mixing during the southwest monsoon, as well as to the transport of sediment-rich waters into the lake by the numerous rivers that discharge into the lake. With increasing duration after demolition, there was a general decrease in FU colour (17) at most stations, but it did not drop to 15 or below, i.e., green or blue colour indicating clearer waters, during the sampling period [
16].
Supporting the quality of our citizen observations, we observed a strong inverse relationship between the FU colour and Secchi depth (
Figure 3). This is consistent with the finding of Garaba et al. (2015) [
19] that the apparent colour darkens as water becomes muddier and turbidity increases with increasing suspended particulate and dissolved material (higher FU colour codes—brownish waters). A correlation test (
Figure 3) helped in proving the utility of an inexpensive and simple technique and easy recording of readings in water quality assessment.
Though the satellite observations yielded Secchi disk observations that were generally in the same range as the in situ observations, there was a systematic over-estimation of Secchi depth compared with the in situ observations when weekly averages were compared. This difference could have been for a number of reasons, including the use of weekly averages for the comparison, and the differences in the scales of observation, apart from the use of an algorithm that had been established for Portuguese waters. We therefore focused on relative changes observed in the satellite data. The comparison of the Secchi depth distribution during week 2 after demolition with that from the week before demolition exhibited significant reduction in Secchi depth by about 0.59 m along the demolition sites, owing to the increased turbidity from debris (
Figure 4A). This information, which could not be obtained from in situ sampling, provides further evidence that the water body was exposed to decreased water clarity due to the demolition. Corroborating the in situ observation, an improvement in water quality was evident in the satellite derived data also by the fifth week after demolition, with the Secchi depth at the demolition sites different by as much as 0.18 m compared with that of the second week (
Figure 4B).
In addition to the direct impact on the spectral light availability within the lake, the demolition waste altered DO and pH, potentially impacting aquatic life. The decrease in DO could be an indication of the presence of substances with high oxygen demand, such as suspended materials that were washed in along with the dust from the demolition site. DO measurements were collected to support observations from the 3DMSD. It was found that in all stations except Station 7, DO was low (3.5–4.3 mg L
−1) in the second week after demolition, but it increased progressively and significantly to 6.1–7.5 mg L
−1 in the fourth week (
Figure 2C). The paired
t-test shows that DO recorded during the third (M = 5.79 ± 0.66,
p < 0.05) and fourth weeks (M = 6.92 ± 0.68,
p < 0.05) was significantly higher than that of the second week (M = 4.25 ± 1.18). The high turbidity caused by the demolition waste may impact the sources of DO (e.g., reducing photosynthesis by limiting light), and increase the FU colour codes (indicative of less green algae) [
16,
18]. During the first week after demolition, the fine dust that was accumulated at the demolition site was washed down into the estuary by spraying water over the rubble. This could have increased the suspended matter load in the water, thereby decreasing the DO level. However, DO did not fall below the critical level that could be tolerated by aquatic organisms [
20,
21]. Station 7, which was the farthest from the demolition site, is at a broader point of the lake and close to the deep shipping channel that opens into the Arabian Sea through the bar mouth. Increased circulation and distance from the demolition site could be the reasons why this station was less affected by pollution from demolition waste.
Salinity was found to be consistently high throughout the sampling in 2020 (19–20 psu) (
Figure 2E), reflecting the samplings at high tide. There was no significant change in salinity from week two to week five after demolition (
Table 1), suggesting little influence of other factors (e.g., precipitation or changes in tidal currents) on our findings.
The pH showed a steady increase in all stations from the second to the fifth week after demolition (
Figure 2D). Significant increase in pH was evident during the third (M = 9.11 ± 0.04,
p < 0.05), fourth (M = 9.1 ± 0.05,
p < 0.05), and fifth (M = 9.07 ± 0.09,
p < 0.05) weeks compared with the second week (M = 8.18 ± 0.12). It is known that cement effluents increase the alkalinity and pH of the receiving water [
22]. The chemical composition of cement used for construction is comprised of calcium silicate hydrates, which include oxides of calcium (CaO) and silicon (SiO
2), with lesser amounts of aluminum oxide (Al
2O
3) and iron oxides (Fe
2O
3). These are subsequently polymerized into a densely-cross-linked matrix [
23,
24,
25]. When brought into contact with water, the first hydration product capable of leaching from cement-based material is reported to be calcium hydroxide [
24,
25]. Addition of hydrated lime to water increases the pH of the system [
26], and the rate of leaching increases with the surface area of the concrete in contact with water [
25]. It has been reported that leaching of hydroxyl ions from cement increases with time and that the cumulative leaching rate is found to be higher in flowing water after three days and continues to increase over a further period of time [
27,
28]. This could be the reason for the sustained increase in the pH of the water even five weeks after demolition.
To examine if the changes in the environmental parameters were natural variations, data on the same variables during five weeks of same time period (January–February) in 2019 were subjected to paired
t-test between weeks. However, none of the parameters (salinity, pH, DO, and Secchi depth) showed significant variation with time (
p > 0.05) in the 2019 dataset. Relative variability in the observations in the two years (
Figure 5) shows higher variability in 2020, especially with respect to DO (62.89% in 2020) and Secchi depth (62.84% in 2020). The small difference in the relative change in pH (10.9% in 2020 compared with 6.5% in 2019) may be misleading, as pH is based on a log scale, so even a small change can have enormous physiological ramifications. Such sudden fluctuations in pH of the system can affect the survival of estuarine organisms and hence the relative change is of high significance from the point of view of ecosystem health. SDG 14—life under the water emphasises that quality of water determines the life under water. The results bring to the fore the urgent need to shift to sustainable development pathways for the sustenance of the estuarine ecosystem.
In the present study, the lake water that showed poor quality immediately following demolitions, regained its pre-demolition status within a short duration (five weeks), indicating the capacity of the estuary to self-regulate. Tides, freshwater influx, and circulation are the major factors which help to flush-out lake waters [
29]. However, heavier particles that sink to the bottom can provide leachates into the water column for a longer duration, altering pH, DO, and even salinity of the waters.
Citizen science activities, necessarily, rely on simple tools to overcome gaps in observations. The utility of such observations will depend ultimately on the quality and reliability of the observations. Uncertainties associated with Secchi Disk measurements and Forel-Ule colour index measurements were discussed in detail by Brewin et al. [
10]. Furthermore, we recognise the importance of providing adequate training to the citizen scientists, to ensure data quality. The ways by which errors can be reduced have been presented in the training manual produced as part of the project work, an open-access publication [
28], which was part of the background material provided to the citizen scientists at the training course provided for them. When satellite observations are included, there are additional uncertainties that arise from mismatches between satellite and in situ observations. Because of the limited number of match-up observations available from this study, we could not carry out a detailed comparison of satellite and in situ observations but this does remain a goal for the future.
Our study highlights the merit of involving the public in monitoring water quality using simple devices. By putting the tools in the hands of the citizens, they can believe what they see, and manage their resources appropriately (for example: water for drinking and bathing, and sustainable fisheries, agriculture). Such information generated by the public can be effectively transferred to scientists with the help of mobile applications and thus improve water-quality assessments. Above all, this educates the general public on how such information would be relevant to support SDG 6—clean water and sanitation, and two other related goals SDG 3—good health and wellbeing, and SDG 14—life under water and to assess related targets and indicators. Given the importance of tourism in Kerala in general, and the Vembanad lake in particular, studies such as this are relevant to the SDG 10 (Reduced Inequalities): water quality, ecosystem health, and scenic beauty are all interconnected, and intimately linked to the attractiveness of the area for tourists and for sustaining revenue from tourism in the area.
4. Conclusions
Anthropogenic disturbances such as civil structure demolitions near a lake can deteriorate the local water quality due to debris falling into the water and the leachates from the shattered civil structures. A citizen science network and 3DMSD linked to a mobile application were used for assessing the water-quality in the water near the demolition sites for a period of five weeks after demolition. Being the first case of a court-directed demolition to protect the coastal regulation zone in India, the public were aware of the importance of environmental protection. However, direct observations on the nature of the potential environmental impacts had been lacking hitherto. The short-term and long-term impact of such demolitions on the nearby aquatic systems could be scientifically assessed in this study. Citizen science-based data on FU colour scale and Secchi depth, along with in situ water quality variables such as salinity, temperature, pH, and dissolved oxygen helped to achieve an almost real-time assessment of the water quality pre- and post-demolition in the Lake area.
Availability of satellite remote sensing data for the region and the scientific analysis of the data helped us to evaluate the weekly progression of water-quality. The water quality during the second week of demolition and consecutive weeks up to the fifth week showed a significant increase in pH, dissolved oxygen, and Secchi depth over time, i.e., the impact of demolition waste on the Vembanad Lake water quality was found to be relatively short-lived, with water clarity, colour, and DO returning to levels typical of that period of year within 4–5 weeks. A key question is whether the time scale of recovery of the water quality is sufficiently rapid to avoid lasting damage to the local ecosystem.
We demonstrated here the application of simple, hand-held tools for evaluating the time-dependent impact on water quality resulting from the demolition of high-rise buildings on the banks of a lake, illustrated the advantages of engaging local communities in such evaluations through citizen science, and demonstrated how freely-available satellite data can complement in situ observations. The approach is readily adaptable to other contexts and localities, and could easily become an essential ingredient of maintaining water quality for sustainable regional development.


 ,
, 


