Article

Effect of Reduced Anthropogenic Activities on Water Quality in Lake Vembanad, India

1
Earth Observation Science and Applications, Plymouth Marine Laboratory, Plymouth PL1 3DH, Devon, UK
2
Indian Council of Agricultural Research-Central Marine Fisheries Research Institute, Cochin 682018, Kerala, India
3
Council of Scientific and Industrial Research-National Institute of Oceanography, Regional Centre, Cochin 682015, Kerala, India
4
Nansen Environmental Research Centre, Amenity Centre, Kerala University of Fisheries and Ocean Sciences, Cochin 682506, Kerala, India
5
Regional Remote Sensing Centre-East, Indian Space Research Organisation, Kolkata 700156, West-Bengal, India
6
Centre for Geography and Environmental Science, College of Life and Environmental Sciences, University of Exeter, Penryn TR10 9FE, Cornwall, UK
7
National Centre for Earth Observation, Plymouth Marine Laboratory, Plymouth PL1 3DH, Devon, UK
*
Author to whom correspondence should be addressed.
Submission received: 26 February 2021 / Revised: 12 April 2021 / Accepted: 16 April 2021 / Published: 21 April 2021

Abstract

:
The United Nation’s Sustainable Development Goal Life Below Water (SDG-14) aims to “conserve and sustainably use the oceans, seas, and marine resources for sustainable development”. Within SDG-14, targets 14.1 and 14.2 deal with marine pollution and the adverse impacts of human activities on aquatic systems. Here, we present a remote-sensing-based analysis of short-term changes in the Vembanad-Kol wetland system in the southwest of India. The region has experienced high levels of anthropogenic pressures, including from agriculture, industry, and tourism, leading to adverse ecological and socioeconomic impacts with consequences not only for achieving the targets set out in SDG-14, but also those related to water quality (SDG-6) and health (SDG-3). To move towards the sustainable management of coastal and aquatic ecosystems such as Lake Vembanad, it is important to understand how both natural and anthropogenic processes affect water quality. In 2020, a unique opportunity arose to study water quality in Lake Vembanad during a period when anthropogenic pressures were reduced due to a nationwide lockdown in response to the global pandemic caused by SARS-CoV-2 (25 March–31 May 2020). Using Sentinel-2 and Landsat-8 multi-spectral remote sensing and in situ observations to analyse changes in five different water quality indicators, we show that water quality improved in large areas of Lake Vembanad during the lockdown in 2020, especially in the more central and southern regions, as evidenced by a decrease in total suspended matter, turbidity, and the absorption by coloured dissolved organic matter, all leading to clearer waters as indicated by the Forel-Ule classification of water colour. Further analysis of longer term trends (2013–2020) showed that water quality has been improving over time in the more northern regions of Lake Vembanad independent of the lockdown. The improvement in water quality during the lockdown in April–May 2020 illustrates the importance of addressing anthropogenic activities for the sustainable management of coastal ecosystems and water resources.

Graphical Abstract

1. Introduction

Despite considerable efforts to protect vulnerable marine, coastal, and freshwater ecosystems, anthropogenic activities remain one of the main causes of poor water quality in rivers, lakes, and wetland systems worldwide [1,2,3]. It has been shown that a combination of industrial and urban pollution, overexploitation of natural resources, and climate change has negative impacts on not only marine and freshwater organisms, but also on human populations that are dependent on the aquatic environment for their livelihood [1,3,4]. Here, we show that water quality can improve considerably when anthropogenic activities are reduced at the study site of Lake Vembanad. The Vembanad-Kol wetland system is situated along the southwest coast of India (09°20′–10°25′N, 76°00′–76°35′E) and has been designated as a UNESCO protected wetland region under the Ramsar Convention of 1971 since 2002. Stretching approximately 100 km and covering over 241 km2, Lake Vembanad is the second largest lake in India. This semi-enclosed lake supports an exceptionally large biodiversity and is rich in water birds, fish, and aquatic plants [5,6,7]. Lake Vembanad forms an important resource for local communities and is used for coastal and freshwater aquaculture, capture fisheries, pokkali rice (a unique variety of rice with a high tolerance for saline water) cultivation, and tourism, among other activities [8]. Despite its protected status and its importance to the livelihood of local communities, the Lake Vembanad ecosystem is under pressure from domestic waste and sewage, industrial pollution including heavy metal contaminations, eutrophication, and aquatic weed infestation [6,9,10,11,12]. Over 5000 instances of “land modifications” have taken place in the past with the majority deemed to violate the Coastal Regulation Zone guidelines of the Indian Environment Protection Act of 1986 [13,14]. As a consequence, water quality has degraded over the past decades and Lake Vembanad is considered one of the most polluted estuaries in India with the continued observation of high levels of suspended and dissolved matter, turbidity, and nutrients, and the persistence of pathogenic bacteria [6,7,15].
The Sustainable Development Goals (SDGs) of the United Nations (UN) (https://sdgs.un.org/; accessed on 15 February 2021) address the need for sustainable development of vulnerable coastal regions such as the Vembanad-Kol wetland system. SDG-14 deals with the conservation and sustainable use of the oceans, seas, and marine resources, while SDG-6 recognises the need for clean water and sanitation. Meeting SDG target 14.1 (“by 2025, prevent and significantly reduce marine pollution of all kinds, in particular from land-based activities, including marine debris and nutrient pollution”) and SDG target 6.3 (“by 2030, improve water quality by reducing pollution, eliminating dumping and minimising release of hazardous chemicals and materials, halving the proportion of untreated wastewater and substantially increasing recycling and safe reuse globally”) will require, as a first step, that the quality of water in aquatic bodies is assessed in a routine manner and changes therein are recorded over time. Similarly, SDG targets 14.2 (“by 2020, sustainably manage and protect marine and coastal ecosystems to avoid significant adverse impacts, by strengthening their resilience, and take action for their restoration in order to achieve a healthy and productive ocean”) and 6.6 (“by 2020, protect and restore water-related ecosystems, including mountains, forests, wetlands, rivers, aquifers, and lakes”) require an assessment of the impact of human activities on water quality. However, it is often not straightforward to demonstrate the direct effect of various anthropogenic activities on water quality.
During 2020, a unique opportunity arose to study water quality in Lake Vembanad under reduced anthropogenic activities. In response to the global pandemic caused by SARS-CoV-2, the government of India imposed a nationwide lockdown on 25 March 2020 that lasted until 31 May 2020. During this period, people were required to stay at home and most services, including transport, education, industry, fish and vegetable markets, and hospitality were suspended with the exemption of essential services. The easing of lockdown regulations after May 2020 occurred in several phases, with restrictions to services remaining in place in containment zones where infection rates and the number of COVID-19 (caused by SARS-CoV-2) cases were high. At the global scale, the lockdown measures led to a decrease in greenhouse gas emissions [16] and in concentrations of atmospheric nitrogen dioxide and fine particulate matter [17,18], as well as to lower levels of environmental noise [19,20]. Similar reductions in greenhouse gasses and atmospheric particulate matter were observed at the regional scale both across India and near Lake Vembanad [16,21,22]. Yet these positive effects of reduced anthropogenic activities on the environment may locally have been countered by increased organic and inorganic domestic and medical waste and less sustainable waste management [20,23,24]. The potential effect of lockdown restrictions on marine and aquatic ecosystems in the southwest of India has recently received considerable attention [21,22,25]. Yunus et al. [21] showed that total suspended matter, a key indicator of water quality, decreased during the initial phase of the lockdown (April 2020) in various zones in Lake Vembanad, yet concentrations were not necessarily the lowest recorded in April between 2013–2020. Avtar et al. [25] showed that chlorophyll-a concentrations increased in enclosed lakes in Wuhan, China, due to lower disturbance and increased hydrological residence time, but this was not evident in Lake Vembanad. Mishra et al. [22] also showed a lack of change in chlorophyll-a concentrations in the coastal waters of southwest India, in contrast to other regions along the coast of India where a decrease in chlorophyll-a was linked to lower atmospheric deposition of nitrogen during the lockdown.
To study whether the reduction in anthropogenic activities during the nationwide lockdown led to improved water quality in Lake Vembanad, we used multi-spectral remote sensing observations to analyse changes in five different water quality indicators. Sentinel-2 and Landsat-8 images were used to calculate chlorophyll-a, total suspended matter, absorption by coloured dissolved organic matter, turbidity, and the Forel-Ule classification of water colour between 2013 and 2020. Trends between the month preceding lockdown and the first month of lockdown were analysed on a pixel-by-pixel basis and for 13 different locations in Lake Vembanad. In May 2020, in situ observations were collected, which provided us with the chance to fill gaps in the data during a later phase of the lockdown when remote sensing observations were obstructed by cloud cover. The in situ observations in May 2020 were compared with those collected in May 2019 as part of an ongoing study on the water quality of Lake Vembanad [14,26,27] and analysed in relation to seasonal and inter-annual variations in these properties. The results are discussed in the context of the longer term trends of water quality of Lake Vembanad and the importance of addressing anthropogenic activities in the sustainable management of aquatic ecosystems and water resources.

2. Materials and Methods
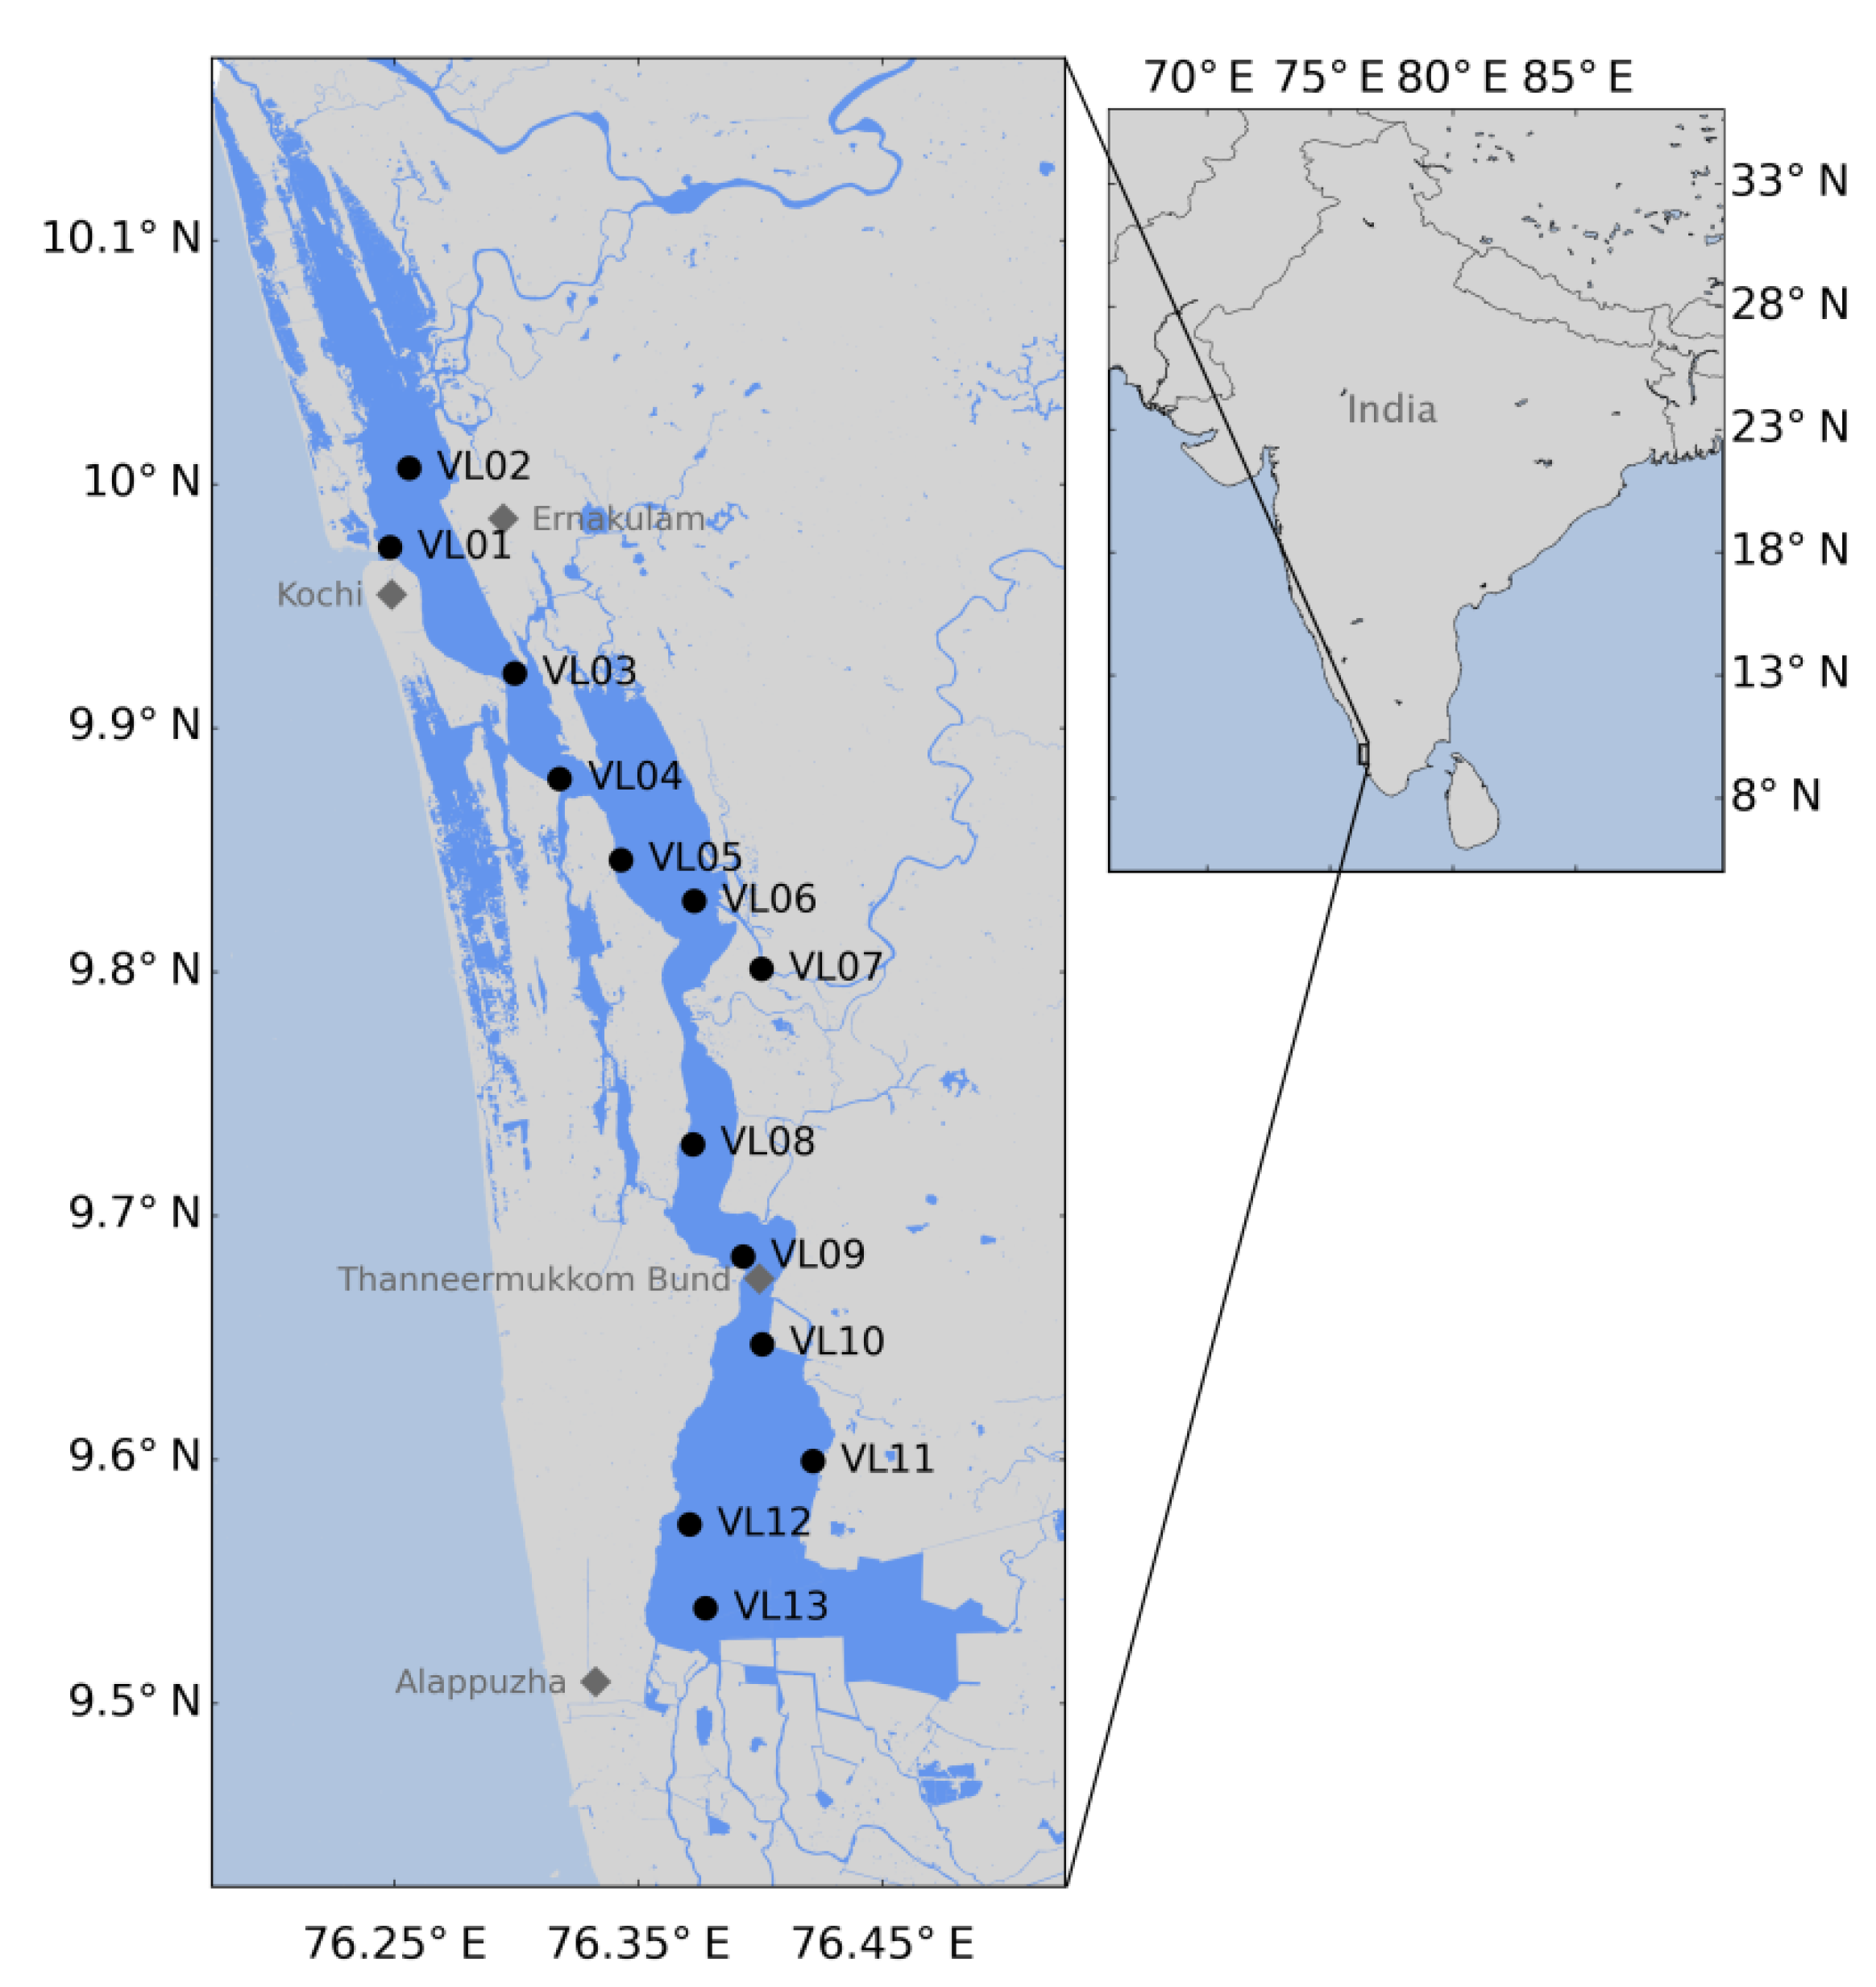
In this study, multi-spectral remote sensing observations were used to analyse trends in water quality parameters in Lake Vembanad, India, before, during, and after a nationally imposed lockdown (25 March–31 May 2020) associated with the global pandemic caused by the SARS-CoV-2. In situ samples were collected during the lockdown in May 2020 and were compared with samples collected in May 2019 as part of an ongoing study [14,26,27]. Long-term trends in water quality, as observed in the satellite record (2013–2020), were also addressed.

2.1. Study Area

Lake Vembanad is part of the Vembanad-Kol wetland system situated along the southwest coast of India (09°25′30″–10°10′30″N, 76°21′00″–76°31′30″E) and extends approximately 100 km. The lake is semi-enclosed with connections to the Arabian Sea at Kochi (VL01, Figure 1) and further north at Ahzeekode, and is partitioned into a northern and a southern region by a man-made barrier (Thanneermukkom Bund; between VL09 and VL10, Figure 1). Lake Vembanad is characterised by brackish waters in the north and fresh waters in the south, except during the south-west monsoon (June–September) when the entire lake becomes a freshwater basin [28]. The depth of the lake ranges from 1.5 to 6 m at most locations, except for the main shipping channels near Kochi, which are maintained at depths of 10 to 13 m through dredging [6]. Six rivers drain into Lake Vembanad with a total drainage area of ~12,000 km2 [8]. The annual cycle in Lake Vembanad is characterised by a dry season in winter (December–February), a spring inter-monsoon (March–May), and wet seasons during the south-west monsoon (June–September) and the north-east monsoon (October–November).

2.2. Multi-Spectral Remote Sensing Observations

Sentinel-2A and -2B Multispectral Imager (MSI) images for Lake Vembanad were downloaded from the Copernicus Open Access Hub (https://scihub.copernicus.eu, accessed on 6 January 2021; level-1C, baseline numbers N0204–N0209, relative orbit number R019, 2016–2020) and Landsat-8 Data Continuity Mission (LDCM) images for the same region were downloaded from the Google Earth Engine Data Catalog (https://developers.google.com/earth-engine/datasets/catalog/landsat, accessed on 6 January 2021; level-1TP, Worldwide Reference System path and row 144053, 2013–2020). Level-1 products were processed at a 10–20 m spatial resolution for Sentinel-2A and -2B and at a 60 m spatial resolution for Landsat-8 using ACOLITE, a processor developed for the analysis of coastal and inland-water data from Sentinel-2 and Landsat imagery (ACOLITE version 20190326, Remote Sensing and Ecosystem Modelling, Royal Belgian Institute of Natural Sciences, Brussels, Belgium; https://odnature.naturalsciences.be/remsem/software-and-data/acolite, accessed on 4 April 2019). ACOLITE was applied with the dark spectrum fitting approach to perform the atmospheric correction [29,30], and surface reflectances were obtained for further analysis. Following standard procedures in ACOLITE, non-water pixels, pixels with negative reflectances, and cirrus clouds were masked. In total, 245 images for Sentinel-2 and 165 images for Landsat-8 were processed between 2013 and 2020. Data coverage was typically lower from May to September due to dense cloud cover associated with the monsoon season.
In this study, we used five indicators amenable to multi-spectral remote sensing to study the water quality of Lake Vembanad: (1) chlorophyll-a (Chl-a), a measure of phytoplankton biomass; (2) total suspended matter (TSM), operationally defined as all organic and inorganic suspended particles larger than 0.7 µm; (3) absorption by coloured dissolved organic matter (aCDOM), the light-absorbing fraction of organic particles smaller than 0.45 µm (i.e., dissolved organic matter); (4) turbidity, a measure of water clarity that is related to Chl-a, TSM, and aCDOM; and (5) the Forel-Ule (FU) classification of water colour ranging from blue to green to brown waters, with blue waters termed as clear waters low in suspended and dissolved materials [31,32,33,34]. Region-specific satellite retrieval algorithms for Lake Vembanad were not available and existing algorithms were used to estimate the five different indicators of water quality. The selected algorithms have been parameterised for Sentinel-2 and Landsat-8 [16,35,36,37] and have previously been used to study water quality in Lake Vembanad [21,25,38]. We provide further information on the comparison between the satellite and in situ observations in Section 2.4. Concentrations of Chl-a (in mg m−3) were calculated using the Ocean Chlorophyll 2-band algorithm (OC2v2 [39]) based on the blue and green spectral reflectances (Table 1) and coefficients specific to the Sentinel-2 and Landsat-8 sensors (a0 = 0.1977, a1 = −1.8117, a2 = 1.9743, a3 = −2.5635, a4 = −0.7218 [35,36]). Concentrations of TSM (in g m−3) were calculated using the bio-optical algorithm for turbid waters described by Nechad et al. [40] using red spectral reflectances (Table 1). Absorption coefficients by CDOM at 440 nm (aCDOM(440) in m−1) were calculated using an exponential model based on green and red spectral reflectances (Table 1) with coefficients for Sentinel-2 (a = 40.75, b = −2.463) and Landsat-8 (a = 28.97, b = −2.015) sensors that were developed for Lake Huran, Canada [41,42,43]. Turbidity (in nephelometric turbidity units (NTU)) was calculated according to Nechad et al. [44] using a bio-optical model that relates turbidity to water-leaving reflectances using the red spectral reflectance (Table 1) and coefficients published for the Moderate Resolution Imaging Spectroradiometer (MODIS) (a = 228.1 and c = 0.1641 [36]). The FU classification of water colour was calculated according to Wernand et al. [45] using all spectral reflectances available for each sensor and with coefficients for Sentinel-2 (a = −751.59, a2 = 1524.96, a3 = −1279.99, a4 = 477.16, a5 = −65.74, c = 116.56) and Landsat-8 (a = −533.61, a2 = 1134.19, a3 = −981.83, a4 = 373.81, a5 = −52.16, c = 76.72) sensors as reported by Van der Woerd and Wernand [37] to estimate the colour-matching functions and chromaticity coordinates for comparison with the unique chromaticity coordinates of the 21 values on the FU scale.

2.3. In Situ Observations

Samples for the measurement of Chl-a, TSM, aCDOM, turbidity, and FU classification of water colour were collected on 14–15 May 2019 and 11–12 May 2020 at 13 different locations in Lake Vembanad (Figure 1; n = 13 for May 2019 and May 2020 each) as part of an ongoing study [26]. CTD (SBE19 plus V2 SeaCAT profiler, Sea-Bird) measurements (temperature, salinity, and turbidity) were performed throughout the water column and water samples at the surface were collected using a 5 l Niskin bottle. For Chl-a, water samples were filtered through GF/F and filters were subsequently extracted in 90% acetone for 24 h at 4 °C and the concentration of Chl-a (mg m−3) was measured using a spectrophotometer (UV-Visible Spectrophotometer UV-2600/2700, Shimadzu, Kyoto, Japan). For TSM, water samples were filtered through pre-weighted GF/F and filters were dried for 4 h at 60 °C and weighted again to obtain the concentration of TSM (g m−3). Samples for the analysis of aCDOM were filtered through 0.2 µm polycarbonate filters and absorption was measured between 400–700 nm using a spectrophotometer with integrated sphere (UV-Visible Spectrophotometer UV-2600/2700, Shimadzu, Kyoto, Japan). The FU classification of water colour was estimated using a 3D-printed mini Secchi disk [34]. Additional samples between May 2018 and May 2019 were used to validate remote sensing observations (see Section 2.4). Further details of sampling procedures are described in [26].

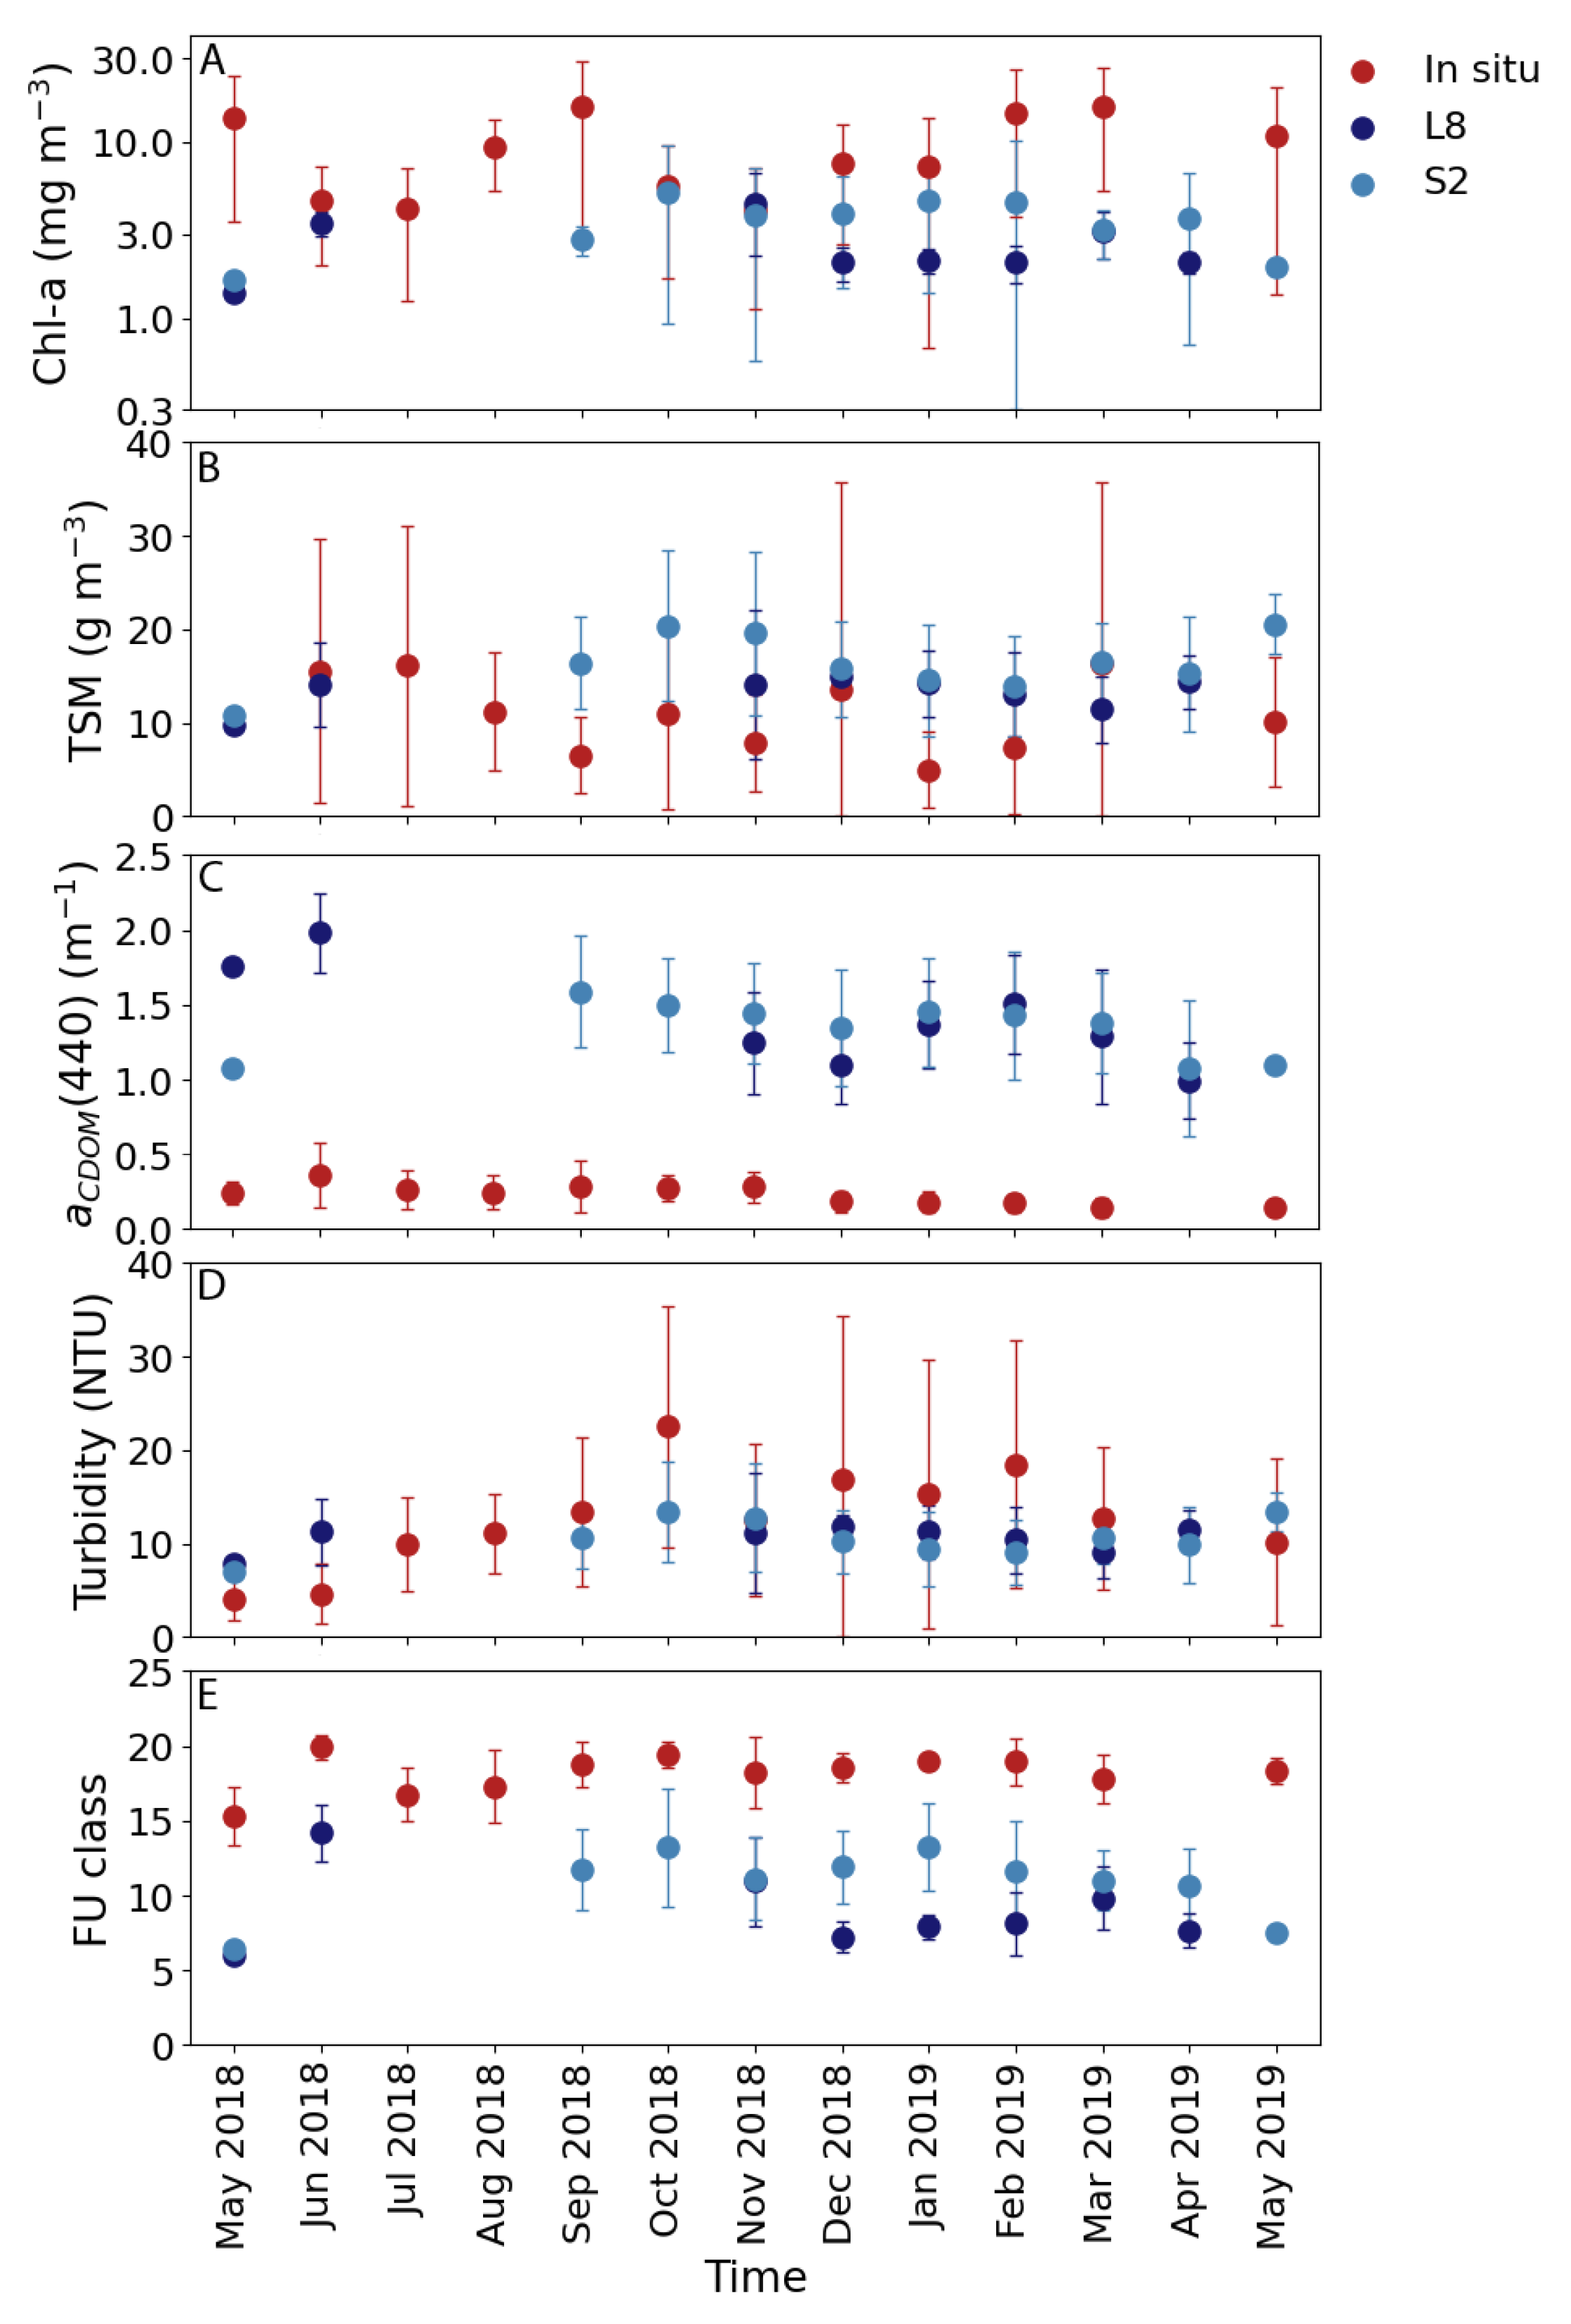
2.4. Comparison of Remote Sensing and In Situ Observations

Earlier studies validating the used satellite retrieval algorithms against the field-derived measurements have suggested good performance of these algorithms in various aquatic systems [35,36,37,39,40,41,42,43,44,45]. For this study, the algorithms were compared to in situ samples collected between May 2018 and May 2019 at 13 different locations in Lake Vembanad (Figure 1; in total 13 cruises were completed during this time period). The following criteria [46] were used to select remote sensing observations for the comparison: (1) The mean of a 3 × 3 pixel matrix at the in situ sampling coordinates were used; (2) Data for at least half of the 3 × 3 pixel matrix were available; (3) The coefficient of variation of the 3 × 3 pixel matrix was ≤0.15; and (4) The time difference between the satellite overpass and the in situ sampling time was ≤2 d. Spatiotemporal matching of the in situ sampling days with satellite overpasses was low with 22 data points for Sentinel-2 and 8 data points for Landsat-8. We considered the low number of match-up data points too limited for a validation exercise and therefore compared monthly mean values of the water quality indicators for each observation method (Figure 2). The comparison of monthly means showed similar seasonality in the water quality indicators based on remote sensing and in situ observations. Further analyses showed that: higher Chl-a concentrations (>10 mg m−3) were not captured by the satellite retrieval algorithm (Figure 2A); satellite-derived values of TSM and turbidity compared relatively well with in situ observations (Figure 2B,D); the absorption by CDOM was overestimated by ~4 times (Figure 2C); and the FU classes were lower in the satellite-derived observations compared with the in situ observations (Figure 2D). Although some satellite retrieval algorithms performed differently in Lake Vembanad compared with reports in the literature from other regions, the relatively low number of match-up data points limits efforts to develop locally tuned satellite algorithms at this time. Other published satellite retrieval algorithms were assessed, but these did not yield a better comparison with the in situ observations of the water quality indicators. We therefore chose to use the selected satellite algorithms, considering that these algorithms have previously been used for Lake Vembanad [21,25,38] and considering that the results are presented as a relative change and separately for each observation method (remote sensing and in situ) in this study.
Radiometric characterisation and cross-calibration have shown that the Sentinel-2 and Landsat-8 bands generally compared well, with the exception of the near infrared bands [47]. For Lake Vembanad, the Sentinel-2 and Landsat-8 data for each water quality indicator were compared on days when both sensors passed the study region (n = 8). The analyses of the coefficient of determination and the root-mean-square error and bias showed that Sentinel-2 and Landsat-8 data generally compared well (r2 = 0.80–92, p < 0.001 for Chl-a, TSM, aCDOM(440), and turbidity, and r2 = 0.60, p < 0.001 for the FU classes) with differences between the two sensors ranging from 6–25%. For further analysis, Landsat-8 data was referenced to Sentinel-2 data by linear regression on a pixel-by-pixel basis as the latter sensor showed a better comparison with the in situ observations in Lake Vembanad. For mapping (Figure 3), Sentinel-2 data was re-gridded to the Landsat-8 data (60 m spatial resolution).

2.5. Data Analyses

To study the effect of the local lockdown measures, the percentage change in the satellite-derived water quality indictors between the month preceding lockdown (PLD, 28 February–24 March, n = 4 images available) and the first month of lockdown (LD, 25 March–24 April, n = 5 images available) was calculated for 2020 for the entire basin and for the locations of the 13 in situ sampling sites (i.e., ([PLD−LD]/LD)×100)). For comparison, similar calculations were performed for the same period in previous years (2013–2019). Calculations were also performed for a post-lockdown period (25 October–24 November, n = 4 images available) after cloud cover (associated with the monsoon season) no longer obstructed remote sensing observations. The probability of the effect of the different lockdown periods on water quality was tested using a Wilcoxon signed-rank test and differences were considered significant when p < 0.05. To estimate inter-annual trends in the water quality indicators between 2013 and 2020, monthly means were corrected for seasonality by subtracting monthly climatologies. The rate of change over time (percentage per year in respect to the mean values of 2013–2020) and its significance (p < 0.05) were calculated using linear regression and Student’s t-tests following [48].

2.6. Ancillary Data

Lake surface water temperature (LSWT) data for Lake Vembanad were downloaded from the Copernicus Global Land Service (https://land.copernicus.eu/global/products/lswt/, accessed on 6 January 2021; 2002–2012 and 2016–2020). The service provides a near real time level-3 dataset of 1 km, 10-day averaged LSWT from the SLSTR instrument on Sentinel-3A (see [49,50] for detailed methods and validation). The data were converted from Kelvin to degrees Celsius, and the mean temperature for Lake Vembanad for each 10-day period was calculated for the period when data were available. The daily photosynthetically active radiation (PAR, 400–700 nm) at the lake surface was downloaded from the National Aeronautics and Space Administration (NASA) Earthdata portal (https://earthdata.nasa.gov/, accessed on 6 January 2021; Aqua-MODIS level 3 global mapped data, 2013–2020) at a 4 km spatial resolution. Mean monthly PAR at the surface of Lake Vembanad was calculated for all years between 2013 and 2020. Daily rainfall data were obtained from the Climate Hazards Group Infrared Precipitation with Stations (CHIRPS) (https://data.chc.ucsb.edu/products/CHIRPS-2.0/, accessed on 6 January 2021; 2013–2020) at a 0.05° spatial resolution. CHIRPS has provided near real time, quasi-global satellite and observation-based precipitation estimates over land since 1981 [51]. The data were used to calculate the mean monthly rainfall in the Lake Vembanad region for each year between 2013–2020.

3. Results

The comparison of remote sensing observations in the month preceding national lockdown measures and during the first month of lockdown showed that water quality improved significantly in large areas of Lake Vembanad, as indicated by a decrease in TSM, turbidity, and aCDOM(440) (p < 0.05; Figure 3B–D, year 2020 in Figure 4B–D). The observed changes were strongest in the central and southern regions of Lake Vembanad (up to −54.9% for TSM, −46.3% for turbidity, and −31.3% aCDOM(440)) with values as low as 4.9 mg m−3 for TSM, 3.9 NTU for turbidity, and 0.29 m−1 for aCDOM(440) by mid-April 2020. However, increased TSM and turbidity during lockdown were also observed in the northern region of Lake Vembanad (near Kochi at station VL01-VL03, Figure 3B,D, year 2020 in Figure 4B,D). The direction of change in Chl-a concentrations during lockdown was variable (Figure 3A), with generally similar or lower Chl-a concentrations observed during lockdown at the locations of the in situ sampling stations (year 2020 in Figure 4A). The water colour remained similar or decreased in number (changing towards clearer water) on the FU scale in large areas of Lake Vembanad during lockdown (Figure 3E, year 2020 in Figure 4E).
The observed changes in water quality indicators during the lockdown period in 2020 were compared with the same period in 2013–2019 at 13 locations in Lake Vembanad (Figure 4). Chl-a concentrations typically decreased during this time of the year between 2013–2019 (Figure 4A). A similar direction of change in Chl-a was observed for some stations in the central and southern regions of Lake Vembanad during 2020 (VL05–VL07, VL11–VL13), while at other stations Chl-a concentrations remained similar or increased during lockdown in 2020 (VL04, VL08–VL10). Both TSM and turbidity typically increased between late-February and April during 2013–2019 (except at stations VL01, VL07; Figure 4B,D), while a strong decrease in TSM and turbidity was observed during lockdown in 2020 at locations in the central and southern regions of the lake (p < 0.05; VL04–VL06, VL08–VL12; Figure 4B,D). The aCDOM(440) decreased at most stations during 2013–2019 and the direction of change was similar during the lockdown in 2020, although higher decreases in aCDOM(440) were observed at some stations (p < 0.05; VL03–VL05, VL08–VL09, VL11–VL12; Figure 4C). The FU class of water colour decreased between late-February and April in 2013–2019 and in 2020, with smaller changes observed in the southern regions of Lake Vembanad during lockdown in 2020 relative to the same period in 2013–2019 (VL08–VL13; Figure 4E).
During lockdown in May 2020, the opportunity arose to collect in situ samples for the water quality indicators. This provided us with the chance to study these water quality indicators later during the lockdown when remote sensing observations were obstructed by cloud cover. Although seasonal and inter-annual variations exist, the in situ observations from May 2020 were compared with those collected in May 2019 as part of an ongoing study in Lake Vembanad (Figure 5). Chl-a concentrations during the lockdown in May 2020 were considerably lower at some of the northern and central locations in the lake (VL03–VL05) compared with May 2019, while at other stations similar concentrations were found in both years (Figure 5A). TSM was higher in the northern stations (VL01–VL04) and at locations VL07, VL08, and VL11 during the lockdown in May 2020 compared with May 2019, while lower TSM was observed in some of the central and southern locations in Lake Vembanad (VL05–VL06, VL09–VL10, VL12–VL13; Figure 5B). The aCDOM(440) values were higher at most in situ sampling stations during the lockdown in May 2020 compared with May 2019 (except for VL05, VL08, and VL10–VL11) (Figure 5C). Turbidity was higher at the northern and central locations in the lake during the lockdown in May 2020 compared with May 2019 (VL02–VL08), while lower turbidity was observed at the southern locations during May 2020 (VL09–VL13; Figure 5D).
Multi-spectral remote sensing observations were obstructed by cloud cover until October 2020, limiting the analysis of water quality directly after the national lockdown measures were lifted at the end of May. The comparison of the remote sensing observations preceding the national lockdown measures and during the period after lockdown in October–November 2020 (once cloud cover had lifted) at the 13 in situ sampling stations showed that the observed improvement in water quality during lockdown was no longer evident (Figure 6). Instead, changes in water quality indicators were more variable in this post-monsoon period, likely related to the influence of rainfall (see below) and associated changes in the hydrology of Lake Vembanad (the basin became entirely freshwater) (Figure 6).
To place the observed differences in water quality indicators in 2020 in the context of inter-annual variations and longer term changes, we analysed inter-annual trends in the five satellite-derived water quality indicators at each location of the in situ sampling sites in Lake Vembanad between 2013 and 2020 (Figure 7). Results showed that Chl-a concentrations decreased in the northern locations (VL01, VL03) and increased in the central and southern locations (VL06–VL13) of the lake during this time period (2013–2020). TSM and turbidity showed similar trends, almost the opposite of those seen for Chl-a, with decreasing values in the northern and central locations (VL01–VL09) and increasing values in the southern locations (VL10–VL12). Values of aCDOM(440) showed relatively lower rates of change with mostly decreasing trends throughout Lake Vembanad (except for location VL11). The direction of change in FU classes was similar to those observed in Chl-a, with decreasing trends in the northern regions (VL03–VL05) and increasing trends in the central and southern regions (VL08–VL12) of Lake Vembanad. In the central region of Lake Vembanad (VL06–VL09), the lowest values of TSM and turbidity were observed during 2020, whereas for the other locations and water quality indicators, the lowest values were recorded between 2013–2019.
In addition to the water quality indicators, we analysed ancillary data that may help to explain the observed differences in water quality in Lake Vembanad during 2020. Surface water temperatures in Lake Vembanad were significantly higher in March–May 2020 compared with the same period in preceding years (2002–2019 for remote sensing observations and with 2018–2019 for in situ observations) (Figure 8A,B). In situ observations in May 2020 compared with 2018–2019 showed that the increase in surface water temperatures was highest in the more central and southern stations (VL06, VL08–VL11; Figure 8B). The observed higher temperatures between March–May 2020 may be related to increased warming due to the relatively low cloud cover and reduced atmospheric aerosols [21,22] during this period and subsequent higher incident irradiance at the water surface (as observed in the remote sensing images and ancillary data). The daily photosynthetically active radiation (PAR) at the surface of Lake Vembanad was somewhat higher during March and April 2020 and considerably lower during August 2020 compared with the same periods in 2013–2019 (Figure 8C). Rainfall was similar in 2013–2019 and 2020 during most months, with higher levels of rainfall observed in July and September 2020 and somewhat lower levels of rainfall during October 2020 (Figure 8D).

4. Discussion

In the past decades, the Vembanad-Kol wetland system has experienced high levels of anthropogenic pressures, leading to adverse ecological and socioeconomic impacts [6,7,52]. The monitoring of water quality is essential for the protection and sustainable use of coastal and freshwater ecosystems such as Lake Vembanad if the ambitious targets set out by the UN as SDGs pertaining to water and sanitation are to be reached. Various indicators and standards are used for monitoring water quality, depending on the application envisaged, ranging from monitoring ecosystem functioning to assessing impacts on human health [31,53]. Dissolved and suspended matter, turbidity, and Chl-a, all amendable to multi-spectral remote sensing, are key indicators of water quality that are often used in regional and global environmental monitoring programmes [2,54,55]. Both dissolved and suspended materials are common pollutants in coastal and aquatic ecosystems [32,56]. High concentrations of these materials can lead to increased turbidity and reduce the light available for photosynthesis by phytoplankton [32]. A reduction of phytoplankton biomass may have a cascading effect on higher trophic levels, while direct effects of suspended matter on zooplankton and fish survival have also been reported (for a review see [32]). Moreover, dissolved and suspended particles can be hazardous and can act as a substrate for bacteria responsible for water-borne diseases, thereby affecting human health [57]. To move towards the sustainable management of freshwater, estuarine, and coastal aquatic ecosystems, it is important to understand how both natural and anthropogenic processes affect water quality. In 2020, the opportunity arose to study the water quality of Lake Vembanad during a period when anthropogenic pressures were reduced due to a nationwide lockdown in response to the global pandemic caused by SARS-CoV-2.
We showed that water quality improved in large areas of Lake Vembanad during April 2020 as evidenced by a decrease in TSM, aCDOM, and turbidity, all leading to clearer waters as indicated by the FU classification of water colour. Similar changes in TSM have also been reported during this first phase of the lockdown in Lake Vembanad [21] and in other freshwater systems in India [58,59]. The observed changes in water quality indicators were strongest in the central and southern regions of Lake Vembanad. In situ observations supported the remotely observed changes in water quality in the southern regions of Lake Vembanad later in the lockdown during May 2020. We observed lower in situ TSM and turbidity during 2020 compared with 2019, while we might have expected a year-to-year increase in these water quality indicators in the southern regions of Lake Vembanad based on longer term trends (this study, [38]). A decrease in TSM, aCDOM, and turbidity was not observed during the same period in preceding years, suggesting that the reduction in anthropogenic activities associated with the nationwide lockdown in 2020 had a positive effect on the water quality in Lake Vembanad. Over longer time scales, improved water quality was observed in the northern and central regions of Lake Vembanad, with decreasing trends in Chl-a, TSM, aCDOM, and turbidity observed between 2013 and 2020. While we cannot distinguish between the influence of natural variations and anthropogenic activities on these trends, the observed differences between the northern and southern regions may be related to differences in hydrological features associated with the salt water barrier in the south of Lake Vembanad (Thanneermukkum Bund, between stations VL09 and VL10, Figure 1) [6,26].
High concentrations of TSM and CDOM in Lake Vembanad have been related to urban, agricultural, and industrial sources [6,7,52]. For example, Kochi city generates 2550 million litres of largely untreated urban sewage per day in which the total dissolved matter can be as high as 54 g m−3 during the summer [6,7], while major industries on the banks of the Periyar River (10 km north of Kochi harbour) discharge 250 million litres of untreated or partially treated effluents containing nutrients, heavy metals, and pesticides into the local estuary [60]. In the central and southern regions of Lake Vembanad, agricultural activities lead to high concentrations of (biodegradable) organic matter [6,15]. The restriction on some of these anthropogenic activities during lockdown in 2020 may explain why the observed improvement in water quality was strongest in the central and southern regions of Lake Vembanad. A halt to transport, industry, and hospitality services could also have had a positive effect on water quality in the entire region by reducing water movement and the resuspension of particles, while the confinement of people to their homes during lockdown may have led to increased domestic waste and sewage discharge in highly populated areas such as in the north of Lake Vembanad near Kochi [20,23]. Moreover, a local shipyard company in Kochi performed dredging activities during the lockdown [61], which together with high siltation in the main shipping channel during this time of the year could have led to high turbidity in the north of Lake Vembanad [62,63].
The hydrological features of Lake Vembanad also played a part in determining the distribution of dissolved and suspended matter in Lake Vembanad during and after the lockdown in 2020. Rivers play a key role in the transportation of dissolved and suspended matter into the lake during the dry season (December–May), while rainfall and enhanced flushing rates can dilute the negative effects of anthropogenic activities on water quality during the wet season (June–November) [6,38,62]. During April and May, rainfall is typically low in the Lake Vembanad region and we observed similar patterns in rainfall between 2020 and earlier years, suggesting that rainfall played a limited role in the improvement in water quality during the lockdown compared with the changes in anthropogenic activities in the region. However, it is more difficult to discern any prolonged effects of reduced anthropogenic activities on water quality after the lockdown restrictions were lifted, as increased rainfall is likely to have altered the water quality of Lake Vembanad during the monsoon season (June–November, [6,38]). In the northern and central regions of Lake Vembanad, tidal movement may have played an additional role in the resuspension and outward flux of suspended matter during the dry season [62]. Other processes, such as the atmospheric and wind-induced deposition of fine particles, may have further contributed to an improvement in water quality in Lake Vembanad, as lower levels of nitrogen dioxide and fine particulate matter were observed during lockdown [18,21].
The observed decrease in TSM and aCDOM could have had a positive impact on the aquatic ecosystem in Lake Vembanad by reducing turbidity and increasing light penetration and hence potentially increasing photosynthesis by phytoplankton [32]. However, Mishra et al. [22] argued that a reduction in atmospheric nitrogen deposition during the lockdown may have altered the trophic status of coastal ecosystems, thereby reducing phytoplankton growth. In Lake Vembanad, phytoplankton growth is generally not nutrient limited due to high levels of eutrophication [7,64]. Consistent with earlier reports on Lake Vembanad and along the southwest coast of India [22,25] we did not observe clear trends in Chl-a during lockdown, indicating that other factors were more important in controlling phytoplankton growth in Lake Vembanad during this time period. We note that during 2020, surface temperatures in Lake Vembanad were considerably higher than in previous years and this may have affected phytoplankton growth during the main bloom period from February to March [26,65]. Over longer time periods, we did observe a positive trend in phytoplankton biomass as the suspended and dissolved matter decreased in the central region of Lake Vembanad, but this was not observed for the more northern and southern regions of the lake, further suggesting that both anthropogenic as well as natural conditions affect phytoplankton growth in Lake Vembanad [32].

5. Conclusions

Although we were not able to pinpoint specific sources of pollution, our study showed that water quality can improve substantially when anthropogenic activities are reduced. This provides important insights into the future management of Lake Vembanad and other coastal and aquatic ecosystems. The Vembanad-Kol wetland system is a critically vulnerable coastal area protected under various international, national, and state-wide regulations (most notably the Ramsar Convention and the Coastal Regulation Zone guidelines of the Indian Environment Protection Act), committing the national and local governments to safeguard the livelihood of the local population while protecting the ecological values of Lake Vembanad and the surrounding wetlands [7,52]. Many anthropogenic activities that affect water quality in Lake Vembanad are regulated and/or prohibited under these regulations, including new industrial development and the discharge of untreated waste waters and hazardous substances [7,66]. Here, we showed that a coordinated response in reducing anthropogenic activities that may violate the regulations in place (as seen during the lockdown in April–May 2020) can improve water quality, with the potential to sustain and/or restore the ecological values of Lake Vembanad in the future [7,32,52]. Continuing such a coordinated response could help achieve the targets set out in SDG-6 and SDG-14 and significantly reduce aquatic pollution and improve water quality by 2030. While we did not observe a prolonged positive effect on water quality after lockdown restrictions were lifted, water quality seems to be improving in some regions when considering inter-annual trends. This shows that both continued scientific research and the monitoring of water quality on short and longer time scales can aid in the knowledge-based decision making required for the sustainable management of Lake Vembanad [52,53] with a view to achieving the SDGs set out by the UN. This is especially important in meeting the targets set out in SDG-6 and SDG-14 which focus on the restoration, protection, and sustainable management of aquatic and marine ecosystems. Remote sensing observations can aid in this, with free and open data available at high temporal and spatial resolutions [31,67]. The limited comparison between remote sensing and in situ observations presented in this study showed some similarities as well as discrepancies in the magnitudes of the water quality indicators studied, such that we were obliged to treat them as independent pieces of information, and confine the analyses of remote sensing data to infer relative changes over time. However, it is worth noting that the relative changes observed through remote sensing and in situ observations were generally consistent with each other. Our results highlight the importance of continued and sustained in situ observations of water quality in Lake Vembanad, to permit more precise match-up data analyses of remote sensing and in situ observations, with a view to developing better satellite retrieval algorithms that are tuned for these regional conditions.

Author Contributions

Conceptualization, G.K., S.S., G.G., A.A., and N.M.; methodology, G.K., S.S., C.J., V.T., and R.J.W.B.; validation, G.K., C.J., and V.T.; formal analysis, G.K.; investigation, G.K., S.S., G.G., A.A., and N.M.; data curation, G.K., G.G., A.A., N.M., and R.J.W.B.; writing—original draft preparation, G.K. and S.S.; writing—review and editing, G.K., S.S., G.G., A.A., N.M., and C.J.; funding acquisition, S.S., G.G., A.A., and N.M. All authors have read and agreed to the published version of the manuscript.

Funding

This work was funded by Natural Environmental Research Council, United Kingdom, and the Department of Science and Technology, India, under the India–UK water quality research programme project REhabilitation of Vibrio Infested waters of VembanAd Lake: pollution and solution (REVIVAL; grant numbers NE/R003521/1 and DST/TM/INDO-UK/2K17/64 C & G). This work is a contribution to the activities of the National Centre of Earth Observation of the UK.

Acknowledgments

G.G. is thankful for the support extended by the Director, ICAR-CMFRI, Kochi in establishing a marine bio-optics laboratory.

Conflicts of Interest

The authors declare no conflict of interest.

References

  1. Beiras, R. Marine Pollution: Sources, Fate and Effects of Pollutant in Coastal Ecosystems; Elsevier: Amsterdam, The Netherlands, 2018. [Google Scholar]
  2. UN Environment. Global Manual on Ocean Statistics. Towards a Definition of Indicator Methodologies; UN Environment: Nairobi, Kenya, 2018. [Google Scholar]
  3. Häder, D.P.; Banaszak, A.T.; Villafañe, V.E.; Narvarte, M.A.; González, R.A.; Helbling, E.W. Anthropogenic pollution of aquatic ecosystems: Emerging problems with global implications. Sci. Total Environ. 2020, 713, 136586. [Google Scholar] [CrossRef] [PubMed]
  4. Barboza, L.G.A.; Dick Vethaak, A.; Lavorante, B.R.B.O.; Lundebye, A.K.; Guilhermino, L. Marine microplastic debris: An emerging issue for food security, food safety and human health. Mar. Pollut. Bull. 2018, 133, 336–348. [Google Scholar] [CrossRef]
  5. Myers, N.; Mittermeier, R.A.; Mittermeier, C.G.; Da Fonseca, G.A.B.; Kent, J. Biodiversity hotspots for conservation priorities. Nature 2000, 403, 853–858. [Google Scholar] [CrossRef]
  6. Menon, N.N.; Balchand, A.N.; Menon, N.R. Hydrobiology of the Cochin backwater system—A review. Hydrobiologia 2000, 430, 149–183. [Google Scholar] [CrossRef]
  7. WISA. Conservation and Wise Use of Vemabanad-Kol: An Integrated Management Planning Framework; Wetlands International—South Asia: New Delhi, India, 2013. [Google Scholar]
  8. Balachandran, K.K.; Nair, K.K.C.; Achuthankutty, C.T.; Nair, S.; Wafar, M.V.W.; Ramesh, R.; Saramma, U.P.; Rosamma, S.; Haridas, P.; Jayalakshmy, K.V.; et al. Ecosystem Modelling of Cochin Backwaters 2002–2007; Ministry of Earth Sciences, Government of India: New Delhi, India, 2007.
  9. Ramasamy, E.V.; Jayasooryan, K.K.; Chandran, M.S.S.; Mohan, M. Total and methyl mercury in the water, sediment, and fishes of Vembanad, a tropical backwater system in India. Environ. Monit. Assess. 2017, 189, 130. [Google Scholar] [CrossRef] [PubMed]
  10. Sruthy, S.; Ramasamy, E.V. Microplastic pollution in Vembanad Lake, Kerala, India: The first report of microplastics in lake and estuarine sediments in India. Environ. Pollut. 2017, 222, 315–322. [Google Scholar] [CrossRef]
  11. Jose, J.; Giridhar, R.; Anas, A.; Loka Bharathi, P.A.; Nair, S. Heavy metal pollution exerts reduction/adaptation in the diversity and enzyme expression profile of heterotrophic bacteria in Cochin estuary, India. Environ. Pollut. 2011, 159, 2775–2780. [Google Scholar] [CrossRef]
  12. Sheeba, V.A.; Abdulaziz, A.; Gireeshkumar, T.R.; Ram, A.; Rakesh, P.S.; Jasmin, C.; Parameswaran, P.S. Role of heavy metals in structuring the microbial community associated with particulate matter in a tropical estuary. Environ. Pollut. 2017, 231, 589–600. [Google Scholar] [CrossRef]
  13. Sudhi, K.S. Vembanad Route to Track CRZ Violations in Kerala. Available online: https://www.thehindu.com/news/national/kerala/vembanad-route-to-track-crz-violations-in-state/article29493876.ece (accessed on 19 February 2021).
  14. Menon, N.; George, G.; Ranith, R.; Sajin, V.; Murali, S.; Abdulaziz, A.; Brewin, R.J.W.; Sathyendranath, S. Citizen science tools reveal changes in estuarine water quality following demolition of buildings. Remote Sens. 2021. (Submitted). [Google Scholar]
  15. Vincy, M.V.; Rajan, B.; Pradeep Kumar, A.P. Water Quality Assessment of a Tropical Wetland Ecosystem with Special Reference to Backwater Tourism, Kerala, South India. Int. Res. J. Environ. Sci. 2012, 1, 62–68. [Google Scholar]
  16. Liu, Z.; Ciais, P.; Deng, Z.; Lei, R.; Davis, S.J.; Feng, S.; Zheng, B.; Cui, D.; Dou, X.; Zhu, B.; et al. Near-real-time monitoring of global CO2 emissions reveals the effects of the COVID-19 pandemic. Nat. Commun. 2020, 11, 1–12. [Google Scholar] [CrossRef]
  17. Liu, F.; Wang, M.; Zheng, M. Effects of COVID-19 lockdown on global air quality and health. Sci. Total Environ. 2020, 755, 142533. [Google Scholar] [CrossRef]
  18. Kumar, P.; Hama, S.; Omidvarborna, H.; Sharma, A.; Sahani, J.; Abhijith, K.V.; Debele, S.E.; Zavala-Reyes, J.C.; Barwise, Y.; Tiwari, A. Temporary reduction in fine particulate matter due to ‘anthropogenic emissions switch-off’ during COVID-19 lockdown in Indian cities. Sustain. Cities Soc. 2020, 62, 102382. [Google Scholar] [CrossRef] [PubMed]
  19. Smith, L.M.; Wang, L.; Mazur, K.; Carchia, M.; Depalma, G.; Azimi, R.; Mravca, S.; Neitzel, R.L. Impacts of COVID-19-related social distancing measures on personal environmental sound exposures. Environ. Res. Lett. 2020, 15, 104094. [Google Scholar] [CrossRef]
  20. Zambrano-Monserrate, M.A.; Ruano, M.A.; Sanchez-Alcalde, L. Indirect effects of COVID-19 on the environment. Sci. Total Environ. 2020, 728, 138813. [Google Scholar] [CrossRef] [PubMed]
  21. Yunus, A.P.; Masago, Y.; Hijioka, Y. COVID-19 and surface water quality: Improved lake water quality during the lockdown. Sci. Total Environ. 2020, 731, 139012. [Google Scholar] [CrossRef] [PubMed]
  22. Mishra, D.R.; Kumar, A.; Muduli, P.R.; Equeenuddin, S.M.; Rastogi, G.; Acharyya, T.; Swain, D. Decline in Phytoplankton Biomass along Indian Coastal Waters due to COVID-19 Lockdown. Remote Sens. 2020, 12, 2584. [Google Scholar] [CrossRef]
  23. Adyel, T.M. Accumulation of plastic waste during COVID-19. Science 2020, 369, 1314–1315. [Google Scholar] [CrossRef]
  24. Sarkodie, S.A.; Owusu, P.A. Impact of COVID-19 pandemic on waste management. Environ. Dev. Sustain. 2020. [Google Scholar] [CrossRef] [PubMed]
  25. Avtar, R.; Kumar, P.; Supe, H.; Jie, D.; Sahu, N.; Mishra, B.K.; Yunus, A.P. Did the COVID-19 lockdown-induced hydrological residence time intensify the primary productivity in lakes? Observational results based on satellite remote sensing. Water 2020, 12, 2573. [Google Scholar] [CrossRef]
  26. Abdulaziz, A.; Krishna, K.; Syamkumar, V.; George, G.; Menon, N.; Kulk, G.; Jasmin, C.; Ciambelli, A.; Hridya, K.V.; Tharakan, B.; et al. Dyanmics of Vibrio cholera in a typical tropical lake and estuarine system: Potential of remote sensing for risk mapping. Remote Sens. 2021, 13, 1034. [Google Scholar] [CrossRef]
  27. George, G.; Menon, N.N.; Abdulaziz, A.; Brewin, R.J.; Pranav, P.; Achanveetil, G.; Mini, K.G.; Kuriakose, S.; Sathyendranath, S.; Platt, T. Citizen scientists contribute to real-time monitoring of lakewater quality using 3D printed mini Secchi disks. Front. Water 2021. [Google Scholar] [CrossRef]
  28. Lakshmanan, P.T.; Shynamma, C.S.; Balchand, A.N.; Kurup, P.G.; Nambisan, P.N.K. Distribution and seasonal variation of temperature and salinity in Cochin backwaters. Indian J. Mar. Sci. 1982, 11, 170–172. [Google Scholar]
  29. Vanhellemont, Q.; Ruddick, K. Atmospheric correction of metre-scale optical satellite data for inland and coastal water applications. Remote Sens. Environ. 2018, 216, 586–597. [Google Scholar] [CrossRef]
  30. Vanhellemont, Q.; Ruddick, K. Adaptation of the dark spectrum fitting atmospheric correction for aquatic applications of the Landsat and Sentinel-2 archives. Remote Sens. Environ. 2019, 225, 175–192. [Google Scholar] [CrossRef]
  31. Ritchie, J.C.; Zimba, P.V.; Everitt, J.H. Ritchie-2003-RS tech to assess water quality. Photogramm. Eng. Remote Sens. 2003, 69, 695–704. [Google Scholar] [CrossRef] [Green Version]
  32. Bilotta, G.S.; Brazier, R.E. Understanding the influence of suspended solids on water quality and aquatic biota. Water Res. 2008, 42, 2849–2861. [Google Scholar] [CrossRef]
  33. Wernand, M.R.; van der Woerd, H.J. Spectral analysis of the Forel-Ule ocean colour comparator scale. J. Eur. Opt. Soc. 2010, 5, 10014s. [Google Scholar] [CrossRef] [Green Version]
  34. Brewin, R.J.W.; Brewin, T.G.; Phillips, J.; Rose, S.; Abdulaziz, A.; Wimmer, W.; Sathyendranath, S.; Platt, T. A printable device for measuring clarity and colour in lake and nearshore waters. Sensors 2019, 19, 936. [Google Scholar] [CrossRef] [Green Version]
  35. Franz, B.A.; Bailey, S.W.; Kuring, N.; Werdell, P.J. Ocean color measurements with the Operational Land Imager on Landsat-8: Implementation and evaluation in SeaDAS. J. Appl. Remote Sens. 2015, 9, 096070. [Google Scholar] [CrossRef]
  36. Vanhellemont, Q.; Ruddick, K. ACOLITE For Sentinel-2: Aquatic Applications of MSI imagery. In Proceedings of the 2016 ESA Living Planet Symposium, Prague, Czech Republic, 9–13 May 2016; p. SP-740. [Google Scholar]
  37. van der Woerd, H.J.; Wernand, M.R. Hue-angle product for low to medium spatial resolution optical satellite sensors. Remote Sens. 2018, 10, 180. [Google Scholar] [CrossRef] [Green Version]
  38. Bhuyan, M.; Jayaram, C.; Menon, N.N.; Joseph, K.A. Satellite-Based Study of Seasonal Variability in Water Quality Parameters in a Tropical Estuary along the Southwest Coast of India. J. Indian Soc. Remote Sens. 2020, 48, 1265–1276. [Google Scholar] [CrossRef]
  39. O’Reilly, J.E.; Maritorena, S.; O’Brien, M.; Siegel, D.; Toole, D.; Menzies, D.; Smith, R.; Mueller, J.; Mitchell, B.; Kahru, M.; et al. SeaWiFS Postlaunch Calibration and Validation Analyses, Part 3. In NASA Tech. Memo. 2000-206892; Hooker, S., Firestone, E., Eds.; NASA Goddard Space Flight Center: Greenbelt, MD, USA, 2000; Volume 11, p. 49. [Google Scholar]
  40. Nechad, B.; Ruddick, K.G.; Park, Y. Calibration and validation of a generic multisensor algorithm for mapping of total suspended matter in turbid waters. Remote Sens. Environ. 2010, 114, 854–866. [Google Scholar] [CrossRef]
  41. Chen, J.; Zhu, W.N.; Tian, Y.Q.; Yu, Q. Estimation of Colored Dissolved Organic Matter from Landsat-8 Imagery for Complex Inland Water: Case Study of Lake Huron. IEEE Trans. Geosci. Remote Sens. 2017, 55, 2201–2212. [Google Scholar] [CrossRef]
  42. Chen, J.; Zhu, W.; Tian, Y.Q.; Yu, Q.; Zheng, Y.; Huang, L. Remote estimation of colored dissolved organic matter and chlorophyll-a in Lake Huron using Sentinel-2 measurements. J. Appl. Remote Sens. 2017, 11, 1. [Google Scholar] [CrossRef]
  43. Chen, J.; Zhu, W.; Tian, Y.Q.; Yu, Q. Monitoring dissolved organic carbon by combining Landsat-8 and Sentinel-2 satellites: Case study in Saginaw River estuary, Lake Huron. Sci. Total Environ. 2020, 718, 137374. [Google Scholar] [CrossRef] [PubMed]
  44. Nechad, B.; Ruddick, K.G.; Neukermans, G. Calibration and validation of a generic multisensor algorithm for mapping of turbidity in coastal waters. In Remote Sensing of the Ocean, Sea Ice, and Large Water Regions 2009; SPIE: Bellingham, WA, USA, 2009; Volume 7473, p. 74730H. [Google Scholar] [CrossRef]
  45. Wernand, M.R.; Hommersom, A.; Van Der Woerd, H.J. MERIS-based ocean colour classification with the discrete Forel-Ule scale. Ocean Sci. 2013, 9, 477–487. [Google Scholar] [CrossRef] [Green Version]
  46. Bailey, S.W.; Werdell, P.J. A multi-sensor approach for the on-orbit validation of ocean color satellite data products. Remote Sens. Environ. 2006, 102, 12–23. [Google Scholar] [CrossRef]
  47. Li, S.; Ganguly, S.; Dungan, J.L.; Wang, W.; Nemani, R.R. Sentinel-2 MSI radiometric characterization and cross-calibration with Landsat-8 OLI. Adv. Remote Sens. 2017, 6, 147–159. [Google Scholar] [CrossRef] [Green Version]
  48. Vantrepotte, V.; Mélin, F. Temporal variability of 10-year global SeaWiFS time-series of phytoplankton chlorophyll a concentration. ICES J. Mar. Sci. 2009, 225, 175–192. [Google Scholar] [CrossRef] [Green Version]
  49. MacCallum, S.N.; Merchant, C.J. Surface water temperature observations of large lakes by optimal estimation. Can. J. Remote Sens. 2012, 38, 25–45. [Google Scholar] [CrossRef]
  50. Carrea, L.; Embury, O. Datasets related to in-land water for limnology and remote sensing applications: Distance-to-land, distance-to-water, water-body identifier and lake-centre co-ordinates. Geosci. Data J. 2015, 2, 83–97. [Google Scholar] [CrossRef] [Green Version]
  51. Funk, C.; Peterson, P.; Landsfeld, M.; Pedreros, D.; Verdin, J.; Shukla, S.; Husak, G.; Rowland, J.; Harrison, L.; Hoell, A.; et al. The climate hazards infrared precipitation with stations—A new environmental record for monitoring extremes. Sci. Data 2015, 2, 150066. [Google Scholar] [CrossRef] [Green Version]
  52. Narayanan, N.C.; Venot, J.P. Drivers of change in fragile environments: Challenges to governance in Indian wetlands. Nat. Resour. Forum 2009, 33, 320–333. [Google Scholar] [CrossRef]
  53. Islam, M.S.; Tanaka, M. Impacts of pollution on coastal and marine ecosystems including coastal and marine fisheries and approach for management: A review and synthesis. Mar. Pollut. Bull. 2004, 48, 624–649. [Google Scholar] [CrossRef]
  54. EU. Directive 2000/60/EC of the European Parliament and of the Council Establishing a Framework for the Community Action in the Field of Water Policy; EU: Brussels, Belgium, 2000. [Google Scholar]
  55. Hussain, J.; Prabhakar, R.N. Water Quality Activities in Central Water Commission; Ministry of Jal Shakti: New Delhi, India, 2020. [Google Scholar]
  56. Davies-Colley, R.J.; Smith, D.G. Turbidity, suspended sediment and water clarity: A reviews. J. Am. Water Resour. Assoc. 2001, 37, 1085–1101. [Google Scholar] [CrossRef]
  57. Schwarzenbach, R.P.; Egli, T.; Hofstetter, T.B.; Von Gunten, U.; Wehrli, B. Global water pollution and human health. Annu. Rev. Environ. Resour. 2010, 35, 109–136. [Google Scholar] [CrossRef]
  58. Aman, M.A.; Salman, M.S.; Yunus, A.P. COVID-19 and its impact on environment: Improved pollution levels during the lockdown period—A case from Ahmedabad, India. Remote Sens. Appl. Soc. Environ. 2020, 20, 100382. [Google Scholar] [CrossRef]
  59. Garg, V.; Aggarwal, S.P.; Chauhan, P. Changes in turbidity along Ganga River using Sentinel-2 satellite data during lockdown associated with COVID-19. Geomat. Nat. Hazards Risk 2020, 11, 1175–1195. [Google Scholar] [CrossRef]
  60. Priju, C.P.; Narayana, A.C. Heavy and trace metals in Vembanad Lake sediments. Int. J. Environ. Res. 2007, 1, 280–289. [Google Scholar]
  61. Hooghly Cochin Shipyard Limited. 3rd Annual Report 2019-20; Hooghly Cochin Shipyard Limited: Cochin, India, 2020. [Google Scholar]
  62. Vinita, J.; Revichandran, C.; Manoj, N.T. Suspended sediment dynamics in Cochin estuary, West Coast, India. J. Coast. Conserv. 2017, 21, 233–244. [Google Scholar] [CrossRef]
  63. Balchand, A.N.; Rasheed, K. Assessment of Short Term Environmental Impacts on Dredging in a Tropical Estuary; Terra Aqua: Voorburg, The Netherlands, 2000; pp. 16–26. [Google Scholar]
  64. Sooria, P.M.; Menon, N.N.; Ranith, R.; Nair, M.; Anjusha, A.; Shivaprasad, A.; Joseph, K.A.; Saramma, A.V. Occurrence of enhanced herbivory in the microbial food web of a tropical estuary during southwest monsoon. Estuar. Coast. Shelf Sci. 2020, 246, 107017. [Google Scholar] [CrossRef]
  65. Eppley, R.W. Temperature and phytoplankton growth in the sea. Fish. Bull. 1972, 70, 1063–1085. [Google Scholar]
  66. CRZ. The Coastal Regulation Zone Notifications, The Gazette of India, S.O. 114; The Gazette of India: New Delhi, India, 1991; pp. 1–15. [Google Scholar]
  67. Sathyendranath, S.; Abdulaziz, A.; Menon, N.; George, G.; Evers-King, H.; Kulk, G.; Colwell, R.; Jutla, A.; Platt, T. Building Capacity and Resilience Against Diseases Transmitted via Water Under Climate Perturbations and Extreme Weathers Stress. In Space Capacity Building in the XXI Century; Ferretti, S., Ed.; Springer Nature: Cham, Switzerland, 2020; pp. 281–298. [Google Scholar]
Figure 1. Map of Lake Vembanad with the locations of the 13 in situ sampling stations. Note that station VL07 is situated in a tributary. Locations of major cities near Lake Vembanad and the Thanneermukkom Bund are also given. The inset map shows the location of Lake Vembanad on the southwest coast of India.
Remotesensing 13 01631 g001
Figure 2. The comparison between remote-sensing and in situ observations of the water quality indicators at 13 locations in Lake Vembanad. Mean monthly values (±standard deviation) are given for (A) chlorophyll-a (Chl-a); (B) total suspended matter (TSM); (C) absorption by coloured dissolved organic matter at 440 nm (aCDOM(440)); (D) turbidity; and (E) the Forel-Ule classification of water colour (FU class) based on Sentinel-2 (S2), Landsat-8 (L8), and in situ observations between May 2018 and May 2019.
Remotesensing 13 01631 g002
Figure 3. Mean (n = 4–5) concentrations of (A) chlorophyll a (Chl-a); (B) total suspended matter (TSM); (C) absorption by coloured dissolved organic matter at 440 nm (aCDOM(440)); (D) turbidity; and (E) the Forel-Ule classification of water colour (FU class) in the month preceding lockdown (pre-lockdown) and the first month during lockdown on 25 March 2020 (lockdown) and the percentage change on a pixel-per-pixel basis between pre-lockdown and lockdown concentrations. Data was obtained from Sentinel-2 (S2a, S2b) and Landsat-8 (L8) multi-spectral remote sensing observations with images for the pre-lockdown period retrieved on 28 February 2020 (L8), 09 March 2020 (S2a), 14 March 2020 (S2b), and 15 March 2020 (L8), and for the lockdown period on 29 March 2020 (S2a), 31 March 2020 (L8), 03 April 2020 (S2b), 13 April 2020 (S2b), and 16 April 2020 (L8).
Remotesensing 13 01631 g003
Figure 4. Percentage change in (A) chlorophyll a (Chl-a); (B) total suspended matter (TSM); (C) absorption by coloured dissolved organic matter at 440 nm (aCDOM(440)); (D) turbidity; and (E) the Forel-Ule classification of water colour (FU class) during the lockdown after March 25 compared with values one month before the lockdown for 2020, and for the same period in 2013–2019 (based on Sentinel-2 and Landsat-8 multi-spectral remote sensing data).
Remotesensing 13 01631 g004
Figure 5. In situ observations of (A) chlorophyll a (Chl-a); (B) total suspended matter (TSM); (C) absorption by coloured dissolved organic matter at 440 nm (aCDOM(440)); (D) turbidity; and (E) Table 2019. and during the lockdown in May 2020. Note that Secchi disk and FU classification measurements were not collected in May 2020.
Remotesensing 13 01631 g005
Figure 6. Percentage change in (A) chlorophyll a (Chl-a); (B) total suspended matter (TSM); (C) absorption by coloured dissolved organic matter at 440 nm (aCDOM(440)); (D) turbidity; and (E) the Forel-Ule classification of water colour (FU class) after lockdown in October–November compared with values one month before lockdown for 2020, and for the same period for 2013–2019 (based on Sentinel-2 and Landsat-8 multi-spectral remote sensing data).
Remotesensing 13 01631 g006
Figure 7. Linear trends in chlorophyll a (Chl-a), total suspended matter (TSM), absorption by coloured dissolved organic matter at 440 nm (aCDOM(440)), turbidity, and Forel-Ule classification of water colour (FU class) between 2013–2020 given as a percentage change per year. Non-significant trends are denoted as n.s., all other trends are significant (p < 0.05). Analyses are based on Sentinel-2 and Landsat-8 multi-spectral remote sensing data.
Remotesensing 13 01631 g007
Figure 8. Environmental conditions in the Lake Vembanad region with (A) satellite-derived mean monthly lake surface water temperature (LSWT) between 2002–2019 and for 2020 (in blue) and the mean in situ surface water temperature for the 13 sample locations in May 2020 (in red); (B) percentage change in in situ surface water temperatures between May 2019 and May 2020 at each sampling location; (C) satellite-derived mean monthly photosynthetically active radiation (PAR) between 2013–2019 and for 2020; and (D) mean monthly rainfall between 2013–2019 and for 2020.
Remotesensing 13 01631 g008
Table 1. Central wavelengths (in nm) for each band used in the calculation of chlorophyll-a, total suspended matter, absorption by coloured dissolved organic matter, and turbidity (as described in Section 2.2).
BandSentinel-2aSentinel-2bLandsat-8
Blue443442443
Green560559561
Red665665655
Publisher’s Note: MDPI stays neutral with regard to jurisdictional claims in published maps and institutional affiliations.

