
FCAU-Net for the Semantic Segmentation of Fine-Resolution Remotely Sensed Images

1
The College of Computer Science and Technology, Chongqing University of Posts and Telecommunications, Chongqing 400065, China
2
The Chongqing Institute of Meteorological Sciences, Chongqing Meteorological Service, Chongqing 401147, China
3
The Aerospace Information Research Institute, Chinese Academy of Sciences, Beijing 100094, China
*
Author to whom correspondence should be addressed.
Remote Sens. 2022, 14(1), 215; https://0-doi-org.brum.beds.ac.uk/10.3390/rs14010215
Submission received: 24 November 2021
/
Revised: 25 December 2021
/
Accepted: 30 December 2021
/
Published: 4 January 2022
(This article belongs to the Section Remote Sensing Image Processing)
Abstract
:The semantic segmentation of fine-resolution remotely sensed images is an urgent issue in satellite image processing. Solving this problem can help overcome various obstacles in urban planning, land cover classification, and environmental protection, paving the way for scene-level landscape pattern analysis and decision making. Encoder-decoder structures based on attention mechanisms have been frequently used for fine-resolution image segmentation. In this paper, we incorporate a coordinate attention (CA) mechanism, adopt an asymmetric convolution block (ACB), and design a refinement fusion block (RFB), forming a network named the fusion coordinate and asymmetry-based U-Net (FCAU-Net). Furthermore, we propose novel convolutional neural network (CNN) architecture to fully capture long-term dependencies and fine-grained details in fine-resolution remotely sensed imagery. This approach has the following advantages: (1) the CA mechanism embeds position information into a channel attention mechanism to enhance the feature representations produced by the network while effectively capturing position information and channel relationships; (2) the ACB enhances the feature representation ability of the standard convolution layer and captures and refines the feature information in each layer of the encoder; and (3) the RFB effectively integrates low-level spatial information and high-level abstract features to eliminate background noise when extracting feature information, reduces the fitting residuals of the fused features, and improves the ability of the network to capture information flows. Extensive experiments conducted on two public datasets (ZY-3 and DeepGlobe) demonstrate the effectiveness of the FCAU-Net. The proposed FCAU-Net transcends U-Net, Attention U-Net, the pyramid scene parsing network (PSPNet), DeepLab v3+, the multistage attention residual U-Net (MAResU-Net), MACU-Net, and the Transformer U-Net (TransUNet). Specifically, the FCAU-Net achieves a 97.97% (95.05%) pixel accuracy (PA), a 98.53% (91.27%) mean PA (mPA), a 95.17% (85.54%) mean intersection over union (mIoU), and a 96.07% (90.74%) frequency-weighted IoU (FWIoU) on the ZY-3 (DeepGlobe) dataset.
1. Introduction
Semantic image segmentation is one of the most important image processing tasks [1,2]. Its purpose is to classify each pixel in the input image and attach a semantic label [3,4,5,6]. The semantic segmentation of remote sensing images often refers to the pixel-level classification and prediction of geographic entities (e.g., buildings, water bodies, roads, cars, and vegetation) [7]. Therefore, semantic segmentation is a critical tool for improving image comprehension [8]. With the advancement of remote sensing technologies, a constellation of Earth observation satellites has been launched by China [9,10,11], and these satellites acquire substantial fine-resolution images that can be used for semantic segmentation [4,5,8]. This process has crucial research significance for urban planning [12], vehicle monitoring [13], land cover mapping [14], and change detection [15], as well as building and road extraction [16,17]. As semantic segmentation is a continually growing technique, several classifiers have been created for this process in the field of remote sensing [18], including traditional methods (e.g., logistic regression [19], distance-based metrics [20], clustering [21]) and machine learning (e.g., support vector machines (SVMs) [22], random forests (RFs) [23], artificial neural networks (ANNs) [24], and multilayer perceptions (MLPs) [25]), but the flexibility and adaptability of these approaches are limited due to their high dependency on hand made features and information transformations [4,5,7,26,27]. For example, spectral, spatial, and texture characteristics are difficult to optimize, resulting in insufficient dependability [8]. The advancement of deep learning has encouraged the use of convolutional neural networks (CNNs) for image processing [28]. CNNs, which are independent of handcrafted descriptors, have the powerful ability to automatically capture nonlinear and hierarchical features, remarkably influencing the field of computer vision (CV) [1,4,29]. A CNN loses part of the semantic information of the input image because of the local nature of the convolution kernel, leading to a lack of long-term relationship determination ability for image segmentation [5,30]. Therefore, it is more difficult to achieve accurate classification in fine-resolution images, and the segmentation of fine-resolution images remains a challenging topic.
Based on the advantages of local texture extraction, a fully convolutional network (FCN) [31] was the first demonstrated and effective end-to-end CNN structure. Skip connections enhance encoder feature information and upsample decoder feature information according to the size of the original input data, demonstrating their significant generalization ability and high efficiency [6,7]. A series of FCN-based networks for scene segmentation have been proposed (such as the segmentation network (SegNet) [32] and U-Net [33]). Although FCNs have shown elegant structures and remarkable achievements, the abstraction capabilities of FCNs are insufficient for considering meaningful global context information for high-level features. Precise boundaries cannot be recovered correctly by performing eight upsampling operations [7]; therefore, the insufficient utilization of information flows hinders the original U-Net architecture’s potential [18]. A more detailed encoder-decoder structure was proposed to address this issue [4]. Generally, the feature maps produced by an encoder contain low-level and fine-grained semantic information, while maps produced by a decoder contain high-level and coarse-grained semantic data [34,35]. Skip connections are additional methods that act as bridges between low-level and high-level feature maps [18]. For example, in U-Net++ [34], nested and dense skip connections are used instead of direct skip connections; this not only improves the strength of the skip connections but also minimizes the semantic gaps between encoders and decoders [18]. Full-scale skip connections are used in U-Net3+ [36] to improve the capabilities of skip connections and extract characteristic information from the network. The pyramid scene parsing network (PSPNet) [37] directly builds feature maps of varying resolutions through the global average pooling technique. Stride-based spatial pyramid pooling (SSPP) [38] alters the sizes of feature maps by using a pooling procedure using strides. These approaches described above have significance for semantic segmentation and multiscale feature information extraction [4]. Although these approaches can gather context information to some extent, they merely mix features with distinct receptive fields via concatenation procedures. Moreover, the different feature representations and context information extraction capabilities of these neural networks have been ignored; therefore, they cannot explore global context information [2,7,8,29,35].
A self-attention mechanism is simply a method of imitating how humans observe objects. For example, when viewing character pictures, most people focus on crucial local information (such as the character itself) rather than the visual backdrop. This form of self-attention mechanism was originally introduced in natural language processing and has been widely used in CV and remote sensing since its vast potential was first discovered [39]. Attention mechanisms [40,41] are a hot topic in convolution and recurrence research. The long-term dependencies of feature maps and the features extracted via refinement improve the segmentation capabilities of deep networks [35,42,43]. For example, the squeeze-and-excitation network (SENet) [44] uses a channel attention structure to effectively establish interdependencies between channels and selects the most suitable channel by itself. Nevertheless, it ignores the importance of the position dimension for semantic segmentation. The dual-attention network (DANet) [45] designs spatial and channel attention modules according to a dot-product attention mechanism to extract rich context. CBAM [46] utilizes a spatial attention module and channel module to refine intermediate feature maps adaptively. MAResU-Net [35] embeds a multistage attention model into the direct skip connections of the original U-Net, thereby refining the multiscale feature maps. Unlike these methods that use expensive and heavyweight nonlocal or self-attention blocks, a coordinate attention (CA) mechanism [47] that effectively captures the position information and channel-wise relationships has been proposed. The CA mechanism enhances the feature representations of networks and obtains essential contextual information and the long-distance dependencies of geographic entities, improving the final segmentation results.
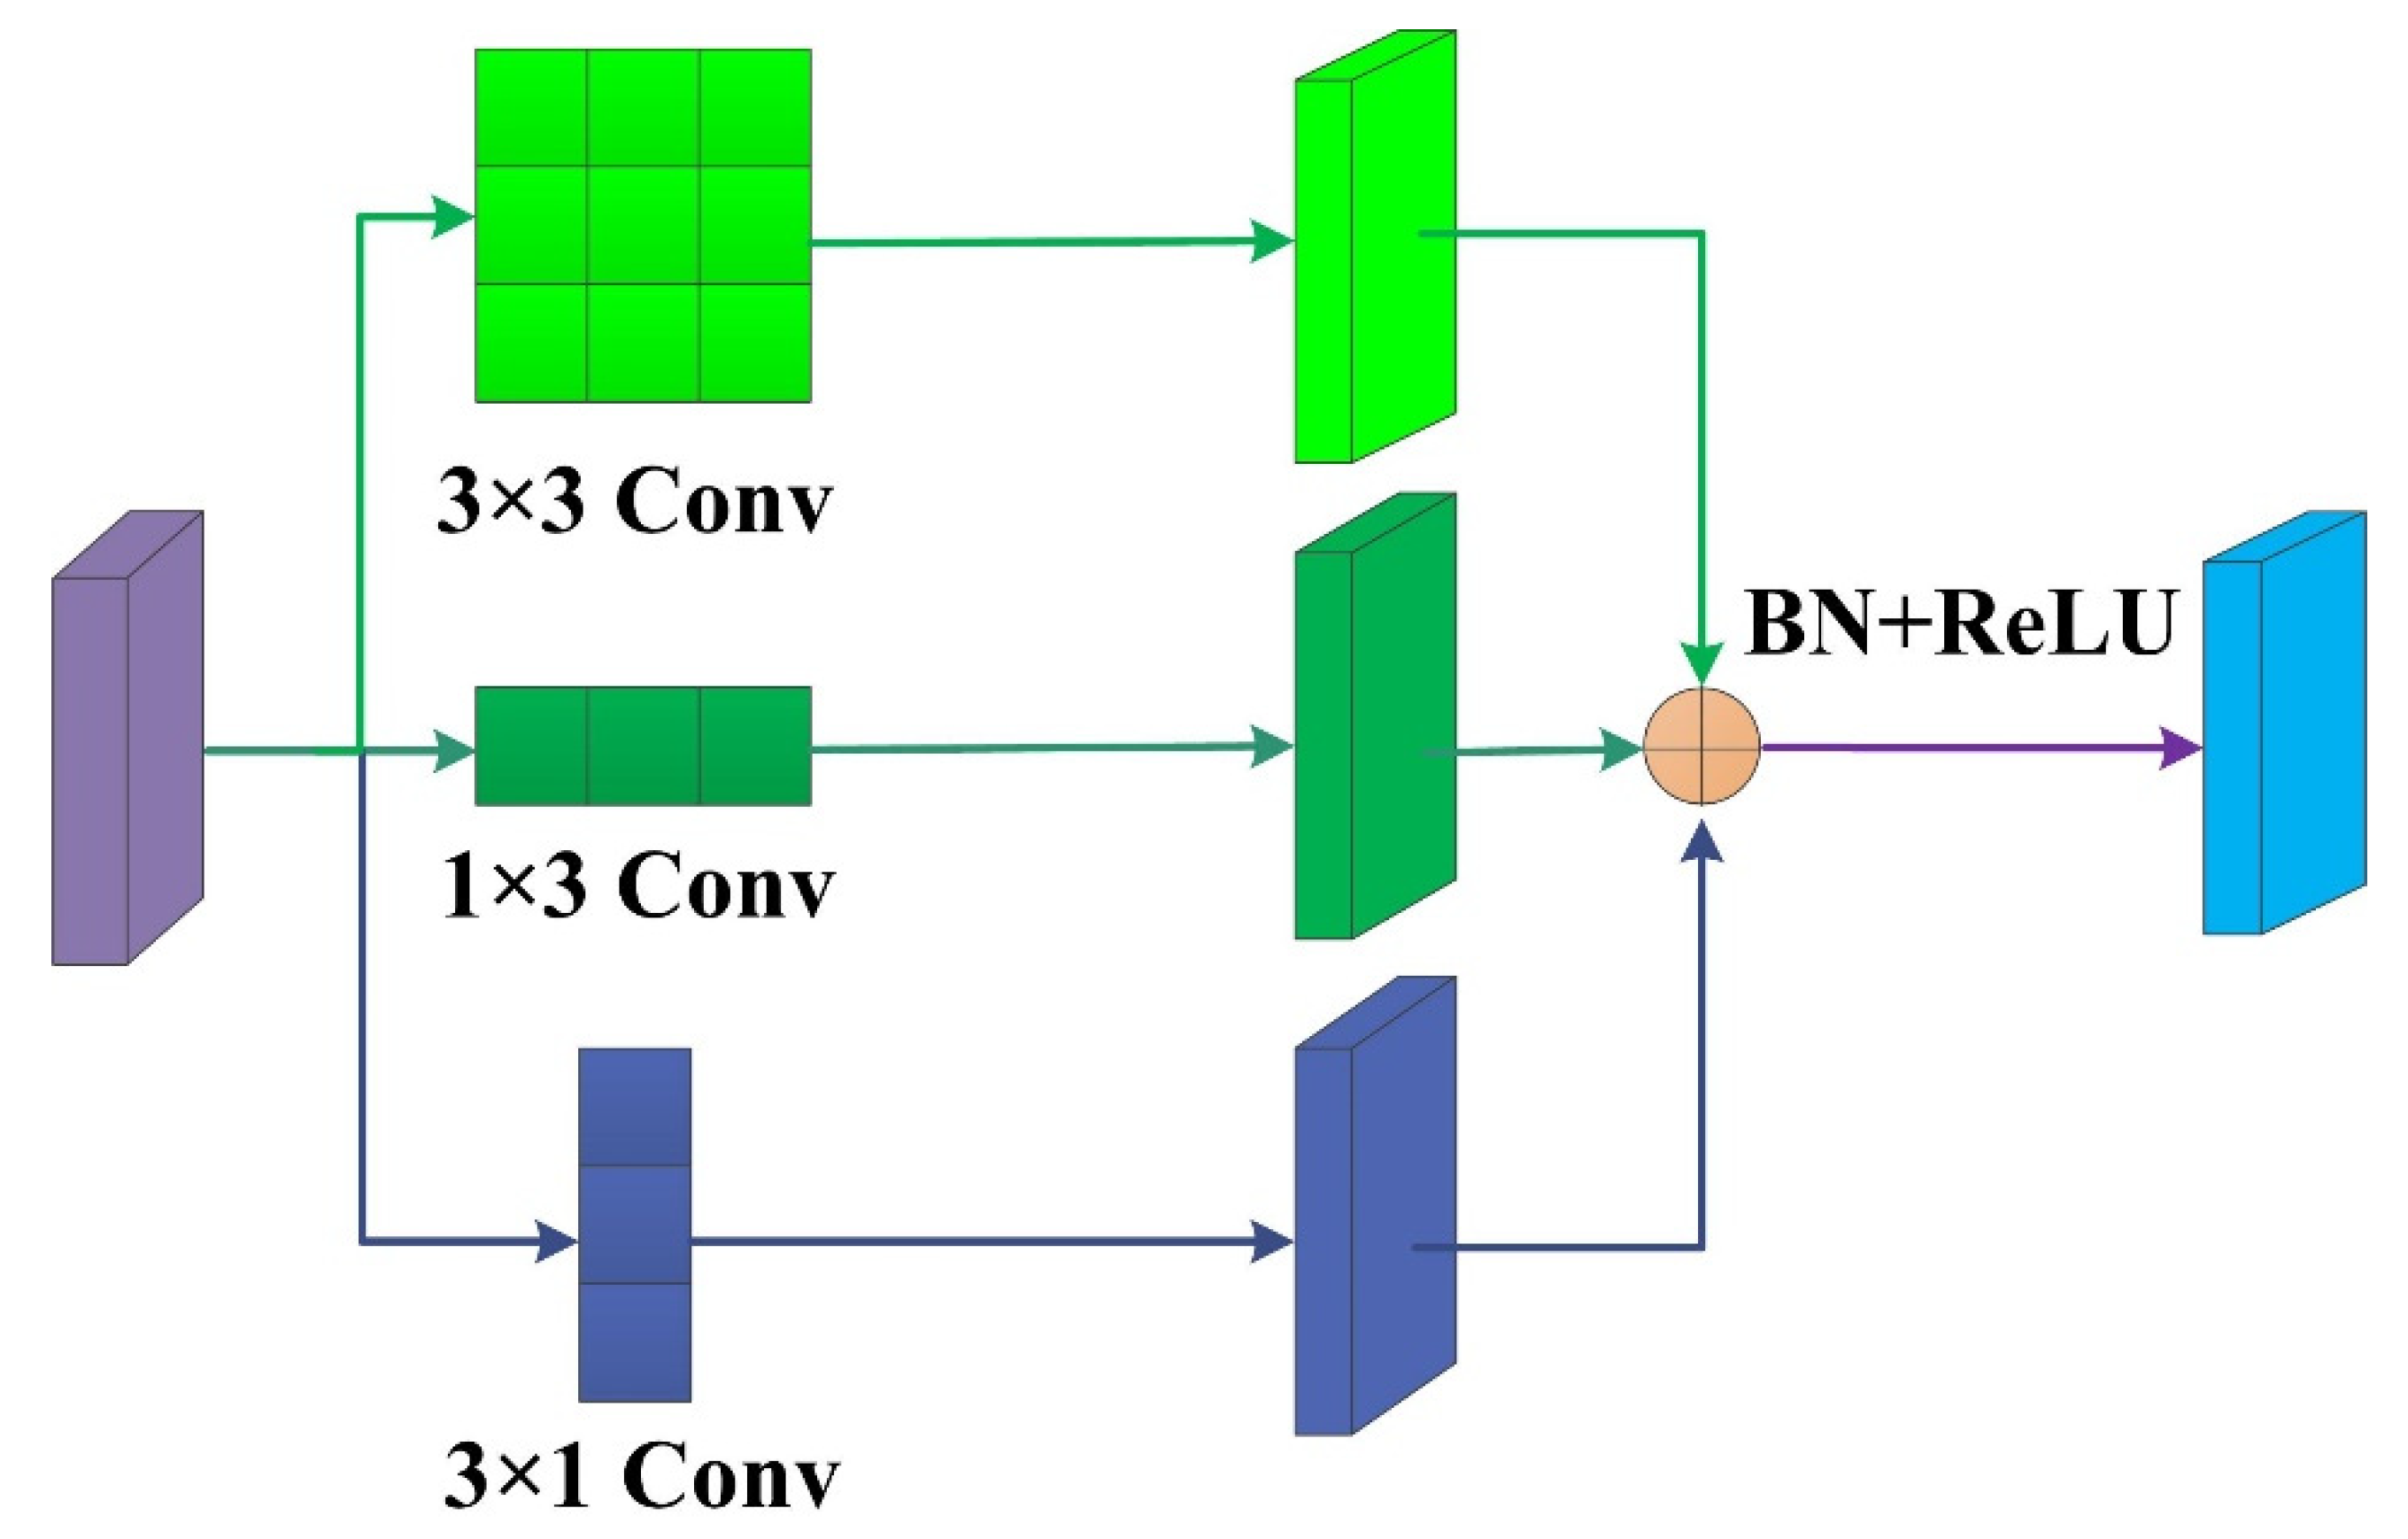
A standard convolution kernel that extracts information with irregular proportions has a more extensive weight range at the central crisscross positions. The points in the corners contain less information that may be used to extract features. Therefore, we used an asymmetric convolution block (ACB) to enhance the spatial details of high-level abstract characteristics by intensifying the weights of the central crisscross portions [18]. ACB convolution is incorporated into FCAU-Net for semantic segmentation. Finally, for the fusion of features, many researchers have proposed effective feature fusion strategies from the perspective of feature-level fusion. For example, Liu et al. [48] proposed a novel cross-resolution hidden layer features fusion (CRHFF) approach for the joint classification of multi-resolution MS and PAN images. The CRHFF solved the inconsistent feature representation problem of the local patches, and the objects can be modeled in a more comprehensive way while increasing the classification accuracy. Zheng et al. [49] proposed a novel multitemporal deep fusion network (MDFN) for short-term multitemporal HR image classification, which includes a long short-term memory (LSTM) and a convolution neural network (CNN). The spatio-temporal-spectral features are extracted and fused by integrating LSTM and CNN branches, improving the classification accuracy. However, a shallow feature mapping contains rough semantics and introduces noise information during feature extraction; the fusion of features with different resolutions leads to the insufficient utilization of information flows. To address the inadequate feature utilization issue, a refinement fusion block (RFB) is designed to merge high-level abstract features and low-level spatial features, thereby eliminating the background noise and reducing the fitting residuals after feature fusion.
Experiments on two public remote sensing image datasets (ZY-3 and DeepGlobe dataset) prove the efficacy of our fusion coordinate and asymmetry-based U-Net (FCAU-Net). For the binary classification problem in our experiment, 0 and 1 represent background and arable land in the ZY-3 dataset, respectively, and 0 and 1 denote background and building in the DeepGlobe dataset. Furthermore, a well-designed model structure can offer a unified solution for semantic segmentation [50], object recognition [51], and change detection [15], which undoubtedly promotes the use of deep learning technology. In summary, the main contributions of this paper are as follows:
- (1)
- A novel CA mechanism is introduced into the encoding process to effectively simulate channel-wise relationships. Accurate position information is used to capture long-term dependencies, enabling the model to accurately locate and identify objects of interest.
- (2)
- In the decoding process, we use an ACB to capture and refine the obtained features by enhancing the weights of the central crisscross positions to improve the convolutional layer’s representation capabilities.
- (3)
- We design an RFB to combine low-level spatial data with high-level abstract features to take advantage of feature information. The RFB can fully utilize the benefits of advantages of these aspects based on the representations of various levels.
- (4)
- To avoid the imbalance between the target and nontarget areas, which may cause the learning process to fall into the local minimum of the loss function and strongly bias the classifier toward the background class, we utilize a combination of the cross-entropy loss function and Dice loss function, which solves the sample imbalance issue.
The flowchart of the FCAU-Net is shown in Figure 1. It includes the CA, the ACB, and the RFB. The FCAU-Net solves the feature fusion problem of pixel-level segmentation and accurately extracts different types of contour information regarding target objects. Furthermore, the target item’s location, forms, and spatial distribution are more precise. The following section introduces the architecture and components of the FCAU-Net in detail. Experimental comparisons on two public remote sensing image datasets (ZY-3 and DeepGlobe) are provided in Section 3. A discussion is presented in Section 4. Finally, conclusions are drawn in Section 5.
2. Methodology
With the continuous improvement of the encoder-decoder network structure, feature information is more abstract, and the feature representation capacity of a network becomes more vital. Nevertheless, position data is lost during encoding and cannot be effectively restored during the upsampling process (as shown in Figure 2). The feature maps must be recovered to the same size as the original image in the decoding process, and the decoder combines low-level spatial characteristics with high-level abstract notions for simple summation or concatenation. Therefore, mainstream deep CNNs (DCNNs) are not capable of dealing with the feature fusion problem successfully.
To address the issue of long-term dependencies and feature fusion, we designed a semantic segmentation network (FCAU-Net) for fine-resolution remotely sensed imagery with the idea of an encoder-decoder structure. First, in the encoding process, we designed two stacked convolutional layers with an embedded CA module in each level. The CA module utilizes accurate position information to address the issues of encoding channel-wise relationships and long-term dependency correlations. Second, we used the ACB to acquire and enhance feature information in each encoder layer. Finally, the RFB in the feature fusion stage was designed to effectively fuse different level features, thereby eliminating background noise and reducing the fitting residuals after feature fusion; this improved the segmentation performance of the network. The overall architecture of the proposed FCAU-Net is shown in Figure 3.
2.1. CA Module
Capturing the long-range dependencies of features through horizontal and vertical attention maps, CA can embed position information into channel attention. To construct an accurate position information model, two steps are required: coordinate information embedding (CIE) and CA generation (CAG). The CA module designed in this study is shown in Figure 4.
In Figure 4, any feature tensor is taken as input, where C, H, and W are the pixel sizes along the channel dimension, height, and width of the feature tensor X, respectively. Given the input X in the attention block, we utilized two spatial pooling kernels, (H, 1) or (1, W), to acquire a pair of 1D vectors along the horizontal coordinate and the vertical coordinate. Thus, the output of the c-th channel at a height h and at a width w can be written as:
Specifically, CAG combines the feature maps extracted via CIE. We first performed the concatenation operation to obtain feature maps and then sent them to a shared 1 × 1 convolution transformation function F1 to compress the channels, yielding:
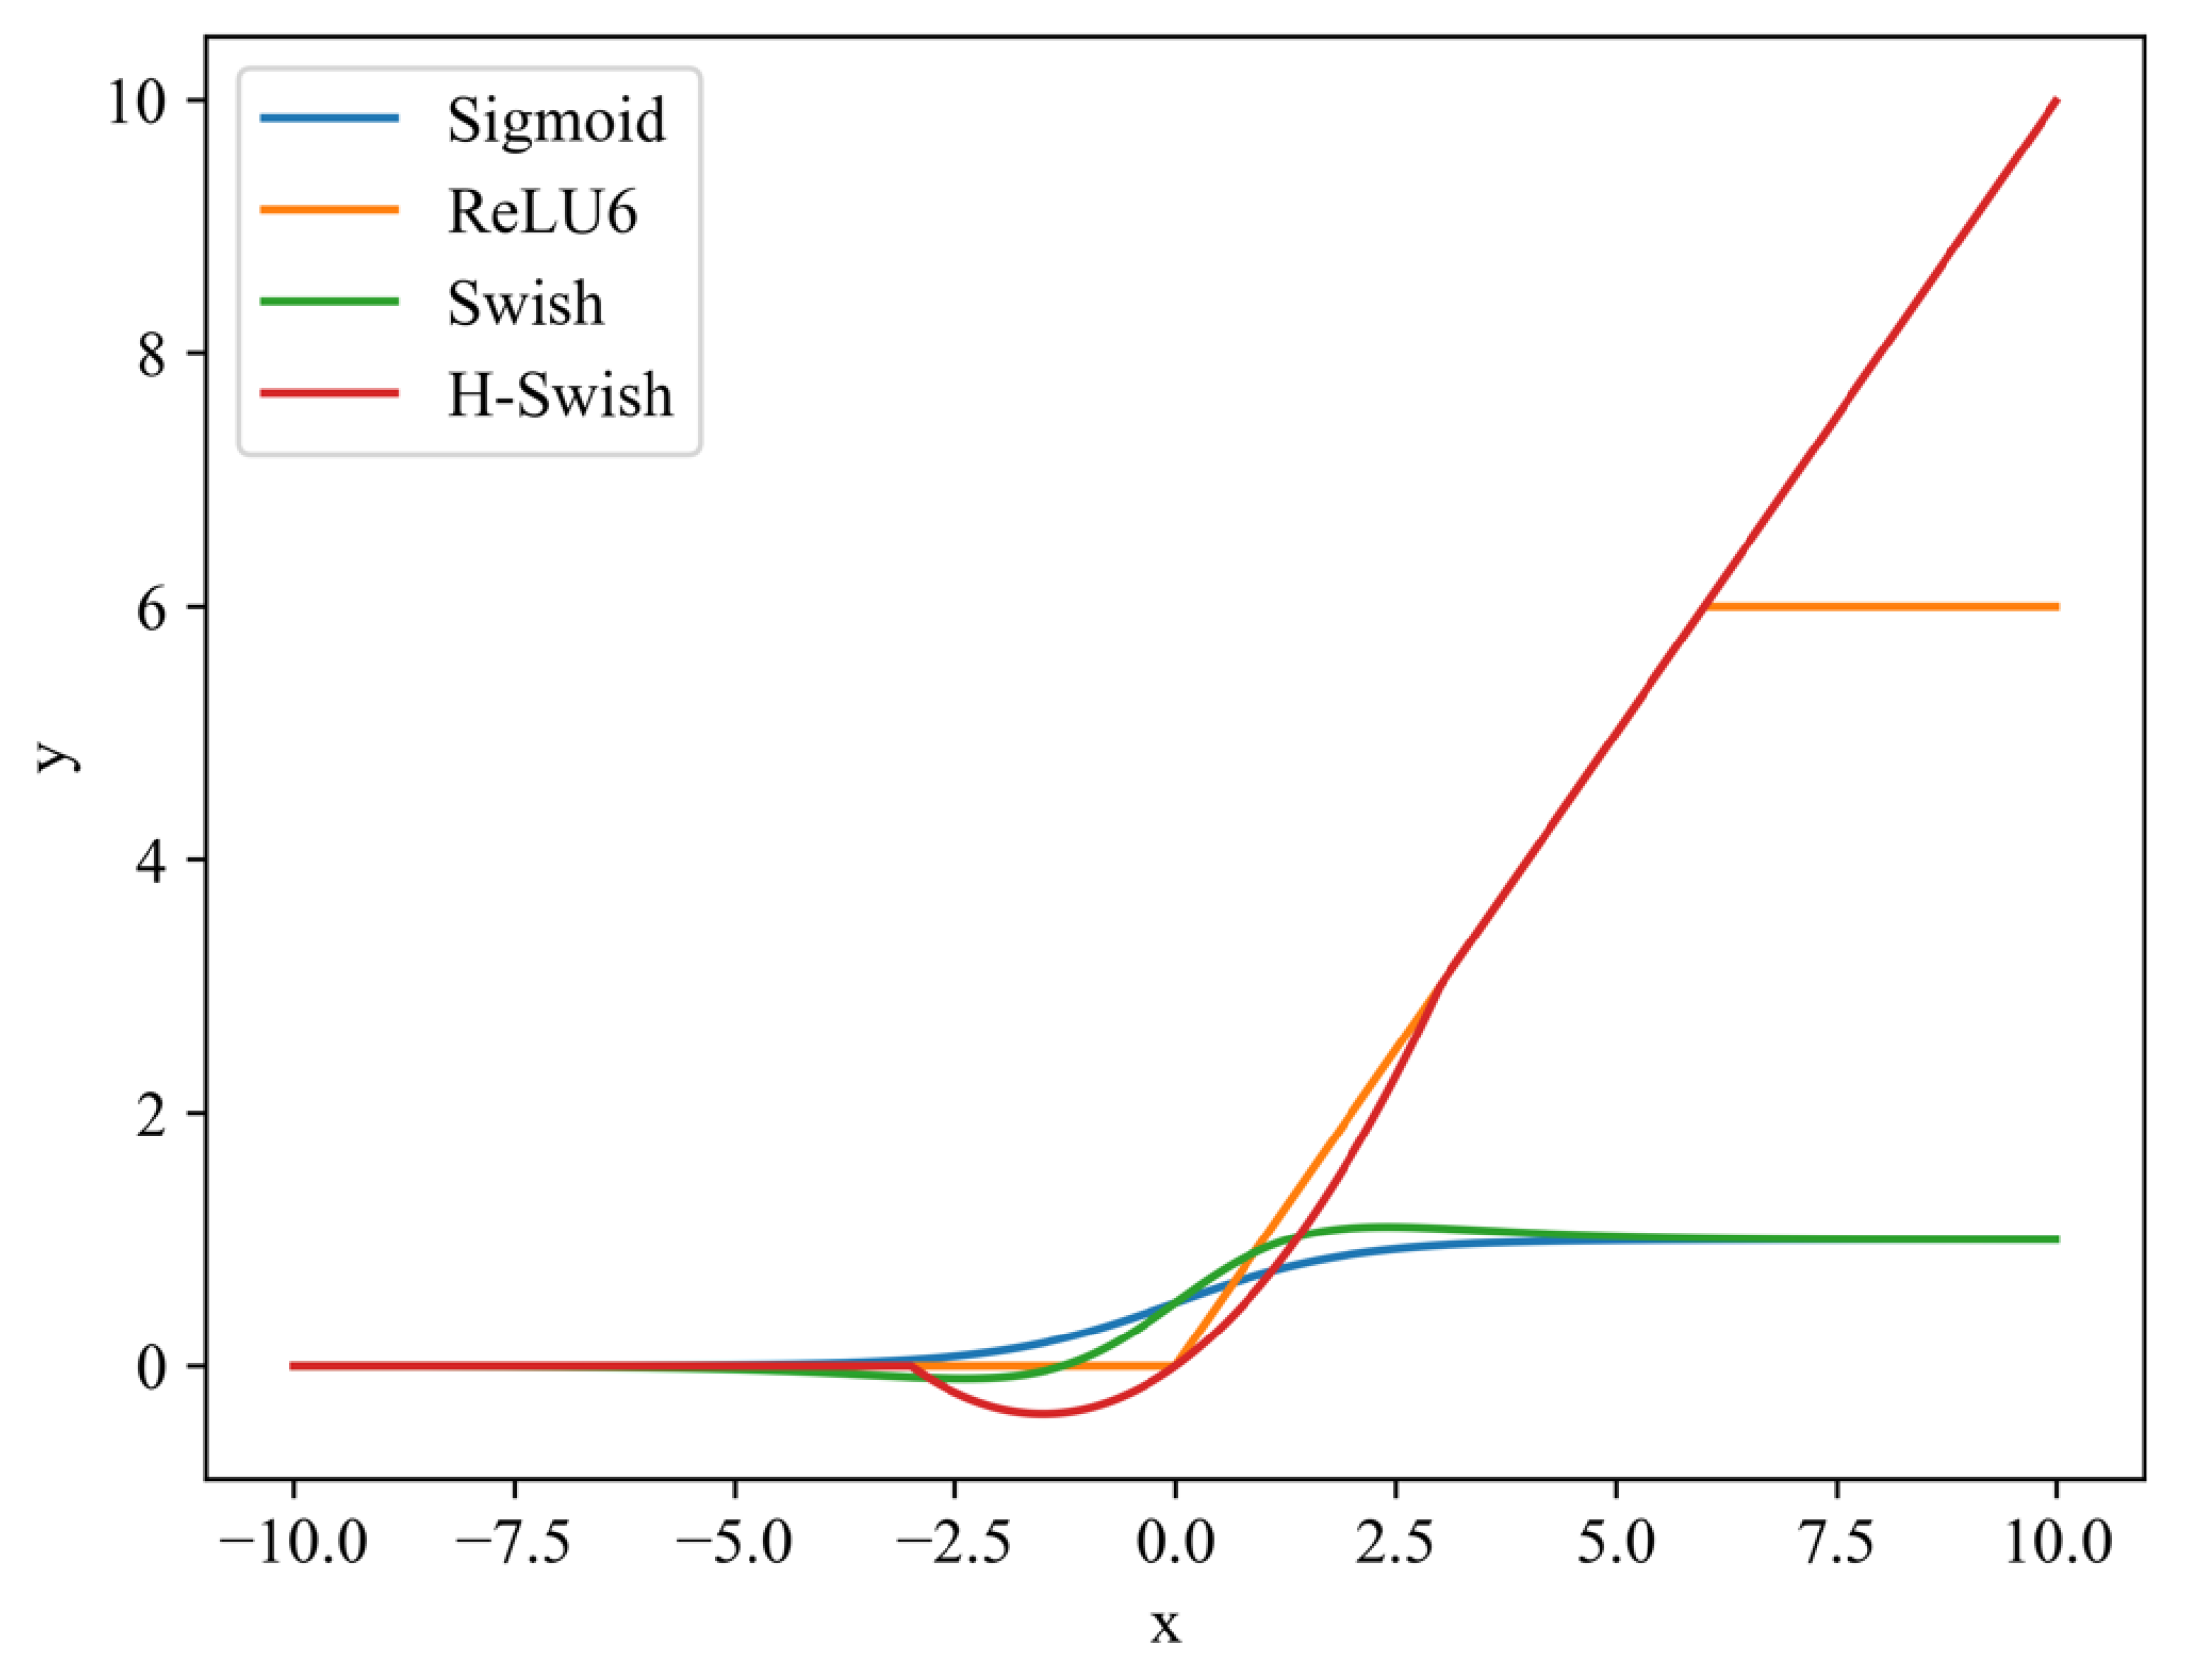
where [▪, ▪] is the spatial dimension concatenation procedure and is the intermediate feature map that encodes spatial information in the horizontal and vertical directions. Specifically, δ denotes the hard-Swish nonlinear activation function, which is utilized instead of the sigmoid layer in the rectified linear unit 6 (ReLU6) and SE blocks. The effect of hard-Swish activation on the deep model is better than that of the commonly used ReLU and Swish models, and the hard-Swish activation function is shown as follows:
The performance of the hard-Swish nonlinear activation function and other related activation functions is shown in Figure 5.
Then, the feature maps were encoded by combing batch normalization (BN) and non-Linear. f is split into two tensors along the spatial dimension: and . Two 1 × 1 convolutional transformation functions Fh and Fw were used to transform fh and fw into tensors with the same dimensions as those of the input X.
where σ is the sigmoid function, which smoothly maps the real number domain to [0, 1], and gh and gw are exaggerated and utilized as attention weights. The output of the CA mechanism Y is described as:
2.2. ACB Module
As mentioned in [52], the amplitudes of the weights of the middle crisscross spots (i.e., the nuclear skeleton) are bigger. Still, the points in the corners offer less information regarding feature extraction and the standard convolution kernel refines features unevenly. Therefore, we introduced the ACB in each decoder layer to generate a smooth image (as shown in Figure 6). The ACB uses three branches: the 3 × 3 convolution captures features through a relatively large receptive field. In contrast, the 1 × 3 convolution and 3 × 1 convolution achieve crisscross receptive fields, ensuring the relevance of the skeletal characteristics and expanding the network’s depth. Then, to obtain fusion results, the three distinct convolution feature maps were combined. Finally, a BN and a ReLU were utilized to improve the numerical stability of the process and activate the output in a nonlinear manner. The calculation of the ACB is expressed as:
where and are the output and input of the ACB, respectively. v is the variance function of the input, and u is the expectation of the input. represents a tiny constant that ensures numerical stability. γ and β are two trainable parameters for the BN layer, where γ scales the normalization result and β shifts it. σ indicates the ReLU activation function.
2.3. RFB Module
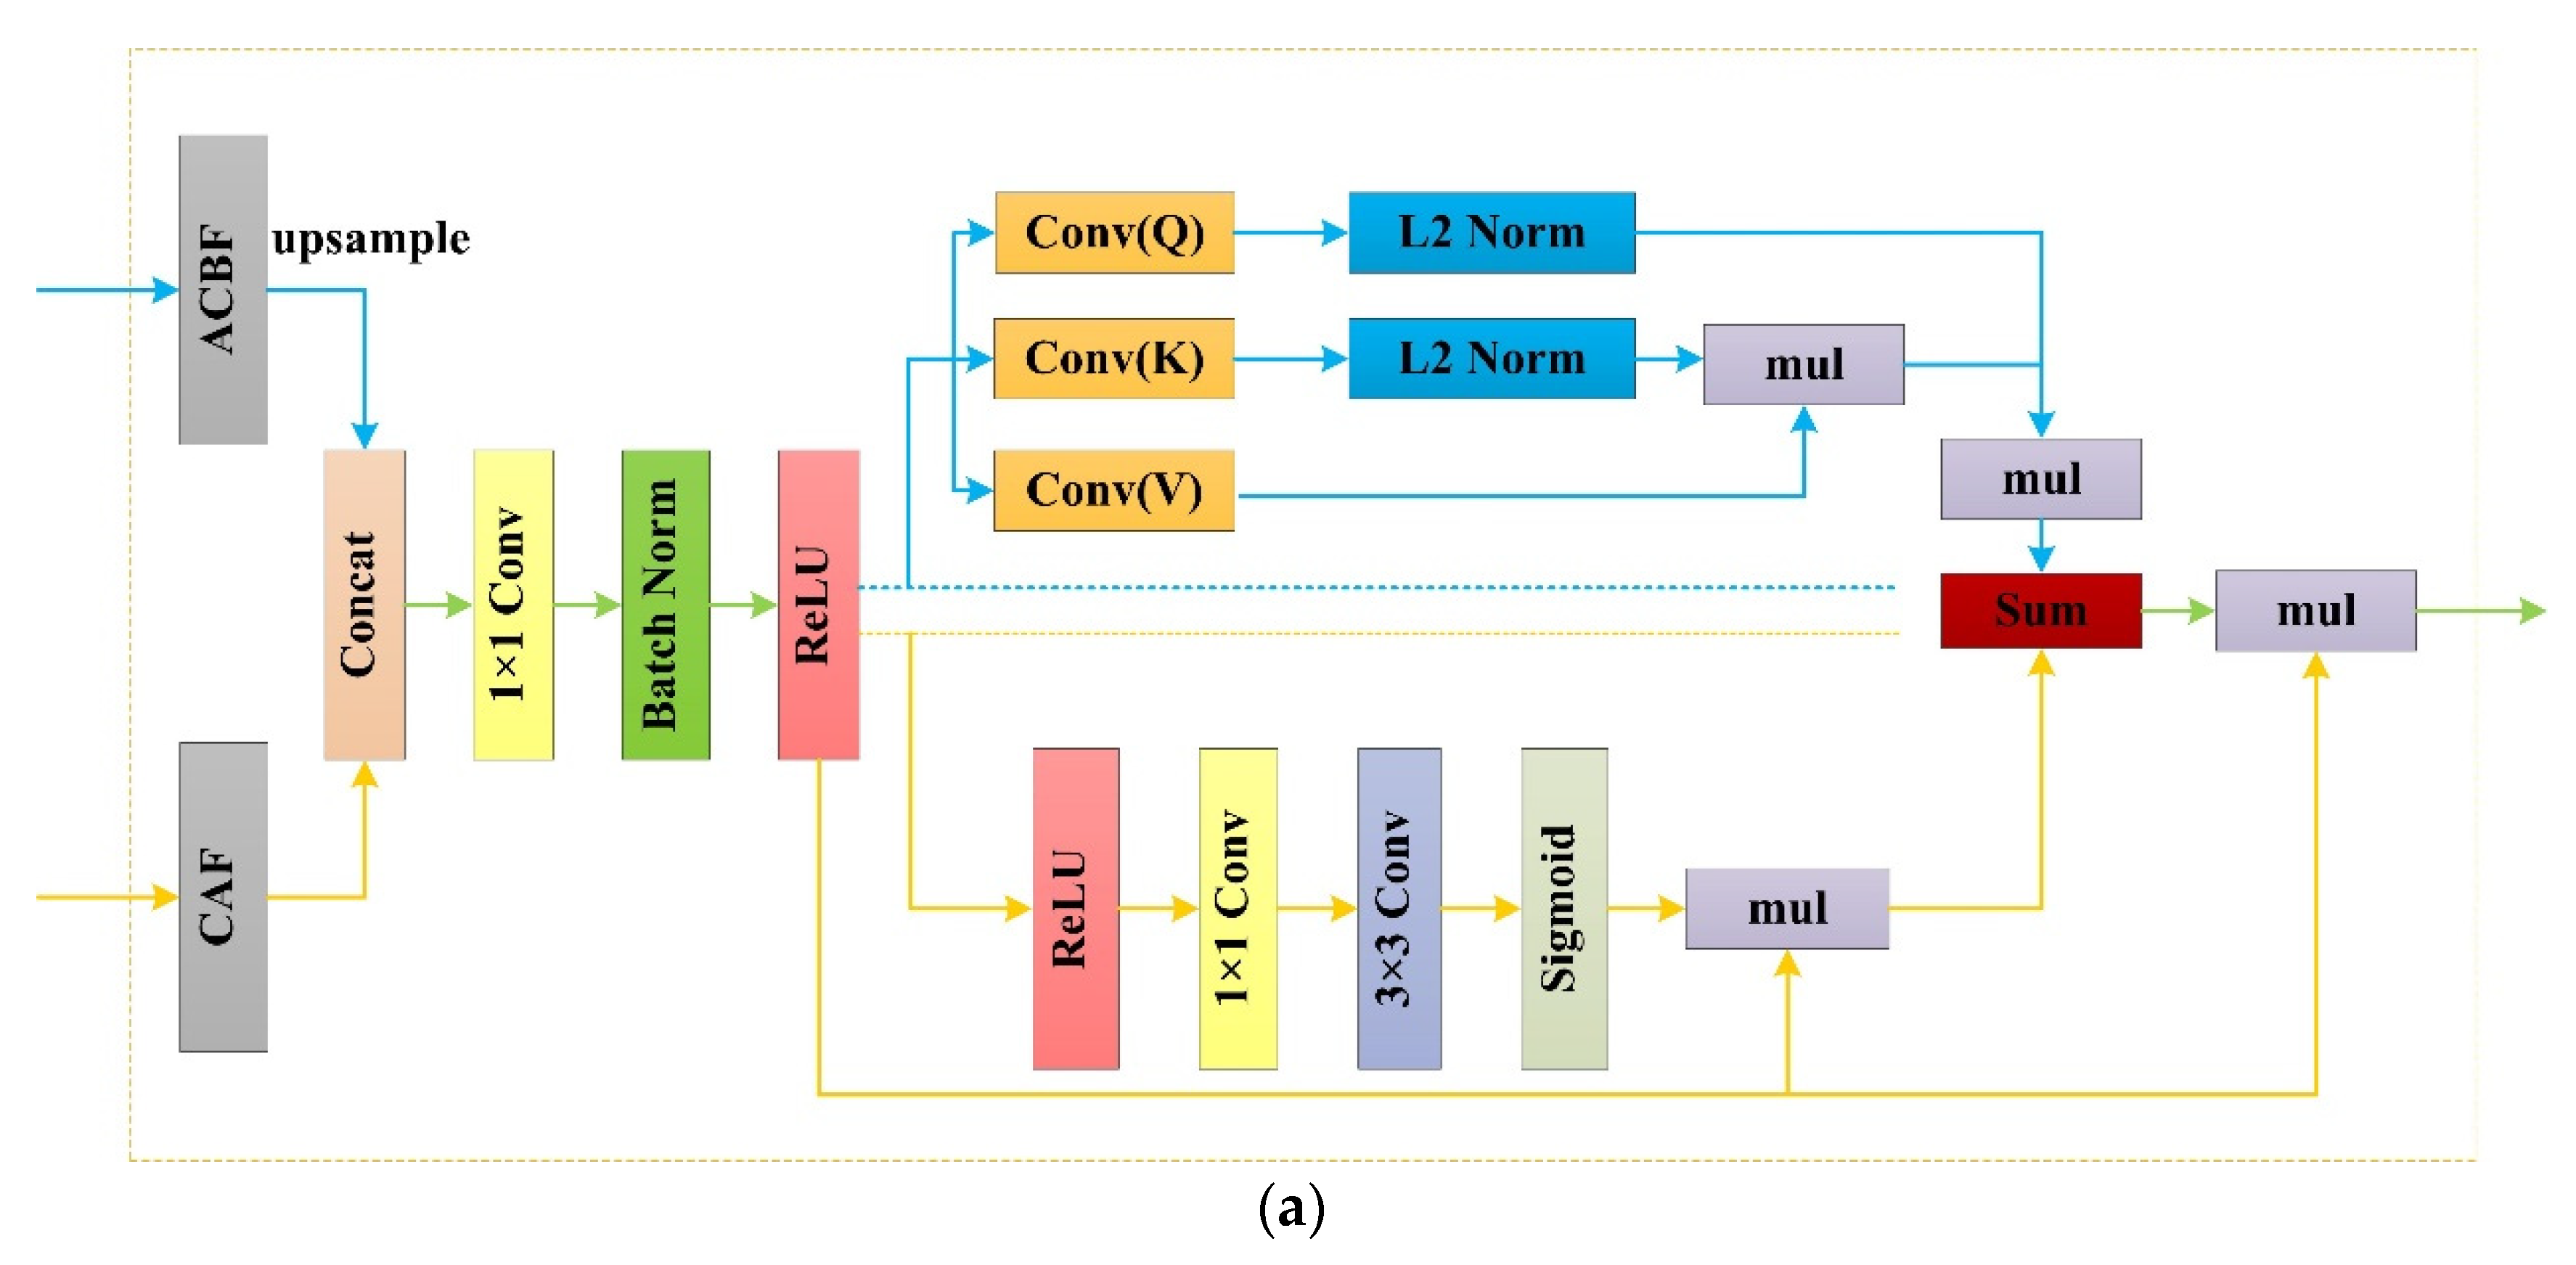
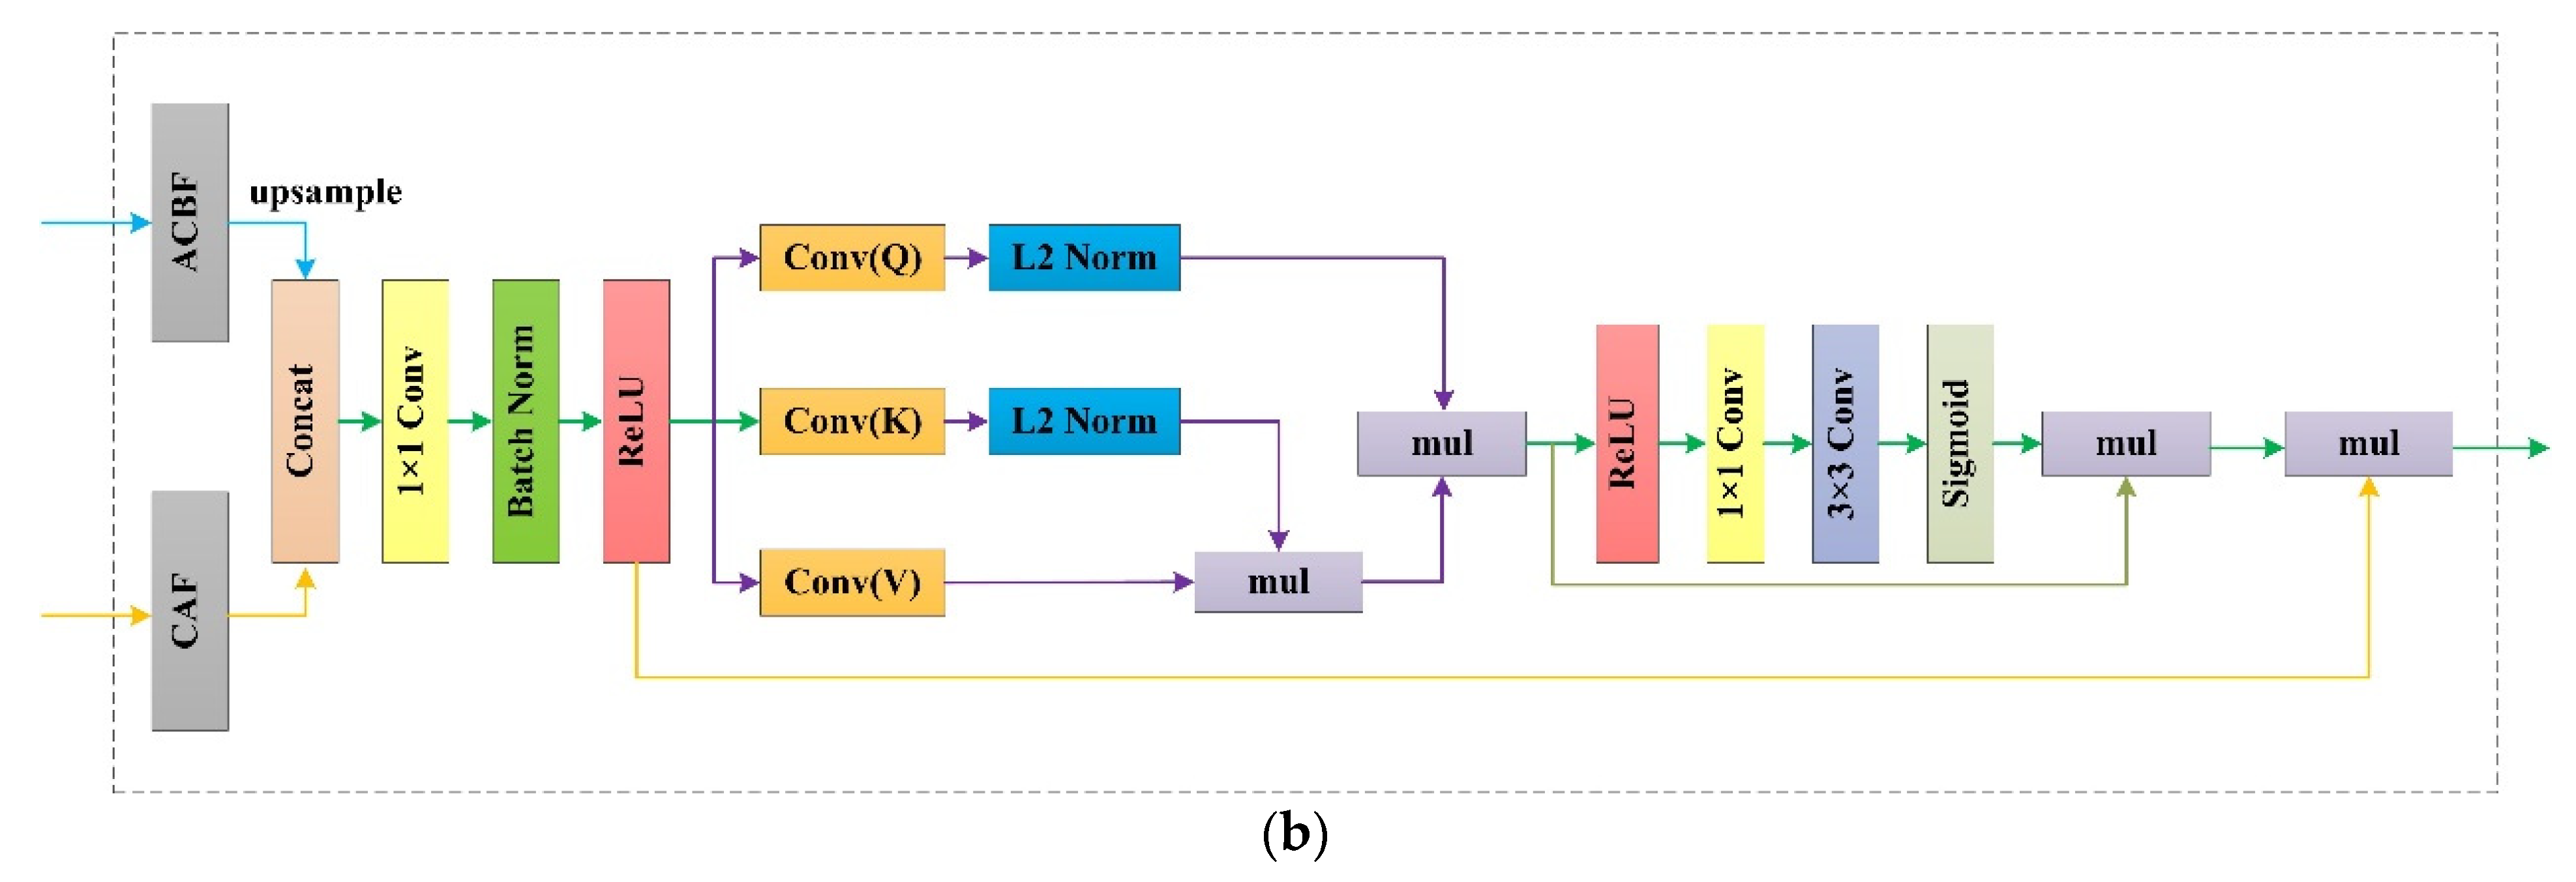
With the application of DCNN, the repeated pooling layers and stride convolutions led to the loss of a quantity of feature information during the process of feature extraction. In addition, the shallow feature mappings of the network contained rough semantics, thus introducing noise information into the target object extraction process. Therefore, to effectively unitize different level features information, we designed the RFB, which is composed of three parts, namely, a feature aggregation module (FAM), a linear attention module (LAM), and a compact spatial attention module (CSAM). Furthermore, we constructed parallel and serial connections to link the LAM and CSAM, and the structures are shown in Figure 7a,b.
The low-level features have the advantage of high spatial resolution, maintaining complete spatial information, and are sensitive to gradient changes at different points. The high-level features have fully extracted abstract information. Therefore, the purpose of the RFB is to comprehensively utilize the advantages of low-level spatial information and high-level semantic information to obtain refined aggregation features. The input features of the RFB involve the CA features (CAFs) and ACB features (ACBFs). Then, the fusion characteristics are subjected to a convolution operation, a BN operation, and a ReLU activation function to obtain aggregate features (AFs), which are fusions of different level information flows. The specific expression is as follows:
where C denotes the concatenation function. U indicates a two-scale factor upsampling technique. • indicates the convolution process. is a size of n × n convolutional kernel. b denotes the bias vector, and x is the input pixel. is a 1 × 1 convolutional layer. fBN denotes batch normalization. fReLU indicates the activation function of the corrected linear unit.
Next, the AFs were subject to background noise elimination and residual reduction fitting to achieve refinement feature maps (RFs). Finally, a matrix multiplication technique between the AFs and RFs was executed to achieve a refined aggregation feature (RAF). The specific expression is as follows:
LAM: The LAM cements the spatial relationships among the AFs, thus restraining the fitting residuals. Supposing that the normalization function is softmax, the i-th row in the output matrix produced by the dot-product attention mechanism can be written as:
Then, Equation (15) can be generalized and rewritten as:
According to the first-order approximation of the Taylor expansion in Equation (15), we designed the LAM, which distinguishes the feature of our study from the mechanisms utilized in previous studies.
However, the above approximation cannot ensure the nonnegative property of the normalization function. Therefore, we normalize qi and kj by the l2 norm to guarantee that .
Equation (16) can be rewritten as Equations (19) and (20):
The vectorized form of Equation (20) is:
where and can be calculated once and then reutilized for each query.
3. Experimental Results
3.1. Datasets
To assess the effectiveness of the FCAU-Net, experiments were conducted on two public datasets. These datasets consist of remotely sensed cultivated land images obtained by Ziyuan-3 satellite sensors (ZY-3) and building images extracted from the Digital Earth Worldview-3 satellite sensor (DeepGlobe). Furthermore, the ZY-3 dataset was used for the MathorCup University Mathematical Modeling Challenge in 2021 (https://www.saikr.com/c/nd/7256, accessed on 23 November 2021). The DeepGlobe dataset was employed in the SpaceNet (https://registry.opendata.aws/spacenet, accessed on 23 November 2021) Building Detection Challenge.
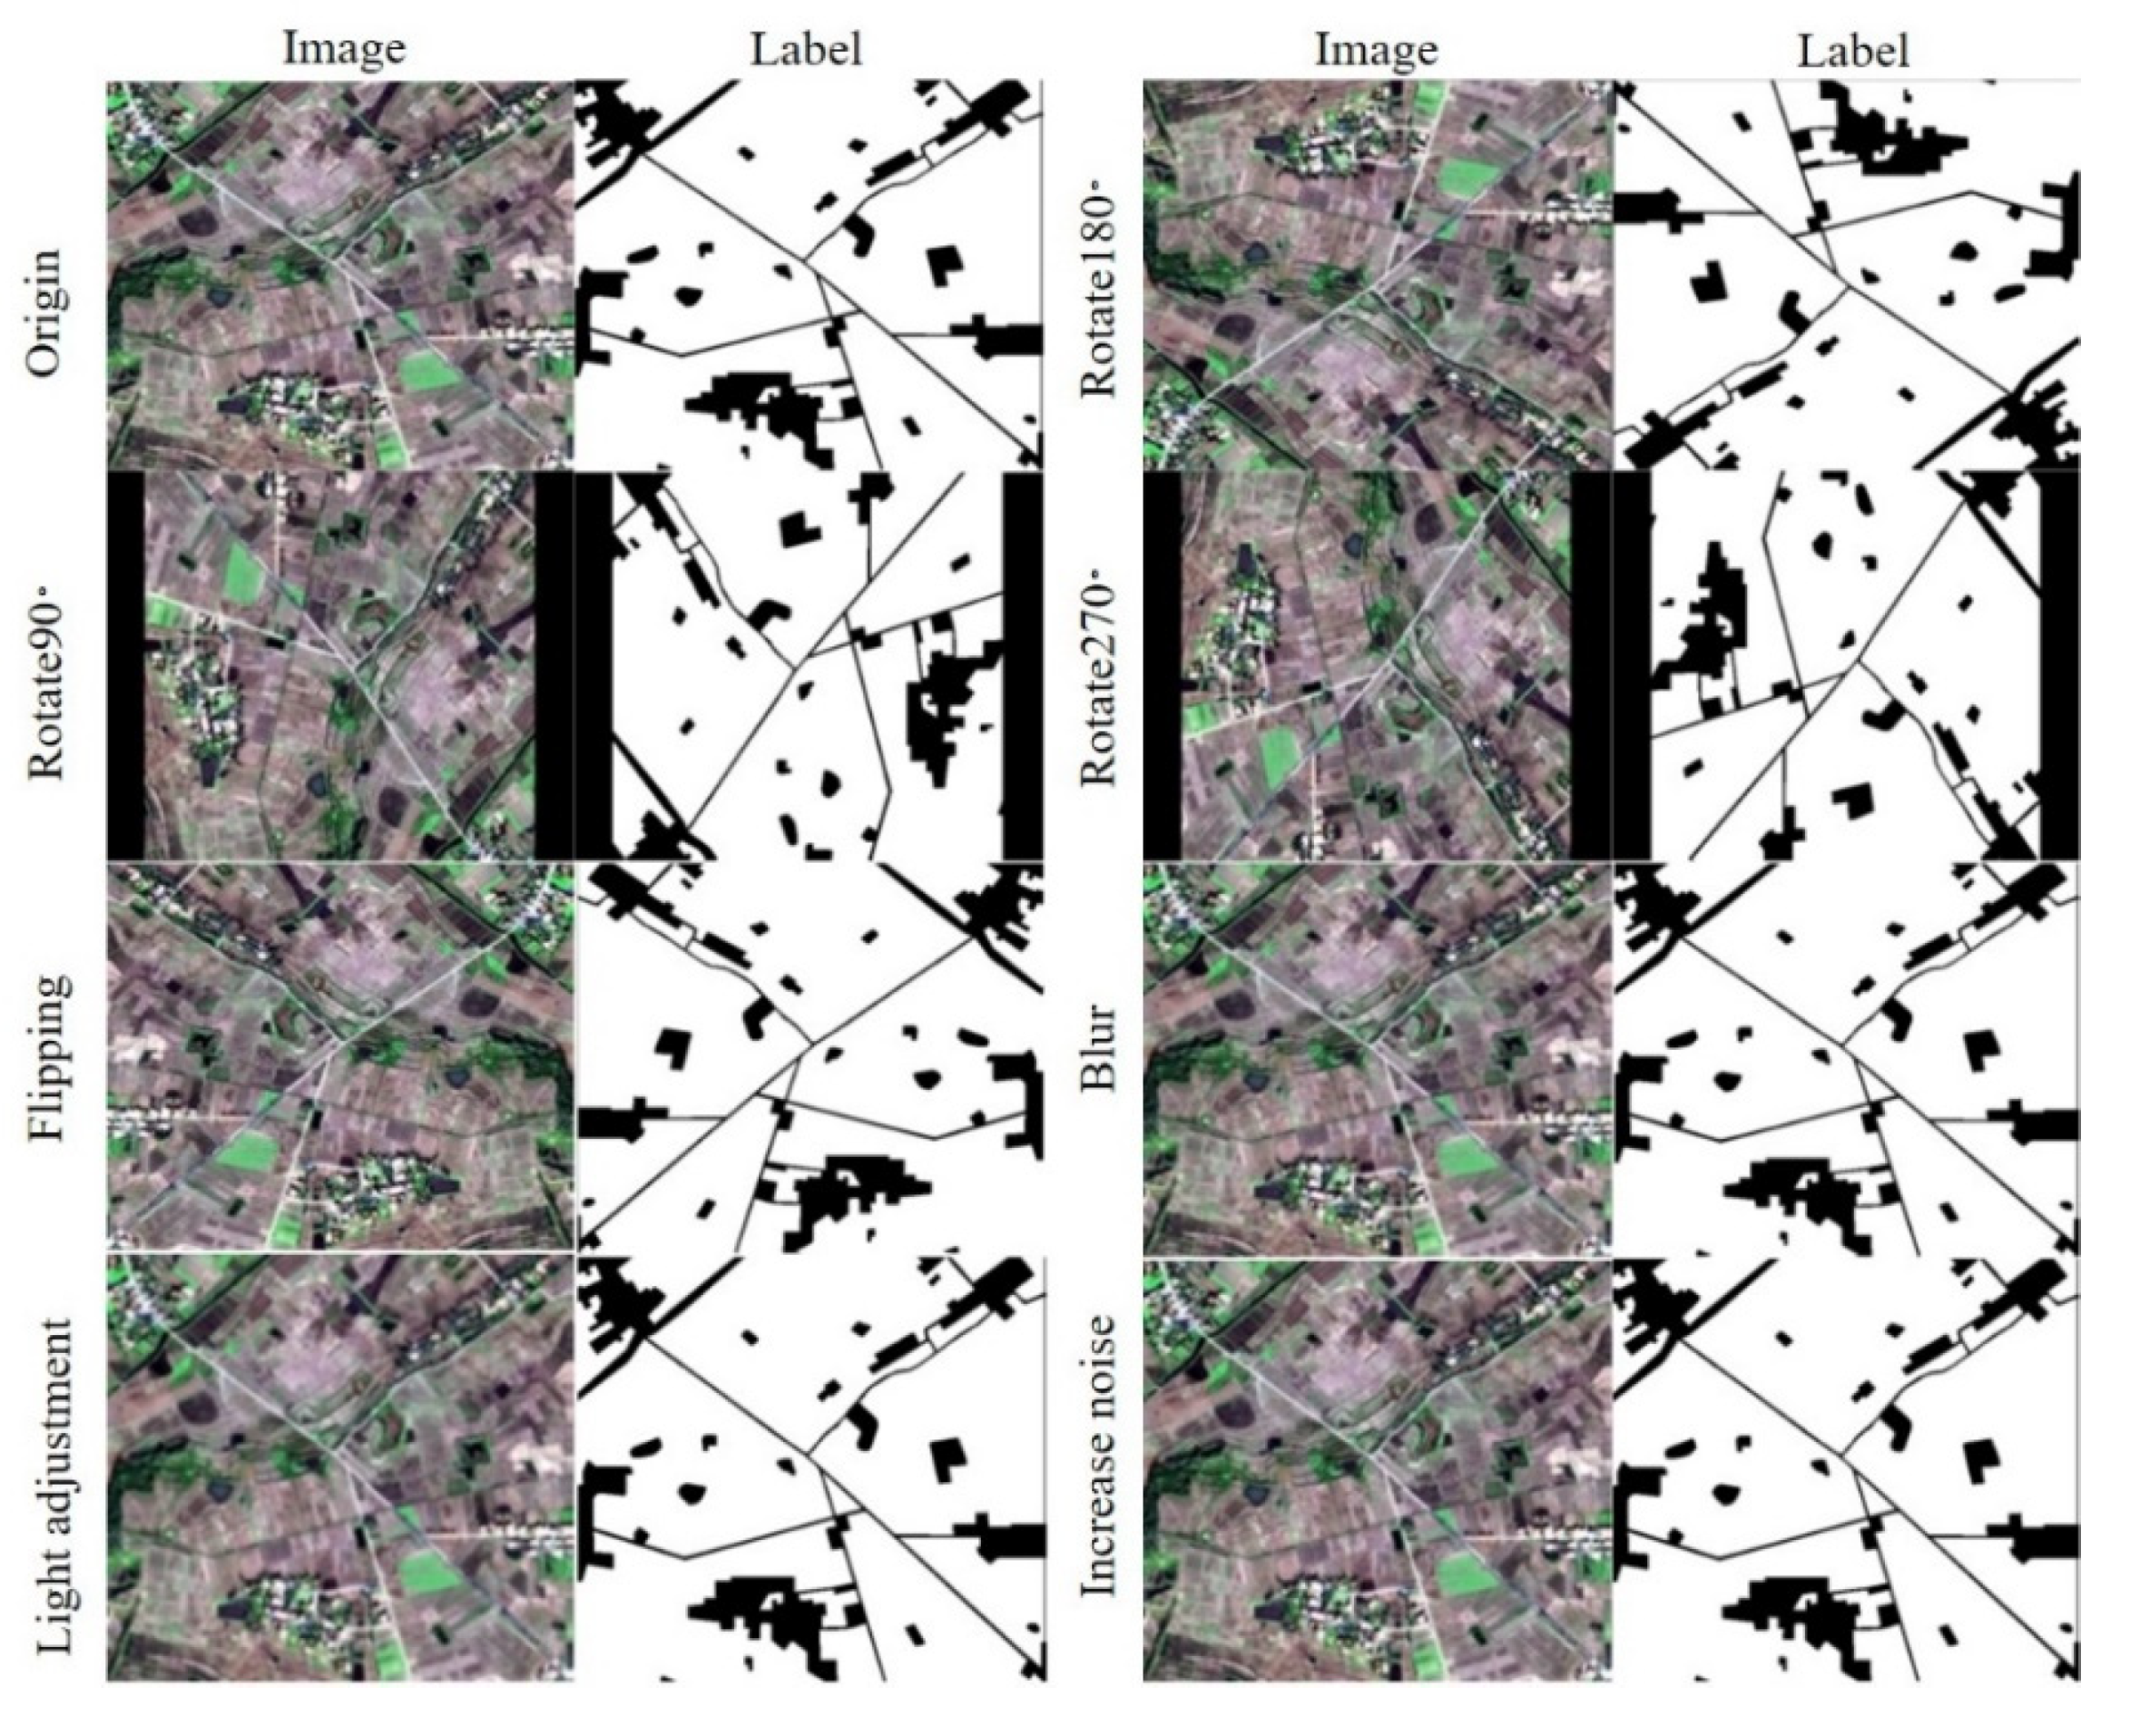
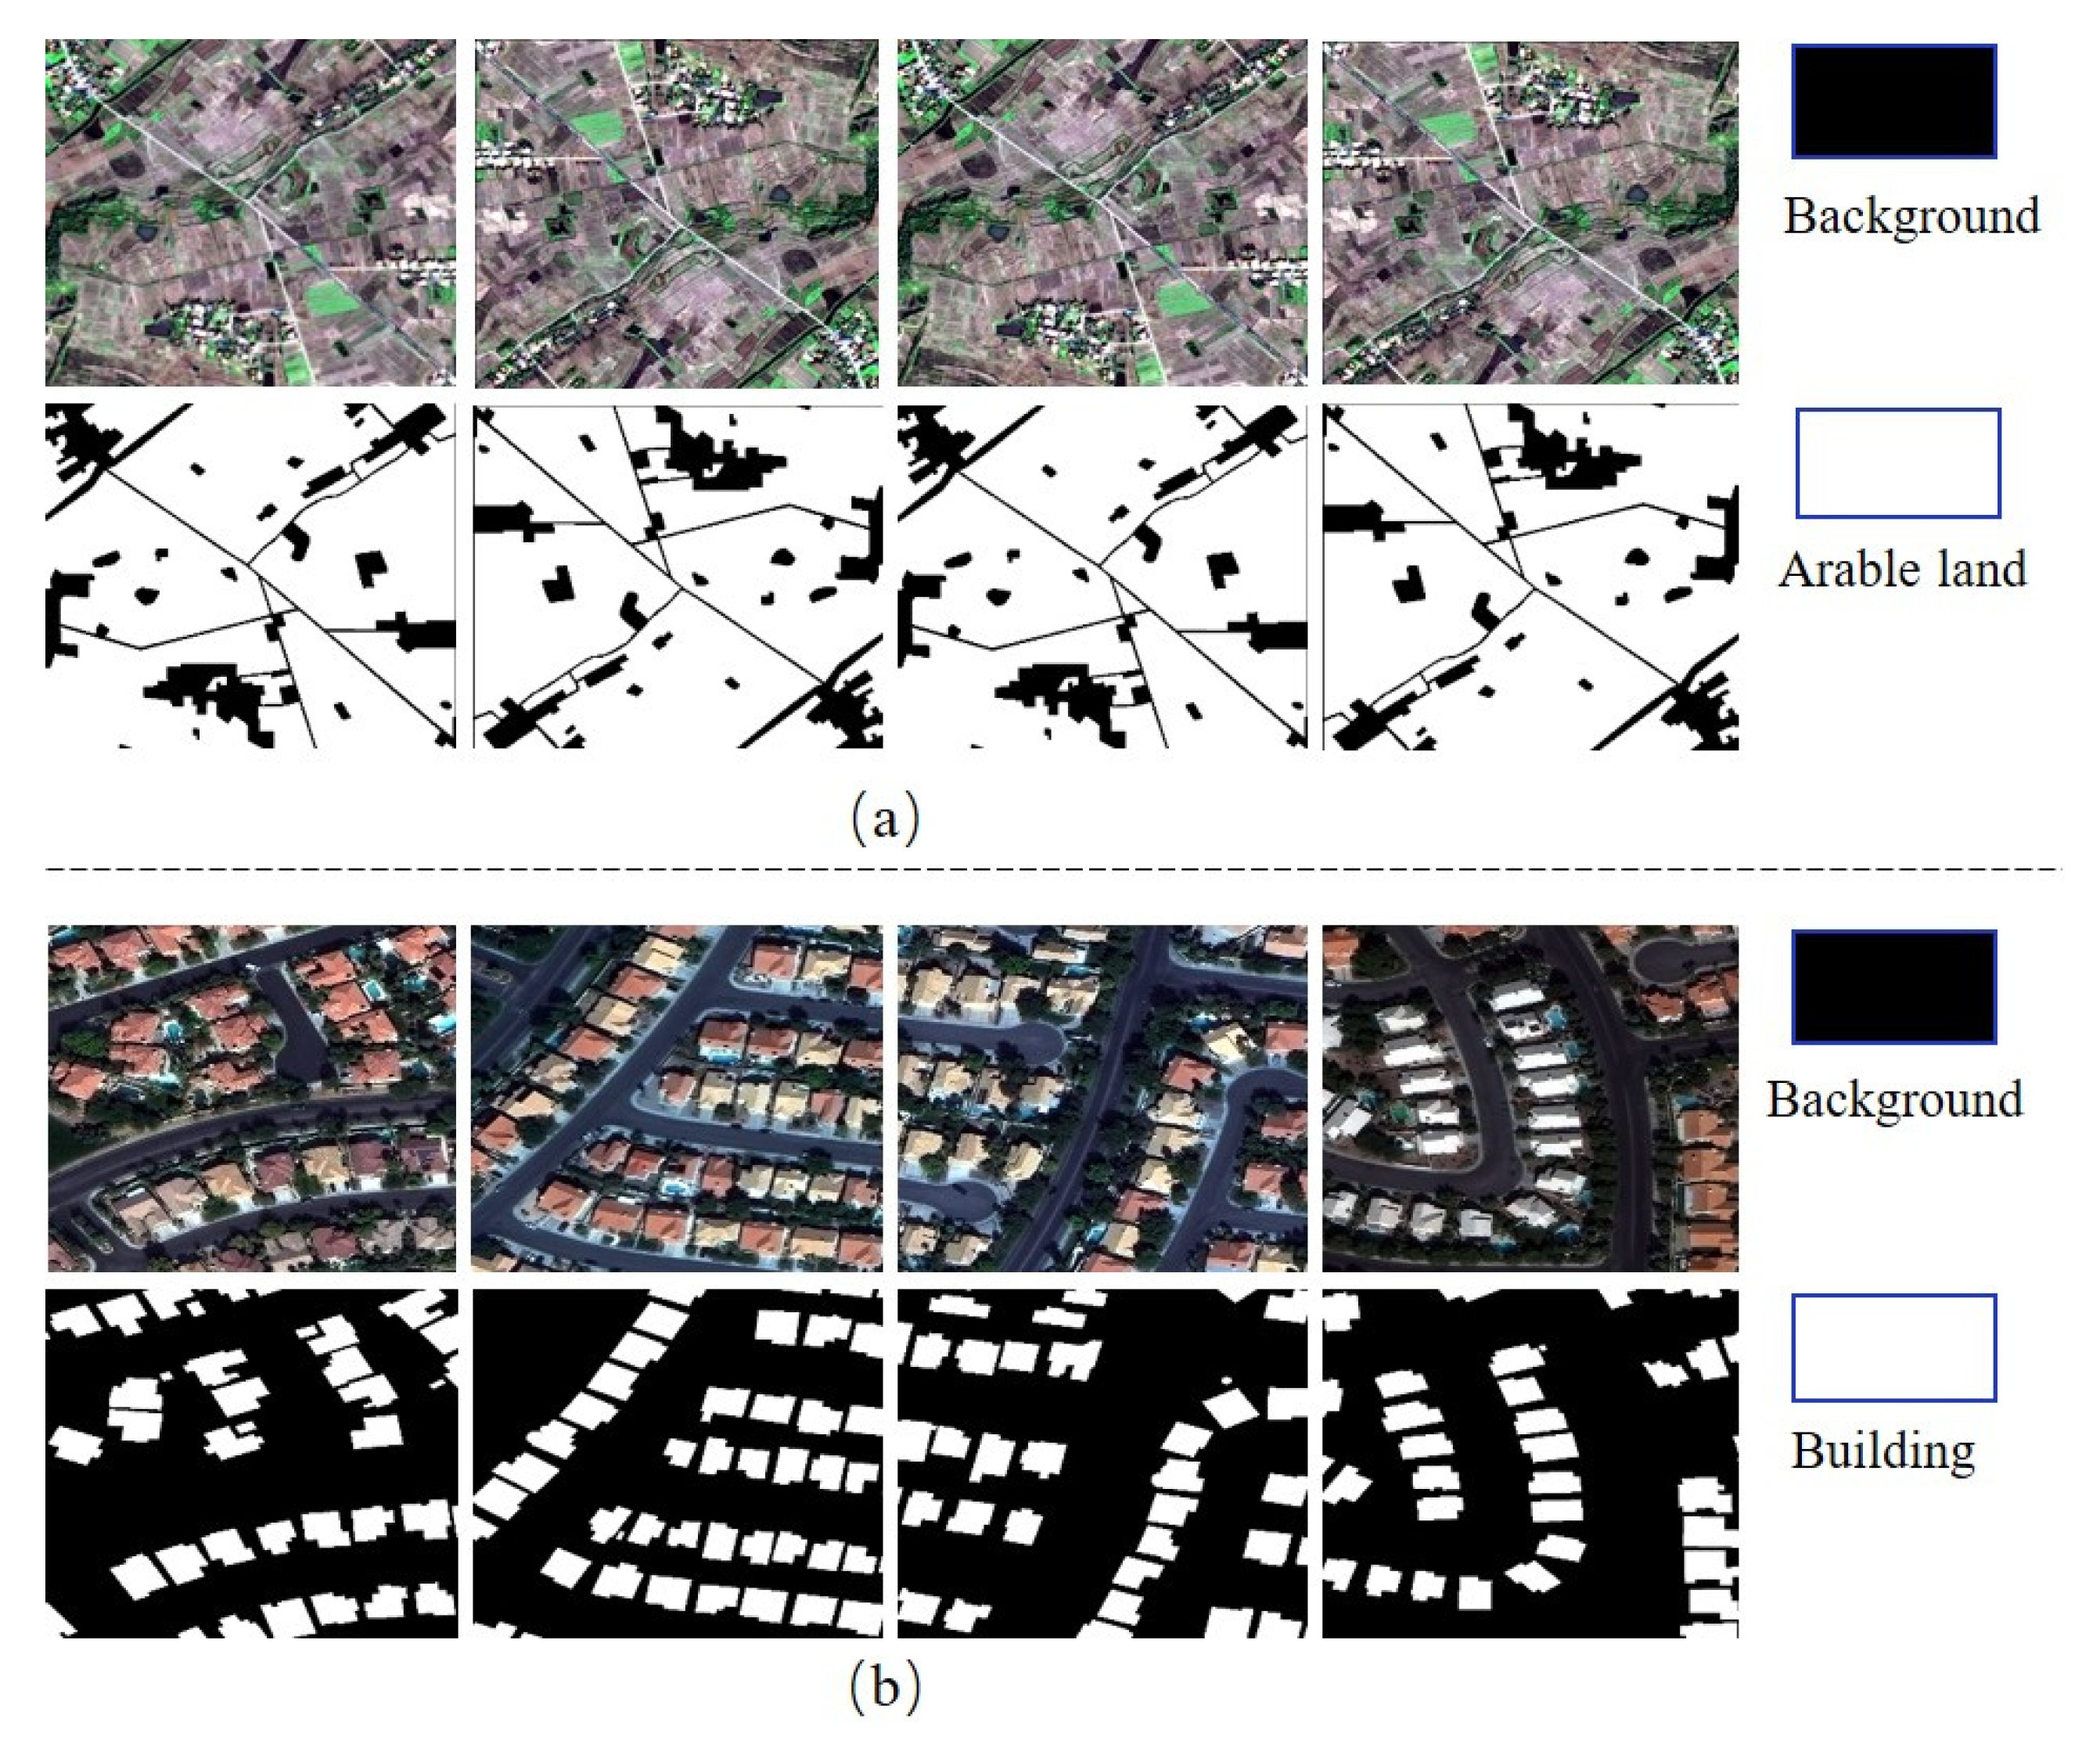
ZY-3 dataset: The spectrum contains visible bands (i.e., red, green, and blue). The images are labeled with two classes (background and arable land) with spatial resolutions of 2 m and 600 × 500 pixels. Considering that a small number of dataset samples can cause difficulties during model training, a series of enhancement methods (e.g., rotation by 90°, rotation by 180°, rotation by 270°, flipping, light adjustment, blurring, and adding increased noise) were used to expand the training dataset to 3000. The dataset was then split randomly into a training set, validation set, and test set at a ratio of 8:1:1. Examples of augmented images are shown in Figure 8.
DeepGlobe dataset: The source images detected by the Worldview-3 satellite sensor, which contain RGB and 8-band multispectral data including 302,701 building footprints with 30 cm ground sample distances (GSDs). The dataset includes 650 × 650-pixel images of all areas of interest and is labeled with two classes (background and building). In this experiment, the Las Vegas subsets were selected to evaluate the generalization performance of the proposed algorithm. Approximately 151,367 buildings were utilized, covering over 216 km2. Finally, the dataset was randomly divided into training/validation/testing subsets at a ratio of 8:1:1. Example images and labels from both the ZY-3 dataset and the DeepGlobe dataset are shown in Figure 9.
3.2. Implementation Details
We used the PyTorch framework on the Windows 10 platform with an NVIDIA GeForce RTX3090 24 GB GPU to complete the training and testing processes in this study. The best hyperparameters were selected based on a comparison of the results obtained from repeated experiments. The input size and batch size were set to 480 × 480 × 3 and 8, respectively. The number of training epochs was 100. Adam [53] was chosen as an optimizer, with an initial learning rate of 0.001, and β1 and β2 were set to their default values as recommended, namely β1 = 0.9, β2 = 0.999. Furthermore, we combined the cross-entropy loss function and Dice loss function to calculate the differences between the obtained segmentation maps and the ground reference, and both ratio coefficients were set to 1:1. Finally, to assess the performance of the FCAU-Net, U-Net [33], Attention U-Net [54], the PSPNet [37], DeepLab v3+ [55], the MAResU-Net [35], MACU-Net [18], and the TransUNet [56] were implemented.
The Loss Function
As the number of non-target pixels in most scenes is substantially more than the number of target pixels, the effect of class imbalance may lead the learning process to become caught in a local minimum of the loss function, severely biasing the classifiers toward the background class [57,58]. To tackle the issue of class disparities, the objective function was calculated by the Dice loss and cross-entropy function with a pixel-wise softmax function over the final feature maps. The formulas are expressed as:
where yi and pi indicate the pixel values of the ground truth (GT) and the predicted probability map achieved through the sigmoid function, respectively. The total number of pixels is denoted by N. In our experiment, α = β = 1.0, ε represents a factor that is applied to smooth the loss and gradient, where .
3.3. Evaluation Metrics
To quantitatively assess the performance of the FCAU-Net, we estimated the accuracy of the target extraction results based on the associated confusion matrix. The form of the confusion matrix is shown in Table 1. In the confusion matrix, the true positive (TP) entries represent the number of positives that are predicted to be positive, the false positive (FP) entries indicate the number of negatives that are predicted to be positive, and the true negative (TN) and false negative (FN) entries refer to the number of negative and positive results that are predicted to be negative, respectively.
Based on the confusion matrix, we used the mean intersection over union (mIoU), pixel accuracy (PA), mean pixel accuracy (mPA), and frequency-weighted IoU (FWIoU) as the critical evaluation metrics to calculate the difference between the predicted mask and the GT. The mIoU, PA, mPA, and FWIoU are calculated as:
where n is the total number of categories (including background categories). Pii and Pij are the total numbers of pixels belonging to true pixel category i that are predicted to belong to i and j, respectively.
3.4. Experimental Results
We evaluated the accuracy of the FCAU-Net and other architectures on the ZY-3 and DeepGlobe datasets (as shown in Table 2) based on the PA, mPA, mIoU, and FWIoU evaluation metrics. According to the calculation results, the FCAU-Net not only has obvious advantages over the contextual information aggregation methods (e.g., DeepLab v3+ and the PSPNet) that were originally designed for natural images but also outperformed the latest feature aggregation models (e.g., the MAResU-Net and MACU-Net). In addition, the proposed FCAU-Net transcends the TransUNet (which is an architecture based on the latest Transformer), achieving the highest PA of 97.97%, mPA of 98.53%, mIoU of 95.17%, and FWIoU of 96.07% on the ZY-3 dataset. The PA, mPA, mIoU, and FWIoU are 0.82%, 0.78%, 1.86%, and 1.52% higher than those of the TransUNet, respectively. For the DeepGlobe dataset, the proposed FCAU-Net achieves 95.05% PA, 91.27% mPA, 85.54% mIoU, and 90.74% FWIoU, bringing an immediate 0.77% increase in PA, a 1.08% increase in mPA, a 1.96% increase in the mIoU, and a 1.31% increase in the FWIoU over the values of the TransUNet. Therefore, the proposed FCAU-Net is effective and stable.
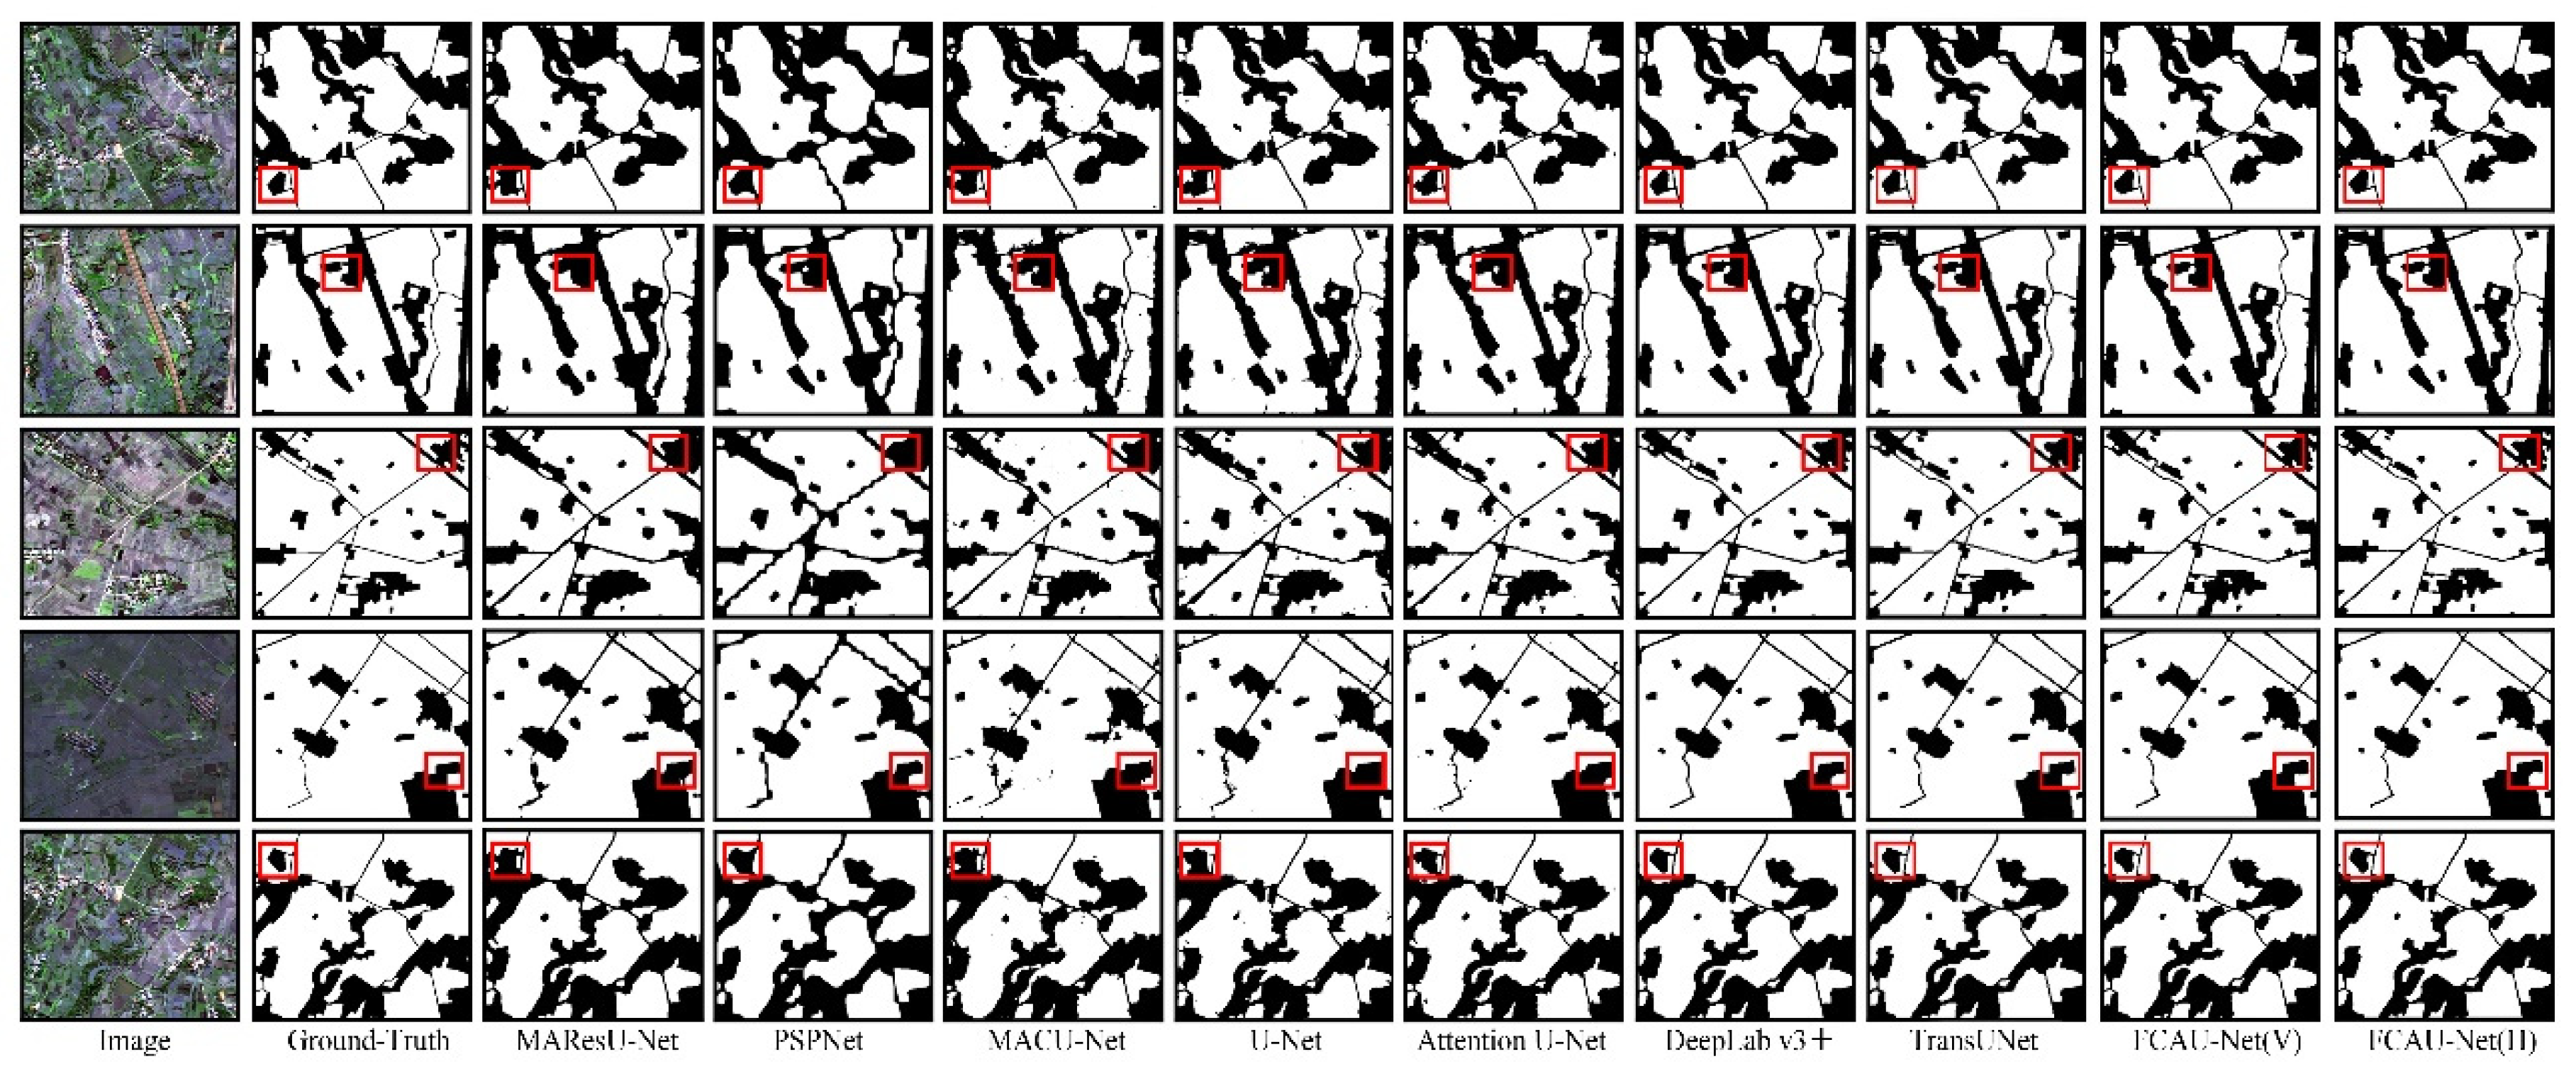
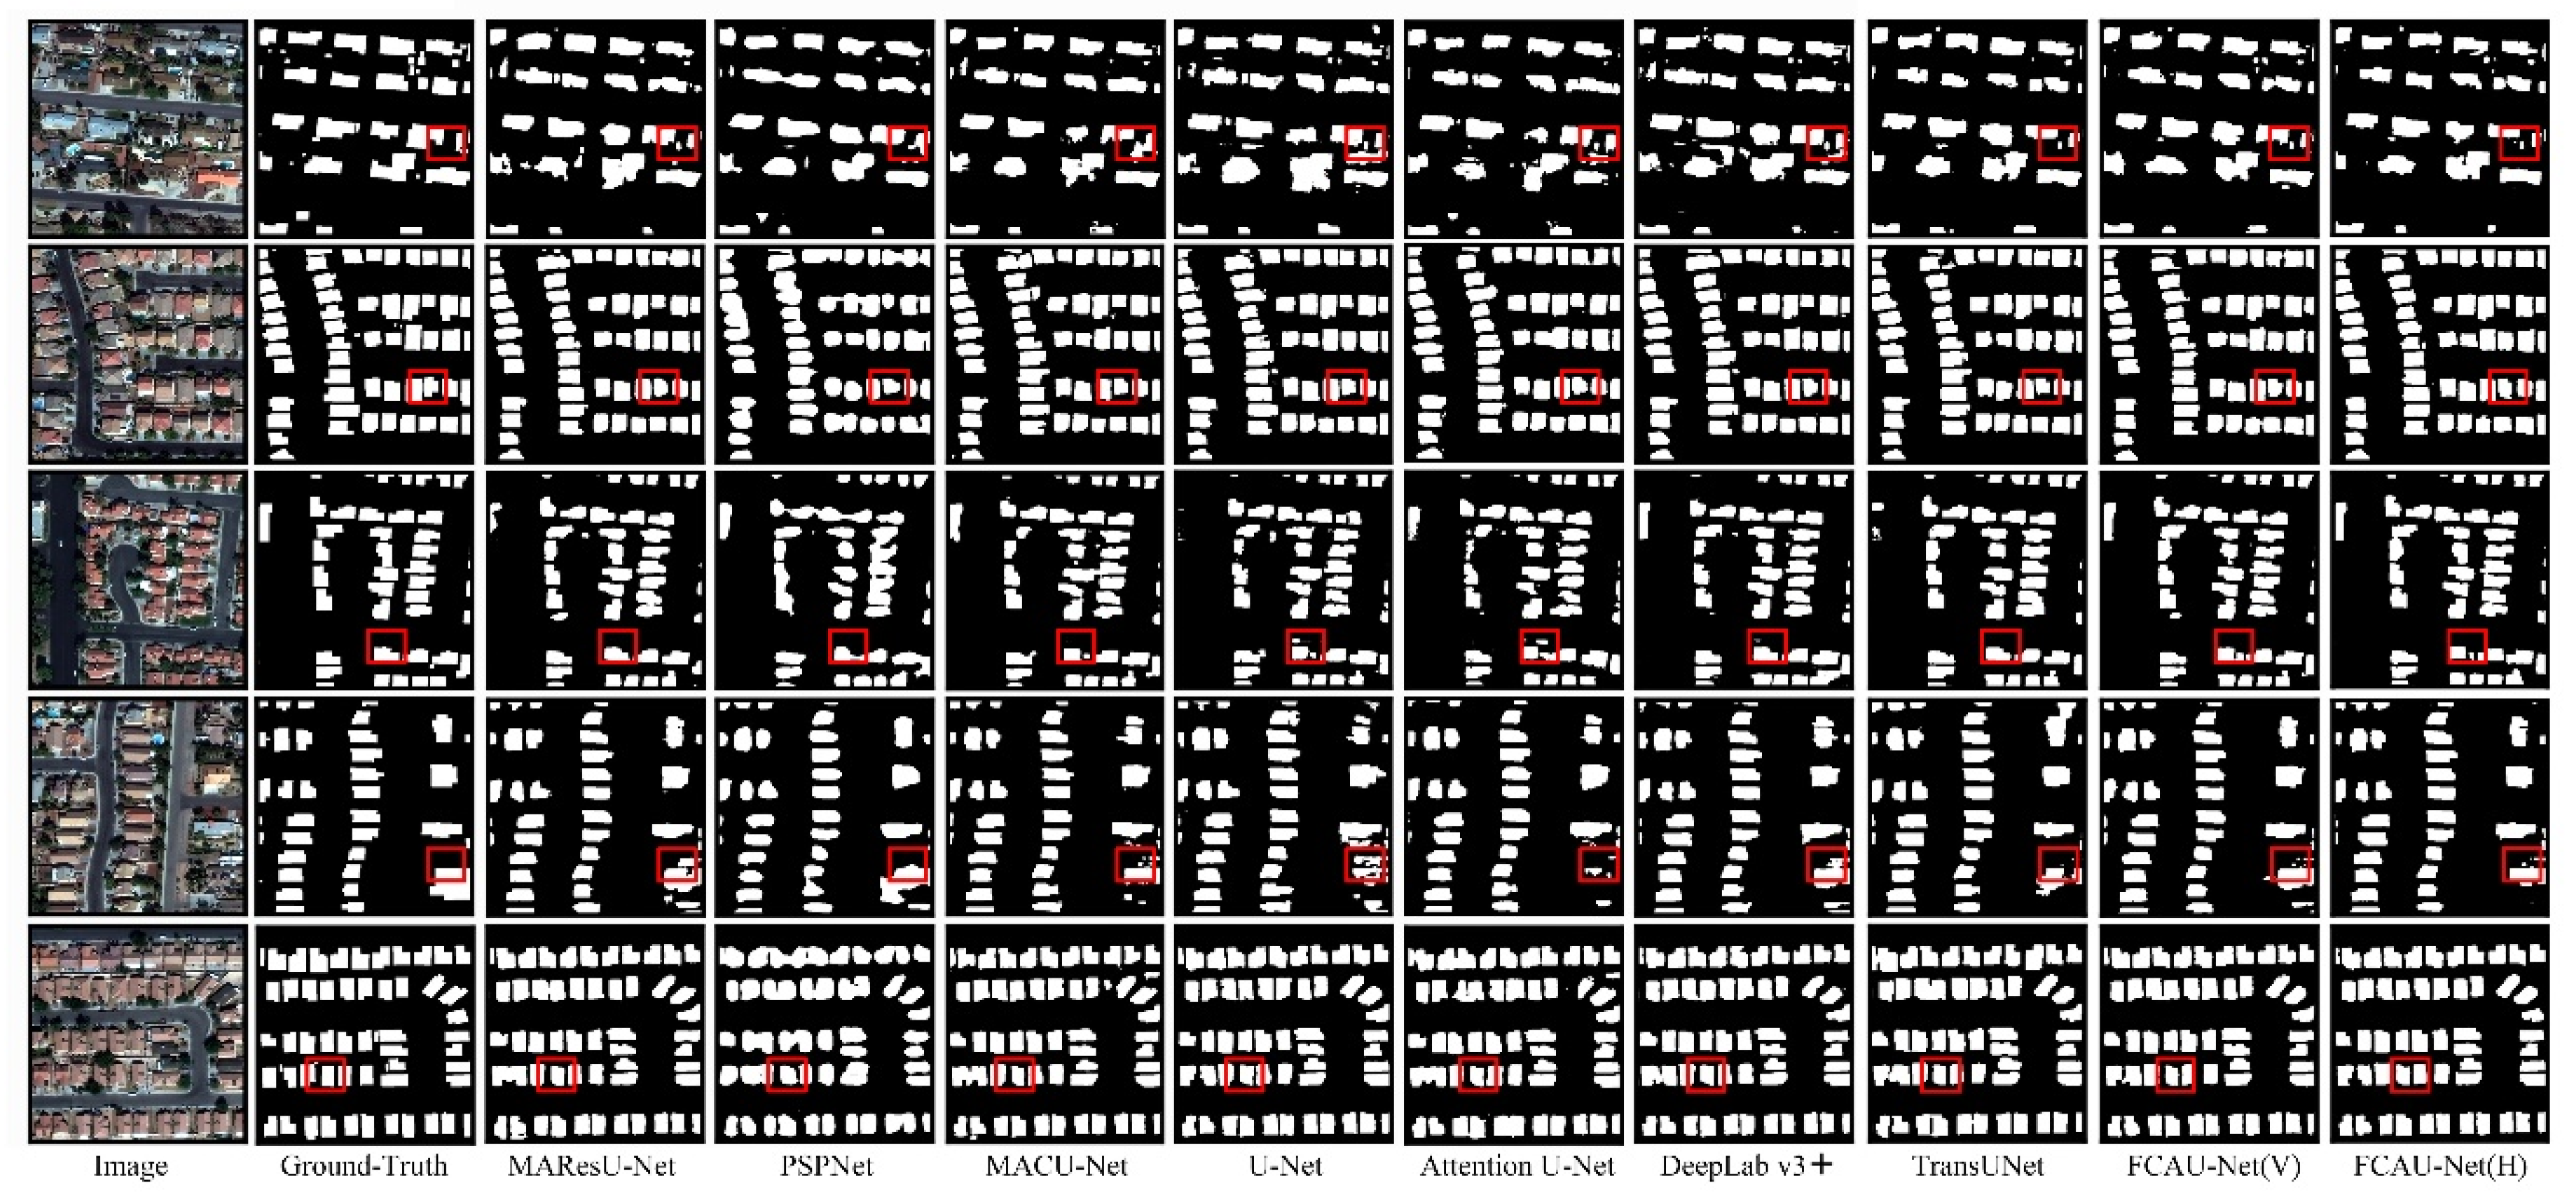
For a qualitative efficacy verification, we showed the segmentation images generated by the proposed FCAU-Net and the comparative approaches in Figure 10 and Figure 11. White represents an object (cultivated land or building), and black represents the background. According to the visualization results obtained on the ZY-3 and DeepGlobe datasets, it is clear that the proposed FCAU-Net captures more delicate features and has smaller target misclassification rates than other architectures (e.g., the MAResU-Net, U-Net, and the PSPNet). On the ZY-3 dataset, the direct use of multiscale modeling methods (e.g., the PSPNet and MACU-Net) and attention mechanism architectures (e.g., the MAResU-Net and Attention U-Net) yield specific improvements; a severe misclassification phenomenon occurs for edge pixels. The classification results of DeepLab v3+ and the TransUNet are the same as the GT. However, the proposed FCAU-Net can ultimately retain the contour information of complex objects. The cultivated land and building contours created by our FCAU-Net are smoother than those achieved by other approaches. Comparing the visualization results obtained on the DeepGlobe dataset, the segmentation results generated by our FCAU-Net are also closest to the GT.
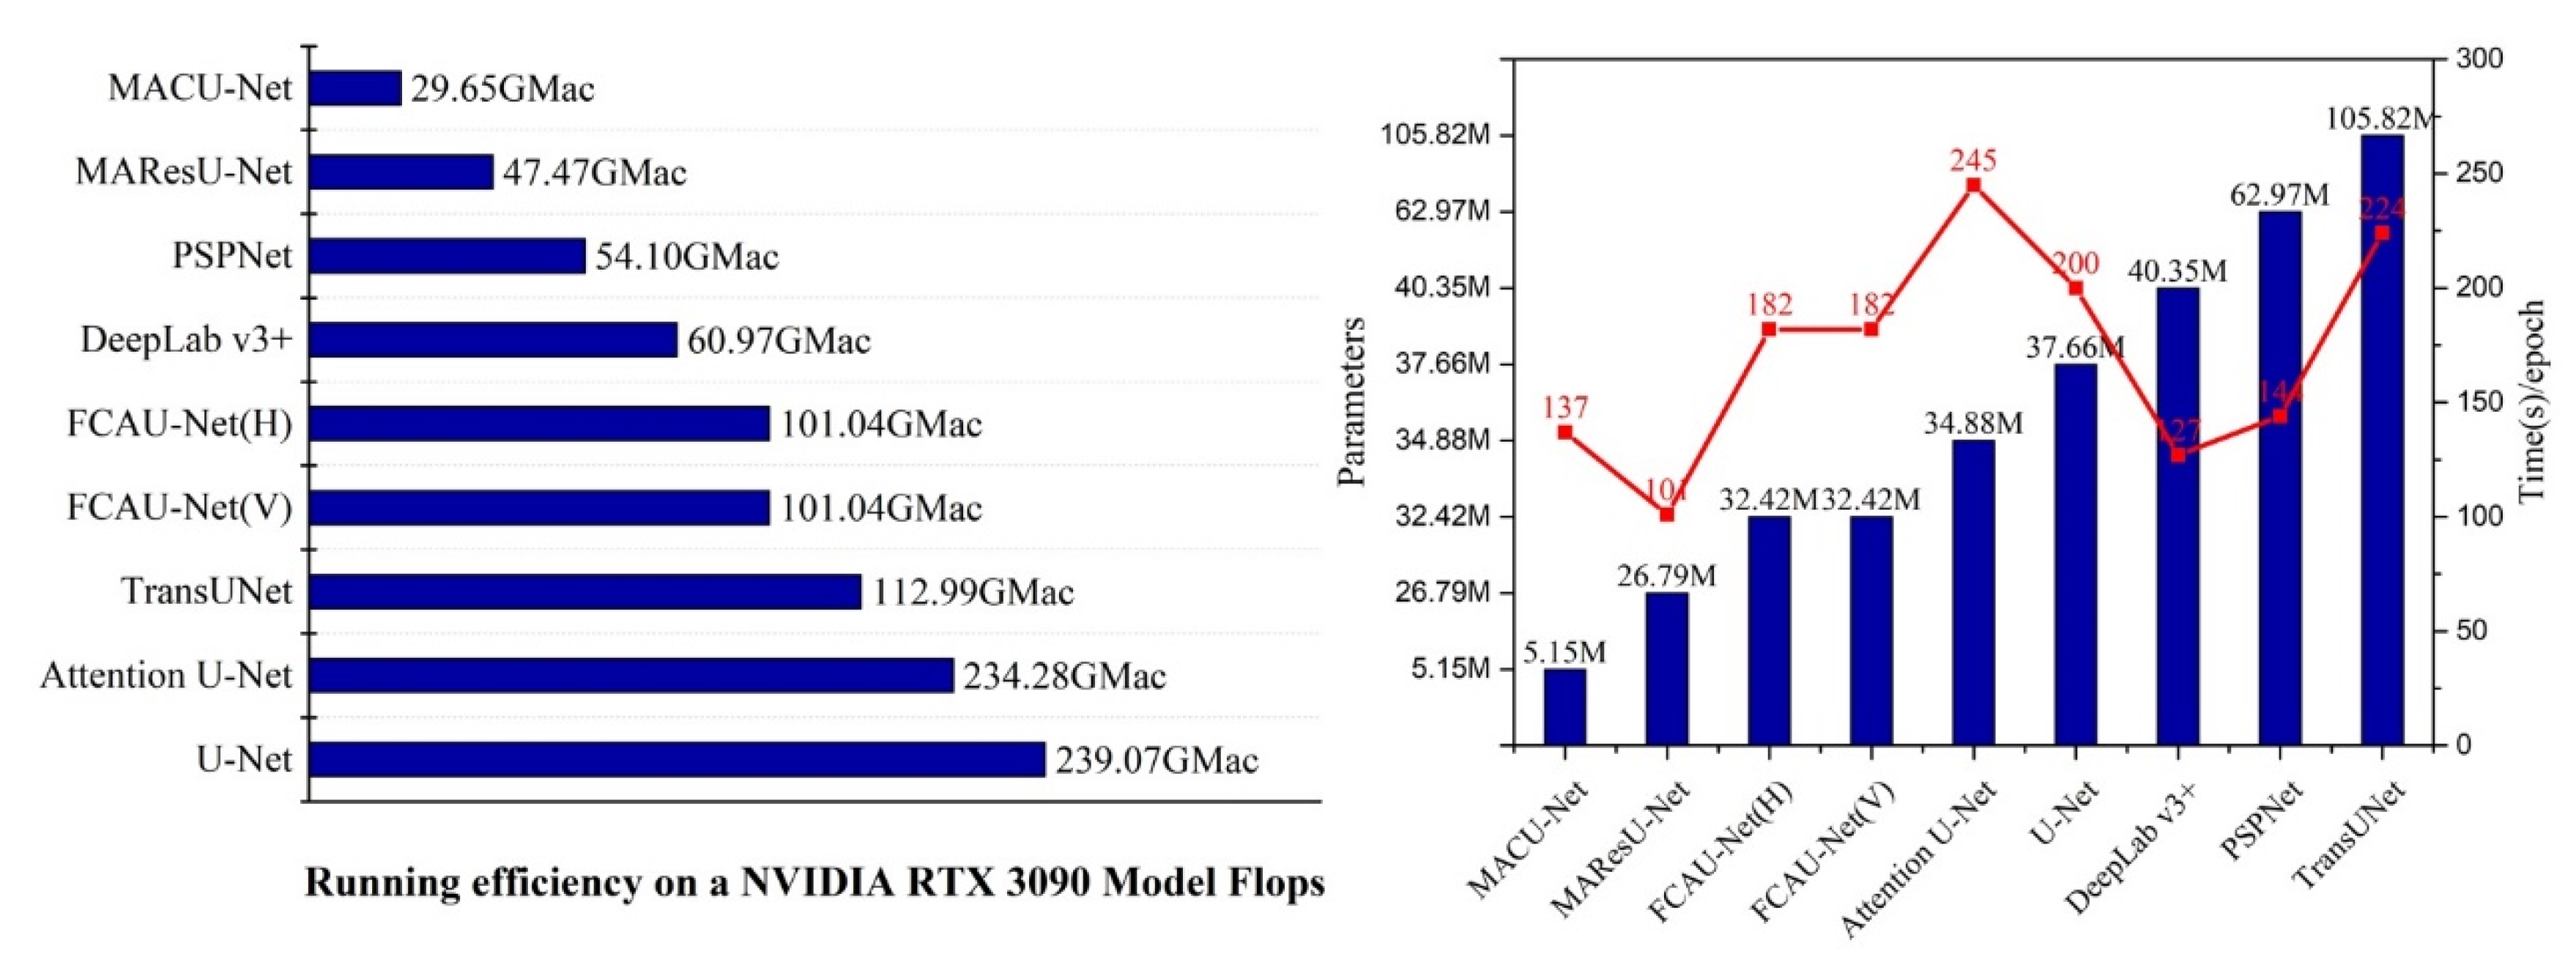
Considering that the number of parameters and the computational complexity are essential to the advantages of the efficiency of the evaluated architecture, we listed the training time required per each epoch. The numbers of floating-point operations per second (Flops) and parameters used by different algorithms (see Table 3) were counted, where “M” represents millions. The comparison indicates that the spatial efficiency and computation efficiency of the FCAU-Net were the third-best among the seven models, with 32.42 M parameters and 101.04 GMac. Regarding the training time, although the FCAU-Net occupied less memory, it was slower than DeepLab v3+ and other models but was notably faster than Attention U-Net.
4. Discussion
4.1. Ablation Study
Ablation experiments were separately carried out on ZY-3 and DeepGlobe datasets to assess the efficacy of various combinations of the ACB, RFB, and CA modules in the FCAU-Net. Table 4 display the experimental settings and quantitative comparative results.
Baseline: We selected the original U-Net as the baseline in our ablation experiments. The low-level feature maps created by each encoder layer through the convolutional layer, and the high-level feature maps created by the decoder through upsampling, were directly subjected to feature aggregation to restore the final segmented shape.
Ablation for the ACB: Since rich spatial details are significant for segmentation, we replaced the ordinary convolution in the decoder part of the FCAU-Net with the ACB. The features in each encoder layer were captured and refined, and the generated feature maps were smoother.
Ablation for the RFB: As the feature information generated by the encoder-decoder structure was contained in different domains, simple feature map channel summation and concatenation were not the best feature aggregation methods. To eliminate background noise information and reduce the fitting residuals after feature fusion, we designed the RFB to effectively fuse different level features characteristics in this study.
Ablation for the CA module: Considering that inter-channel information and spatial position information are essential for capturing the long-term dependencies of object architectures and modeling in visual tasks, we proposed a novel CA mechanism that captures cross-channel, directional, and position-sensitive information. Therefore, the CA module can help the model to accurately locate and identify the object of interest.
Table 4 show that the performance of the network with the ACB is superior to that of the encoder-decoder baseline. For the ZY-3 dataset, with the introduction of the ACB, we found that the PA increased by 2.50%, the mPA increased by 1.76%, the mIoU increased by 5.04%, and the FWIoU increased by 4.33%. The PA, mPA, mIoU, and FWIoU increasd by 0.59%, 2.98%, 2.10%, and 1.16%, respectively, for the DeepGlobe dataset. As the ACB cannot fully capture the feature information, we developed the RFB to realize the merging of low-level position information and high-level abstract features. For the ZY-3 dataset, the introduction of RFB increased the PA by more than 0.90%, the mPA by 0.64%, the mIoU by 1.94%, and the FWIoU by 1.63%, while the improvements achieved on the DeepGlobe dataset were 1.05%, 0.65%, 2.35%, and 1.69%, respectively. We designed a CA module to embed position information into the channel attention mechanism, enhancing the representations of objects of interest. The utilization of the CA module contributed to increases of 0.58% in the PA, 0.40% in the mPA, 1.28% in the mIoU, and 1.06% in the FWIoU on the ZY-3 dataset, while the improvements achieved on the DeepGlobe dataset were 0.47%, 0.50%, 1.15%, and 0.78%, respectively.
4.2. Influence of the Input Size
In this subsection, the different input sizes are inputted into the network for training to further evaluate the FCAU-Net. We discovered that the greater the input size, the better the performance effect. The input sizes were set at 480, 256, and 224. The accuracy of the test set was greatest at a size of 480 (seen Table 5). As the sample library involves single-target segmentation, we needed to select as large a slice size as possible to stabilize the network training procedure. Due to GPU source constraints, the batch size and input size were set at 8 and 480, respectively.
4.3. Optimization
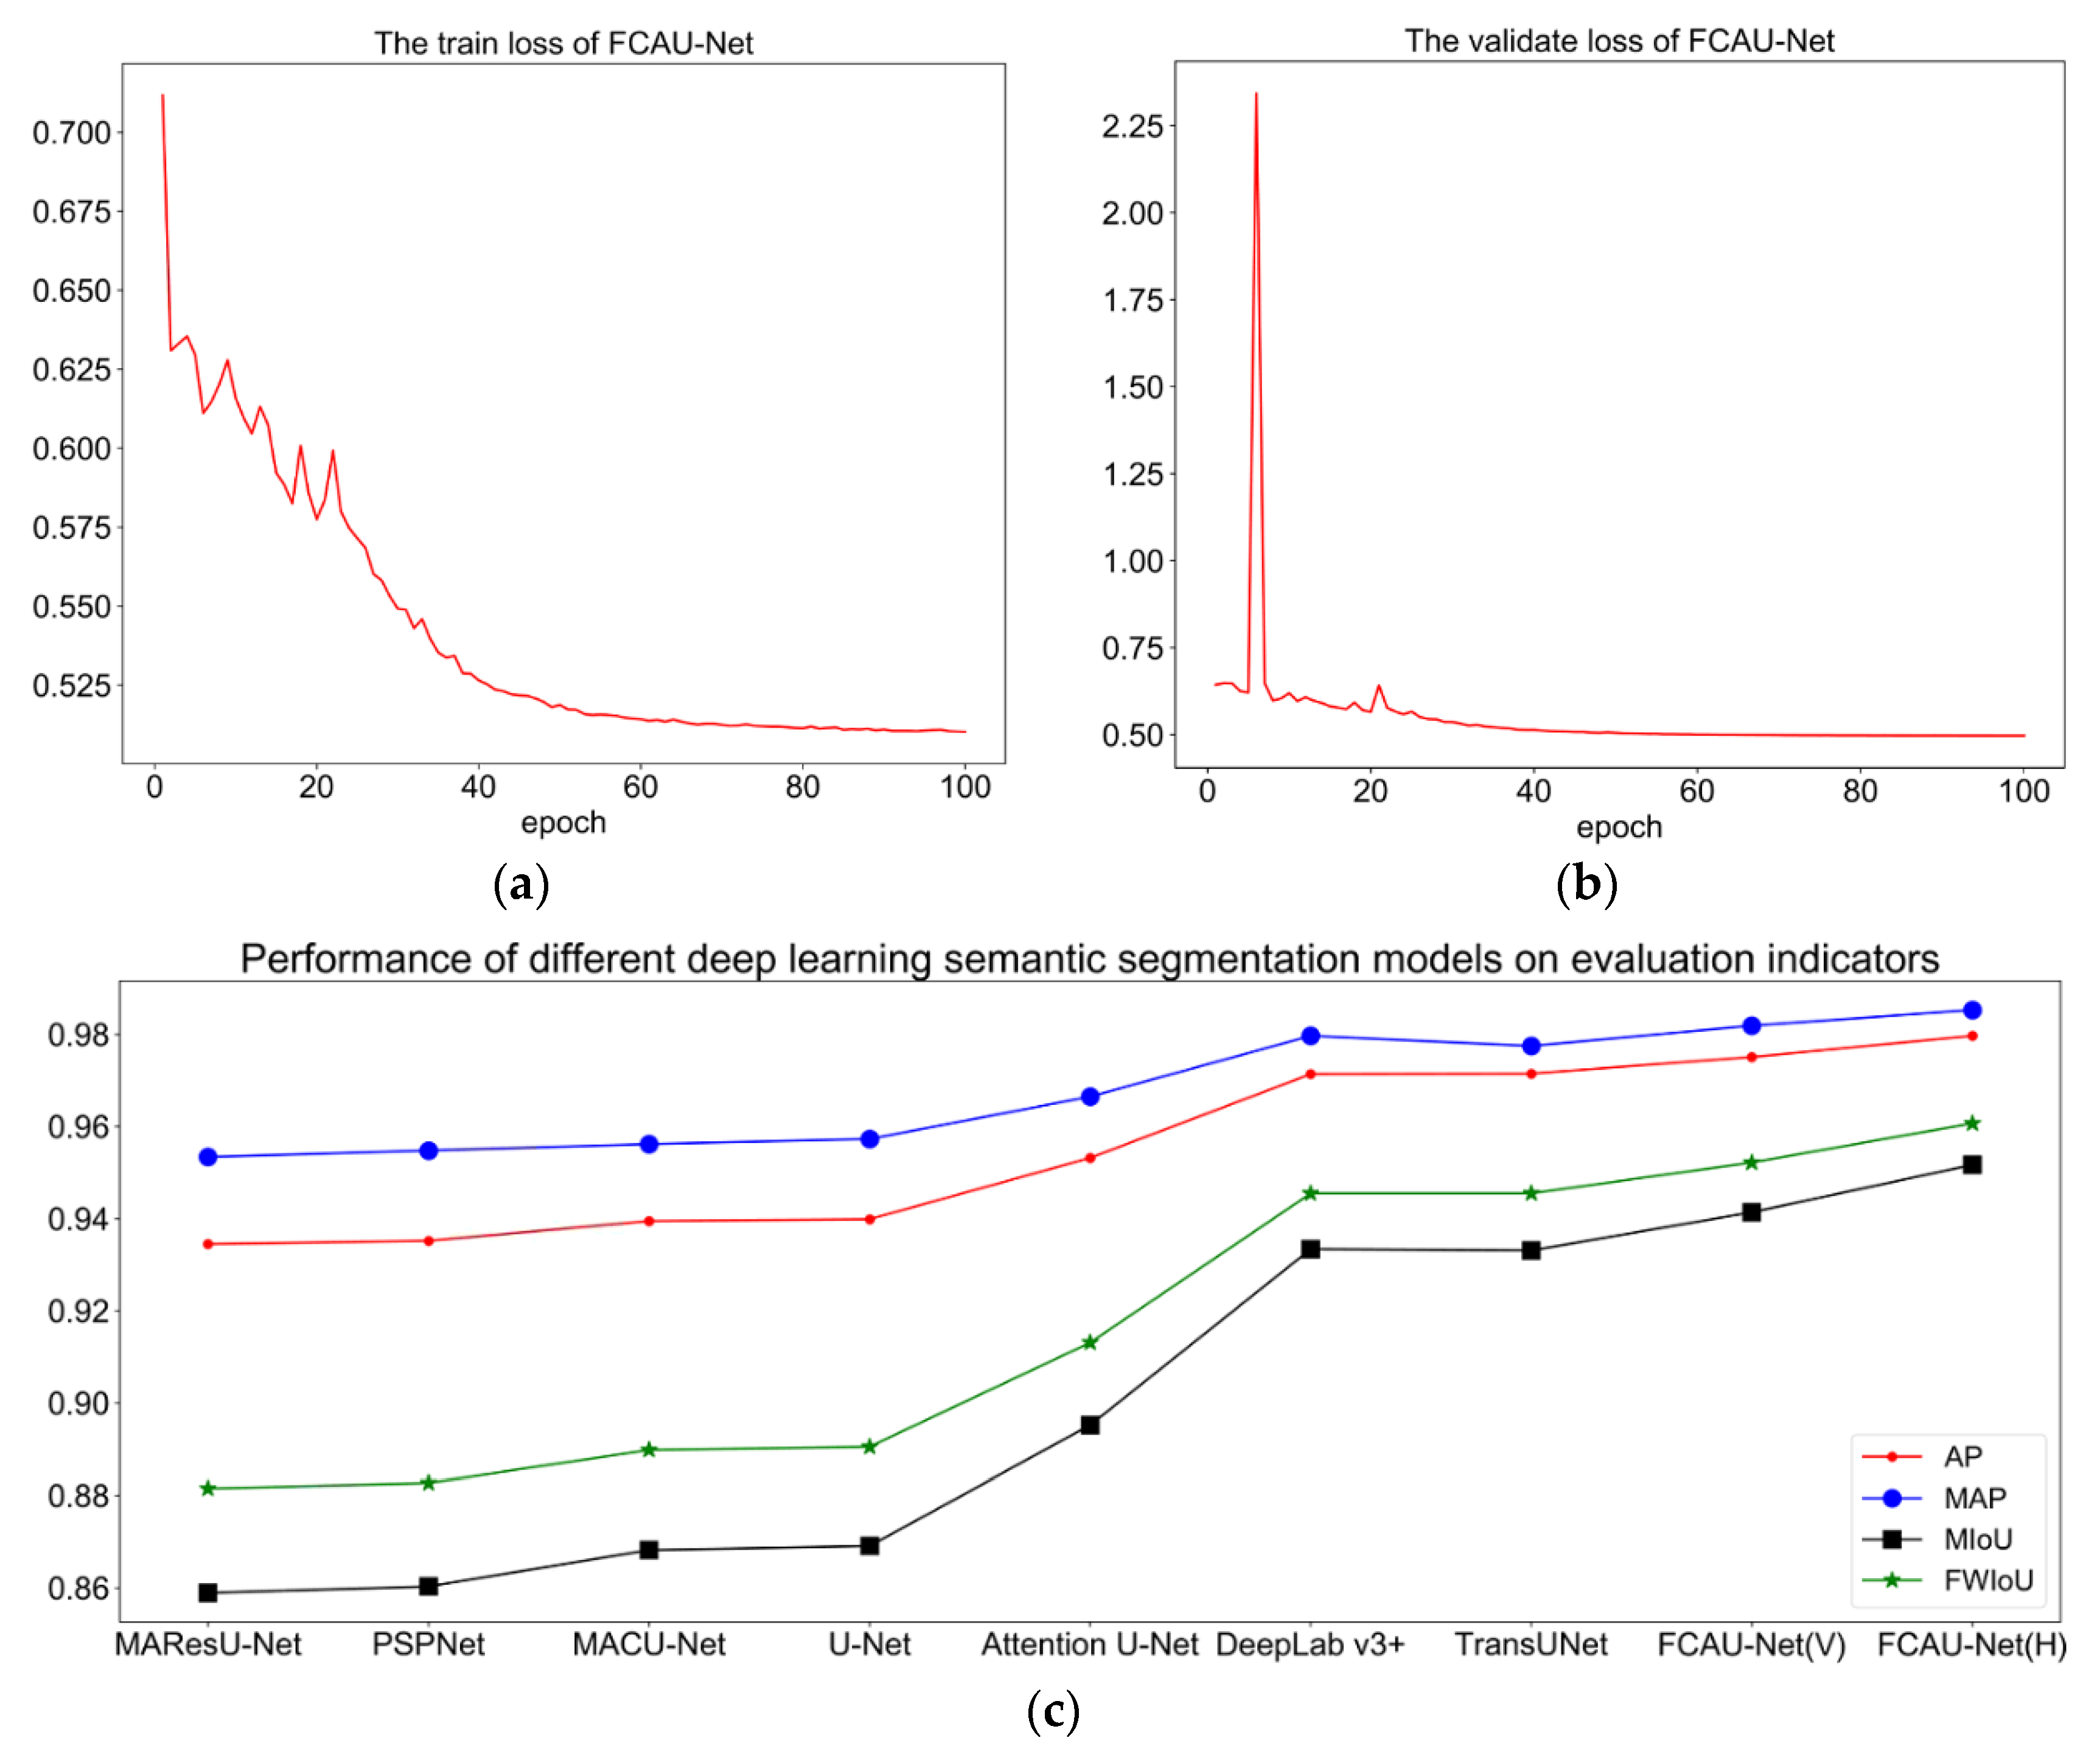
In this experiment, adaptive moment estimation (Adam) was selected as the FCAU-Net optimizer. The stochastic gradient descent (SGD) optimization method is affected by the learning rate. However, the Adam optimization technique is not affected by the learning rate, and Adam may regulate the learning rate to a specific extent. Thereby, Adam was selected as the FCAU-Net optimizer to accelerate network convergence and obtain the best performance on the ZY-3 and DeepGlobe datasets. Figure 12a,b illustrate the loss values achieved on the training and validation sets. The training and validation loss function gradually decreased at the beginning; however, after a certain epoch, the loss no longer decreased and began to balance. The accuracy values of different approaches are shown in Figure 12c, which presents the finding that the FCAU-Net proposed by us has the best performance. Therefore, our experimental setting has certain feasibility.
In addition, to examine the influence of the sensitivity of the hyperparameters (α and β in Equation (25)) on model accuracy, we conducted a test on the ZY-3 dataset as an example. As shown in Table 6, different scale factors have prominent effects on the performance of the model. The best performance was found when the cross-entropy (CE) and Dice losses were used and when α and β were set to 1. The FCAU-Net achieved 97.27% in PA, a 97.87% mPA, a 93.60% mIoU, and a 94.77% FWIoU for the ZY-3 dataset.
4.4. Limitations and Future Work
Although the proposed FCAU-Net bridges the gap in feature fusion between low-level spatial information and high-level semantic information, some inherent issues need to be considered. As shown in Figure 13, the total number of trainable parameters in the FCAU-Net was 32.42 M, which is smaller than that required by medium-scale networks (e.g., the PSPNet (62.97 M) and DeepLab v3+(40.35 M)) but more significant than that required by small-scale networks (e.g., MACU-Net (5.15 M) and the MAResU-Net (26.79 M)). Therefore, the network efficiency of the FCAU-Net is relatively low and is not suitable for mobile platforms. Next, Transformer has gained prominence in a variety of CV tasks (e.g., image classification, object detection, and semantic segmentation) in recent years due to its powerful long-distance dependency capturing and sequence-based graphics modeling capabilities. Transformer divides the input image into non-overlapping continuous patches. It constructs a feature extraction block composed of a multihead self-attention (MHSA) module and an MLP to capture long-distance dependencies. Due to its nonconvolutional architecture and attention mechanism, Transformer can capture long-term dependencies more effectively than other approaches. Based on the above limitations and advantages, we will dedicate ourselves to studying semantic remote sensing image segmentation based on the Transformer architecture in future work.
5. Conclusions
In this paper, we proposed an FCAU-Net for the semantic segmentation of fine-resolution remote sensing images. Specifically, a CA mechanism first embeds position information into a channel attention mechanism in the encoding stage to capture long-range relationships, providing a clear segmentation boundary and improving the accuracy of semantic segmentation. Second, an ACB was utilized to improve the representation ability of the standard convolution layer, and the features in each layer of the encoder were captured and refined, achieving a smooth image. Finally, we designed an RFB to achieve the successful integration of low-level semantic and high-level abstract characteristics, eliminating the background noise when extracting feature information, reducing the fitting residuals of the fused features, and enhancing the ability of the network to capture information flows.
We performed extensive experiments and ablation studies on the public ZY-3 (0: background, 1: arable land) and DeepGlobe datasets (0: background, 1: building) to demonstrate the superiority of the FCAU-Net. Namely, the FCAU-Net can capture more delicate features, and the segmentation results have smoother and clearer visual effects than those of other methods.
Author Contributions
Conceptualization: X.N. and Q.Z.; methodology: X.N. and Q.Z.; software: X.N. and Q.Z.; validation: X.N. and L.C.; formal analysis: X.N. and X.L.; investigation: X.N.; resources: Q.Z.; data curation: Q.Z.; writing—original draft preparation: Q.Z.; writing—review and editing: X.N. and Q.Z.; visualization: X.N. and Q.Z.; supervision: X.L. and L.C.; project administration: X.N., Q.Z. and L.C.; funding acquisition: Q.Z. All authors have read and agreed to the published version of the manuscript.
Funding
This research was funded by the National Natural Science Foundation of China under grant 42001315, the Chongqing Meteorological Department Business Technology Project under grant YWJSGG-202107, and the National Natural Science Foundation of China under grant 41871226.
Institutional Review Board Statement
Not applicable.
Informed Consent Statement
Not applicable.
Data Availability Statement
The datasets presented in this study can be found here: https://www.saikr.com/c/nd/7256 and https://registry.opendata.aws/spacenet/, accessed on 23 November 2021.
Acknowledgments
All authors would sincerely thank the reviewers and editors for their beneficial, careful, and detailed comments and suggestions for improving the paper.
Conflicts of Interest
The authors declare no conflict of interest.
References
- Zhao, Q.; Liu, J.H.; Li, Y.W.; Zhang, H. Semantic Segmentation with Attention Mechanism for Remote Sensing Images. IEEE Trans. Geosci. Remote Sens. 2021, 1–13. [Google Scholar] [CrossRef]
- Zhang, Q.; Yang, G.; Zhang, G.X. Collaborative Network for Super-Resolution and Semantic Segmentation of Remote Sensing Images. IEEE Trans. Geosci. Remote Sens. 2021, 1–12. [Google Scholar] [CrossRef]
- Zheng, X.W.; Wu, X.J.; Huan, L.X.; He, W.; Zhang, H.Y. A Gather-to-Guide Network for Remote Sensing Semantic Segmentation of RGB and Auxiliary Image. IEEE Trans. Geosci. Remote Sens. 2021, 1–15. [Google Scholar] [CrossRef]
- Li, R.; Zheng, S.Y.; Duan, C.X. Feature Pyramid Network with Multi-Head Attention for Semantic Segmentation of Fine-Resolution Remotely Sensed Images. arXiv 2021, arXiv:2102.07997. [Google Scholar]
- Li, R.; Zheng, S.Y.; Zhang, C.; Duan, C.X.; Wang, L.B.; Atkinson, P.M. ABCNet: Attentive bilateral contextual network for efficient semantic segmentation of Fine-Resolution remotely sensed imagery. ISPRS J. Photogramm. Remote Sens. 2021, 18, 84–98. [Google Scholar] [CrossRef]
- Wang, L.B.; Li, R.; Wang, D.Z.; Duan, C.X.; Wang, T.; Meng, X.L. Transformer Meets Convolution: A Bilateral Awareness Network for Semantic Segmentation of Very Fine Resolution Urban Scene Images. Remote Sens. 2021, 13, 3065. [Google Scholar] [CrossRef]
- Yang, X.; Li, S.S.; Chen, Z.C.; Jocelyn, C.; Jia, X.P.; Zhang, B.; Li, B.P.; Chen, P. An fusion network for semantic segmentation of very-high-resolution remote sensing imagery. ISPRS J. Photogramm. Remote Sens. 2021, 177, 238–262. [Google Scholar] [CrossRef]
- Deng, G.H.; Wu, Z.C.; Wang, C.J.; Xu, M.Z.; Zhong, Y.F. CCANet: Class-Constraint Coarse-to-Fine Attentional Deep Network for Subdecimeter Aerial Image Semantic Segmentation. IEEE Trans. Geosci. Remote Sens. 2021, 1–20. [Google Scholar] [CrossRef]
- Bazi, Y.; Bashmal, L.; Rahhal, M.M.A.; Dayil, R.A.; Ajlan, N.A. Vision transformers for remote sensing image classification. Remote Sens. 2021, 13, 516. [Google Scholar] [CrossRef]
- Duan, C.X.; Pan, J.; Li, R. Thick Cloud Removal of Remote Sensing Images Using Temporal Smoothness and Sparsity Regularized Tensor Optimization. Remote Sens. 2020, 12, 3446. [Google Scholar] [CrossRef]
- Zhang, C.; Harrison, P.A.; Pan, X.; Li, H.; Sargent, I.; Atkinson, P.M. Scale Sequence Joint Deep Learning (SS-JDL) for land use and land cover classification. Remote Sens. Environ. 2020, 237, 111593. [Google Scholar] [CrossRef]
- Huang, Y.; Qin, R.J.; Chen, X.Y. Unmanned Aerial Vehicle for Remote Sensing Applications—A Review. Remote Sens. 2019, 11, 1443. [Google Scholar]
- Audebert, N.; Le Saux, B.; Lefèvre, S. Segment-before-Detect: Vehicle Detection and Classification through Semantic Segmentation of Aerial Images. Remote Sens. 2017, 9, 368. [Google Scholar] [CrossRef] [Green Version]
- Matikainen, L.; Karila, K. Segment-Based Land Cover Mapping of a Suburban Area-Comparison of High-Resolution Remotely Sensed Datasets Using Classification Trees and Test Field Points. Remote Sens. 2011, 3, 1777–1804. [Google Scholar] [CrossRef] [Green Version]
- Zhang, Q.L.; Seto, K.C. Mapping urbanization dynamics at regional and global scales using multi-temporal DMSP/OLS nighttime light data. Remote Sens. Environ. 2011, 115, 2320–2329. [Google Scholar] [CrossRef]
- Wei, Y.N.; Wang, Z.L.; Xu, M. Road Structure Refined CNN for Road Extraction in Aerial Image. IEEE Geosci. Remote Sens. Lett. 2017, 14, 709–713. [Google Scholar] [CrossRef]
- Li, E.; Femiani, J.; Xu, S.; Zhang, X.; Wonka, P. Robust Rooftop Extraction from Visible Band Images Using Higher Order CRF. IEEE Trans. Geosci. Remote Sens. 2015, 53, 4483–4495. [Google Scholar] [CrossRef]
- Li, R.; Duan, C.X.; Zheng, S.Y.; Zhang, C.; Atkinson, P.M. MACU-Net for semantic segmentation of fine-resolution remotely sensed images. IEEE Geosci. Remote Sens. Lett. 2021, 19, 1–5. [Google Scholar] [CrossRef]
- Rutherford, G.N.; Guisan, A.; Zimmermann, N.E. Evaluating sampling strategies and logistic regression methods for modelling complex land cover changes. J. Appl. Ecol. 2007, 44, 414–424. [Google Scholar] [CrossRef]
- Du, Q.; Chang, C.I. A linear constrained distance-based discriminant analysis for hyperspectral image classification. Pattern Recognit. 2001, 34, 361–373. [Google Scholar] [CrossRef]
- Maulik, U.; Saha, I. Automatic fuzzy clustering using modified differential evolution for image classification. IEEE Trans. Geosci. Remote Sens. 2010, 48, 3503–3510. [Google Scholar] [CrossRef]
- Guo, Y.P.; Jia, X.P.; Paull, D. Effective Sequential Classifier Training for SVM-Based Multitemporal Remote Sensing Image Classification. IEEE Trans. Image Process. 2018, 27, 3036–3048. [Google Scholar]
- Pal, M. Random forest classifier for remote sensing classification. Int. J. Remote Sens. 2005, 26, 217–222. [Google Scholar] [CrossRef]
- Adede, C.; Oboko, R.; Wagacha, P.W.; Atzberger, C. A mixed model approach to vegetation condition prediction using artificial neural networks (ANN): Case of Kenya’s operational drought monitoring. Remote Sens. 2019, 11, 1099. [Google Scholar] [CrossRef] [Green Version]
- Zhang, C.; Pan, X.; Li, H.P.; Gardiner, A.; Sargent, I.; Hare, J.; Atkinson, P.M. A hybrid MLP-CNN classifier for very fine resolution remotely sensed image classification. ISPRS J. Photogramm. Remote Sens. 2018, 140, 133–144. [Google Scholar] [CrossRef] [Green Version]
- Xie, Y.K.; Zhu, J.; Cao, Y.G.; Feng, D.J.; Hu, M.J.; Li, W.L.; Zhang, Y.H.; Fu, L. Refined extraction of building outlines from high-resolution remote sensing imagery based on a multifeature convolutional neural network and morphological filtering. IEEE J. Sel. Top Appl. Earth Obs. Remote Sens. 2020, 13, 1842–1855. [Google Scholar] [CrossRef]
- Li, R.; Zheng, S.Y.; Duan, C.X.; Yang, Y.; Wang, X.Q. Classification of hyperspectral image based on double-branch dual-attention mechanism network. Remote Sens. 2020, 12, 582. [Google Scholar] [CrossRef] [Green Version]
- LeCun, Y.; Bengio, Y.; Hinton, G. Deep learning. Nature 2015, 521, 436–444. [Google Scholar] [CrossRef]
- Li, R.; Zheng, S.Y.; Zhang, C.; Duan, C.X.; Su, J.L.; Wang, L.B.; Atkinson, P.M. Multiattention network for semantic segmentation of fine-resolution remote sensing images. IEEE Trans. Geosci. Remote Sens. 2021, 1–13. [Google Scholar] [CrossRef]
- Jung, H.; Choi, H.S.; Kang, M. Boundary Enhancement Semantic Segmentation for Building Extraction from Remote Sensed Image. IEEE Trans. Geosci. Remote Sens. 2021, 1–12. [Google Scholar] [CrossRef]
- Long, J.; Shelhamer, E.; Darrell, T. Fully convolutional networks for semantic segmentation. In Proceedings of the IEEE conference on computer vision and pattern recognition (CVPR), Boston, MA, USA, 7–12 June 2015; pp. 3431–3440. [Google Scholar]
- Badrinarayanan, V.; Kendall, A.; Cipolla, R. SegNet: A deep convolutional encoder-decoder architecture for image segmentation. IEEE Trans. Pattern Anal. Mach. Intell. 2017, 39, 2481–2495. [Google Scholar] [CrossRef] [PubMed]
- Ronneberger, O.; Fischer, P.; Brox, T. U-Net: Convolutional networks for biomedical image segmentation. In Proceedings of the International Conference on Medical Image Computing and Computer-Assisted Intervention, Munich, Germany, 5–9 October 2015; pp. 234–241. [Google Scholar]
- Zhou, Z.W.; Siddiquee, M.M.R.; Tajbakhsh, N.; Liang, J.M. Unet++: A nested u-net architecture for medical image segmentation. In Proceedings of the Deep learning in medical image analysis and multimodal learning for clinical decision support, Granada, Spain, 20 September 2018; pp. 3–11. [Google Scholar]
- Li, R.; Zheng, S.Y.; Duan, C.X.; Su, J.L.; Zhang, C. Multistage Attention ResU-Net for Semantic Segmentation of Fine-Resolution Remote Sensing Images. IEEE Geosci. Remote Sens. Lett. 2021, 19, 1–5. [Google Scholar] [CrossRef]
- Huang, H.M.; Lin, L.F.; Tong, R.F.; Hu, H.J.; Zhang, Q.W.; Iwamoto, Y.; Han, X.H.; Chen, Y.W.; Wu, J. Unet 3+: A full-scale connected unet for medical image segmentation. In Proceedings of the ICASSP 2020–2020 IEEE International Conference on Acoustics, Speech and Signal Processing (ICASSP), Barcelona, Spain, 4–8 May 2020; pp. 1055–1059. [Google Scholar]
- Zhao, H.S.; Shi, J.P.; Qi, X.J.; Wang, X.W.; Jia, J.Y. Pyramid scene parsing network. In Proceedings of the IEEE Conference on Computer Vision and Pattern Recognition (CVPR), Honolulu, HI, USA, 21–26 July 2017; pp. 2881–2890. [Google Scholar]
- Peng, C.L.; Ma, J.Y. Semantic segmentation using stride spatial pyramid pooling and dual attention decoder. Pattern Recognit. 2020, 107, 107498. [Google Scholar] [CrossRef]
- Vaswani, A.; Shazeer, N.; Parmar, N.; Uszkoreit, J.; Jones, L.; Gomez, A.N.; Kaise, L.; Polosukhin, I. Attention is all you need. In Proceedings of the Advances in Neural Information Processing Systems, Long Beach, CA, USA, 4–9 December 2017; pp. 5998–6008. [Google Scholar]
- Tsotsos, J.K. A Computational Perspective on Visual Attention; MIT Press: London, UK, 2011. [Google Scholar]
- Tsotsos, J.K. Analyzing vision at the complexity level. Behav. Brain Sci. 2011, 13, 423–469. [Google Scholar] [CrossRef]
- Li, R.; Su, J.L.; Duan, C.X.; Zheng, S.Y. Linear attention mechanism: An efficient attention for semantic segmentation. arXiv 2020, arXiv:2007.14902. [Google Scholar]
- Zhu, Q.; Liao, C.; Hu, H.; Mei, X.M.; Li, H.F. MAP-Net: Multiple attending path neural network for building footprint extraction from remote sensed imagery. IEEE Transactions on Geoscience and Remote Sensing. IEEE Trans. Geosci. Remote Sens. 2020, 59, 6169–6181. [Google Scholar] [CrossRef]
- Hu, J.; Shen, L.; Sun, G. Squeeze-and-excitation networks. In Proceedings of the IEEE Conference on Computer Vision and Pattern Recognition (CVPR), Salt Lake City, UT, USA, 18–23 June 2018; pp. 7132–7141. [Google Scholar]
- Fu, J.; Liu, J.; Tian, H.J.; Li, Y.; Bao, Y.J.; Fang, Z.W.; Lu, H.Q. Dual attention network for scene segmentation. In Proceedings of the IEEE/CVF Conference on Computer Vision and Pattern Recognition (CVPR), Long Beach, CA, USA, 15–20 June 2019; pp. 3146–3154. [Google Scholar]
- Woo, S.; Park, J.; Lee, J.; Kweon, I. Cbam: Convolutional block attention module. In Proceedings of the European Conference on Computer Vision (ECCV), Amsterdam, The Netherlands, 8–16 October 2018; pp. 3–19. [Google Scholar]
- Hou, Q.B.; Zhou, D.Q.; Feng, J.S. Coordinate Attention for Efficient Mobile Network Design. In Proceedings of the IEEE/CVF Conference on Computer Vision and Pattern Recognition (CVPR), Nashville, TN, USA, 19–25 June 2021; pp. 13713–13722. [Google Scholar]
- Liu, S.C.; Zhao, H.; Du, Q.; Bruzzone, L.; Samat, A.; Tong, X.H. Novel Cross-Resolution Feature-Level Fusion for Joint Classification of Multispectral and Panchromatic Remote Sensing Images. IEEE Trans. Geosci. Remote Sens. 2021. [Google Scholar] [CrossRef]
- Zheng, Y.J.; Liu, S.C.; Du, Q.; Zhao, H.; Tong, X.H.; Dalponte, M. A novel multitemporal deep fusion network (MDFN) for short-term multitemporal HR images classification. IEEE J-STARS 2021, 14, 10691–10704. [Google Scholar]
- Nigam, I.; Huang, C.; Ramanan, D. Ensemble Knowledge Transfer for Semantic Segmentation. In Proceedings of the 2018 IEEE Winter Conference on Applications of Computer Vision (WACV), Lake Tahoe, NV, USA, 12–15 March 2018; pp. 1499–1508. [Google Scholar]
- Ullah, I.; Abinesh, S.; Smyth, D.L.; Karimi, N.B.; Drury, B.; Glavin, F.G.; Madden, M.G. A virtual testbed for critical incident investigation with autonomous remote aerial vehicle surveying, artificial intelligence, and decision support. In Proceedings of the ECML PKDD 2018 Workshops, Dublin, Ireland, 10–14 September 2018; pp. 216–221. [Google Scholar]
- Ding, X.H.; Guo, Y.C.; Ding, G.G.; Han, J.G. Acnet: Strengthening the kernel skeletons for powerful cnn via asymmetric convolution blocks. In Proceedings of the IEEE/CVF International Conference on Computer Vision (ICCV), Seoul, Korea, 27 October–2 November 2019; pp. 1911–1920. [Google Scholar]
- Kingma, D.P.; Ba, J. Adam: A method for stochastic optimization. arXiv 2015, arXiv:1412.6980. [Google Scholar]
- Oktay, O.; Schlemper, J.; Folgoc, L.L.; Lee, M.; Heinrich, M.; Misawa, K.; Mori, K.; McDonagh, S.; Hammerla, N.Y.; Kainz, B.; et al. Attention u-net: Learning where to look for the pancreas. arXiv 2018, arXiv:1804.03999. [Google Scholar]
- Chen, L.C.; Zhu, Y.K.; Papandreou, G.; Schroff, F.; Adam, H. Encoder-decoder with atrous separable convolution for semantic image segmentation. In Proceedings of the European Conference on Computer Vision (ECCV), Munich, Germany, 8–14 September 2018; pp. 801–818. [Google Scholar]
- Chen, J.N.; Lu, Y.Y.; Yu, Q.H.; Luo, X.D.; Adeli, E.; Wang, Y.; Lu, L.; Yuille, A.L.; Zhou, Y.Y. Transunet: Transformers make strong encoders for medical image segmentation. arXiv 2021, arXiv:2102.04306. [Google Scholar]
- Huang, J.F.; Zhang, X.C.; Xin, Q.C.; Sun, Y.; Zhang, P.C. Automatic building extraction from high-resolution aerial images and LiDAR data using gated residual refinement network. ISPRS J. Photogramm. Remote Sens. 2019, 151, 91–105. [Google Scholar] [CrossRef]
- Milletari, F.; Navab, N.; Ahmadi, S.-A. V-Net: Fully Convolutional Neural Networks for Volumetric Medical Image Segmentation. In Proceedings of the 2016 Fourth International Conference on 3D Vision (3DV), Stanford, CA, USA, 25–28 October 2016; pp. 565–571. [Google Scholar]
Figure 1.
The framework of our proposed approach.

Figure 2.
Much location information is lost after encoding. The initial location information cannot be obtained after upsampling.
Figure 2.
Much location information is lost after encoding. The initial location information cannot be obtained after upsampling.

Figure 3.
The FCAU-general Net’s architecture.

Figure 4.
The CA module.

Figure 5.
P Performance of various activation functions. x-axis is the input parameters of the activation, and y-axis denotes the output result of the activation function, namely y = h-swish [x].
Figure 5.
P Performance of various activation functions. x-axis is the input parameters of the activation, and y-axis denotes the output result of the activation function, namely y = h-swish [x].

Figure 6.
Structure of the ACB.

Figure 7.
The structures of the RFB. (a,b) represent respectively parallel and serial connections, namely, RFB(V) and RFB(H).
Figure 7.
The structures of the RFB. (a,b) represent respectively parallel and serial connections, namely, RFB(V) and RFB(H).


Figure 8.
Data augmentation samples.

Figure 9.
Sample images and labels from both the ZY-3 dataset (a) and the DeepGlobe dataset (b).

Figure 10.
The experimental results obtained on the ZY-3 dataset.

Figure 11.
The experimental results obtained on the DeepGlobe dataset.

Figure 12.
The loss and accuracy values of the FCAU-Net. (a,b) are the loss values on the training and validation sets, respectively. (c) is the accuracy values of different approaches.
Figure 12.
The loss and accuracy values of the FCAU-Net. (a,b) are the loss values on the training and validation sets, respectively. (c) is the accuracy values of different approaches.

Figure 13.
Comparison with other approaches in terms of the training time per epoch, running efficiency, and network complexity metrics.
Figure 13.
Comparison with other approaches in terms of the training time per epoch, running efficiency, and network complexity metrics.


Table 1.
Confusion matrix.
| Predicted Label | |||
|---|---|---|---|
| True | False | ||
| GT data | True | TP | FN |
| (True Positive) | (False Negative) | ||
| False | FP | TN | |
| (False Positive) | (True Negative) | ||
Table 2.
Experimental results obtained on the ZY-3 and DeepGlobe datasets (%).
| Method | ZY-3 | DeepGlobe | ||||||
|---|---|---|---|---|---|---|---|---|
| PA | mPA | mIoU | FWIoU | PA | mPA | mIoU | FWIoU | |
| MAResU-Net | 93.45 | 95.34 | 85.89 | 88.15 | 93.78 | 88.45 | 82.02 | 88.49 |
| PSPNet | 93.52 | 95.48 | 86.03 | 88.27 | 93.29 | 88.37 | 81.01 | 87.74 |
| MACU-Net | 93.95 | 95.62 | 86.82 | 88.98 | 93.72 | 88.88 | 82.04 | 88.45 |
| U-Net | 93.99 | 95.73 | 86.91 | 89.05 | 92.94 | 87.14 | 79.94 | 87.11 |
| Attention U-Net | 95.32 | 96.65 | 89.52 | 91.31 | 92.58 | 85.61 | 78.70 | 86.40 |
| DeepLab v3+ | 97.14 | 97.97 | 93.34 | 94.55 | 93.85 | 89.50 | 82.50 | 88.71 |
| TransUNet | 97.15 | 97.75 | 93.31 | 94.55 | 94.28 | 90.19 | 83.58 | 89.43 |
| FCAU-Net(V) | 97.51 | 98.19 | 94.14 | 95.22 | 94.78 | 90.97 | 84.86 | 90.28 |
| FCAU-Net(H) | 97.97 | 98.53 | 95.17 | 96.07 | 95.05 | 91.27 | 85.54 | 90.74 |
Table 3.
Comparison with other networks.
| Method | Time (s)/Epoch | Flops (GMac) | Parameters (M) |
|---|---|---|---|
| MAResU-Net | 101 | 47.47 | 26.79 |
| PSPNet | 144 | 54.10 | 62.97 |
| MACU-Net | 137 | 29.65 | 5.15 |
| U-Net | 200 | 239.07 | 37.66 |
| Attention U-Net | 245 | 234.28 | 34.88 |
| DeepLab v3+ | 127 | 60.97 | 40.35 |
| TransUNet | 224 | 112.99 | 105.82 |
| FCAU-Net(V) | 182 | 101.04 | 32.42 |
| FCAU-Net(H) | 182 | 101.04 | 32.42 |
Table 4.
Ablation results for the ACB, RFB and CA module (%).
| Dataset | Method | PA | mPA | mIoU | FWIoU |
|---|---|---|---|---|---|
| ZY-3 | Baseline | 93.99 | 95.73 | 86.91 | 89.05 |
| ACB | 96.49 | 97.49 | 91.95 | 93.38 | |
| ACB-RFB(V) | 97.08 | 97.91 | 93.21 | 94.44 | |
| ACB-RFB(H) | 97.39 | 98.13 | 93.89 | 95.01 | |
| ACB-RFB(V)-CA | 97.51 | 98.19 | 94.14 | 95.22 | |
| ACB- RFB (H)-CA | 97.97 | 98.53 | 95.17 | 96.07 | |
| DeepGlobe | Baseline | 92.94 | 87.14 | 79.94 | 87.11 |
| ACB | 93.53 | 90.12 | 82.04 | 88.27 | |
| ACB- RFB(V) | 94.38 | 91.11 | 84.04 | 89.66 | |
| ACB- RFB(H) | 94.58 | 90.77 | 84.39 | 89.96 | |
| ACB- RFB(V)-CA | 94.78 | 90.97 | 84.86 | 90.28 | |
| ACB- RFB(H)-CA | 95.05 | 91.27 | 85.54 | 90.74 |
Table 5.
The results of the experiment regarding the input size (%).
| Dataset | Input_Size | PA | mPA | mIoU | FWIoU |
|---|---|---|---|---|---|
| ZY-3 | [480,480,3] | 97.97 | 98.53 | 95.17 | 96.07 |
| [256,256,3] | 97.27 | 97.87 | 93.60 | 94.77 | |
| [224,224,3] | 97.27 | 97.82 | 93.59 | 94.77 | |
| DeepGlobe | [480,480,3] | 95.05 | 91.27 | 85.54 | 90.74 |
| [256,256,3] | 92.14 | 85.42 | 77.84 | 85.75 | |
| [224,224,3] | 92.37 | 86.05 | 78.50 | 86.16 |
Table 6.
The results of the experiment regarding the loss (%).
| Loss | PA | mPA | MIoU | FWIoU |
|---|---|---|---|---|
| both Dice and CE losses (α = β = 0.5) | 97.24 | 97.84 | 93.56 | 94.74 |
| both Dice and CE losses (α = β = 2.0) | 97.26 | 97.86 | 93.58 | 94.76 |
| both Dice and CE losses (α = β = 1.0) | 97.27 | 97.87 | 93.60 | 94.77 |
| both Dice and CE losses (α = 1, β = 0.5) | 97.24 | 97.83 | 93.54 | 94.73 |
| both Dice and CE losses (α = 1, β = 2.0) | 97.25 | 97.85 | 93.56 | 94.74 |
Publisher’s Note: MDPI stays neutral with regard to jurisdictional claims in published maps and institutional affiliations. |
© 2022 by the authors. Licensee MDPI, Basel, Switzerland. This article is an open access article distributed under the terms and conditions of the Creative Commons Attribution (CC BY) license (https://creativecommons.org/licenses/by/4.0/).
Share and Cite
MDPI and ACS Style
Niu, X.; Zeng, Q.; Luo, X.; Chen, L. FCAU-Net for the Semantic Segmentation of Fine-Resolution Remotely Sensed Images. Remote Sens. 2022, 14, 215. https://0-doi-org.brum.beds.ac.uk/10.3390/rs14010215
AMA Style
Niu X, Zeng Q, Luo X, Chen L. FCAU-Net for the Semantic Segmentation of Fine-Resolution Remotely Sensed Images. Remote Sensing. 2022; 14(1):215. https://0-doi-org.brum.beds.ac.uk/10.3390/rs14010215
Chicago/Turabian StyleNiu, Xuerui, Qiaolin Zeng, Xiaobo Luo, and Liangfu Chen. 2022. "FCAU-Net for the Semantic Segmentation of Fine-Resolution Remotely Sensed Images" Remote Sensing 14, no. 1: 215. https://0-doi-org.brum.beds.ac.uk/10.3390/rs14010215
Note that from the first issue of 2016, this journal uses article numbers instead of page numbers. See further details here.