
Calibration of Automatic Sun Photometer with Temperature Correction in Field Environment


1
Key Laboratory of Photoelectronic Imaging Technology and System of Ministry of Education of China, School of Optics and Photonics, Beijing Institute of Technology, Beijing 100081, China
2
Key Laboratory of Radiometric Calibration and Validation for Environmental Satellites, National Satellite Meteorological Center, China Meteorological Administration, Beijing 100081, China
*
Author to whom correspondence should be addressed.
Remote Sens. 2022, 14(1), 66; https://0-doi-org.brum.beds.ac.uk/10.3390/rs14010066
Submission received: 18 November 2021
/
Revised: 21 December 2021
/
Accepted: 22 December 2021
/
Published: 24 December 2021
(This article belongs to the Section Atmospheric Remote Sensing)
Abstract
:Aerosol optical depth (AOD) is an important atmospheric correction parameter in remote sensing. In order to obtain AOD accurately, the surface-based automatic sun photometer needs to carry out calibration regularly. The normally used Langley method can be effective only when the AOD and the calibration coefficients of the instrument remain unchanged throughout the day. However, when observing the AOD with CE318 sun photometer in field environment, it was found that the AOD of silicon (Si) detector at 1020 nm and indium gallium arsenide (InGaAs) detector at 1639 nm was strongly influenced by temperature due to the large temperature difference at the Dunhuang site. Based on the corresponding relationship between AOD and wavelength, the model of the calibration coefficients varying with temperature was established by nonlinear regression method in field environment. By comparing the AOD before and after temperature correction with the theoretical one, the ratio of data with relative error (RE) less than 5% increased from 0.195 and 0.14 to 0.894 and 0.355, respectively. By this method, calibration can be carried out without the limit of constant AOD. In addition, it is simpler, more convenient, and less costly to perform temperature correction in a field environment than in a laboratory.
1. Introduction
The measurement accuracy of field spectroradiometers, such as the sun photometer CE318, is easily affected by the ambient temperature [1,2], especially in a typical continental climate area, such as Dunhuang, with a relatively large temperature difference between day and night. For the sun photometer CE318, the measurement error of Si detector at 1020 nm can reach about 0.3% [3], and InGaAs detector at 1639 nm can reach about 1% [4], respectively, when the ambient temperature changes by 1 °C. The maximum working temperature difference of CE318 at the Dunhuang site can exceed 70 °C [5]. This may cause a huge measurement error. If the measurement error due to temperature difference is not considered, the incorrect calibration coefficients and retrieval results will be obtained by the observation data of CE318. Therefore, it is quite important to perform temperature correction on CE318.
In the current research work on temperature correction, Li et al. carried out a laboratory study on the temperature effects on CE318 in polar region and achieved temperature correction in 2013 [6]. In 2019, Li et al. studied on the temperature correction for radiometric instruments in laboratory and proposed a general polynomial temperature correction functional method for the Si detector (950–1000 nm) and InGaAs detector (1000–1850 nm). In addition, the deviation of the measured value from the calibration value of these two detectors were controlled to within 1% by this method [1]. In 2019, Giles et al. used different temperature coefficients achieved in laboratory of different wavelength to correct actual measured voltage data of sun photometers in the Aerosol Robotic Network (AERONET) [7]. In 2021, Wu et al. used polynomial fitting and least squares to establish a functional relationship between responsivity and temperature of radiometer in laboratory. It was shown that the correspondence between responsivity and temperature could be used to address the accuracy of measurements under different environmental conditions [2].
It can be seen that the current study on temperature correction of radiometric instruments is mostly carried out in the laboratory. This kind of correction method is costly and makes observation data vacant for the automatic observation.
Therefore, in this paper, we proposed a new calibration method with temperature correction of sun photometer to improve the AOD retrieval accuracy at the Dunhuang site by nonlinear regression method based on the corresponding relationship between AOD and wavelength. The temperature correction is performed by data measured in the field rather than in the laboratory. It would be simpler, more convenient, and less costly. At the same time, the calibration of sun photometer is performed under a changeable AOD, which is easier to achieve than the normal method.
2. Instrument and Data
CE318-T593 is manufactured by CIMEL Company in Paris, France. It is mainly used to measure direct and diffuse solar radiation in different wavelengths, directions, and time. The measured data can be used to derive the characteristic of atmospheric aerosol, water vapor, and other components. CE318-T593 has 10 bands, and their specific information is shown in Table 1 [7,8,9,10]; ECW is the equivalent center wavelength.
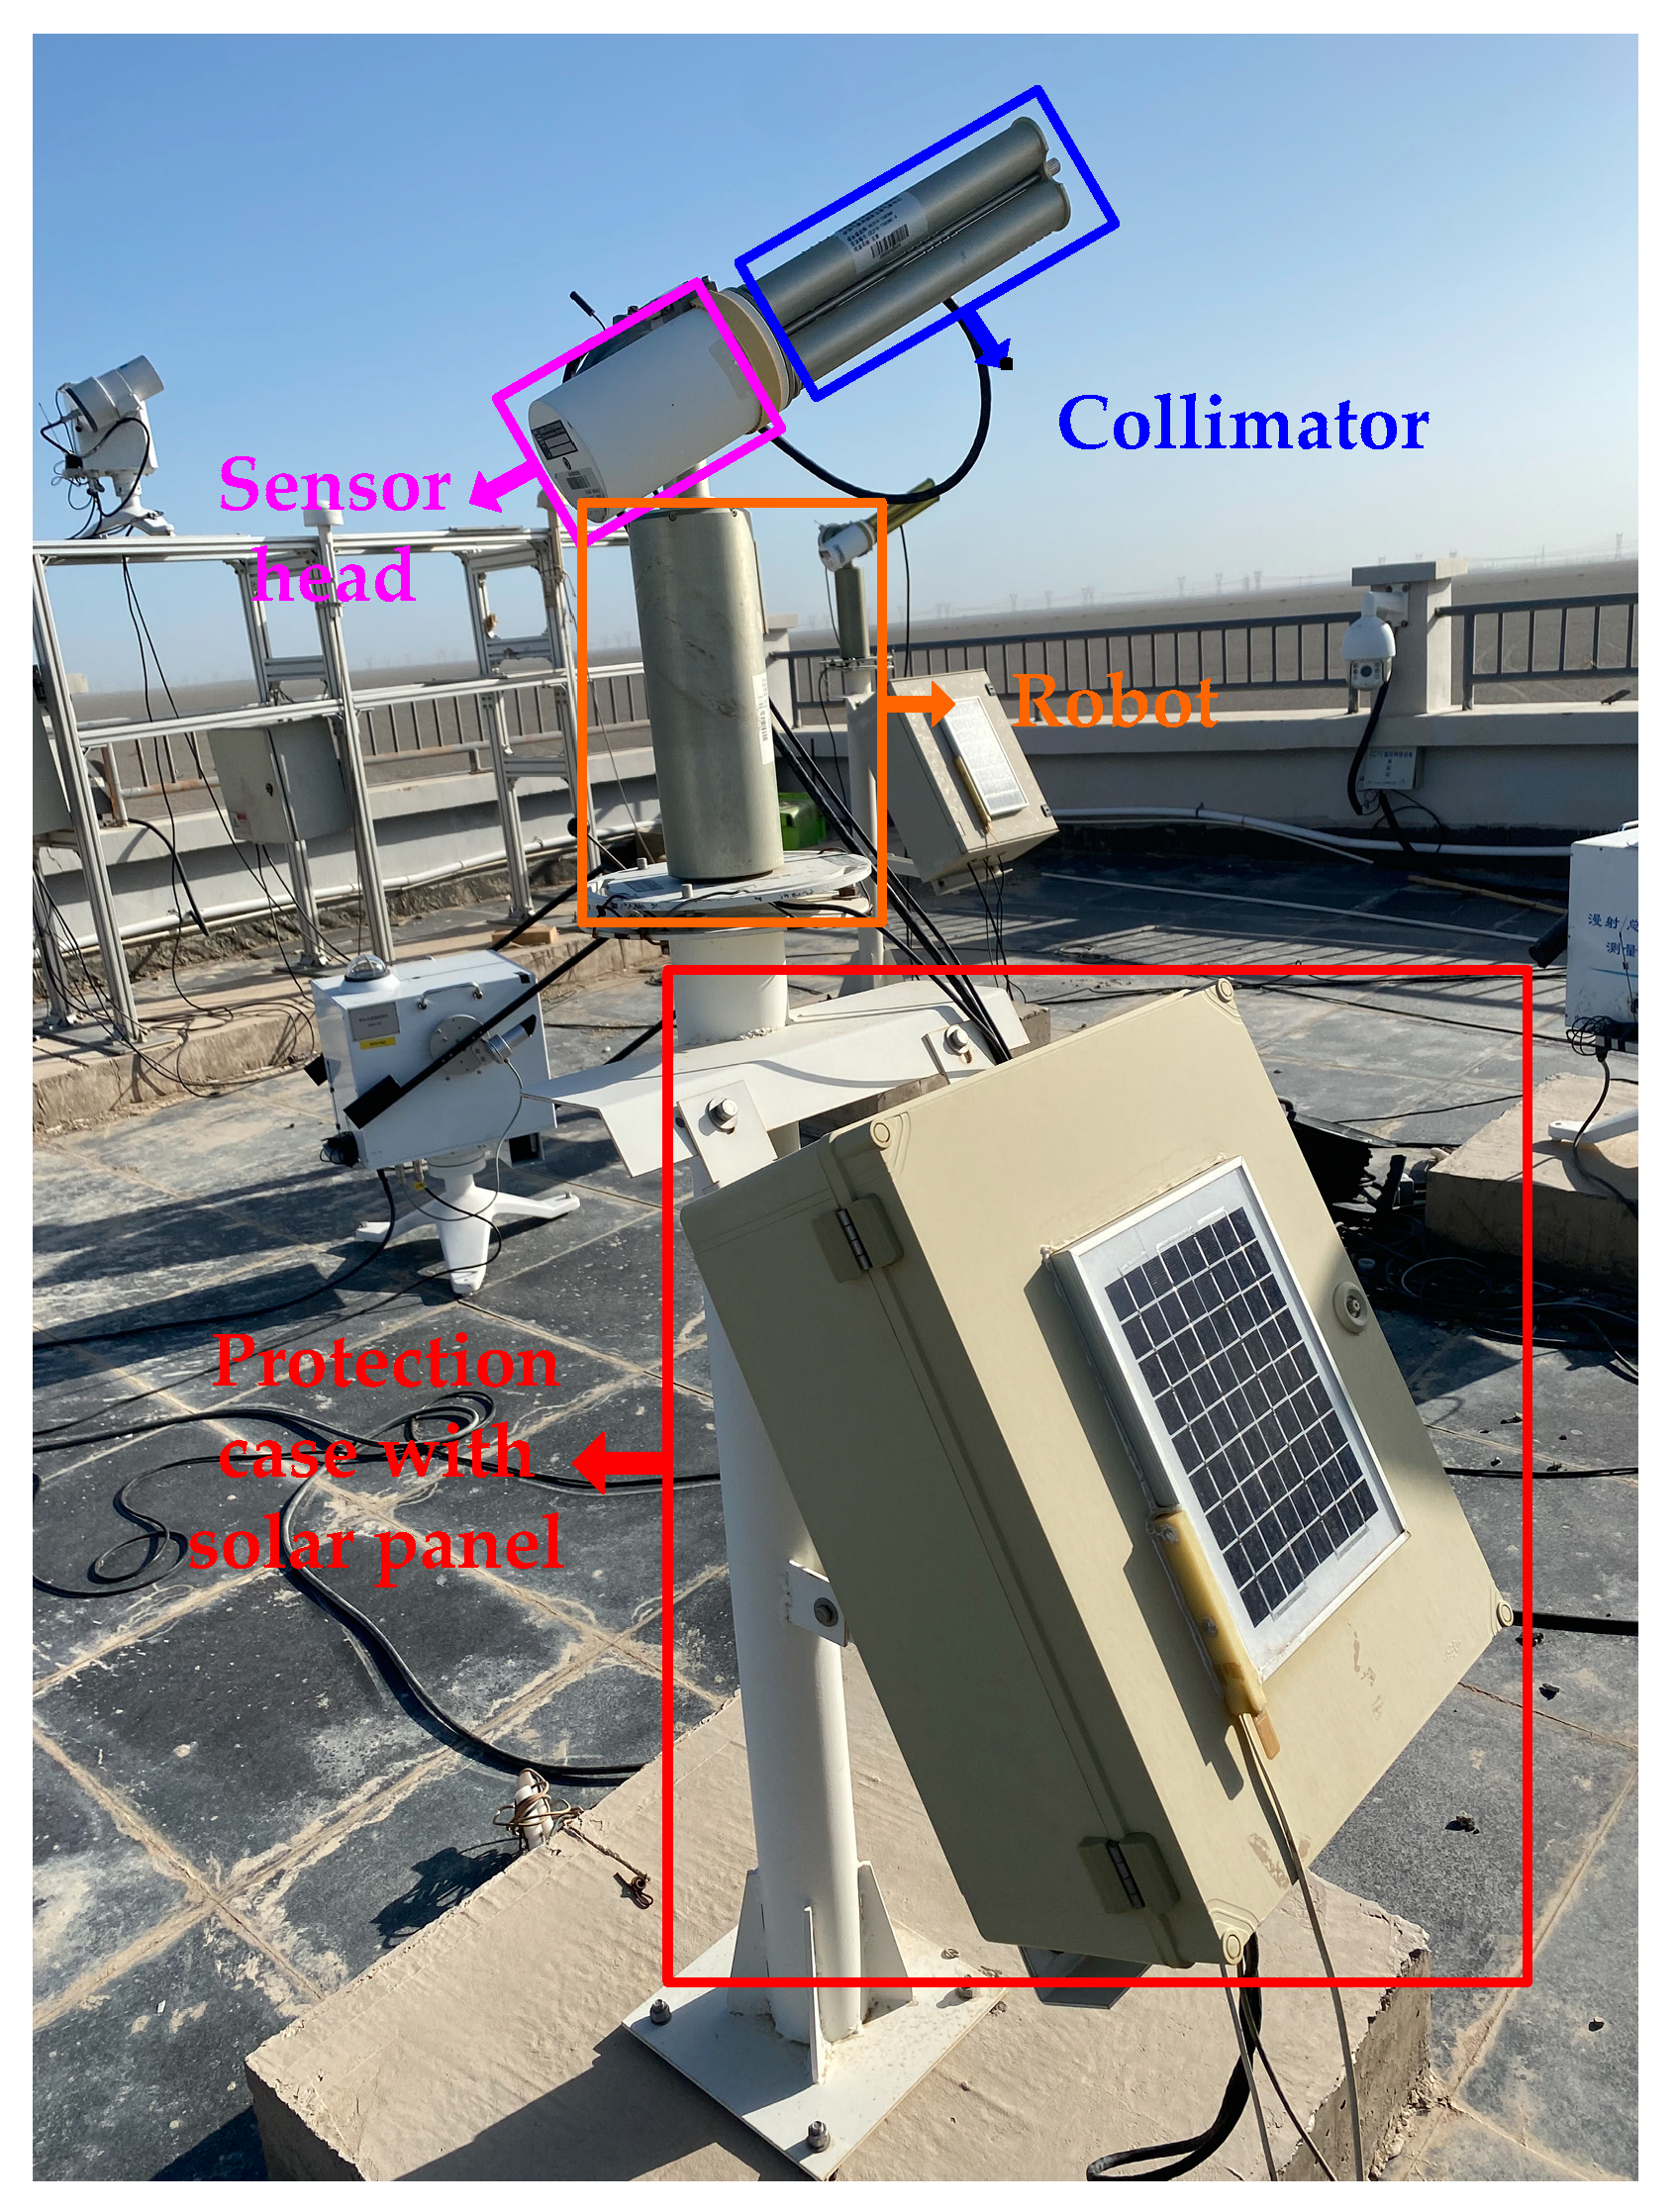
The CE318-T593 observing in automatic observation base of Dunhuang radiometric calibration test site (40.09° N, 94.40° E) [11,12] is shown in Figure 1. It mainly consists of a sensor head and a collimator, a protection case with solar panel, and a robot that controls two mutually perpendicular rotation axes [10]. Due to preferable aerosol conditions in the morning, the voltage and temperature data measured by CE318-T593 between 8:00 and 13:00 every day in the whole year of 2020 were selected. There are 8969 data points in total.
3. Method
Firstly, the raw voltage data measured by CE318-T593 sun photometer were screened. The weighted Langley method was performed to obtain the calibration coefficients and the corresponding AOD on each band. Data were screened again based on AOD to remove the cloud-containing data. The model of the calibration coefficients changing with temperature was established under the assumption that the two bands of 870 nm and 440 nm were free of gas absorption and not influenced by temperature. Finally, the model mentioned above was used to calibrate bands that were strongly influenced by temperature.
3.1. Voltage Data Screening
Since CE318-T593 is installed in field environment, it is affected by many factors, such as wind, frost, rain, snow, and sand, as well as temperature. Therefore, before temperature correction, it is necessary to carry out strict quality control on the raw voltage data and eliminate data that is affected by other factors as much as possible. According to Giles et al. [7], the preliminary screening steps of the voltage data (expressed by digital number ()) are listed below.
- Delete the voltage data on all bands when “ < 100” occurs at 870 nm or 1020 nm (InGaAs).
- If the of the voltage triplet values is greater than 0.2 on a certain band, the voltage data on all bands are deleted at this moment. is the root mean square of the voltage triplet values, and is the average of the voltage triplet values.
- Delete voltage data if the air mass factor (AMF) is outside the range of 2 to 7.
- After the above steps, all the measured data on this day need to be deleted if the number of remaining data points is less than 3 or 10% × (take the maximum of the two numbers), where is the number of points of the raw voltage data.
3.2. Weighted Langley Calibration
According to Beer-Lambert-Bouguer law [13,14], if the voltage value is proportional to the intensity of direct solar radiation, the relationship between the voltage value and the corresponding AOD can be represented in Equation (1).
Equation (2) is obtained by taking the logarithm of Equation (1).
where is the sun-earth distance correction factor which is the square of the ratio of the actual sun-earth distance to the average sun-earth distance; is the wavelength in nm; is the calibration coefficients on the wavelength ; is the AMF; is the total optical depth.
can be expressed by Equation (3), where is the optical depth due to rayleigh scattering; is AOD; is the optical depth due to various absorbing gases. The minor adverse effects of the tiny absorbing gas can be negligible compared to the impact of temperature on the retrieval of AOD on 1020 nm, 1639 nm, 870 nm, and 440 nm. Therefore, is taken as 0 on these bands in this paper [7].
However, the classical Langley method ignores small random AOD fluctuations at larger , which can lead to fluctuations of . In order to avoid the effect of fluctuations while calibrating, the weighted Langley method [15] was selected in this paper. This method is described in Equation (4). At this time, can be obtained from the slope of the fitted line of and .
3.3. AOD Retrieval
After obtaining calibration coefficients [16,17], the estimated AOD on the corresponding bands of CE318-T593 can be retrieved by the weighted Langley method.
As for the theoretical AOD, the method proposed by Angstrom is generally used for the calculation. It is shown in Equation (5), where is the Angstrom atmospheric turbidity coefficient, and is the wavelength index. AOD at the wavelength of 870 nm and 440 nm are generally chosen to obtain and , so that the theoretical AOD at any wavelength can be obtained [18,19,20].
Equation (6) is obtained by taking the logarithm of Equation (5) and regarding as and as .
3.4. Cloud Data Screening
3.5. Temperature Correction
The temperature correction method is described in Equations (7)–(10). Let be , and Equation (7) is obtained by associating Equations (2) and (3).
After selecting two known bands, the following system of Equation (8) can be listed by associating Equations (6) and (7), where and are 2 different band numbers of CE318-T593; and denote ECW corresponding to bands and , respectively.
As for the two selected known bands, it is necessary not only that gas absorption is less but also that they are less affected by temperature. The gas absorption of 870 nm and 440 nm are less than other bands of CE318, according to Giles [7]. Moreover, Si detector at 300–900 nm is less affected by temperature compared to Si detector at 1020 nm [1,2,3,7], and InGaAs detector at 1639 nm [4]. As a result, 870 nm and 440 nm were selected as and bands, respectively, and it was assumed that these two bands were not affected by temperature in this paper. Therefore, and at different moments can be obtained by Equation (8). The expressions of and are shown in Equation (9).
After that, on the band, which is much affected by temperature, can be calculated, and the corresponding calibration coefficients at different temperature can be obtained, at the same time. Therefore, the relationship of the calibration coefficients and temperature is fitted by Equation (10).
where is the fitting order; denotes the temperature in °C; … denote the fitting coefficients at wavelength , which means that are calibration coefficients when the temperature is 0 °C, and … are temperature correction coefficients.
4. Results
4.1. Fitting Results
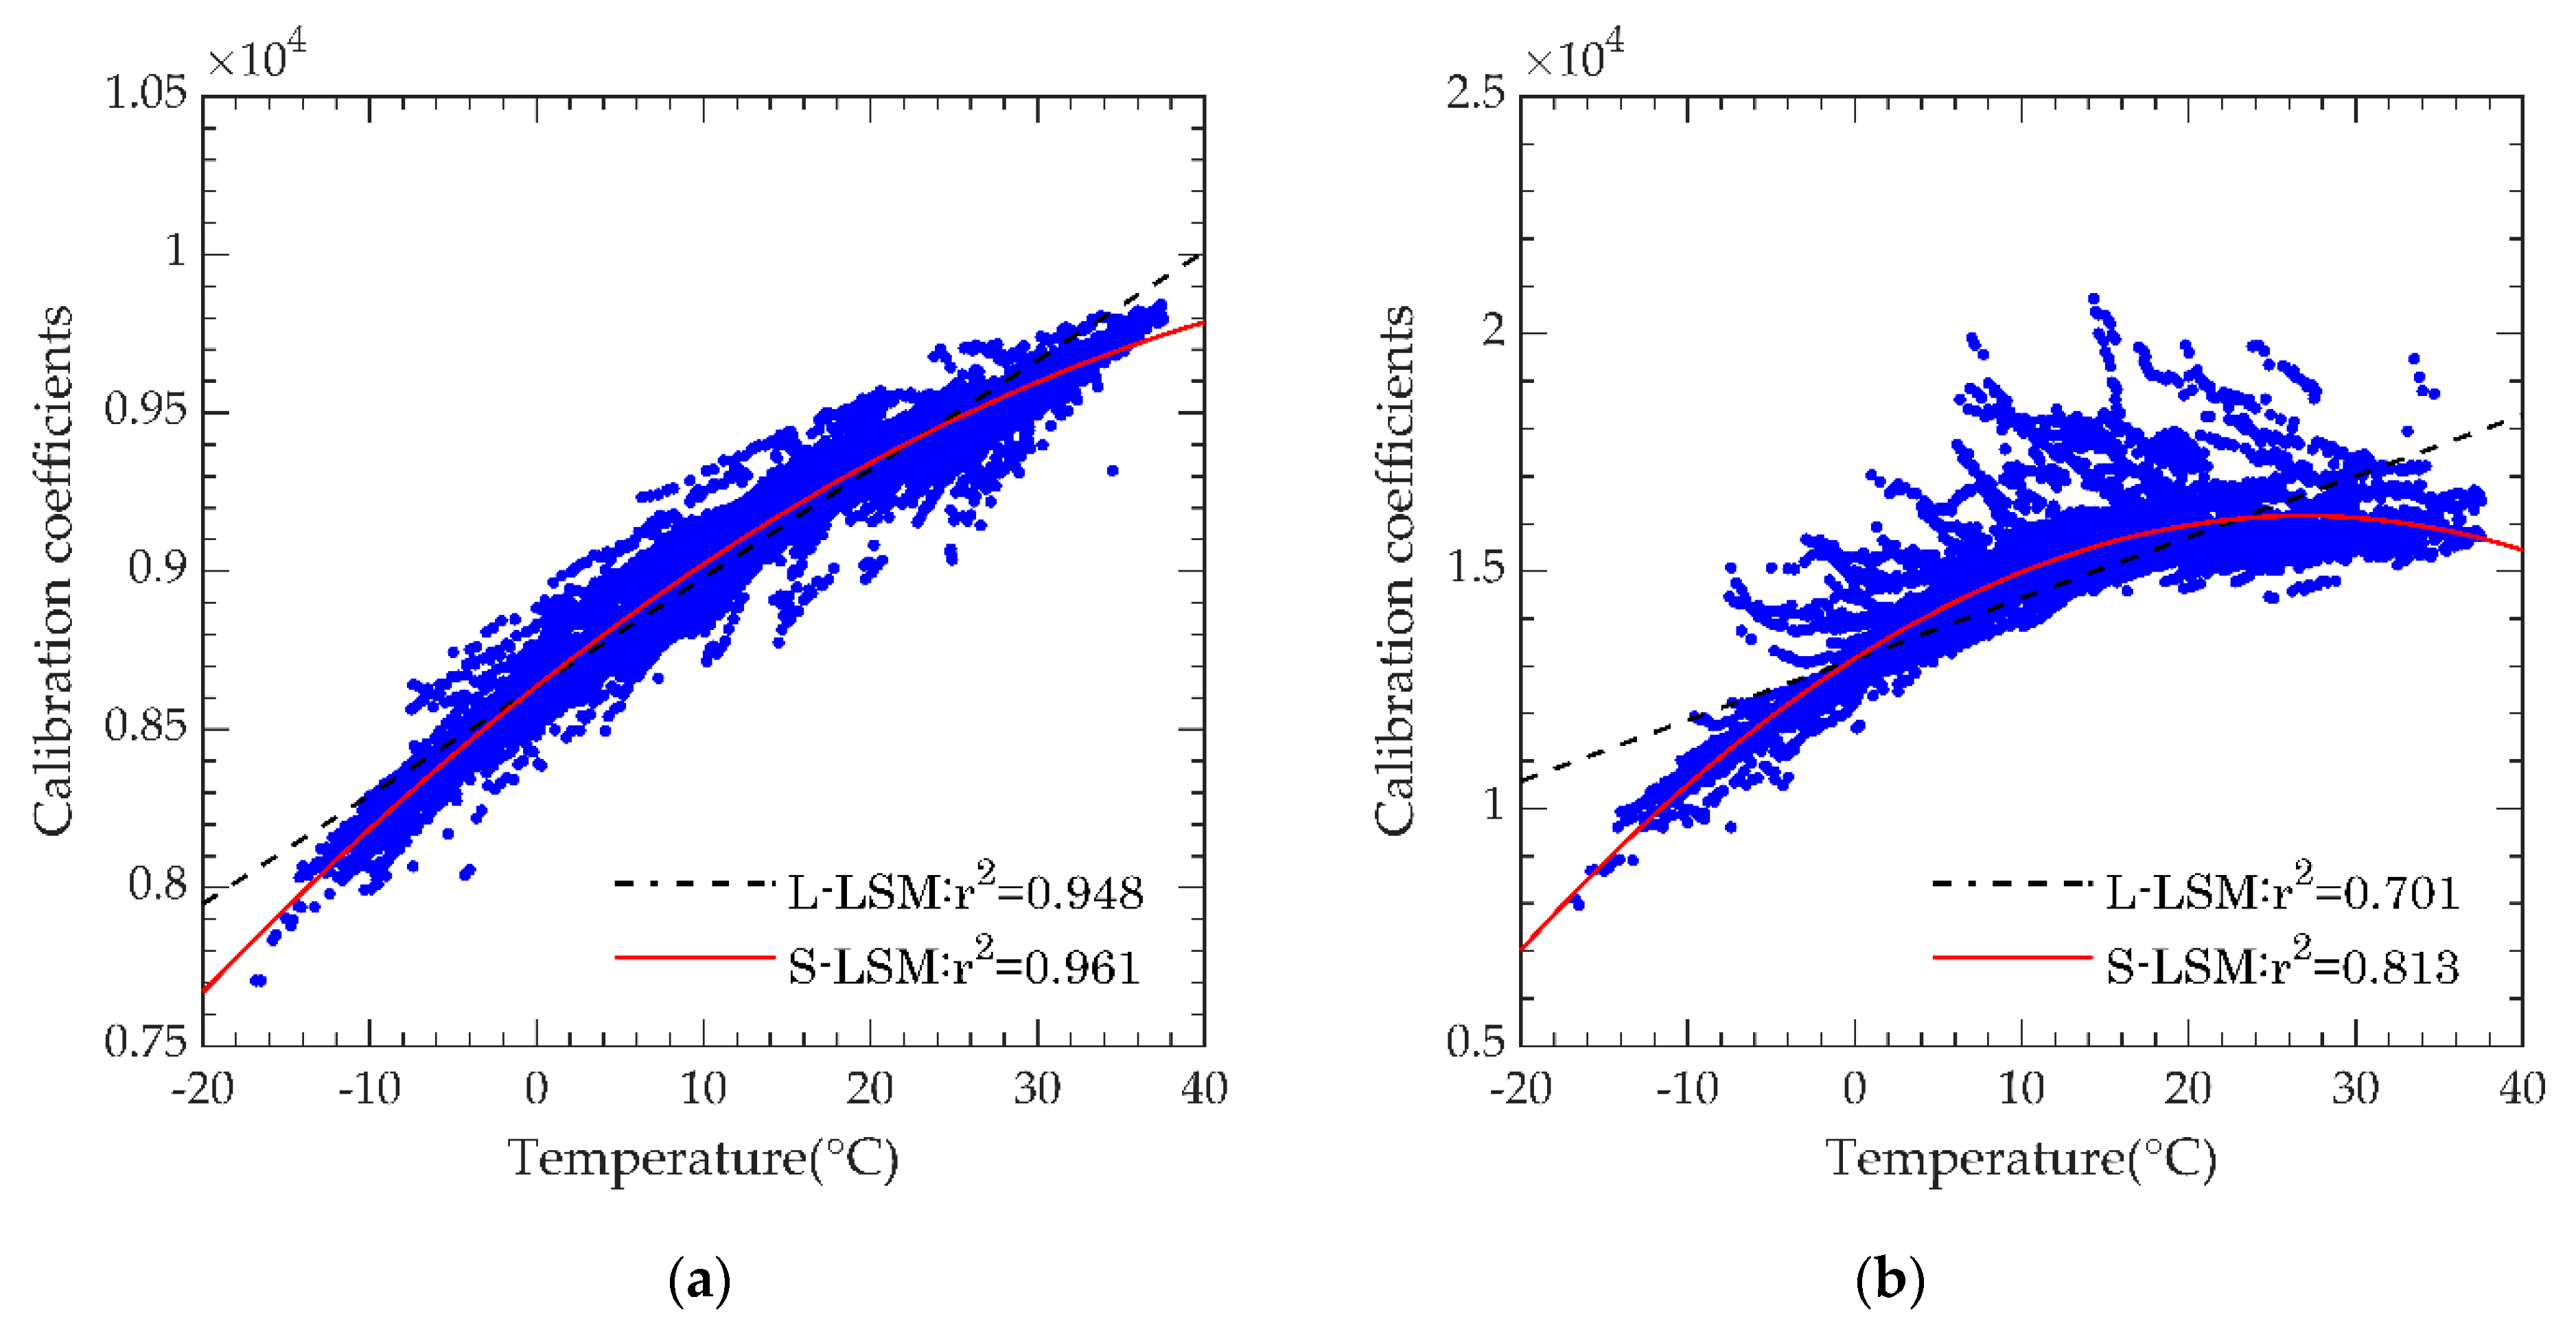
As 1020 nm and 1639 nm were much affected by temperature, temperature correction was performed for each of the two bands. The calibration coefficients of 870 nm and 440 nm in a whole year were used to get the model of the calibration coefficients varying with temperature of 1020 nm and 1639 nm, respectively. Results are shown in Figure 2.
L-LSM represents linear least squares method, and S-LSM represents secondary least squares method. is the correlation coefficient of the fitted curve. From Figure 2, it can be seen that both of S-LSM are better than L-LSM. Therefore, in Equation (10) is 2 in this paper.
As shown in Figure 2a, is −0.3031, and is 41.7067 at 1020 nm. is −3.5293, and is 204.2777 at 1639 nm, from Figure 2b. Therefore, the absolute value of temperature correction coefficients at 1639 nm are bigger than those at 1020 nm, respectively. In other words, InGaAs detector at 1639 nm of CE318 is more susceptible to temperature than Si detector at 1020 nm of CE318, which is also a verification of the previous theory [3,4].
The temperature correction expression for every month is also related to the calibration coefficients at 870 nm and 440 nm of that month. and were fixed to recalculate in Equation (10) for every month, after obtaining the temperature correction expression for a whole year. In addition, results are shown in Table 2.
4.2. Correction Results
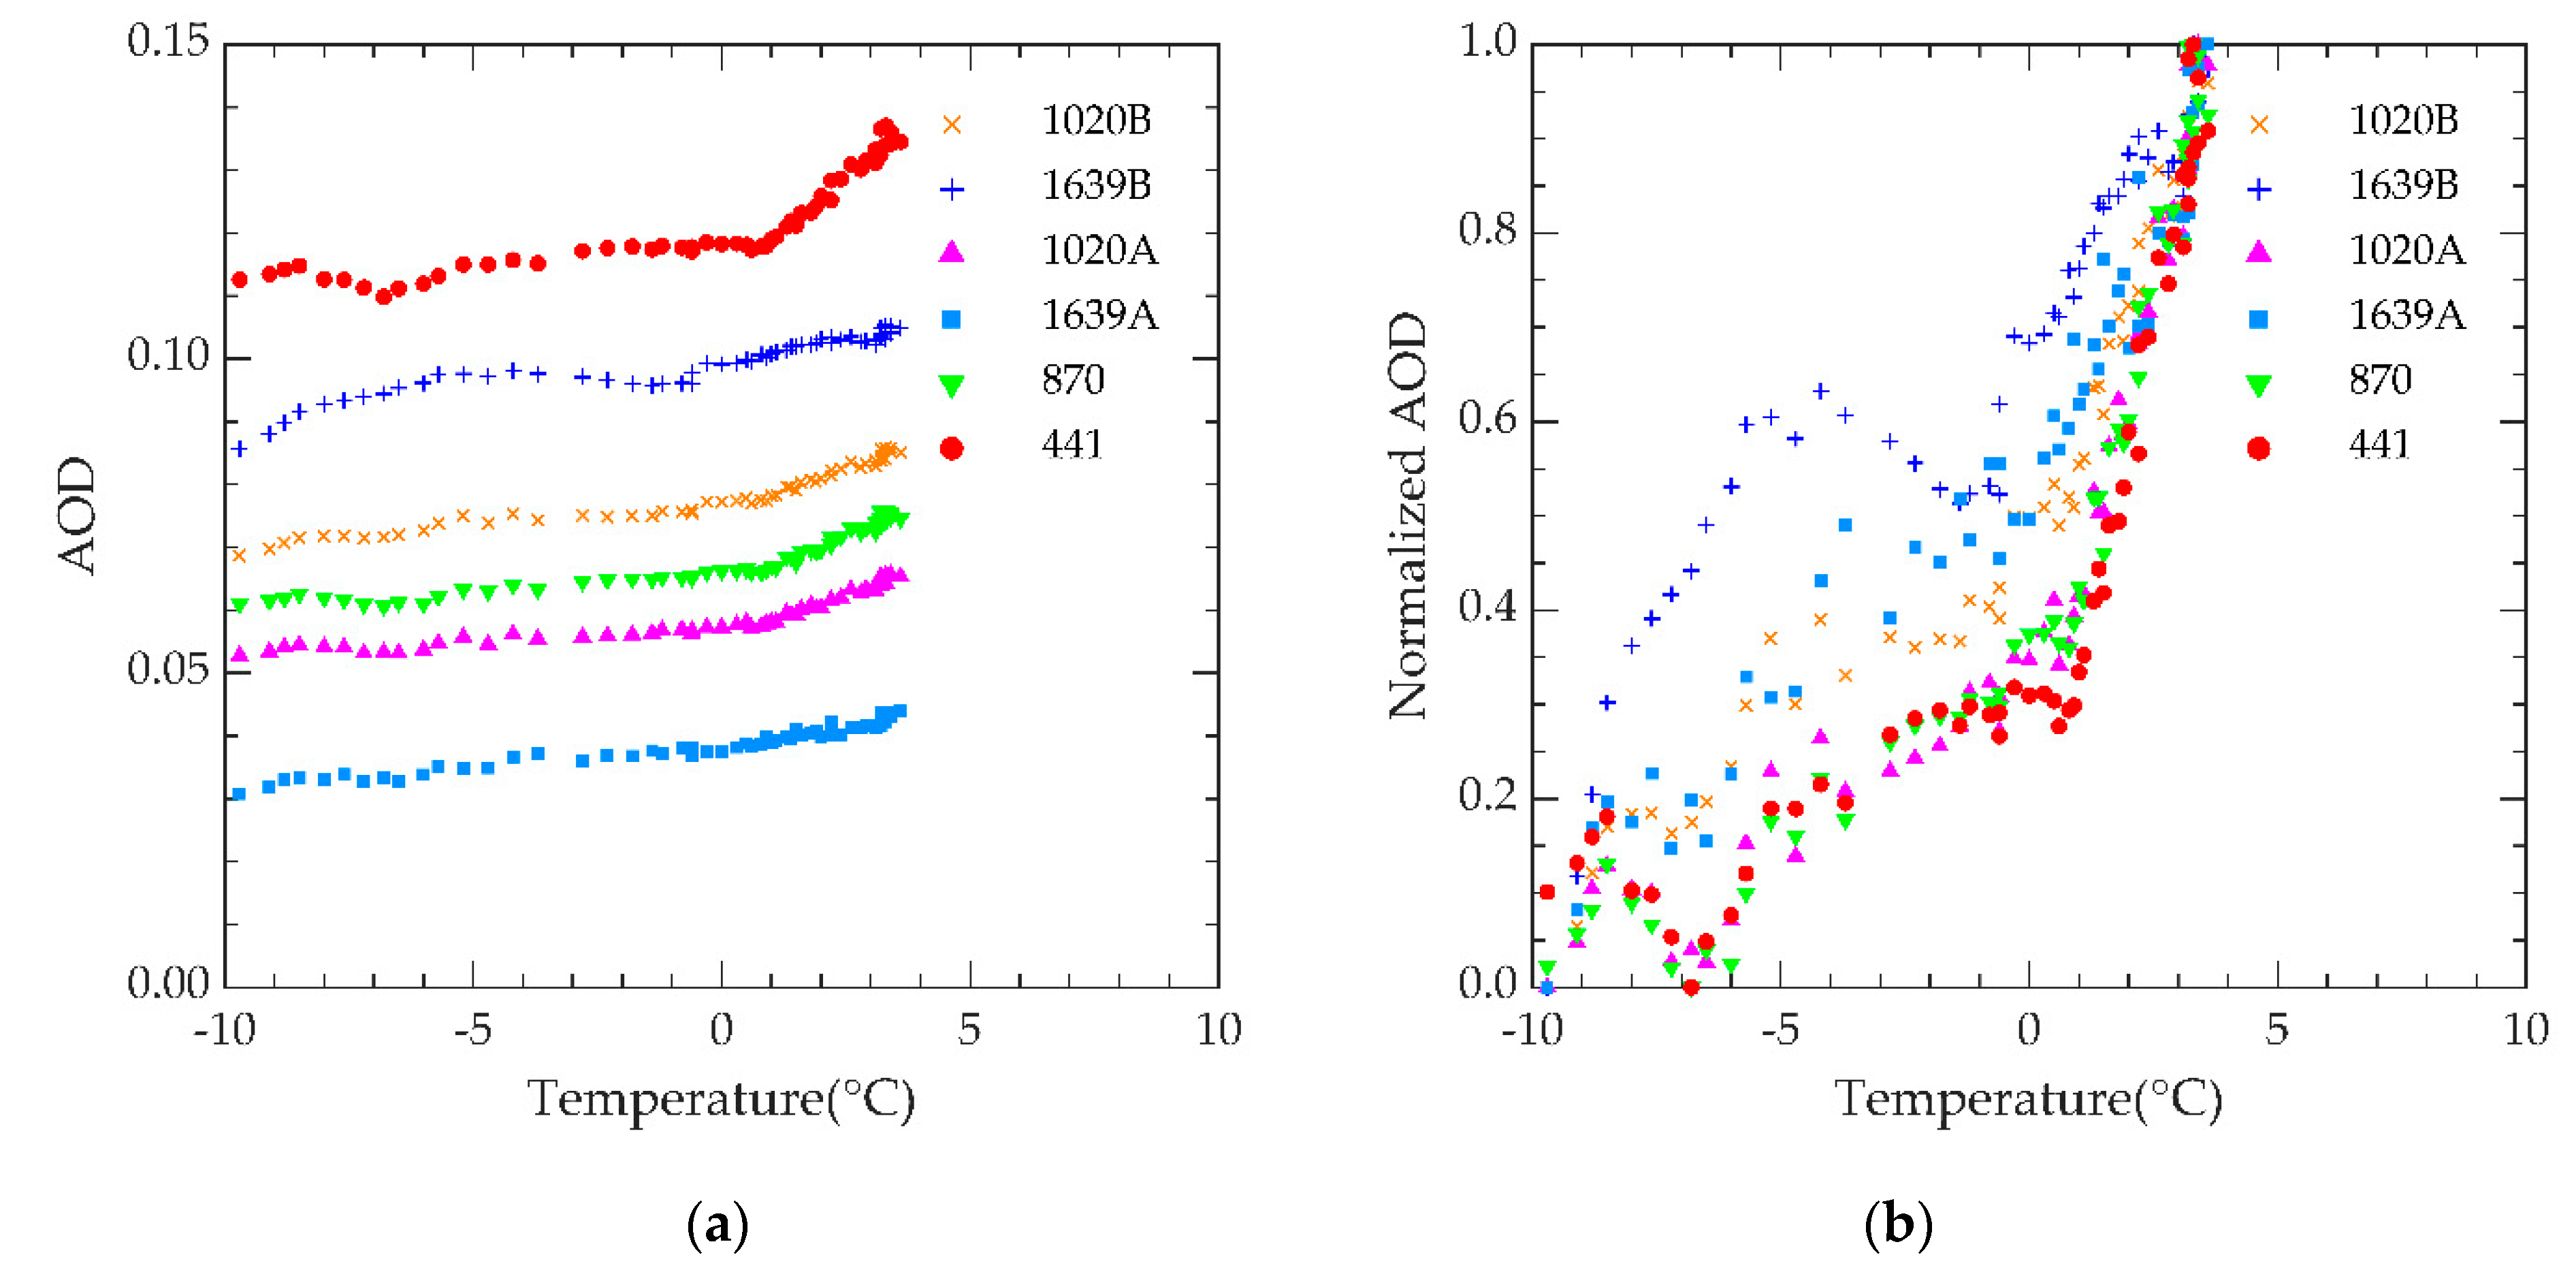
, , and were applied to correct AOD for the corresponding month. In January 2020, is 9096.644 at 1020 nm and 13,416.819 at 1639 nm. Taking 2020.1.30 as an example, the plot of AOD with temperature before and after correction is shown in Figure 3. 1020B represents 1020 nm before temperature correction; 1639B represents 1639 nm before temperature correction; 1020A represents 1020 nm after temperature correction; 1639A represents 1639 nm after temperature correction.
Figure 3a shows that the AOD of 1020 nm and 1639 nm is more consistent with the law of decreasing with the increase of wavelength after temperature correction. Figure 3b shows that the trends of normalized AOD with temperature after temperature correction of 1020 nm and 1639 nm are more similar to that of other bands.
4.3. AOD Comparison
The theoretical AOD of each band at the corresponding moment was obtained by and from Equations (5)–(9). The theoretical AOD of CE318-T593 was selected as the standard value for comparison with the estimated AOD before and after correction at 1020 nm and 1639 nm.
RE of the estimated AOD with the theorical AOD can be calculated by Equation (11). The absolute error (AE) of the estimated AOD with the theorical AOD can be calculated by Equation (12). is the estimated AOD, and is the theoretical AOD.
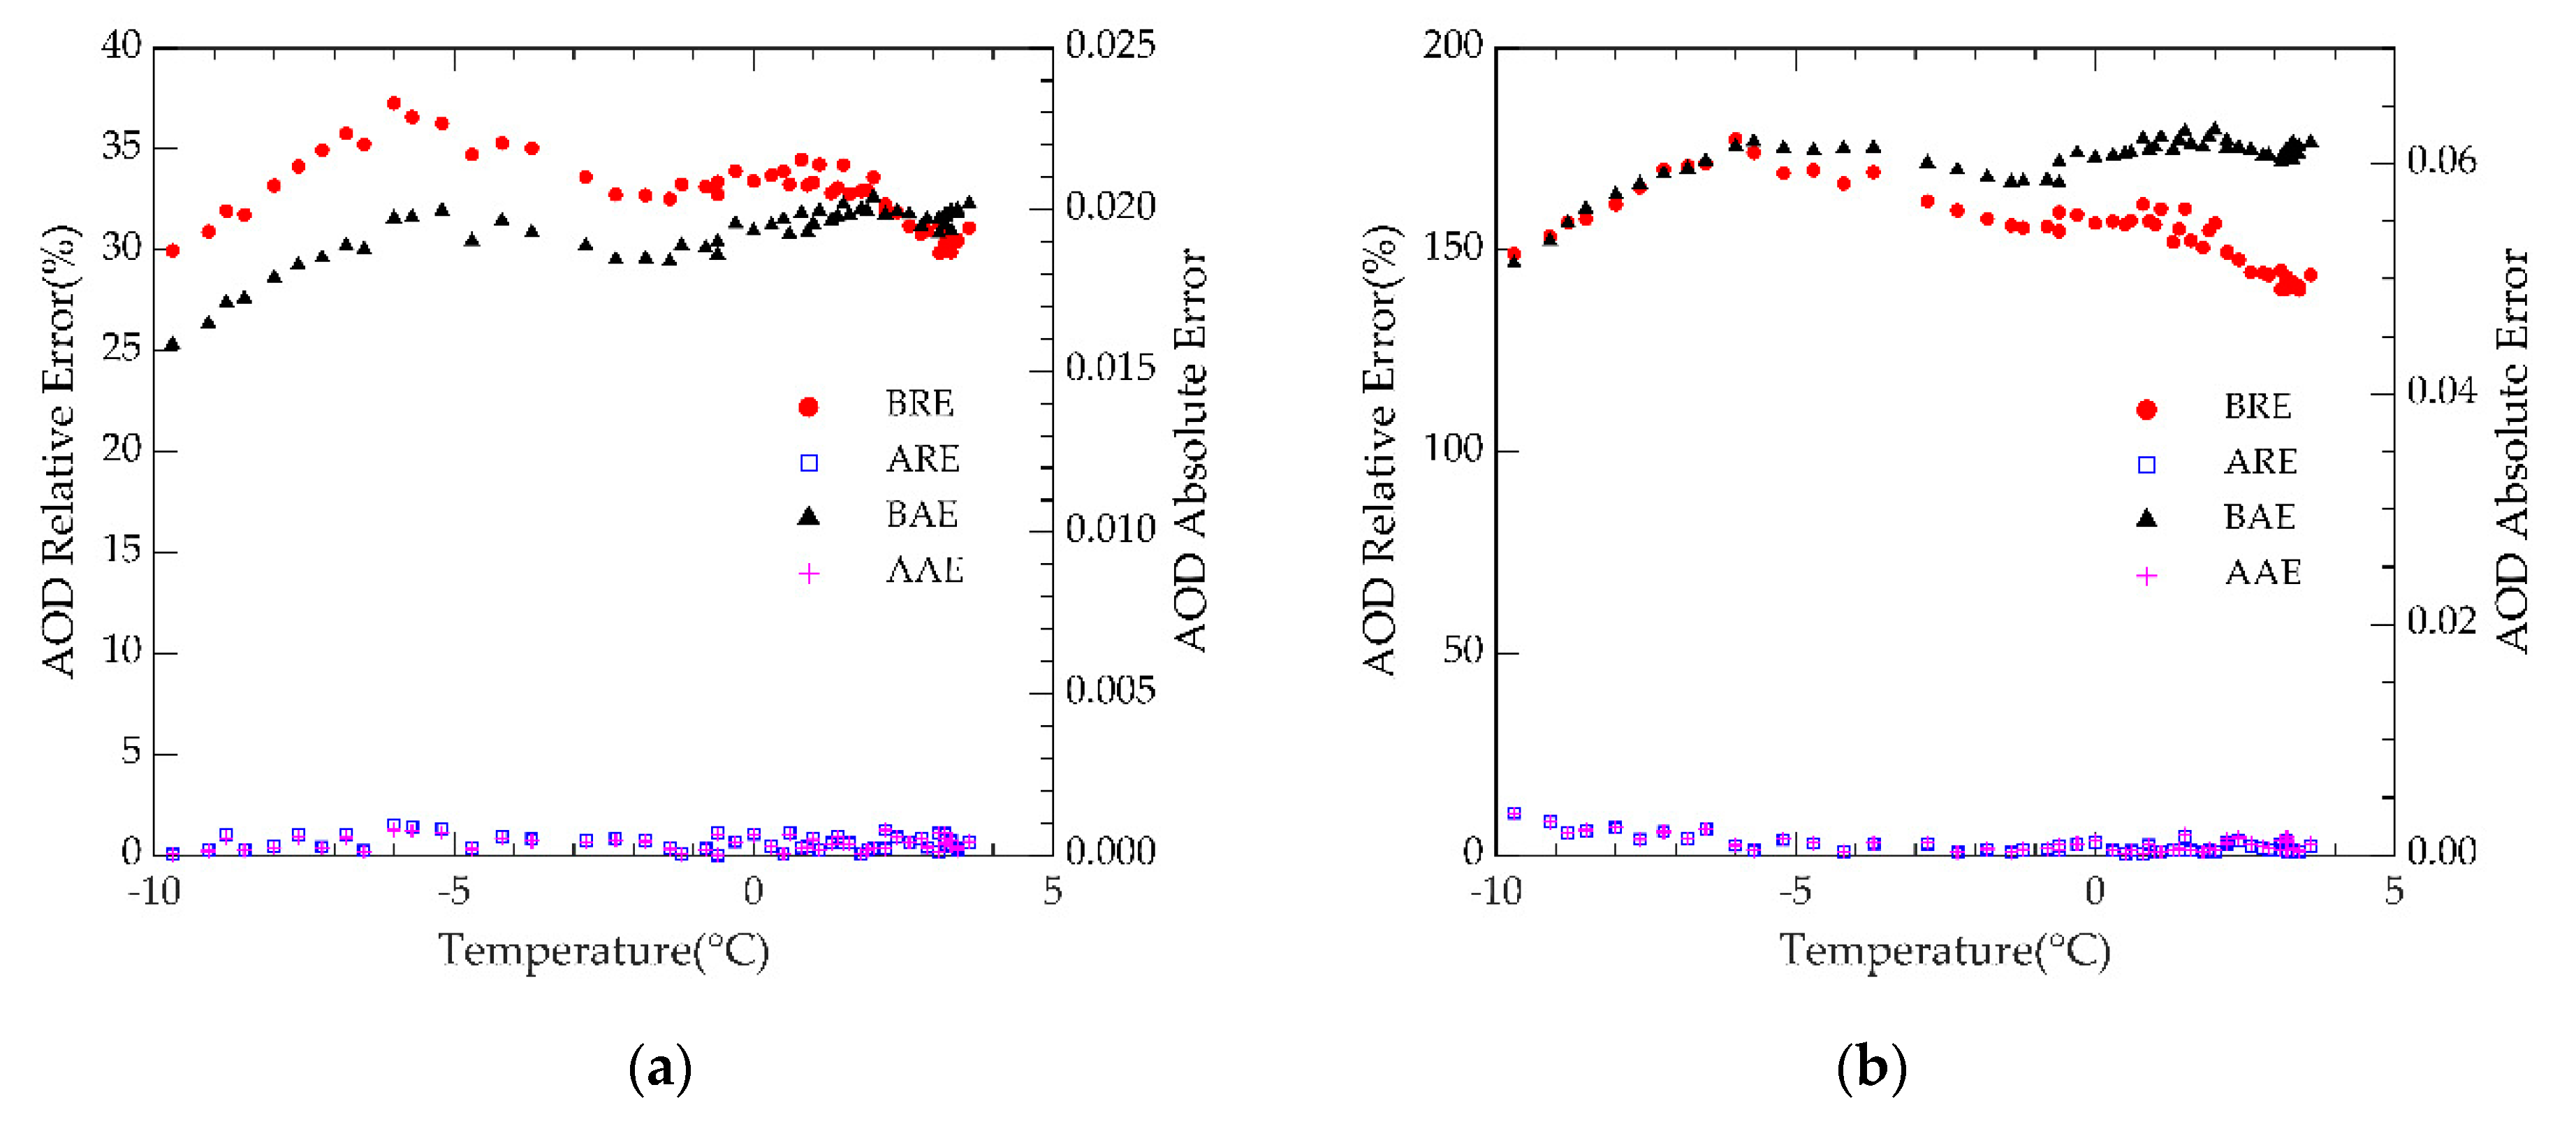
Figure 4 shows RE and AE varying with temperature at 1020 nm and 1639 nm on 30 January 2020. BRE is RE of the estimated AOD before calibration with the theoretical AOD; ARE is RE of the estimated AOD after calibration with the theoretical AOD; BAE is AE of the estimated AOD before calibration with the theoretical AOD; AAE is AE of the estimated AOD after calibration with the theoretical AOD.
From Figure 4a, it can be seen that RE of the estimated AOD with the theoretical AOD at 1020 nm has decreased from more than 29% to within 1.5%, and AE has dropped from about 0.02 to 0. As for 1639 nm, Figure 4b shows that RE of the estimated AOD with the theoretical AOD has decreased from more than 140% to within 10.5%, and AE has dropped from about 0.06 to within 0.003.
5. Validation
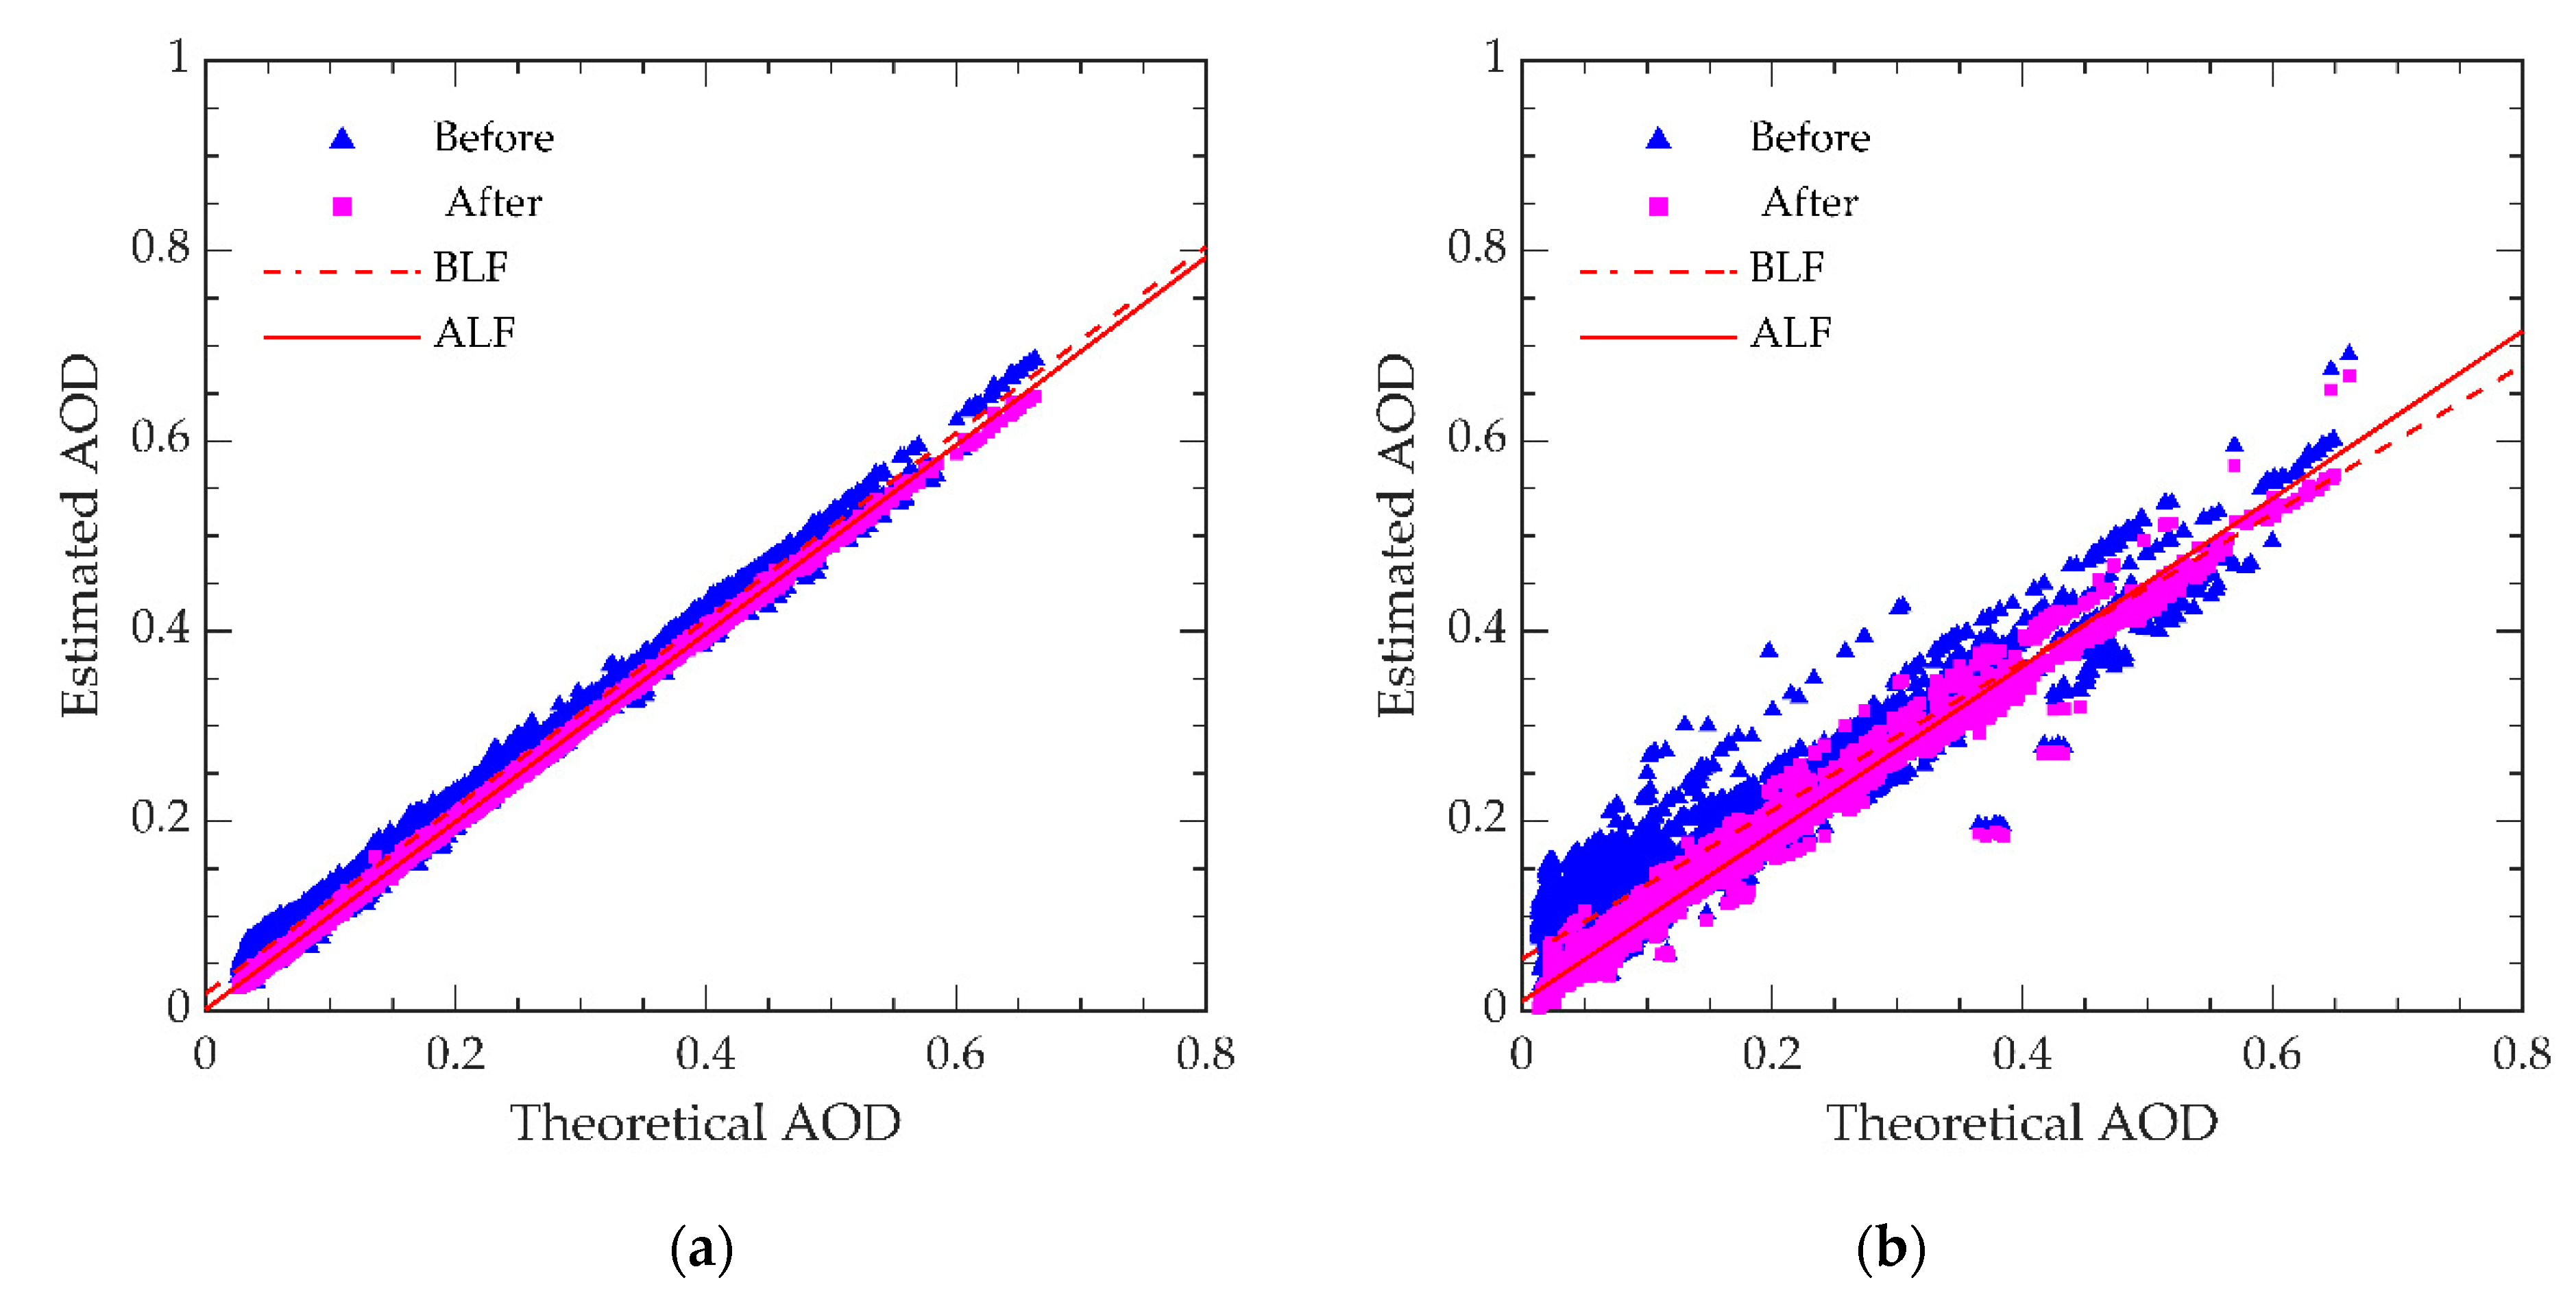
The graphs of 1020 nm and 1639 nm were plotted by taking theoretical AOD as the independent variable and the estimated AOD as the dependent variable, respectively. In addition, L-LSM was performed at the same time. Results are shown in Figure 5, where “Before” is the estimated AOD before correction; “After” is the estimated AOD after correction; BLF is before linear fitting, which is a linear fit to the estimated AOD before correction with the theoretical AOD; ALF is after linear fitting, which is a linear fit to the estimated AOD after correction with the theoretical AOD.
Figure 5a shows that increased from 0.994 to 0.999, and the slope of the fitted line increased from 0.983 to 0.989 at 1020 nm. Figure 5b shows that increased from 0.910 to 0.984, and the slope of the fitted line increased from 0.781 to 0.881 at 1639 nm. This means that the estimated AOD is much closer to the theoretical AOD and less affected by temperature on these two bands.
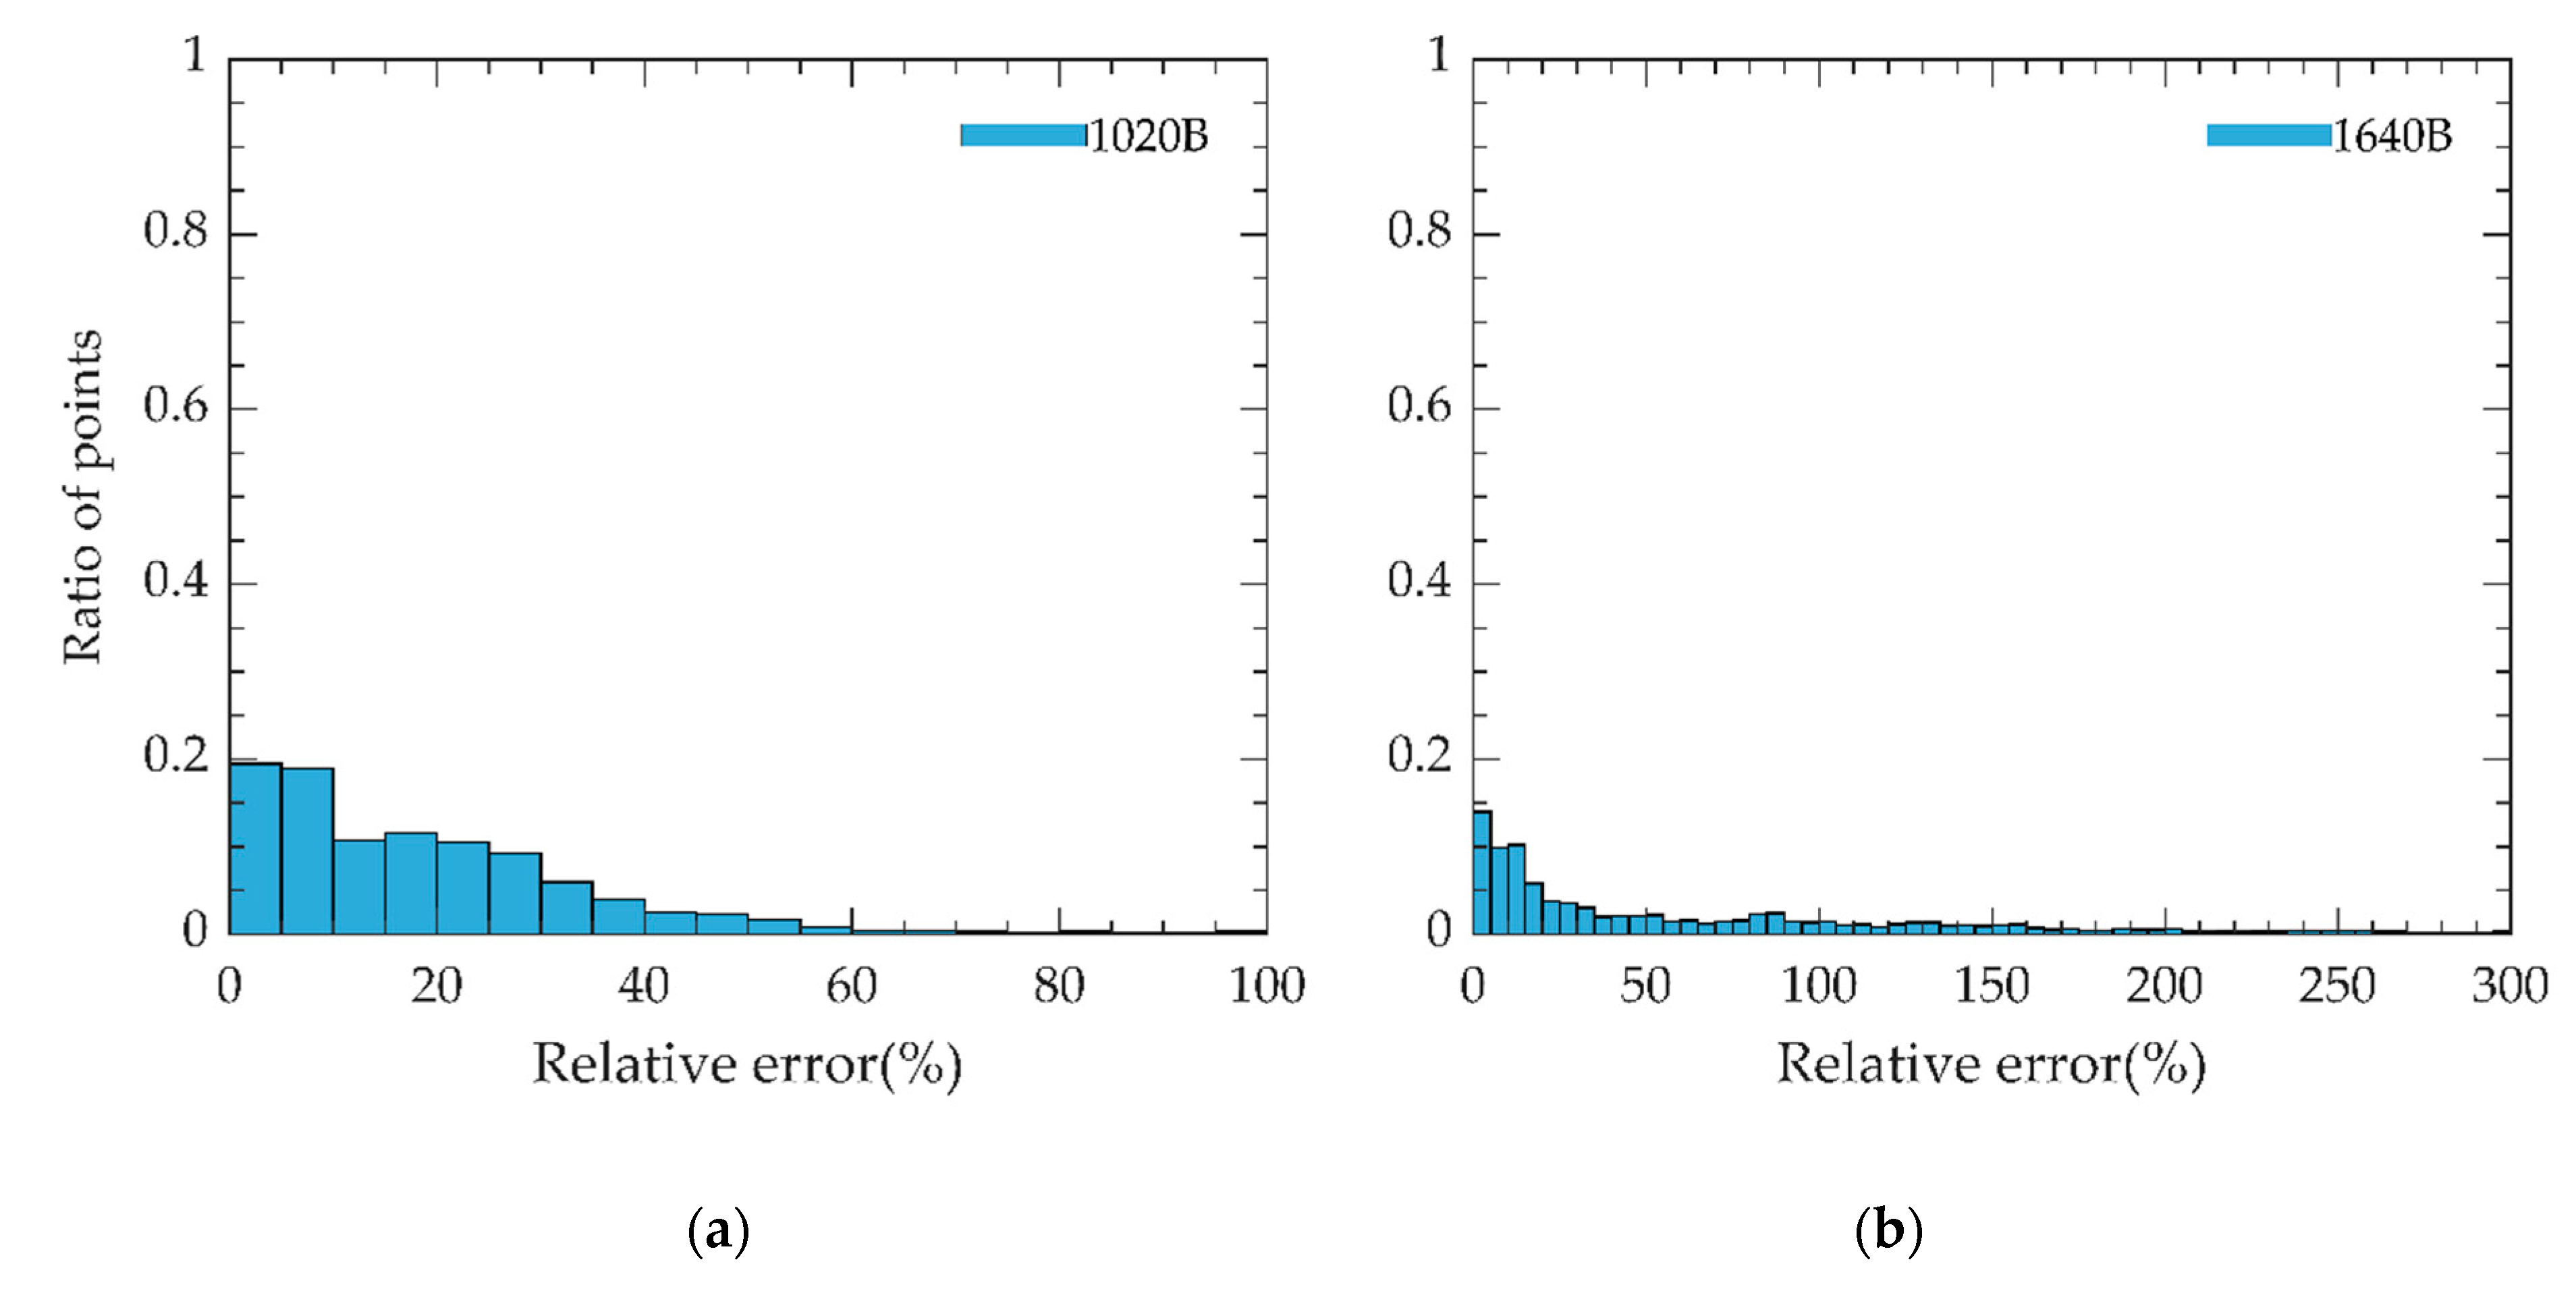
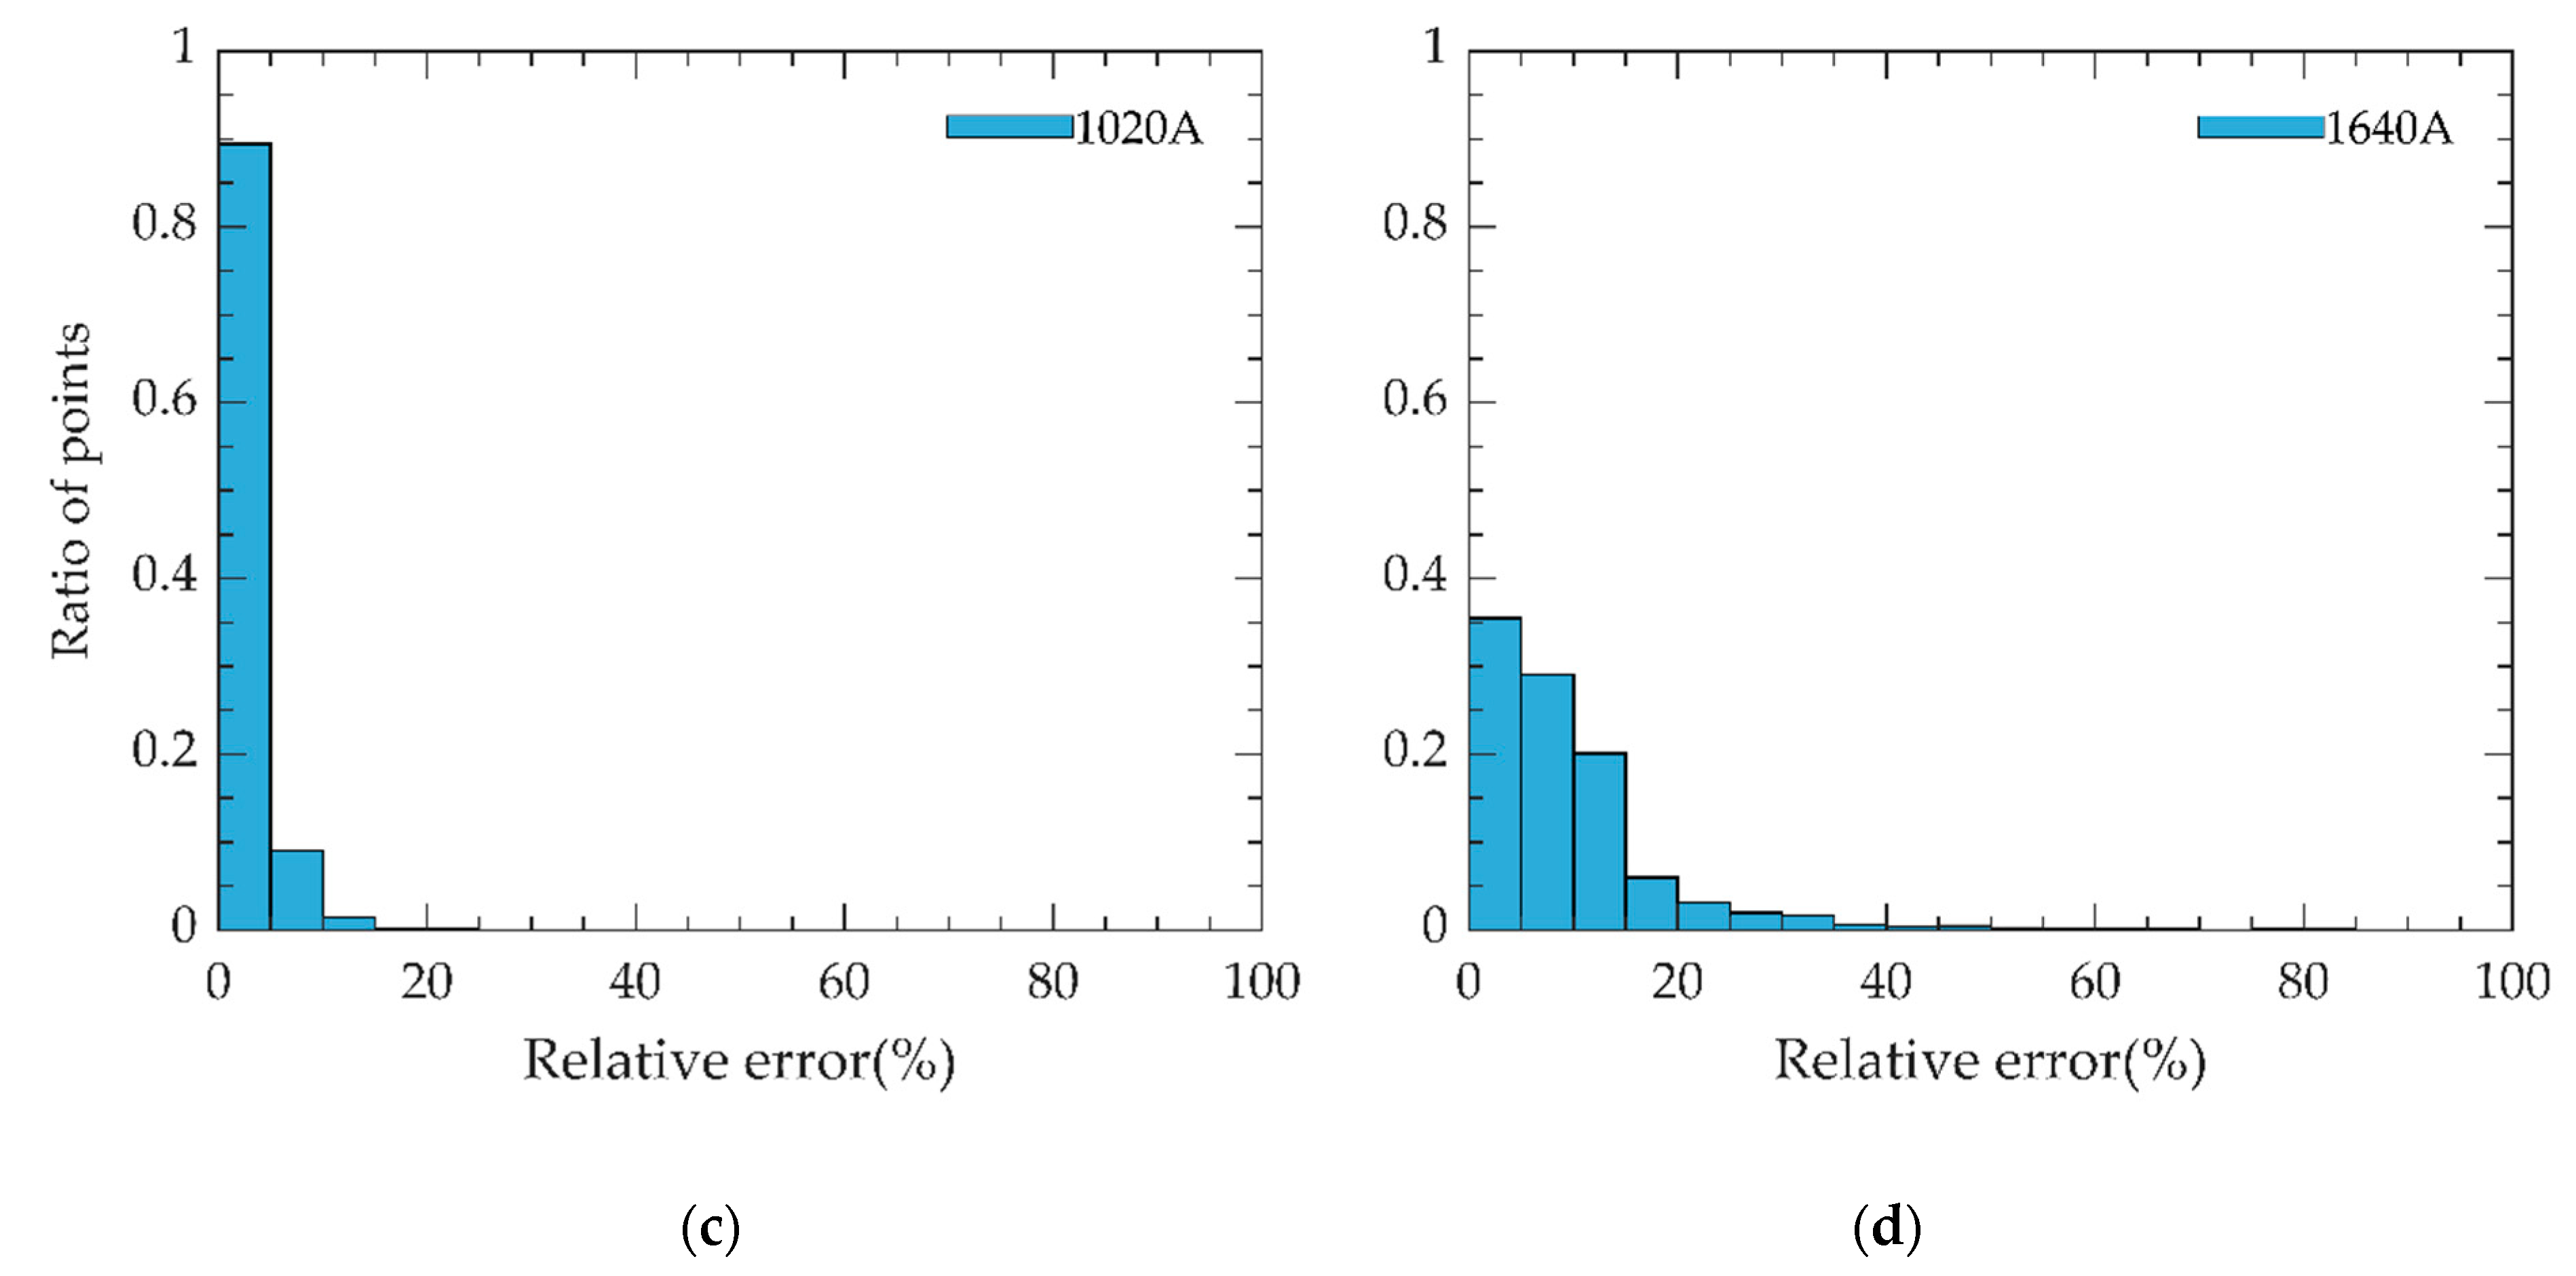
At 1020 nm and 1639 nm, RE distribution of the estimated AOD with the theoretical AOD is shown in Figure 6, respectively. As can be seen in Figure 6a–d, the ratio of data points where RE are within 5% at 1020 nm and 1639 nm have increased from 0.195 and 0.14 to 0.894 and 0.355, respectively. RE before temperature correction is concentrated within 70% and 200% and controlled to be concentrated within 15% and 50% after correction, respectively.
6. Conclusions
In this paper, we proposed an external field temperature correction method for CE318-T593 in the Dunhuang site. In this method, the calibration coefficients with temperature are modeled through a series of radiation data to correct the bands that are affected by temperature rather than transporting instruments to the laboratory for temperature correction. At the same time, calibrating will not rely on the Langley method requiring perfect weather conditions, which greatly reduce the uncertainty caused by the Langley method. By using this method, we corrected 1020 nm and 1639 nm affected by temperature successfully. AOD of these two bands follows the law of decreasing with the increase of wavelength after correction. In addition, RE and AE of the estimated AOD with the theoretical AOD are greatly reduced on these two bands, and the estimated AOD is more consistent with the theoretical AOD.
As a result, it is simpler, more convenient, and less costly to correct sun photometer including CE318-T593 affected by temperature in field environment than in laboratory. In addition, this new calibration method of automatic sun photometer with temperature correction is also applicable to other types of sun photometer located in other observation bases. Therefore, sun photometers are no longer limited to the laboratory for temperature correction, and it lays a solid foundation for improving the accuracy of site automated correction.
Author Contributions
Conceptualization, S.C., Y.L. and Y.Z.; methodology, S.C., Y.L. and Y.Z.; software, S.C. and Y.L.; validation, Y.L., Y.Z. and F.C.; formal analysis, S.C., Y.L. and Y.Z.; investigation, S.C., Y.L. and Y.Z.; data curation, S.C.; writing—original draft preparation, S.C.; writing—review and editing, Y.L. and Y.Z.; visualization, S.C.; supervision, Y.L., Y.Z. and F.C.; project administration, Y.L. and Y.Z.; funding acquisition, Y.L. All authors have read and agreed to the published version of the manuscript.
Funding
This research was supported by the National Key Research and Development Program of National Satellite Meteorological Center (No. 2018YFB0504601) and the National Natural Science Foundation of China (No. 41271373).
Data Availability Statement
The processed data presented in this study are available on request from the corresponding author.
Acknowledgments
We would like to express our gratitude to Xiutian Ba of Dunhuang Meteorological Bureau for the help of instrument maintenance. The authors extend appreciation to the reviewers for their thoughtful comments and value advice.
Conflicts of Interest
The authors declare no conflict of interest.
References
- Li, L.; Dai, C.; Wu, Z.; Wang, Y. Laboratory calibration and temperature research of spectral radiometric instruments. Spectrosc. Spectral Anal. 2019, 39, 1965–1969. [Google Scholar]
- Wu, Z.; Li, L.; Dai, C.; Wang, Y.; Xie, Y.; Cheng, Q. Temperature and humidity influence in field spectroradiometer measurement. Spectrosc. Spectral Anal. 2021, 41, 1639–1643. [Google Scholar]
- HAMAMATSU. Available online: http://www.hamamatsu.com.cn/UserFiles/upload/file/20190709/s1336_series_kspd1022e.pdf (accessed on 18 December 2021).
- HAMAMATSU. Available online: http://www.hamamatsu.com.cn/UserFiles/upload/file/20190918/g11193_series_kird1111e.pdf (accessed on 18 December 2021).
- Qiu, G. Development and Calibration Applications of Automatic Observation System on Satellite Radiometric Calibration Site; University of Science and Technology of China: Hefei, China, 2017. [Google Scholar]
- Li, D.; Li, Z.; Bian, L.; Li, K.; Li, B.; Gu, X.; Podvin, T. Analysis of aerosol properties using ground-based sun-sky radiometer in polar region. J. Remote Sens. 2013, 17, 553–565. [Google Scholar]
- Giles, D.M.; Sinyuk, A.; Sorokin, M.G.; Schafer, J.S.; Smirnov, A.; Slutsker, I.; Eck, T.F.; Holben, B.N.; Lewis, J.R.; Campbell, J.R.; et al. Advancements in the Aerosol Robotic Network (AERONET) Version 3 Database—Automated near-Real-Time quality control algorithm with improved cloud screening for sun photometer Aerosol Optical Depth (AOD) measurements. Atmos. Meas. Tech. 2019, 12, 169–209. [Google Scholar] [CrossRef] [Green Version]
- Wei, Y.; Li, Z.; Zhang, Y.; Chen, C.; Dubovik, O.; Zhang, Y.; Xu, H.; Li, K.; Chen, J.; Wang, H.; et al. Validation of POLDER GRASP aerosol optical retrieval over China using SONET observations. J. Quant. Spectrosc. Radiat. Transfer. 2020, 246, 106931. [Google Scholar] [CrossRef]
- Barreto, Á.; Cuevas, E.; Granados-Muñoz, M.-J.; Alados-Arboledas, L.; Romero, P.M.; Gröbner, J.; Kouremeti, N.; Almansa, A.F.; Stone, T.; Toledano, C.; et al. The new Sun-Sky-Lunar cimel CE318-T Multiband Photometer—A comprehensive performance evaluation. Atmos. Meas. Tech. 2016, 9, 631–654. [Google Scholar] [CrossRef] [Green Version]
- AERONET. Available online: https://aeronet.gsfc.nasa.gov/new_web/Documents/CE318_T_Photometer_UserManual_V4.3.pdf (accessed on 31 October 2021).
- Wei, W.; Song, S.; Sun, Y.; Qiu, G.; Li, X.; Zheng, X. Development and application of automated vicarious calibration system. Chin. Opt. Lett. 2017, 15, 100101. [Google Scholar] [CrossRef]
- Li, Y.; Rong, Z.; Li, Y.; Zhang, Y.; Ba, X.; Zhang, Y.; Chen, L.; Zhang, L.; Wei, W.; Sun, L. Solar reflection band site automatic calibration by the dunhuang site automatic observation radiometric calibration operational system. In Proceedings of the Earth Observing Systems XXIV; Butler, J.J., Xiong, X.J., Gu, X., Eds.; SPIE: San Diego, CA, USA, 2019; p. 59. [Google Scholar]
- Biggar, S.F.; Gellman, D.I.; Slater, P.N. Improved evaluation of optical depth components from langley plot data. Remote Sens. Environ. 1990, 32, 91–101. [Google Scholar] [CrossRef]
- Xia, M.; Li, J.; Li, Z.; Gao, D.; Pang, W.; Li, D.; Zheng, X. Research on calibration method in lab of direct solar channels of Sun photometer. Chin. Opt. Lett. 2014, 12, 121201–121207. [Google Scholar] [CrossRef]
- Axel, K.; Alexander, C.; Martin, T. ESA Ground-Based Air-Quality Spectrometer Validation Network and Uncertainties Study. 2017. Available online: https://www.pandonia-global-network.org/wp-content/uploads/2019/06/LuftBlick_Pandonia_TN_abscalib_RP_2017004_v1.0.pdf (accessed on 31 October 2021).
- Tong, J.; Zhao, Y.; Zhao, Z.; Zhang, W. Research on calibration method of sunphotometer in semi-arid areas. Acta Opt. Sin. 2014, 34, 9–13. [Google Scholar]
- Dong, Z.; Yu, X.; Lu, D.; Dai, J.; Li, X.; Chen, C.; Peng, Y.; Dong, Y. An objective method for assessment of langley calibrations of sunphotometer. Chin. J. Atmos. Sci. 2020, 44, 39–52. [Google Scholar]
- Ångström, A. On the atmospheric transmission of Sun radiation and on dust in the air. Geogr. Annaler. 1929, 11, 156–166. [Google Scholar] [CrossRef]
- O’Neill, N.T.; Dubovik, O.; Eck, T.F. Modified ångström exponent for the characterization of submicrometer aerosols. Appl. Opt. 2001, 40, 2368. [Google Scholar] [CrossRef] [PubMed]
- Liu, R.; Li, L.; Yu, J.; Huang, W.; Xu, L.; Liu, M.; Tang, X. On-line measurements and characteristic analysis of aerosol optical depth in the atmosphere of Urban Chongqing. Acta Sci. Circumstantiae 2014, 34, 819–825. [Google Scholar] [CrossRef]
- Smirnov, A.; Holben, B.N.; Eck, T.F.; Dubovik, O.; Slutsker, I. Cloud-screening and quality control algorithms for the AERONET database. Remote Sens. Environ. 2000, 73, 337–349. [Google Scholar] [CrossRef]
Figure 1.
Sun photometer (CE318-T593) at the Dunhuang site.

Figure 2.
The calibration coefficients changing with temperature (°C) for a whole year: (a) 1020 nm; (b) 1639 nm.
Figure 2.
The calibration coefficients changing with temperature (°C) for a whole year: (a) 1020 nm; (b) 1639 nm.

Figure 3.
Results of before and after temperature correction on 30 January 2020: (a) AOD varying with temperature (°C); (b) normalized AOD varying with temperature (°C).
Figure 3.
Results of before and after temperature correction on 30 January 2020: (a) AOD varying with temperature (°C); (b) normalized AOD varying with temperature (°C).

Figure 4.
RE and AE of the estimated AOD and the theoretical AOD varying with temperature (°C) on 30 January 2020: (a) 1020 nm; (b) 1639 nm.
Figure 4.
RE and AE of the estimated AOD and the theoretical AOD varying with temperature (°C) on 30 January 2020: (a) 1020 nm; (b) 1639 nm.

Figure 5.
The estimated AOD before and after calibration changing with the theoretical AOD. There are 8969 points: (a) 1020 nm; (b) 1639 nm.
Figure 5.
The estimated AOD before and after calibration changing with the theoretical AOD. There are 8969 points: (a) 1020 nm; (b) 1639 nm.

Figure 6.
Distribution of RE of the estimated AOD and the theoretical AOD: (a) 1020 nm before correction; (b) 1639 nm before correction; (c) 1020 nm after correction; (d) 1639 nm after correction.
Figure 6.
Distribution of RE of the estimated AOD and the theoretical AOD: (a) 1020 nm before correction; (b) 1639 nm before correction; (c) 1020 nm after correction; (d) 1639 nm after correction.


Table 1.
The specific information of CE318-T593.
| Band ID | ECW (nm) | Filter Bandpass (nm) | Detector Material |
|---|---|---|---|
| 1 | 1020 | 10 | Si |
| 2 | 1639 | 25 | InGaAs |
| 3 | 870 | 10 | Si |
| 4 | 676 | 10 | Si |
| 5 | 441 | 10 | Si |
| 6 | 501 | 10 | Si |
| 7 | 1020 | 10 | InGaAs |
| 8 | 936 | 10 | Si |
| 9 | 380 | 2 | Si |
| 10 | 340 | 2 | Si |
Table 2.
Fitting results of 1020 nm and 1639 nm for every month in 2020.
| ECW | Month | |||
|---|---|---|---|---|
| 1020 nm | 2020.01 | −0.3031 | 41.7067 | 9096.644 |
| 2020.02 | −0.3031 | 41.7067 | 9020.933 | |
| 2020.03 | −0.3031 | 41.7067 | 9189.117 | |
| 2020.04 | −0.3031 | 41.7067 | 8893.401 | |
| 2020.05 | −0.3031 | 41.7067 | 7973.700 | |
| 2020.06 | −0.3031 | 41.7067 | 8318.141 | |
| 2020.07 | −0.3031 | 41.7067 | 9160.032 | |
| 2020.08 | −0.3031 | 41.7067 | 8579.034 | |
| 2020.09 | −0.3031 | 41.7067 | 8231.424 | |
| 2020.10 | −0.3031 | 41.7067 | 8267.358 | |
| 2020.11 | −0.3031 | 41.7067 | 8393.064 | |
| 2020.12 | −0.3031 | 41.7067 | 8527.619 | |
| 1639 nm | 2020.01 | −3.5293 | 204.2777 | 13,416.819 |
| 2020.02 | −3.5293 | 204.2777 | 13,423.355 | |
| 2020.03 | −3.5293 | 204.2777 | 14,401.933 | |
| 2020.04 | −3.5293 | 204.2777 | 14,017.944 | |
| 2020.05 | −3.5293 | 204.2777 | 13,130.968 | |
| 2020.06 | −3.5293 | 204.2777 | 12,399.482 | |
| 2020.07 | −3.5293 | 204.2777 | 13,688.588 | |
| 2020.08 | −3.5293 | 204.2777 | 12,706.422 | |
| 2020.09 | −3.5293 | 204.2777 | 12,158.218 | |
| 2020.10 | −3.5293 | 204.2777 | 12,477.550 | |
| 2020.11 | −3.5293 | 204.2777 | 12,677.392 | |
| 2020.12 | −3.5293 | 204.2777 | 12,687.567 |
Publisher’s Note: MDPI stays neutral with regard to jurisdictional claims in published maps and institutional affiliations. |
© 2021 by the authors. Licensee MDPI, Basel, Switzerland. This article is an open access article distributed under the terms and conditions of the Creative Commons Attribution (CC BY) license (https://creativecommons.org/licenses/by/4.0/).
Share and Cite
MDPI and ACS Style
Chen, S.; Li, Y.; Cao, F.; Zhang, Y. Calibration of Automatic Sun Photometer with Temperature Correction in Field Environment. Remote Sens. 2022, 14, 66. https://0-doi-org.brum.beds.ac.uk/10.3390/rs14010066
AMA Style
Chen S, Li Y, Cao F, Zhang Y. Calibration of Automatic Sun Photometer with Temperature Correction in Field Environment. Remote Sensing. 2022; 14(1):66. https://0-doi-org.brum.beds.ac.uk/10.3390/rs14010066
Chicago/Turabian StyleChen, Shuyu, Yuan Li, Fengmei Cao, and Yuxiang Zhang. 2022. "Calibration of Automatic Sun Photometer with Temperature Correction in Field Environment" Remote Sensing 14, no. 1: 66. https://0-doi-org.brum.beds.ac.uk/10.3390/rs14010066
Note that from the first issue of 2016, this journal uses article numbers instead of page numbers. See further details here.