Article

Climatological Aspects of Active Fires in Northeastern China and Their Relationship to Land Cover

1
Liaoning Weather Modification Office, Shenyang 110166, China
2
Key Opening Laboratory for Northeast China Cold Vortex Research, Shenyang 110166, China
3
Liaoning Meteorological Disaster Monitoring and Early Warning Centre, Shenyang 110166, China
4
Key Laboratory of Middle Atmosphere and Global Environment Observation (LAGEO), Institute of Atmospheric Physics, Chinese Academy of Sciences, Beijing 100029, China
5
Institute of Atmospheric Environment, China Meteorological Administration, Shenyang 110166, China
*
Author to whom correspondence should be addressed.
Remote Sens. 2022, 14(10), 2316; https://0-doi-org.brum.beds.ac.uk/10.3390/rs14102316
Submission received: 7 March 2022 / Revised: 3 May 2022 / Accepted: 5 May 2022 / Published: 11 May 2022

Abstract

:
Biomass burning (BB) is a driving force for heavy haze in northeastern China (NEC) and shows distinct seasonal features. However, little is known about its climatological aspects, which are important for regional BB management and understanding BB effects on climate and environment. Here, the climatological characteristics of active fires and their dependence on land cover in NEC were studied using Moderate Resolution Imaging Spectroradiometer (MODIS) products. Moreover, the influence of meteorological factors on fire activities was explored. The number of fires was found to have increased significantly from 2003 to 2018; and the annual total FRP (FRPtot) showed a generally consistent variation with fire counts. However, the mean fire radiative power for each spot (FRPmean) decreased. Fire activity showed distinctive seasonal variations. Most fires and intense burning events occurred in spring and autumn. Spatially, fires were mainly concentrated in cropland areas in plains, where the frequency of fires increased significantly, especially in spring and autumn. The annual percentage of agricultural fires increased from 34% in 2003 to over 60% after 2008 and the FRPtot of croplands increased from 12% to over 55%. Fires in forests, savannas, and grasslands tended to be associated with higher FRPmean than those in croplands. Analysis indicated that the increasing fire count in NEC is mainly caused by agricultural fires. Although the decreasing FRPmean represents an effective management of BB in recent years, high fire counts and FRPtot in croplands indicate that the crop residue burning cannot be simply banned and a need instead for effective applications. More efforts should be made on clean utilization of straw. The accumulation of dry biomass, high temperature, and low humidity, and weak precipitation are conducive to the fire activities. This study provides a comprehensive analysis of BB in NEC and provides a reference for regional BB management and control.

Graphical Abstract

1. Introduction

Biomass burning (BB) is an important source of trace gases and aerosols in the atmosphere [1,2,3,4]. By acting as cloud condensation nuclei and ice nuclei, the particles emitted by BB influence the quantity and size distribution of cloud droplets, thereby changing the cloud albedo and lifetime [5,6,7,8,9]. Moreover, the CO and NOx released during BB affect the formation of O3 and change the oxidative capacity of the troposphere [10,11]. The particles produced by BB also affect regional air quality, posing a threat to the environment and human health [12,13]. Therefore, it is important to monitor BB and study its important role in the climate and air quality.
BB is common in eastern China and shows distinct seasonal features. In the past few decades, BB in the North China Plain, Yangtze River Delta, and Pearl River Delta have been intensely investigated [2,14,15,16,17]. Northeastern China (NEC) is an important breadbasket region, and approximately 30% of the total area is cropland. During harvest seasons, large amounts of crop residues are commonly burned in the fields [18,19]. Moreover, residential burning of wood and crop residues for heating and cooking are common practices in rural areas and contribute significantly to regional pollution events and haze formation [4]. Shi et al. [20] evaluated the emissions from open BB in NEC during 2001–2017 and found that crop residue burning accounted for 68% of the total CO2 emissions. Haze episodes with high PM2.5 concentrations (>400 µg/m3) due to intensive BB in NEC have been reported [21]. Approximately 60–80% of the polluted days in NEC can be attributed to BB during the fire seasons, when the hourly PM2.5 concentration can exceed 1000 µg m−3 [22]. Although BB contributes significantly to PM2.5 loading and plays a key role in haze formation in NEC, little is still known about its climatological aspects.
The launch of NASA’s Terra satellite in 1999 and Aqua satellite in 2002 provided a practical way to monitor global fire activity and atmospheric pollutants from space. The Moderate Resolution Imaging Spectroradiometer (MODIS) on board Terra and Aqua was the first spaceborne radiometer developed for long-term active fire detection from space. It has middle- and long-wave infrared bands, with 1 km ground resolution, designed for the observation of actively burning fires [23]. The global distribution of fires and the fire radiative power (FRP) have been inferred from the Terra and Aqua MODIS observations [24].
In this study, the climatological characteristics of fire frequency and intensity on different land covers in NEC were investigated to obtain a reference for BB management and control decisions as well as a scientific basis for regional atmospheric environmental management. The paper is organized as follows. Section 2 describes the active fire, land-use and cloud MODIS products, and the methodology used in this analysis. Section 3 describes the analysis of the spatial-temporal distribution of fires and FRP, in which the fire activity in different land cover types is explored. Additionally, the impact meteorological factors on fire measurement is discussed. The conclusions are presented in Section 4.

2. Materials and Methods
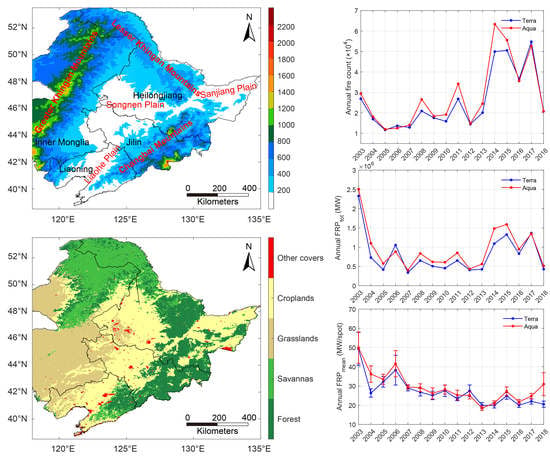
2.1. Study Area

The study area (Figure 1a) includes Liaoning, Jilin, and Heilongjiang provinces and the eastern part of the Inner Mongolia Autonomous Region (east of 118° E). The western, northern, and eastern borders of the region are formed by the Greater Khingan Mountains, Lesser Khingan Mountains, and Changbai Mountains, respectively, which have closed-canopy forest covers (Figure 1b).
Three plains, specifically the Songnen Plain, Liaohe Plain, and Sanjiang Plain, are in central and eastern NEC (Figure 1b) and are an important granary for China. Corn, soybeans, rice, sorghum, millet, and spring wheat are primarily planted, and a yearly crop rotation of corn, soybeans, and wheat is practiced.

2.2. MODIS Fire Products

The Collection 6 daily level 3 fire products MOD14A1 (Terra) and MYD14A1 (Aqua), with a spatial resolution of 1 km, were used to characterize the spatiotemporal variation of active fires in NEC [25]. The Terra satellite occupies a sun-synchronous polar orbit with local equatorial crossing time of 1030 (ascending) and 2230 (descending). The Aqua satellite provides an additional pair of observations at 0130 (descending) and 1330 (ascending) local time. The science dataset (SDS), named “FireMask”, from these products were employed and only the fire pixels with nominal and high confidence were extracted. Moreover, the FRPs form SDS “MaxFRP” were extracted from these products to describe the fire intensity in NEC. MOD14A1 and MYD14A1 products were freely available online (https://ladsweb.modaps.eosdis.nasa.gov/, accessed on 3 March, 2021). In this study, the fire activity monitored by Terra and Aqua were analysed separately. The annual and monthly fire counts represent the total number of fire spots during a calendar year and month, the total FRP (FRPtot) represents the sum of the FRP, and the mean FRP (FRPmean) represents the average FRP for each fire spot.

2.3. MODIS Land-Cover Products

This study analysed the distribution of active fires in various land covers in NEC using the Terra and Aqua combined MODIS land cover type (MCD12Q1) C6 data product, which provides global land cover types at annual intervals with a spatial resolution of 500 m [26]. This product has five legacy classification schemes, which are the International Geosphere-Biosphere Programme, University of Maryland, leaf-area index, BIOME Biogeochemical, and plant functional types classification schemes, and a new three-layer legend based on the land cover classification system from the Food and Agriculture Organization [27]. The International Geosphere-Biosphere Programme scheme, which has 17 land cover types, was used in this study (Table 1). Because fire rarely occurred on some land cover types, only 12 types were analysed in this study; these types were reclassified according to Wei et al. [28] as forests (types 1, 2, 3, 4, and 5), savannas (types 6, 7, 8, and 9), grasslands (type 10), and croplands (types 12 and 14). The reclassified land cover types in NEC are shown in Figure 1b. To identify the land cover type of a specific fire spot, the nearest neighbour resampling method was performed.

2.4. ERA5 Monthly Averaged Data

ERA5 is the fifth-generation reanalysis for climate and weather released by the European Center for Medium-Range Weather Forecasts (ECMWF) to replace their ERA-Interim product, one of the best performing products in hydrological studies [29]. In order to explore the influence of climate factors on fire activity, the ERA5 monthly averaged temperature, relative humidity at 2 m above the surface of the Earth, and precipitation at 0.25° × 0.25° resolution during the study period were used. More specifically, RH was calculated based on temperature and dew temperature.

2.5. Trend Estimation and Significance Testing

The magnitude of pixel-wise fire counts and CF linear trends from 2003 to 2018 were estimated using the Theil–Sen (TS) slope estimator, a non-parametric method proposed by Theil [30] and modified by Sen [31]. The TS slope estimator is the median of the slopes calculated between observation values at all pairwise time steps, for a total of n (n − 2)/2 slopes. This technique is robust against outliers and can reject extreme values without affecting the slope [32].
The significance of the TS slope was assessed using the Mann-Kendall (MK) test, which is a non-parametric statistic that does not require samples to meet a certain distribution. The combination of these methods is an important trend analysis approach. Kendall’s S is defined as follows:
S = i = 1 n 1 j = i + 1 n s i g n ( x j x i )
and
s i g n ( x j x i ) = { + 1 , x j x i > 0 0 , x j x i = 0 1 , x j x i < 0
where n is the length of the time series dataset, and xi and xj are the observations at times i and j, respectively.
The calculation of probability is related to S and n. When n ≥ 10, S generally follows a standard normal distribution, and the variance is computed as follows:
V ar ( S ) = n ( n 1 ) ( 2 n + 5 ) i = 1 n t i ( i ) ( i 1 ) ( 2 i + 5 ) 18
where ti denotes the number of the ties of extent i. For example, a dataset with two tied values would have one tie of extent two or i = 2 and t2 = 1 [33].
Z S = { S 1 V ar ( S ) , S > 0 0 , S = 0 S + 1 V ar ( S ) , S < 0
When ZS is positive, the trend is increasing and vice versa. A bilateral trend test was conducted according to an α significance level of α = 0.05. The null hypothesis is false if | Z s | > Z 1 α / 2 ; however, if the hypothesis is true, then the time series trend is significant.

3. Results and Discussion

3.1. Spatiotemporal Distribution of Fire Spots

Figure 2a shows the inter-annual variation in fire counts in NEC from 2003 to 2018 based on the Terra and Aqua MODIS observations. The annual fire counts ranged from 1.2 × 10⁴ to 6.3 × 10⁴, and more fires were detected by Aqua than Terra satellite. The peak fire count for Aqua occurred in 2014, reaching at 6.3 × 10⁴, and that of Terra occurred in 2017, reaching at 5.5 × 10⁴. It is about 5 times of that in 2005, indicating a significant inter-annual variability of fires during 2003–2018. The TS slope of the annual fire count was about 1957 and 1927 spots per year measured by Terra and Aqua MODIS, respectively, and both trends passed the significance test. The annual fire count generally ranged from 1.2 × 10⁴ to 3.5 × 10⁴ during 2003–2013; however, it dramatically increased to a high level in 2014 and 2015, and afterwards, a gradually decreasing tendency was observed. In particular, the fire count dropped dramatically to 2.1 × 10⁴ in 2018. This drop was due to the burning ban implemented in this region which aimed to restrict agricultural burning to improve local air quality, especially in 2018 [34,35]. As shown in Figure 2b, the monthly average fire counts showed that the fires were mainly concentrated in spring (March and April) and autumn (October and November) and peaked in April and October (>5 × 10³). The total number of fire spots in spring and autumn accounted for approximately 90% of the annual average values. This seasonality is consistent with previous research [36,37] and can be attributed to the conventional planting pattern of single cropping with the staple crops of corn, soybeans, rice, and wheat. The growing season lasts from late April to October, whereas the non-growing season lasts for about half a year [38]. During the non-growing period, local farmers burn the straw left on their farmland as fertilizer to make spring ploughing easier. Both Terra and Aqua products showed sharp increases in fire counts in spring and autumn. The TS slope was 1504 and 1221 spots per year in spring for Terra and Aqua fire product, respectively, and it was 658 and 1033 spots per year in autumn during 2003–2018. Only the trend in spring passed the significance test. The monthly average fire counts in all other months were less than 1.0 × 10³, especially in January and December, when the monthly average was even less than 100. In addition, more fires were detected by Aqua than Terra in the winter-half of the year (from October to March the following year) while Terra detected more in the summer-half of the year. Analysis of the fire recording time of Terra and Aqua satellites showed that more fires were detected during daytime overpasses. The difference between monthly fire count distributions can be attributed to the diurnal fire cycle between midmorning and early afternoon. The high latitude and late sunrise time in the winter-half of the year in NEC makes the ambient temperature low in midmorning, which is not suitable for fire activities.
Since most fires occurred in spring and autumn, the spatial distribution of fire counts during these two seasons was analysed (Figure 3). Both Terra and Aqua fire products showed quite a similar spatial pattern. The fires were concentrated in plains that were dominated by croplands, which are shown in Figure 1b. In spring, high fire counts were mainly concentrated in west Heilongjiang and Jilin Province, where Songnei Plain is located, and the seasonal total fire count here reached 40 spots per grid or greater. In autumn, the areas with high fire densities were more dispersed, and the fire activities in west Heilongjiang and Jilin were weaker than those in spring, while the fires in central Jilin and Liaoning were more active. The spatial distribution pattern is consistent with the previous studies [28,34,37].
Figure 4 shows the long-term trends in seasonal fire counts in spring and autumn during 2003–2018 from Terra and Aqua fire products. The fires in plain areas in NEC showed the strongest increase and both products showed quite similar patterns. In spring, the fire spots in the plains showed significant increasing trends of more than three spots per year per grid, especially in central western Heilongjiang, where an increase of more than six spots per year per grid was observed. The spatial distribution of fire trends in autumn was similar to that of spring, but the areas with significant increasing rates extended further south. In addition, the fires in Sanjiang Plain were more intense in autumn than in spring due to the direct burning of crop residues in the field after harvesting [39].

3.2. Spatiotemporal Distribution of FRP

Figure 5 shows the annual and monthly FRPtot and FRPmean for each fire spot which are important indicators of fire intensity. The annual FRPtot ranged from 0.3 × 10⁶ to 2.5 × 10⁶ MW, and it was higher when detected by Aqua than by Terra. The peak annual FRPtot occurred in 2003, and it mainly fluctuated between 0.3 × 10⁶ and 1.1 × 10⁶ MW during 2004–2013. The annual FRPtot increased sharply in 2014 and it maintained a high level in 2014, 2015, and 2017, but decreased to approximately 0.5 × 10⁶ MW in 2018. The TS slope of annual FRPtot was 1.6 × 10⁴ and 0.9 × 10⁴ MW/year for Terra and Aqua fire products, respectively, during 2003–2018, but no trend passed the significance test, even without considering the variation of annual FRPtot between 2003 and 2006. Consistent with the seasonality of monthly fire counts, the monthly FRPtot peaked in April and October, and the sum of monthly FRPtot in spring and autumn accounted for approximately 92% of the annual average values. The high standard deviation of monthly FRPtot in May resulted from the intense burning in 2003 and 2006. Regarding the variation of annual FRPmean, it was higher when detected by Aqua than by Terra, and both fire products showed decreasing FRPmean from 2003 to 2018. It was higher than 50 MW/spot in 2003 and dropped to below 30 MW/spot in 2018. The TS slope of annual FRPmean was −0.9 and −1.2 MW/spot per year for Terra and Aqua products, respectively, and both of them passed the significance test. This may be attributed to more effective fire management, which reduced the number of large-scale and high-intensity fires. The high FRPmean in 2003 and 2006 were attributed to high fire intensities during spring, specifically in May, which were caused by simultaneous high temperatures, low precipitation, and low humidity [40]. The maximum instantaneous FRP was detected by Terra satellite which reached 6.4 × 10³ MW and occurred on 18 May 2003. In contrast to the seasonal variation in fire spots, the monthly FRPmean showed a different pattern. It peaked in May and was the lowest in June. The outstanding high FRPmean in May was also due to the extremely high energy released by BB in 2003 and 2006.
As shown in Figure 5b, the total energy released by active fires in summer and winter was much less than that in spring and autumn. In addition, the seasonal FRPtot is a combination of fire counts and FRPmean. Therefore, only the distributions of FRPmean in spring and autumn were analysed (Figure 6). Similar spatial pattern of FRPmean was detected by Terra and Aqua satellites. Regions with high average FRPmean (>20 MW/spot) were concentrated in northern NEC, which is dominated by savannas, grasslands, and forests. In these areas, the fuel loads are usually high and the size of burning areas can grow to be large.
Figure 7 shows the seasonal trends in FRPmean. Areas with a significant increase in average FRP were mainly concentrated in the plains. The FRP of most grids increased by less than 1 MW/spot per year, whereas some grids reached 3 MW/spot per year. However, not all grids with increased number of fire spots also showed increased FRP, especially in west Heilongjiang and Jilin in spring.

3.3. Fire Activity in Different Land Covers

As mentioned before, both the distribution of fire counts and FRP are closely related to land cover type. Therefore, the relationships between the fire spots and land cover types were analysed. As shown in Figure 1b, more than 98% of the land in NEC is covered by forests, savannas, grasslands, and croplands. Among them, croplands accounted for the highest proportion, reaching 33%, and were mainly in the plains. Grasslands accounted for 25% and were mainly in the eastern part of the Inner Mongolia Autonomous Region and the areas that border it. The percentages of forests and savannas were similar, at 22% and 18%, respectively. The percentage of other cover types was relatively low, at approximately 2%. Table 2 shows the multi-annual averaged percentages of fire counts and FRPtot in these different land cover types. Both Terra and Aqua fire products showed similar proportions for fire counts and FRP. More than 60% of the fires in NEC, or approximately twice the national average (~29%, [28]), occurred in croplands, followed by savannas, grasslands, and forests. However, the percentages of FRPtot in the savannas, forests, and grasslands were higher than that of the fire counts. Moreover, the biggest difference between the percentages of FRPtot and fire counts was observed in the savannas, reaching more than 10%. Therefore, the savannas, forests, and grasslands release more energy than the croplands when fires occur.
The annual fire counts in four land covers during the study period are shown in Figure 8. In general, Terra and Aqua products showed similar variations of fire counts in the four land cover types. In addition, more fires were detected by Aqua than Terra satellite, except in grasslands. The fire counts showed different variation patterns between land covers. The fires in the forests and savannas decreased during the study period, whereas they increased in the grasslands. The TS slope derived from Terra (Aqua) fire products was −4.2 (−14.4), −112.5 (−116.4), and 141.3 (130.5) spots per year for forests, savannas, and grasslands, respectively. However, except the trend of fires in grasslands derived from Terra products, these trends did not pass the significance test at the 5% level. In contrast, a significant increase in fires occurred in croplands, at a rate of 1870 (1869) spots per year for Terra (Aqua) fire products, accounting for more than 50% of the annual growth rate of national agricultural fires [28]. Moreover, the proportion of fires in croplands increased rapidly during the study period (not shown here), from about 33% in 2003 to greater than 60% in 2009; the maximum occurred in 2014, reaching close to 80%.
It could be concluded that the increasing fire count in NEC is mainly caused by cropland fires. Due to the rapid development of China’s economy, the demand for straws as biofuel has decreased in rural areas. At the same time, the high-cost and small-scale farming system hinders the utilization of crop straws [35]. After the implementation of the burning ban in January 2015, the cropland fires reduced, and the reduction of crop fire counts continued in 2016 (Figure 8d). However, a slight increase in agricultural fires occurred in 2017. It indicates more effective measures should be implemented rather than simply prohibiting crop residue burning.
The annual FRPtot and FRPmean in all types of land cover are shown in Figure 9. Similar variation of annual FRPtot can be found between Terra and Aqua fire products, but the annual FRPtot was higher when detected by Aqua satellite than by Terra satellite (Figure 9 left panel). Regarding the annual FRPtot in different land covers, they have been decreasing in forests, savannas, and grasslands, and only the trend in savannas detected by Aqua passed the significant test at a 0.05 level. The TS slope of annual FRPtot for forests, savannas, and grasslands was −2559.7 (−3236.6), −10829 (−18960), and −507.3 (−155) MW/year, respectively, for Terra (Aqua) fire products. However, in croplands, the annual FRPtot was significant increased. Its TS slope in croplands was 3514.9 (3794.5) MW/year for Terra (Aqua) fire products. The percentages of total FRP released by different land cover types were analysed. The FRP in the savannas and croplands dominated the total burning energy. In 2003, the FRP proportions of savannas reached approximately 70%, and in 2018, it decreased to approximately 22%, while the FRP proportions of croplands increased from 12% in 2003 to over 55% in 2018. The annual FRPmean decreased from 2003 to 2018 (Figure 9 right panel); and the trends mostly passed the significant test. Significant decreasing trends occurred in savannas, grasslands, and croplands at a rate of −5.5, −2.4, and −0.3 MW/spot per year, respectively, derived from Terra products, and −3.5, −0.5, and −0.3 MW/spot per year, respectively, from Aqua products. The decreasing trend of forests fires was −1.42 and −0.3 MW/spot for Terra and Aqua fire products, respectively, but only the trend detected by Aqua passed the significant test. In addition, the inter-annual variation in FRP was more intense before 2007, indicating a greater control over fire intensity in recent years.
The monthly fire counts in different land cover types are shown in Figure 10. Both Terra and Aqua observed strong seasonality of the fire counts. Clearly, more fires for all types of land covers occurred in spring and autumn. The highest monthly fire counts were also observed during these seasons. For fire counts in forests and savannas, high values were observed in the first few years of the study period, which were mostly caused by the spread of large wildfires. As shown in Figure 10a,b, more than 3.0 × 10³ fire spots appeared in forests in October 2004. It was caused by the ignition of the fire defending belt in Heihe of Heilongjiang Province (http://news.sohu.com/20041021/n222606461.shtml, accessed on 28 March 2022). Strong wind facilitated the spread of the fires and the fires lasted more than ten days. Meanwhile, the fires ignited surrounding savannas resulting in a high fire count in savannas in October 2004 (Figure 10c,d). Regarding the interannual variation of fire counts, no seasonal trends were significant at the 5% level for forests and savannas, and these monthly fire counts were mostly below 1 × 10³. The monthly fire counts in the grasslands were mostly below 1.5 × 10³, and they increased after 2014, especially in spring and autumn. The cropland fire counts differed by up to four orders of magnitude among different months, with the highest value observed in October 2014 by Aqua satellite at 2.6 × 10⁴. Significant increases in cropland fire counts were found during spring and autumn for both Terra and Aqua products with a grow rate at 1038.7 and 959.6 spots per year, respectively, in spring and 486.6 and 919 spots per year, respectively, in autumn, which were more than five-fold of the seasonal variation trends compared with the other three land covers. In addition, it should be noted that the fire spots in this study were hot spots and not the individual fires. For forests and savannas, a large wildfire may contain thousands of hot spots while a cropland fire may contain only one pixel due to the low biomass load and scattered storage of straws.
The monthly values of FRPmean in these four land cover types are shown in Figure 11, and they showed downward trends during most seasons, especially in spring and autumn. The decreasing rates of seasonal FRPmean were smaller than 3 MW/spots, and most of them were insignificant. However, the TS slopes of seasonal FRPmean in grasslands in spring, summer, and autumn for both Terra and Aqua fire products passed the significance test. The TS slope in spring, summer, and autumn was −2.45 (−1.19), −1.48 (−1.60), and −1.98 (−2.78) MW/spot, respectively, for Terra (Aqua) fire products. Although the monthly FRPmean in forests, savannas, and grasslands peaked in spring and autumn, it varied among years owing to occasional high FRP events in these three land cover types. The outstanding high values of monthly FRPtot and FRPmean in May (Figure 5b,d) resulted from the high fire counts (Figure 10c,d) and FRPmean (Figure 11c,d) released by savanna fires in 2003 and 2006. In croplands, the interannual variation in the monthly FRPmean was small, and the difference between months was not obvious. Moreover, the FRPmean in croplands was lower than that in forests, savannas, and grasslands. This is mainly because the fire spots in croplands usually have small areas and shorter durations, and the storage of dry biomass is sparse and scattered [35,36]. In addition, more intense fires were detected by Aqua satellite. This may relate to the high temperature, low relative humidity, and the following large amount of dry biomass in the afternoon.
Taking the annual and seasonal downward trends of FRPmean into consideration, it indicates that the fire intensity has been more manageable in recent years. This may be attributed to more effective fire management, which reduced the number of large-scale and high-intensity fires. For fires in forests, grasslands, and savannas, which are mostly caused by natural factors, the decreasing FRPmean indicates the rapid response to fire suppression to prevent loss of human life and socioeconomics. For cropland fires, the burning ban has been stricter in recent years due to the severe air pollution caused by burning. Low FRPmean of croplands fires reduce the risk of being punished for burning straw without permission. However, the high annual fire counts and FRPtot in croplands indicate that the crop residue burning cannot be simply banned and a need instead for effective applications.

3.4. Influence of Meteorological Factors on Fire Occurrence

Given the close relationship between climate and fire occurrence [40,41], the fire activities were compared with meteorological factors. Figure 12 shows the annual and monthly average temperature, relative humidity, and accumulated precipitation in NEC during 2003–2018. As shown in Figure 12a, the meteorological factors fluctuated greatly from 2003 to 2018. The maximum temperature occurred in 2007 and the minimum value appeared in 2012. The interannual variation of precipitation and humidity were similar, with the highest value occurring in 2013 and lowest in 2007. High temperature, low humidity, and weak precipitation were conducive to the accumulation of dry biomass, the ignition and spread of open-field fires, and the opposite conditions hindered fire activities. Considering the interannual variation of fire counts (Figure 2a), in general, the fire counts increased with the increasing temperature, and decreasing relative humidity and precipitation, and vice versa, especially after 2008. However, the meteorological factors during 2003–2006 were comparable with those in 2014–2017 while the annual fire counts in 2014–2017 were almost triple those in 2003–2006. It can be attributed to the sharp increase of agricultural fires during the study period, indicating the important role of human-induced burning in NEC.
Significant seasonality of meteorological conditions can be drawn from Figure 12b. The maximum values of temperature and accumulated precipitation appeared in summer, and the minimum values appeared in winter. Relative humidity was the highest in summer and the lowest in spring. High humidity, abundant precipitation in summer, and low temperature in winter were unconducive to fire activities. In spring and autumn, the relatively high temperature, dry air, and weak rainfall resulted in high dry biomass loads and fire occurrences (Figure 2b). Moreover, the FRP in spring was higher than that in autumn (Figure 5b,d). It may be attributed to the low relative humidity and high dry fuel loads in spring which contribute to energy release in burning.

4. Conclusions

In this study, MODIS fire and land-use products were used to explore the climatology of fire activity during 2003–2018. Moreover, the impact of meteorological factors on fire activities was examined. The results revealed an upward trend of fire spots in NEC during the study period with TS slope reaching 1957 and 1927 spots per year for Terra and Aqua fire products, respectively. Fires mostly occurred in spring and autumn, especially in March, April, October, and November, which is consistent with the planting and harvesting time of crops in NEC. The annual FRPtot presented an insignificant increasing trend while the annual FRPmean showed a significant decreasing trend during 2003–2018, indicating a more controllable intensity of fires. Regarding the spatial distribution, the fire spots were mainly concentrated in the cropland areas in plains. Delineating the fires into four land cover types, the proportion of fires counts varied greatly, with cropland fires accounting for over 60%, followed by savannas, grasslands, forests. Moreover, the proportion of annual FRPtot released by cropland fires accounted for approximately 50% of the total, indicating that the crop residue burning dominated the BB in NEC. A significant increase was found in cropland fires with the TS slope reaching approximately 1870 spots/y. The fires in forests, savannas, and grasslands generally corresponded to higher FRPmean than those in croplands. However, the FRPmean in four land cover types all showed a decreasing trend. Regarding the influence of meteorological conditions, the fires increased with the increasing temperature and decreasing relative humidity and precipitation due to the dry biomass accumulation under such an environment.
In this study, satellite fire products were used to analyse BB in NEC. However, owing to the limitations in satellite observation capabilities, small burning areas and cloud-covered fires could not be monitored, causing the fire counts in this study to be smaller than their actual values. Moreover, cropland burning, the primary contributor to BB in NEC, is usually characterized by a small-area and short duration, which implies potential gaps between polar satellite overpass and actual fire activity. Therefore, higher spatiotemporal resolution fire products should be used in future studies.

Author Contributions

Conceptualization, data curation, methodology, writing—original draft, writing—review & editing, L.S.; Data curation, formal analysis, writing—original draft, writing—review & editing, L.Y.; Supervision, writing—original draft, formal analysis, writing—review & editing, X.X.; Methodology, visualization, writing—original draft, D.W.; Visualization, formal analysis, T.Z. All authors have read and agreed to the published version of the manuscript.

Funding

This study is funded by the National Natural Science Foundation of China (41705127), the Natural Science Founding of Liaoning Provinces (20180540086 and 2019JH2/10200019) and the project of Institute of Atmospheric Environment, China Meteorological Administration, China (2021SYIAEKFMS21).

Data Availability Statement

The fire, land cover and ERA5 monthly averaged products supporting the findings of this study are openly available online. The fire and land cover products can be archived at following URL/DOI: https://ladsweb.modaps.eosdis.nasa.gov/archive/ (accessed on 3 March 2021). The ERA5 monthly averaged data can be archived at the following website https://www.ecmwf.int/en/forecasts/datasets/reanalysis-datasets/era5 (accessed on 1 January 2022).

Acknowledgments

The authors are grateful to NASA for making the MODIS data available. We also thank European Centre for Medium-Range Weather Forecasts provides the ERA5 data.

Conflicts of Interest

The authors declare no conflict of interest.

References

  1. Kaufman, Y.J.; Nakajima, T. Effect of Amazon Smoke on Cloud Microphysics and Albedo-Analysis from Satellite Imagery. J. Appl. Meteorol. 1993, 32, 729–744. [Google Scholar] [CrossRef] [Green Version]
  2. Xia, X.; Zong, X.; Sun, L. Exceptionally active agricultural fire season in mid-eastern China in June 2012 and its impact on the atmospheric environment. J. Geophys. Res. Atmos. 2013, 118, 9889–9900. [Google Scholar] [CrossRef]
  3. Zha, S.; Zhang, S.; Cheng, T.; Chen, J.; Huang, G.; Li, X.; Wang, Q. Agricultural Fires and Their Potential Impacts on Regional Air Quality over China. Aerosol Air Qual. Res. 2013, 13, 992–1001. [Google Scholar] [CrossRef] [Green Version]
  4. Yang, G.; Zhao, H.; Tong, D.Q.; Xiu, A.; Gao, C. Impacts of post-harvest open biomass burning and burning ban policy on severe haze in the Northeastern China. Sci. Total Environ. 2020, 716, 136517. [Google Scholar] [CrossRef] [PubMed]
  5. Crutzen, P.J.; Andreae, M.O. Biomass Burning in the Tropics: Impact on Atmospheric Chemistry and Biogeochemical Cycles. Science 1990, 250, 1669–1678. [Google Scholar] [CrossRef]
  6. Kaufman, Y.J.; Fraser, R.S. The effect of smoke particles on clouds and climate forcing. Science 1997, 277, 1636–1639. [Google Scholar] [CrossRef] [Green Version]
  7. Lin, J.C.; Matsui, T.; Pielke, R.A.; Kummerow, C. Effects of biomass-burning-derived aerosols on precipitation and clouds in the Amazon Basin: A satellite-based empirical study. J. Geophys. Res. 2006, 111. [Google Scholar] [CrossRef] [Green Version]
  8. Rosenfeld, D. Suppression of rain and snow by urban and industrial air pollution. Science 2000, 287, 1793–1796. [Google Scholar] [CrossRef]
  9. Twomey, S.A. The Influence of Pollution on the Shortwave Albedo of Clouds. J. Atmos. Sci. 1977, 34, 1149–1154. [Google Scholar] [CrossRef] [Green Version]
  10. Galanter, M.; Levy, H.; Carmichael, G.R. Impacts of biomass burning on tropospheric CO, NOx, and O3. J. Geophys. Res. Atmos. 2000, 105, 6633–6653. [Google Scholar] [CrossRef]
  11. Tanimoto, H.; Sato, K.; Butler, T.; Lawrence, M.G.; Fisher, J.A.; Kopacz, M.; Yantosca, R.M.; Kanaya, Y.; Kato, S.; Okuda, T.; et al. Exploring CO pollution episodes observed at Rishiri Island by chemical weather simulations and AIRS satellite measurements: Long-range transport of burning plumes and implications for emissions inventories. Tellus B Chem. Phys. Meteorol. 2017, 61, 394–407. [Google Scholar] [CrossRef] [Green Version]
  12. Chen, W.; Zhang, S.; Tong, Q.; Zhang, X.; Zhao, H.; Ma, S.; Xiu, A.; Yuexin, H. Regional Characteristics and Causes of Haze Events in Northeast China. Chin. Geogra. Sci. 2018, 28, 836–850. [Google Scholar] [CrossRef] [Green Version]
  13. Laumbach, R.J.; Kipen, H.M. Respiratory health effects of air pollution: Update on biomass smoke and traffic pollution. J. Allergy Clin. Immunol. 2012, 129, 3–11. [Google Scholar] [CrossRef] [PubMed] [Green Version]
  14. Cheng, Z.; Wang, S.; Fu, X.; Watson, J.G.; Jiang, J.; Fu, Q.; Chen, C.; Xu, B.; Yu, J.; Chow, J.C.; et al. Impact of biomass burning on haze pollution in the Yangtze River delta, China: A case study in summer 2011. Atmos. Chem. Phys. 2014, 14, 4573–4585. [Google Scholar] [CrossRef] [Green Version]
  15. Wang, Q.; Shao, M.; Liu, Y.; William, K.; Paul, G.; Li, X.; Liu, Y.; Lu, S. Impact of biomass burning on urban air quality estimated by organic tracers: Guangzhou and Beijing as cases. Atmos. Environ. 2007, 41, 8380–8390. [Google Scholar] [CrossRef]
  16. Zhang, Y.; Min, S.; Yun, L.; Luan, S.; Mao, N.; Chen, W.; Wang, M. Emission inventory of carbonaceous pollutants from biomass burning in the Pearl River Delta Region, China. Atmos. Environ. 2013, 76, 189–199. [Google Scholar] [CrossRef]
  17. Zhang, Z.; Gao, J.; Zhang, L.; Wang, H.; Tao, J.; Qiu, X.; Chai, F.; Li, Y.; Wang, S. Observations of biomass burning tracers in PM2.5 at two megacities in North China during 2014 APEC summit. Atmos. Environ. 2017, 169, 54–64. [Google Scholar] [CrossRef]
  18. Cao, F.; Zhang, S.C.; Kawamura, K.; Liu, X.; Yang, C.; Xu, Z.; Fan, M.; Zhang, W.; Bao, M.; Chang, Y.; et al. Chemical characteristics of dicarboxylic acids and related organic compounds in PM2.5 during biomass-burning and non-biomass-burning seasons at a rural site of Northeast China. Environ. Pollut. 2017, 231, 654–662. [Google Scholar] [CrossRef]
  19. Zhang, J.; Liu, L.; Xu, L.; Lin, Q.; Zhao, H.; Wang, Z.; Guo, S.; Hu, M.; Liu, D.; Shi, Z.; et al. Exploring wintertime regional haze in northeast China: Role of coal and biomass burning. Atmos. Chem. Phys. 2020, 20, 5355–5372. [Google Scholar] [CrossRef]
  20. Shi, Y.; Gong, S.; Zang, S.; Zhao, Y.; Wang, W.; Lv, Z.; Matsunaga, T.; Yamaguchi, Y.; Bai, Y. High-resolution and multi-year estimation of emissions from open biomass burning in Northeast China during 2001–2017. J. Clean. Prod. 2021, 310, 127496. [Google Scholar] [CrossRef]
  21. Cao, F.; Zhang, S.C.; Kawamura, K.; Zhang, Y.L. Inorganic markers, carbonaceous components and stable carbon isotope from biomass burning aerosols in Northeast China. Sci. Total Environ. 2016, 572, 1244–1251. [Google Scholar] [CrossRef] [PubMed]
  22. Li, Y.; Liu, J.; Han, H.; Zhao, T.; Zhang, X.; Zhuang, B.; Wang, T.; Chen, H.; Wu, Y.; Li, M. Collective impacts of biomass burning and synoptic weather on surface PM2.5 and CO in Northeast China. Atmos. Environ. 2019, 213, 64–80. [Google Scholar] [CrossRef]
  23. Kaufman, Y.J.; Justice, C.; Flynn, L.; Kendall, J.; Prins, E.; Giglio, L.; Ward, D.E.; Menzel, P.; Setzer, A. Potential global fire monitoring from EOS-MODIS. J. Geophys. Res. 1998, 103, 32215–32238. [Google Scholar] [CrossRef]
  24. Giglio, L.; Csiszar, I.; Justice, C.O. Global distribution and seasonality of active fires as observed with the Terra and Aqua Moderate Resolution Imaging Spectroradiometer (MODIS) sensors. J. Geophys. Res. Biogeosci. 2006, 111. [Google Scholar] [CrossRef]
  25. Giglio, L.; Schroeder, W.; Justice, C.O. The collection 6 MODIS active fire detection algorithm and fire products. Remote Sens. Environ. 2016, 178, 31–41. [Google Scholar] [CrossRef] [Green Version]
  26. Friedl, M.A.; McIver, D.K.; Hodges, J.C.F.; Zhang, X.Y.; Muchoney, D.; Strahler, A.H.; Woodcock, C.E.; Gopal, S.; Schneider, A.; Cooper, A.; et al. Global land cover mapping from MODIS: Algorithms and early results. Remote Sens. Environ. 2002, 83, 287–302. [Google Scholar] [CrossRef]
  27. Sulla-Menashe, D.; Friedl, M.A. User Guide to Collection 6 MODIS Land Cover (MCD12Q1 and MCD12C1) Product; USGS: Reston, VA, USA, 2018. [CrossRef]
  28. Wei, X.; Wang, G.; Chen, T.; Hagan, D.F.T.; Ullah, W. A Spatio-Temporal Analysis of Active Fires over China during 2003–2016. Remote Sens. 2020, 12, 1787. [Google Scholar] [CrossRef]
  29. Tarek, M.; Brissette, F.P.; Arsenault, R. Evaluation of the ERA5 reanalysis as a potential reference dataset for hydrological modelling over North America. Hydrol. Earth Syst. Sci. 2020, 24, 2527–2544. [Google Scholar] [CrossRef]
  30. Theil, H. A rank-invariant method of linear and polynomial regression analysis. Mathematics 1950, 53, 386–392. [Google Scholar]
  31. Sen, K.P. Estimates of the Regression Coefficient Based on Kendall’s Tau. Publ. Am. Stat. Assoc. 1968, 63, 1379–1389. [Google Scholar] [CrossRef]
  32. Neeti, N.; Eastman, J.R. A Contextual Mann-Kendall Approach for the Assessment of Trend Significance in Image Time Series. Trans. GIS 2011, 15, 599–611. [Google Scholar] [CrossRef]
  33. Douglas, E.M.; Vogel, R.M.; Kroll, C.N. Trends in floods and low flows in the United States: Impact of spatial correlation. J. Hydrol. 2000, 240, 90–105. [Google Scholar] [CrossRef]
  34. Yin, S.; Wang, X.; Xiao, Y.; Tani, H.; Zhong, G.; Sun, Z. Study on spatial distribution of crop residue burning and PM2.5 change in China. Environ. Pollut. 2017, 220, 204–221. [Google Scholar] [CrossRef]
  35. Zhao, H.; Yang, G.; Tong, D.Q.; Zhang, X.; Xiu, A.; Zhang, S. Interannual and Seasonal Variability of Greenhouse Gases and Aerosol Emissions from Biomass Burning in Northeastern China Constrained by Satellite Observations. Remote Sens. 2021, 13, 1005. [Google Scholar] [CrossRef]
  36. Ke, H.; Gong, S.; He, J.; Zhou, C.; Zhang, L.; Zhou, Y. Spatial and temporal distribution of open bio-mass burning in China from 2013 to 2017. Atmos. Environ. 2019, 210, 156–165. [Google Scholar] [CrossRef]
  37. Wang, L.; Jin, X.; Wang, Q.; Mao, H.; Liu, Q.; Weng, G.; Wang, Y. Spatial and temporal variability of open biomass burning in Northeast China from 2003 to 2017. Atmos. Ocean. Sci. Lett. 2020, 13, 240–247. [Google Scholar] [CrossRef] [Green Version]
  38. Korontzi, S.; Mccarty, J.; Loboda, T.; Kumar, S.; Justice, C. Global distribution of agricultural fires in croplands from 3 years of Moderate Resolution Imaging Spectroradiometer (MODIS) data. Glob. Biogeochem. Cycles 2006, 20. [Google Scholar] [CrossRef]
  39. Zhao, H.; Tong, D.Q.; Gao, C.; Wang, G. Effect of dramatic land use change on gaseous pollutant emissions from biomass burning in Northeastern China. Atmos. Res. 2015, 153, 429–436. [Google Scholar] [CrossRef]
  40. Tao, J.; Zhang, Y.; Yuan, X.; Wang, J.; Zhang, X. Analysis of forest fires in Northeast China from 2003 to 2011. Int. J. Remote Sens. 2013, 34, 8235–8251. [Google Scholar] [CrossRef]
  41. Krawchuk, M.A.; Moritz, M.A.; Parisien, M.A.; Van Dorn, J.; Hayhoe, K. Global pyrogeography: The current and future distribution of wildfire. PLoS ONE 2009, 4, e5102. [Google Scholar] [CrossRef]
Figure 1. (a) Location of study area, (b) topographic map, and (c) distribution of land cover types in northeastern China.
Remotesensing 14 02316 g001
Figure 2. (a) Annual total and (b) monthly average fire counts in northeastern China during 2003–2018. Error bars indicate one-fifth of the standard deviation.
Remotesensing 14 02316 g002
Figure 3. Spatial distribution of the multi-annual average seasonal fire counts in different seasons of (a,c) spring and (b,d) autumn in northeastern China during 2003–2018 from (a,b) Terra and (c,d) Aqua fire products, respectively.
Remotesensing 14 02316 g003
Figure 4. Long-term trends in fire counts (units: spots per year) in (a,c) spring and (b,d) autumn in Northeastern China during 2003–2018 from (a,b) Terra and (c,d) Aqua fire products. The “+” sign indicates that the trend passed the significance test at the 5% level.
Remotesensing 14 02316 g004
Figure 5. Statistic value of fire radiative power during 2003–2018 in NEC from Terra and Aqua fire products. (a) Annual total fire radiative power (unit: MW); (b) monthly total fire radiative power (unit: MW); (c) annual mean fire radiative power per spot (unit: MW/spot); and (d) monthly mean fire radiative power per spot (unit: MW/spot) in NEC. Error bars indicate one-fifth of the standard deviation.
Remotesensing 14 02316 g005
Figure 6. Spatial distribution of mean fire radiative power (unit: MW/spot) in different seasons of (a,c) spring and (b,d) autumn in northeastern China during 2003–2018 from (a,b) Terra and (c,d) Aqua fire products, respectively.
Remotesensing 14 02316 g006
Figure 7. Long-term variation in mean fire radiative power for each fire spot (unit: MW/spot per year) during 2003–2018 in (a,c) spring and (b,d) autumn from Terra and Aqua fire products. The “+” sign indicates that the trend passed the significance test at the 5% level.
Remotesensing 14 02316 g007
Figure 8. Annual fire counts in different land cover types during 2003–2018 from Terra and Aqua fire products. Error bars indicate one fifth of the standard deviation.
Remotesensing 14 02316 g008
Figure 9. Annual total fire radiative power (FPRtot, left panels) and mean fire radiative power for each fire point (FRPmean, right panels) in different land cover types during 2003–2018 from Terra and Aqua fire products. The graphs show these values for (a,b) forests, (c,d) savannas, (e,f) grasslands, and (g,h) croplands. Error bars indicate one-fifth of the standard deviation.
Remotesensing 14 02316 g009
Figure 10. Monthly fire counts in different land cover types in northeastern China during 2003–2018 from (left panel) Terra and (right panel) Aqua fire products. The graphs show the values for (a,b) forests, (c,d) savannas, (e,f) grasslands, and (g,h) croplands. The red lines represent the monthly average values, and the black lines represent the median values.
Remotesensing 14 02316 g010
Figure 11. Monthly mean fire radiative power for each fire spot (FRPmean, unit: MW/spot) in different land cover types during 2003–2018 from (left panel) Terra and (right panel) Aqua fire products. The graphs show the values for (a,b) forests, (c,d) savannas, (e,f) grasslands, and (g,h) croplands. The red lines represent the monthly average values, and the black lines represent the median values.
Remotesensing 14 02316 g011
Figure 12. (a) Annual and (b) monthly mean temperature (Tmean), relatively humidity (RHmean), and accumulated precipitation (Pmean) during 2003–2018.
Remotesensing 14 02316 g012
Table 1. Combined MODIS land cover type (MCD12C1) International Geosphere-Biosphere Programme legend.
NameValueNameValue
Evergreen needleleaf forests1Grasslands10
Evergreen broadleaf forests2Permanent wetlands11
Deciduous needleleaf forests3Croplands12
Deciduous broadleaf forests4Urban and built-up lands13
Mixed forests5Croplands/natural vegetation mosaics14
Closed shrublands6Permanent snow and ice15
Open shrublands7Barren16
Woody savannas8Water bodies17
Savannas9Unclassified255
Table 2. Percentages of multi-annual average fire counts and total fire radiative power (FRPtot) detected by Terra and Aqua satellites among different land covers in the NEC region.
SatelliteVariableForestsSavannasGrasslandsCroplandsOther Covers
TerraFire count5.1%16.1%10.9%61.9%6.0%
FRPtot6.8%26.9%13.4%50.1%2.8%
AquaFire count6.4%18.1%9.8%61.4%4.3%
FRPtot8.8%30.5%11.5%47.2%2.0%
Publisher’s Note: MDPI stays neutral with regard to jurisdictional claims in published maps and institutional affiliations.

