
State of the Vietnamese Coast—Assessing Three Decades (1986 to 2021) of Coastline Dynamics Using the Landsat Archive


1
German Remote Sensing Data Center (DFD), German Aerospace Center (DLR), 82234 Wessling, Germany
2
Department of Remote Sensing, Institute of Geography and Geology, University of Wuerzburg, 97074 Wuerzburg, Germany
3
Department of Physical Geography, Institute of Geography and Geology, University of Wuerzburg, 97074 Wuerzburg, Germany
*
Author to whom correspondence should be addressed.
Remote Sens. 2022, 14(10), 2476; https://0-doi-org.brum.beds.ac.uk/10.3390/rs14102476
Submission received: 5 May 2022
/
Revised: 18 May 2022
/
Accepted: 19 May 2022
/
Published: 21 May 2022
(This article belongs to the Special Issue Coastal Erosion Monitoring Based on Earth Observation Products)
Abstract
:Vietnam’s 3260 km coastline is densely populated, experiences rapid urban and economic growth, and faces at the same time a high risk of coastal hazards. Satellite archives provide a free and powerful opportunity for long-term area-wide monitoring of the coastal zone. This paper presents an automated analysis of coastline dynamics from 1986 to 2021 for Vietnam’s entire coastal zone using the Landsat archive. The proposed method is implemented within the cloud-computing platform Google Earth Engine to only involve publicly and globally available datasets and tools. We generated annual coastline composites representing the mean-high water level and extracted sub-pixel coastlines. We further quantified coastline change rates along shore-perpendicular transects, revealing that half of Vietnam’s coast did not experience significant change, while the remaining half is classified as erosional (27.7%) and accretional (27.1%). A hotspot analysis shows that coastal segments with the highest change rates are concentrated in the low-lying deltas of the Mekong River in the south and the Red River in the north. Hotspots with the highest accretion rates of up to +47 m/year are mainly associated with the construction of artificial coastlines, while hotspots with the highest erosion rates of −28 m/year may be related to natural sediment redistribution and human activity.
1. Introduction
Estuarine and coastal ecosystems belong to the most heavily used and threatened natural systems worldwide [1]. Currently, more than 40% of the world’s population lives in coastal regions, a quarter of which is situated less than 10 m above sea level [2,3]. Floods, saltwater intrusion, tsunamis, subsidence, and erosion are among the natural risks to which coasts are exposed [4]. In this context, global change increases the pressure on coastal ecosystems through a rising global mean sea level, changing rainfall and related freshwater discharge patterns, and the likelihood of more frequent or more severe droughts and storms [3,5]. The IPCC 2019 Special Report on Oceans and Cryosphere [5] further states the important role of non-climatic anthropogenic drivers for the increasing vulnerability of low-lying coastal communities. In contrast to the long-term impact of sea level rise, human-induced changes can rapidly modify coasts over short periods [5,6]. Profound understanding and monitoring of coastal processes are therefore crucial for protecting a large number of people in the face of a changing world.
Coastline change is a powerful indicator for characterizing and comparing dynamics within the coastal zone [7]. The observation of coastline dynamics allows for continuous and quantifiable coastal monitoring. The definition of the ‘coast’ goes beyond the binary, linear separation of land and water and can rather be described as the zone that is generally affected by ocean water. According to Boak and Turner (2005) [8], a comparable definition of the ‘coastline’ is required when studying coastline dynamics over a period of time. However, the terms ‘coastline’ and ‘shoreline’ have been used interchangeably in coastal research [9,10,11]. Mohan et al. (2005) [12] suggests a differentiation of the terms ’coastline’ and ’shoreline’ by scale, where ’coastline’ describes the land-water boundary at regional to global scales, while ’shoreline’ marks the precise boundary between the shore and the water. In this paper, ‘coastline’ will refer to the annual mean high-water boundaries on large scale, while ‘shoreline’ will be utilized for single acquisition waterlines on smaller scales.
Drivers of long-term coastline changes are diverse and often interrelated [13]. Natural coastal erosion may be caused by near-shore currents, wind, waves, or weathering [14]. Coasts that are usually supplied by river sediment likely erode as a consequence of a reduction in river discharge through decreasing rainfall or snowmelt [15,16]. Human-induced coastal erosion is often associated with the construction of river dams [17,18], sand mining [19,20,21], cutting of coastal mangrove forests [22], and the construction of coastal infrastructure, such as groynes, ports, inlet jetties, breakwaters, and sea walls [23,24,25]. Moreover, anthropogenic climate change is already contributing to global mean sea level rise, which is projected to be a major cause of coastal erosion in the future [5,26]. Natural coastal accretion on the other hand most commonly occurs at deltaic coasts, where large quantities of fluvial sediment get distributed along the coast through littoral drift [12]. Energetic breaking waves, coastal landslides, and rockfall, as well as tidal flat formation, may also temporally prograde coastlines [12]. Anthropogenic coastal accretion encompasses artificial (beach) nourishment, artificial coastlines, land reclamation, and mangrove planting [12,27,28].
In the past, coastline changes have been monitored using historical photographs, coastal maps, land-based surveys, seabed mapping, and temporally sparse aerial datasets [10]. These techniques are rather time-consuming and expensive. The emergence of publicly available, global satellite archives has revolutionized coastal research, allowing for continuous monitoring with large spatial and temporal coverage [8,22,29,30,31]. Band ratios such as the Normalized Difference Water Index (NDWI), which exploits the high absorption of water in the near-infrared (NIR) wavelength, are commonly used to distinguish water from land in multispectral satellite images [32]. Bishop-Taylor et al. (2019) [33] compared several methods to extract the waterline from water index images using different thresholding and line extraction methods. The best results were achieved using a combination of an ‘optimal threshold’ (e.g., Otsu) and sub-pixel waterline extraction based on a marching squares algorithm, which provided more accurate results than a traditional whole-pixel approach [33]. Similar results were also published by Cipolletti et al. (2012) [34] and Song et al. (2019) [35], revealing high accuracies using sub-pixel waterline extraction methods. When assessing coastline dynamics, the definition of a representative coastline position poses an additional challenge [8], as the position of the coastline is not only subject to long-term changes but also to short-term fluctuations, e.g., due to the tidal range [8,15]. Previous satellite-based coastline detection studies either neglected the effect of tidal impact [36], created composites from all available images over a period of time to average out the effect of tidal variation [29], or utilized tidal modeling [33,37,38,39] based on sea level data with the tidal data. The recent development of cloud-computing services, such as the freely accessible Google Earth Engine (GEE), allows for parallel computation of big analysis-ready datasets and has accelerated the potential of satellite-based large-scale time series analysis [40]. The studies of Luijendijk et al. (2018) [29] and Mentaschi et al. (2018) [22] presented global coastline change analysis based on Landsat data, exploiting the capacities of GEE. However, the existing global coastline datasets are limited to sandy beaches [29] and raster-based land loss and gain information [22] and are therefore only suitable to a limited extent for detailed local analyses.
The coastal zone of Vietnam is especially vulnerable to coastline change with over 50% of the major cities, which contain 31% of the national population, being located on the coast [9]. Urbanization and the need for natural resources accelerate the pressure on the coastal zone [17]. At the same time, hazard risk information is fragmented and incomplete [26]. The studies that have previously addressed coastal erosion and accretion in Vietnam are regionally limited to the Mekong Delta [17,19,20,21,41], the Red River Delta [42,43] or other local hotspots, such as Cua Dai Beach [44,45]. Remote sensing, bathymetry, and field surveys have been used to discuss a variety of possible drivers of coastline change, such as natural erosion through waves and currents [45], upstream river dam construction [17], sand mining [19,20], coastal engineering [44], sea level rise [26,42,46], land subsidence [47], and vegetation clearing [21,41] in these areas. However, these findings are difficult to assemble into an overarching picture due to a lack of standardization and overlapping time periods. No complete national assessment of Vietnam’s coastline change has been conducted to date.
This research aims at developing a detailed nationwide analysis of annual coastline dynamics in Vietnam covering a period of 35 years (1986–2021). The analysis concentrates on: (i) Development of a GEE-based fully automated approach using only publicly and globally available datasets and tools; (ii) generation of annual coastline composites representing the mean-high water level; (iii) analysis of coastline dynamics along shore-perpendicular transects; and (iv) analysis of erosion and accretion hotspots, including a discussion on potential drivers of change at the most salient observed hotspots.
2. Materials and Methods
2.1. Study Area
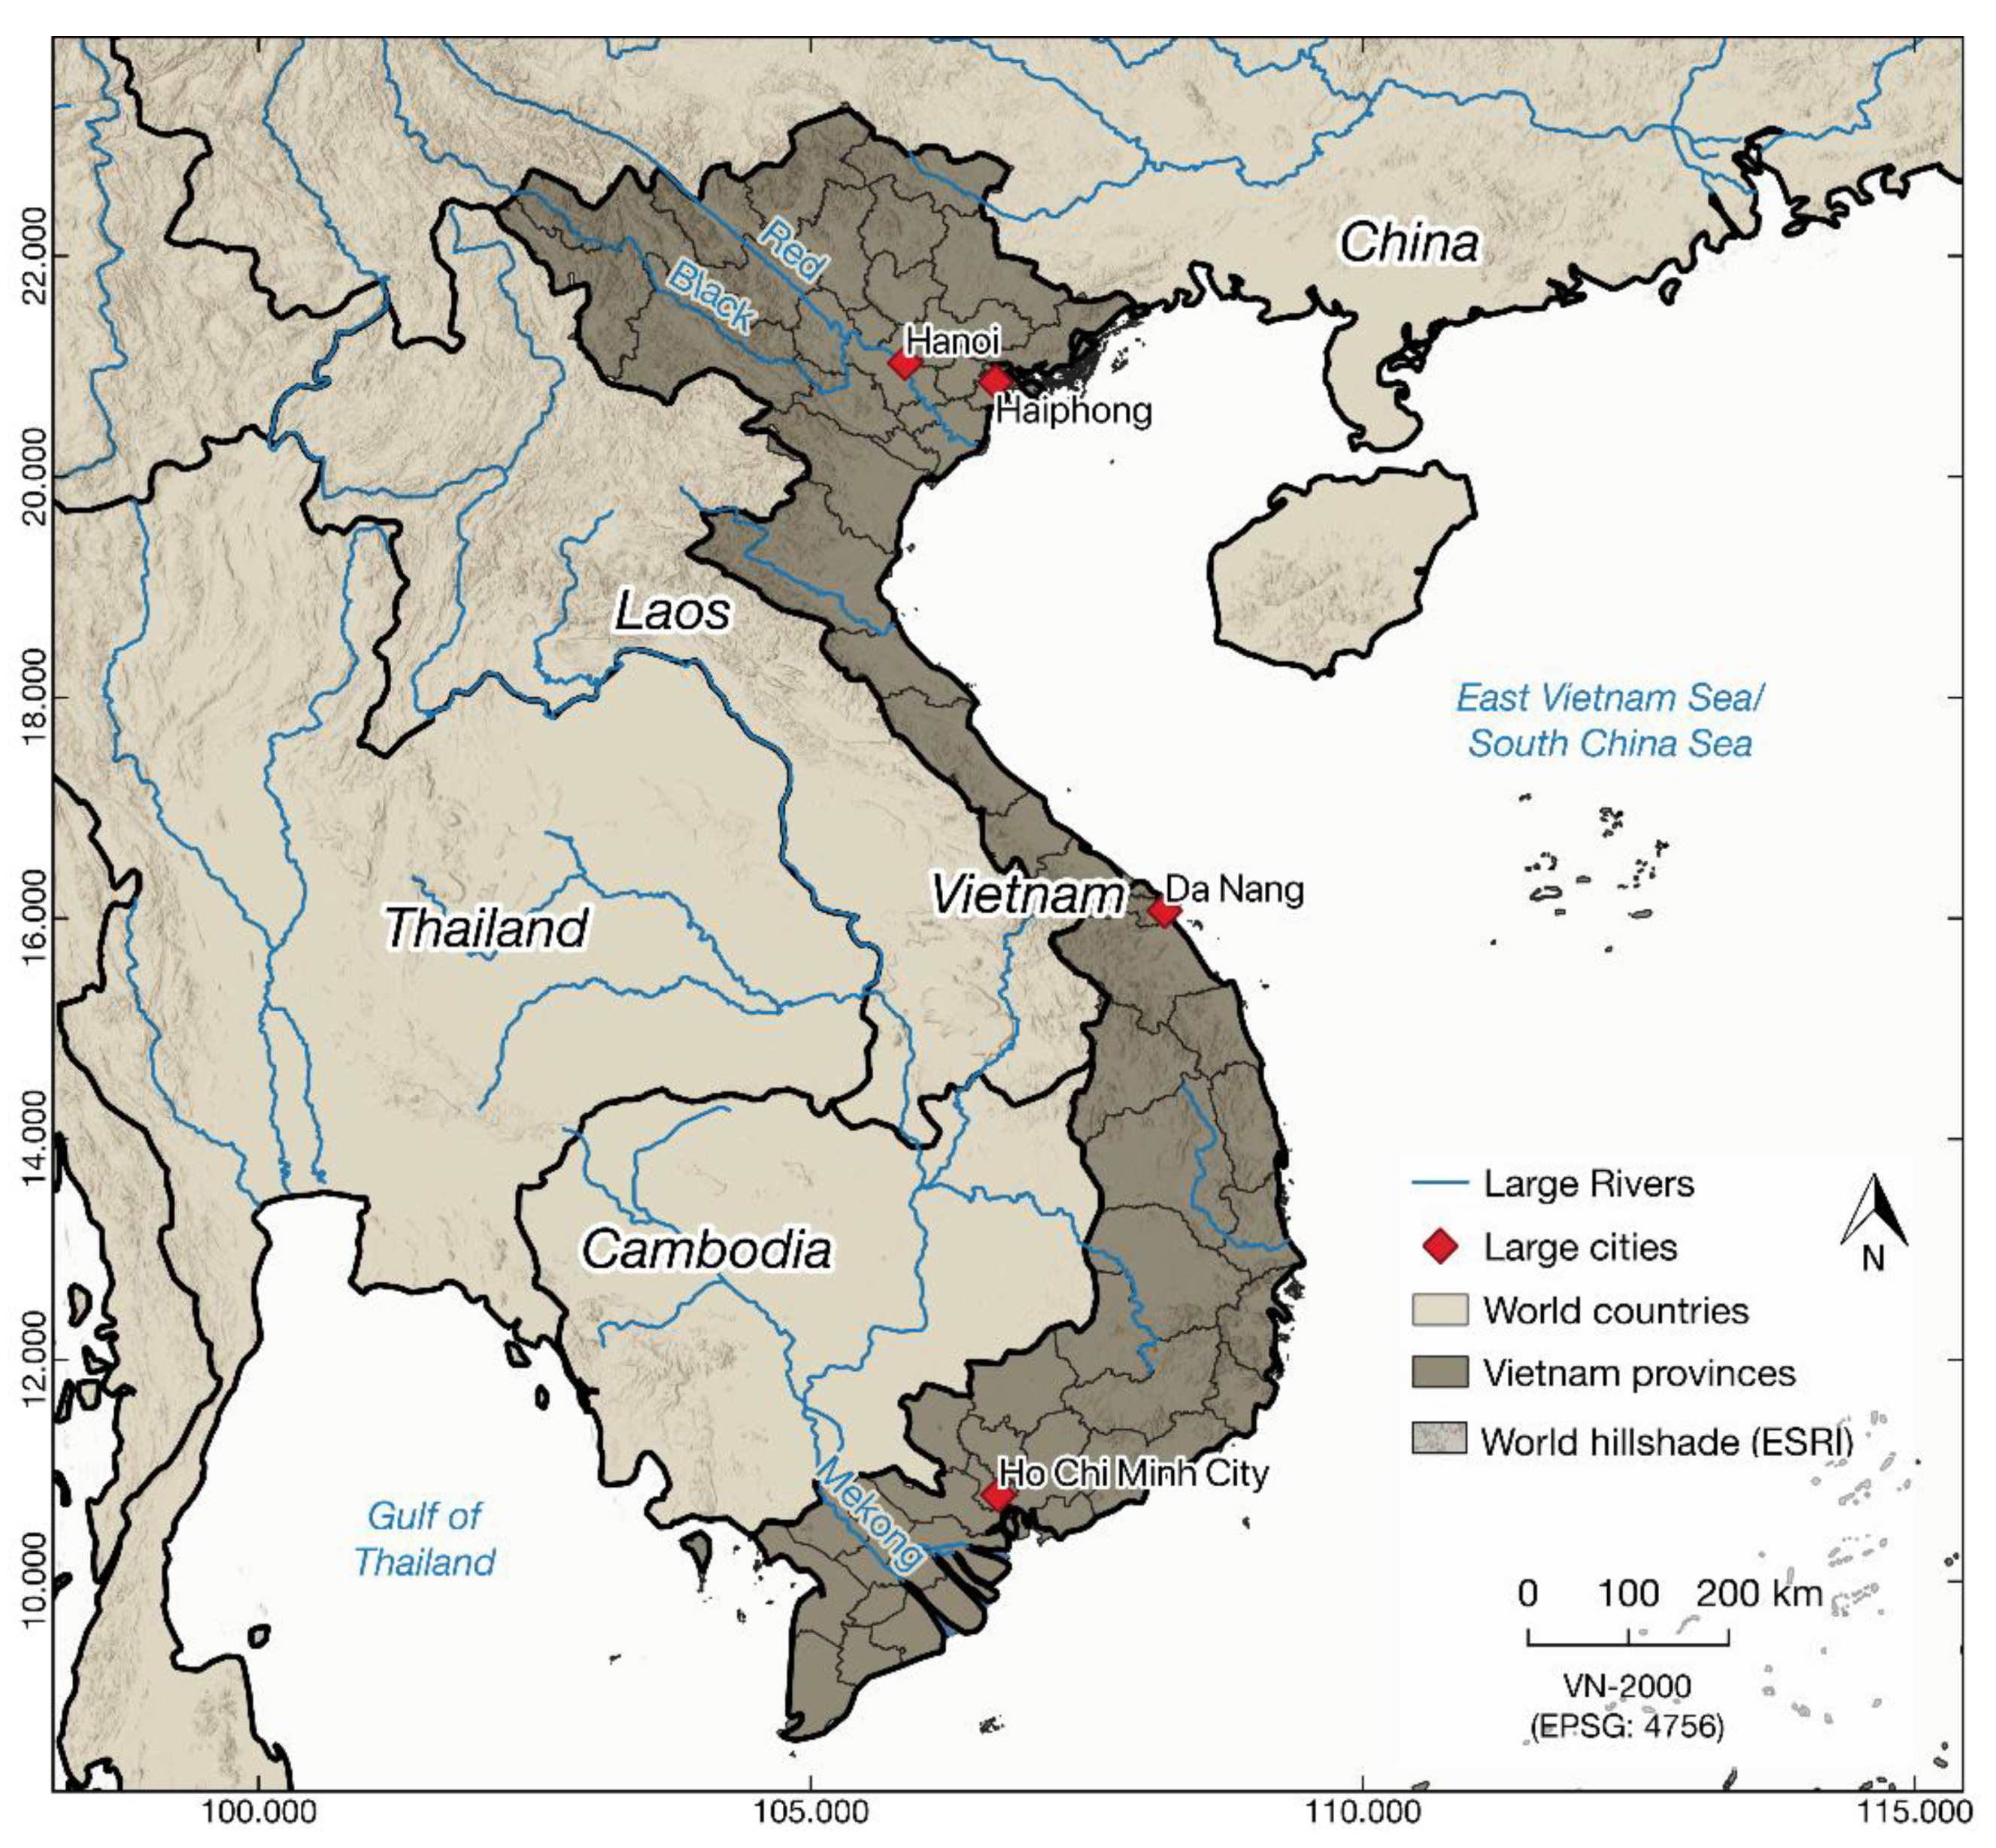
Vietnam covers an area of about 331,690 km2 and currently holds a population of approx. 97 million people. Administratively, Vietnam is divided into five municipalities and 58 provinces, of which 28 are located at the coast (Figure 1). The coastal zone is home to 47 million people. Hanoi and Ho Chi Minh City represent the urban centers of the country [48]. Vietnam encompasses several climatic zones, ranging from tropical climate in the south to temperate climate in the north and the central highlands [49]. The climate in the north shows four distinct seasons, while the tropical south has two seasons (rainy and dry). All parts of the country experience effects of the annual monsoon, which corresponds to the occurrence of the rainy season. The average temperatures in the north range from 22–27.5 °C in summer and 15–20 °C in winter, while the south shows a narrower range of 28–29 °C in summer and 26–27 °C in winter. The average annual precipitation for Vietnam is 1834 mm [50]. Vietnam is further characterized by two major river systems: The Mekong River in the south and the Red River in the north [51]. Both rivers form naturally prograding deltas with complex river systems and large low-lying areas. Vietnam’s coast mainly consists of rocky promontories, beaches, and small estuaries, with corals growing along most of the coast [52]. The tidal regime along the Vietnamese coast transitions from diurnal tides in the north to semi-diurnal tides in the south [53]. The tidal range in the south lies between 2 to 4 m, while tides at the central coast only range from 0.5 to 2 m, and 1.3 to 4 m in the north. Most of Vietnam’s coastline may hence be classified as microtidal to mesotidal [27]. Vietnam experiences strong coastal currents that mostly depend on seasonal monsoons and tropical cyclones. During winter, the predominant direction of the near-shore currents is south-(west), while the pattern reverses in summer towards north-(east). Generally, the winter currents are more common than the summer currents [54].
2.2. Data
2.2.1. Landsat Archive
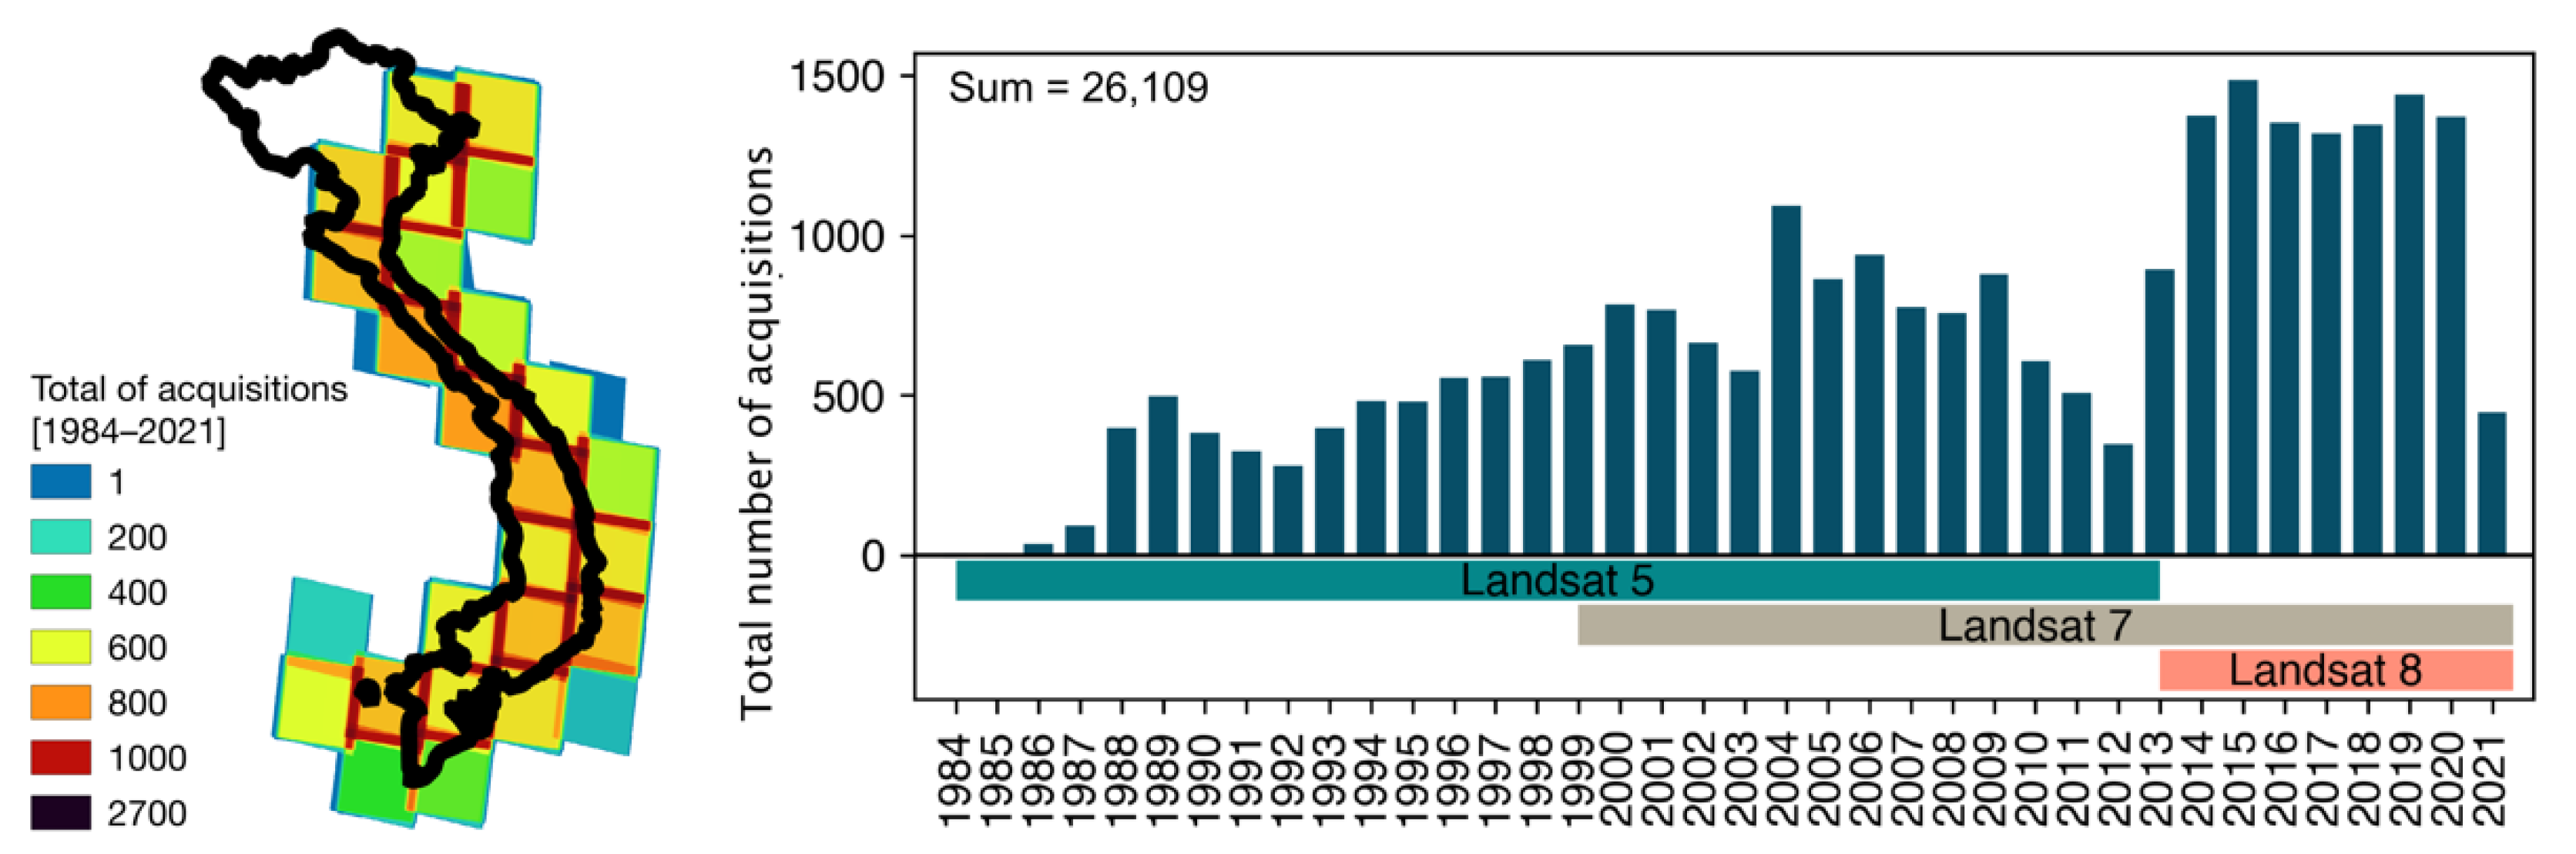
The Landsat mission provides the longest, continuous space-based record of Earth’s land surface [55]. For the present analysis, all available images covering the Vietnamese coastal zone of the Landsat 5 Thematic Mapper (TM), Landsat 7 Enhanced Thematic Mapper Plus (ETM+), and Landsat 8 Operational Land Imager (OLI) instruments were used. The United States Geological Service (USGS) provides the datasets already pre-processed to surface reflectance (SR) [56]. The TM and ETM+ sensors capture electromagnetic radiation in seven bands with four bands in the visible (VIS) and NIR spectrum, two short-wave infrared (SWIR) bands, and one thermal infrared (TIR) band. The visible and near-infrared (VNIR), as well as the SWIR, bands are acquired with a spatial resolution of 30 m [55]. Each of the near polar-orbiting Landsat satellites has a revisit time of 16 days. For Vietnam’s coastal zone, a total of 26,109 Landsat acquisitions were analyzed. The spatio-temporal availability of acquisitions is shown in Figure 2, depicting low availability in the 1980s and 2012, while most acquisitions for Vietnam are available from 2014 until 2021 after the launch of Landsat 8. Spatially, central Vietnam encompasses the lowest availability at the southern tip of the country with a total of 400 observations.
2.2.2. Validation Data
Very High Resolution (VHR) RapidEye data were utilized to validate the Landsat-derived coastline results. This commercial satellite constellation is operated by the company Planet and was launched in August 2008. It consists of five identical satellites capturing images of Earth’s land surface every 5.5 days over mid-latitude regions. The RapidEye Earth-imaging System (REIS) provides imagery in five spectral bands (Blue, Red, Green, Red Edge, and NIR) with a spatial resolution of 6.5 m at nadir, which is resampled to 5 m [57]. For this analysis, orthorectified level 3A products were used. The data are provided radiometrically and geometrically corrected. RapidEye provides data in 25 by 25 km tiles [58]. All utilized tiles are listed in Table 1, including the Landsat scene that was used for comparison. The RapidEye mosaic was the only available VHR image for which a temporally matching cloud-free Landsat image existed. The close acquisition times are important to avoid the influence of tidal and wave attack on the land-water boundary. The RapidEye mosaic covers an area of about 3000 km2 around Da Nang in central Vietnam with a shoreline length of approx. 250 km.
2.2.3. Sea Level Data
To understand how tidal range might influence Landsat-derived coastlines, hourly sea-level data was used to identify the sea level at Landsat acquisition times. The University of Hawaii Sea Level Center (UHSLC) provides global sea level data measured by tide gauge since 1846 [59]. The sea level data can be accessed as Fast Delivery (FD) data or Research Quality data (RQD). For the present analysis, RQD from gauge station Qui Nhon in Central Vietnam was used from 1994 to 2018.
2.3. Methods
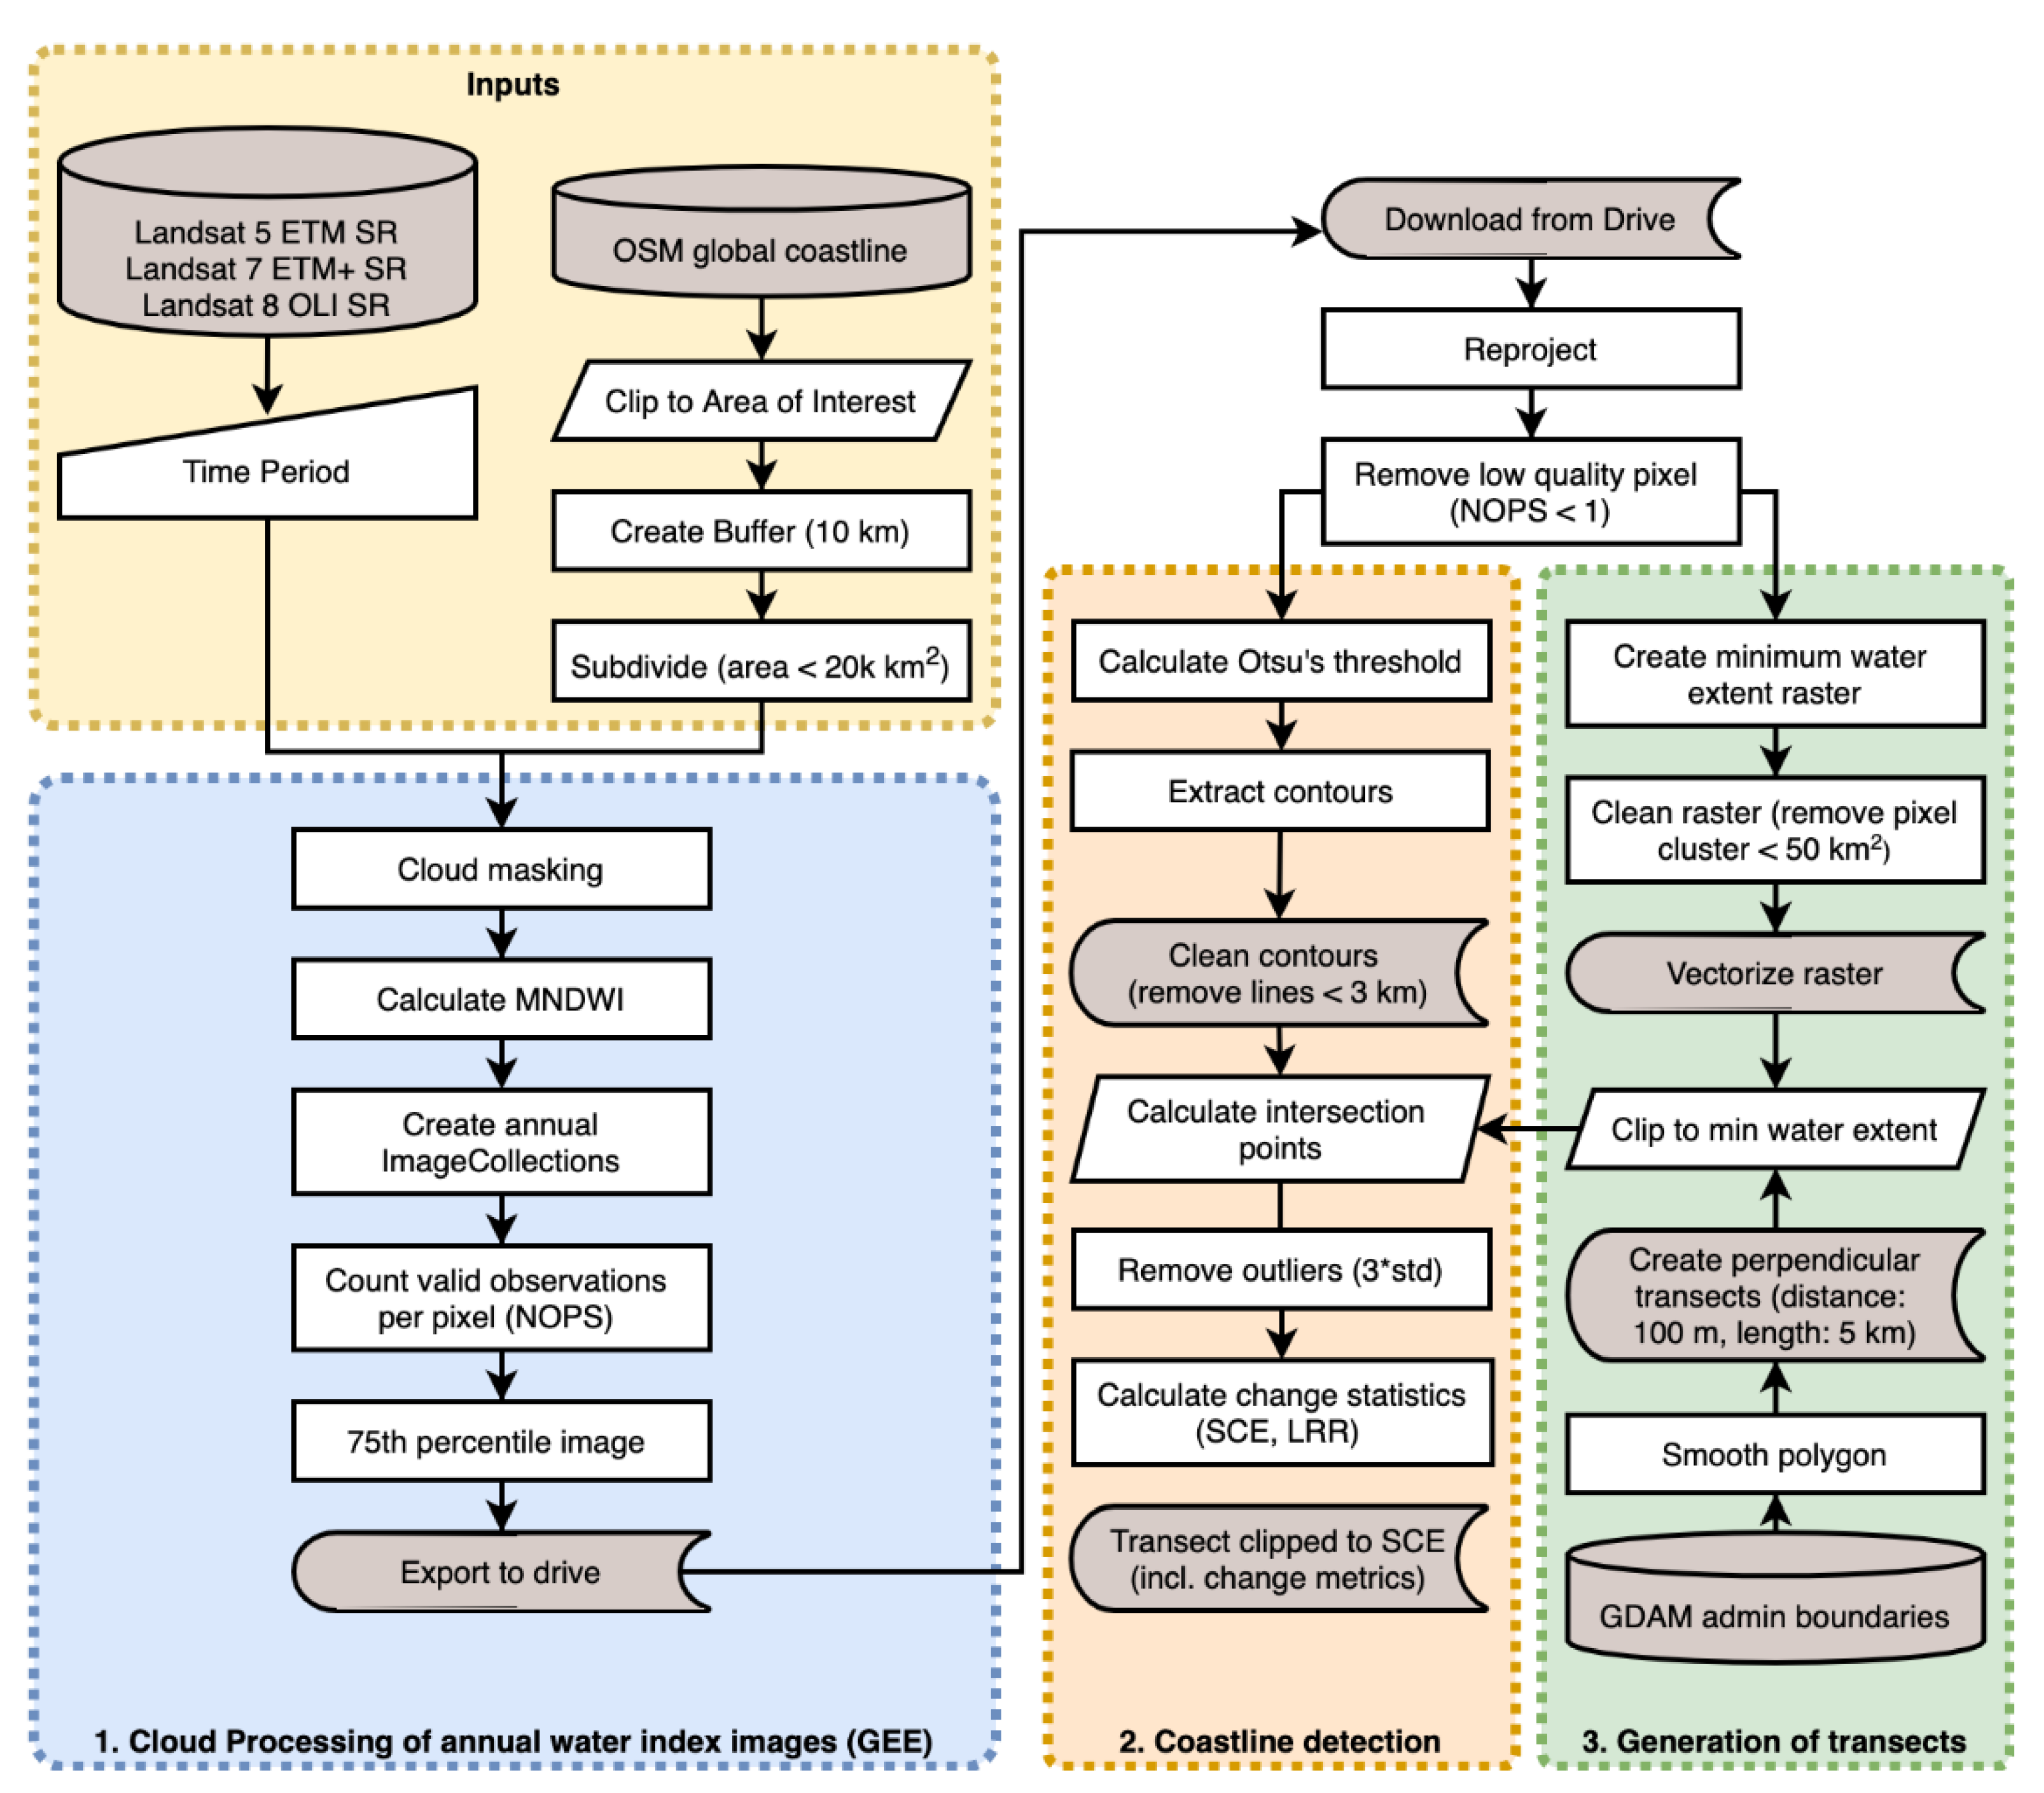
The presented coastline detection approach comprises three overarching methods: The cloud-processing of annual water index images, the coastline extraction with change quantification, as well as the creation of shore-normal transects (see Figure 3).
2.3.1. Country-Scale Processing of Annual Water Index Images
The creation of annual water-index composites was performed within the cloud-processing framework of GEE. To define the area of interest (AOI), an Open Street Map (OSM) global shoreline from 2020 was clipped to the country boundaries of Vietnam and buffered by 10 km. The resulting polygon was then simplified and subdivided into tiles with a maximum of 20 km2 for batch processing. All images between 1986 and 2021 were cloud-masked based on the pixel quality band (pixel_qa), provided with each Landsat acquisition. The pixel quality band was generated from the CFMask algorithm developed by Foga et al. (2017) [60] and contains pixel quality attributes including bitmasks for clouds and cloud shadows. The cloud-masking processing step was preferred over the immediate generation of annual composites, e.g., done by Luijendijk et al. (2018) [29], since the high cloud coverage of tropical Vietnam is expected to cause cloud residuals [61]. A water index was calculated for each cloud-masked image using the Modified Normalized Difference Water Index (MNDWI) developed by Xu (2006) [62]. The index is calculated as follows (Equation (1)):
MNDWI = (Green − SWIR)/(Green + SWIR)
The calculation results in pixel values ranging from −1 to +1, where high values are associated with water bodies and low values with land features [62]. The MNDWI has been proven to provide more accurate results than the traditional NDWI, which uses the NIR band instead of SWIR [33,63,64]. After having calculated the MNDWI for all images, they were combined into annual image stacks. To reduce the effect of tidal and seasonal fluctuation, a 75th percentile composite was calculated for each year. The 75th percentile is expected to capture the mean high-water level, assuming that different water levels are represented within one annual image stack. Finally, a band containing the number of valid (cloud-free) observations per pixel (NOPS) was calculated for each image stack and exported with the final water index composite as a quality layer. Low-quality pixels with only one observation were masked to avoid a single acquisition bias of the local coastline detection result.
2.3.2. Sub-Pixel Coastline Extraction
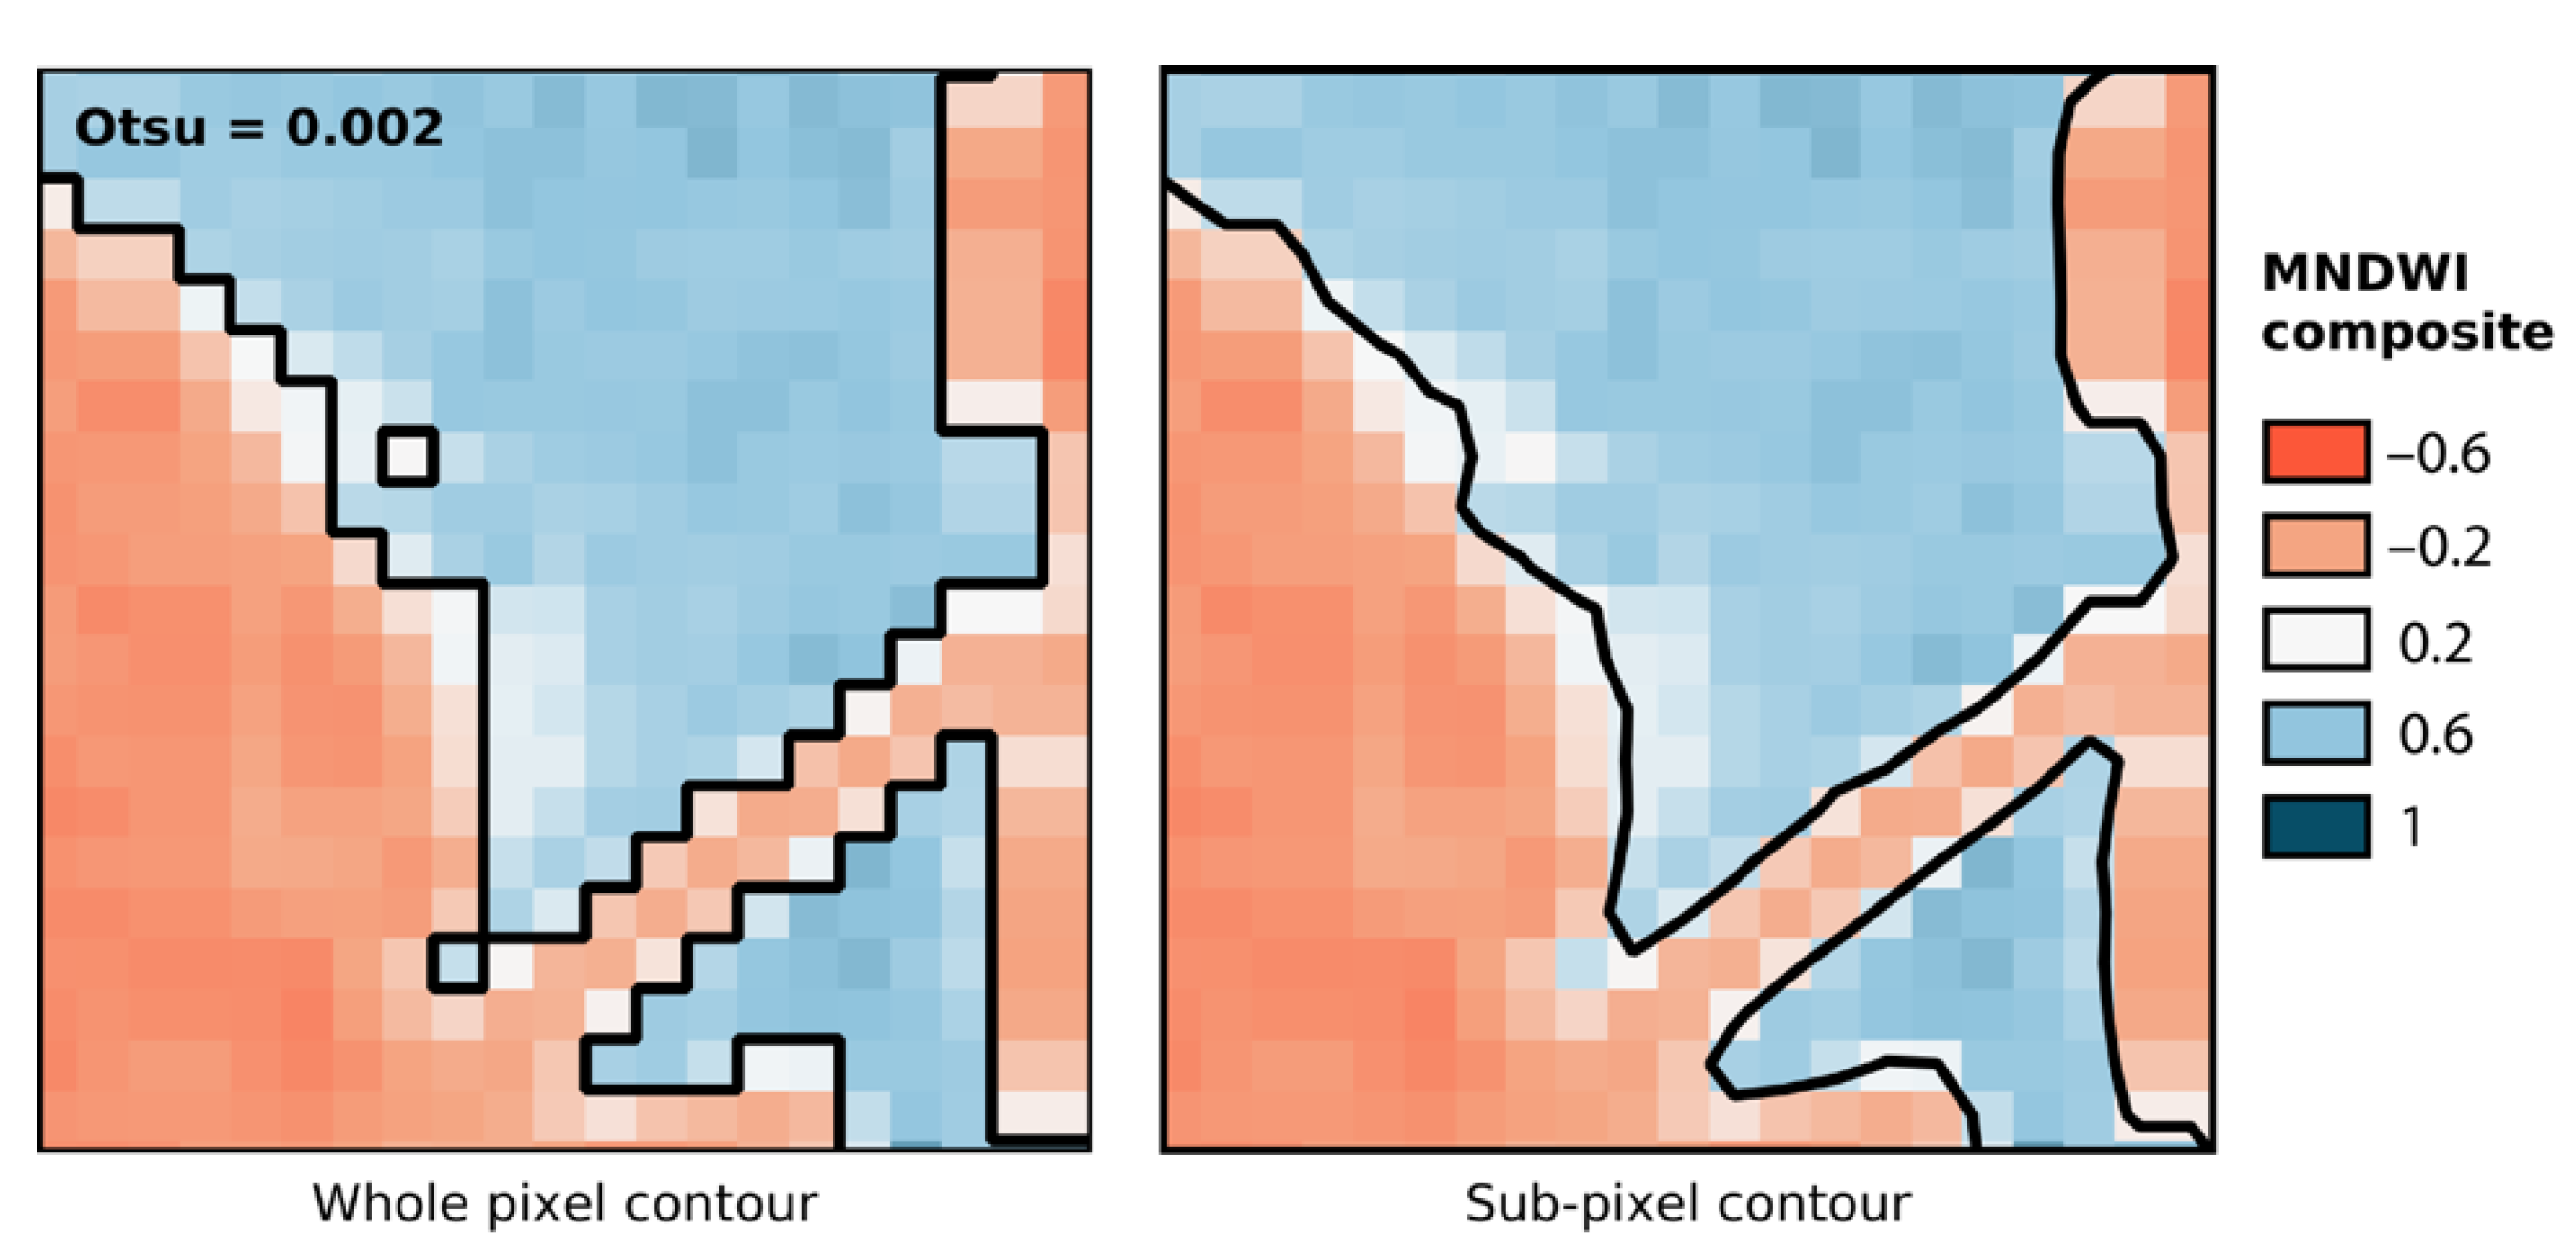
The boundary between land and water was defined using the Otsu adaptive thresholding method [65]. The Otsu method is regarded the ‘gold standard in the field of thresholding’, according to Toure et al. (2020) [10] and has been widely used to delineate water/land boundaries [11,29,63,66]. The Otsu threshold works best for bimodal histogram distributions and fails when the histogram is (close to) unimodal [67]. The processing tile generation along the OSM coastline ensures a nearly balanced distribution of land and water within the images. The sub-pixel coastline was calculated using the contour extraction method skimage.measure.find_contour developed by van der Walt et al. (2014) [68]. It uses the marching squares algorithm with linear interpolation to find an iso-valued contour in a 2D array for a given level value. The Otsu threshold was used as the level value to find the iso-valued contour in the MNDWI images. Contour extraction methods aim at finding the boundary between two classes on a two-dimensional surface. When extracting a subpixel contour from a continuous water index image, it is assumed that medium resolution pixels along the land-water boundary represent mixed pixels and that the pixel value directly represents its proportion of land and water [33]. The find_contour method linearly interpolates between the water index values of neighboring pixels to draw the precise location of the waterline according to the given threshold [34]. An example of the sub-pixel contour, compared to a whole-pixel contour approach, is shown in Figure 4.
Short coastline fragments with a length of 3 km or less were removed from the coastline dataset to reduce noise and processing effort. The minimum length of 3 km was chosen for two reasons: (i) it had to be large enough to exclude small land and water features such as ships or aquaculture ponds that have a circumference of 2 km on average [69] and (ii) it allowed for detection of features small enough to preserve interrupted coastlines, sand banks, and other features that might be of interest for understanding coastline change processes.
2.3.3. Shore-Normal Transect Generation
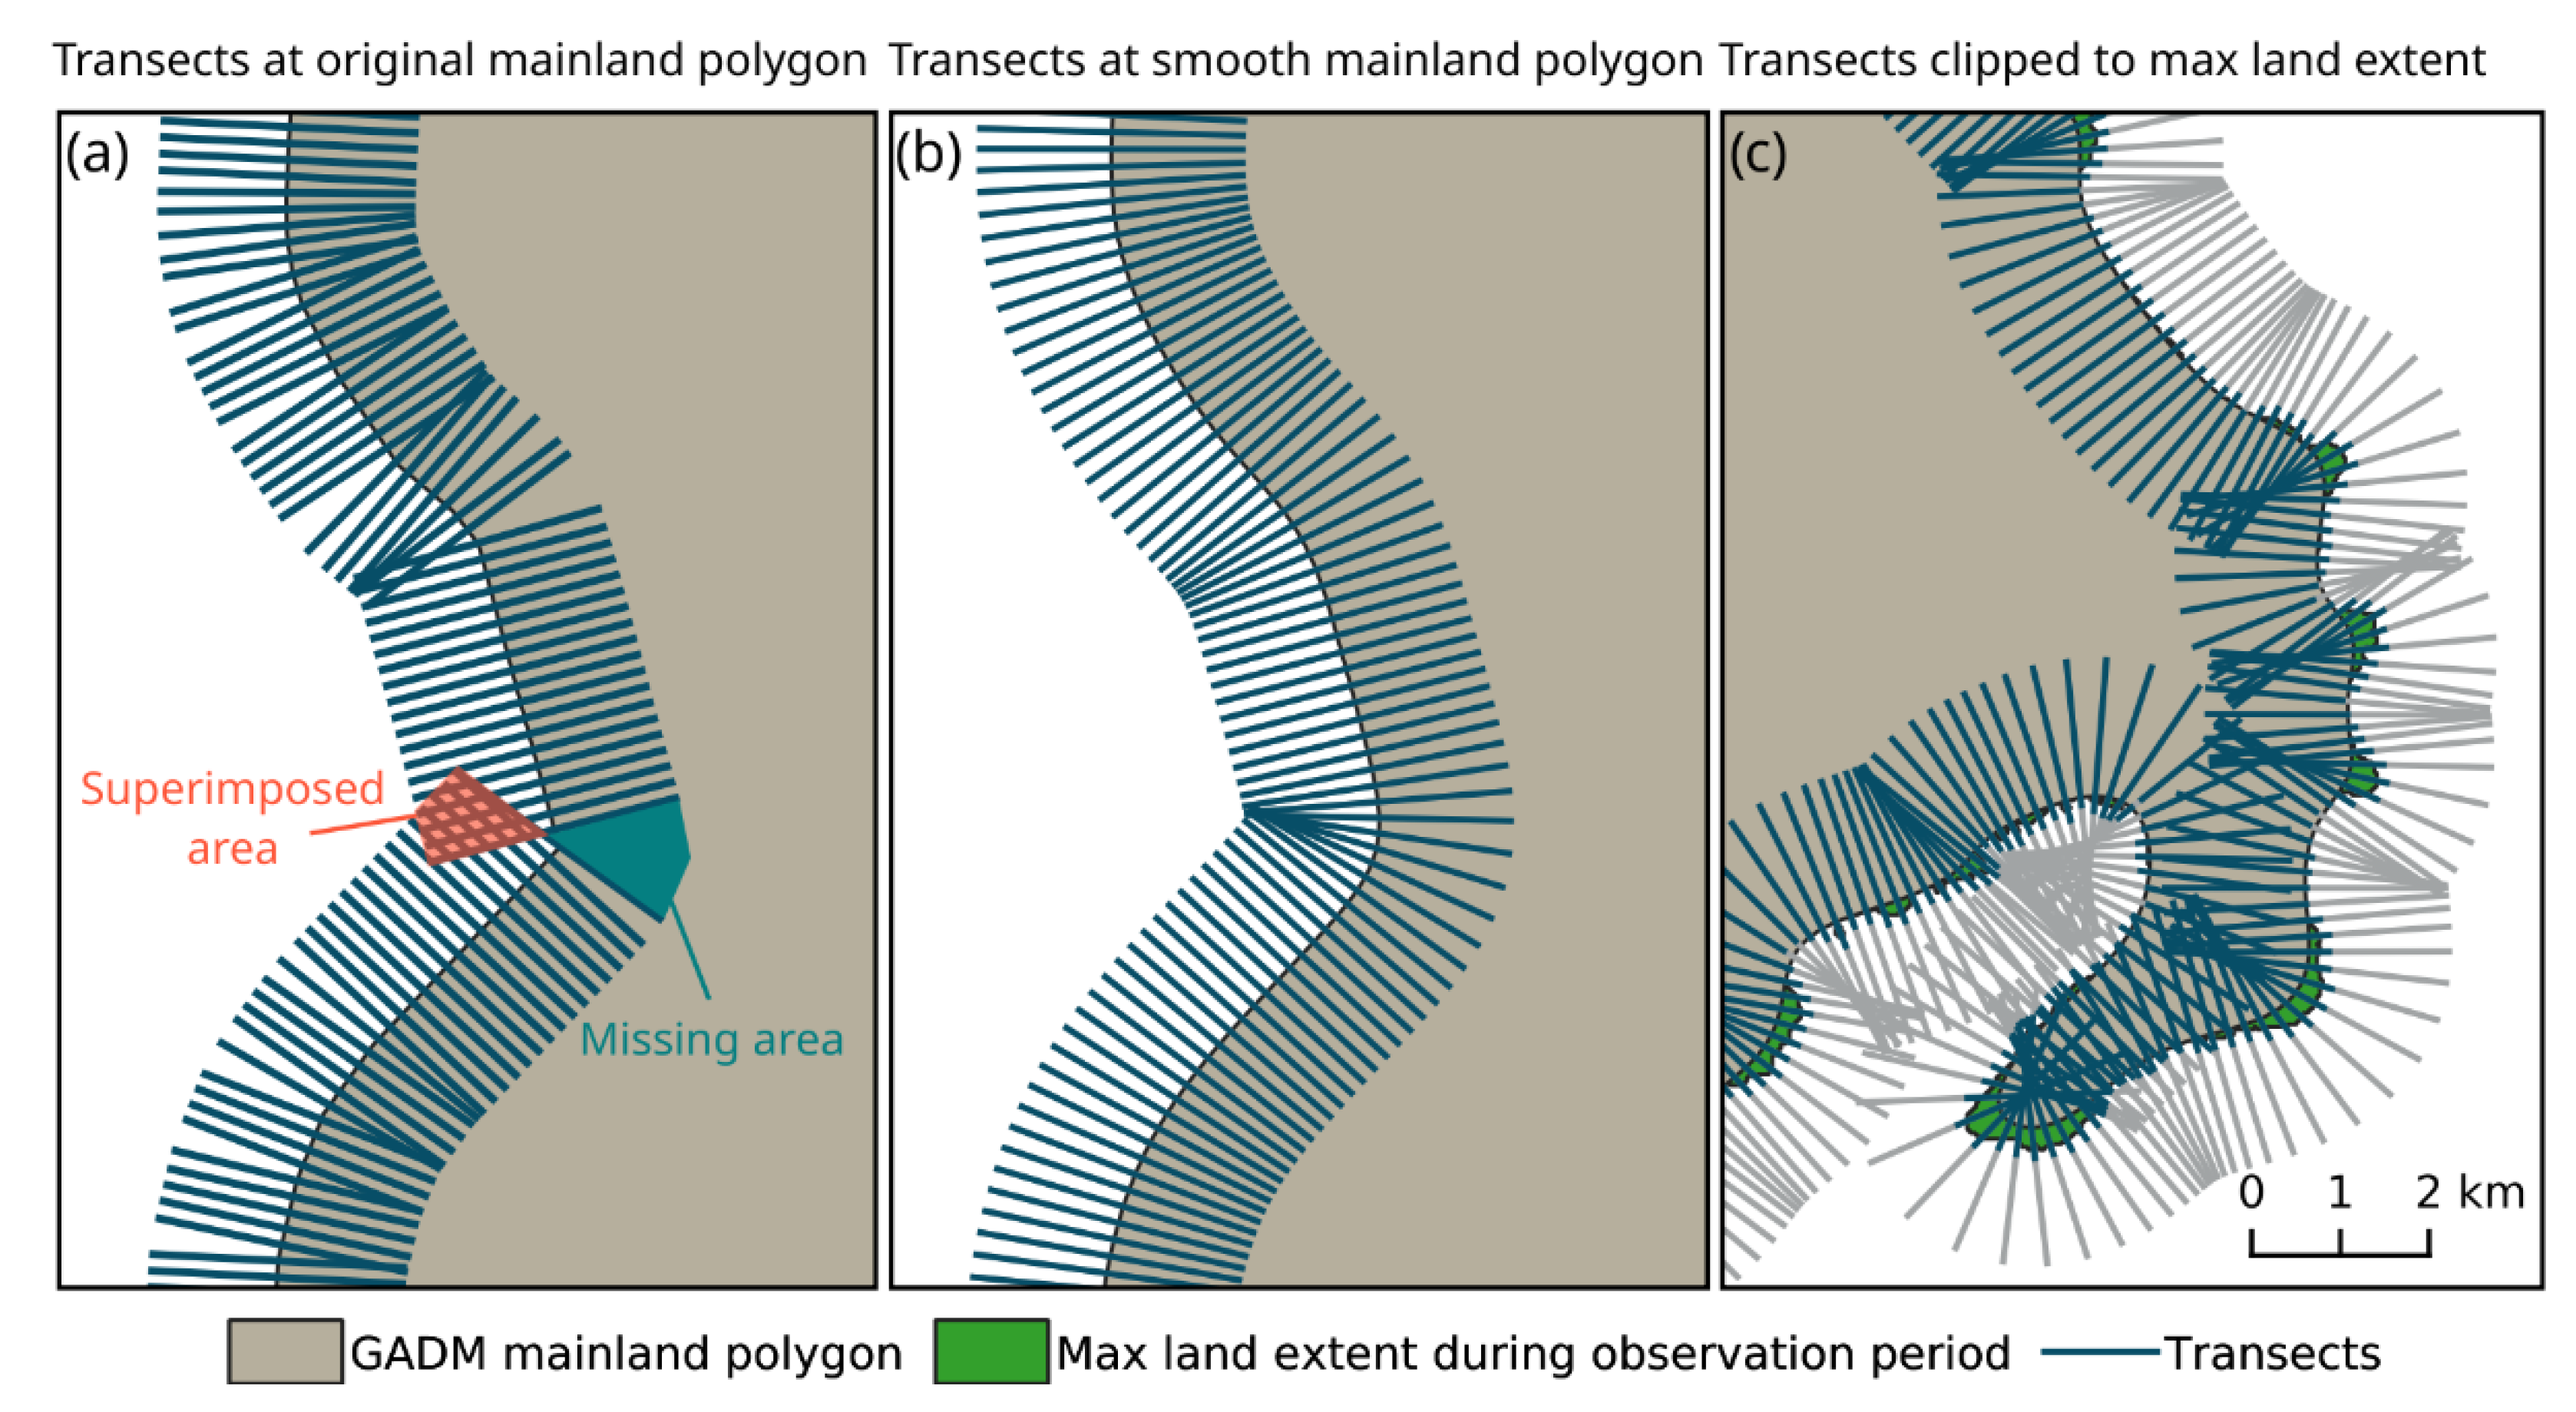
Transects were created perpendicular to the administrative boundaries of Vietnam, derived from the Global Administrative Areas (GADM) [70], with a spacing of 200 m. The mainland polygon was smoothed using a one-dimensional Gaussian filter on interpolated points along the polygon outline. The smoothing reduces data gaps and superimposed areas at hard edges as shown in Figure 5 [22]. The length of the transects was set to 3 km (1.5 km to both inland and seaward direction) to capture the maximum coastline change. This threshold was determined visually. Islands were excluded from the generation of transects to keep the focus on the coastal processes of the mainland. The transects were clipped to the maximum land extent within the observed time series. This step was carried out to reduce erroneous coastline quantification at headlands, lagoons, river mouths, or remaining coastal islands, where the transects would partly extend into the opposite shore. To create the maximum land extent raster images, all masked MNDWI images were binarized according to their Otsu threshold values and reduced to one raster with maximum pixel values. The resulting maximum land extent raster was cleaned by removing pixel clusters with an area below 50 km2 to avoid the interruption of transects at small inland water bodies. The cleaned raster was then vectorized and utilized for the clipping of transects (see Figure 5).
2.3.4. Coastline Change Quantification
For the quantification of coastline change along shore-perpendicular transects, only the most seaward intersection point per year was considered for each transect. Information on the distance to the inland transect origin was added to each intersection point. The earliest coastline position was chosen as a baseline to measure the amount of shift [71]. If a transect contained less than five intersection points, it was removed from the analysis. Prior to the quantification of coastline change, outliers on each transect were eliminated to enhance the robustness of the coastline change calculation. Outliers were identified as intersection points deviating more than three times the standard deviation from the median coastline position [72]. The commonly used change metrics Shoreline Change Envelope (SCE) and Linear Regression Rate (LRR) were calculated for each transect [73,74]. The SCE describes the maximum distance between all coastlines at a given transect and is therefore expressed in metric units without sign [73]. The SCE was used to define the length of the resulting coastline change classification transect. The coastline change rate was calculated by applying linear regressions to all intersection points at the transect. The slope of the linear regression represents the rate of change in meters per year, while the standard error characterizes the average distance of the observed values to the regression line [72]. All transects were then classified on two levels: (1) All transects with a LRR between −0.5 m/year and +0.5 m/year are classified as ‘No Change’, while all transects with a change rate below −0.5 m/year are classified as ‘Erosion’ and transects with changes larger than +0.5 m/year as ‘Accretion’. (2) The classification on Level 2 differentiates degrees of erosion and accretion and was adopted from the chronic beach erosion classification scheme by Estevesf et al. (1998) [75]. The scheme was extended with a class for extreme erosion as proposed by Luijendijk et al. (2018) [29]. The accretion class was additionally subdivided equivalent to the erosion class, resulting in the scheme shown in Table 2.
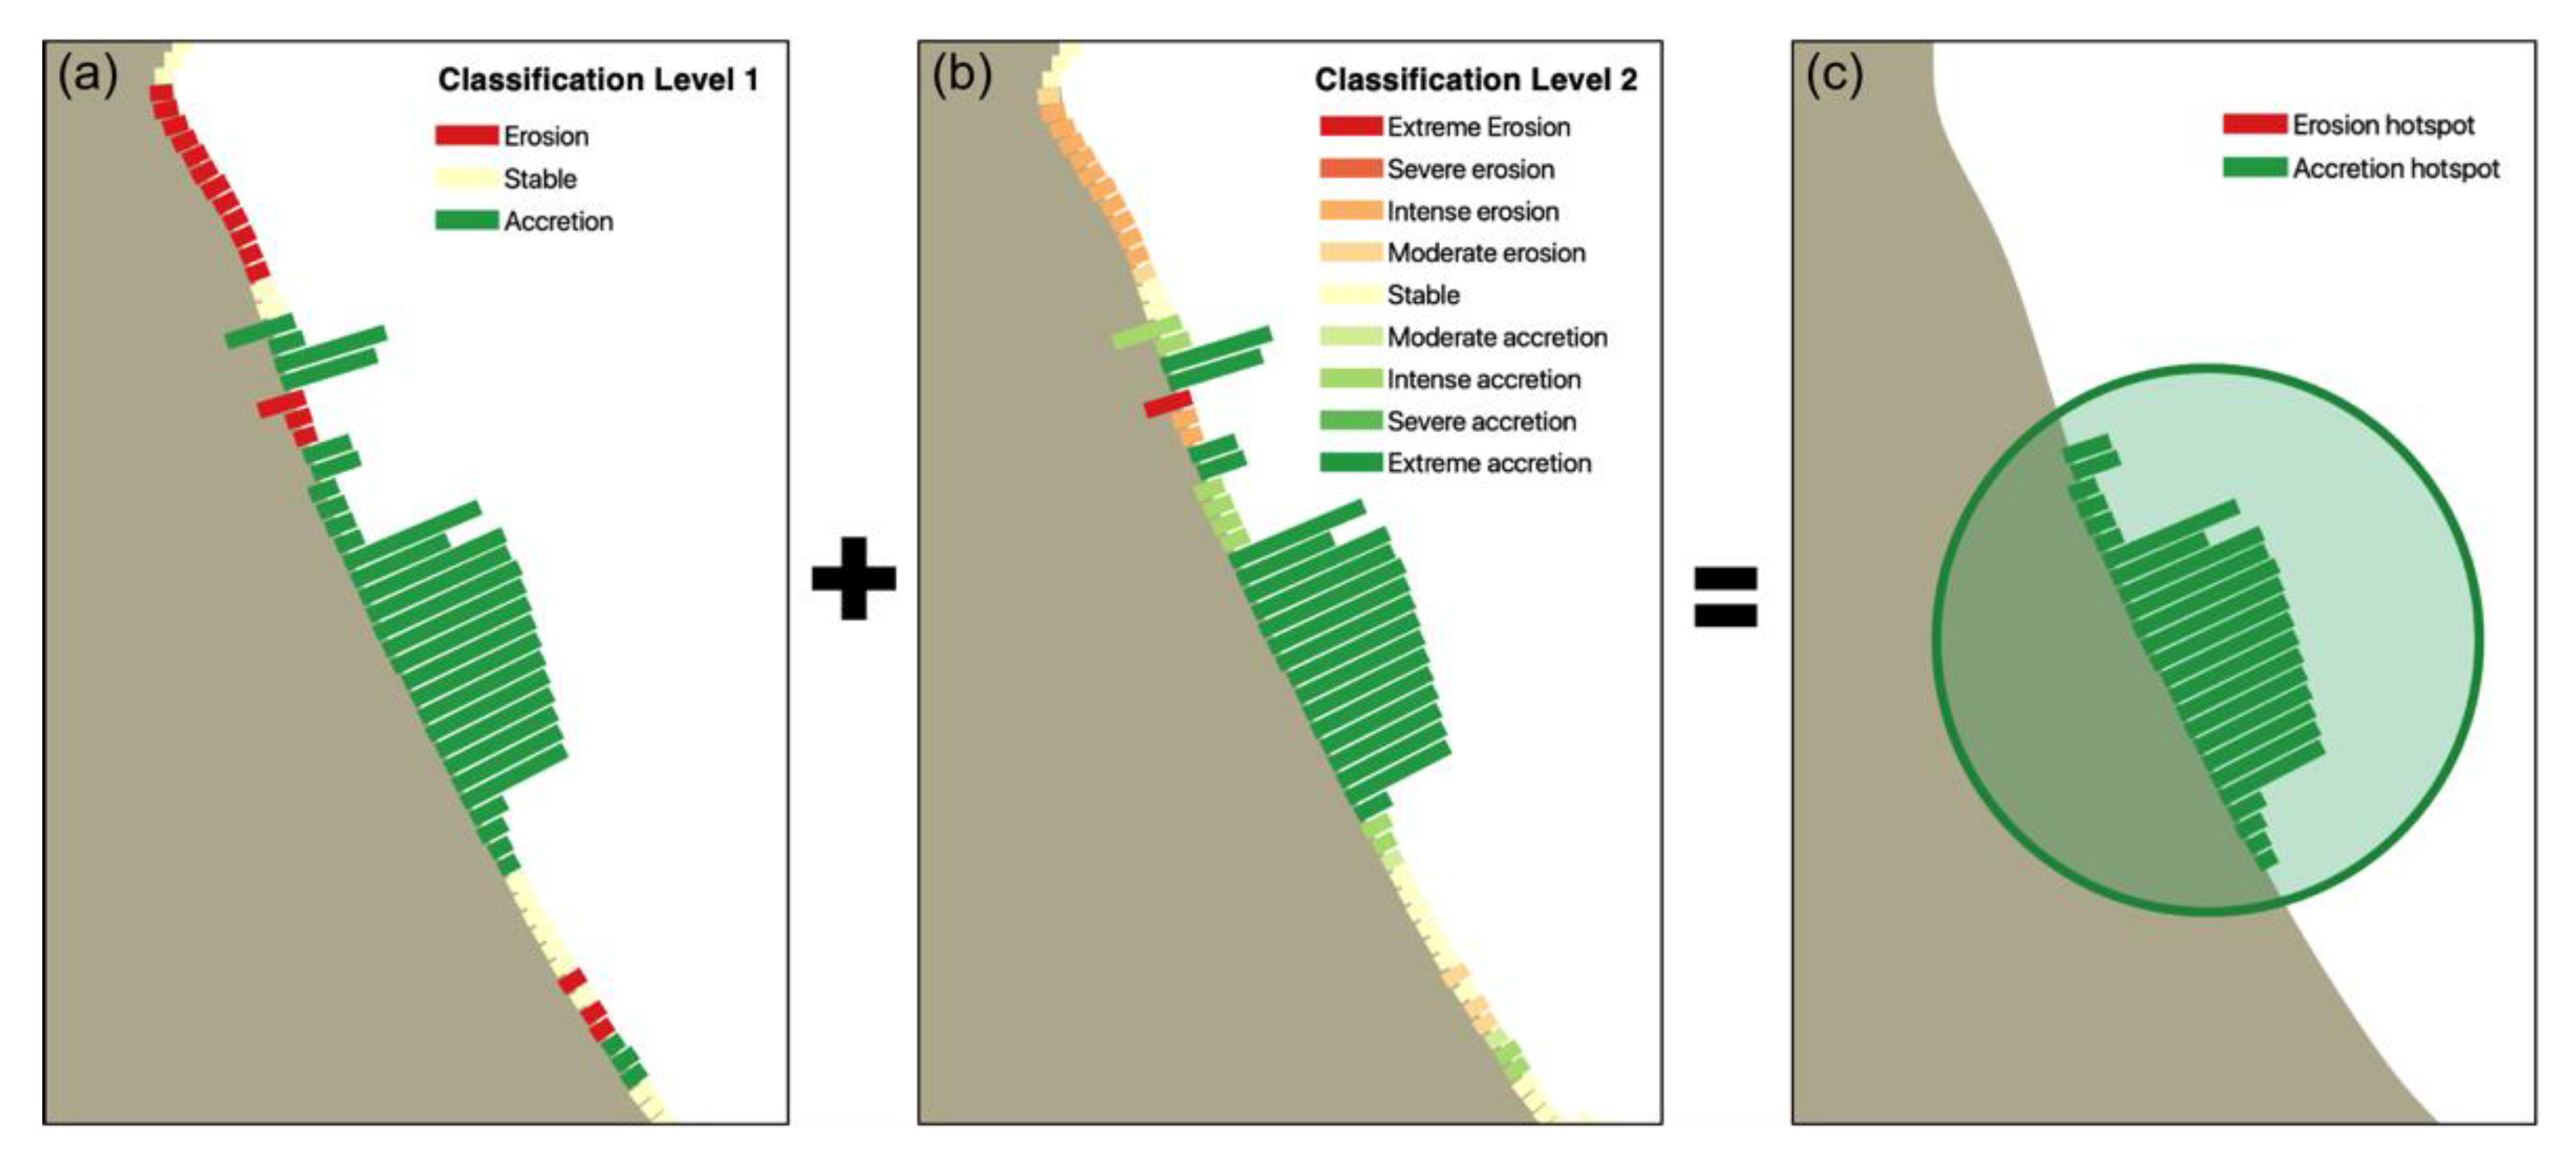
Based on the coastline change quantification, erosion and accretion hotspot analyses were performed (Figure 6). A clustering approach was chosen, where all adjacent transects of the same class (Level 1) with a tolerance of one transect were combined into one cluster. If the cluster contained more than 20 transects (4 km length) and was either associated with ‘Erosion’ or ‘Accretion’, it was defined as a hotspot. To find the most distinct hotspots within this dataset, only hotspots showing extreme erosion or accretion rates (>+5/<−5) on average were filtered.
2.3.5. Validation
To validate the coastline detection results, a VHR cloud-free RapidEye mosaic (see Section 2.2.2) from the 7th of February 2017 was utilized, for which a cloud-free Landsat scene exists with the same date and approximate acquisition time (see Table 1). The Landsat scene was cropped to the extent of the Rapid Eye mosaic. Both images were co-registered using an automatic global subpixel approach [76]. The reference shoreline was digitized manually on the RapidEye RGB mosaic. A subpixel shoreline was extracted from the cropped Landsat image using the methodology described in Section 2.3.2. The displacement between both shorelines was calculated along shore-normal transects.
The effect of tides on the 75th percentile MNDWI images was exemplarily assessed by extracting the sea levels in Qui Nhon (see Section 2.2.3) at each Landsat acquisition time. The resulting sea level time series was used to validate the mean-high water level captured by Landsat throughout the year.
3. Results
3.1. Coastline Detection
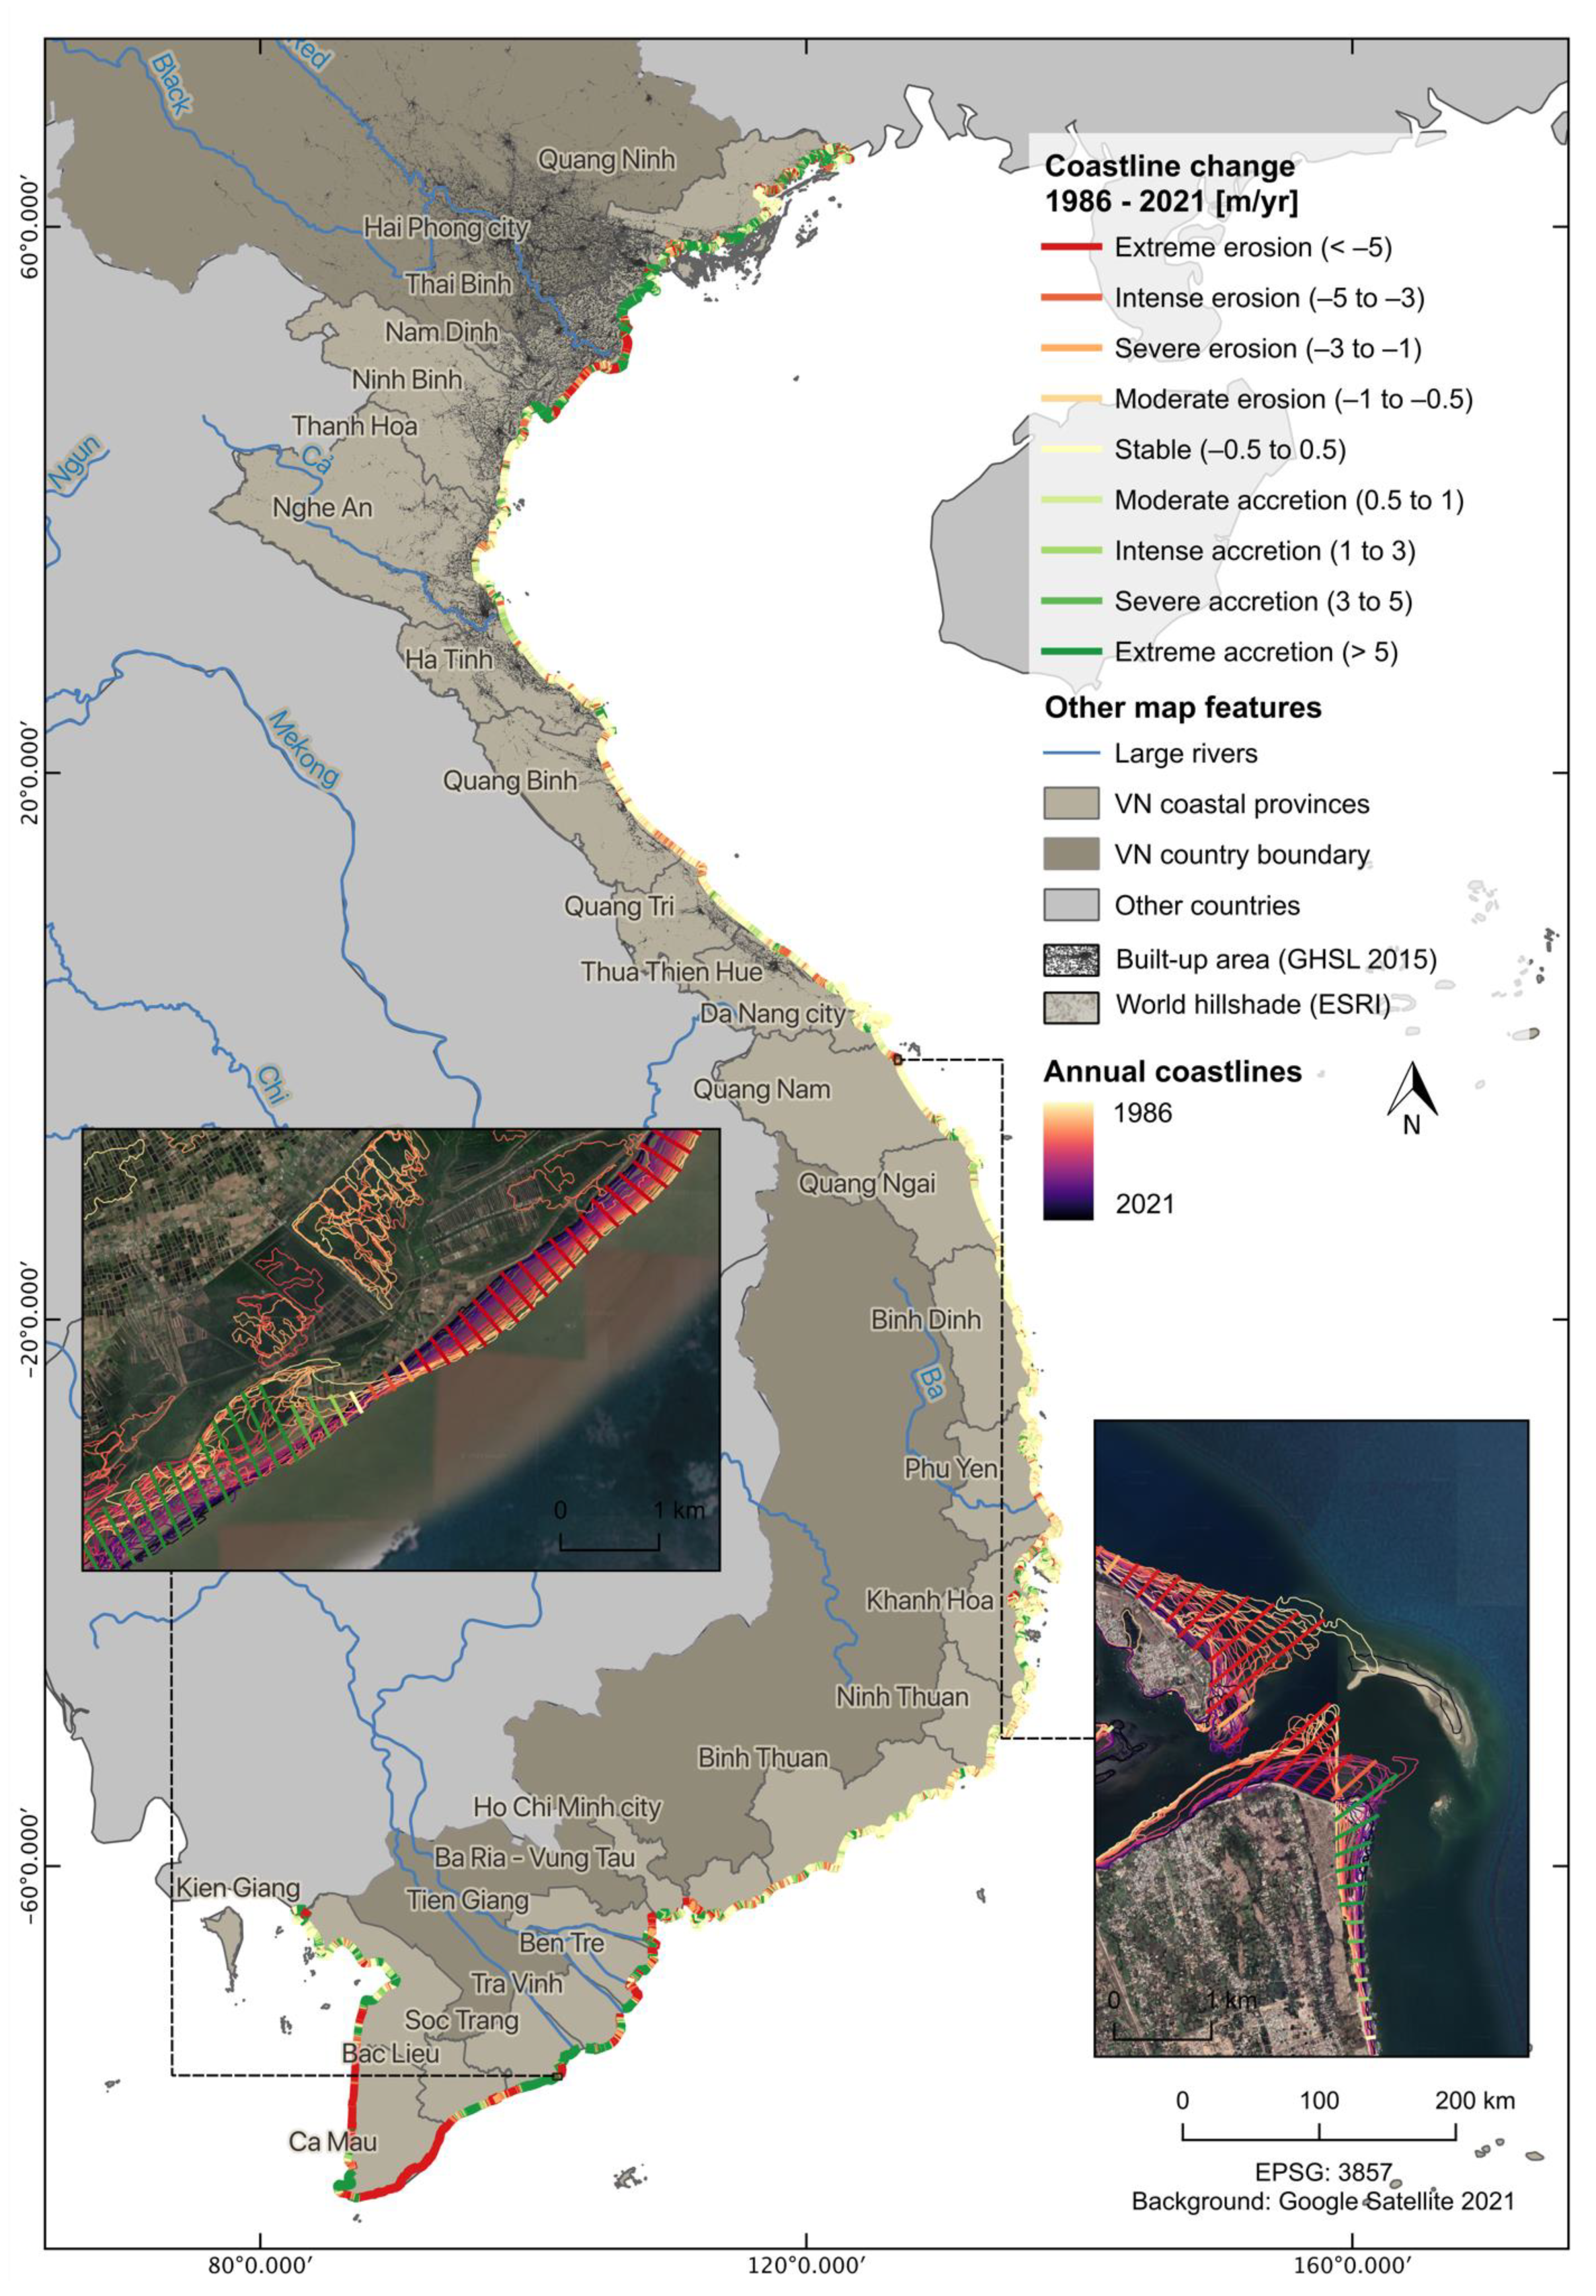
An overview of the coastline change classification on Level 2 (see Section 2.3.4.) is given in Figure 7. It shows the distribution of classification transects ranging from extreme erosion with change rates of less than −5 m/year (in red) to extreme accretion representing prograding coastlines with change rates over +5 m/year (in green). A quantitative analysis of countrywide coastline change is provided in Table 3, showing that 45.2% of the Vietnamese coast experienced no significant change (i.e., −0.5 m/year and +0.5 m/year) over the period from 1986 to 2021, while 27.7% of the coast was affected by erosion, and 27.1% by accretion. Within the erosion class, 39.2% of the coast experienced extreme erosion. The coastal accretion class shows a similar pattern, with 45.5% of the coasts being exposed to extreme accretion. Overall, the coastline dynamics of Vietnam show a threefold picture of unchanged conditions, extreme erosion, and extreme accretion.
3.2. Spatio-Temporal Patterns of Coastline Change in Vietnam
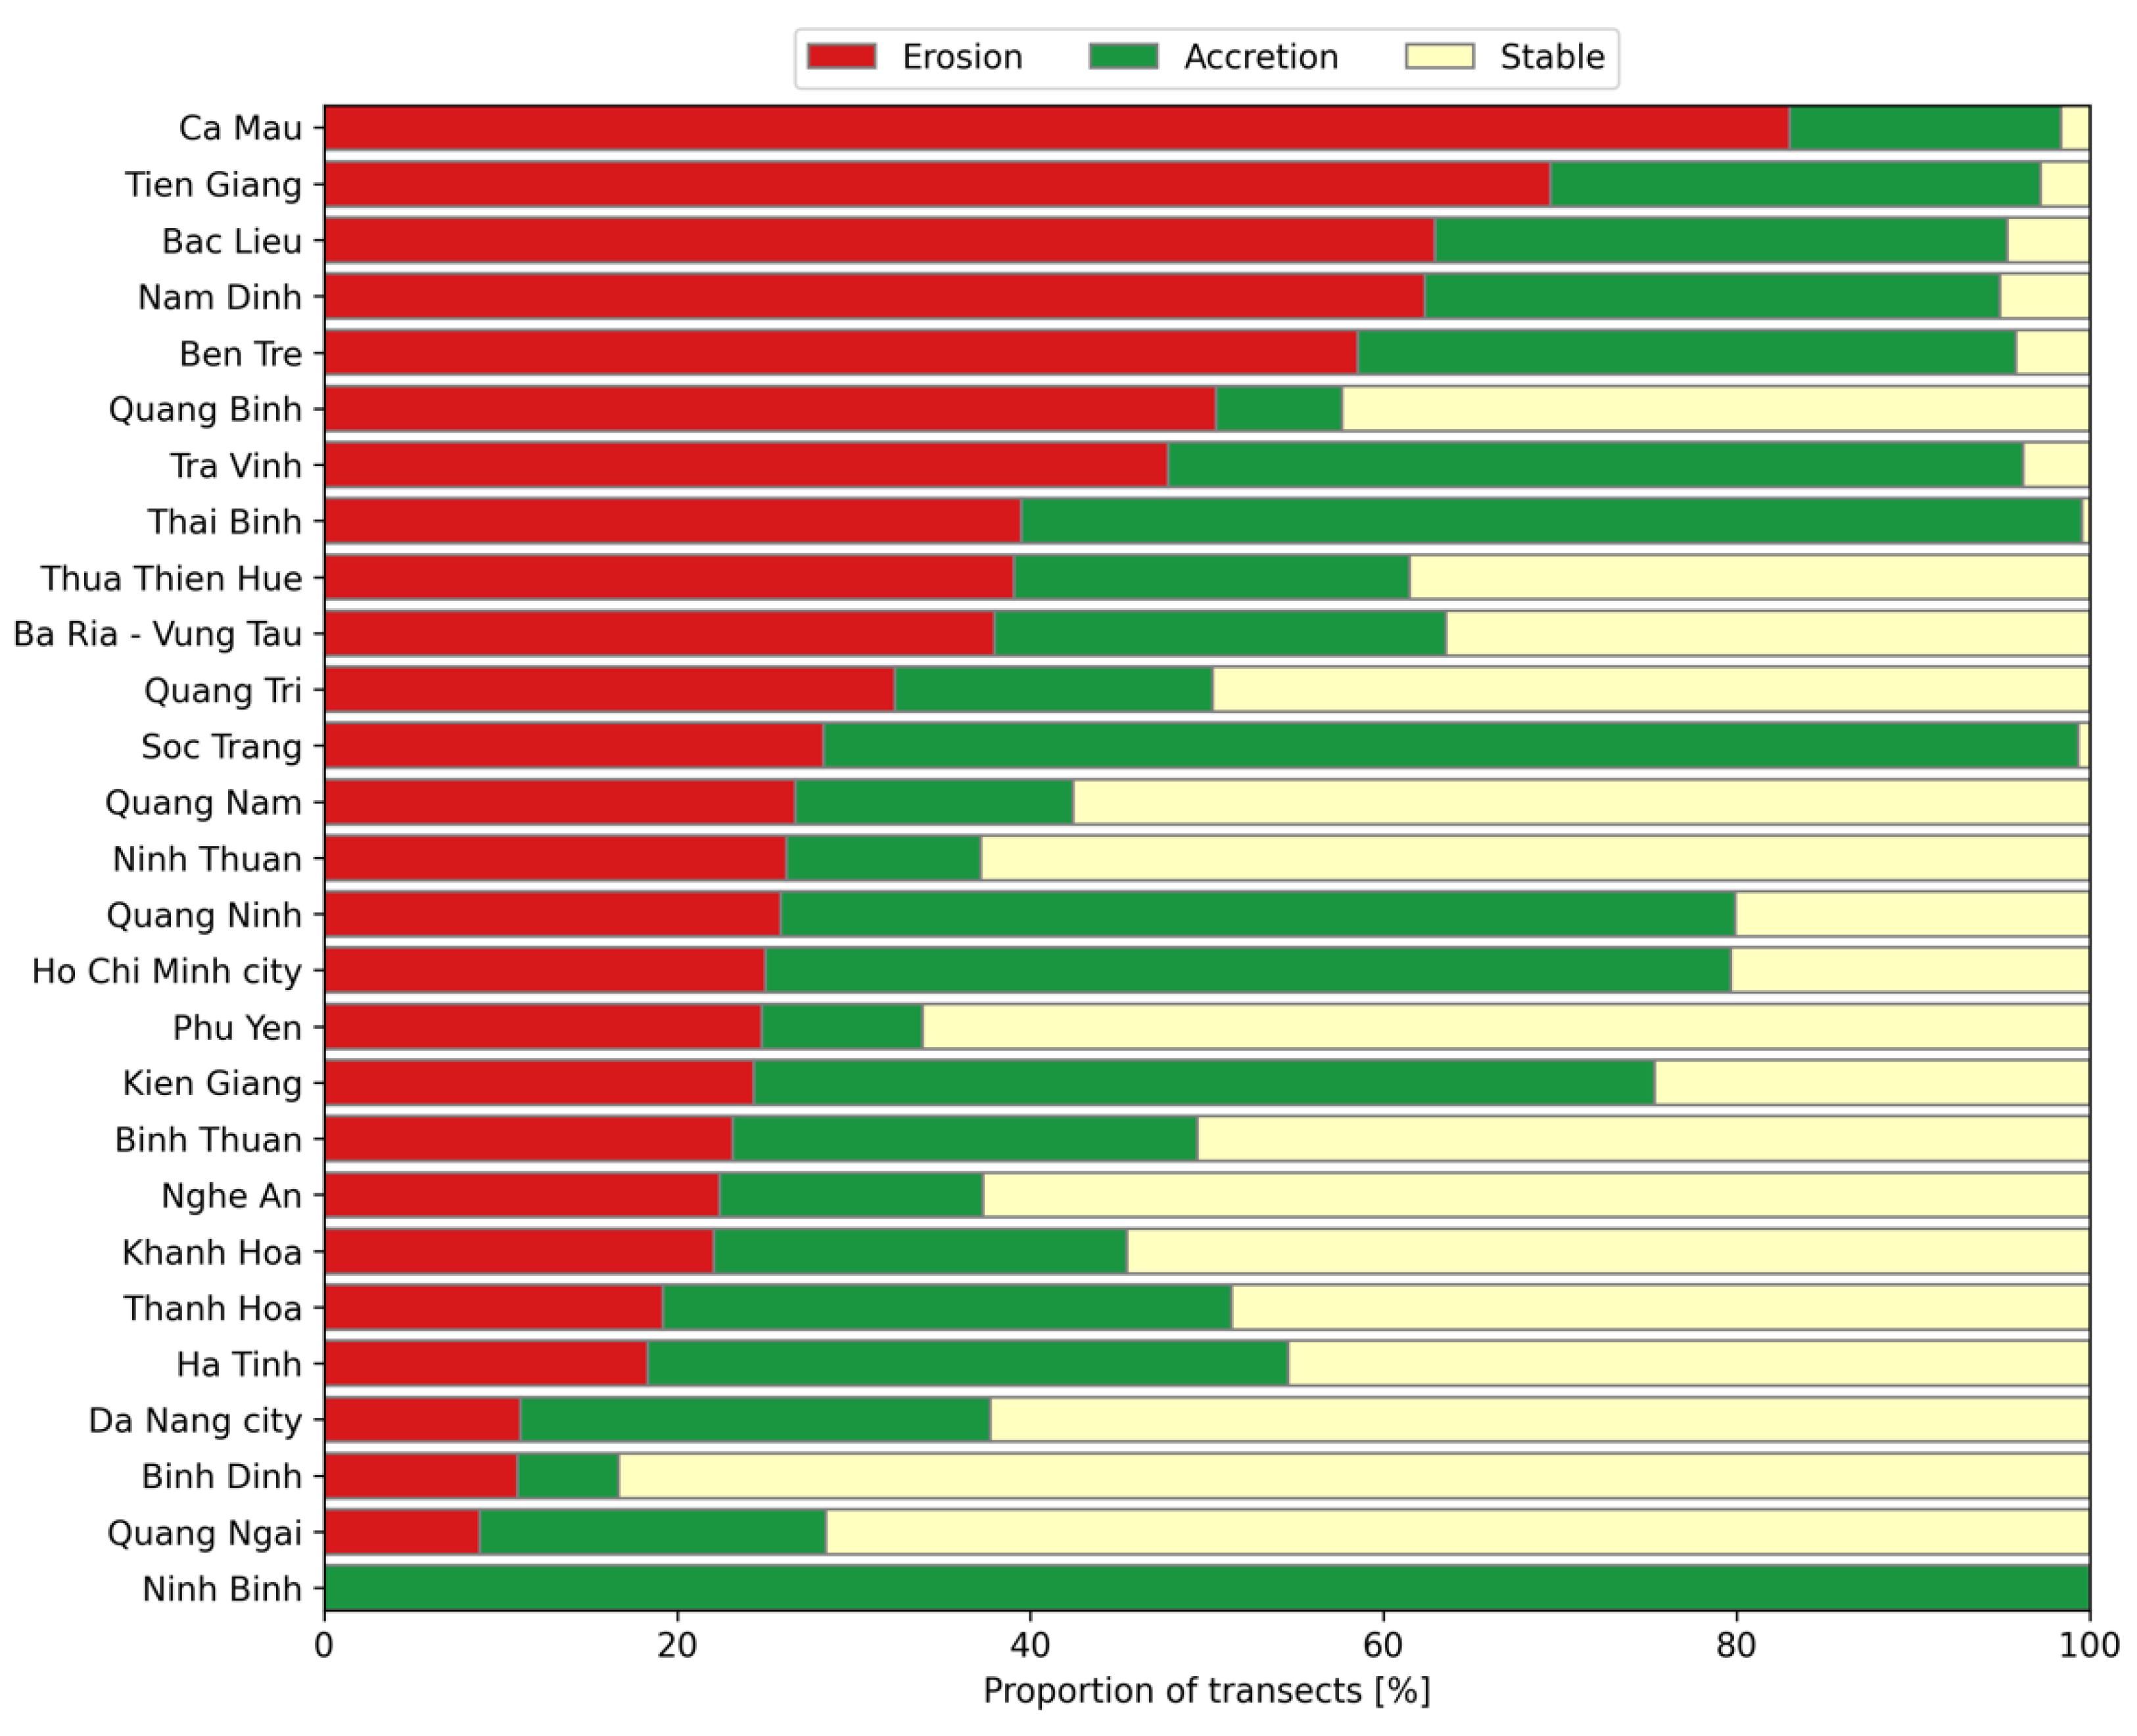
To provide an administrative spatial differentiation of coastline dynamics in Vietnam, Figure 8 shows the coastline change class proportions for each coastal province sorted by the erosion percentage. It is evident that Ca Mau in Southern Vietnam is the province most affected by erosion, with over 80% of its coastlines having retreated since 1986. Ca Mau is closely followed by Tien Giang with 70% and Bac Lieu with about 60% eroding coasts. Nam Dinh also shows more than 60% erosion, but is unlike the other provinces located in the north of Vietnam. Ninh Binh, also located in the north of the country, exclusively experienced accretion, followed by Hai Phong City (80% accretion) in the north and Soc Trang (70% accretion) in the south. The three provinces Binh Dinh (80% stable), Quang Ngai (70% stable), and Phu Yen (66% stable) with highest proportions of stable coastlines are located in central Vietnam.
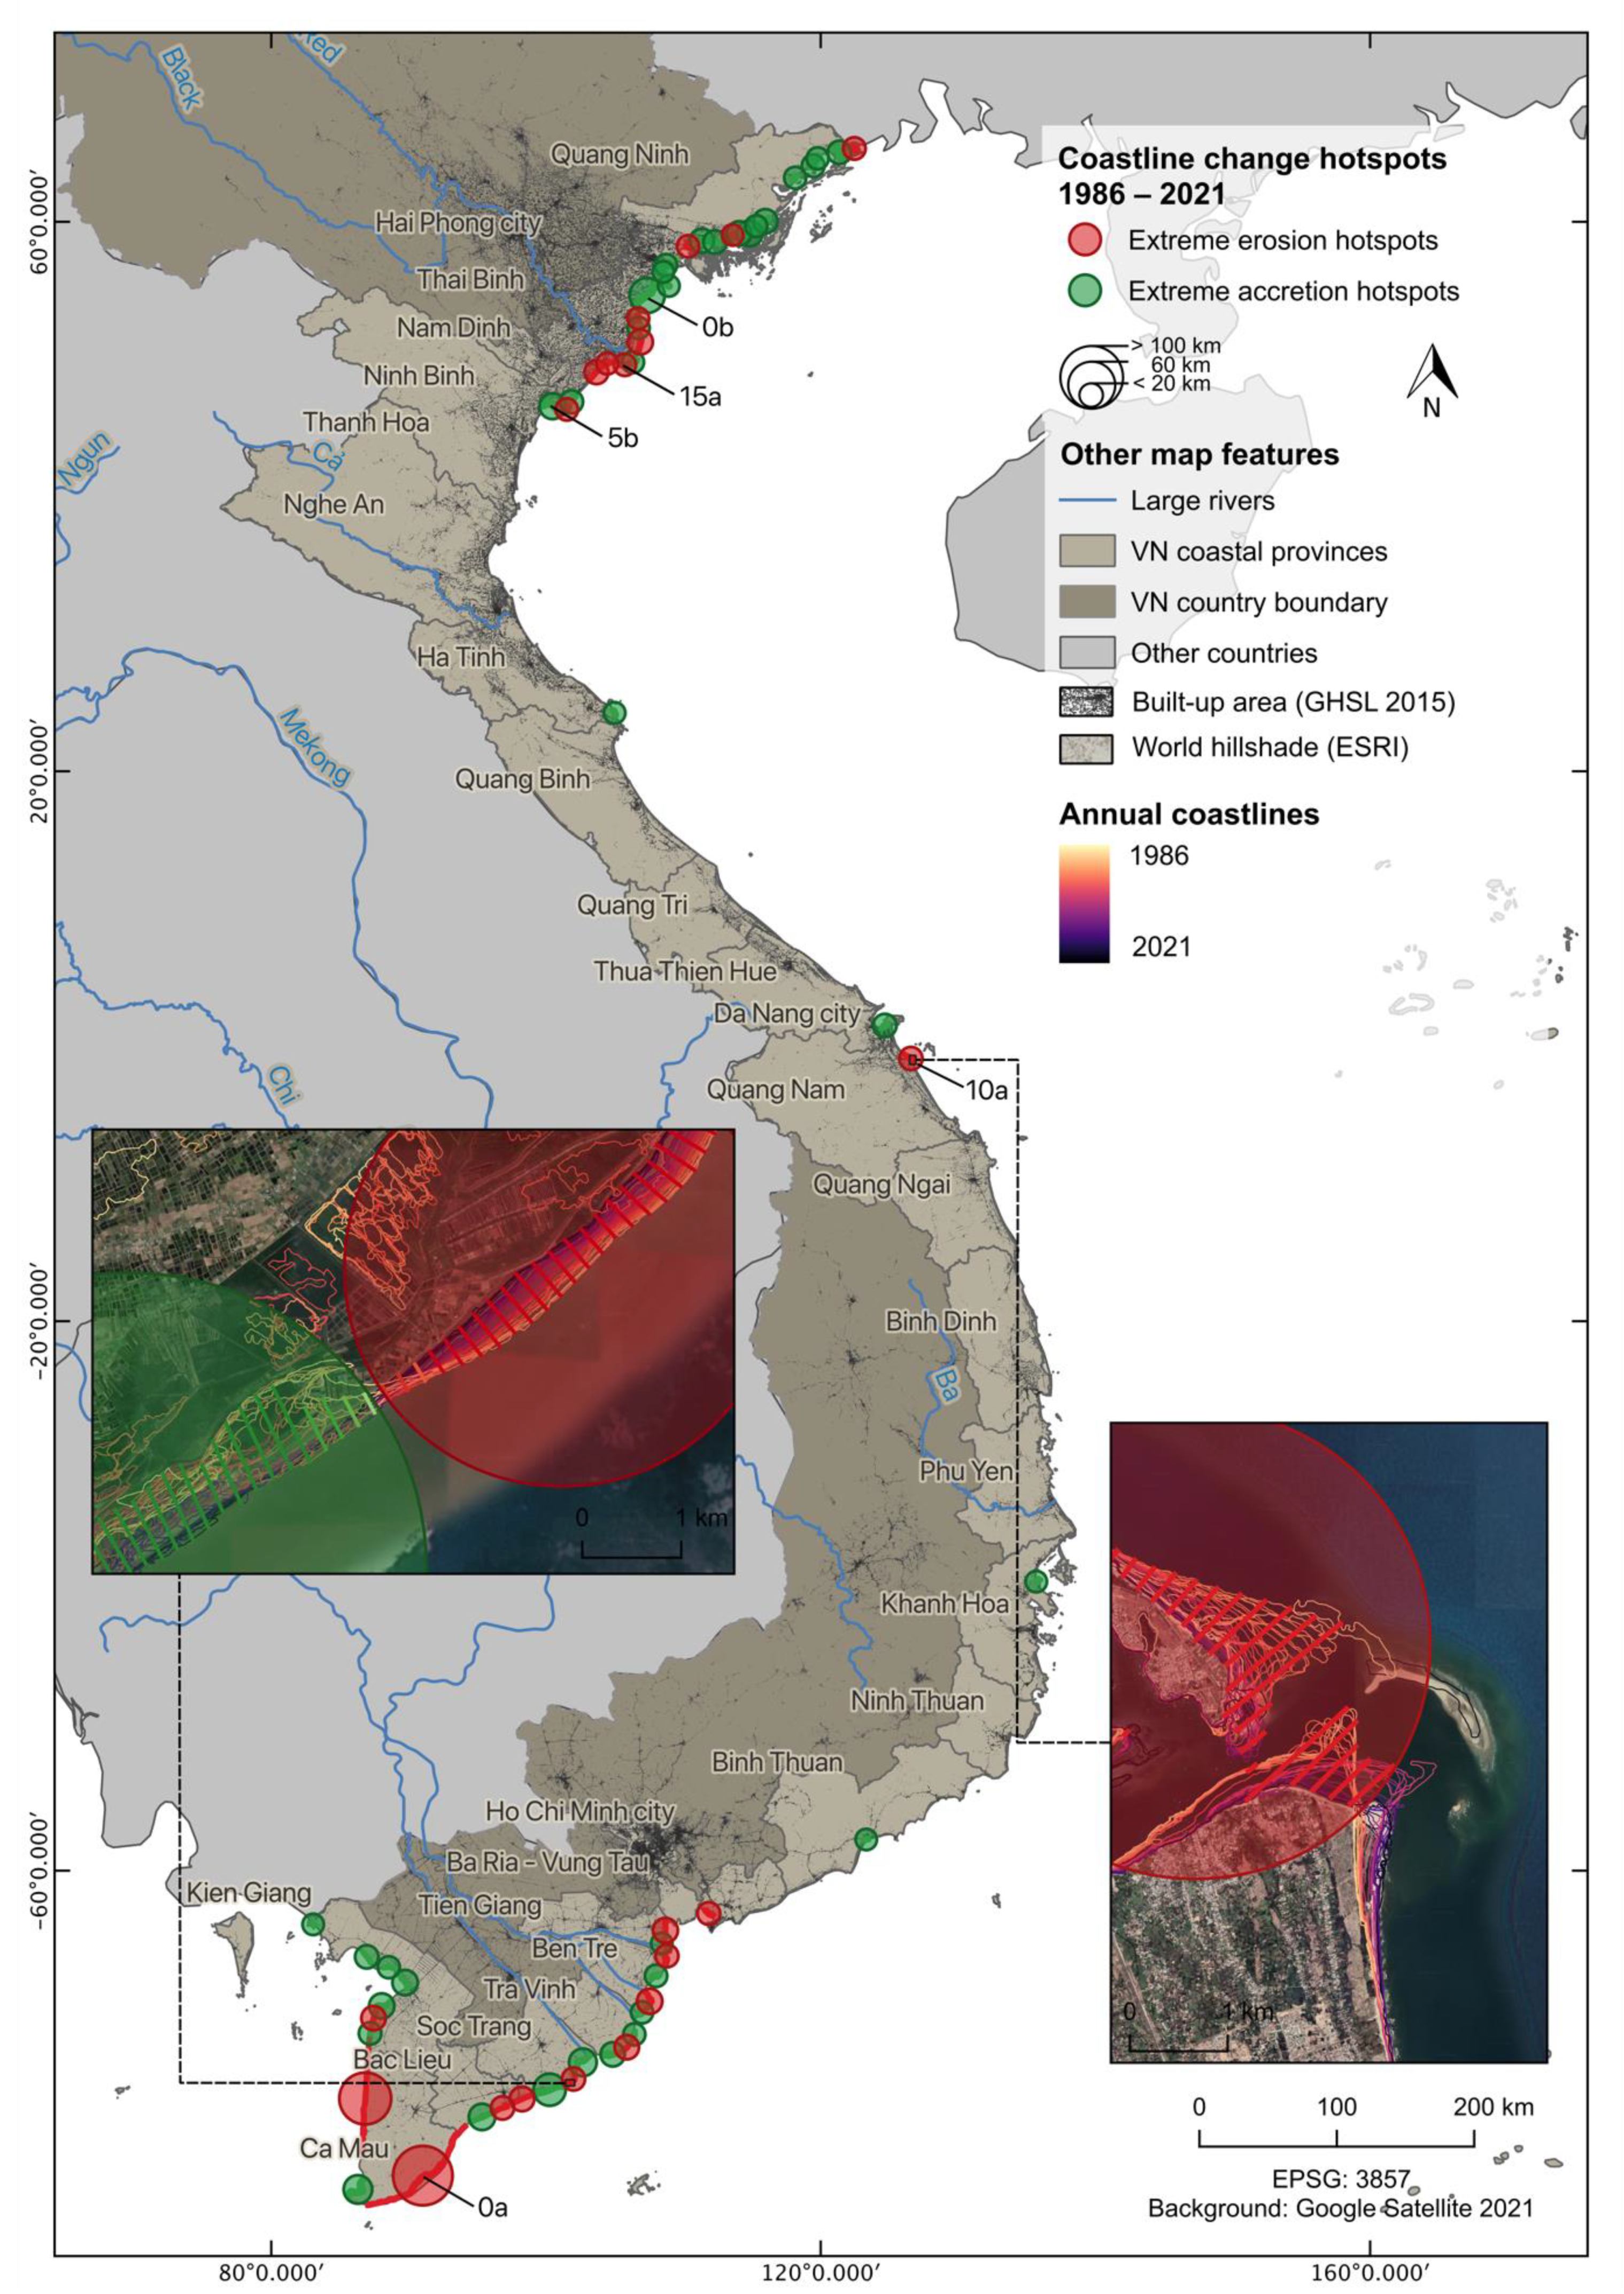
The coastline change hotspot analysis is shown in Figure 9. The accretion and erosion rates as well as the affected coastal segment length for each of the selected hotspots are shown in Table 4 and Table 5, respectively. The hotspot analysis shows small-scale extreme coastline dynamics in central Vietnam that have not been reflected in the provincial coastline change statistics. For example, erosion hotspot No. 10a is located close to the city Hoi An in Quang Nam province, which is considered a mostly stable province (see Figure 8). The erosion hotspot with the longest affected coastal segment of 102 km is located in the Mekong Delta, while the erosion hotspot with the highest erosion rate of −27.7 m/year is found in the Red River Delta. The longest accretion segment of 39 km is close to Hai Phong City. The accretion hotspot with highest accretion rates is located south of the Red River Delta and stretches across the provinces of Thanh Hoa and Ninh Binh. It shows an average accretion rate of +47.3 m/year. In summary, it can be deduced that the majority of accretion hotspots length- and intensity-wise are located in the urbanized Red River Delta, while the majority of erosion hotspots lie in the Mekong Delta.
3.3. Validation
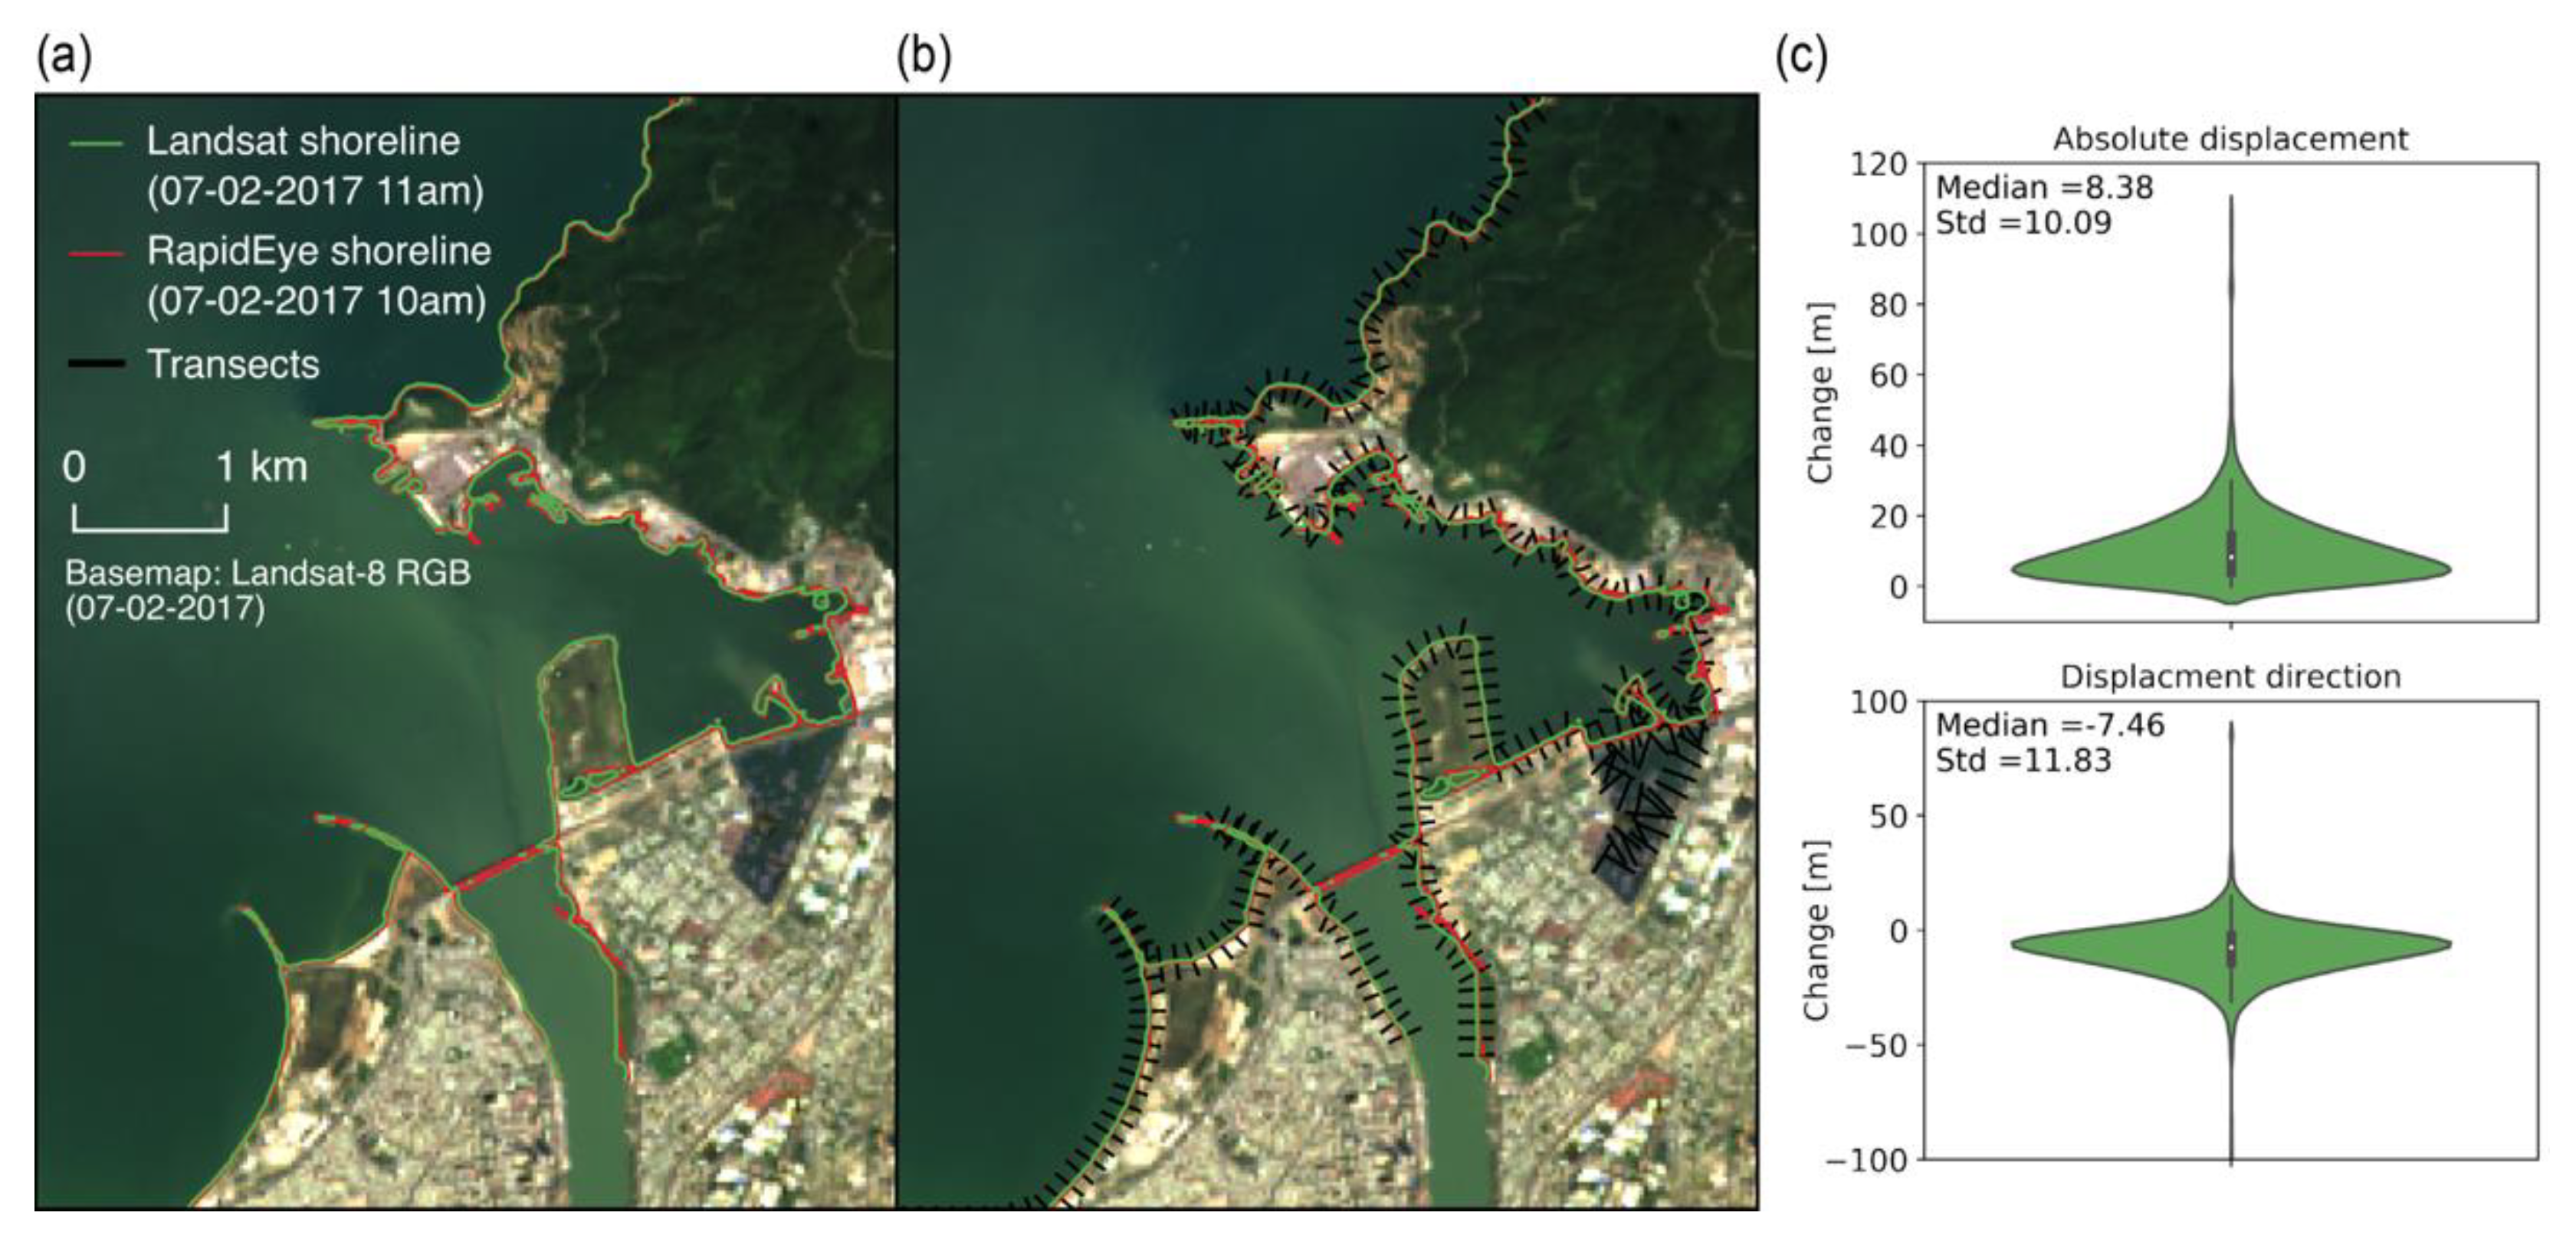
The displacement between the reference shoreline (Rapid Eye) and the extracted shoreline (Landsat 8) was calculated along 2167 shore-perpendicular transects. The total length of the reference shoreline amounts to 183 km. As shown in Figure 10, the median displacement between the RapidEye and the Landsat shorelines equals to 8.4 m with a standard deviation of 10.4 m. Taking the displacement direction into account, the median shoreline displacement yields −7.5 m, which implies that the Landsat shoreline tends to be detected slightly seawards of the reference shoreline.
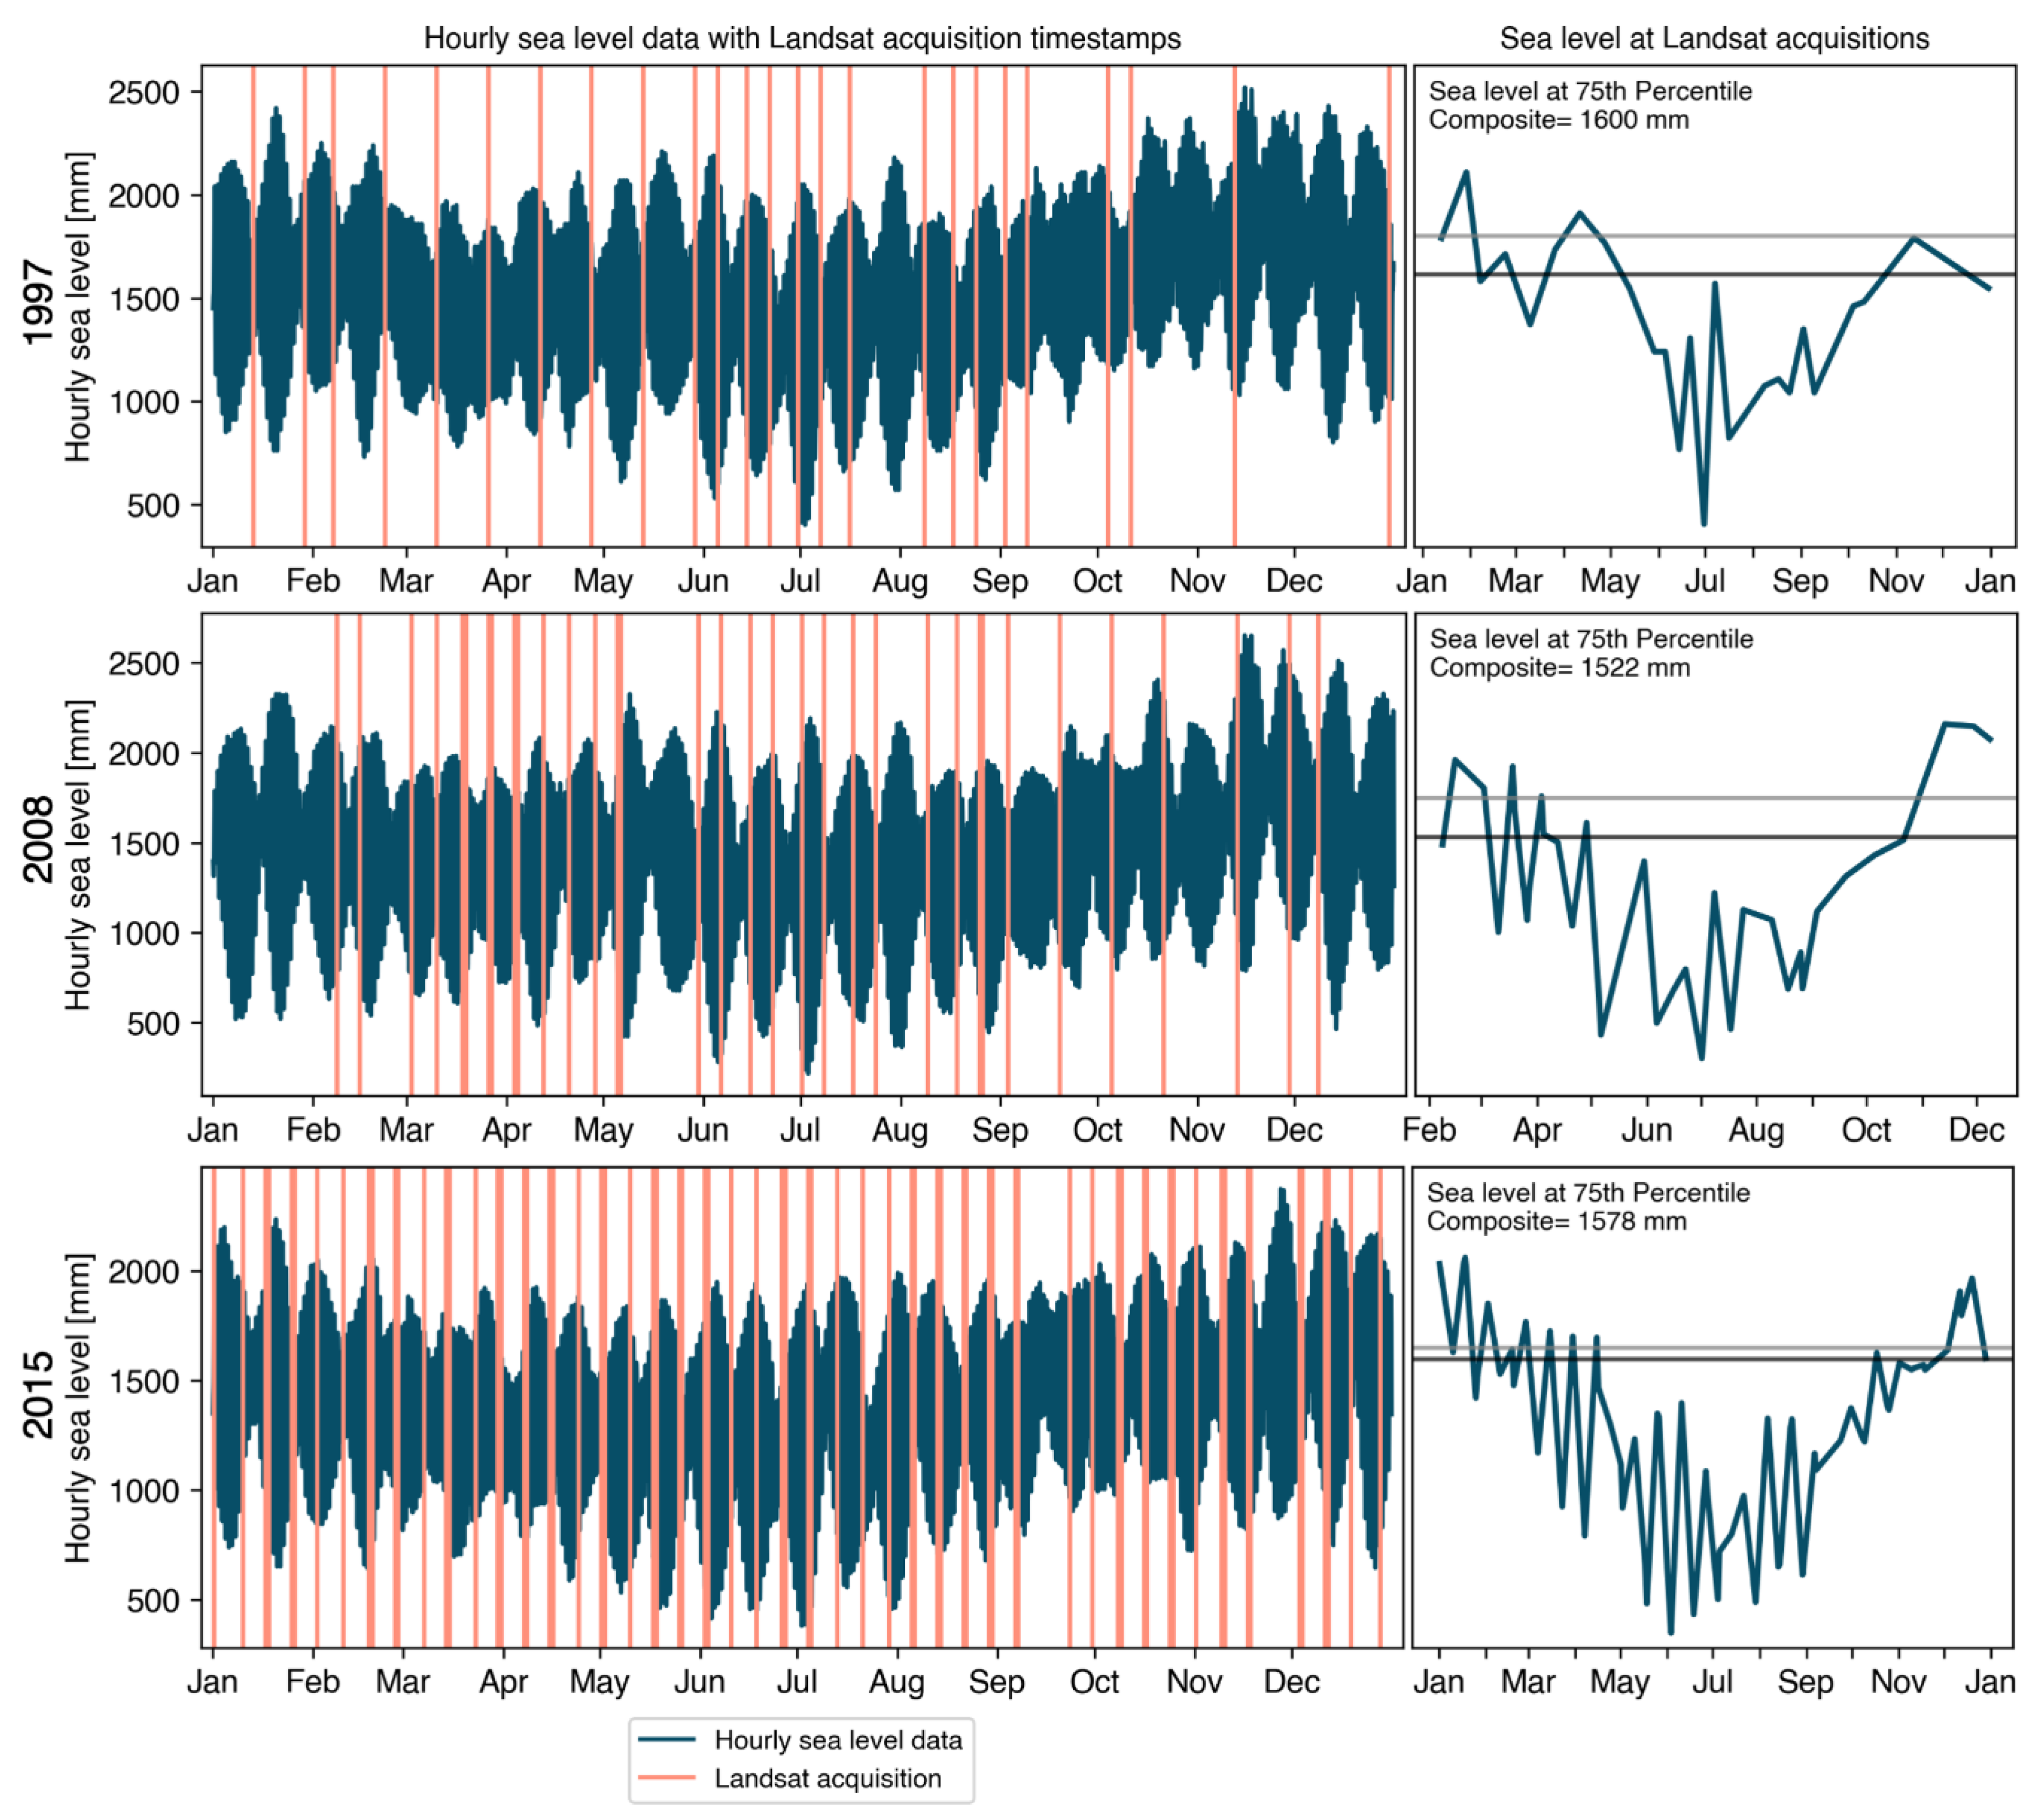
The 75th percentile MNDWI images have been created to capture the mean high-water level of each year. Figure 11 shows measured sea levels at Qui Nhon station in central Vietnam for three exemplary years. The number of acquisitions varies among the examples (1997: few, 2008: average, and 2015: maximum). Hourly sea levels are represented in blue in the left column of Figure 11, superimposed by the Landsat acquisition timestamps in orange. The right column shows the resulting sea levels only at Landsat acquisition time stamps. The black line represents the 75th percentile of the sea levels at Landsat acquisition, while the grey line shows the 75th percentile of all sea levels. It can be deduced that Landsat captures different sea levels over the course of the year, which generally allows for the representation of a mean high-water level by annual 75th percentile images. However, with less acquisitions, the Landsat percentile image tends to slightly underestimate the actual mean high-water level.
4. Discussion
4.1. Limitations of the Landsat-based Coastline Detection Method
Coastline detections are difficult to validate due to their highly dynamic nature and the spatial variability of their dynamics [8]. Therefore, a cloud-free scene of a very-high resolution sensor had to be selected for the same day and time at which a Landsat scene was available, to avoid the effect of local short-term coastline changes. The determined accuracy of 8.4 m lies in the sub-pixel range of Landsat sensors. The validation area, however, only covers an area in central Vietnam that consists of urban areas, rocky coasts, sandy beaches, estuaries, and vegetated coast and shows a low tidal range [77]. Thus, while the validation area contains some heterogeneity in coastal types, it does not provide an indication of accuracy in mangrove areas, marshlands, or tidal flats of southern and northern Vietnam. Furthermore, the validation is limited to the coastline extraction method only. In this respect, it can be stated that although the validation method yielded a high sub-pixel accuracy, the value should be treated with caution. Neither the error sources of the annual composites nor those of more complex coastal types are reflected. Accordingly, further validation of the dataset would be recommended, particularly covering the delta regions in Vietnam and the temporal component. For this purpose, using additional VHR images as well as land-survey GPS and sea level data would be conceivable [29]. Potential causes for errors are discussed in the following paragraphs.
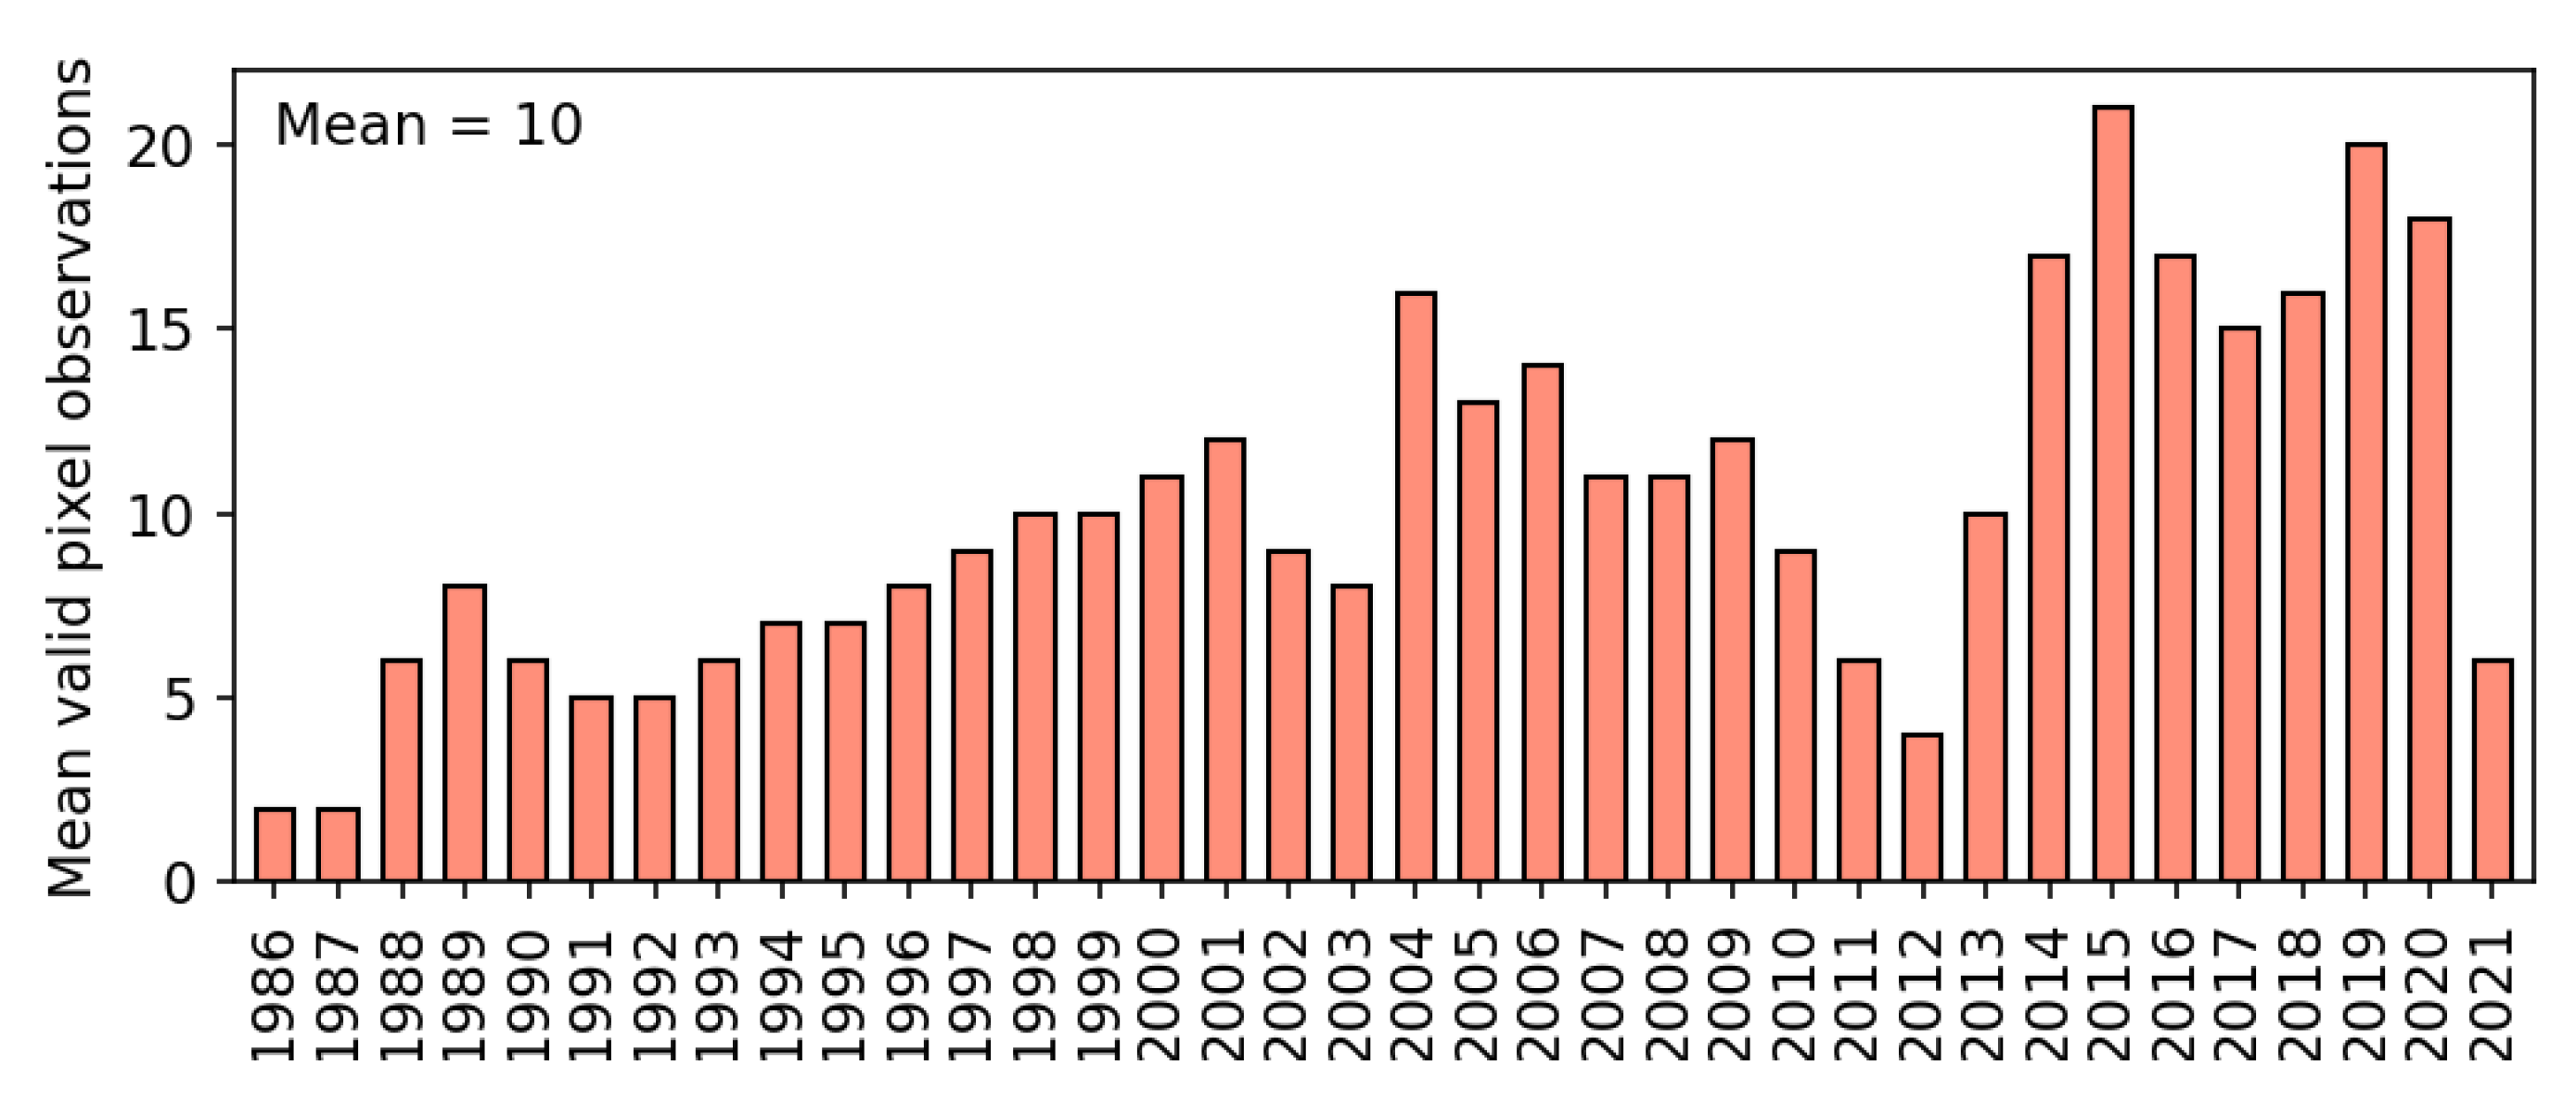
The availability of valid Landsat pixel observations is temporally and spatially variable (compare Figure 2), which may be related to sensor operation periods, acquisition paths, storage and distribution issues of the Landsat archive, and sensor failures (such as the Landsat 7 Scan Line Corrector (SLC) failure in 2003) [78]. Weather conditions play an additional critical role in the available number of valid pixel observations. Since each image was cloud-masked prior to compositing, occasional misclassification of bright targets, such as building tops, snow, ice, sand dunes, salt lakes, and beaches as clouds is possible [60]. Figure 12 shows the average number of valid pixel observations per year after cloud-masking, revealing an overall mean of 10 observations between 1986 and 2021. From these statistics, a temporal quality characteristic of the individual annual coastlines may be obtained: the coastline for 2012 is thus significantly less reliable than the coastline from 2015.
MNDWI composites with few valid observations per pixel were found to occasionally produce incomplete or false coastlines at cloud residuals or remaining tidal flats. Furthermore, it has been shown that the representability of the mean-high water level in annual MNDWI composites increases with the number of available acquisitions (compare Figure 11).
4.2. Limitations of the Coastline Change Quantification
The generation of transects along the simplified mainland polygon of Vietnam comes with several constraints when being utilized to quantify coastline change. Masked pixels within the MNDWI composites, for example, may interrupt the annual coastline at a transect position. When inland water bodies intersect the transect instead, while only the most seaward intersection point for each year is chosen to quantify coastline change, the coastline intersection point for that year would be selected falsely. This limitation was addressed by excluding outlier points that deviate by more than three standard deviations at each transect. Another issue occurs in very complex and highly dynamic coastal environments. Such intricate coastlines cannot be reasonably represented using generalized transects, because the transect orientation does not correspond to the complex shape of the coast. Furthermore, edge transects of estuaries or headlands are susceptible to false change rate calculations since the actual coast is occasionally omitted in favor of the river shore. The coastline quantification itself is based on linear regression slopes. Linear regressions are generally susceptible to outliers and thus tend to underestimate trends [73]. Furthermore, the standard error is proportionally larger for transects with low mean change rates than for transects with high mean change rates, leading to increased uncertainty in the trend for transects with low mean change rates.
However, since the change rate quantification as such is difficult to validate (as described in Section 4.1), we compared several local coastline change rates to previously published change rates in the corresponding locations. For example, Marchesiello et al. (2019) [13] published coastline change rates for the Mekong delta covering the time period 1990–2015 using a combination of in situ, remote sensing, and laboratory experiment data. The authors determined mean erosion rates between −10 and −30 m/year on the east coast of the Ca Mau head, which corresponds well to the herein identified erosion hotspot 0a, with an average erosion rate of −25 m/year. At the west coast of the Ca Mau head, Marchesiello et al. (2019) [13] found accretion rates of more than +30 m/year, reflected in erosion hotspot 2b, with an average mean change rate of +39 m/year. Nguyen (2017) [45] published change rates at Cua Dai beach in the province Quang Nam, which was also detected as an erosion hotspot in this analysis (10a). The authors report erosion rates of up to −35 m/year between 2001 and 2010, while the highest erosion rate identified at hotspot 10a in this analysis amounts to −29 m/year. Although these comparisons cannot substitute for extensive validation, they do show that the herein presented automated calculations of coastline change agree well with the magnitudes of locally determined rates of change.
4.3. Potential Drivers of Coastline Change at Selected Hotspots
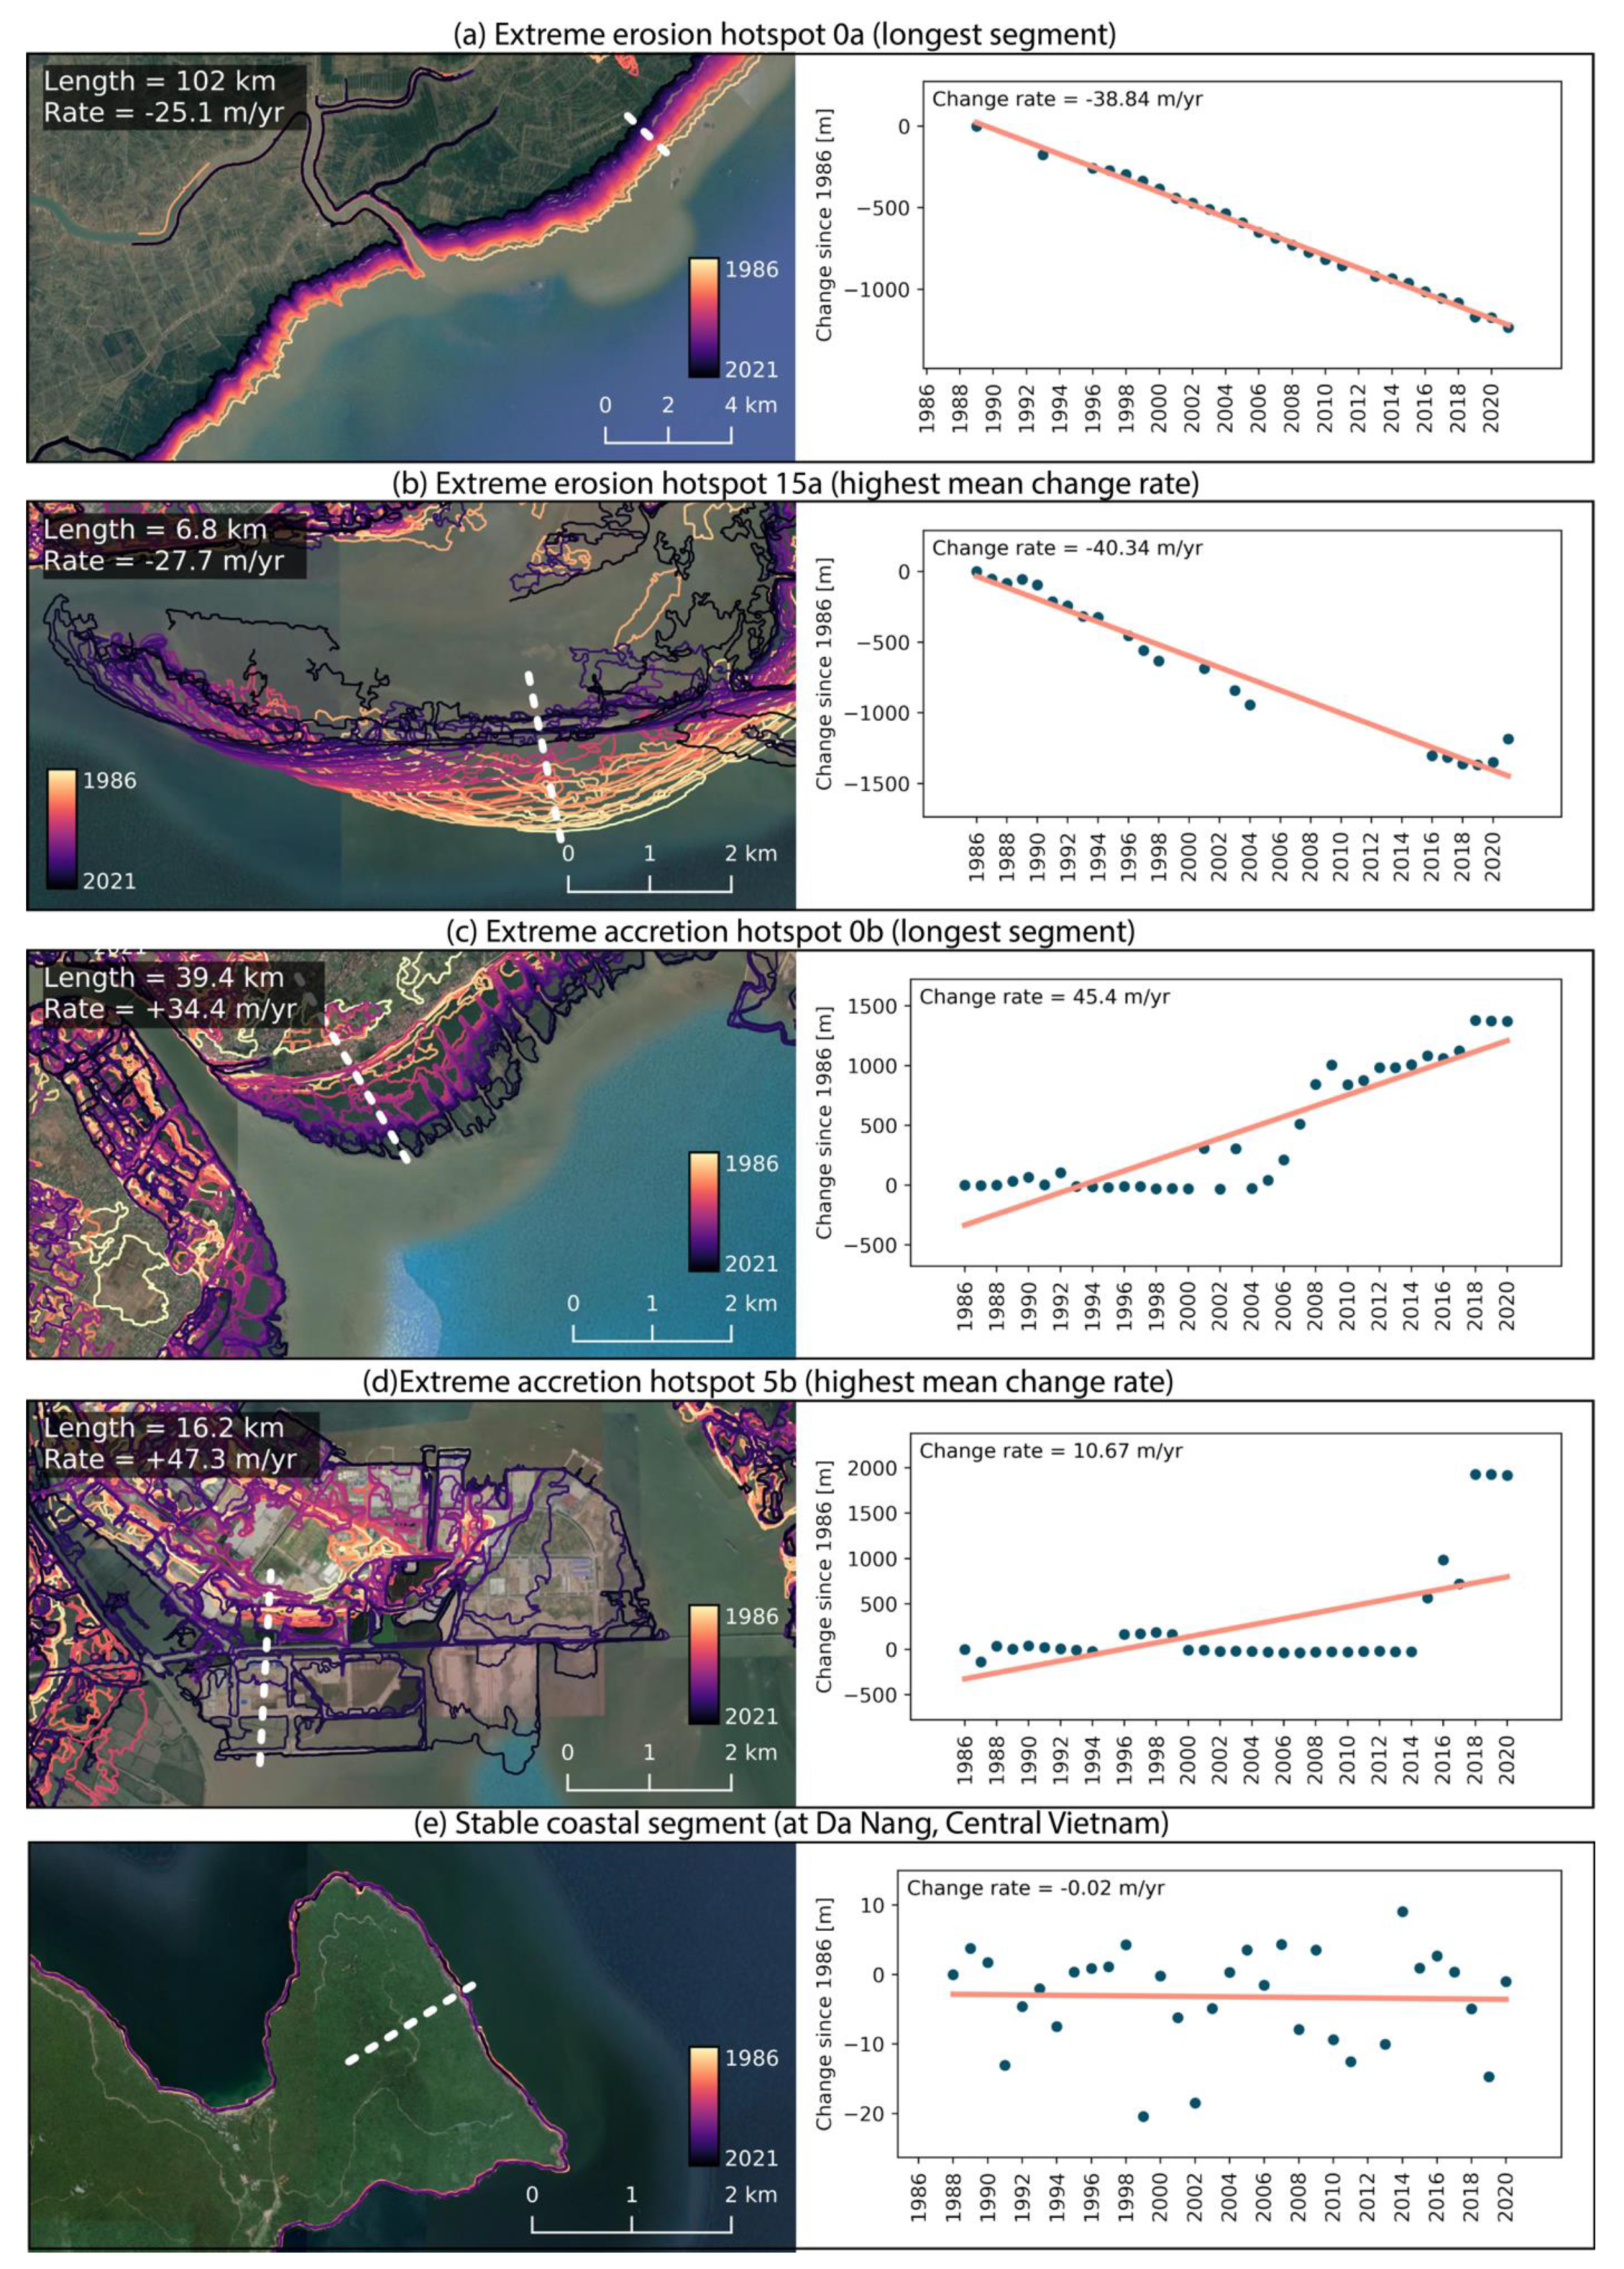
The coastline dynamics in Vietnam over the past 35 years show high spatial variability. Most change can be observed in the north and south of the country, while the coastline in central Vietnam remained mostly stable (Figure 7). This pattern is reflected by the topography, dominated by rocky coastlines in the center, and flat, vast river deltas in the north and south [52]. Within the coastal segments that are either affected by erosion or accretion, extreme change rates of more than 5 m/year are dominating (Table 3). The provinces Hai Phong City and Ninh Binh with highest accretion proportions (Figure 8) belong to the most densely populated coastal provinces in Vietnam [79]. These trends might be fueled by the rapid economic and population growth Vietnam has experienced, especially concentrated in the coastal urban centers [51]. The proportion of extreme accretion is higher than the proportion of extreme erosion (Table 3). This could be related to the fact that accretion is often caused by direct human intervention, such as the construction of artificial coastlines or land reclamation, while erosion usually happens more continuously and at slower rates [23]. Time series of coastline dynamics at five selected hotspots are shown in Figure 13. The two erosion and accretion hotspots with the longest affected segments and highest change rates (Table 4 and Table 5) as well as a stable coastline example are displayed.
4.3.1. Erosion Hotspot in the Mekong Delta
Vietnam’s longest erosional coastal segment lies in the lower Mekong Delta of Ca Mau province and is shown in Figure 13a. The average erosion rate at the hotspot is −25 m/year, resulting in a total coastline shift of 1200 m from 1986 to 2021. The time series graph of the sample transect shows a clear continuous erosion trend with a few data gaps in the 1990s and in 2012. Constant retreat of the coastline in Ca Mau has been observed multiple times before [13,17,19,20,21,80,81]. Identified drivers for coastal erosion in Ca Mau include natural sediment redistribution by along-shore currents [13], land subsidence through ground water extraction [80], mangrove removal for aquaculture production [81], reduced river discharge through river damming [17], and sand mining [19,20]. A comprehensive analysis of the various influencing factors was provided by Marchesiello et al. (2019) [13], who compared all of the above-mentioned drivers by modelling their relative impacts. The authors simulated the natural redistribution of the Mekong Delta and found that the east coast from Soc Trang to Ca Mau (which includes this hotspot) is naturally eroding due to predominant south-westwards currents close to the shore. The eroded sediment was observed to partly accumulate at the Ca Mau head (which can also be seen in Figure 7 and Figure 9). However, several naturally accreting coastal segments within the Mekong Delta were found to be eroding. This could be caused by a combination of land subsidence and a reduction in river sediment supply, according to Marchesiello et al. [13]. In this respect, the observed continuous coastline retreat at this hotspot suggests a constant natural cause, which was potentially accelerated by human activity. However, since the potential drivers for coastline change are very diverse and overlap each other, it remains a challenge to prove causal relationships. This would require further modelling and the use of additional datasets [41].
4.3.2. Erosion Hotspot in the Red River Delta
The Ba Lat mouth, the main river mouth of the Red River Delta, contains the erosion hotspot with the highest erosion rate of −28 m/year at the sample transect (Figure 13b). At the same time, however, strong accumulation is visible immediately west of the transect. The trend is mostly continuous with missing coastline records from 2005 to 2016. Hung and Larson (2014) [82] considered the Ba Lat mouth generally an accumulation area. They found that rapidly accreting river deltas typically form sand bars in front of the river mouth protecting the coast from waves and currents and hence creating suitable conditions for rapid accretion. According to Duc et al. (2012) [43], such sediment deposition appears unequally distributed and highly dynamic. While new sand bars are formed continuously, the ‘old’ sand bars are exposed to increased wave attack and along-shore currents, which naturally leads to sediment redistribution with high local erosion rates. In the Red River Delta, the average prevailing sediment transport direction through near-shore currents is south-west [82]. This hotspot entailed a data gap between 2005 and 2016 at the sample transect (Figure 13b). When taking a closer look, it becomes apparent that coastlines exist for those years west of the sample transect, forming sand bar-like structures. As proposed by Hung and Larson (2014) [82], natural processes of sand bar formation and erosion can most probably be identified as the dominant drivers at the erosion hotspot in the Ba Lat mouth. However, further downstream, continuous erosion at the mainland of Hai Hau between the two largest river mouths of the Red River Delta was reported several times [43,82] and is also reflected in the hotspot analysis (Table 5: 8a, 18a). The chronic erosion between the two river mouths was associated with a combination of south-western monsoonal currents and human-induced river sediment deficits, such as river damming and sand mining, by Hung and Larson 2014 [82].
4.3.3. Accretion Hotspot in Haiphong City
Haiphong City province encompasses Vietnam’s largest accretion hotspot, with a length of 39 km and an accretion rate of +34 m/year (Figure 13c). This translates to a total coastline shift of 1400 m. The trend is not as continuous as in the erosion hotspots described above. The hotspot area was classified as mangrove forest by Nguyen et al. (2020) [83]. These mangrove forests have been cut down extensively since the 1970s, mainly for aquaculture production [84]. The time series graph in Figure 13c shows a marginal coastline retreat from 1992 to 2000, which might be related to this policy. To address the issue of mangrove loss in northern Vietnam, several international and national organizations started initiatives to restore mangrove fringes, mainly by paying local households for planting and maintaining mangroves [85]. Especially in 2005, after strong typhoons hit the northern coast and destroyed many shrimp farms, a significant increase in mangrove area was reported by Nguyen et al. (2013) [85]. This event was followed by several national strategies for mangrove restoration and development [83,86]. An increase in coastal accretion rates since 2005 is also reflected by the time series graph in Figure 13c, which, accordingly, can be associated with active mangrove plantation.
4.3.4. Accretion Hotspot at Haiphong Port
The hotspot with the highest average accretion rate of +47 m/year is located within the Haiphong Port area in the south of the third largest city of Vietnam (Figure 13d). The time series along the sample transect shows a discontinuous picture with a predominantly stable coastline from 1986 to 2014, shifting abruptly by 2 km from 2015 to 2018 and stabilizing afterwards. Haiphong Port is the biggest harbor in northern Vietnam. Due to the rapid economic growth in the region, an expansion of the port was planned from 2010 until 2020 [87], along with the construction of new industrial zones [88]. Using Google Maps, this accretion hotspot could be located in one of these industrial zones called ‘Nam Dinh Vu Industrial Park’. Hence, the observed accretion at the sample transect between 2014 and 2018 can be explained by the harbor development of Haiphong Port along with land reclamation for related industrial zones.
4.3.5. Stable Coastline in Da Nang
An additional example was selected, showing a predominantly stable stretch of coastline in Da Nang on the Son Tra peninsula in central Vietnam. As part of the Annamite Mountain range, the peninsula is characterized by a rocky, sparsely populated coast [52]. Most likely due to the rock outcrops and lack of urbanization, this coastal segment has shown no significant change over the past 35 years.
5. Conclusions
The coastal zone of Vietnam is particularly vulnerable to natural hazards, such as floods, saltwater intrusion, tsunamis, and erosion, since economic and population growth has been concentrated at the coast during the past decades. This study investigated the annual coastline dynamics of Vietnam over the past 35 years, exploiting the full potential of the Landsat satellite archive: (i) The development of a fully automated GEE-based approach allowed for the creation of annual MNDWI composites covering the entire coastal zone of Vietnam from 1986 to 2021. (ii) The mean-high water level could be represented in the annual composites through the creation of 75th percentile images. Comparison with actual sea level data showed good agreement of the actual mean-high water level with the mean-high water level that was captured by Landsat throughout the year. The sub-pixel coastline extraction from MNDWI images yielded an average accuracy of 8.4 m on a single Landsat acquisition in central Vietnam. Comparison to previous studies on local coastline change rates in Vietnam shows that the automatic change quantification corresponds well to locally determined rates of change. (iii) The analysis of coastline change rates along shore-perpendicular transects revealed that almost half of the Vietnamese coast remained stable, while 27.7% experienced erosion and 27.1% experienced accretion over time. Within the erosional and accretional coastal segments, almost 50% of the transects show change rates above 5 m/year. (iv) The hotspot analysis identifies long stretches of coastline that show consistently high rates of erosion or accretion. Hotspots with highest erosion (−28 m/year) and accretion rates (+47 m/year) are concentrated in the two large river deltas of the Mekong River in the south and the Red River in the north. Both regions are additionally characterized by rapid economic and population growth. The highest erosion rates could presumably be related to natural redistribution of sediment while at the same time being accelerated through human-induced sediment deficits, such as river damming or sand mining. The highest observed accretion rates, in contrast, are most probably caused by direct human intervention in the form of mangrove plantation and land reclamation. However, to better understand the causes for coastline changes in Vietnam, further analysis including the type of the affected coast, prevailing natural processes, as well as coastal vulnerability, would be of interest. Furthermore, more extensive validation of the coastline extraction as well as the change quantification method is recommended in the future. Nevertheless, the presented coastline change analysis contributes an objective and valuable inventory, which may be used as a basis for future research. In addition, the approach offers the potential to be transferred to other regions, since only globally and publicly available datasets and tools were utilized.
Author Contributions
Conceptualization, R.L., F.B. and T.U.; methodology, R.L., F.B. and T.U; software, R.L.; validation, R.L. and F.B.; writing—original draft preparation, R.L.; writing—review and editing, R.L., F.B. and T.U.; visualization, R.L.; supervision, F.B. and T.U. All authors have read and agreed to the published version of the manuscript.
Funding
This research received funding from the FloodAdaptVN project (https://www.floodadapt.eoc.dlr.de, accessed on 18 May 2022), funded by the German Ministry of Education and Research (BMBF, funding no. 01LE1905A1) in the framework of the FONA program (https://www.fona.de/en/, accessed on 18 May 2022).
Data Availability Statement
The data that support the findings of this study are available from the corresponding author [R.L.], upon reasonable request. The Landsat archive is after registration available through the ‘Data Catalog’ of Google Earth Engine (https://developers.google.com/earth-engine/datasets/catalog/landsat, accessed on 18 May 2022). The administrative boundaries of Vietnam can be downloaded from https://gadm.org/maps/VNM.html (accessed on 18 May 2022). The OSM data for Vietnam can be obtained from Geofabrik Download Service (https://download.geofabrik.de/asia/vietnam.html, accessed on 18 May 2021). The sea level data for Qui Nhon station in Vietnam was accessed on http://uhslc.soest.hawaii.edu/data/ (accessed on 18 May 2022).
Acknowledgments
The authors would like to thank the anonymous reviewers for his/her valuable comments. Further thanks go to NASA, USGS, GEE, OSM, GADM, and UHSLC for providing the data and download services as well as processing capacities.
Conflicts of Interest
The authors declare no conflict of interest.
References
- Barbier, E.B.; Hacker, S.D.; Kennedy, C.; Koch, E.W.; Stier, A.C.; Silliman, B.R. The Value of Estuarine and Coastal Ecosystem Services. Ecol. Monogr. 2011, 81, 169–193. [Google Scholar] [CrossRef]
- United Nations. UN Ocean Fact Sheet. In Proceedings of the Ocean Conference, New York, NY, USA, 5–7 June 2017; United Nations: New York, NY, USA, 2017. [Google Scholar]
- Wolanski, E.; Day, J.W.; Elliott, M.; Ramachandran, R. Coasts and Estuaries: The Future; Elsevier: Amsterdam, The Netherlands, 2019; ISBN 978-0-12-814003-1. [Google Scholar]
- Small, C.; Nicholls, R.J. A Global Analysis of Human Settlement in Coastal Zones. J. Coast. Res. 2003, 19, 584–599. [Google Scholar]
- Oppenheimer, M.; Glavovic, B.C.; Hinkel, J.; van de Wal, R.; Magnan, A.K.; Abd-Elgawad, A.; Cai, R.; Cifuentes-Jara, M.; DeConto, R.M.; Ghosh, T.; et al. Sea Level Rise and Implications for Low-Lying Islands, Coasts and Communities. In IPCC Special Report on the Ocean and Cryosphere in a Changing Climate; Intergovernmental Panel on Climate Change: Geneva, Switzerland, 2019. [Google Scholar]
- Ranasinghe, R. Assessing Climate Change Impacts on Open Sandy Coasts: A Review. Earth-Sci. Rev. 2016, 160, 320–332. [Google Scholar] [CrossRef] [Green Version]
- Nicholls, R.J.; Woodroffe, C.; Burkett, V. Coastline Degradation as an Indicator of Global Change. In Climate Change; Elsevier: Amsterdam, The Netherlands, 2016; pp. 309–324. ISBN 978-0-444-63524-2. [Google Scholar]
- Boak, E.H.; Turner, I.L. Shoreline Definition and Detection: A Review. J. Coast. Res. 2005, 214, 688–703. [Google Scholar] [CrossRef] [Green Version]
- Kien, P.H.; Cong, L.V.; Thanh, V.T. Vietnam Coastal Erosion—Cause and Challenges. Presentation Slides. Hanoi. 2018. Available online: http://sciencedocbox.com/Geology/116703635-Vietnam-coastal-erosion-cause-and-challenges.html (accessed on 18 May 2022).
- Toure, S.; Diop, O.; Kpalma, K.; Maiga, A. Shoreline Detection Using Optical Remote Sensing: A Review. ISPRS Int. J. Geo-Inf. 2019, 8, 75. [Google Scholar] [CrossRef] [Green Version]
- Viaña-Borja, S.P.; Ortega-Sánchez, M. Automatic Methodology to Detect the Coastline from Landsat Images with a New Water Index Assessed on Three Different Spanish Mediterranean Deltas. Remote Sens. 2019, 11, 2186. [Google Scholar] [CrossRef] [Green Version]
- Mohan, R.K.; Short, A.D.; Cambers, G.; MacLeod, M.; Cooper, J.A.G.; Hopley, D.; May, V.; Mörner, N.-A.; Otvos, E.G.; West, N.; et al. Coasts, Coastlines, Shores, and Shorelines. In Encyclopedia of Coastal Science; Schwartz, M.L., Ed.; Springer: Dordrecht, The Netherlands, 2005; pp. 323–327. ISBN 978-1-4020-1903-6. [Google Scholar]
- Marchesiello, P.; Nguyen, N.M.; Gratiot, N.; Loisel, H.; Anthony, E.J.; Dinh, C.S.; Nguyen, T.; Almar, R.; Kestenare, E. Erosion of the Coastal Mekong Delta: Assessing Natural against Man Induced Processes. Cont. Shelf Res. 2019, 181, 72–89. [Google Scholar] [CrossRef]
- Mangor Definitions of Coastal Terms. Coastalwiki. 2021. Available online: http://www.coastalwiki.org/wiki/Definitions_of_coastal_terms (accessed on 2 May 2021).
- Bird, E.C.F. Coastal Geomorphology: An Introduction, 2nd ed.; Wiley: Chichester, UK; Hoboken, NJ, USA, 2008; ISBN 978-0-470-51729-1. [Google Scholar]
- Cui, B.-L.; Li, X.-Y. Coastline Change of the Yellow River Estuary and Its Response to the Sediment and Runoff (1976–2005). Geomorphology 2011, 127, 32–40. [Google Scholar] [CrossRef]
- Nhan, N.H.; Cao, N.B. Damming the Mekong: Impacts in Vietnam and Solutions. In Coasts and Estuaries; Elsevier: Amsterdam, The Netherlands, 2019; pp. 321–340. ISBN 978-0-12-814003-1. [Google Scholar]
- Warrick, J.A.; Stevens, A.W.; Miller, I.M.; Harrison, S.R.; Ritchie, A.C.; Gelfenbaum, G. World’s Largest Dam Removal Reverses Coastal Erosion. Sci. Rep. 2019, 9, 13968. [Google Scholar] [CrossRef] [Green Version]
- Bravard, J.-P.; Goichot, M.; Gaillot, S. Geography of Sand and Gravel Mining in the Lower Mekong River: First Survey and Impact Assessment. EchoGéo 2013. [Google Scholar] [CrossRef] [Green Version]
- Jordan, C.; Tiede, J.; Lojek, O.; Visscher, J.; Apel, H.; Nguyen, H.Q.; Quang, C.N.X.; Schlurmann, T. Sand Mining in the Mekong Delta Revisited—Current Scales of Local Sediment Deficits. Sci. Rep. 2019, 9, 17823. [Google Scholar] [CrossRef] [PubMed]
- Besset, M.; Gratiot, N.; Anthony, E.J.; Bouchette, F.; Goichot, M.; Marchesiello, P. Mangroves and Shoreline Erosion in the Mekong River Delta, Viet Nam. Estuar. Coast. Shelf Sci. 2019, 226, 106263. [Google Scholar] [CrossRef]
- Mentaschi, L.; Vousdoukas, M.I.; Pekel, J.-F.; Voukouvalas, E.; Feyen, L. Global Long-Term Observations of Coastal Erosion and Accretion. Sci. Rep. 2018, 8, 12876. [Google Scholar] [CrossRef] [PubMed] [Green Version]
- Mangor Human Causes of Coastal Erosion. Coastalwiki. 2020. Available online: http://www.coastalwiki.org/wiki/Human_causes_of_coastal_erosion (accessed on 30 April 2021).
- Nordstrom, K.F. Living with Shore Protection Structures: A Review. Estuar. Coast. Shelf Sci. 2014, 150, 11–23. [Google Scholar] [CrossRef]
- Hapke, C.J.; Kratzmann, M.G.; Himmelstoss, E.A. Geomorphic and Human Influence on Large-Scale Coastal Change. Geomorphology 2013, 199, 160–170. [Google Scholar] [CrossRef]
- Rentschler, J.; de Vries Robbé, S.; Braese, J.; Nguyen, D.H.; van Ledden, M.; Pozueta Mayo, B. Resilient Shores: Vietnam’s Coastal Development between Opportunity and Disaster Risk; World Bank: Washington, DC, USA, 2020. [Google Scholar]
- Kelletat, D. Physische Geographie Der Meere Und Küsten: Eine Einführung; Studienbücher der Geographie; 3., neu bearb. und erw. Aufl.; Borntraeger: Stuttgart, Germany, 2013; ISBN 978-3-443-07150-9. [Google Scholar]
- Tian, B.; Wu, W.; Yang, Z.; Zhou, Y. Drivers, Trends, and Potential Impacts of Long-Term Coastal Reclamation in China from 1985 to 2010. Estuar. Coast. Shelf Sci. 2016, 170, 83–90. [Google Scholar] [CrossRef]
- Luijendijk, A.; Hagenaars, G.; Ranasinghe, R.; Baart, F.; Donchyts, G.; Aarninkhof, S. The State of the World’s Beaches. Sci. Rep. 2018, 8, 6641. [Google Scholar] [CrossRef]
- Sayre, R.; Noble, S.; Hamann, S.; Smith, R.; Wright, D.; Breyer, S.; Butler, K.; Van Graafeiland, K.; Frye, C.; Karagulle, D.; et al. A New 30 Meter Resolution Global Shoreline Vector and Associated Global Islands Database for the Development of Standardized Ecological Coastal Units. J. Oper. Oceanogr. 2019, 12, S47–S56. [Google Scholar] [CrossRef] [Green Version]
- Sabour, S.; Brown, S.; Nicholls, R.J.; Haigh, I.D.; Luijendijk, A.P. Multi-Decadal Shoreline Change in Coastal Natural World Heritage Sites—A Global Assessment. Environ. Res. Lett. 2020, 15, 104047. [Google Scholar] [CrossRef]
- McFeeters, S.K. The Use of the Normalized Difference Water Index (NDWI) in the Delineation of Open Water Features. Int. J. Remote Sens. 1996, 17, 1425–1432. [Google Scholar] [CrossRef]
- Bishop-Taylor, R.; Sagar, S.; Lymburner, L.; Alam, I.; Sixsmith, J. Sub-Pixel Waterline Extraction: Characterising Accuracy and Sensitivity to Indices and Spectra. Remote Sens. 2019, 11, 2984. [Google Scholar] [CrossRef] [Green Version]
- Cipolletti, M.P.; Delrieux, C.A.; Perillo, G.M.E.; Cintia Piccolo, M. Superresolution Border Segmentation and Measurement in Remote Sensing Images. Comput. Geosci. 2012, 40, 87–96. [Google Scholar] [CrossRef]
- Song, Y.; Liu, F.; Ling, F.; Yue, L. Automatic Semi-Global Artificial Shoreline Subpixel Localization Algorithm for Landsat Imagery. Remote Sens. 2019, 11, 1779. [Google Scholar] [CrossRef] [Green Version]
- Pardo-Pascual, J.; Sánchez-García, E.; Almonacid-Caballer, J.; Palomar-Vázquez, J.; Priego de los Santos, E.; Fernández-Sarría, A.; Balaguer-Beser, Á. Assessing the Accuracy of Automatically Extracted Shorelines on Microtidal Beaches from Landsat 7, Landsat 8 and Sentinel-2 Imagery. Remote Sens. 2018, 10, 326. [Google Scholar] [CrossRef] [Green Version]
- Chen, W.-W.; Chang, H.-K. Estimation of Shoreline Position and Change from Satellite Images Considering Tidal Variation. Estuar. Coast. Shelf Sci. 2009, 84, 54–60. [Google Scholar] [CrossRef]
- El-Ashmawy, N. Automatic Determination of Shoreline at Maximum Retreating. Egypt. J. Remote Sens. Space Sci. 2019, 22, 247–252. [Google Scholar] [CrossRef]
- Bishop-Taylor, R.; Nanson, R.; Sagar, S.; Lymburner, L. Mapping Australia’s Dynamic Coastline at Mean Sea Level Using Three Decades of Landsat Imagery. Remote Sens. Environ. 2021, 267, 112734. [Google Scholar] [CrossRef]
- Gorelick, N.; Hancher, M.; Dixon, M.; Ilyushchenko, S.; Thau, D.; Moore, R. Google Earth Engine: Planetary-Scale Geospatial Analysis for Everyone. Remote Sens. Environ. 2017, 202, 18–27. [Google Scholar] [CrossRef]
- Nguyen, H.-H.; McAlpine, C.; Pullar, D.; Leisz, S.J.; Galina, G. Drivers of Coastal Shoreline Change: Case Study of Hon Dat Coast, Kien Giang, Vietnam. Environ. Manage. 2015, 55, 1093–1108. [Google Scholar] [CrossRef]
- Hung, N.T.; Duc, D.M.; Quynh, D.T.; Cuong, V.D. Nearshore Topographical Changes and Coastal Stability in Nam Dinh Province, Vietnam. J. Mar. Sci. Eng. 2020, 8, 755. [Google Scholar] [CrossRef]
- Duc, D.M.; Nhuan, M.T.; Ngoi, C.V. An Analysis of Coastal Erosion in the Tropical Rapid Accretion Delta of the Red River, Vietnam. J. Asian Earth Sci. 2012, 43, 98–109. [Google Scholar] [CrossRef]
- Hue, N.H.; Thanh, N.H. Assessing the Impact of Massive Development of Beach Resorts on Current Status of Coastal Erosion Along the Central Coast of Vietnam; Trung Viet, N., Xiping, D., Thanh Tung, T., Eds.; Springer: Singapore, 2020; pp. 551–556. [Google Scholar]
- Quang Tuan, N.; Cong Tin, H.; Quang Doc, L.; Anh Tuan, T. Historical Monitoring of Shoreline Changes in the Cua Dai Estuary, Central Vietnam Using Multi-Temporal Remote Sensing Data. Geosciences 2017, 7, 72. [Google Scholar] [CrossRef] [Green Version]
- Wyatt, A.B.; Thanh, N.T.P.; Gian, T.P. Viet Nam Situation Analysis; IUCN: Hanoi, Vietnam, 2012; p. 95. [Google Scholar]
- Nguyen, Q.H.; Takewaka, S. Land Subsidence and Its Effects on Coastal Erosion in the Nam Dinh Coast (Vietnam). Cont. Shelf Res. 2020, 207, 104227. [Google Scholar] [CrossRef]
- UN Viet Nam—Country Profile. UN Data. 2020. Available online: http://data.un.org/en/iso/vn.html (accessed on 25 June 2021).
- Beck, H.E.; Zimmermann, N.E.; McVicar, T.R.; Vergopolan, N.; Berg, A.; Wood, E.F. Present and Future Köppen-Geiger Climate Classification Maps at 1-Km Resolution. Sci. Data 2018, 5, 180214. [Google Scholar] [CrossRef] [PubMed] [Green Version]
- WorldBank Vietnam—Climate Data: Historical. Climate Change Knowledge Portal—Development Practitioners and Policy Makers. 2020. Available online: https://climateknowledgeportal.worldbank.org/country/vietnam (accessed on 25 June 2021).
- WorldBank Vietnam. World Development Indicators. 2021. Available online: https://data.worldbank.org/country/vietnam (accessed on 25 June 2021).
- Eisma, D. Vietnam. In Encyclopedia of the World’s Coastal Landforms; Bird, E.C.F., Ed.; Springer: Dordrecht, The Netherlands, 2010; pp. 1147–1150. ISBN 978-1-4020-8639-7. [Google Scholar]
- Trinh, T.T.; Pattiaratchi, C.; Bui, T. The Contribution of Forerunner to Storm Surges along the Vietnam Coast. J. Mar. Sci. Eng. 2020, 8, 508. [Google Scholar] [CrossRef]
- Vlasova, G.A.; Xuan, N.B.; Demenok, M.N.; Long, B.H.; Mau, L.D.; Dung, N.T.T. Tropical Cyclone in the North of the South China Sea as a Factor Affecting the Structure of the Vietnamese Current. Izv. Atmospheric Ocean. Phys. 2020, 56, 390–400. [Google Scholar] [CrossRef]
- USGS Landsat Satellite Missions. USGS Science for a Changing World. 2021. Available online: https://www.usgs.gov/core-science-systems/nli/landsat/landsat-satellite-missions?qt-science_support_page_related_con=0#qt-science_support_page_related_con (accessed on 30 June 2021).
- Vermote, E.; Justice, C.; Claverie, M.; Franch, B. Preliminary Analysis of the Performance of the Landsat 8/OLI Land Surface Reflectance Product. Remote Sens. Environ. 2016, 185, 46–56. [Google Scholar] [CrossRef]
- ESA RapidEye. Earth Online. 2021. Available online: https://earth.esa.int/eogateway/missions/rapideye (accessed on 1 July 2021).
- Planet RAPIDEYETM Imagery Product Specifications. 2016. Available online: https://www.planet.com/products/satellite-imagery/files/160625-RapidEye%20Image-Product-Specifications.pdf (accessed on 1 July 2021).
- Caldwell, P.C.; Merrifield, M.A.; Thompson, P.R. Sea Level Measured by Tide Gauges from Global Oceans as Part of the Joint Archive for Sea Level (JASL) Since 1846. 2010. Available online: https://www.ncei.noaa.gov/archive/accession/JIMAR-JASL (accessed on 2 July 2021).
- Foga, S.; Scaramuzza, P.L.; Guo, S.; Zhu, Z.; Dilley, R.D.; Beckmann, T.; Schmidt, G.L.; Dwyer, J.L.; Joseph Hughes, M.; Laue, B. Cloud Detection Algorithm Comparison and Validation for Operational Landsat Data Products. Remote Sens. Environ. 2017, 194, 379–390. [Google Scholar] [CrossRef] [Green Version]
- Corbane, C.; Politis, P.; Kempeneers, P.; Simonetti, D.; Soille, P.; Burger, A.; Pesaresi, M.; Sabo, F.; Syrris, V.; Kemper, T. A Global Cloud Free Pixel- Based Image Composite from Sentinel-2 Data. Data Brief 2020, 31, 105737. [Google Scholar] [CrossRef]
- Xu, H. Modification of Normalised Difference Water Index (NDWI) to Enhance Open Water Features in Remotely Sensed Imagery. Int. J. Remote Sens. 2006, 27, 3025–3033. [Google Scholar] [CrossRef]
- Du, Y.; Zhang, Y.; Ling, F.; Wang, Q.; Li, W.; Li, X. Water Bodies’ Mapping from Sentinel-2 Imagery with Modified Normalized Difference Water Index at 10-m Spatial Resolution Produced by Sharpening the SWIR Band. Remote Sens. 2016, 8, 354. [Google Scholar] [CrossRef] [Green Version]
- Kelly, J.T.; Gontz, A.M. Using GPS-Surveyed Intertidal Zones to Determine the Validity of Shorelines Automatically Mapped by Landsat Water Indices. Int. J. Appl. Earth Obs. Geoinf. 2018, 65, 92–104. [Google Scholar] [CrossRef]
- Otsu, N. A Threshold Selection Method from Gray-Level Histograms. IEEE Trans. Syst. Man Cybern. 1979, 9, 62–66. [Google Scholar] [CrossRef] [Green Version]
- Vos, K.; Splinter, K.D.; Harley, M.D.; Simmons, J.A.; Turner, I.L. CoastSat: A Google Earth Engine-Enabled Python Toolkit to Extract Shorelines from Publicly Available Satellite Imagery. Environ. Model. Softw. 2019, 122, 104528. [Google Scholar] [CrossRef]
- Ng, H.-F.; Jargalsaikhan, D.; Tsai, H.-C.; Lin, C.-Y. An Improved Method for Image Thresholding Based on the Valley-Emphasis Method. In Proceedings of the 2013 Asia-Pacific Signal and Information Processing Association Annual Summit and Conference, Kaohsiung, Taiwan, 29 October–1 November 2013; pp. 1–4. [Google Scholar]
- van der Walt, S.; Schönberger, J.L.; Nunez-Iglesias, J.; Boulogne, F.; Warner, J.D.; Yager, N.; Gouillart, E.; Yu, T. Scikit-Image: Image Processing in Python. PeerJ 2014, 2, e453. [Google Scholar] [CrossRef]
- Ngo, T.; Vu, H.V.; Ho, H.; Dao, T.T.T.; Nguyen, H.T.H. Performance of Fish Farms in Vietnam–Does Financial Access Help Improve Their Cost Efficiency? Int. J. Financ. Stud. 2019, 7, 45. [Google Scholar] [CrossRef] [Green Version]
- GADM. Global Administrative Areas. 2020. Available online: https://gadm.org/data.html (accessed on 1 July 2021).
- Narayana, A.C. Shoreline Changes. In Encyclopedia of Estuaries; Kennish, M.J., Ed.; Springer: Dordrecht, The Netherlands, 2016; pp. 590–602. ISBN 978-94-017-8800-7. [Google Scholar]
- Eckey, H.-F.; Kosfeld, R.; Türck, M. Deskriptive Statistik; Gabler: Wiesbaden, Germany, 2008; ISBN 978-3-8349-0859-9. [Google Scholar]
- Himmelstoss, E.A.; Henderson, R.E.; Kratzmann, M.G.; Farris, A.S. Digital Shoreline Analysis System (DSAS) Version 5.0 User Guide; Open-File Report; U.S. Geological Survey: Reston, VA, USA, 2018. [CrossRef] [Green Version]
- Mullick, M.R.A.; Islam, K.M.A.; Tanim, A.H. Shoreline Change Assessment Using Geospatial Tools: A Study on the Ganges Deltaic Coast of Bangladesh. Earth Sci. Inform. 2020, 13, 299–316. [Google Scholar] [CrossRef]
- Estevesf, L.S.; Finkl, C.; Raton, B. The Problem of Critically Eroded Areas (CEA): An Evaluation of Florida Beaches; Conference Paper. 1998. Available online: https://0-www-jstor-org.brum.beds.ac.uk/stable/25736114 (accessed on 26 May 2021).
- Scheffler, D.; Hollstein, A.; Diedrich, H.; Segl, K.; Hostert, P. AROSICS: An Automated and Robust Open-Source Image Co-Registration Software for Multi-Sensor Satellite Data. Remote Sens. 2017, 9, 676. [Google Scholar] [CrossRef] [Green Version]
- Liem, N.V.; Bao, D.V.; Bac, D.K.; Cuong, N.C.; Nga, P.T.P.; Burkhard, B.; Chi, G.T.K. Assessment of Shoreline Changes for Setback Zone Establishment from Son Tra (Da Nang City) to Cua Dai (Hoi An City), Vietnam. Vietnam J. Earth Sci. 2020, 42. [Google Scholar] [CrossRef]
- Wulder, M.A.; White, J.C.; Loveland, T.R.; Woodcock, C.E.; Belward, A.S.; Cohen, W.B.; Fosnight, E.A.; Shaw, J.; Masek, J.G.; Roy, D.P. The Global Landsat Archive: Status, Consolidation, and Direction. Remote Sens. Environ. 2016, 185, 271–283. [Google Scholar] [CrossRef] [Green Version]
- General Statistics Office of Vietnam. Results of the Census of Population and Housing at 0 O’clock April 1, 2019. Part III—Tabulated Tables; Statistical Publishing House: Hanoi, Vietnam, 2019; ISBN 978-604-75-1448-9.
- Minderhoud, P.S.J.; Erkens, G.; Pham, V.H.; Bui, V.T.; Erban, L.; Kooi, H.; Stouthamer, E. Impacts of 25 Years of Groundwater Extraction on Subsidence in the Mekong Delta, Vietnam. Environ. Res. Lett. 2017, 12, 064006. [Google Scholar] [CrossRef]
- Tran, H.; Tran, T.; Kervyn, M. Dynamics of Land Cover/Land Use Changes in the Mekong Delta, 1973–2011: A Remote Sensing Analysis of the Tran Van Thoi District, Ca Mau Province, Vietnam. Remote Sens. 2015, 7, 2899–2925. [Google Scholar] [CrossRef] [Green Version]
- Hung, N.M.; Larson, M. Coastline and River Mouth Evolution in the Central Part of the Red River Delta. In Coastal Disasters and Climate Change in Vietnam; Elsevier: Amsterdam, The Netherlands, 2014; pp. 43–79. ISBN 978-0-12-800007-6. [Google Scholar]
- Nguyen, H.-H.; Tran, L.T.N.; Le, A.T.; Nghia, N.H.; Duong, L.V.K.; Nguyen, H.T.T.; Bohm, S.; Premnath, C.F.S. Monitoring Changes in Coastal Mangrove Extents Using Multi-Temporal Satellite Data in Selected Communes, Hai Phong City, Vietnam. For. Soc. 2020, 4, 256. [Google Scholar] [CrossRef]
- Pham, T.D.; Yoshino, K. Impacts of Mangrove Management Systems on Mangrove Changes in the Northern Coast of Vietnam. Tropics 2016, 24, 141–151. [Google Scholar] [CrossRef] [Green Version]
- Nguyen, H.-H.; McAlpine, C.; Pullar, D.; Johansen, K.; Duke, N.C. The Relationship of Spatial–Temporal Changes in Fringe Mangrove Extent and Adjacent Land-Use: Case Study of Kien Giang Coast, Vietnam. Ocean Coast. Manag. 2013, 76, 12–22. [Google Scholar] [CrossRef]
- Hawkins, S.; Xuan To, P.; Phuong, P.; Thuy, P.; Cuong, C.; Brown, S.; Robertson, S.; Vu, N.; McNally, R. Roots in the Water: Legal Frameworks for Mangrove PES in Vietnam; Forest Trends: Washington, DC, USA, 2010. [Google Scholar]
- Khan, A.Z.; Xuan Quynh, L.; Canters, F.; Corijn, E. SECOA 4—Environmental Conflicts in Coastal Urban Areas. Towards a Strategic Assessment Framework for Sustainable Development; Sapienza Università Editrice: Rome, Italy, 2013; 420p. [Google Scholar] [CrossRef]
- DEEP-C Industrial Zones. Exploring Vietnam 2.0; Presentation Slides. 2020. Available online: https://www.oav.de/fileadmin/user_upload/2_Termine/Allgemein/OAV_ppt_20200702.pdf (accessed on 11 July 2021).
Figure 1.
Study area: Vietnam.

Figure 2.
Spatio-temporal distribution of Landsat acquisitions for Vietnam’s coastal zone, 1984–2021.
Figure 2.
Spatio-temporal distribution of Landsat acquisitions for Vietnam’s coastal zone, 1984–2021.

Figure 3.
Schematic workflow of the coastline detection method.

Figure 4.
Sub-pixel contour compared to whole-pixel contour at Otsu threshold.

Figure 5.
Shore-normal transect generation method. (a) Transects generated at original GADM land polygon with 200 m spacing and 3 km length, resulting in superimposed and missing areas at hard edges. (b) Transects generated at smoothed GADM land polygon. (c) Transects clipped to the maximum observed land area through the entire time series from 1986 to 2021 (blue); unclipped transects (grey).

Figure 6.
Hotspot analysis method. (a) Coastline change classification on Level 1; coastal segments are defined hotspots when 20 consecutive transects belong to the “erosion” or “accretion” class (with 1 transect tolerance). (b) Coastline change classification on Level 2; hotspots showing “extreme” change rates on average (>5 m/year) are filtered. (c) Filtered “extreme erosion hotspot”.

Figure 7.
Classification of coastline change in Vietnam from 1986 to 2021, with zooms on two exemplary coastal segments showing the annual coastlines overlaid by the classification transects.
Figure 7.
Classification of coastline change in Vietnam from 1986 to 2021, with zooms on two exemplary coastal segments showing the annual coastlines overlaid by the classification transects.

Figure 8.
Coastline change per province, showing the proportion of transects with erosion, accretion and stable conditions from 1986 to 2021.
Figure 8.
Coastline change per province, showing the proportion of transects with erosion, accretion and stable conditions from 1986 to 2021.

Figure 9.
Coastline change hotspots in Vietnam from 1986 to 2021. Only the hotspots with extreme average erosion and accretion rates (>5 m/year) were selected. The size of the circle differs by the length of the affected coastal segment. The two zoom images additionally show the annual coastlines overlaid by the filtered hotspot transects and circles.

Figure 10.
(a) Cutout of the manually digitized RapidEye reference shoreline (red) and automatically extracted Landsat shoreline (green). (b) Shore-perpendicular transects along which the displacement is calculated. (c) Distribution of displacement values between both shorelines showing absolute displacement vs. displacement direction (positive: towards land; negative: towards the sea).

Figure 11.
Left: Hourly sea levels at Qui Nhon station (blue) and Landsat acquisition times (orange). Right: Sea levels only at Landsat acquisition times (blue), 75th percentile of sea levels at Landsat acquisition time (black line), and 75th percentile of all sea levels (grey line).
Figure 11.
Left: Hourly sea levels at Qui Nhon station (blue) and Landsat acquisition times (orange). Right: Sea levels only at Landsat acquisition times (blue), 75th percentile of sea levels at Landsat acquisition time (black line), and 75th percentile of all sea levels (grey line).

Figure 12.
Mean number of valid (cloud-free) observations per pixel from 1986–2021.

Figure 13.
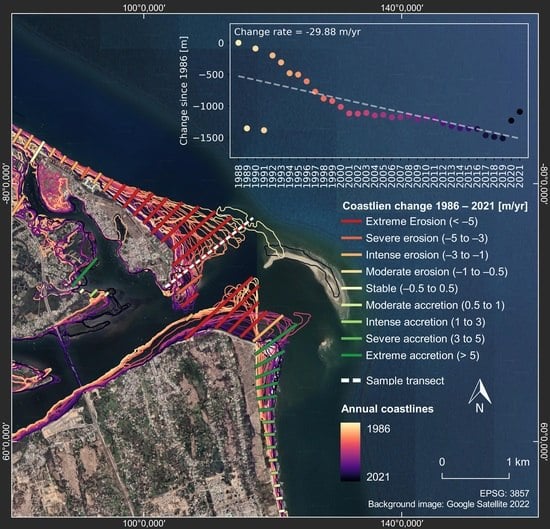
Left: Mean annual coastlines (1986–2021) at selected hotspots overlaid by a sample transect (white-dotted line). Right: The time series graph of the coastline positions relative to the earliest coastline position on the sample transect. For the location of the hotspots, see Figure 9.
Figure 13.
Left: Mean annual coastlines (1986–2021) at selected hotspots overlaid by a sample transect (white-dotted line). Right: The time series graph of the coastline positions relative to the earliest coastline position on the sample transect. For the location of the hotspots, see Figure 9.


Table 1.
Validation data.
| Satellite | Tile ID | Date | Acquisition Time [UTC] | Cloud Cover [%] | Processing Level |
|---|---|---|---|---|---|
| RE1 | 4946401 | 7 February 2017 | 03:51:05 | 0 | 3A |
| RE1 | 4946402 | 7 February 2017 | 03:51:04 | 0 | 3A |
| RE1 | 4946403 | 7 February 2017 | 03:51:03 | 1 | 3A |
| RE1 | 4946501 | 7 February 2017 | 03:51:02 | 0 | 3A |
| RE1 | 4946502 | 7 February 2017 | 03:51:01 | 0 | 3A |
| RE1 | 4946503 | 7 February 2017 | 03:51:00 | 0 | 3A |
| LC8 | 124049 | 7 February 2017 | 03:06:27 | 0 | T1 L2 |
Table 2.
Coastline change classification scheme on Level 2.
| Class | Change Rates [m/Year] |
|---|---|
| Extreme accretion | >5 |
| Severe accretion | 5 to 3 |
| Intense accretion | 3 to 1 |
| Moderate accretion | 1 to 0.5 |
| Stable | 0.5 to −0.5 |
| Moderate erosion | −0.5 to −1 |
| Intense erosion | −1 to −3 |
| Severe erosion | −3 to −5 |
| Intense erosion | <−5 |
Table 3.
Proportion of coastline change classes in Vietnam.
| Classification L1 [m/Year] | Proportion [%] | Classification L2 [m/Year] | Proportion [%] |
|---|---|---|---|
| Stable (0.5 to −0.5) | 45.2 | ||
| Erosion (<−0.5) | 27.7 | Extreme erosion (<−5) | 39.2 |
| Severe erosion (−3 to −5) | 9.6 | ||
| Intense erosion (−3 to −1) | 22.0 | ||
| Moderate erosion (−1 to −0.5) | 29.3 | ||
| Accretion (>0.5) | 27.1 | Extreme accretion (>5) | 49.5 |
| Severe accretion (5 to 3) | 9.3 | ||
| Intense accretion (3 to 1) | 23.7 | ||
| Moderate accretion (1 to 0.5) | 17.5 |
Table 4.
Accretion hotspots in Vietnam from 1986 to 2021.
| No. | Length [m] | Mean Change Rate [m/year] | Mean Standard Error [m] | Province |
|---|---|---|---|---|
| 0b | 39,400 | 34.4 | 4.9 | Thai Binh/Hai Phong City |
| 1b | 32,000 | 22.6 | 3.3 | Soc Trang |
| 2b | 22,600 | 39.0 | 3.3 | Ca Mau |
| 3b | 20,400 | 23.5 | 1.9 | Soc Trang/Tra Vinh |
| 4b | 17,200 | 8.6 | 2.5 | Bac Lieu |
| 5b | 16,200 | 47.3 | 6.9 | Thanh Hoa/Ninh Binh |
| 6b | 15,800 | 36.8 | 3.2 | Quang Ninh |
| 7b | 14,600 | 11.4 | 1.6 | Kien Giang |
| 8b | 14,200 | 14.8 | 1.0 | Kien Giang |
| 9b | 12,600 | 25.3 | 2.5 | Quang Ninh |
| 10b | 12,000 | 15.2 | 1.7 | Quang Ninh |
| 11b | 11,800 | 10.2 | 1.8 | Tra Vinh |
| 12b | 11,400 | 21.1 | 2.5 | Quang Ninh |
| 13b | 9400 | 15.3 | 2.4 | Da Nang City |
| 14b | 9400 | 13.0 | 5.8 | Quang Ninh |
| 15b | 9400 | 5.1 | 0.5 | Kien Giang |
| 16b | 9400 | 11.5 | 3.7 | Nam Dinh |
| 17b | 8800 | 15.6 | 3.7 | Nam Dinh |
| 18b | 7600 | 7.9 | 2.2 | Quang Ninh |
| 19b | 7200 | 6.7 | 1.3 | Kien Gang |
| 20b | 6800 | 24.9 | 3.6 | Ben Tre |
| 21b | 6400 | 28.9 | 4.1 | Ben Tre |
| 22b | 6200 | 20.1 | 5.2 | Thai Binh |
| 23b | 6200 | 6.1 | 0.3 | Kien Giang |
| 24b | 6000 | 12.3 | 3.2 | Quang Ninh |
| 25b | 6000 | 51.5 | 13.9 | Hai Phong City/Quang Ninh |
| 26b | 6000 | 6.8 | 0.8 | Tra Vinh |
| 27b | 6000 | 11.0 | 4.8 | Quang Ninh |
| 28b | 6000 | 21.4 | 8.2 | Nam Dinh |
| 29b | 5800 | 6.5 | 0.9 | Quang Ninh |
| 30b | 5000 | 21.8 | 3.9 | Ha Tinh |
| 31b | 4800 | 8.8 | 1.2 | Hai Phong City |
| 32b | 4400 | 9.5 | 1.7 | Khanh Hoa |
| 33b | 4400 | 10.9 | 1.7 | Hai Phong City |
| 34b | 4400 | 25.1 | 2.8 | Kien Giang |
| 35b | 4200 | 19.2 | 2.0 | Tien Giang |
| 36b | 4200 | 6.1 | 1.0 | Binh Thuan |
Table 5.
Erosion hotspots in Vietnam from 1986 to 2021.
| No. | Length [m] | Mean Change Rate [m/year] | Mean Standard Error [m] | Province |
|---|---|---|---|---|
| 0a | 101,600 | −25.1 | 1.0 | Ca Mau/Bac Lieu |
| 1a | 82,200 | −10.7 | 0.8 | Kien Giang/Ca Mau |
| 2a | 14,200 | −13.2 | 0.5 | Ben Tre |
| 3a | 13,600 | −7.7 | 0.4 | Tien Giang |
| 4a | 13,400 | −16.7 | 2.3 | Bac Lieu/Soc Trang |
| 5a | 12,600 | −7.8 | 1.6 | Bac Lieu/Soc Trang |
| 6a | 12,000 | −9.5 | 1.2 | Kien Giang |
| 7a | 12,000 | −5.7 | 0.6 | Tra Vinh |
| 8a | 10,800 | −5.3 | 1.0 | Nam Dinh |
| 9a | 9200 | −5.9 | 1.6 | Bac Lieu |
| 10a | 9000 | −6.2 | 1.5 | Quang Nam |
| 11a | 8800 | −10.9 | 0.5 | Soc Trang |
| 12a | 8400 | −18.5 | 1.2 | Tien Giang/Ben Tre |
| 13a | 7800 | −7.1 | 1.2 | Ba Ria/Vung Tau |
| 14a | 7200 | −9.5 | 4.4 | Quang Ninh |
| 15a | 6800 | −27.7 | 2.4 | Nam Dinh |
| 16a | 6600 | −22.3 | 2.3 | Nam Dinh |
| 17a | 6400 | −15.7 | 7.2 | Quang Ninh |
| 18a | 5400 | −8.4 | 0.8 | Nam Dinh |
| 19a | 5400 | −6.3 | 2.7 | Thai Binh |
| 20a | 4200 | −8.5 | 2.4 | Quang Ninh |
Publisher’s Note: MDPI stays neutral with regard to jurisdictional claims in published maps and institutional affiliations. |
© 2022 by the authors. Licensee MDPI, Basel, Switzerland. This article is an open access article distributed under the terms and conditions of the Creative Commons Attribution (CC BY) license (https://creativecommons.org/licenses/by/4.0/).
Share and Cite
MDPI and ACS Style
Lappe, R.; Ullmann, T.; Bachofer, F. State of the Vietnamese Coast—Assessing Three Decades (1986 to 2021) of Coastline Dynamics Using the Landsat Archive. Remote Sens. 2022, 14, 2476. https://0-doi-org.brum.beds.ac.uk/10.3390/rs14102476
AMA Style
Lappe R, Ullmann T, Bachofer F. State of the Vietnamese Coast—Assessing Three Decades (1986 to 2021) of Coastline Dynamics Using the Landsat Archive. Remote Sensing. 2022; 14(10):2476. https://0-doi-org.brum.beds.ac.uk/10.3390/rs14102476
Chicago/Turabian StyleLappe, Ronja, Tobias Ullmann, and Felix Bachofer. 2022. "State of the Vietnamese Coast—Assessing Three Decades (1986 to 2021) of Coastline Dynamics Using the Landsat Archive" Remote Sensing 14, no. 10: 2476. https://0-doi-org.brum.beds.ac.uk/10.3390/rs14102476
Note that from the first issue of 2016, this journal uses article numbers instead of page numbers. See further details here.