Article

Soil Salinity Variations and Associated Implications for Agriculture and Land Resources Development Using Remote Sensing Datasets in Central Asia

1
Key Laboratory of Ecosystem Network Observation and Modeling, Institute of Geographic Sciences and Natural Resources Research, Chinese Academy of Sciences, Beijing 100101, China
2
Hamelmalo Agricultural College, National Commission for Higher Education, Keren 397, Eritrea
3
University of Chinese Academy of Sciences, No. 19A, Yuquan Road, Beijing 100049, China
4
Earth Change Observation Laboratory, Department of Geosciences and Geography, University of Helsinki, FI-00014 Helsinki, Finland
5
State Key Laboratory of Information Engineering in Surveying, Mapping and Remote Sensing, Wuhan University, Wuhan 430079, China
6
Department of Biology, National University of Uzbekistan, Tashkent 100170, Uzbekistan
7
Department of Civil and Environmental Engineering, FAMU-FSU College of Engineering, 2525 Pottsdame Street, Tallahassee, FL 32310, USA
*
Author to whom correspondence should be addressed.
Remote Sens. 2022, 14(10), 2501; https://0-doi-org.brum.beds.ac.uk/10.3390/rs14102501
Submission received: 21 March 2022 / Revised: 18 May 2022 / Accepted: 20 May 2022 / Published: 23 May 2022
(This article belongs to the Special Issue Integrating Earth Observations into Ecosystem Service Models)

Abstract

:
Global agricultural lands are becoming saline because of human activities that have affected crop production and food security worldwide. In this study, the spatiotemporal variability of soil electrical conductivity (EC) in Central Asia was evaluated based on high-resolution multi-year predicted soil EC data, Moderate Resolution Imaging Spectroradiometer (MODIS) land cover product, precipitation, reference evapotranspiration, population count, and soil moisture datasets. We primarily detected pixel-based soil EC trends over the past three decades and correlated soil EC with potential deriving factors. The results showed an overall increase in salt-affected areas between 1990 and 2018 for different land cover types. The soil EC trend increased by 6.86% (p < 0.05) over Central Asia during 1990–2018. The open shrub lands dominated by woody perennials experienced the highest increasing soil salinity trend, particularly in Uzbekistan and Turkmenistan local areas, while there was a decreasing soil EC trend in the cropland areas, such as in Bukhara and Khorezm (Uzbekistan). The main factors that affect the variability of soil salinity were strongly associated with population pressure and evapotranspiration. This study provides comprehensive soil EC variations and trends from the local to regional scales. Agriculture and land resource managers must tackle the rising land degradation concerns caused by the changing climate in arid lands and utilise geoinformatics.

1. Introduction

Soil salinisation is a major process and a threat to land degradation, which adversely affects soil fertility. Soil salinity constitutes part of the desertification process and is a global concern, particularly in arid and semi-arid areas. Climate change can also impact erosion and salinisation, the principal processes of desertification [1]. In recent decades, human activities, especially agricultural expansion, irrigation with saline water has caused substantial damage to soil structure and resulted in soil salinisation. Approximately one-third of the global agricultural land is saline, and one billion ha of the terrestrial environment is saline, with less than 80 million ha caused due to human activities [2,3].
Soil salinization is a global environmental concern that can negatively affect sustainable land use, cropland productivity, and food security worldwide [3,4]. It is estimated that about 20% of total global croplands are salinized due to poor agricultural practices, and it is predicted that 50% of the worldwide croplands will be salinized by 2050 unless proper agricultural and land management practices are developed from local to global scales [5]. The use of accurate and high-resolution spatial distribution maps of the salt-affected area could be essential in the development of reliable action plans for the management of soil, water, and vegetation with the potential to develop data-driven policies and land resource management strategies [6].
The increase in and extent of saline croplands can accelerate land degradation and desertification, thereby threatening agricultural productivity and environmental sustainability [7,8]. According to the World Bank 2003 report from the United Nations Environment Programme (UNEP) and Food and Agriculture Organization (FAO), the areas affected by salinisation of irrigated lands in Central Asia reached 4.8 million ha (47%) of the total 10.13 million ha, with the highest percentages in Turkmenistan and Uzbekistan [9,10]. Understanding soil salinity and mapping salt-affected areas could be an essential tool for agricultural land resource management, as soil salinisation poses huge challenges for dryland crop production, particularly in Central Asia [7,10,11]. The changes in soil salinity in central Asia have had an increasing effect on the agricultural area and land development practices. For example, salinisation processes of the irrigated lands caused significant impairments in the agronomics of the arid regions; specifically, the unsustainable use of agricultural land in Uzbekistan was mainly due to the increase in the groundwater table, mineralization, and salt contents of the soil [3]. There were rising problems of sustainable utilisation and the management of land and water resources in Uzbekistan, including the impacts of unsustainable agricultural practices [12].
Mapping the spatiotemporal variability of soil salinity was problematic until the advancement of geoinformatics tools and systems. The utilisation of geographic information systems and remote sensing techniques in the last two decades has significantly improved the understanding of apparent soil electrical conductivity (EC) and the use of multiple and hyperspectral images to estimate the soil salinity of the root zone from the field to regional scales [7,13]. Many remote sensing indices from multispectral and hyperspectral images have been proposed for monitoring and mapping salinity at or near the soil surface, usually within a 0.05–0.1 m depth, with limited capacity to understand the impact on crop yield [13,14]. The EC is highly related to the dissolved salts in the soil solution, which represents the soil saturation extract, and is a typical measure of soil salinity expressed in dS/m [15]. The use of soil EC estimation, which considers the root depth through the soil profile, can be helpful for monitoring soil salinity variability. Moreover, monitoring salt-affected areas in association with land cover changes could be effective in rehabilitating saline soils and preventing further salinisation in agricultural fields [16,17].
Several studies on soil salinity in Central Asia and specific sites within the region indicate the challenges and potential of agricultural development. For instance, Funakawa and Kosaki [18] identified the potential risks of secondary salinisation in deep soil layers and predicted that secondary salinisation is more likely to occur in northern Kazakhstan with the development of an irrigation system. The Central Asian Research Institute of Irrigation recommends the application of a large-scale electro-conductivity measurement method, rather than soluble salts, for soil-salinity monitoring in Central Asia [19]. A recent study by Kulmatov et al. [2] highlighted that saline areas are progressively increasing in irrigated lands of the Aral Sea Basin, indicating a threat to potential agricultural development and food security in Uzbekistan.
The pressure on the limited agricultural land in Central Asia is growing due to the rapidly increasing population and changing climate [20]. The increase in population and expansion of irrigation practices in the region have aggravated the problem of soil salinisation and reduced the flow of major rivers, such as the Syr Darya and Amu Darya rivers, which flow to the Aral Sea [21]. Moreover, the 1–2 °C increase in temperature since the beginning of the 21st century with a high evaporation rate in Central Asia and the possible melting of glacier reserves in the Tiashan and Pamir Mountains affect agricultural development and crop production in the region [10,22].
The main factors affecting the distribution and temporal variability of soil salinity in the region require a comprehensive investigation and advanced mapping to support agricultural and land-use management [23]. There is a lack of spatiotemporal assessments of soil salinity at a wider spatial resolution for Central Asia and many other developing countries [4]. Moreover, the characterisation of the co-variants that affect soil salinity has been challenging due to changing climate and human activities. Assessing regional soil salinity changes with more focus on an indirect assessment of root zone soil salinity could be helpful in understanding soil salinity trends and drivers [24].
At present, the availability of high-resolution satellite images is advancing with the help of machine learning and the Google Earth Engine, and the use of remote sensing to detect soil salinity has become more common [8,14,15,25,26]. Although there is a need for the use of such geospatial datasets to map soil salinity at regional and local levels, these have had limited focus and applications, particularly at the regional scale. The purpose of the study was primarily to assess the electrical conductivity (EC)-based soil salinity change and variability at the regional scale, with a focus on cropland soil salinity and, secondly, to detect soil EC trends and the associated deriving factors under the impacts of contemporary climate change across Central Asia. The specific objectives of this study were to: (I) evaluate the soil salinity distributions and changes in soil EC at decadal time intervals (1990, 2000, 2010 and 2018), (II) detect pixel-based soil EC trends over Central Asia during 1990–2018, and (III) identify the main driving factors that have impacted soil EC over the last two decades.

2. Materials and Methods
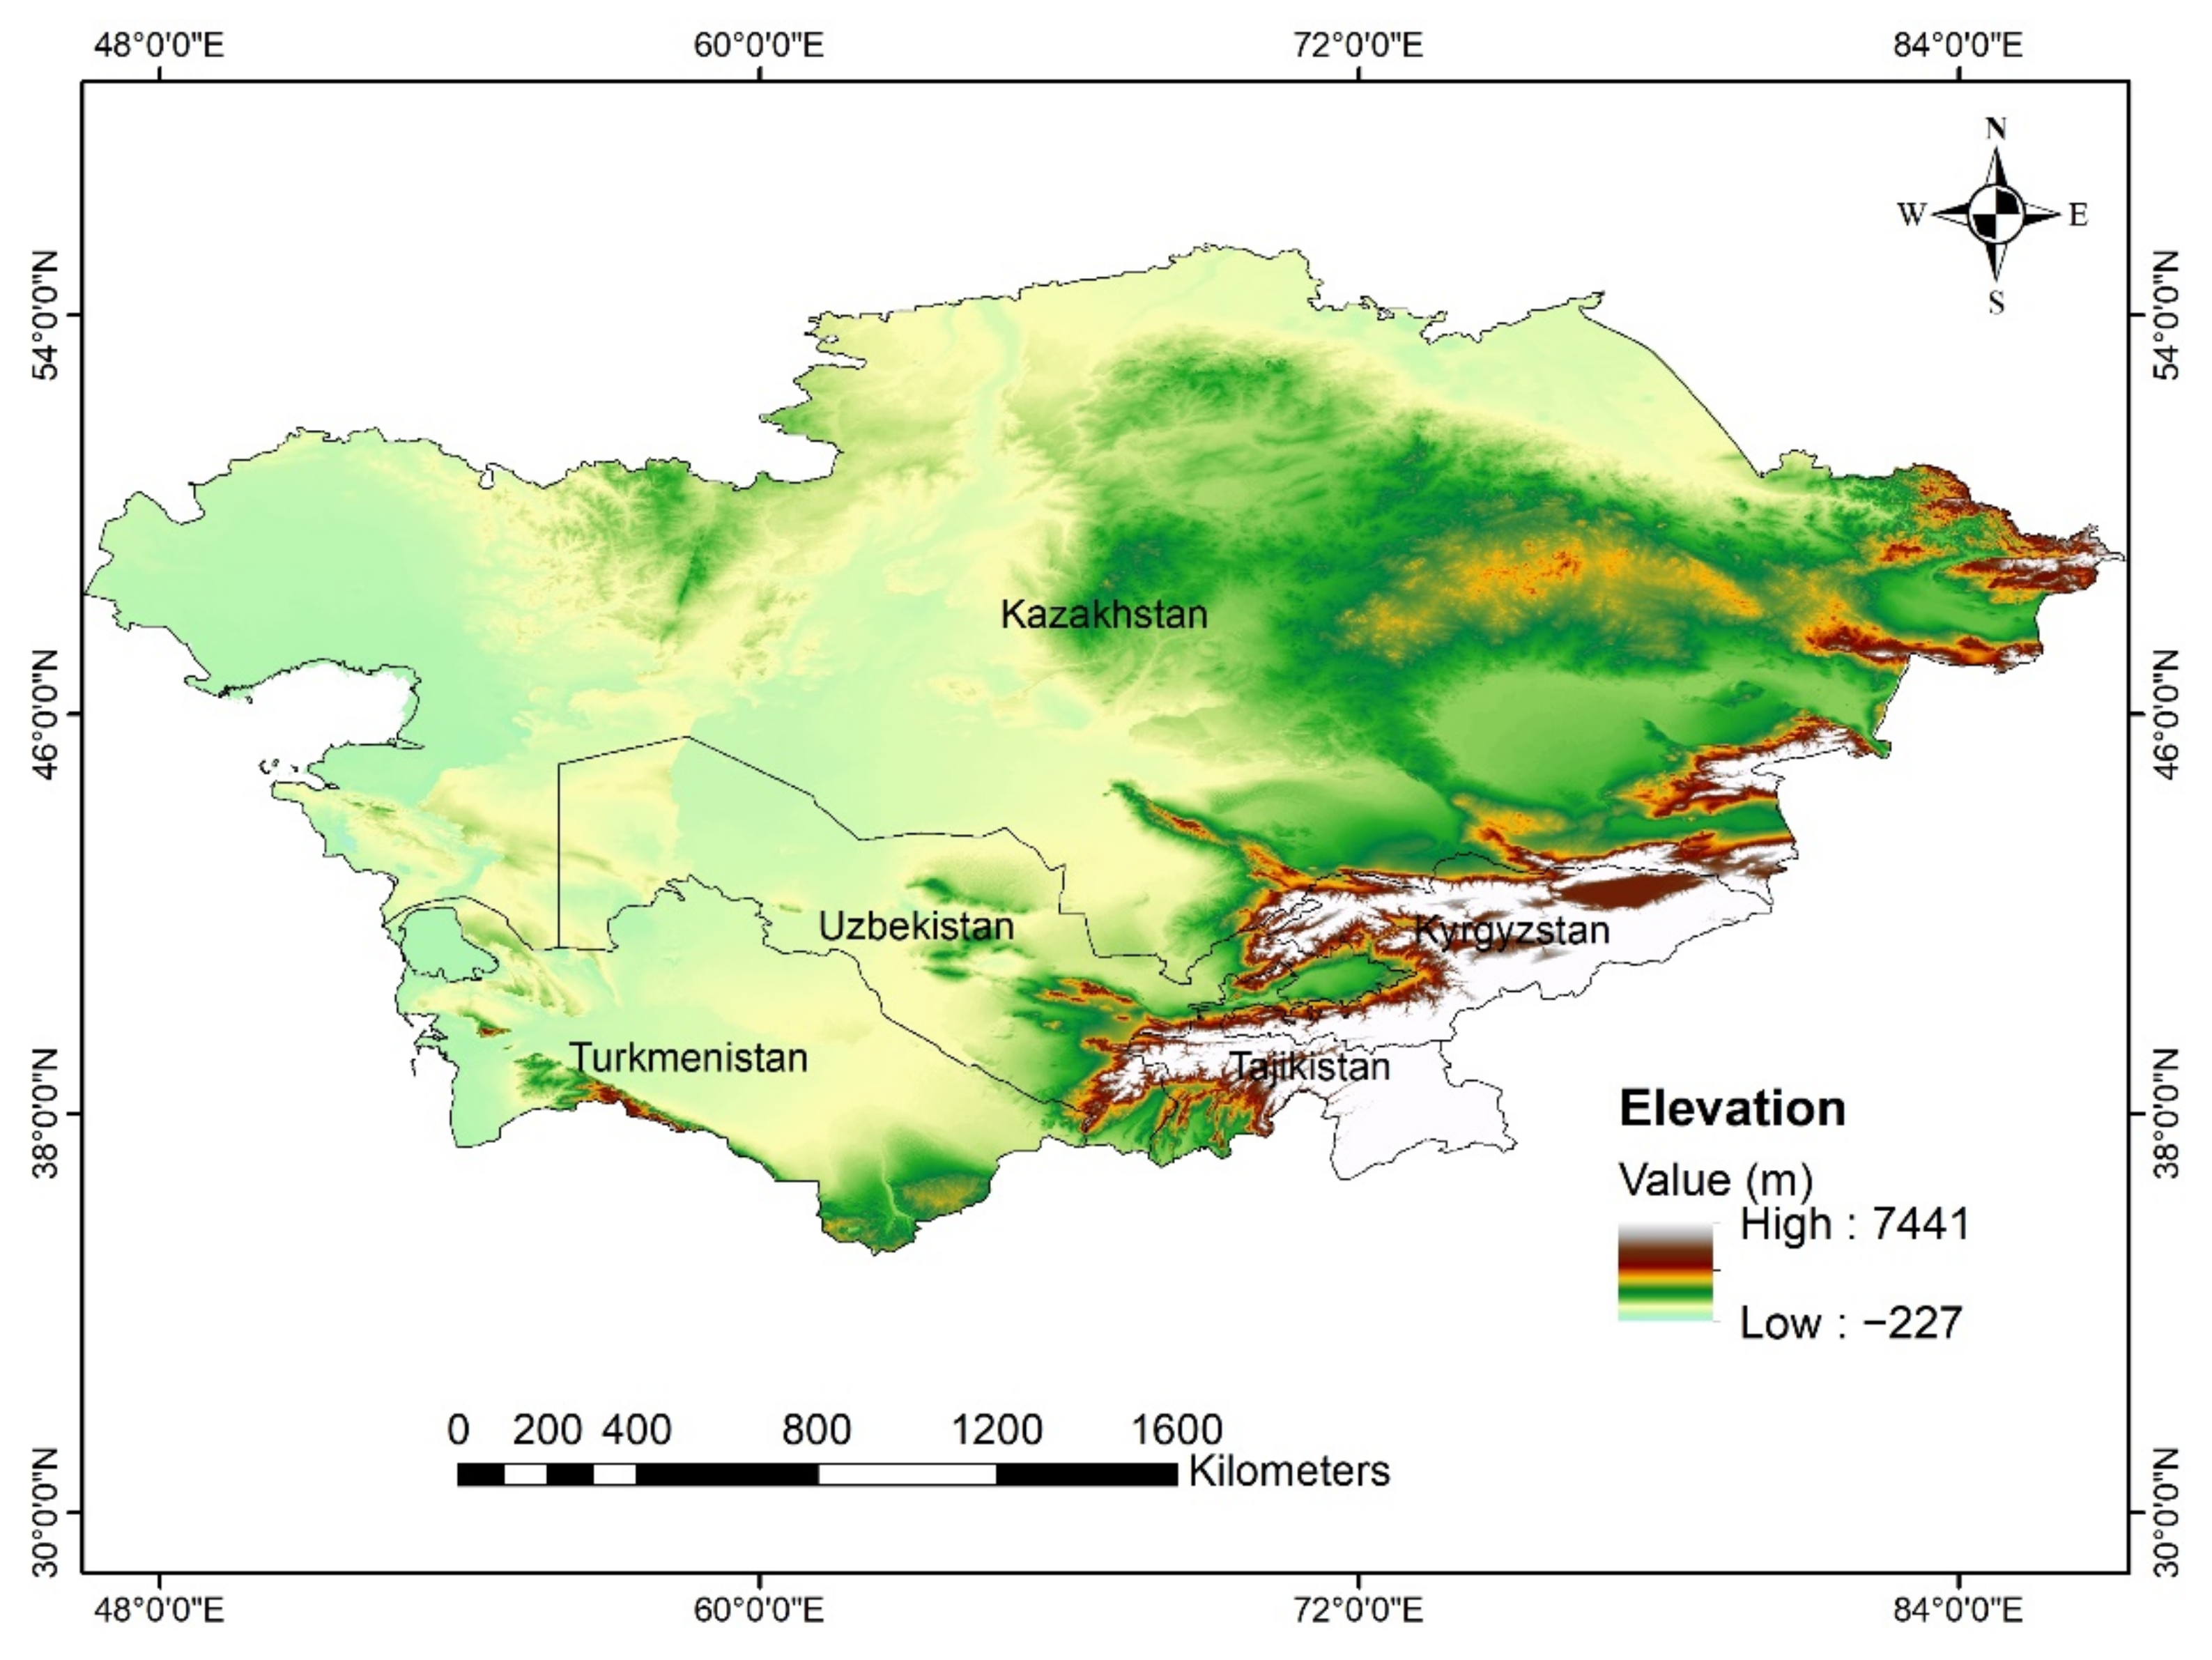
2.1. Study Area

The study area covers the inner part of Central Asia and is characterised as an arid and semi-arid region of the inland hinterland in Europe and Asia. It is bordered by China in the west, the Caspian Sea in the east, Russia in the north, and Afghanistan in the south. This region comprises five countries: Kazakhstan, Tajikistan, Uzbekistan, Turkmenistan, and Kyrgyzstan. The region’s topography is highly varied and includes high-standing mountains (Tian Shan), extended desert areas (Taklamakan), lowlands, and grasslands. The digital elevation model (DEM) extracted from the USGS Shuttle Radar Topography Mission (SRTM) ranges from below sea level in some inland deserts to 7441 m above sea level in Central Asia (Figure 1).
The region’s climate is mainly a cold desert climate (BWk) and semi-arid climate (BSk) based on the Köppen Climate Classification (2018). The average monthly precipitation is very low throughout the year, with the highest records found in March and April across the region. The average annual rainfall in Central Asia is estimated to reach approximately 273 mm [20]. The mean annual temperature ranges between −5 and 15 °C using CRU TS 4.01 (average 1950–2016), with the maxima in eastern and western lowlands of Central Asia [27].
Figure 2 shows the land-cover types in Central Asia, and 69% of the region is highly dominated by grasslands, followed by barren lands (16.5%) and croplands (5.2%). The data and percentages of each land cover are presented in Table 1. The people in this region largely depend on agricultural land; agriculture is the main economic sector in Uzbekistan, contributing 18% of the GDP, and human activities could have aggravated the problem of soil salinity, particularly in arable lowland areas [28]. The deficit of air moisture in Central Asia with the modern changing climate has favoured the preservation of salt accumulation; however, a study showed no direct relationship between the automorphic salt-affected soils and the aridity in the region [29].

2.2. Datasets

To assess the soil salinity changes over Central Asia, we accessed high-spatial-resolution soil salinity datasets (0.00833°) between 1990 and 2018, which are available at https://0-doi-org.brum.beds.ac.uk/10.6084/m9.figshare.13295918.v1 (accessed on 19 August 2020). The soil salinity datasets were prepared based on EC using a machine learning technique from various climatic, soil, topographic, and remote sensing data, which consider up to 30 cm of the soil profile [14]. Hassani et al. [14] predicted global soil EC datasets using training data, mainly at agricultural sites, and used predictive 4D models with ten-fold cross-validation to estimate the performance of fitted models with a high potential for regional analysis.
We prepared the MODIS Land Cover Type Product of 2018 using the Google Earth Engine platform based on the International Geosphere-Biosphere Program (IGBP) classification system [30] with 17 classes. High-resolution time series precipitation, soil moisture, and reference evapotranspiration (ETo) images (2000–2018) were retrieved and processed from TerraClimate monthly datasets at a spatial resolution of 4 km. The validation of TerraClimate datasets using station data has improved the overall mean absolute error and increased the spatial realism in comparison to the low resolution of gridded datasets [31]. Other essential time series data used in this study were population count images (2000–2018) from the unconstrained global mosaics dataset, at a spatial resolution of 1 km [32].

2.3. Methods

We reclassified and assessed the soil salinity EC datasets in ArcGIS software based on FAO general saline soil classifications to plant growth for 1990, 2000, 2010 and 2018. Table 2 summarizes the soil salinity classes with their corresponding EC values in dS/m, and potential effects on crop growth [33]. Even though the soil salinity classes were five, we considered the moderately saline and above classes as salt-affected soils when analysing the soil EC data.
A spatiotemporal salinity trend analysis over the study area was performed using the nonparametric statistical method of Mann–Kendal during 1990–2018. The existence of a monotonic increasing or decreasing trend was performed using the Mann–Kendal test with normalised test statistics Z to detect the temporal trend over time. We applied the trend in each pixel using a pixel-based smallest power function of the linear regression, as in Equation (1), to determine the overall variability in salinity during the last three decades.
S l o p e = n × i = 1 n i × E C i i = 1 n i × i = 1 n E C i n × i = 1 n i 2 i = 1 n i 2
where Slope represents the changing trends of the EC values, i denotes the number of years in the series, n is the number of years in the study period, and ECi is the salinity variation in the ith year. The trend significance in each pixel of the matrix was further analysed using the F-Test in MATLAB version 2016a (The MathWorks, Inc., Natick, MA, USA) at p < 0.05, and significant pixels were masked and mapped.
The salinity trend changes and salt-affected areas were examined using a detailed administrative map and the trend results were integrated with the MODIS Land Cover Type Product of 2018 [30]. Moreover, the cropland and cropland mixed with natural vegetation for 2018 were masked and cross-clipped with the same year EC dataset to identify the potential cropland area from the uncultivated lands. To identify the main factors affecting the soil salinity variations over the last two decades, a Pearson correlation coefficient (r) analysis was conducted based on total annual precipitation, mean annual ETo and soil moisture values, and annual population count (2000–2018) to the soil salinity annual EC images. All time series variables were resampled using bilinear resampling method and matched to the target resolution of the EC dataset to compute the correlations and consider the scale differences. The r test was performed using the F-Test in MATLAB R2016a at a significance threshold of p values < 0.05. One assumption is that the population count per pixel represents the population pressure and indirectly affects the variability of soil salinity over time.

3. Results

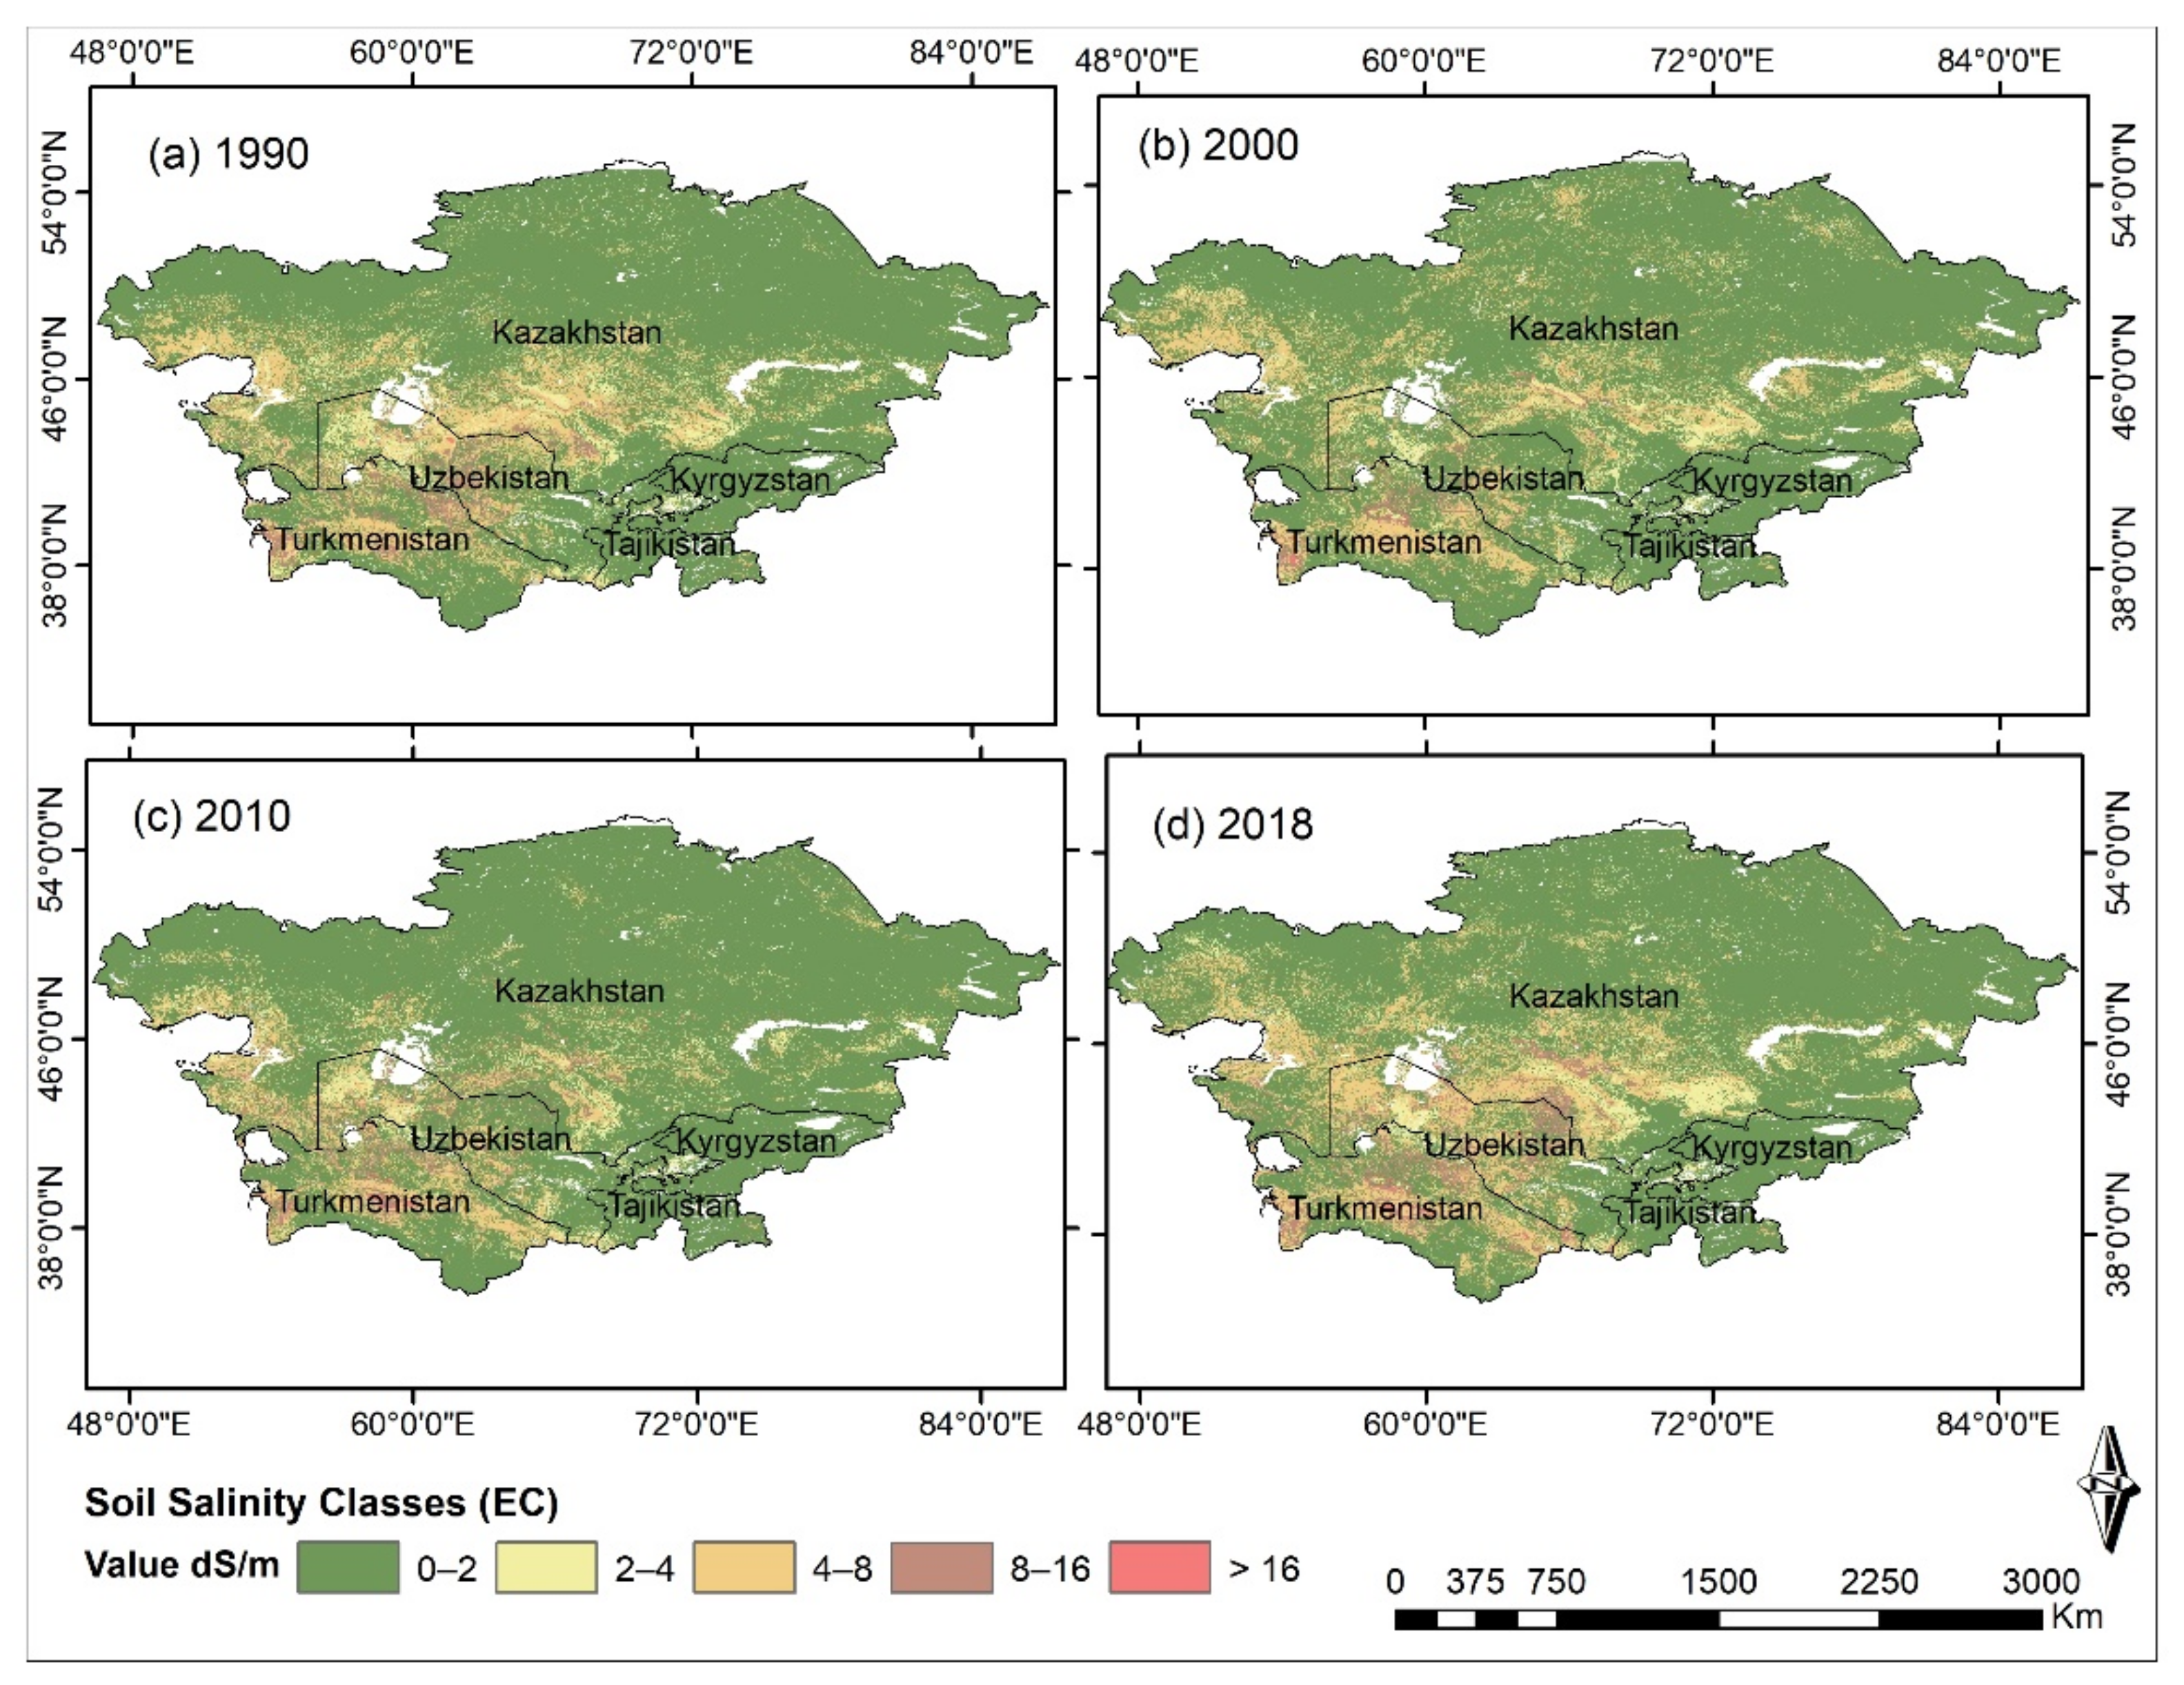
3.1. Spatio-Temporal Variation of Soil Salinity across Central Asia

Figure 3 shows the spatio-temporal distribution of soil salinity, represented as soil EC classes over Central Asia in 1990, 2000, 2010, and 2018. The classification of the soil EC datasets in the selected years provides essential information regarding their effects on plant growth. The total estimated salt-affected areas for EC > 4 dS/m were 9.7 × 10⁵ km2, 8.6 × 10⁵ km2, 7.5 × 10⁵ km2, and 11.1 × 10⁵ km2 in 1990, 2000, 2010, and 2018, respectively.
Table 3 summarises the estimated soil EC in the selected years and the decadal spatial variations in the EC across Central Asia. The highest salt-affected soils were concentrated in the south-western parts of Central Asia close to the southern vicinity of the Aral Sea Basin, as shown in Figure 3a–d. Soil EC extractions by region in 1990 represented 561,545 km2, 176,332 km2, 217,383 km2, 6460 km2, and 2827 km2 salt-affected areas in Kazakhstan, Uzbekistan, Turkmenistan, Tajikistan and Kyrgyzstan, respectively. The soil EC distributions in 2018 changed to 593,121 km2 (5.6%), 235,488 km2 (33.5%), 267,519 km2 (26.3%), 5988 km2 (−7.3%) and 2299 km2 (−18.7%) in Kazakhstan, Uzbekistan, Turkmenistan, Tajikistan and Kyrgyzstan, respectively. The extent of the extremely affected saline areas (EC >16 dS/m) continuously increased over time, with a total of 4221 km2, 5431 km2, 7561 km2, and 12,170 km2 in 1990, 2000, 2010, and 2018, respectively. Conversely, there was a slight decrease in non-saline areas from 4.2 × 10⁵ km2 in 1990 to 4.1 × 10⁵ km2 in 2018.

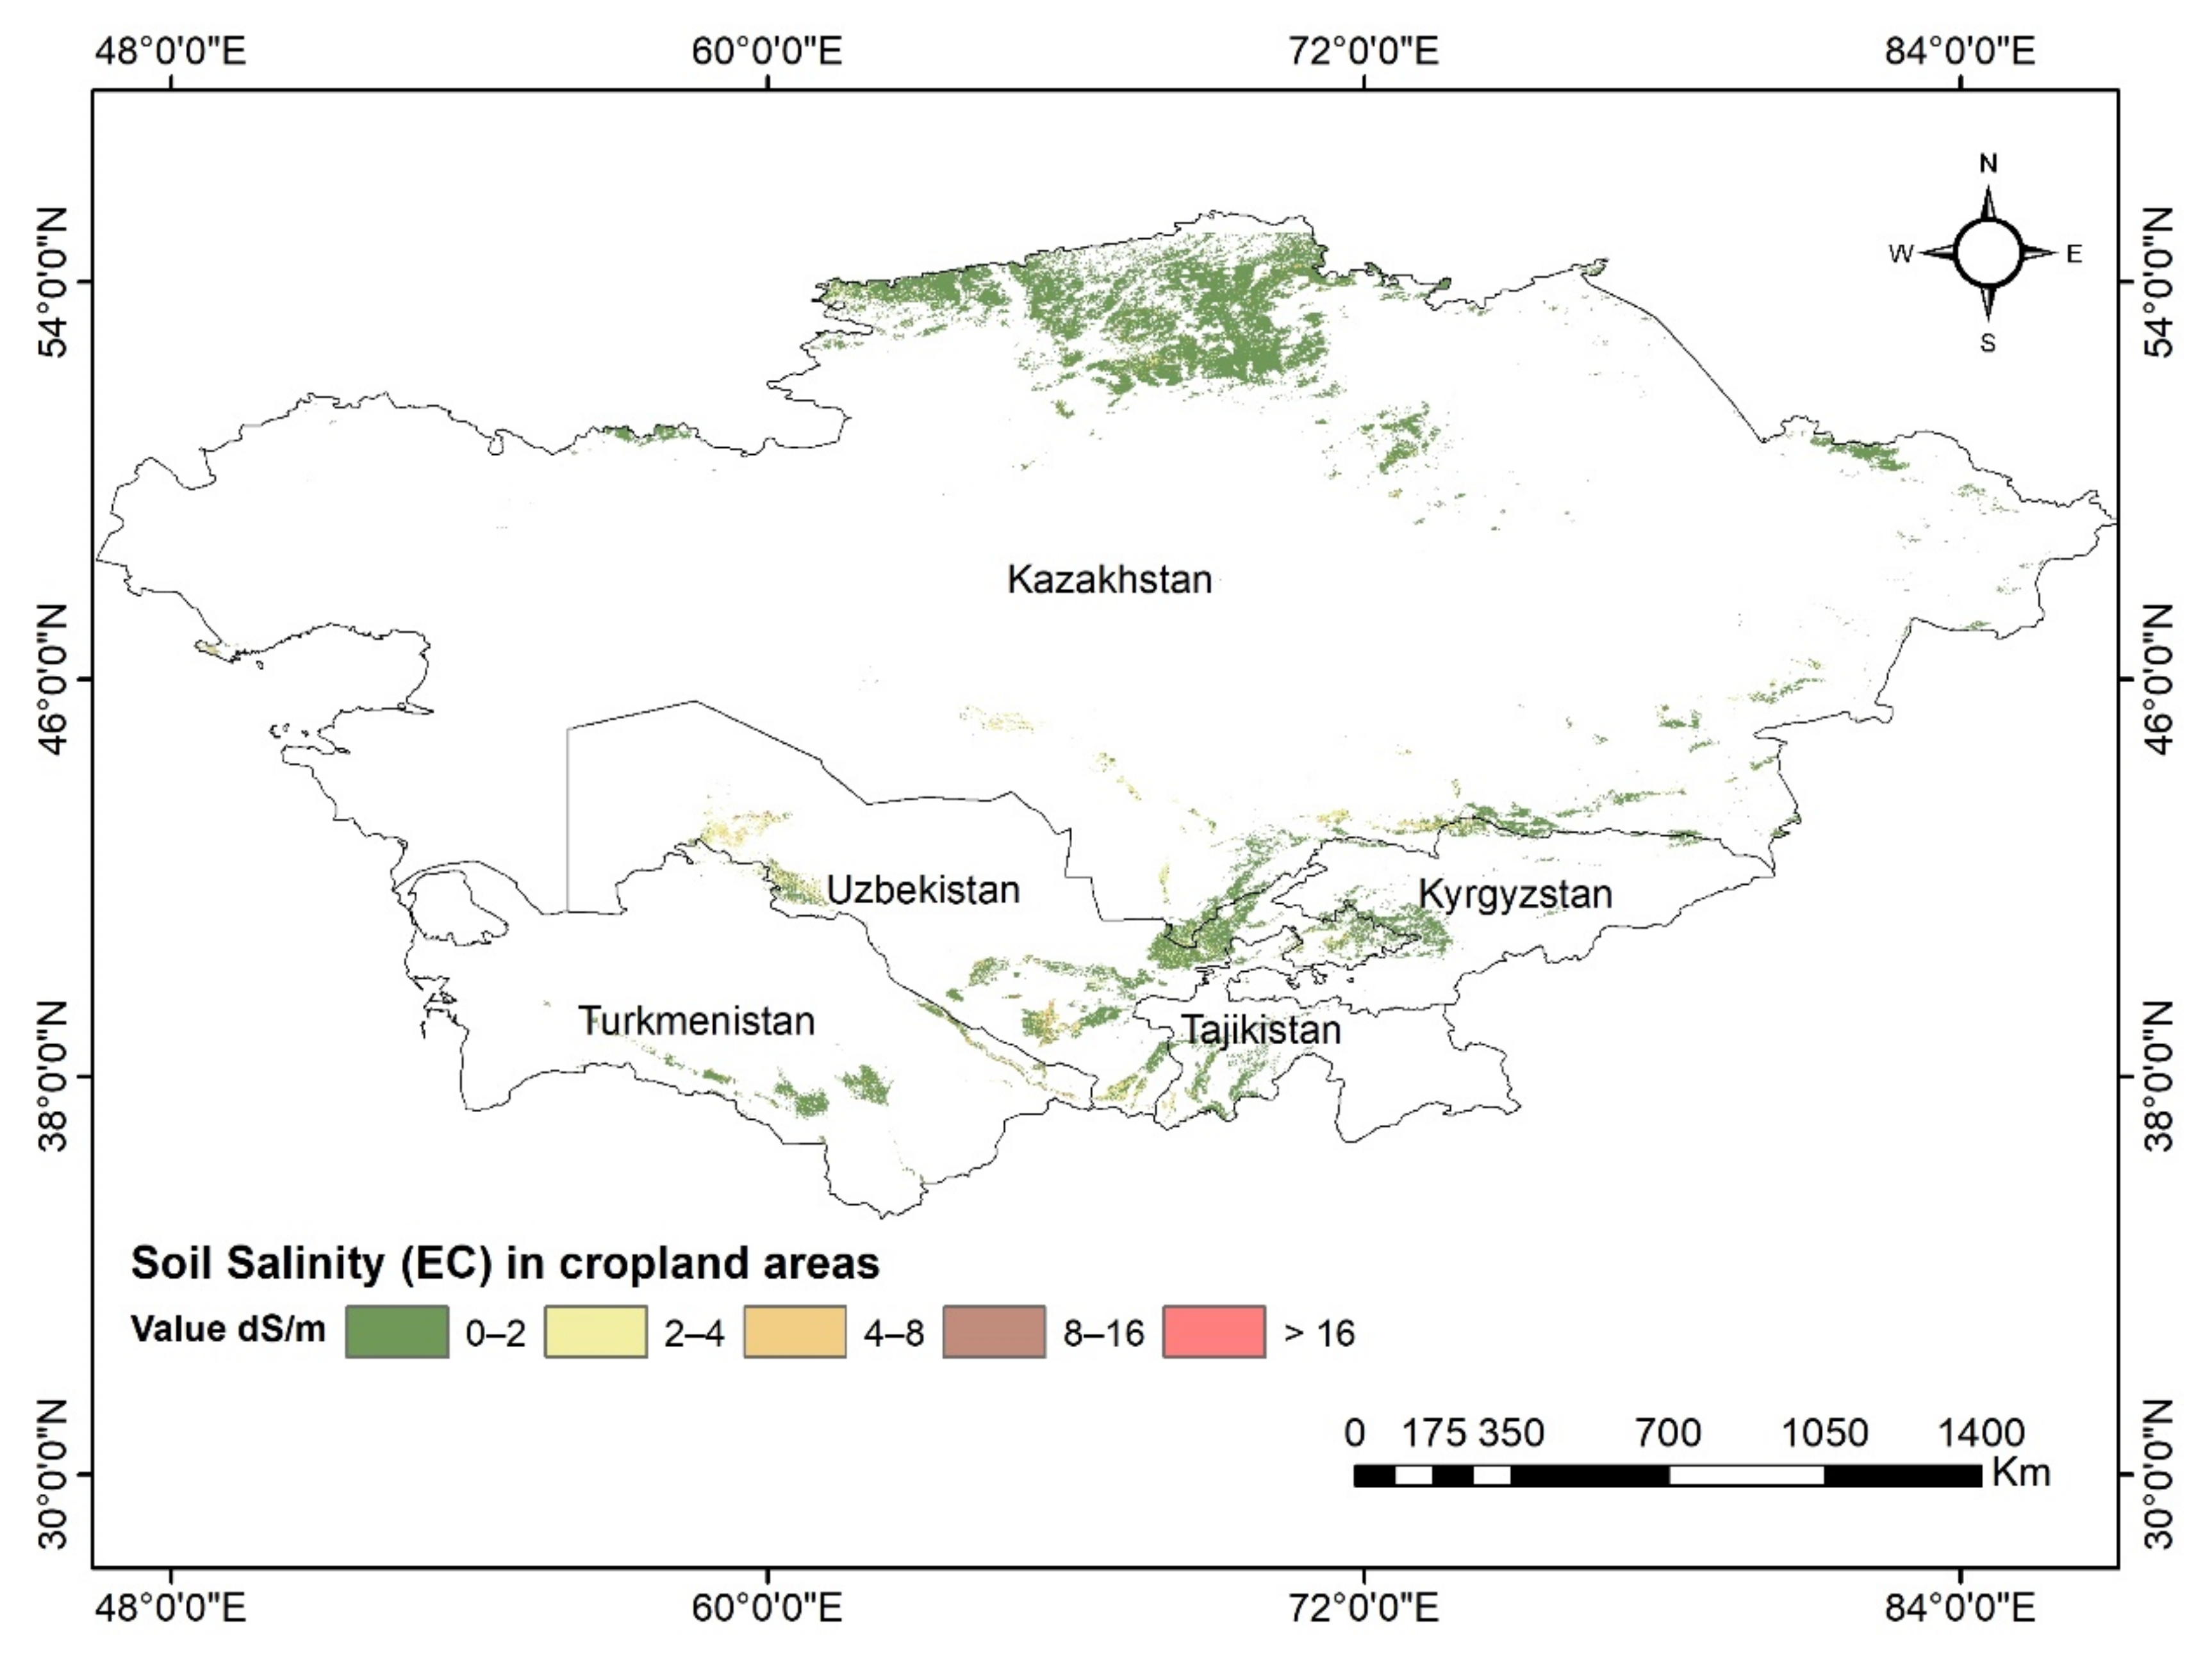
3.2. Soil EC in Cropland Areas
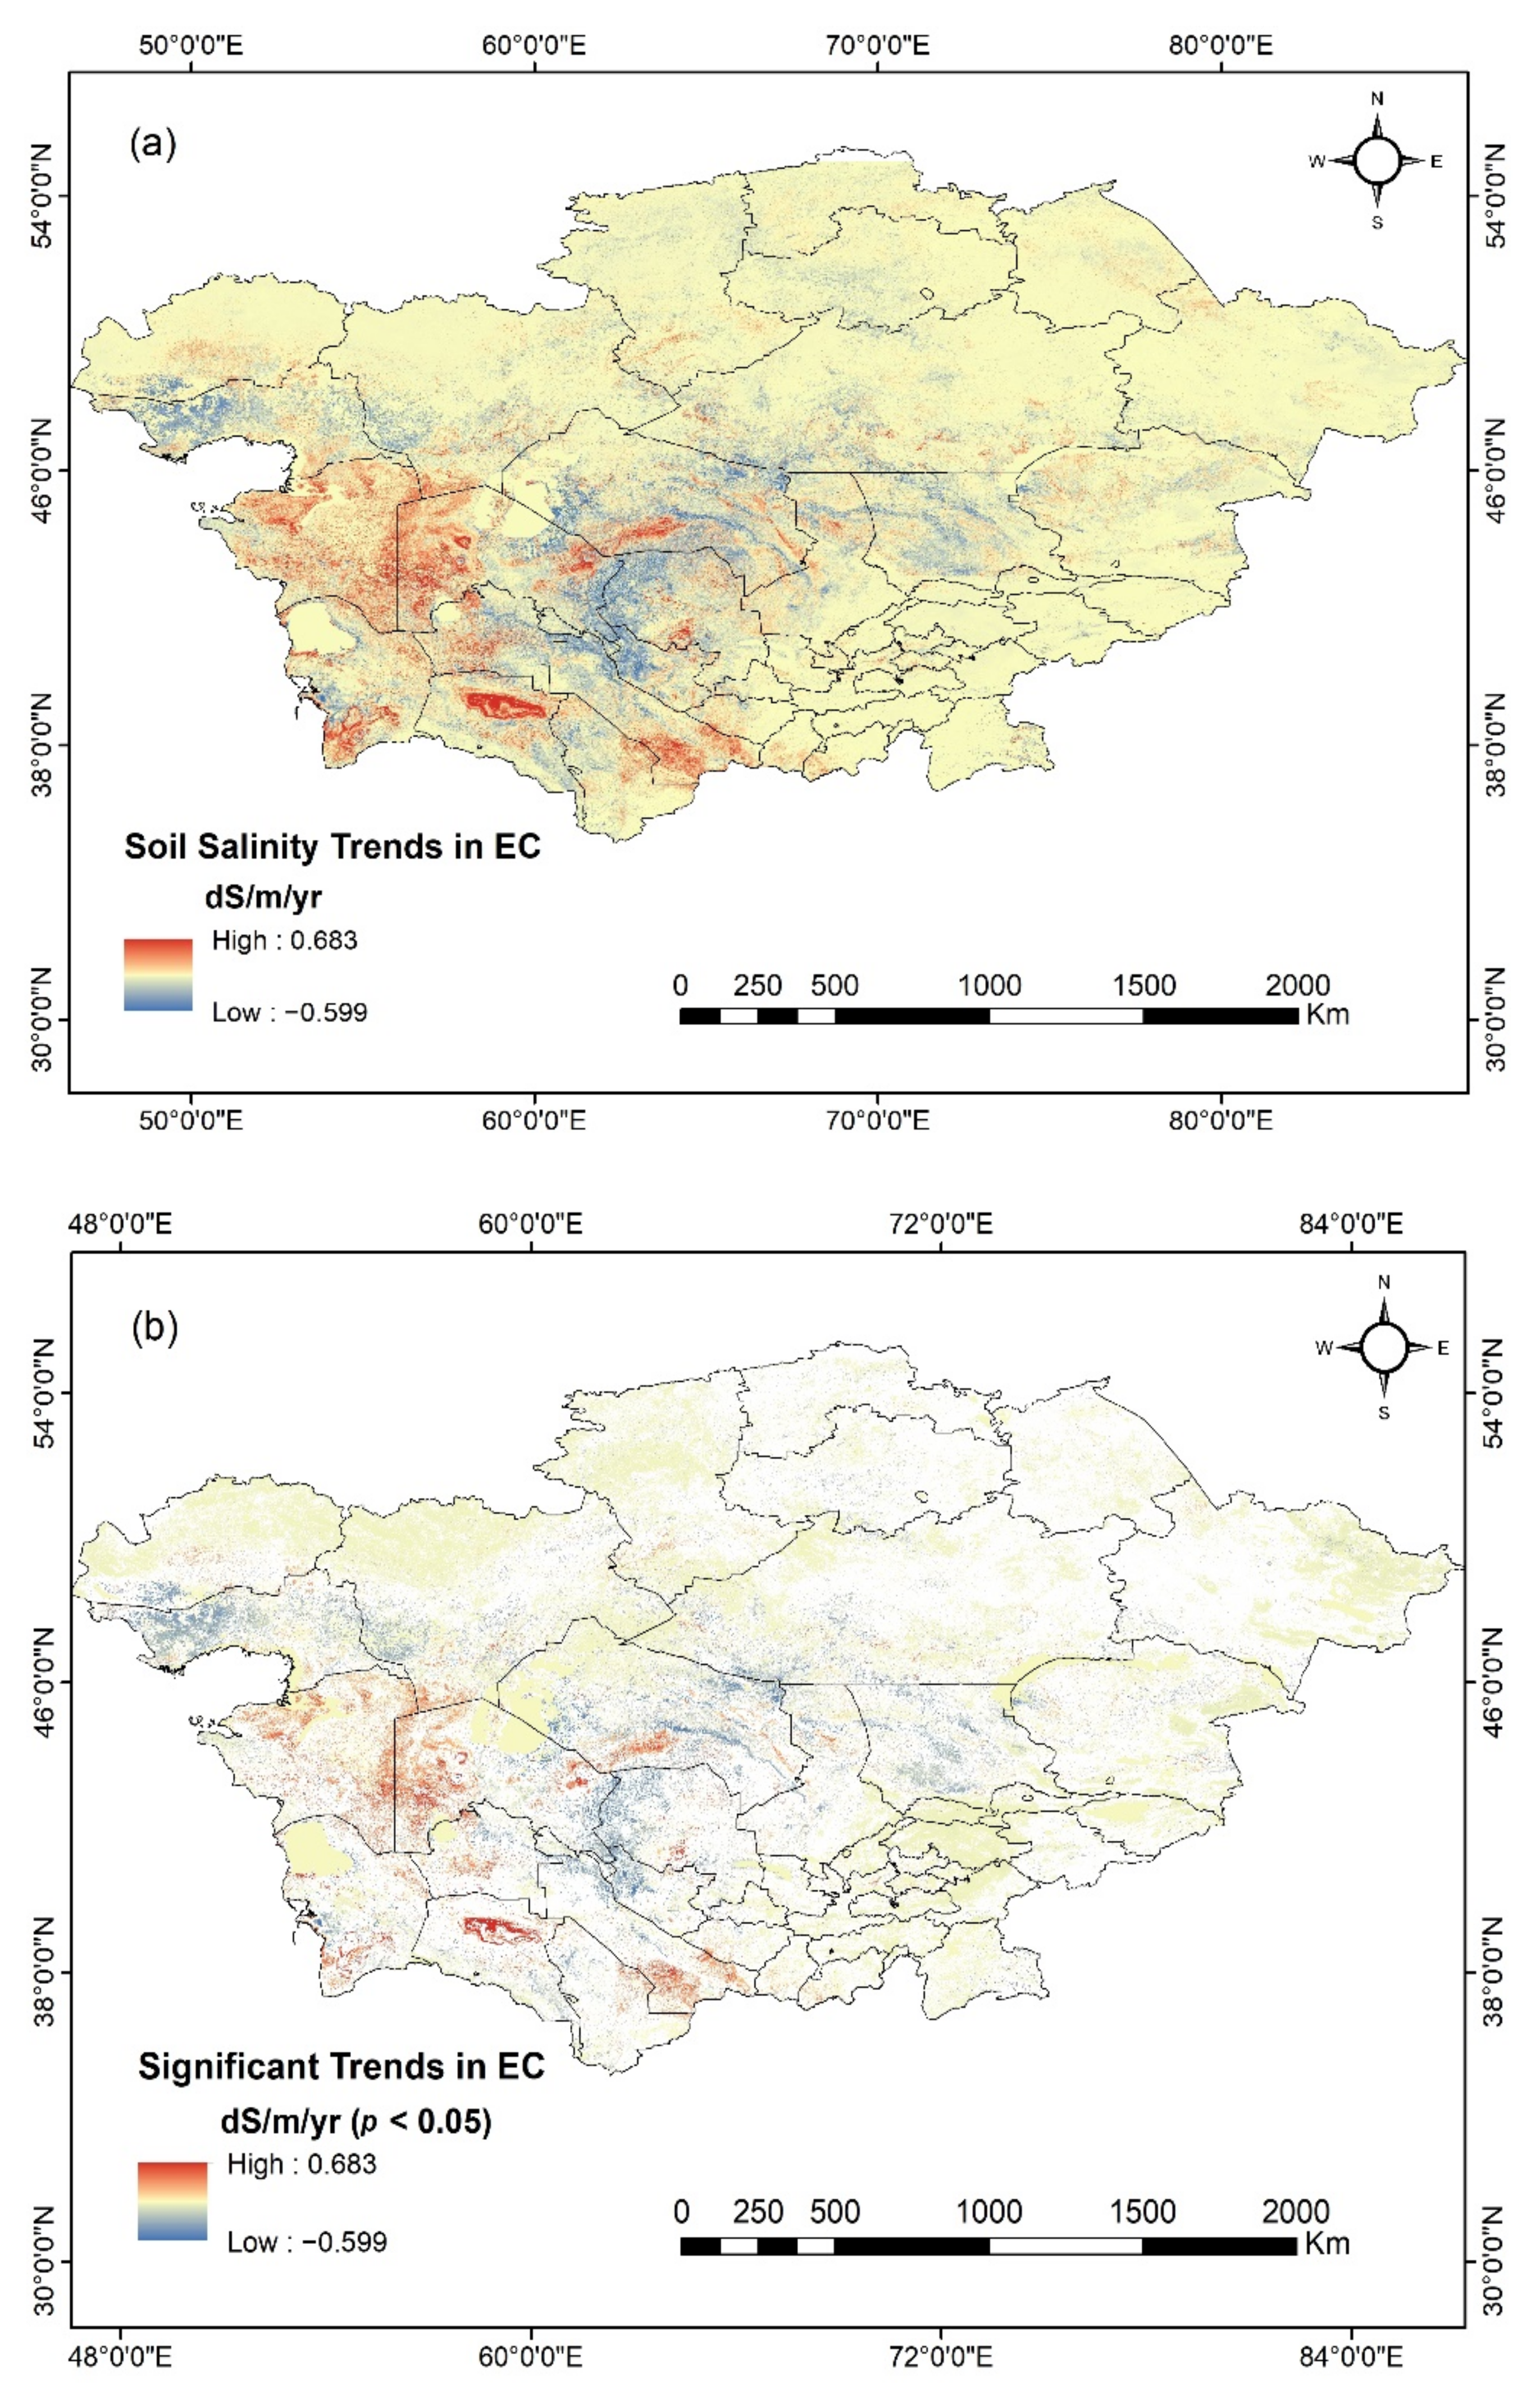
The cropland areas in Central Asia are dominant in the northern parts of Kazakhstan, south-western Kyrgyzstan, central and eastern lands of Uzbekistan, south-western Tajikistan, and some patches in south-eastern Turkmenistan (Figure 2). The cross-clip of cropland areas with the soil EC dataset in Figure 4 shows that >282,117 km2 of areas in the region were within the salinity classification (EC < 4 dS/m), while 16,108 km2 of cropland areas showed EC > 4 dS/m in 2018. Thus, approximately 5.4% of the croplands in Central Asia are salt-affected areas.

3.3. Soil EC Trends

Figure 5 demonstrates the annual trend of soil salinity and its significant changes in EC over Central Asia during 1990–2018. The pixel-based trend shows areas of increasing and decreasing soil EC in the study area, while this trend is negative on average. Approximately 33.8% of the pixels showed an increasing annual trend in soil EC, with 6.86% of the study area showing significant changes (p < 0.05). The percentage of significantly increasing soil EC pixels for each country accounted for 11.2% in Uzbekistan, 5.8% in Kazakhstan, 5.5% in Tajikistan, 1.7% in Kyrgyzstan, and 12.2% in Turkmenistan. The most significant increasing trend was found in the south-western plains of Central Asia, which indicates the growth of soil salinity over the region in the past three decades. The maximum soil salinity with a significantly increasing EC trend was found in the Navoi (Uzbekistan), Ahal, and Balkan (Turkmenistan) administrative areas. On the other hand, the lowest mean soil salinity areas with decreasing EC trends were observed in Bukhara and Khorezm (Uzbekistan).
The integration of the significant soil EC trend with the MCD12Q1 land cover product as zonal statistics reveals that the open shrublands dominated by woody perennials experienced the highest increasing soil EC trend, followed by barren lands during 1990–2018. The croplands alone, and the croplands mixed with natural vegetation, showed a decreasing trend in soil EC, with average values of −0.006 and −0.009 dS/m per year since 1990, respectively. However, there were croplands with a minimum soil EC trend value of −0.003 dS/m per year.

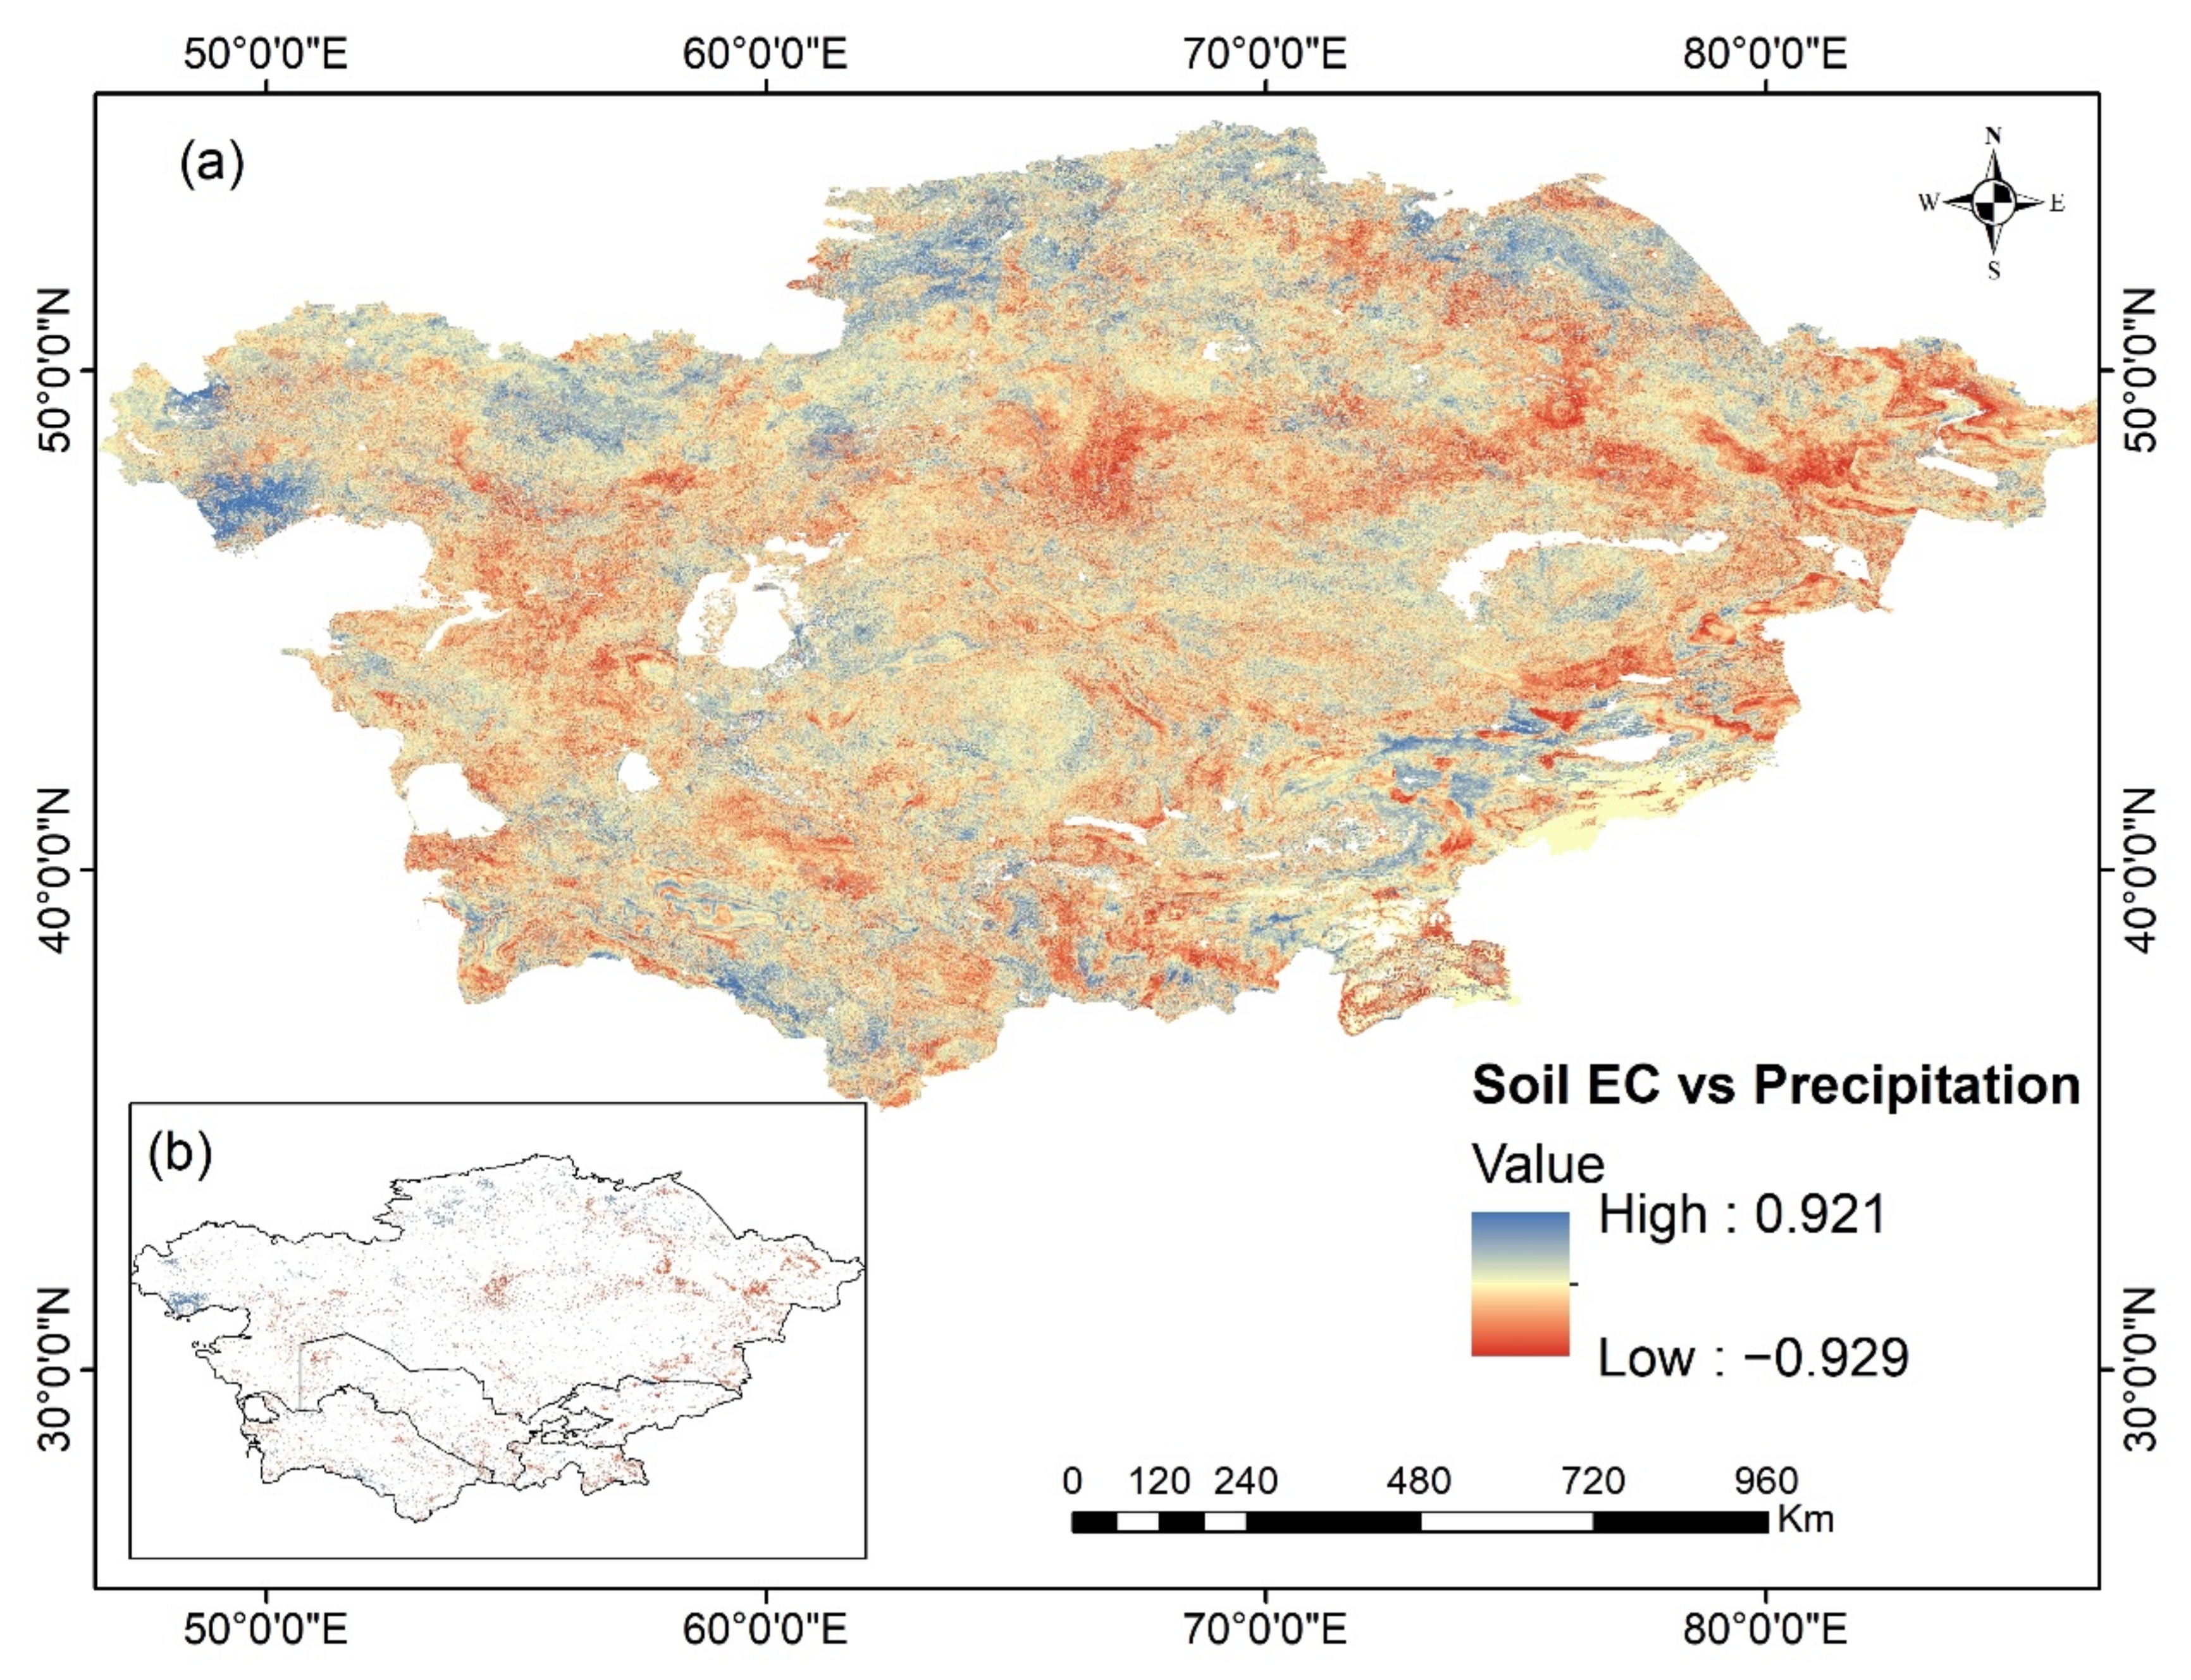
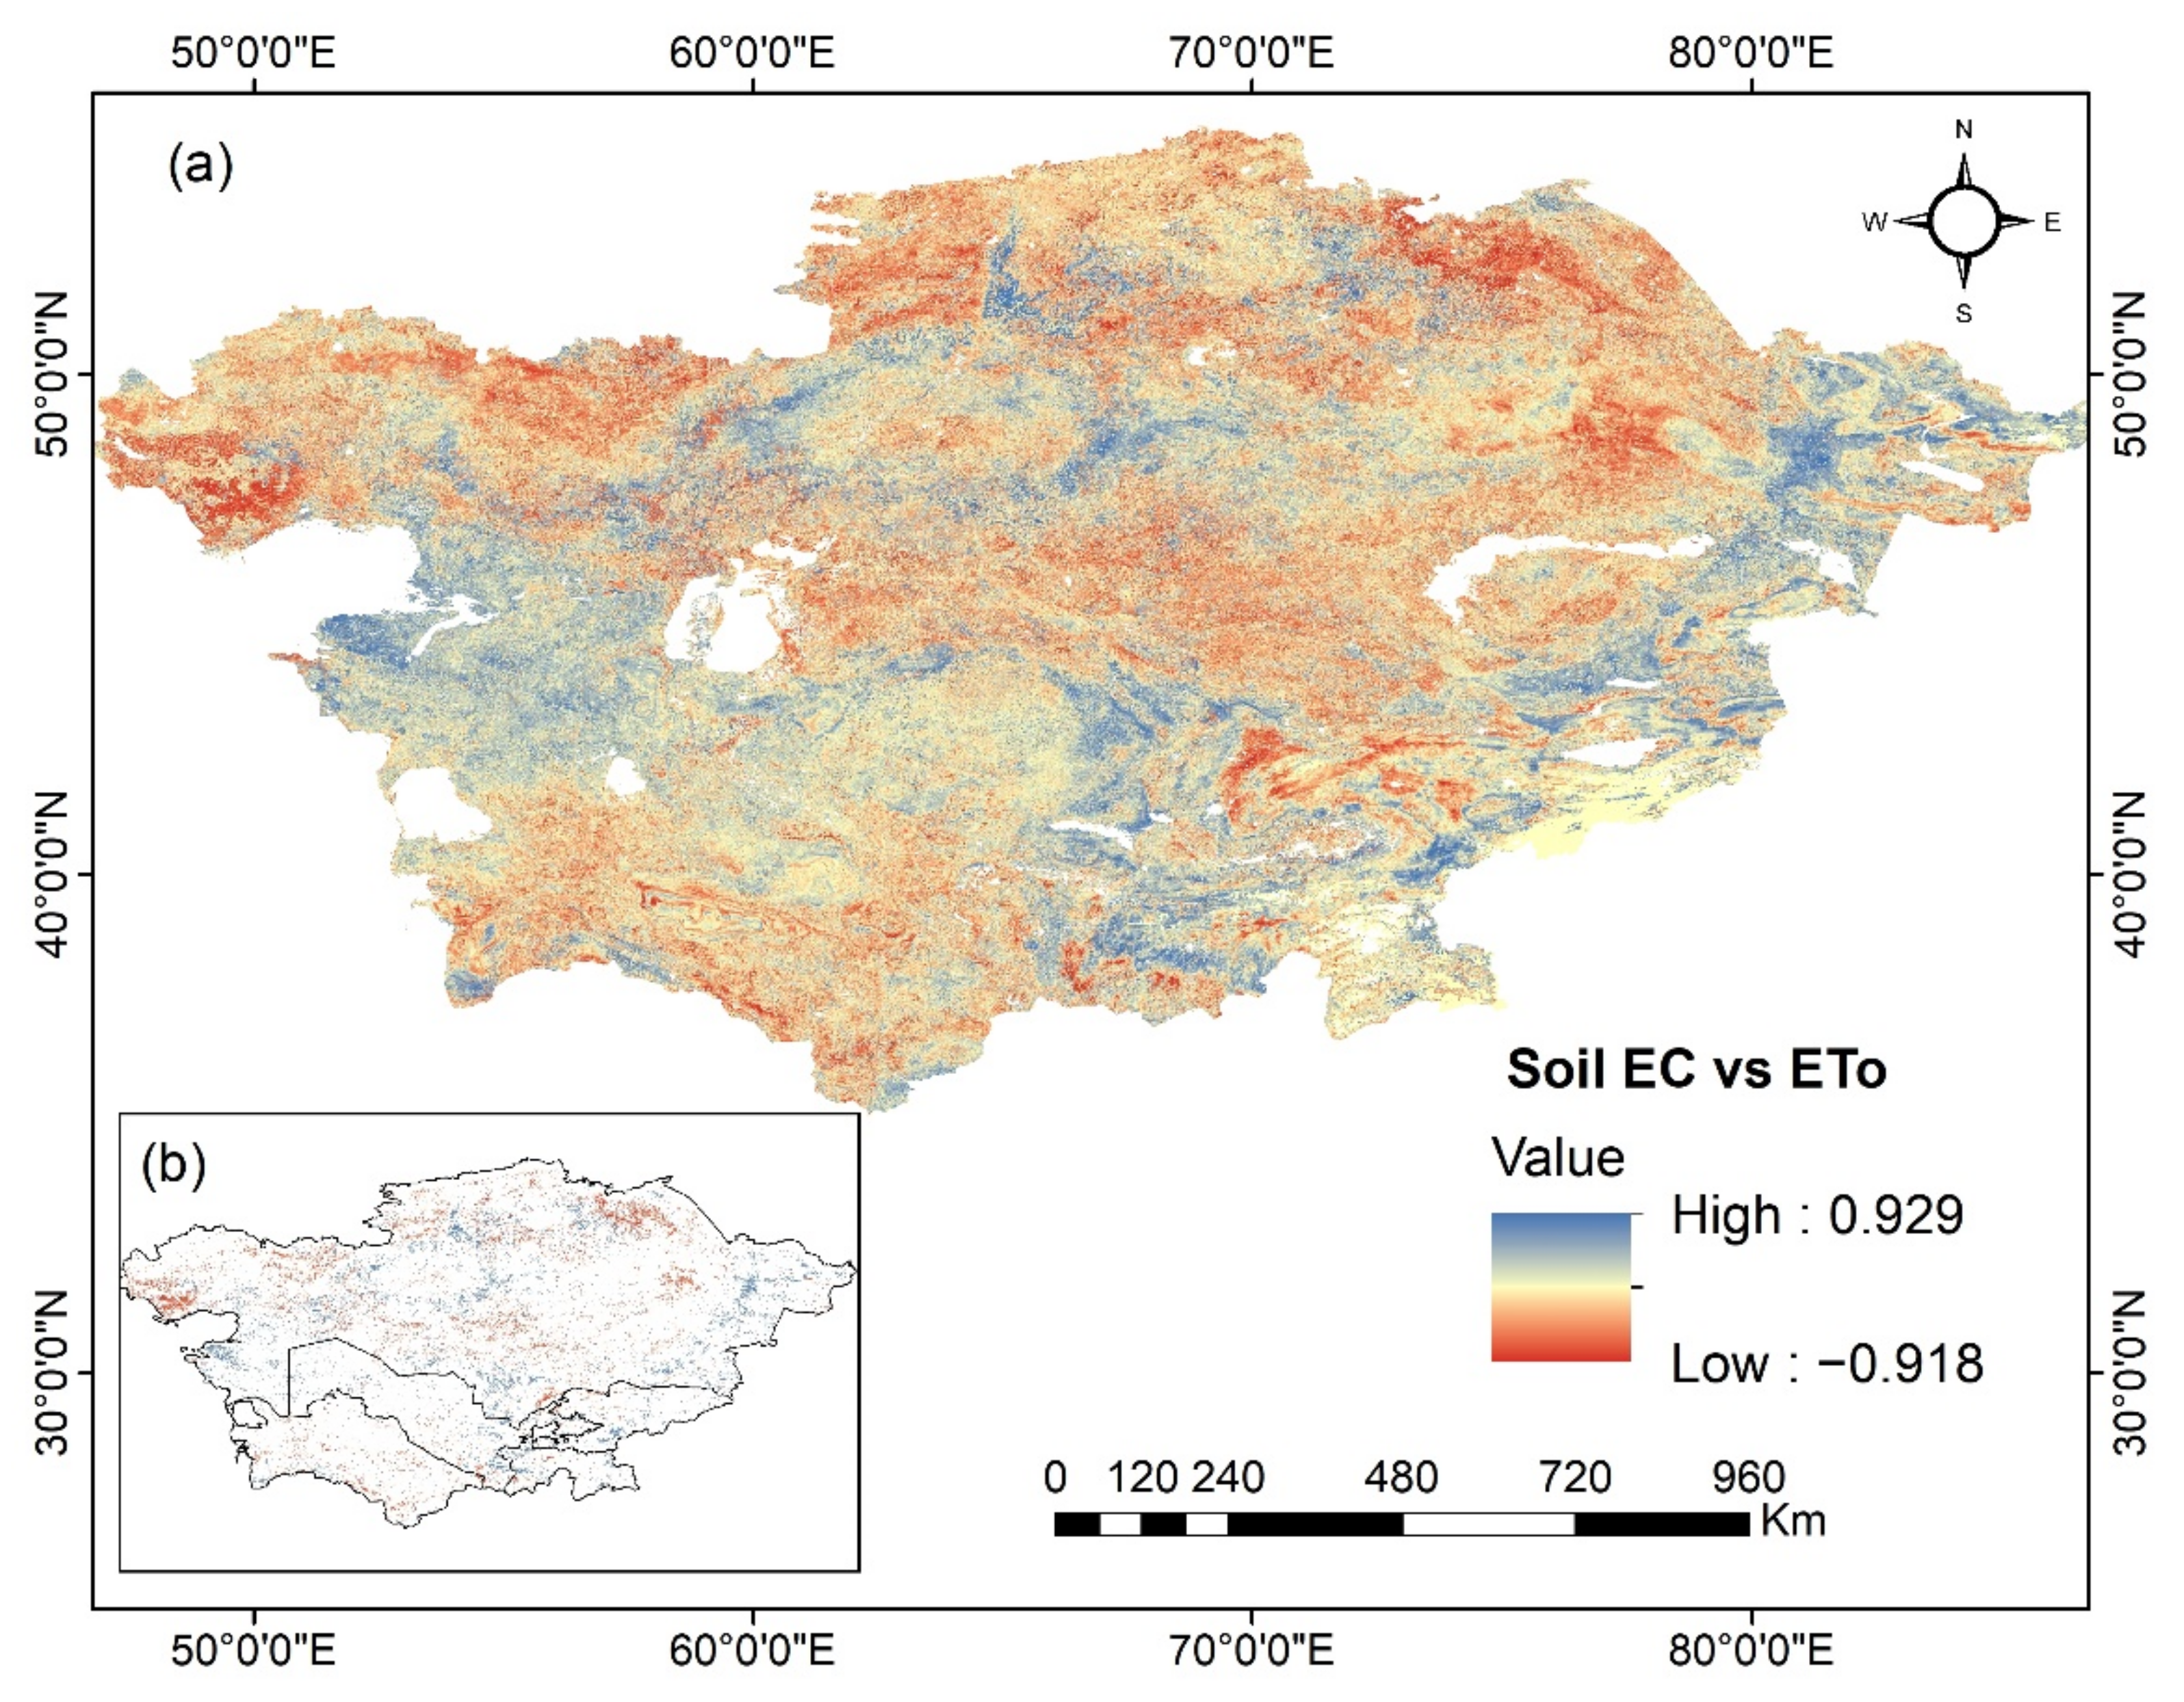
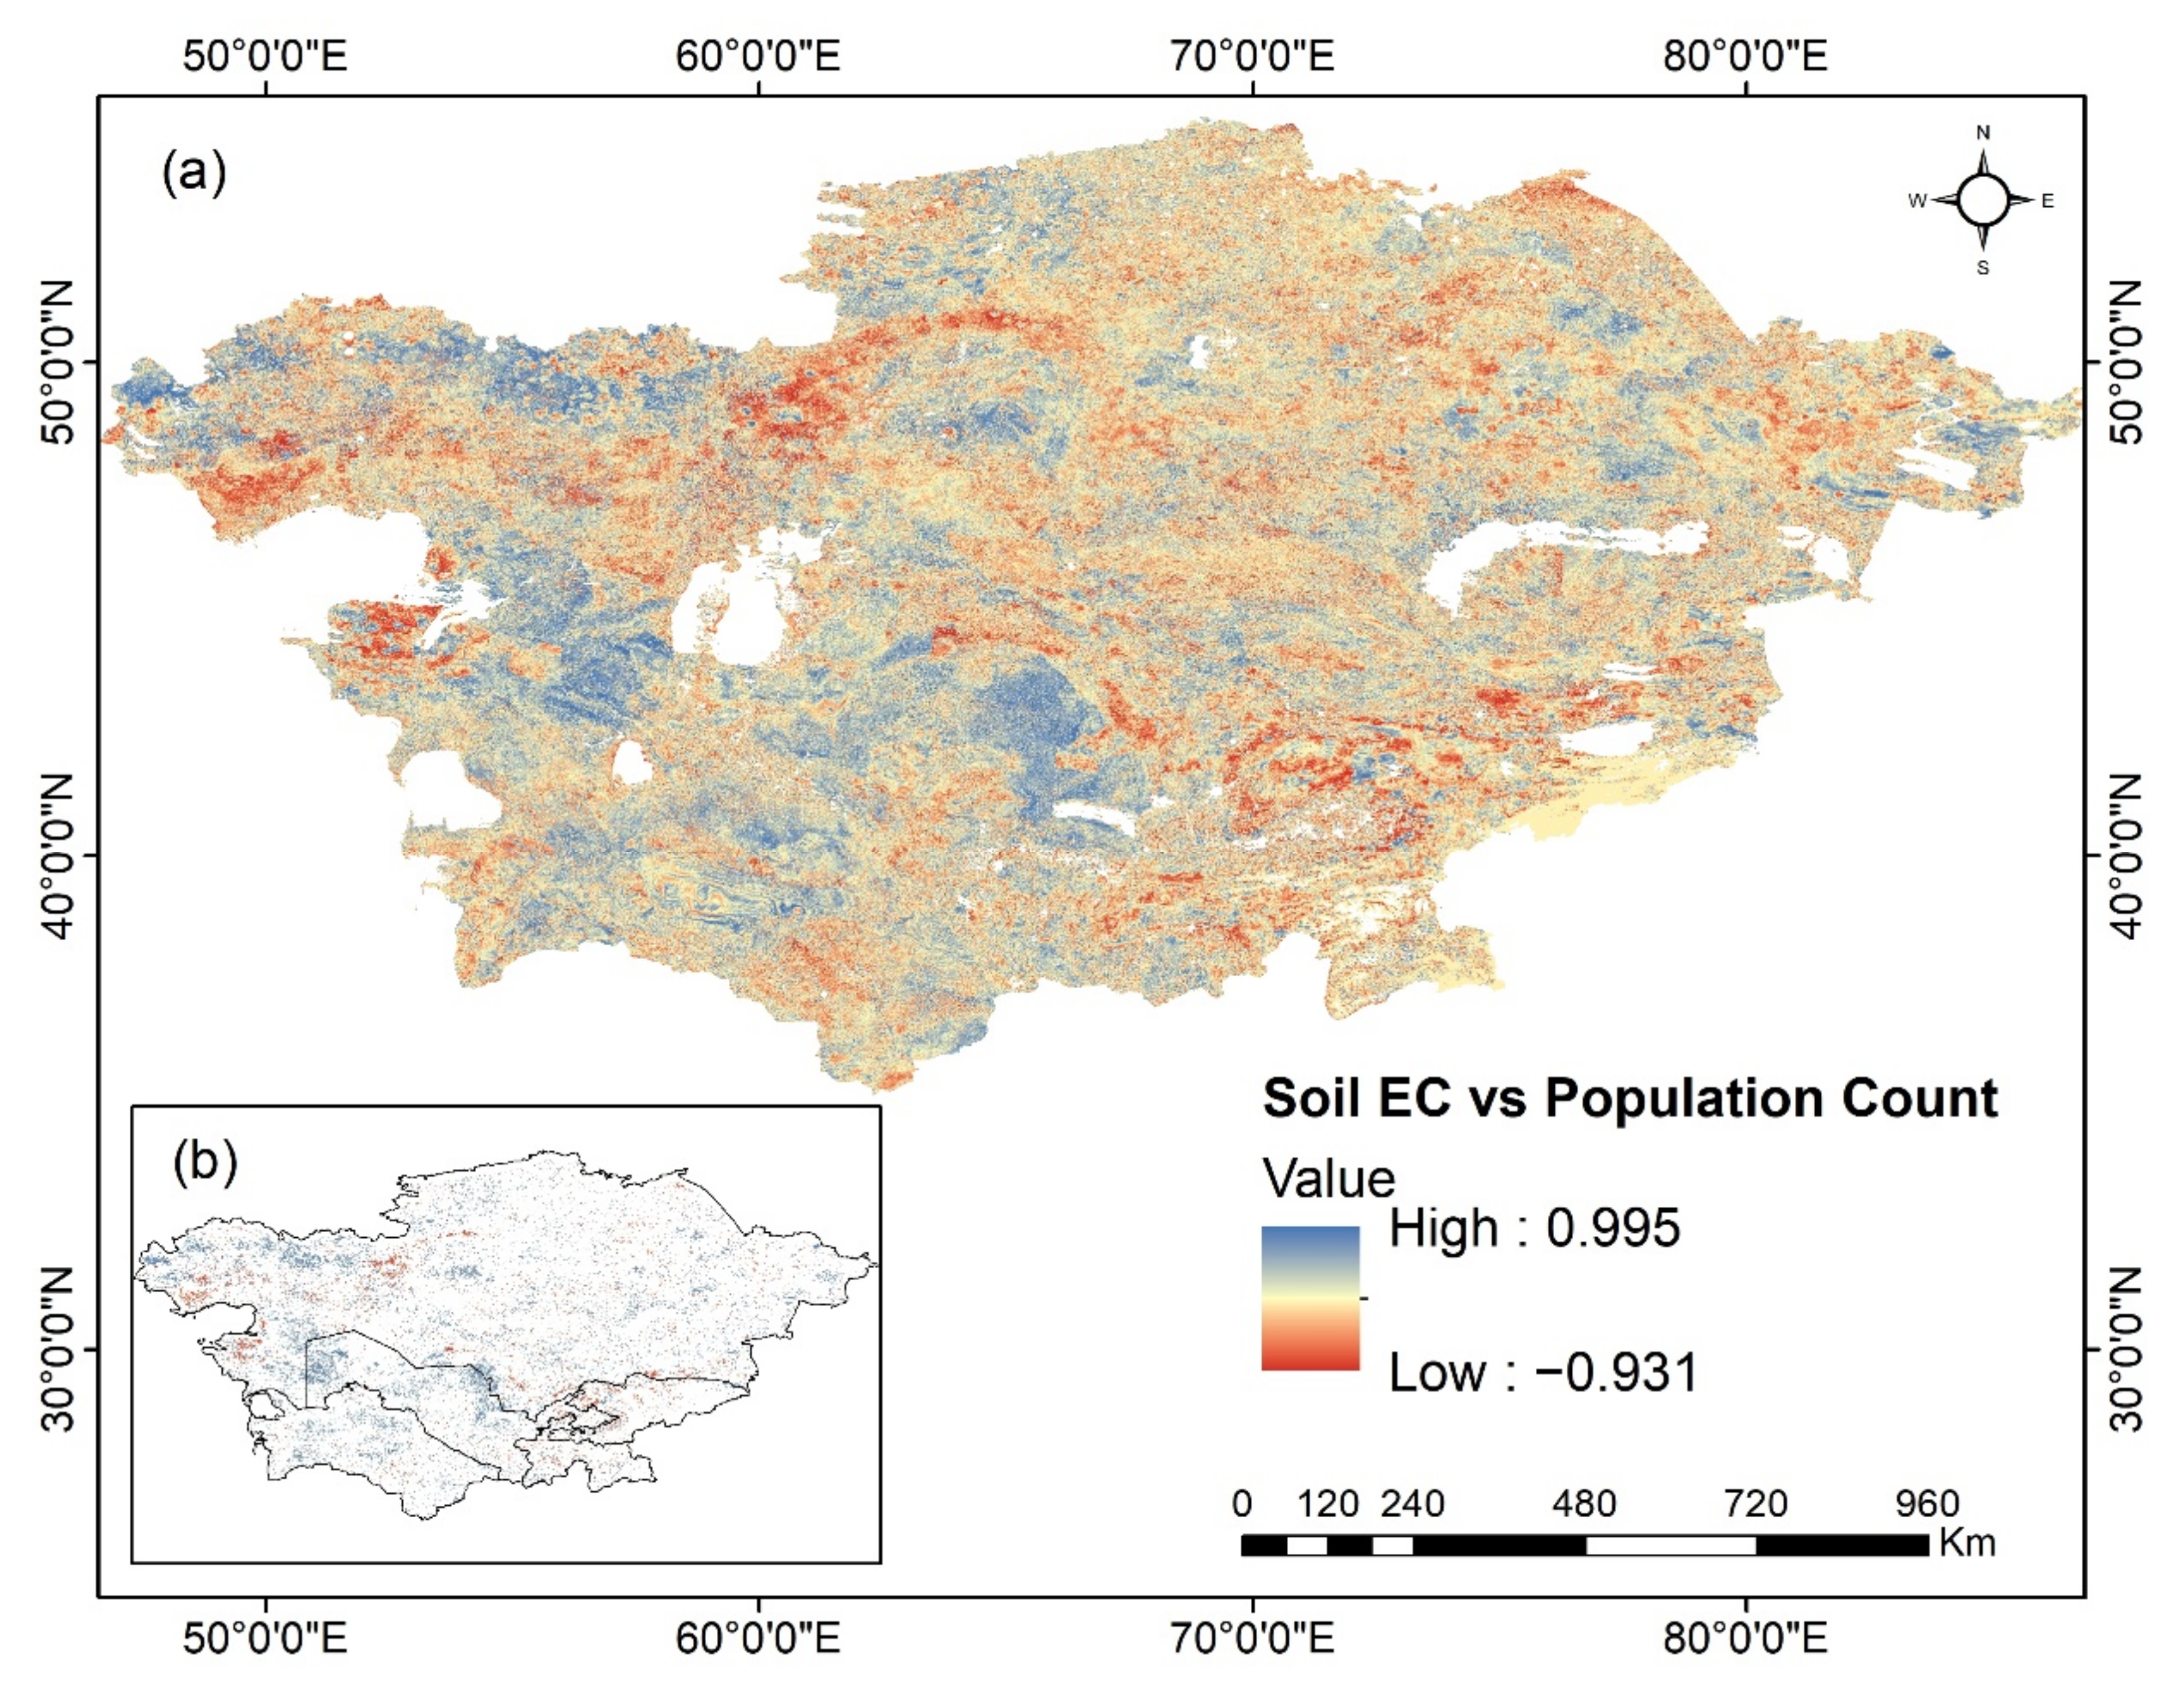
3.4. Factors Affecting Soil EC Variations from 2000 to 2018

To characterise and understand the factors affecting soil salinity variations and spatial relationship over time, we considered four main variables, conducted a Pearson correlation analysis at the pixel level during 2000–2018 in Central Asia, and masked significant change maps.
In total, 57.8% of the study area in Figure 6a shows a negative correlation between soil EC and annual total precipitation, of which 7.9% of the pixels showed significant changes (Figure 6b, p < 0.05). The total annual precipitation estimates based on the terra climate dataset for the study area ranged between 62 mm and 1068 mm from 2000 to 2018, with an average value of 257 mm and a standard deviation of 129. Based on zonal statistics using land cover types (Figure 2), the correlation between soil EC and precipitation was the most negatively and significantly correlated in the closed shrubland biome, whereas the correlation was positively and significantly correlated in the cropland area. At the country level, the correlation between the two variables was the most significant and negative in Tajikistan, followed by Kyrgyzstan.
In contrast, 47.8% in Figure 7a demonstrates a positive correlation between soil EC and mean annual evapotranspiration (ETo), with significant pixels of 10.5% (Figure 7b). The correlation between soil EC and ETo showed the highest mean positive values and significant changes in the open shrubland and cropland mixed with natural vegetation, while it was the most negative and significant in closed shrubland, followed by the savannah of Central Asia. The correlation between these two variables was highly significant and negative, particularly in Turkmenistan and western Kazakhstan.
In Figure 8a, 57.7% of the study area also reflects a positive correlation between soil EC and population count, of which 15.42% showed significant changes (Figure 8b). The population has been increasing since 2000, and the population count has the highest significant positive correlation with soil EC in comparison to the other factors, especially in Uzbekistan and Turkmenistan. The correlation between the two variables in Figure 8 showed the maximum significant and positive values in the grassland and cropland biomes.
Similarly, Figure 9a shows a positive correlation between soil EC and soil moisture in 52.46% of the study area, with significant changes representing 7.84% (Figure 9b). The highest positive and significant correlations were observed in cropland mixed with natural vegetation and evergreen needle leaf forests, particularly in Turkmenistan and Kazakhstan. The soil moisture threshold can highly affect and control the stability of above- and below-ground interactions in the temperate desert of Central Asia [34].

4. Discussion

4.1. Evaluation of Salt-Affected Areas

Variability was observed in the salt-affected areas in all classes and selected years (Figure 3). The salt-affected areas in Central Asia (Table 2) comprised 17.6%, 15.7%, 13.6%, and 20.1% in 1990, 2000, 2010, and 2018, respectively. There was an overall increase in salt-affected areas between 1990 and 2018 for land cover types, and this expanded by 5.4% for croplands in 2018. The decrease in 2010 could be more associated with the impacts of climate variability, changing groundwater level, and variable soil leaching changes [28]. Haag et al. [27] found that the annual temperature increased at a rate of 0.28 °C per decade, while the annual precipitation increased by 3.13 mm per decade in Central Asia. The groundwater table could also affect the variability of the salt-affected area; for example, in the Bukhara region (Uzbekistan), groundwater salinity was 3.53 g/L and 2.83 g/L in 2001 and 2013, respectively [28].
Our findings related to the continued growth in the extremely affected saline soils in Central Asia, which correspond with a study on soil salinity field observations over three years (1996–1998) in Central Asia through the Water Use and Farm Management Survey subproject [19]. Similarly, Latonov et al. [25] reported significant growth in moderately and highly saline soils in the central parts of the Syrdarya Province of Uzbekistan during 2000–2011. In comparison to previous records of saline soils in Central Asia, our estimates are low, as soil EC values may not consider salt contents in the deep soil profiles. According to data summarised in 2004 for Central Asia, the combined moderate and severely saline irrigated lands accounted for 45% of the total arable agricultural lands [21]. A recent study in the Syrdarya Province of Uzbekistan also confirmed the moderately saline irrigated areas experienced a rapid decline of nearly 17.4% from 16.4% in 2015 [3].
Apart from the decadal variations in salt-affected areas in Central Asia, the spatial characterisation of soil salinity can be essential for land resource management and actions. The spatial distributions of salt-affected lands under the extremely saline category, such as those apparent in Uzbekistan and Turkmenistan and some parts of Kazakhstan (Figure 3d), have strong implications for land resource planning and targeting local areas. Land salinisation in Central Asia is a common problem that affects the irrigated areas of Kyrgyzstan, Uzbekistan, and Turkmenistan [8,22].
Other studies have also identified extensive distributions of the salt-affected areas in the Aral Sea Basin, Khorezm irrigated lands, and Bukhara Province in Central Asia [13,21,28], which correspond to the decadal variability and increments in our findings. Although the salt-affected areas are still abusndant in Bukhara and Khorezm, the decreasing soil EC trends in these areas are due to the annual salt leaching from the irrigated lands, which is carried out up to three times in late autumn and early spring seasons. This implies that soil salinity has been a barrier to agricultural development in areas that may affect food production in the region.

4.2. Soil Salinity Variations and Associated Implications

The increasing soil EC (Figure 5) indicates severely saline soils that need critical attention and highlight the need for food security planning, while non-saline areas with the lowest EC values imply potential for agricultural development. A local study in the Aral Sea Basin confirmed that saline areas showed a progressive increase in irrigated lands, whereas non-saline irrigated areas in Syrdarya Province negligibly increased, accounting for only 3% throughout the years [2].
The soil salinity trend (Figure 5b) indicates that the soil EC trend significantly increased, particularly in the Novoi Province of Uzbekistan and Ahal and Balkan provinces of Turkmenistan. Meanwhile, the soil EC trend decreased in the Bukhara Province of Uzbekistan during 1990–2018. Kulmatov et al. [28] found similar temporal variations in the soil salinisation process in the Bukhara region of Uzbekistan and stated that there was a steady reduction in soil salinisation, particularly from 2001 to 2009. The soil EC for croplands in large parts of Central Asia showed a decreasing trend. This implies that the availability of non-saline soils in many cropland areas of Central Asia has increased in the last three decades, signifying a wider potential for advances in agricultural land resource investment.
Although precipitation is expected to play a determinant role in the soil salinization process, the correlation with the soil EC (Figure 6b) identified the lowest percentages of significant changes. The annual precipitation was low and a majority was released as runoff and leaching of soluble salts, especially in the upper stream areas of Kyrgyzstan and Tajikistan, as identified in our results (Section 3.1 and Section 3.4) and confirmed by other studies [18,21]. The limited precipitation also indirectly contributes to the development of soil salinisation in the region, as indicated by a recent study in the Aral Sea Basin [20]. Similarly, the role of soil moisture in the soil salinisation process is relatively high; however, as the annual precipitation in the region is poor, with high evapotranspiration rates, its effect was not strong in large parts of Central Asia (Figure 9).
The highest percentages of significant and positive soil EC correlations were 15.42%, marked by the population count, and 10.5% with evapotranspiration (Figure 7b and Figure 8b) of the total area in the region. In arid and semi-arid areas, salts accumulate within and below the root zone due to the increasing ET, and this is evident in the region to which ET strongly contributed over the last two decades, particularly in the vicinity of the Tashkent, Djizzakh, and Osh local areas. Kulmatov et al. [28] also stated that the main reason for soil salinisation in the Bukhara region in Uzbekistan was extensive fertiliser application and high evaporation rates. The population result corresponds with the findings of Leng et al. [20], who concluded that the relationship between population distribution and diffused sources of N and P was positive and strong in the Amu Darya and Syr Darya river catchments.
The main driving factors that affect the spatiotemporal variability of soil EC in Central Asia were strongly associated with increasing human pressure on the land and evapotranspiration due to climate variability and climate change. The evapotranspiration variable could have a higher impact on the soil salinisation process in the region because the population estimation may not coexist with soil EC in the same pixel. Other fixed factors, such as geological nutrient formation, fertilizer applications, slope, and groundwater levels, could also contribute to determining the variability of soil salinity, as stated by several local and regional studies [17,18,20,28]. The correlation between soil EC and Eto (Figure 7) was revealed, particularly the open shrubland and cropland mixed with natural vegetation, which had the highest mean positive values. This implies the negative effect on these ecosystems. This signals the vulnerability of the biomes to the impacts of contemporary climate change in Central Asia. The delimitation of soil EC classes and variations, soil EC trends and correlations to the main deriving factors can provide essential spatiotemporal information in agricultural and land resource planning with respect to the challenges of climate change, and tackle land degradation concerns at local and regional scale.
The results of the soil EC decadal variations and a trend analysis have strong implications for proper agricultural practices and land resource management, and there should be more focus on the south-western part of Central Asia to curb soil salinization and the land degradation process. Novoi (Uzbekistan), Ahal, and Balkan (Turkmenistan) provinces need more attention, where the extent of salt-affected areas abruptly increased and soil salinity showed significant increasing trends over the last three decades. Significant correlations were found between soil EC and population, with high impacts on the grassland and cropland biomes; thus, human pressure on the agricultural land and excessive groundwater utilization should be minimized, and there should be more efforts to reduce the salt content of the soil in the region, especially in Uzbekistan and Turkmenistan. Moreover, the increasing negative impacts of soil salinity on the shrubland and croplands should be considered, to implement sustainable agriculture and land resource development strategies at national and regional levels.

5. Conclusions

In the current study, we assessed soil EC trends and identified the major factors that affect soil salinity over Central Asia using high-spatial-resolution images from predicted global soil EC datasets, climate variables, and population count data. Our findings, based on the FAO general soil EC classes, demonstrated a decadal variation in the salt-affected areas over the region, with an increasing pattern from 1990 to 2018. In 2018, approximately 16,108 km2 of cropland had a salinity classification of EC > 4 dS/m, and 5.4% of the crop fields were salt-affected areas. The soil EC trend shows that soil salinity increased over the last three decades, with 6.86% of the region presenting a significant increase (p < 0.05), primarily in the south-western plains of Central Asia, with the highest significant increase found in soil EC trends in Uzbekistan (11.2%) and Turkmenistan (12.2%). However, the integration of soil EC trends and land cover products emphasised that most of the cropland areas represent a decreasing soil EC trend, implying a potential for agricultural development in the region. The main driving factors that affect soil EC variability in Central Asia have been associated with rising evapotranspiration rates and population pressure since 2000. Some of the challenges in this soil salinity assessment using remote sensing datasets were defining standard classification systems for salt-affected areas including non-croplands, the limited recent studies to compare the soil EC trends and correlations, and lack of seasonally aggregated soil salinity data at a wider spatial scale. Future studies should include a detailed review of field-scale soil salinity studies and soil EC local data sampling by considering the role of various human, physical, climatic, and economic constraints, and others, as a basis on which develop more essential protocols and guidelines for soil salinity assessment at a regional scale. Further studies related to soil salinity should focus on the combined effects of vegetation indices on root zone salinity and the soil profile, and remote-sensing-based EC estimations should support field measurements of EC for groundwater variations, nutrient distributions, and soil depths to generate standardised regional and global soil salinity maps. Moreover, the development of a platform on the spatiotemporal variability in soil salinity and risk mapping services at local to regional scales can support agricultural land resource management. Regional coordination and research projects are also essential to overcome and mitigate the problems of soil salinization, land degradation and desertification in the region, with strong potential to target and monitor the sustainable development goals of the United Nations, such as zero hunger (goal 2), climate action (goal 15) and life on land (goal 15).

Author Contributions

Conceptualization, S.M. and F.L.; data curation, S.M., P.P. and H.H.; formal analysis, F.L. and C.T.; funding acquisition, S.M. and F.L.; investigation, S.M., F.L. and R.K.; methodology, S.M., F.L. and P.P.; project administration, F.L. and C.T.; resources, S.M. and F.L.; software, S.M., C.T. and H.H.; supervision, F.L., C.T., Y.Q. and G.C.; validation, S.K. and R.K.; visualization, S.M., N.X. and Y.Q.; writing—original draft, S.M. and F.L.; writing—review and editing, P.P., H.H., N.X., Y.Q., S.K. and G.C. All authors have read and agreed to the published version of the manuscript.

Funding

This study was supported by the [Special Fund of the Chinese Academy of Sciences for Strategic Leading Technology] under Grant [XDA20040302]; the [XPCC Finance Science and Technology Project] under Grant [2021BC003].

Data Availability Statement

In the study, we used publicly available datasets. The long-term annual soil EC dataset is accessible at https://0-doi-org.brum.beds.ac.uk/10.6084/m9.figshare.13295918.v1 (accessed on 19 August 2020). The Terra Climate monthly datasets of precipitation, soil moisture, and reference evapotranspiration images at 4000-m spatial resolutions are ready through the climate engine platform, available at https://app.climateengine.org/climateEngine (accessed on 25 August 2020). The population count data are an open spatial demographic time series for download at a spatial resolution of 1000 m from worldpop (https://www.worldpop.org/ (accessed on 27 August 2020)). The MODIS land cover product of yearly Global 500 m (MCD12Q1, version 6) is also accessible through the Google Earth Engine code editor, masked to the study area (https://developers.google.com/earth-engine/datasets/catalog/MODIS_006_MCD12Q1 (accessed on 21 August 2020)). Other ancillary data, such as the administrative shape files from Natural Earth as ADMIN 0 and ADMIN 1 boundaries (https://www.naturalearthdata.com/downloads/ (accessed on 15 July 2020)), and the SRTM DEM, are accessible at https://www2.jpl.nasa.gov/srtm/ (accessed on 16 July 2020).

Acknowledgments

The authors would like to acknowledge Hassani et al. (2020) for sharing a globally validated historical dataset of the annual topsoil salinity at fine spatial resolutions using machine learning techniques. We also thank the Terra Climate monthly dataset providers and the Climate Engine for making time series precipitation, soil moisture, and reference evapotranspiration data available with ease of access, and ensuring these data were ready for further processing at relatively high spatial resolutions.

Conflicts of Interest

The authors declare no conflict of interest.

References

  1. Lal, R. Climate change and soil degradation mitigation by sustainable management of soils and other natural resources. Agric. Res. 2012, 1, 199–212. [Google Scholar] [CrossRef] [Green Version]
  2. Kulmatov, R.; Khasanov, S.; Odilov, S.; Li, F. Assessment of the space-time dynamics of soil salinity in irrigated areas under climate change: A case study in sirdarya province, Uzbekistan. Water Air Soil Pollut. 2021, 232, 1–13. [Google Scholar] [CrossRef]
  3. Khasanov, S.; Li, F.; Kulmatov, R.; Zhang, Q. Evaluation of the perennial spatio-temporal changes in the groundwater level and mineralization, and soil salinity in irrigated lands of arid zone: As an example of Syrdarya Province, Uzbekistan. Agric. Water Manag. 2022, 263, 107444. [Google Scholar] [CrossRef]
  4. Gorji, T.; Sertel, E.; Tanik, A. Monitoring soil salinity via remote sensing technology under data scarce conditions: A case study from Turkey. Ecol. Indic. 2017, 74, 384–391. [Google Scholar] [CrossRef]
  5. Uri, N. Cropland soil salinization and associated hydrology: Trends, processes and examples. Water 2018, 10, 1030. [Google Scholar] [CrossRef] [Green Version]
  6. Hassani, A.; Azapagic, A.; Shokri, N. Global predictions of primary soil salinization under changing climate in the 21st century. Nat. Commun. 2021, 12, 1–17. [Google Scholar] [CrossRef]
  7. Stavi, I.; Thevs, N.; Priori, S. Soil Salinity and sodicity in drylands: A review of causes, effects, monitoring, and restoration measures. Front. Environ. Sci. 2021, 9, 1–16. [Google Scholar] [CrossRef]
  8. Ivushkin, K.; Bartholomeus, H.; Bregt, A.K.; Pulatov, A.; Kempen, B.; de Sousa, L. Global mapping of soil salinity change. Remote Sens. Environ. 2019, 231, 111260. [Google Scholar] [CrossRef]
  9. Bucknall, J.; Klytchnikova, I.; Lampietti, J.; Lundell, M.; Scatasta, M.; Thurman, M. Irrigation in central Asia. social, economic and environmental considerations. In Europe and Central Asia Region Environmentally and Socially Sustainable Development; The World Bank: Washington, DC, USA, 2003; p. 104. [Google Scholar]
  10. Hamidov, A.; Helming, K.; Balla, D. Impact of agricultural land use in central Asia: A review. Agron. Sustain. Dev. 2016, 36, 1–23. [Google Scholar] [CrossRef] [Green Version]
  11. Kushiev, H.; Noble, A.D.; Abdullaev, I.; Toshbekov, U. Remediation of abandoned saline soils using glycyrrhiza glabra: A study from the hungry steppes of central Asia. Int. J. Agric. Sustain. 2005, 3, 102–113. [Google Scholar] [CrossRef] [Green Version]
  12. Kulmatov, R. Problems of sustainable use and management of water and land resources in Uzbekistan. J. Water Resour. Prot. 2014, 6, 35–42. [Google Scholar] [CrossRef]
  13. Corwin, D.L.; Scudiero, E. Review of soil salinity assessment for agriculture across multiple scales using proximal and/or remote sensors. Adv. Agron. 2019, 158, 1–130. [Google Scholar]
  14. Hassani, A.; Azapagic, A.; Shokri, N. Predicting long-term dynamics of soil salinity and sodicity on a global scale. Proc. Natl. Acad. Sci. USA 2020, 117, 33017–33027. [Google Scholar] [CrossRef] [PubMed]
  15. Al-Gaadi, K.A.; Tola, E.K.; Madugundu, R.; Fulleros, R.B. Sentinel-2 images for effective mapping of soil salinity in agricultural fields. Curr. Sci. 2021, 121, 384–390. [Google Scholar] [CrossRef]
  16. Taghadosi, M.M.; Hasanlou, M. Trend analysis of soil salinity in different land cover types using Landsat time series data (case study Bakhtegan Salt Lake). Int. Arch. Photogramm. Remote Sens. Spat. Inf. Sci. 2017, 42, 251–257. [Google Scholar] [CrossRef] [Green Version]
  17. Tran, T.V.; Tran, D.X.; Myint, S.W.; Huang, C.Y.; Pham, H.V.; Luu, T.H.; Vo, T.M.T. Examining spatiotemporal salinity dynamics in the mekong river delta using landsat time series imagery and a spatial regression approach. Sci. Total Environ. 2019, 687, 1087–1097. [Google Scholar] [CrossRef]
  18. Funakawa, S.; Kosaki, T. Potential risk of soil salinization in different regions of central Asia with special reference to salt reserves in deep layers of soils. Soil Sci. Plant Nutr. 2007, 53, 634–649. [Google Scholar] [CrossRef]
  19. Shirokova, Y.; Forkutsa, I.; Sharafutdinova, N. Use of electrical conductivity instead of soluble salts for soil salinity monitoring in central Asia. Irrig. Drain. Syst. 2000, 14, 199–205. [Google Scholar] [CrossRef]
  20. Leng, P.; Zhang, Q.; Li, F.; Kulmatov, R.; Wang, G.; Qiao, Y.; Wang, J.; Peng, Y.; Tian, C.; Zhu, N.; et al. Agricultural impacts drive longitudinal variations of riverine water quality of the aral sea basin (amu darya and syr darya rivers), central Asia. Environ. Pollut. 2021, 284, 117405. [Google Scholar] [CrossRef]
  21. Toderich, K.; Ismail, S.; Massino, I.; Wilhelm, M.; Yusupov, S.; Kuliev, T. Extent of Salt-Affected Land in Central Asia: Biosaline Agriculture and Utilization of the Salt-Affected Resources; KIER Working Papers 648; Kyoto University, Institute of Economic Research: Kyoto, Japan, 2008. [Google Scholar]
  22. Bobojonov, I.; Aw-Hassan, A. Impacts of climate change on farm income security in central Asia: An integrated modeling approach. Agric. Ecosyst. Environ. 2014, 188, 245–255. [Google Scholar] [CrossRef]
  23. Pulatov, A.; Khamidov, A.; Akhmatov, D.; Pulatov, B.; Vasenev, V. Soil salinity mapping by different interpolation methods in mirzaabad district, syrdarya province. IOP Conf. Ser. Mater. Sci. Eng. 2020, 883, 012089. [Google Scholar] [CrossRef]
  24. Scudiero, E.; Corwin, D.L.; Anderson, R.G.; Skaggs, T.H. Moving forward on remote sensing of soil salinity at regional scale. Front. Environ. Sci. 2016, 4, 1–5. [Google Scholar] [CrossRef] [Green Version]
  25. Latonov, A.P.; Arimov, A.K.; Rathapar, S.P. Using satellite images for multi-annual soil salinity mapping in the irrigated areas of syrdarya province, Uzbekistan. J. Arid Land Stud. 2015, 25, 225–228. [Google Scholar]
  26. Sidike, A.; Zhao, S.; Wen, Y. Estimating soil salinity in Pingluo County of China using QuickBirddata and soil reflectance spectra. Int. J. Appl. Earth Obs. Geoinf. 2014, 26, 156–175. [Google Scholar]
  27. Haag, I.; Jones, P.D.; Samimi, C. Central Asia’s changing climate: How temperature and precipitation have changed across time, space, and altitude. Climate 2019, 7, 123. [Google Scholar] [CrossRef] [Green Version]
  28. Kulmatov, R.; Rasulov, A.; Kulmatova, D.; Rozilhodjaev, B.; Groll, M. The modern problems of sustainable use and management of irrigated lands on the example of the bukhara region (Uzbekistan). J. Water Resour. Prot. 2015, 7, 956–971. [Google Scholar] [CrossRef] [Green Version]
  29. Pankova, E.I.; Konyushkova, M.V. Climate and soil salinity in the deserts of Central Asia. Eurasian Soil Sci. 2013, 46, 721–727. [Google Scholar] [CrossRef]
  30. Gray, J.; Sulla-Menashe, D.; Friedl, M.A. User Guide to Collection 6 MODIS Land Cover Dynamics (MCD12Q2) Product; NASA EOSDIS Land Processes DAAC: Missoula, MT, USA, 2019; Volume 6, pp. 1–8. [Google Scholar]
  31. Abatzoglou, J.T.; Dobrowski, S.Z.; Parks, S.A.; Hegewisch, K.C. TerraClimate, a high-resolution global dataset of monthly climate and climatic water balance from 1958–2015. Sci. Data 2018, 5, 1–12. [Google Scholar] [CrossRef] [Green Version]
  32. WorldPop. Available online: https://www.worldpop.org/ (accessed on 18 October 2021).
  33. Abrol, I.P.; Yadav, J.S.P.; Massoud, F.I. Salt-Affected Soils and their Management; Food & Agriculture Organization: Rome, Italy, 1988; ISBN 92-5-102686-6. [Google Scholar]
  34. Jia, Y.; Shi, Z.; Chen, Z.; Walder, F.; Tian, C.; Feng, G. Soil moisture threshold in controlling above- and belowground community stability in a temperate desert of central Asia. Sci. Total Environ. 2020, 703, 134650. [Google Scholar] [CrossRef]
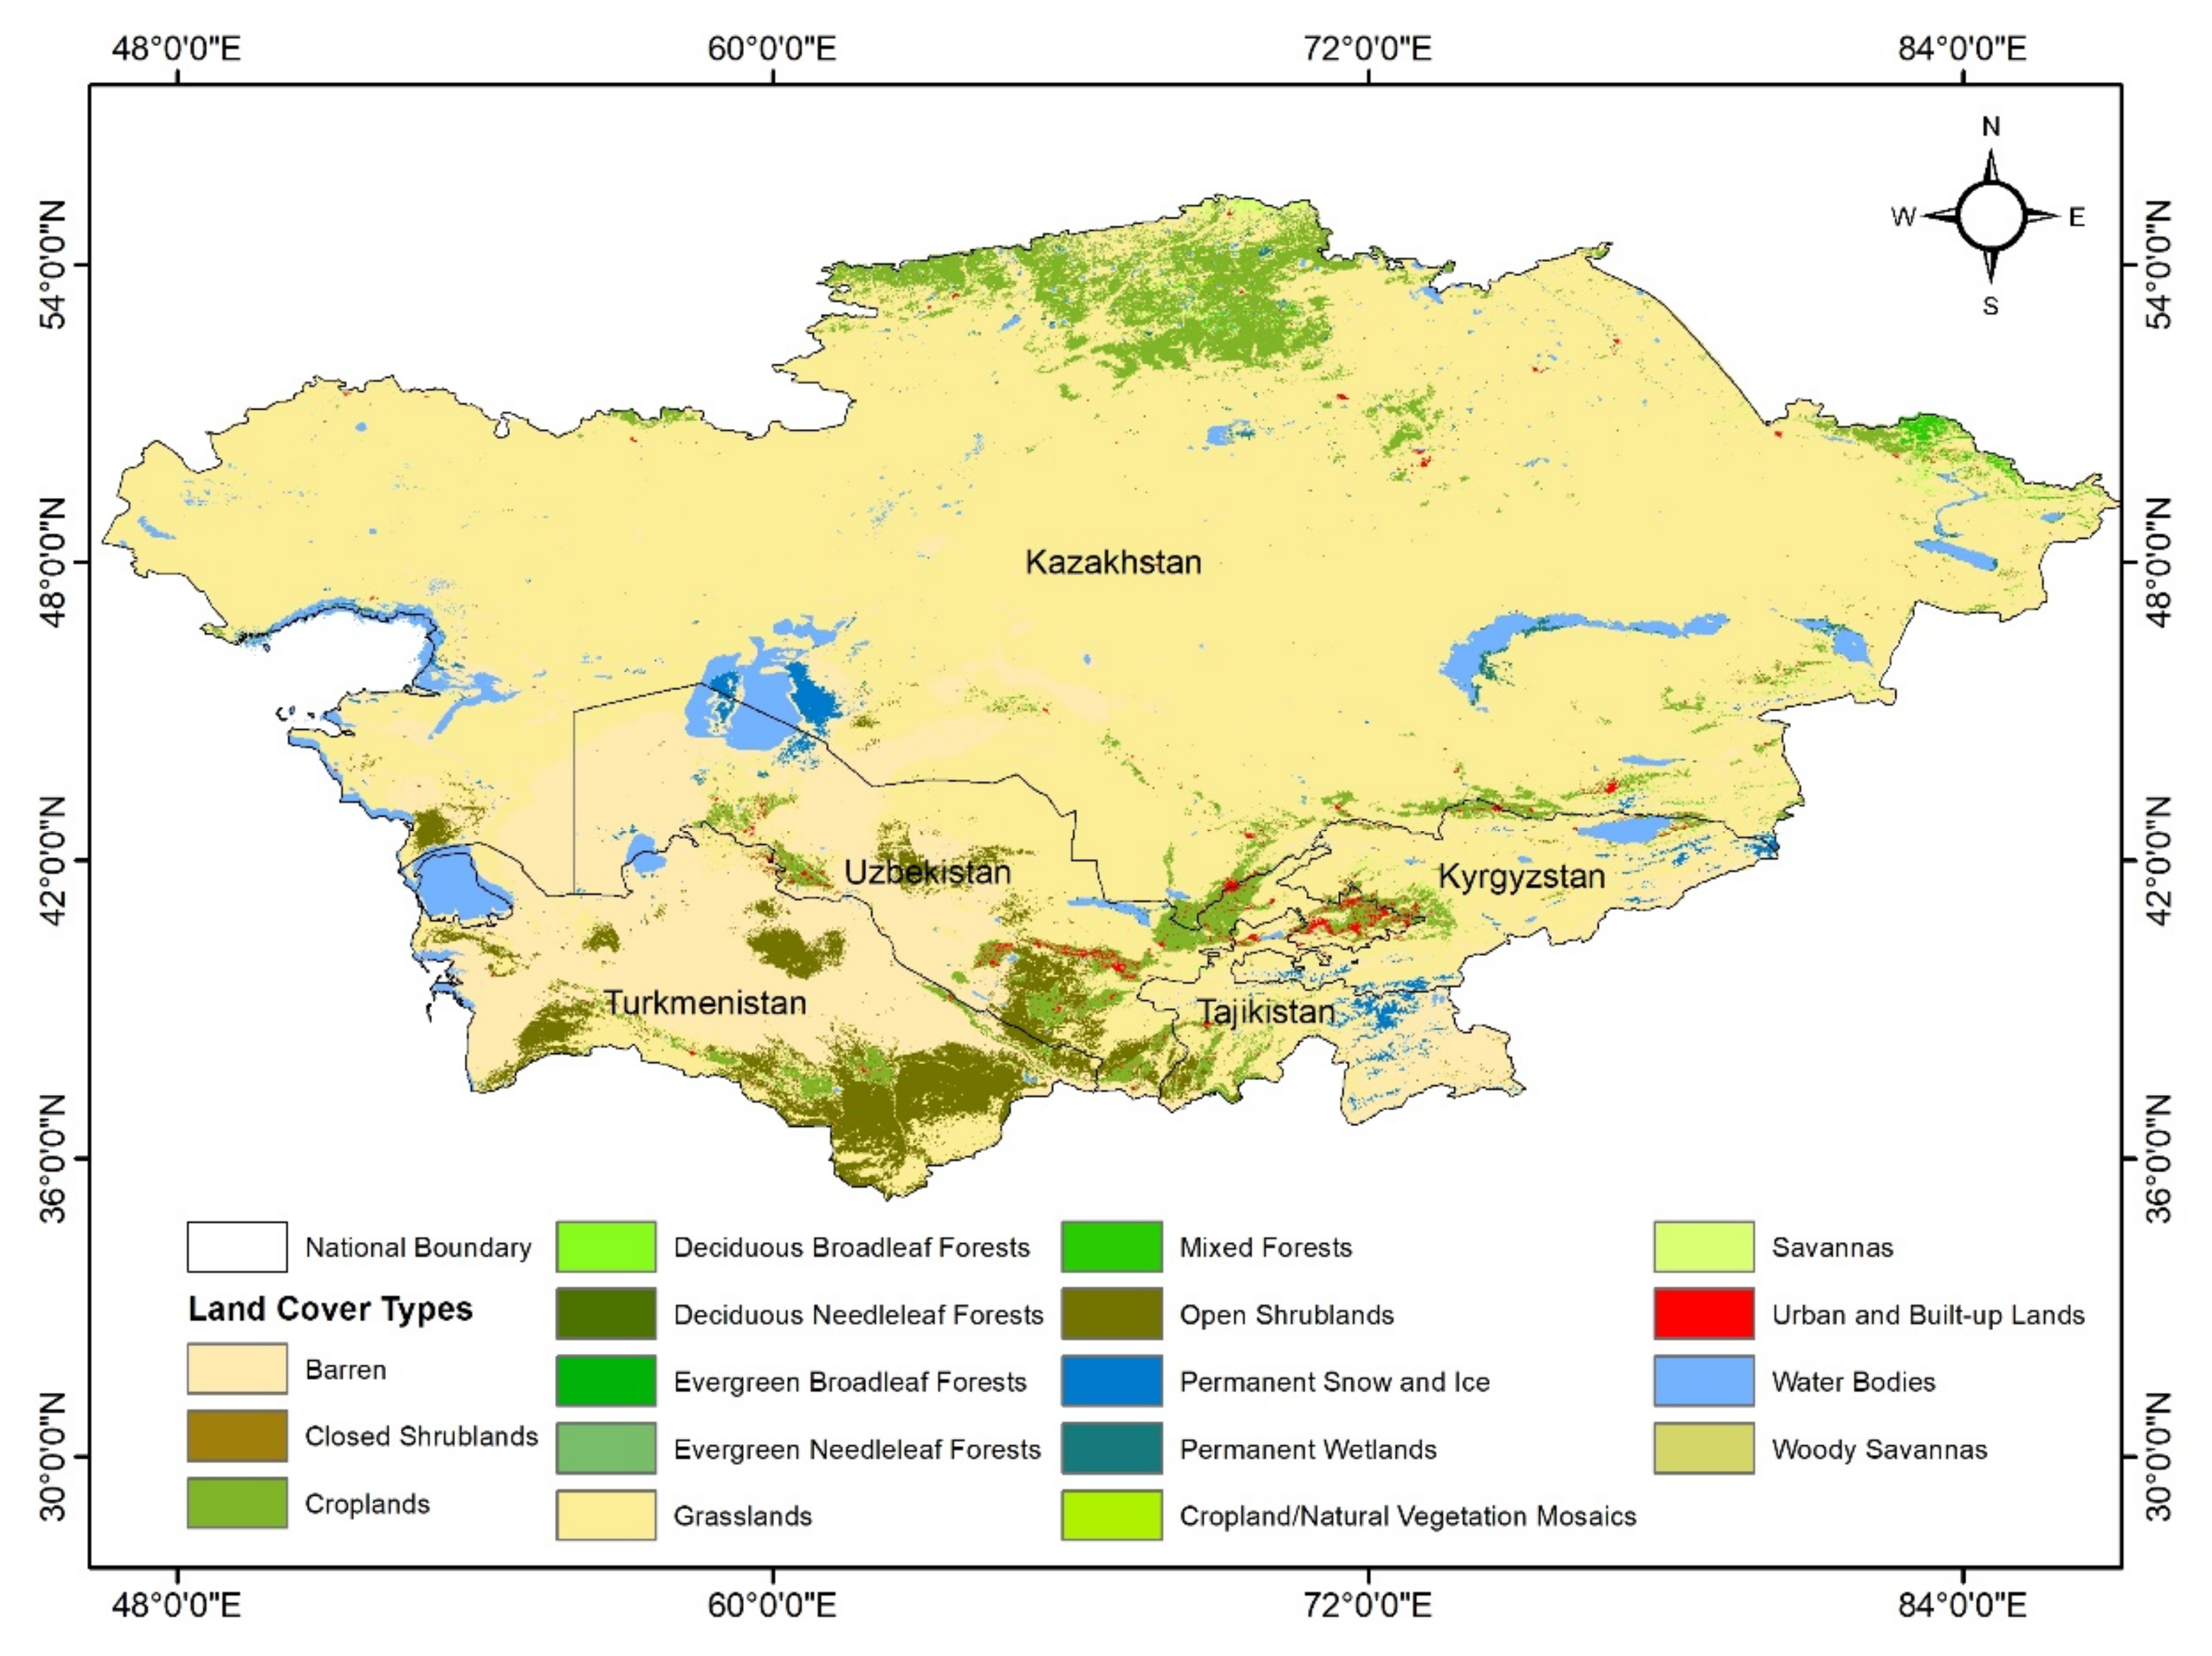
Figure 1. Digital elevation map of Central Asia (Source: USGS SRTM 90 m).
Remotesensing 14 02501 g001
Figure 2. Land cover types of Central Asia in 2018 (source: MODIS MCD12Q1 image).
Remotesensing 14 02501 g002
Figure 3. Soil EC distributions across Central Asia in 1990, 2000, 2015, and 2018.
Remotesensing 14 02501 g003
Figure 4. Soil salinity distributions and EC classes for 2018 cropland areas in Central Asia.
Remotesensing 14 02501 g004
Figure 5. (a) Soil EC annual trend and (b) trend with p < 0.05 over Central Asia during 1990–2018.
Remotesensing 14 02501 g005
Figure 6. (a) Soil EC correlation to precipitation, and (b) significant changes during 2000–2018.
Remotesensing 14 02501 g006
Figure 7. (a) Soil EC correlation to evapotranspiration, and (b) significant changes during 2000–2018.
Remotesensing 14 02501 g007
Figure 8. (a) Soil EC correlation to population count, and (b) significant changes during 2000–2018.
Remotesensing 14 02501 g008
Figure 9. (a) Soil EC correlation to soil moisture, and (b) significant changes during 2000–2018.
Remotesensing 14 02501 g009
Table 1. Land cover types and percentages for each class in Central Asia.
No.MODIS Land Cover TypesArea (km2)Percentage (%)
1Evergreen Needle leaf Forests11890.03
2Evergreen Broadleaf Forests4.50.00
3Deciduous Needle leaf Forests1440.00
4Deciduous Broadleaf Forests12090.03
5Mixed Forests68860.17
6Closed Shrub lands4580.01
7Open Shrub lands154,1703.85
8Woody Savannas78980.20
9Savannas10,3240.26
10Grasslands2,767,39869.04
11Permanent Wetlands10,8820.27
12Croplands208,1525.19
13Urban and Built-up Lands19,1940.48
14Cropland/Vegetation Mosaics6430.02
15Permanent Snow and Ice28,5150.71
16Barren662,76516.53
17Water Bodies128,7293.21
Total4,008,561
Table 2. Soil salinity classes with soil EC values and potential effects on crop yield.
Soil Salinity ClassEC Class (dS/m)Effect on Crop Yield
Non-saline0–2Insignificant
Slightly saline2–4Limit yield of sensitive crops
Moderately saline4–8Restrict yields of many crops
Highly saline8–16May not only affect resistant crops
Extremely saline>16May not affect very few resistant crops
Table 3. Soil EC decadal variations (km2) in Central Asia.
EC Class (dS/m)1990200020102018
0–24,252,4404,392,0404,557,2004,139,280
2–4281,075242,499192,920254,440
4–8826,994789,386611,714903,574
8–16135,66171,038130,989190,928
>1642215431756112,170
Publisher’s Note: MDPI stays neutral with regard to jurisdictional claims in published maps and institutional affiliations.

