
Accuracy of Code GNSS Receivers under Various Conditions

 , , , ,
Abstract
:
1. Introduction
2. Background
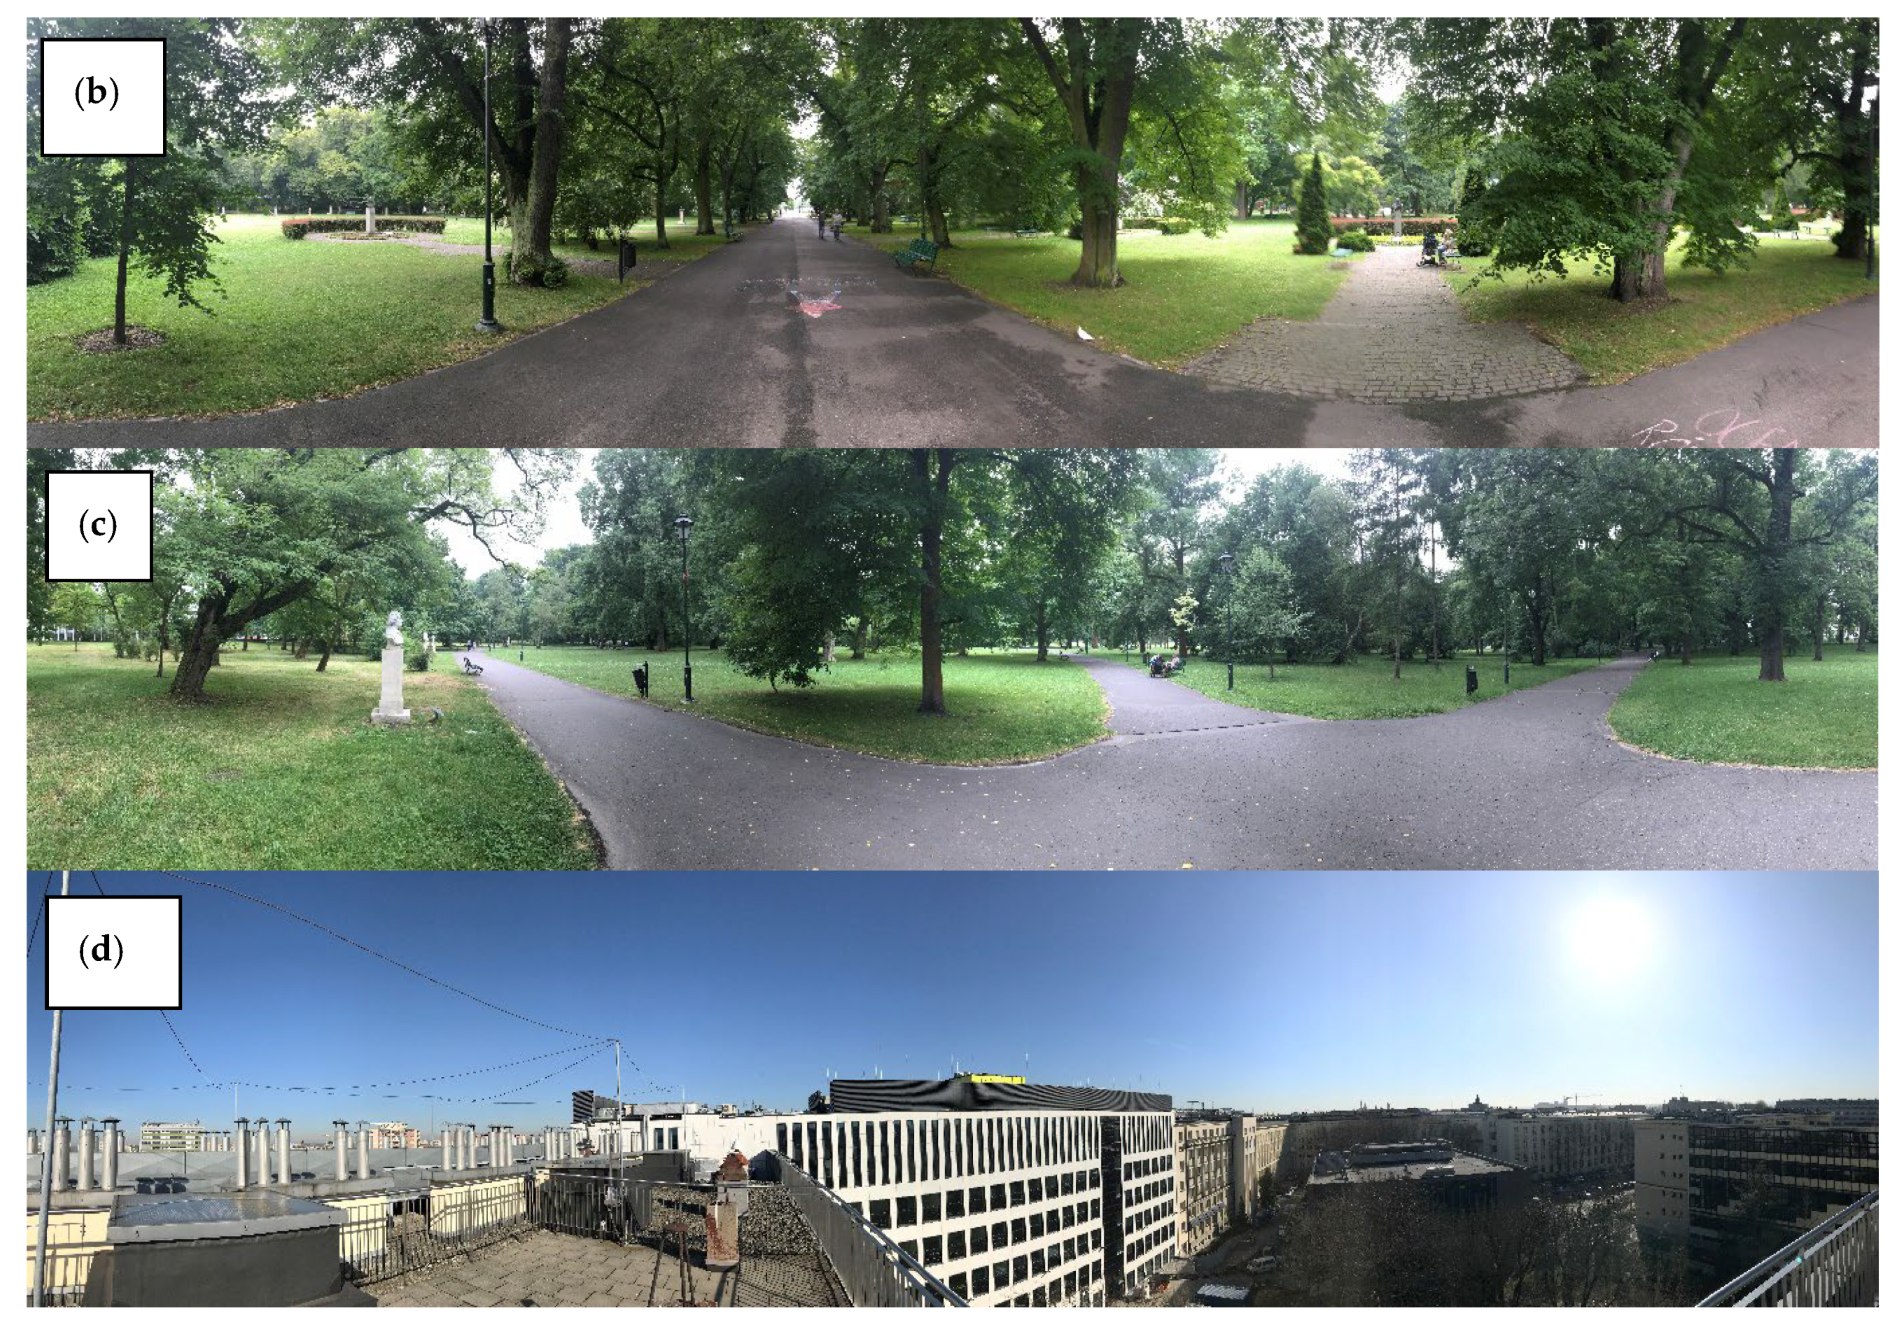
3. Materials and Methods
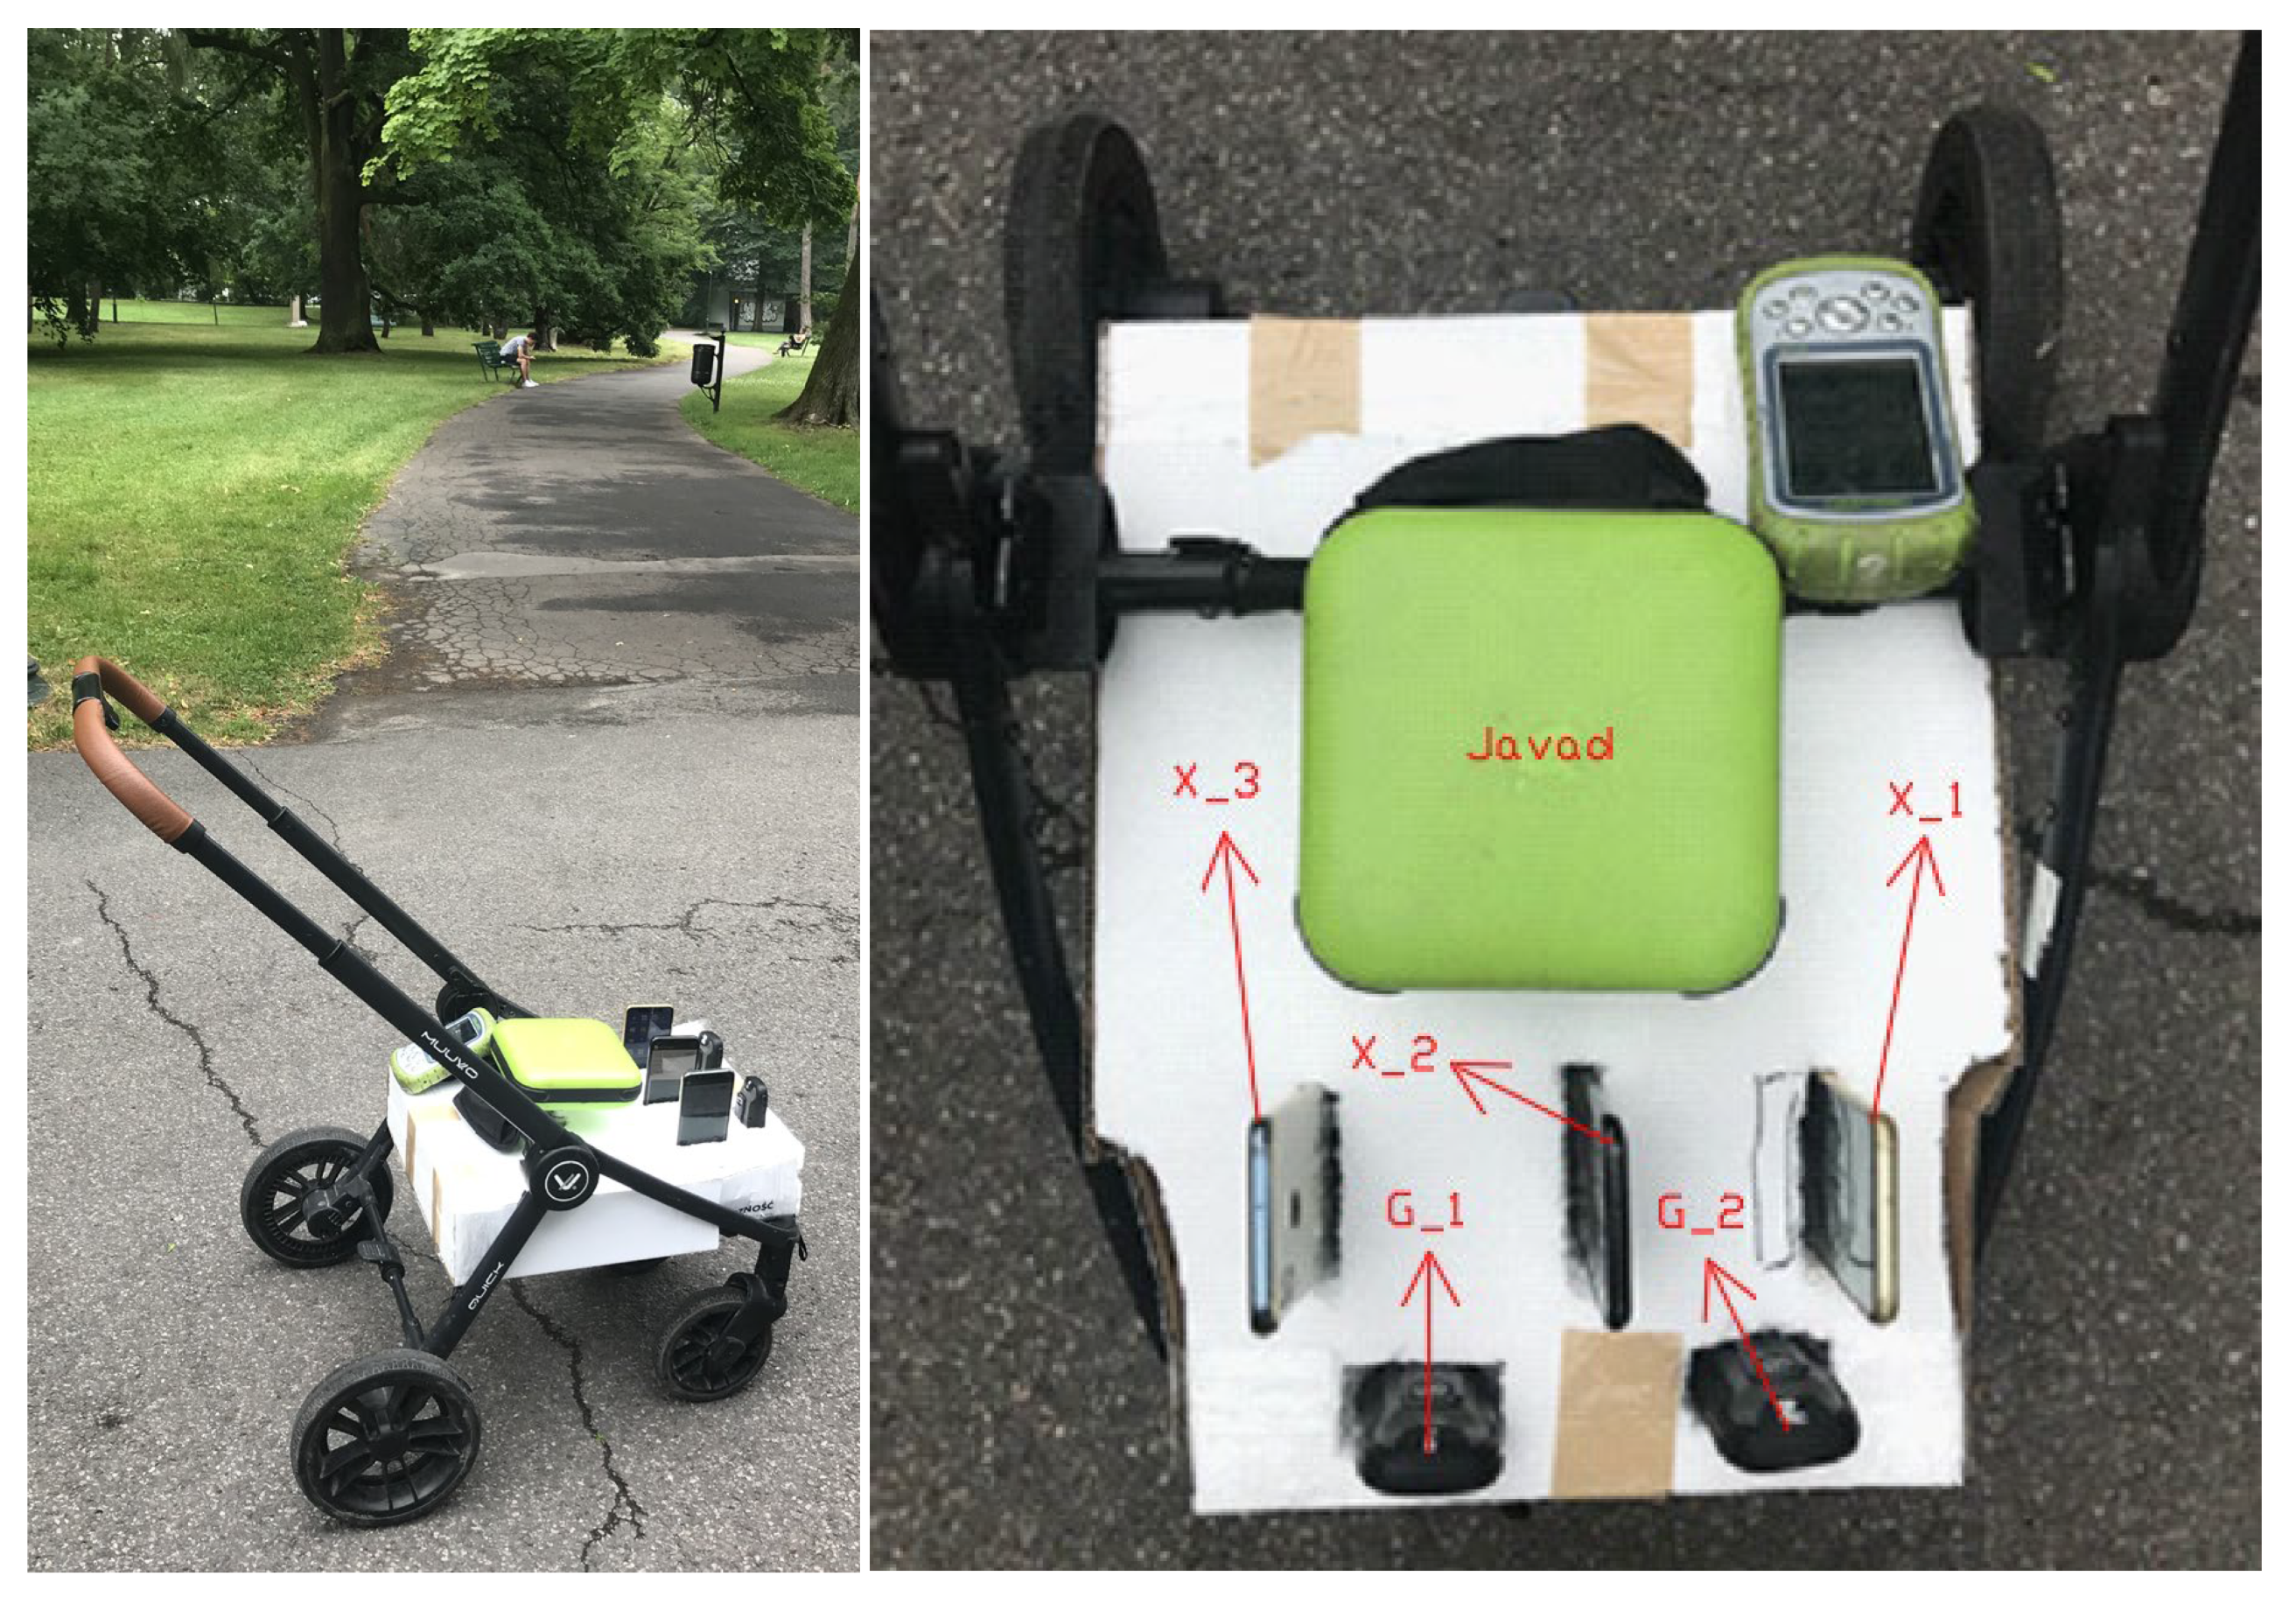
3.1. Materials
- Javad Triumph-1 (chipset 352-TFBGA, 90 nm) precision receiver operating in RTK GPS mode, with reference to a reference station located at a distance of 500 m, which eliminated the influence of the ionosphere.
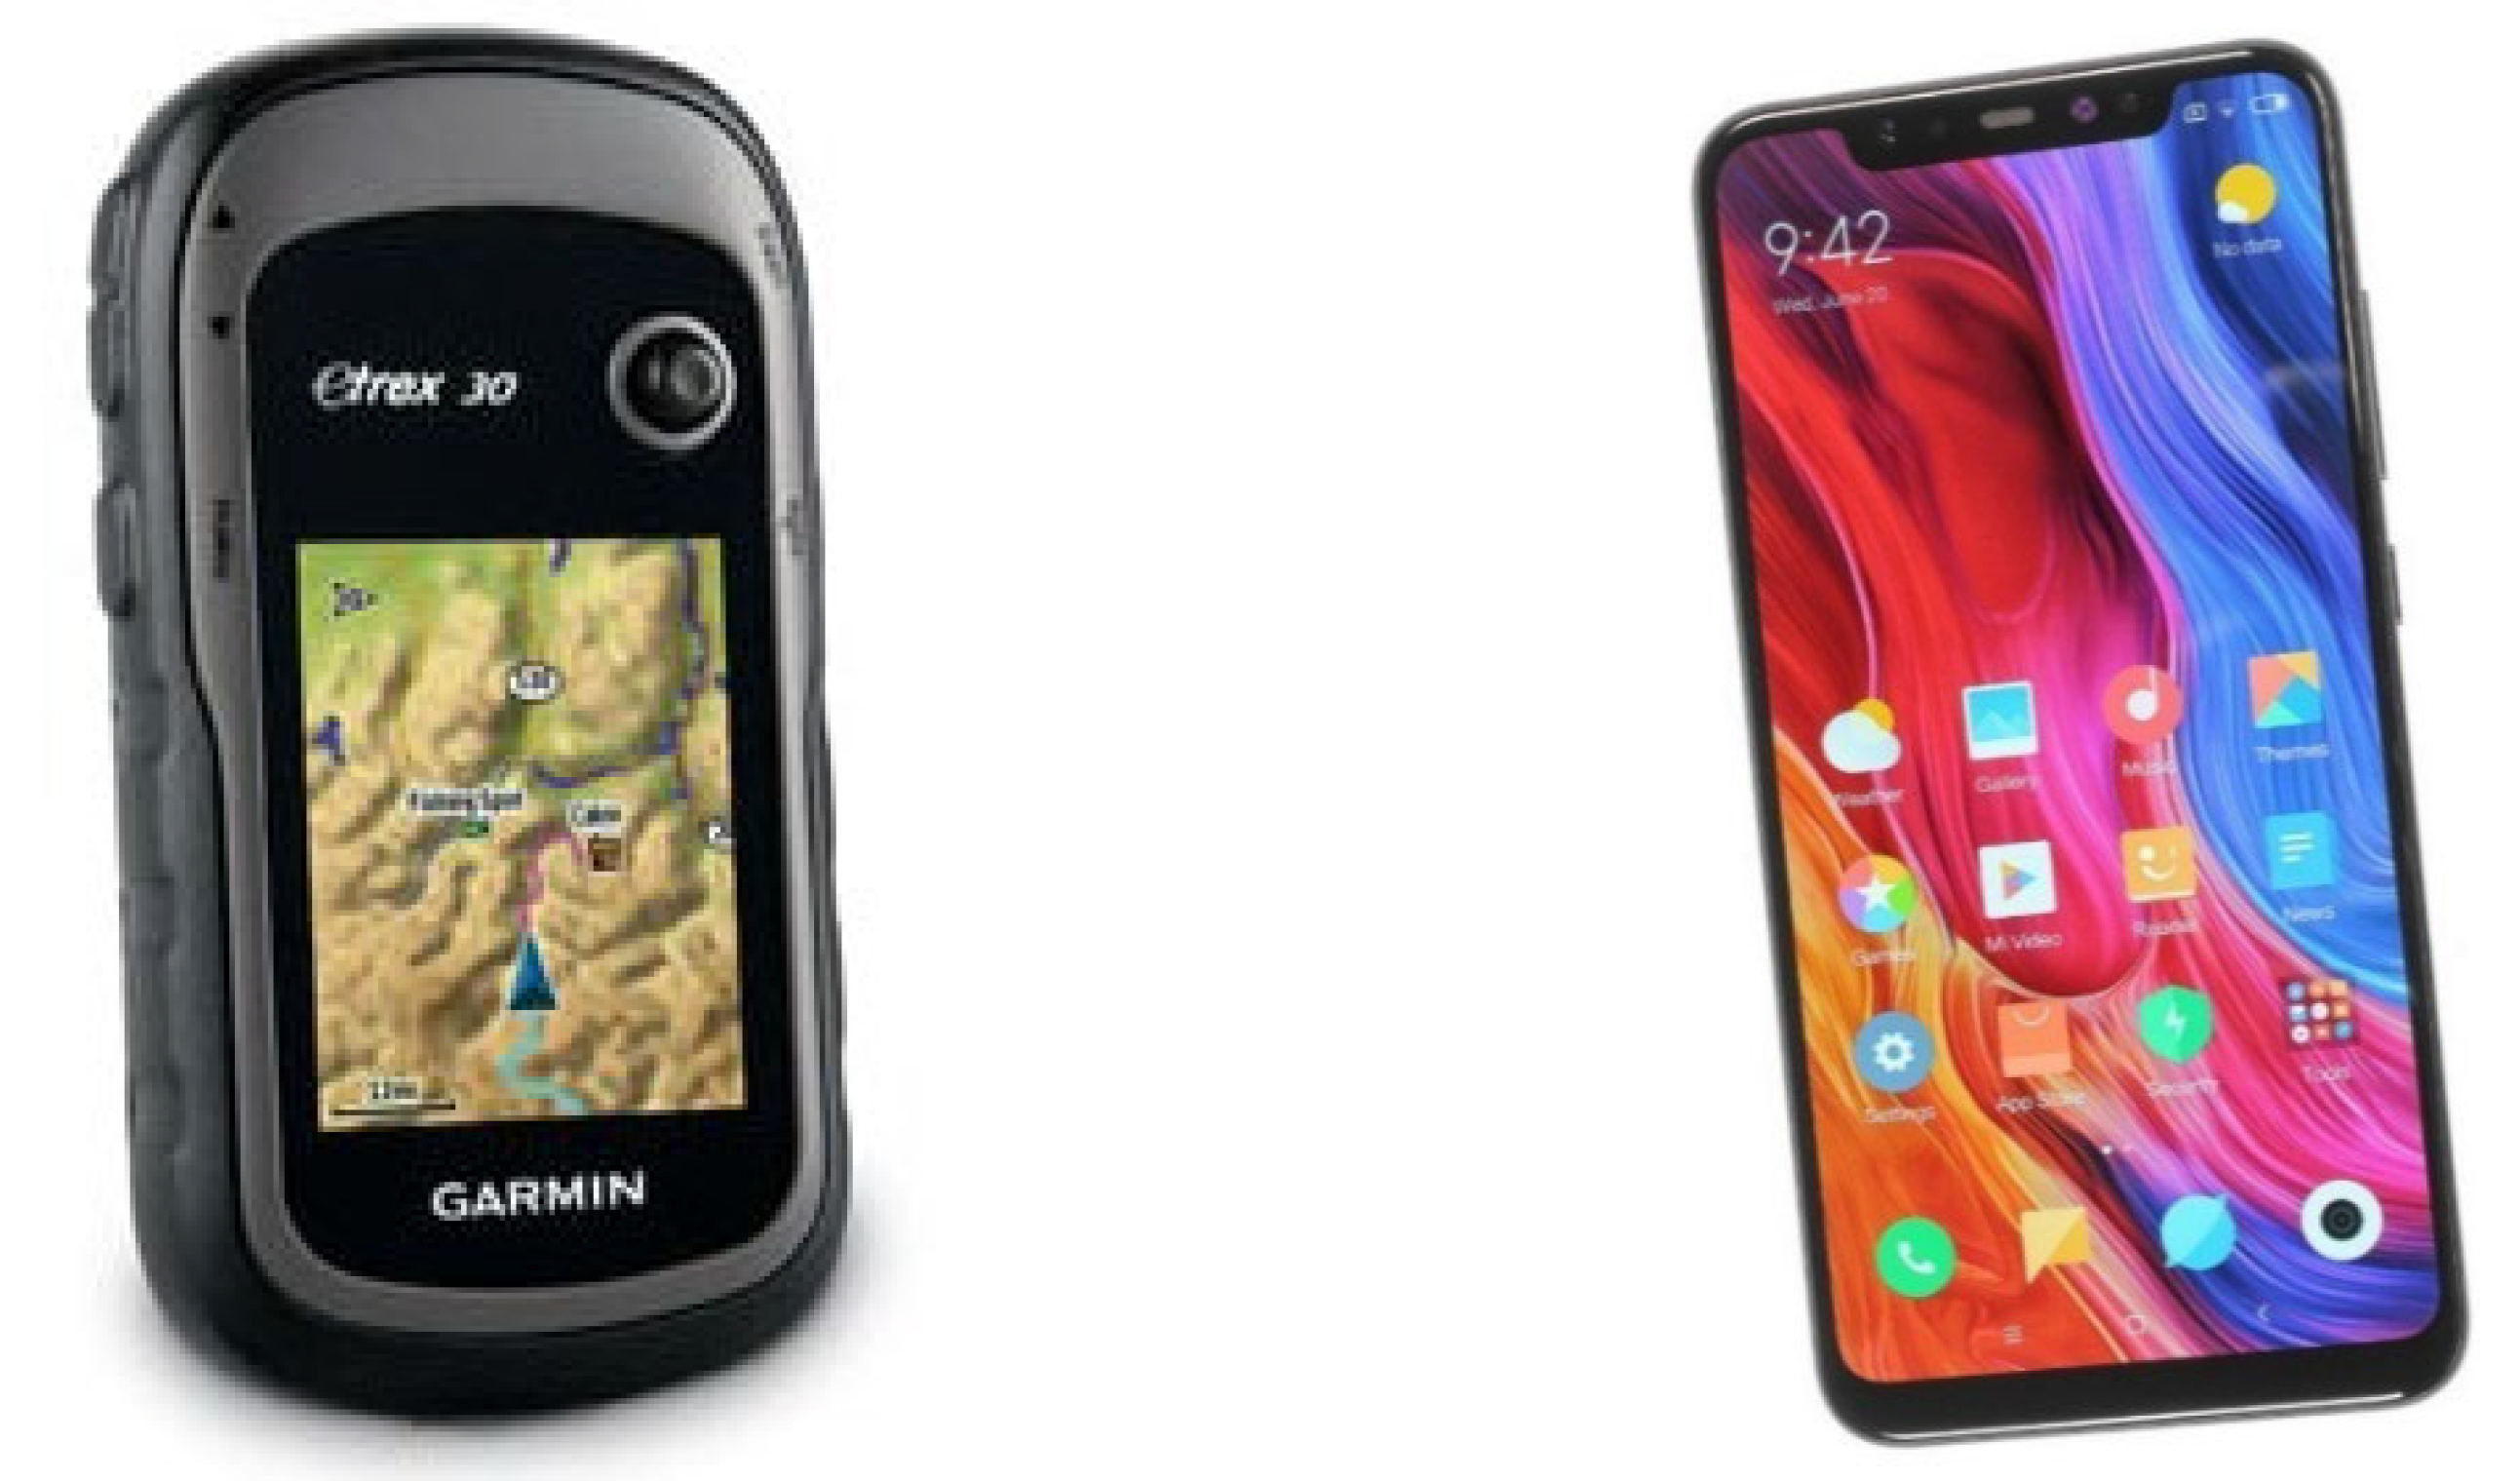
- Two Garmin eTrex 30 (chipset STA8088 TESEO II) receivers allowing signals to be recorded in GPS or GPS+GLONASS mode, each receiver operating in a different mode (Table 1).
- Three Xiaomi Mi 8 (chipset Qualcomm SDM845 Snapdragon 845, 10 nm) phones running the Android 8.1 operating system capable of recording GPS, GLONASS, Galileo, and BeiDou signals. A free GPS Logger application (Geo Stats) was used to measure the smartphones. It was programmed to receive only the GPS signal, so it was not possible to set other signals, although the phones had such a possibility. All smartphones were operating in the same mode. Furthermore, the application did not record altitude. During the study, 4 software applications were tested for measuring smartphones on the move, but only 1 application positioned the device throughout the measurement, while the other 3 terminated after 1 min.
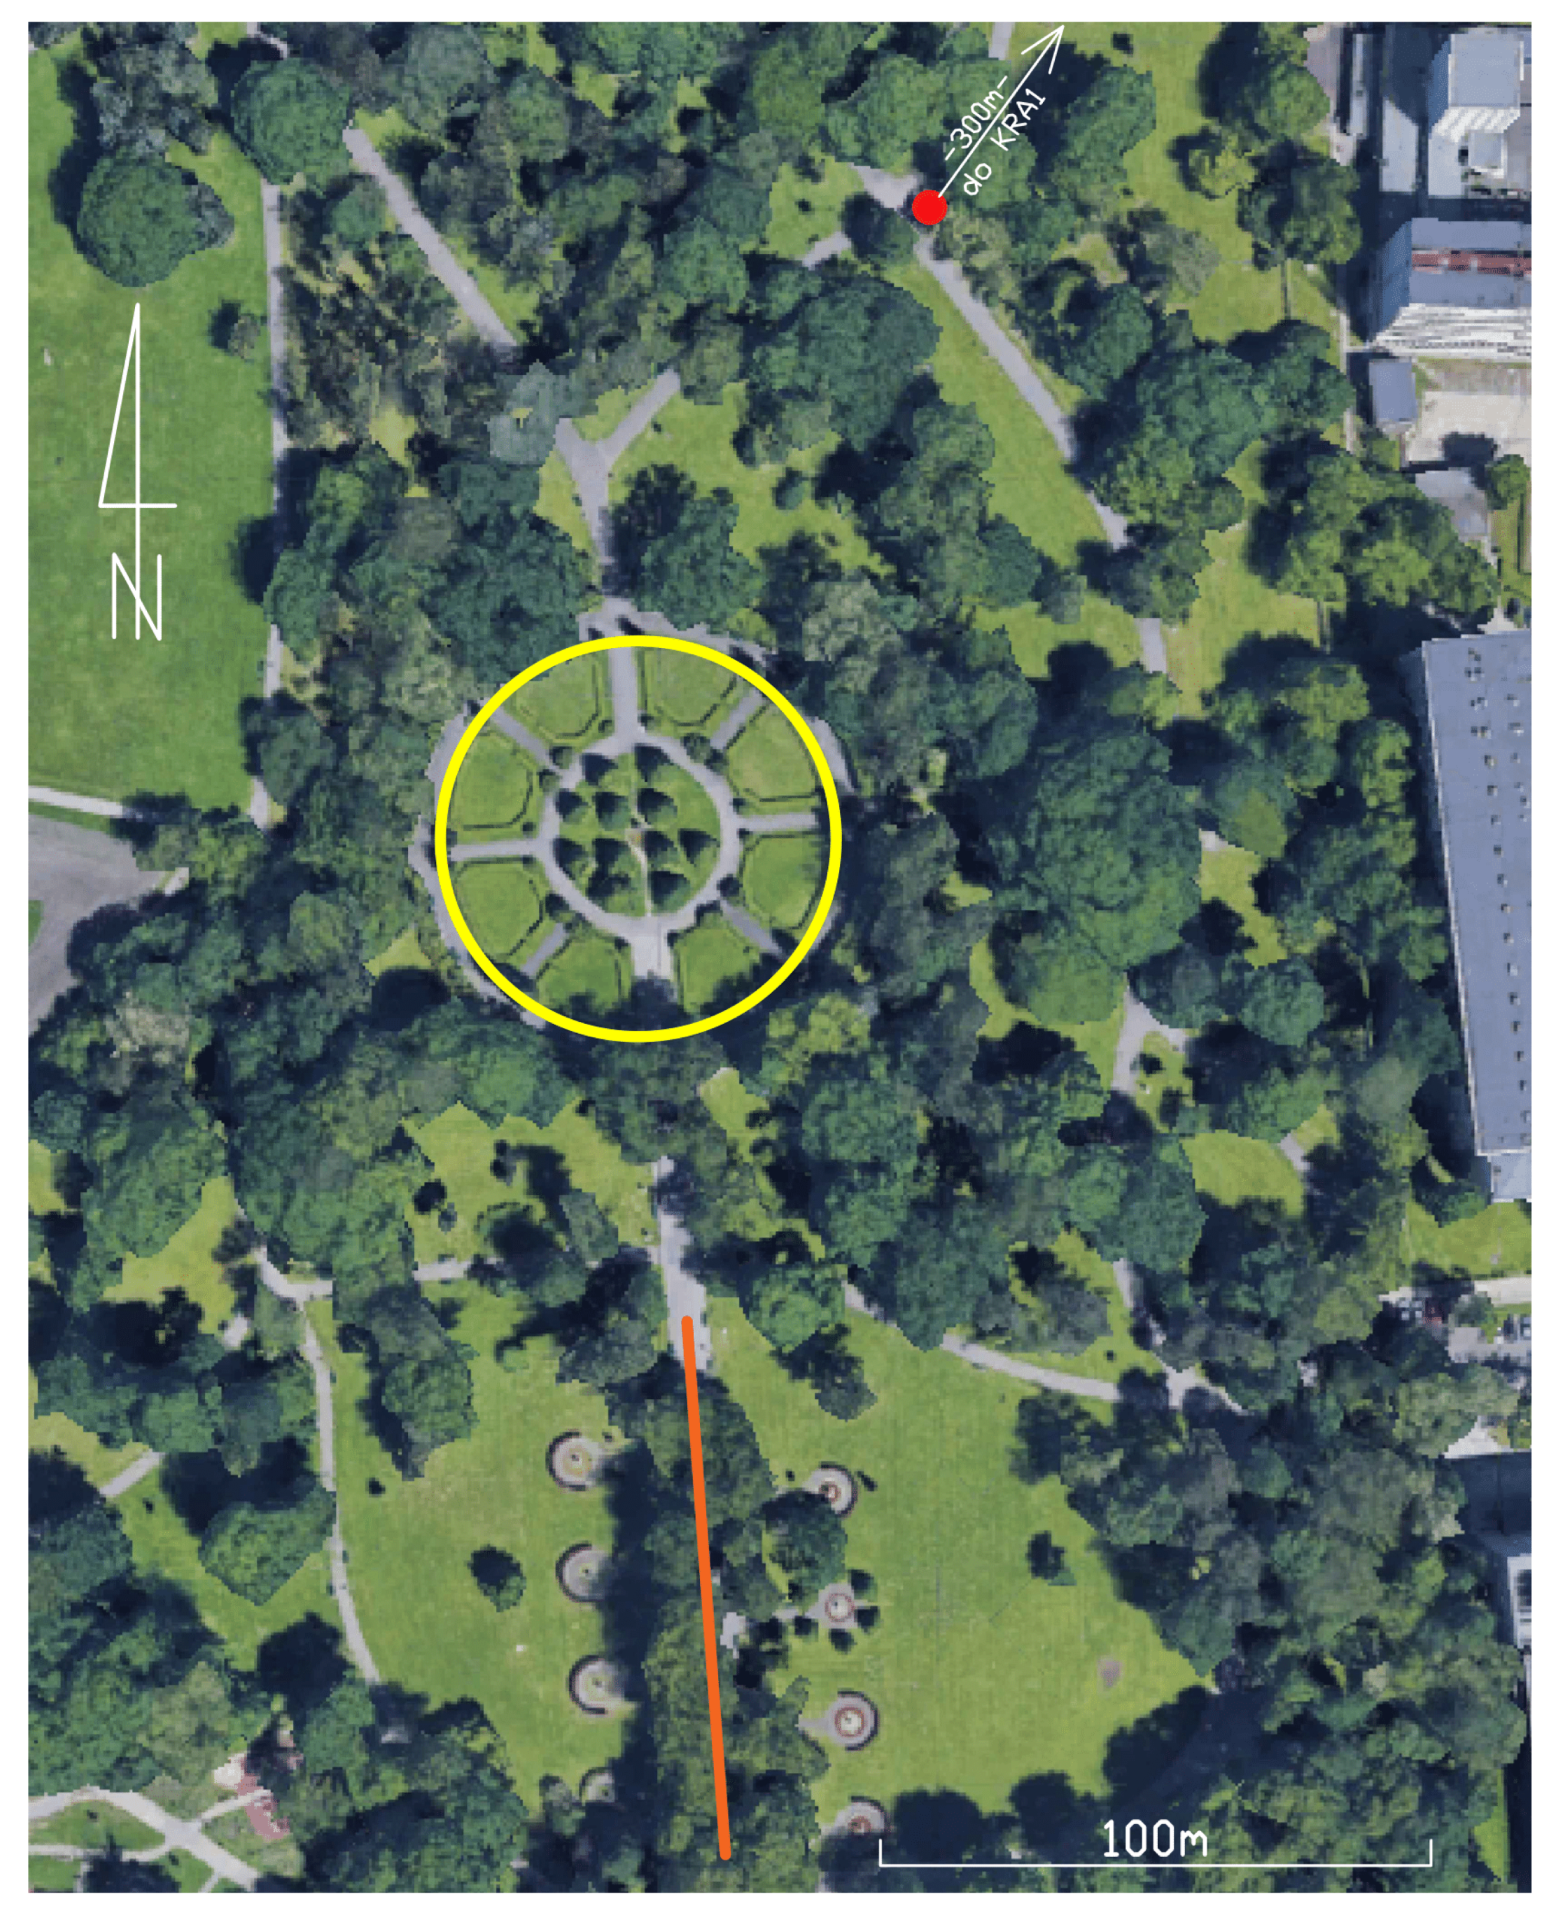
3.2. Methods
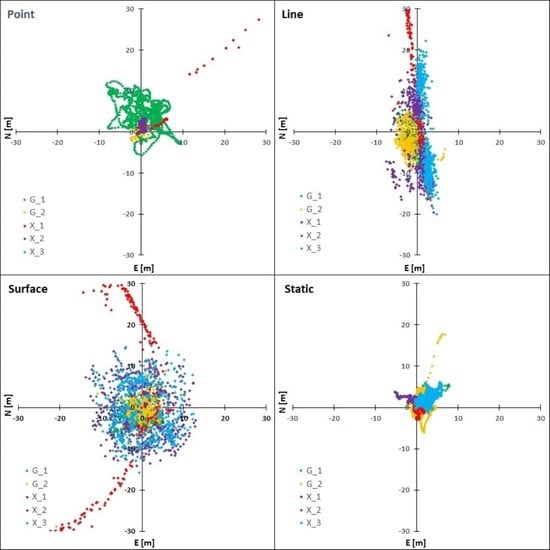
4. Results
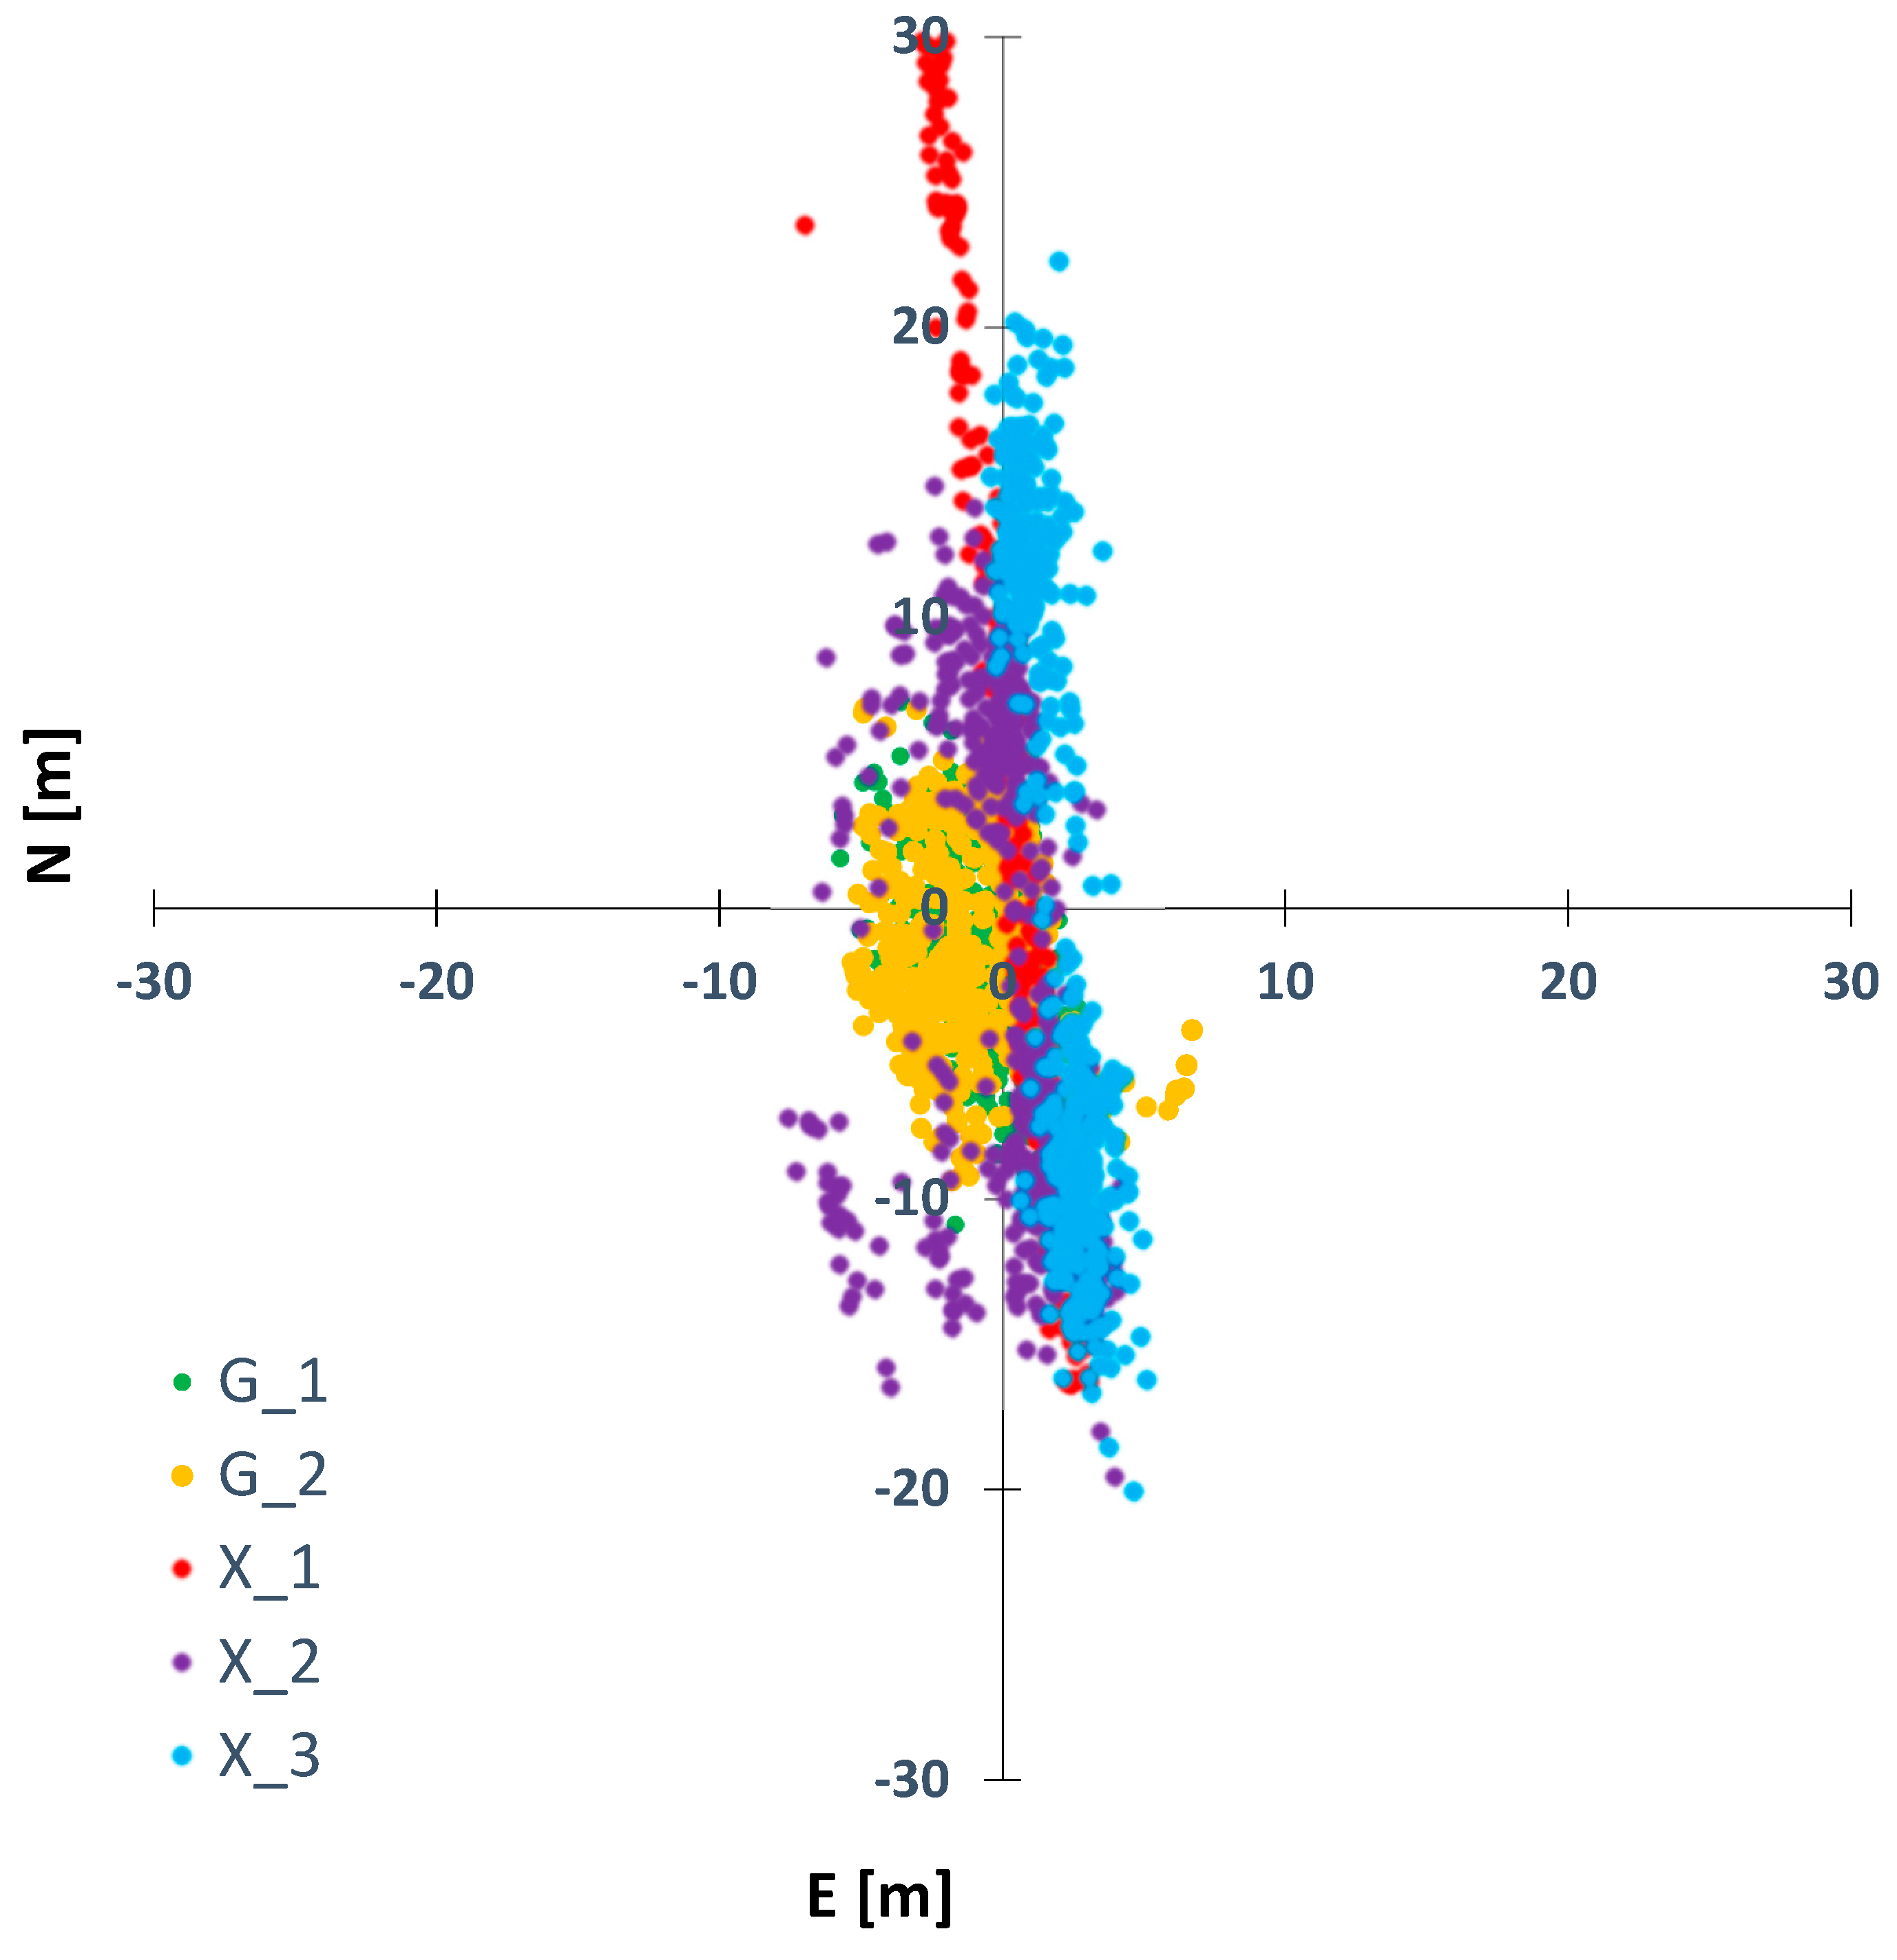
4.1. Point
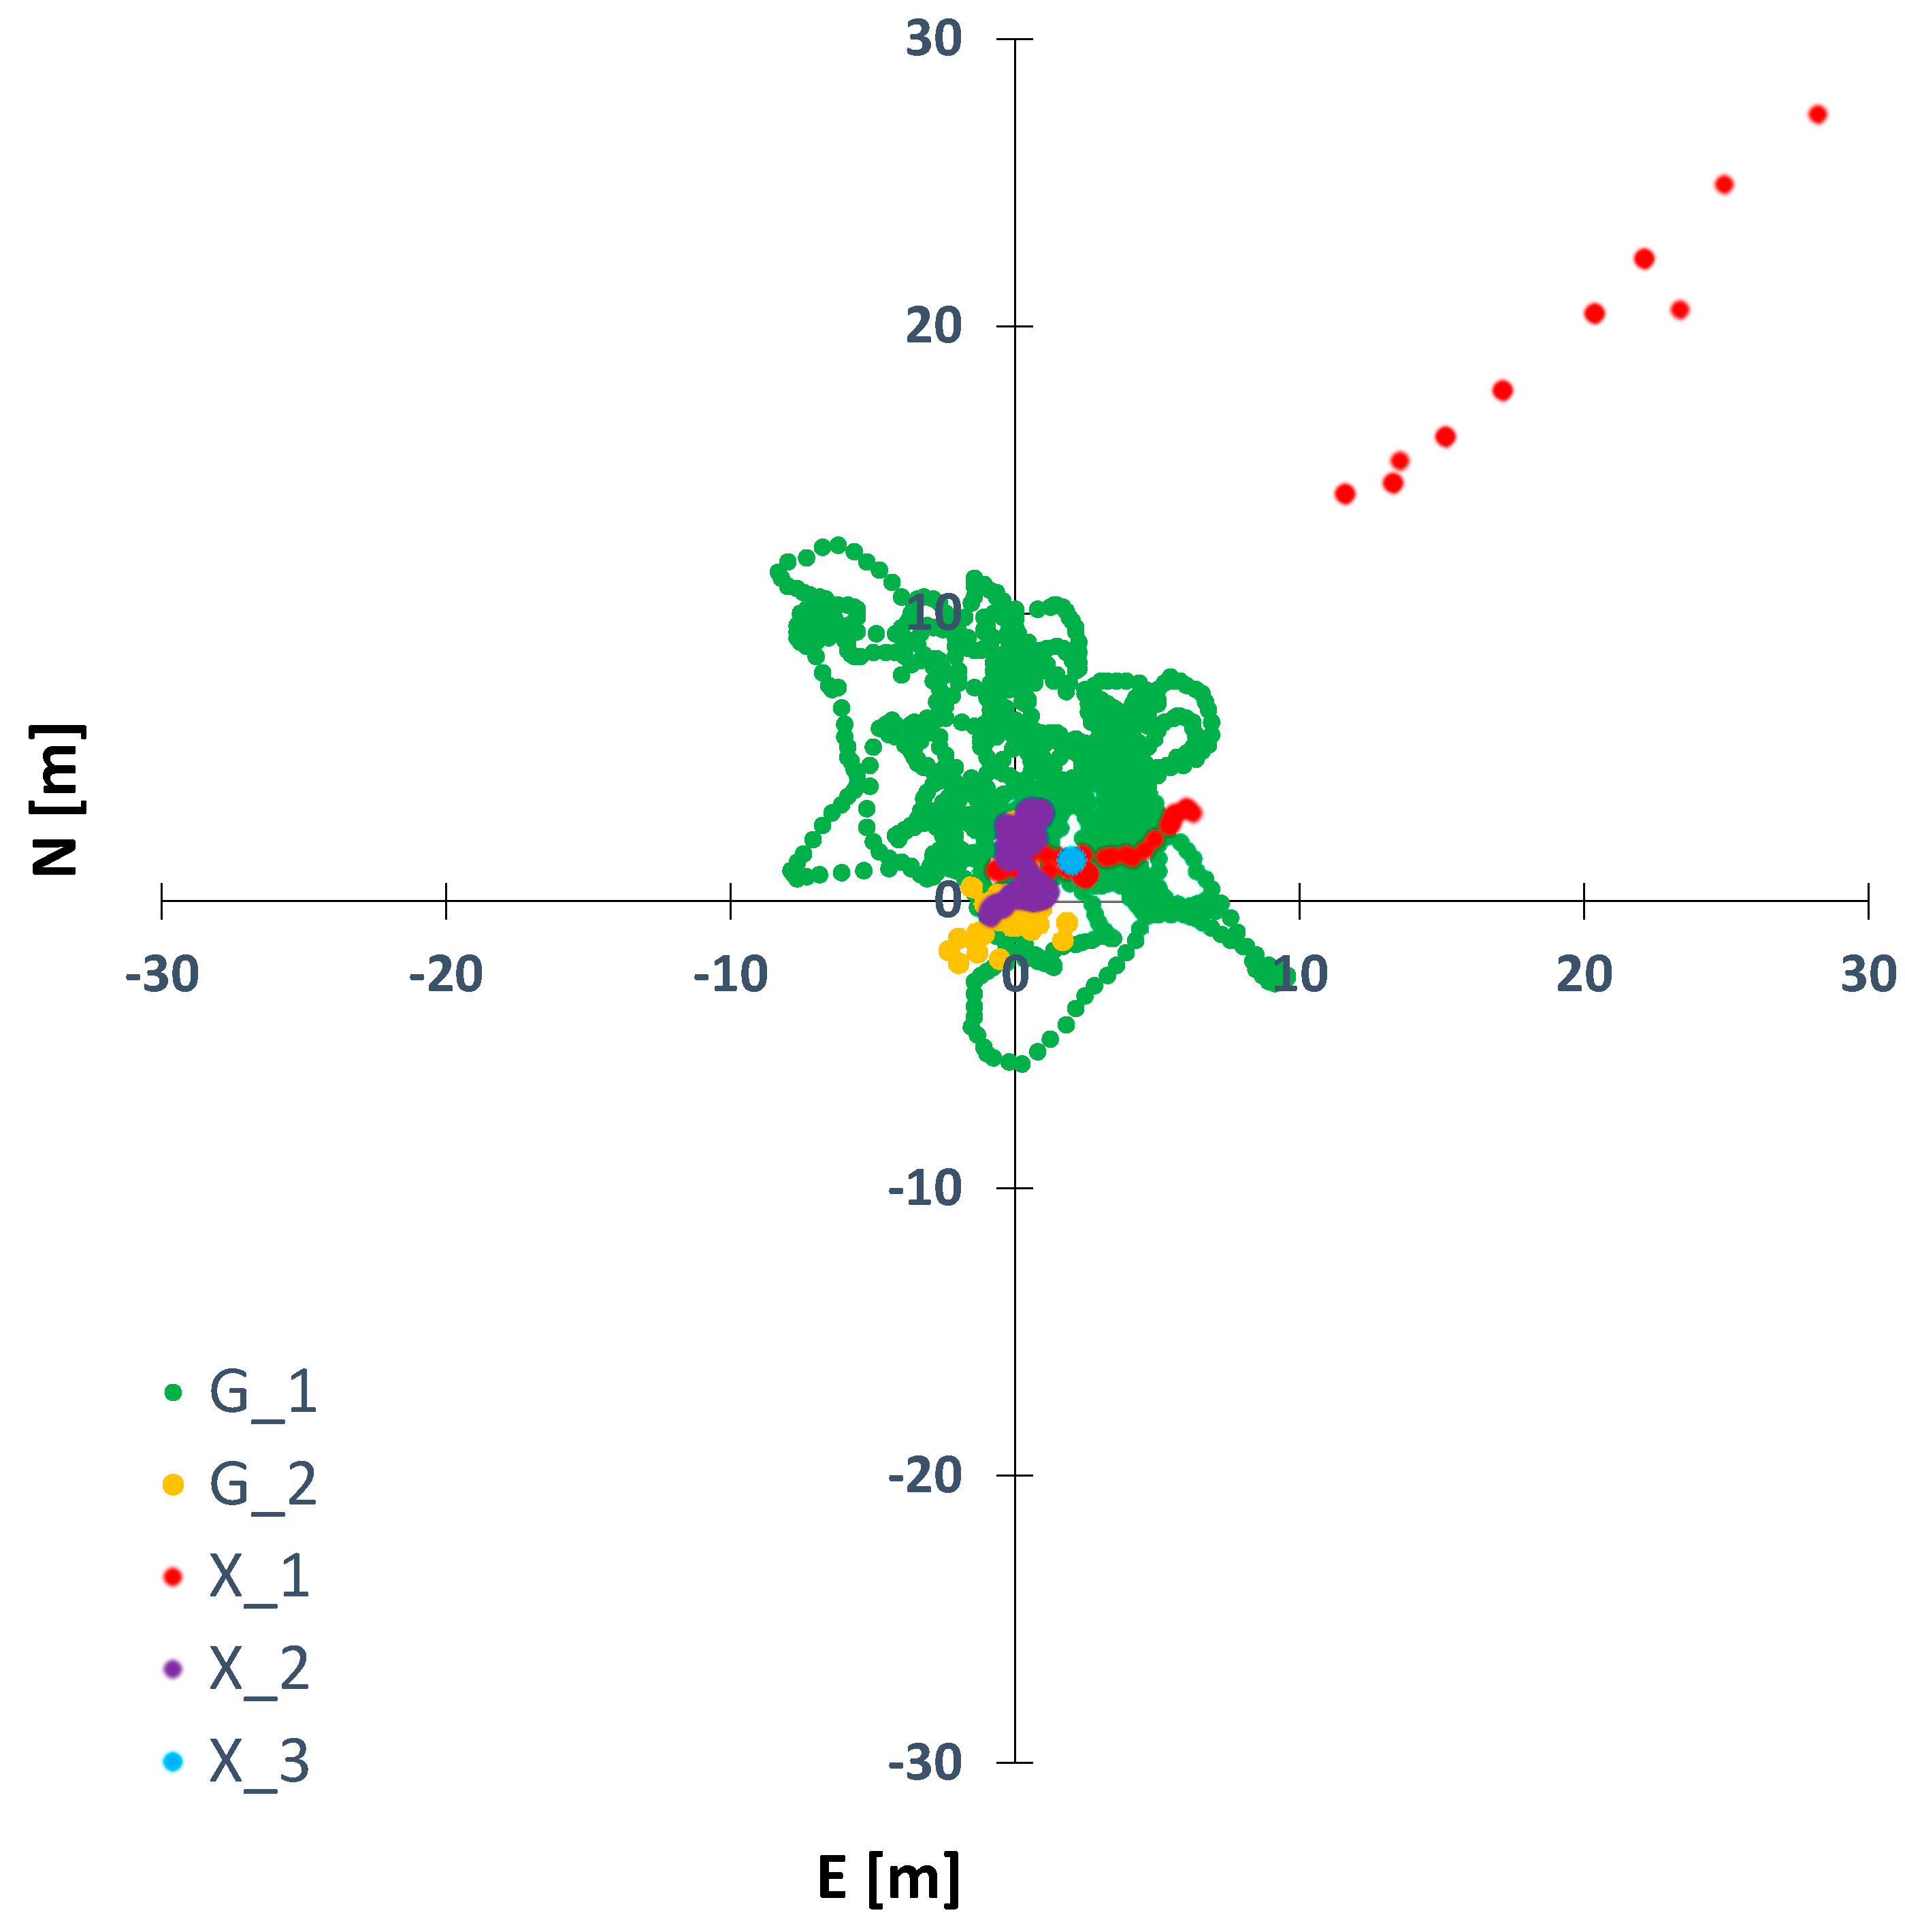
4.2. Line
4.3. Surface
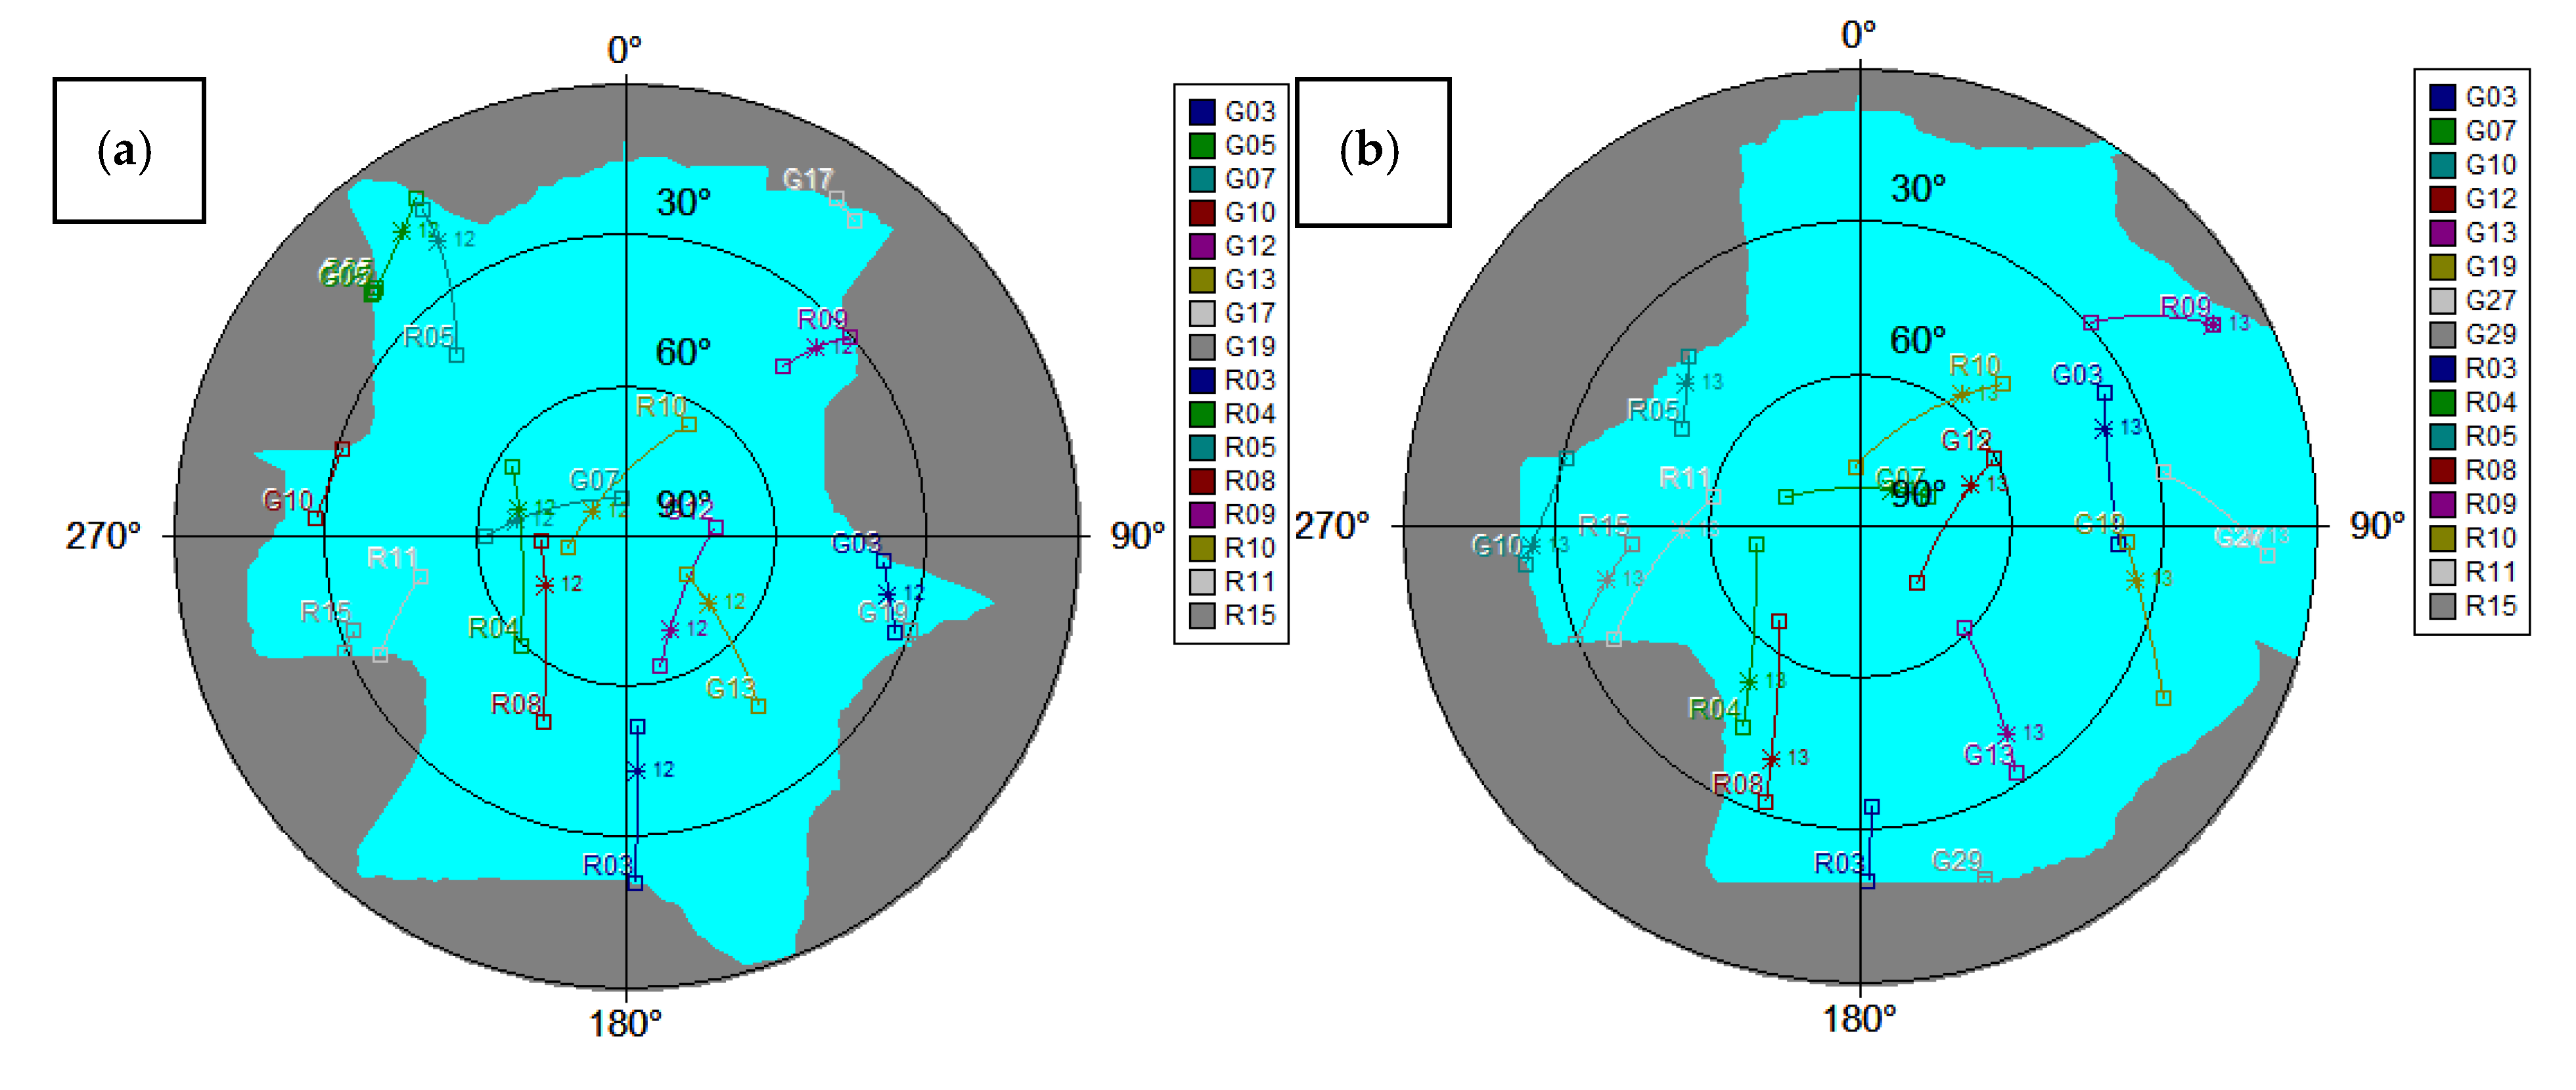
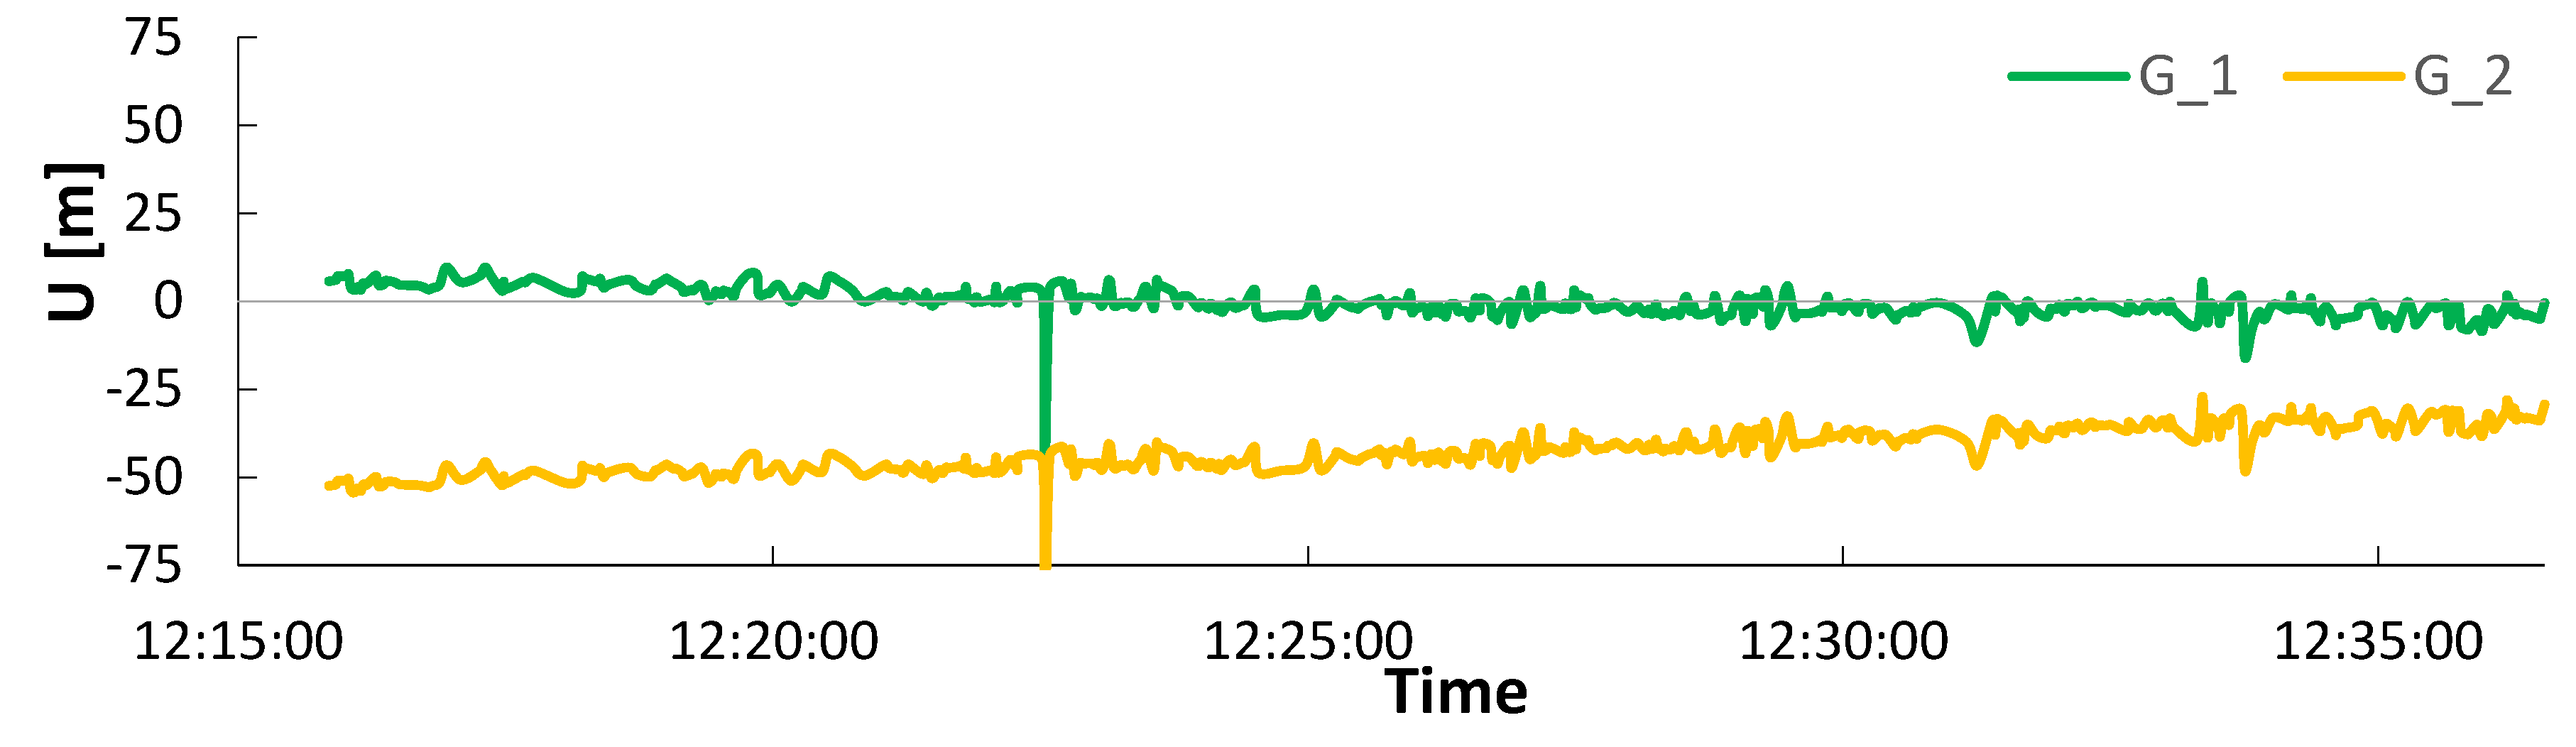
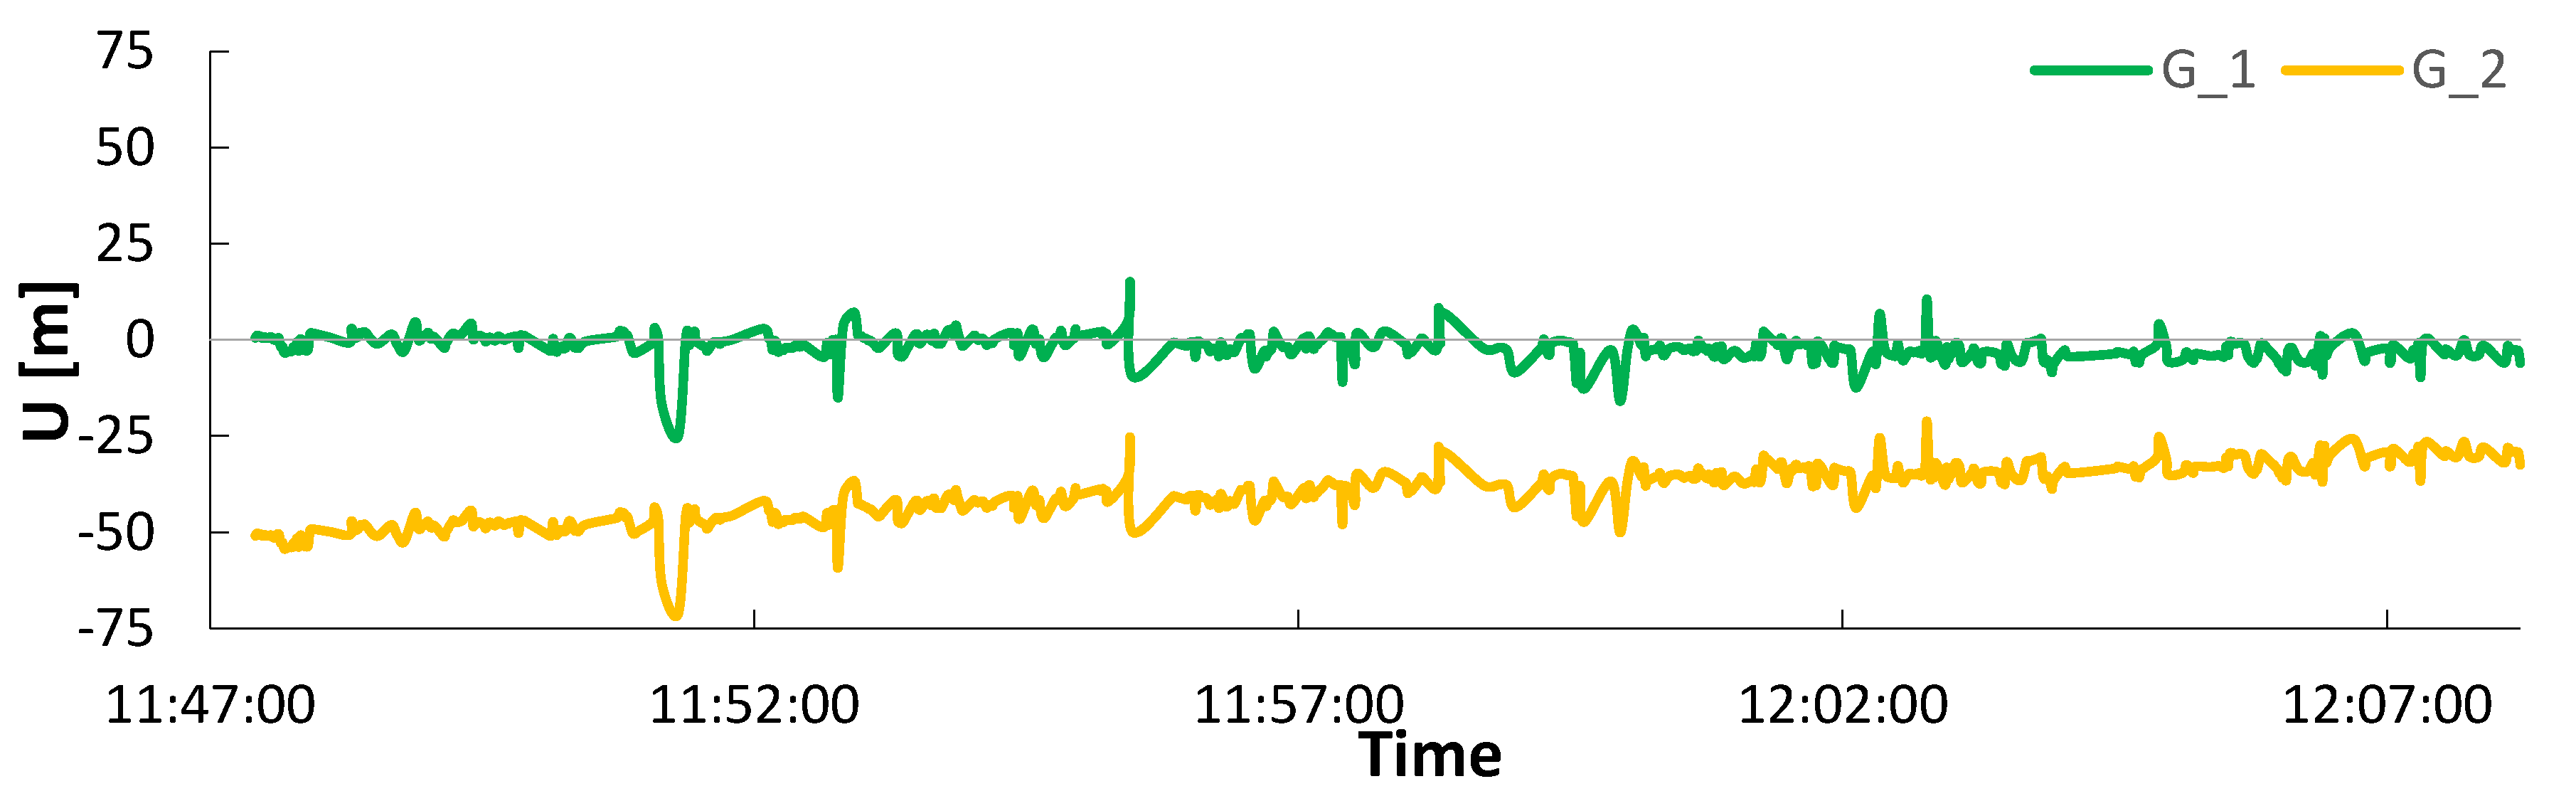
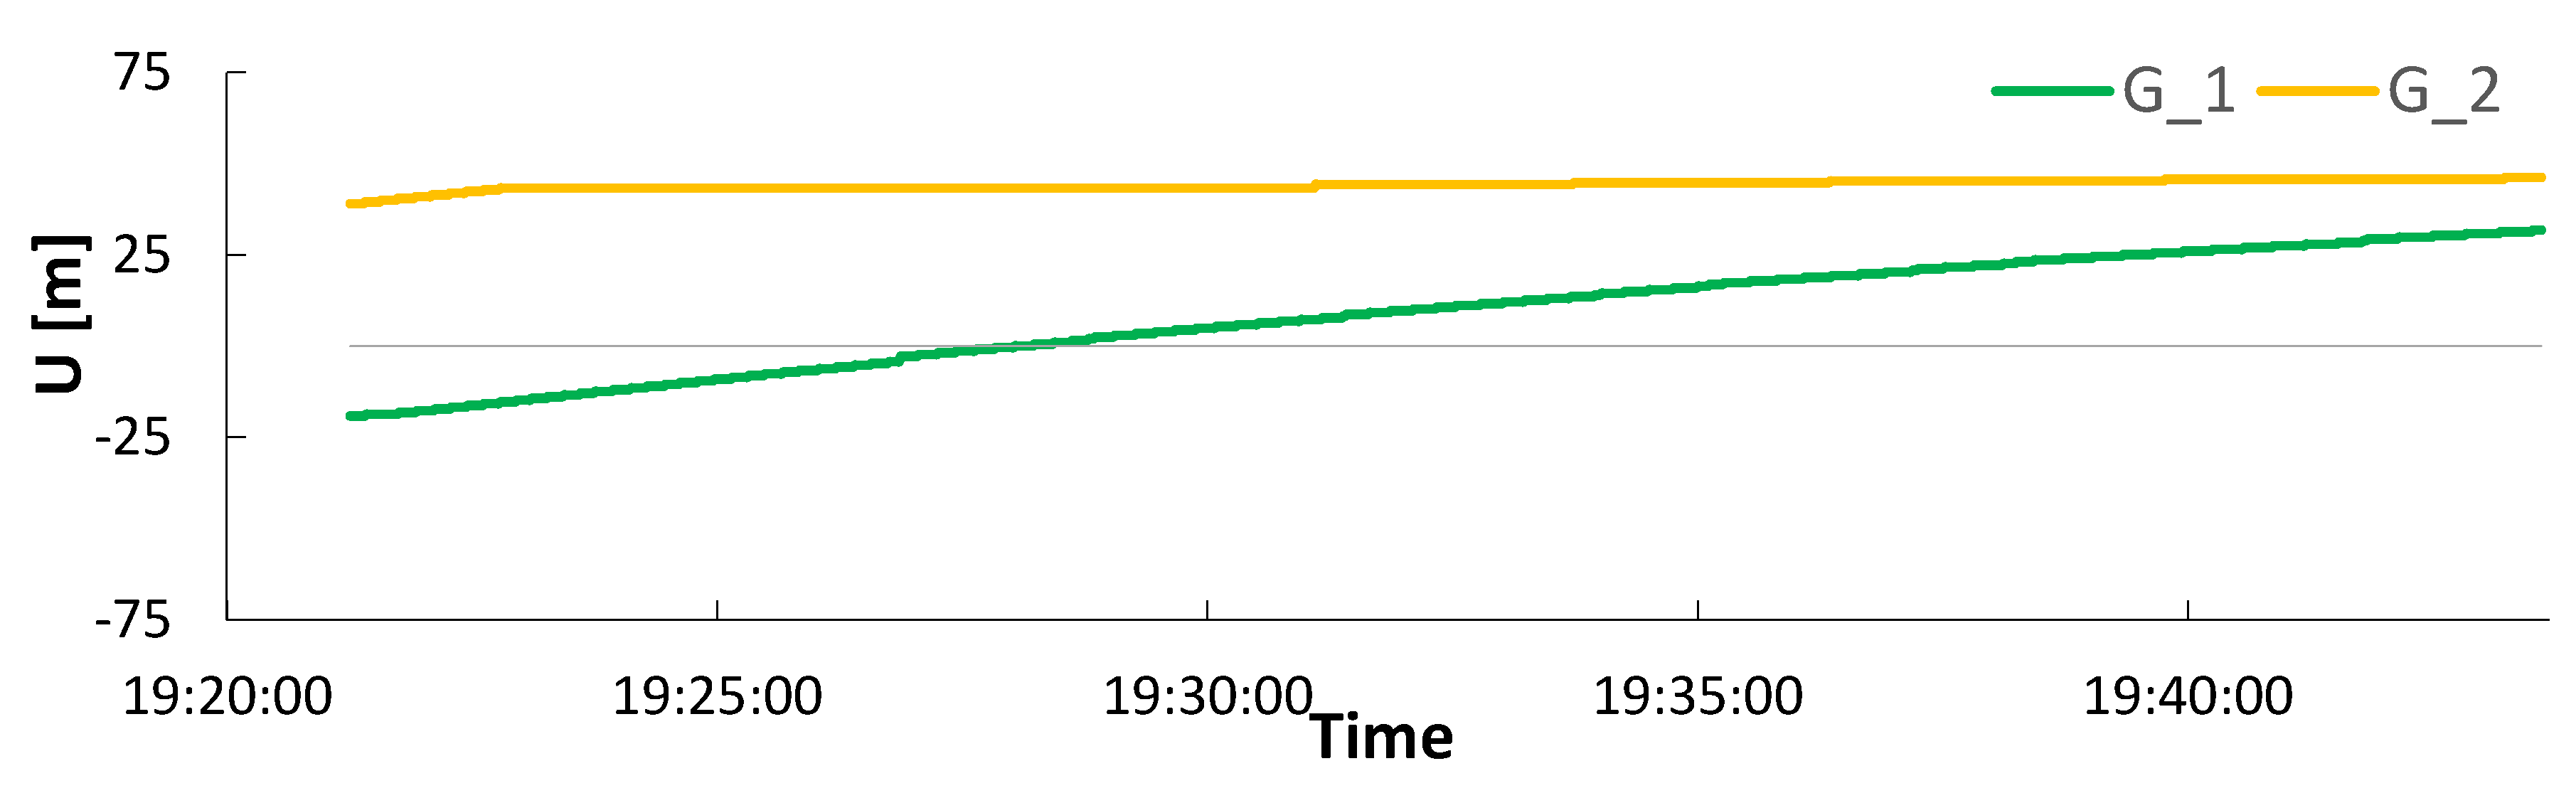
4.4. Static Session
5. Conclusions
6. Future Works
Author Contributions
Funding
Data Availability Statement
Conflicts of Interest
References
- Zrinjski, M.; Matika, K.; Barković, Đ. Razvoj i modernizacija GNSS-a. Geod. List 2019, 73, 45–65. [Google Scholar]
- Petrovski, I.G. GPS, GLONASS, Galileo, and Beidou for Mobile Devices; Cambridge University Press: Cambridge, UK, 2012; Volume 9781107035. [Google Scholar]
- Cutugno, M.; Robustelli, U.; Pugliano, G. Low-Cost GNSS Software Receiver Performance Assessment. Geosciences 2020, 10, 79. [Google Scholar] [CrossRef] [Green Version]
- Kudrys, J. Spectral analysis of multi-year GNSS code multipath time-series. Bud. Archit. 2020, 18, 15–22. [Google Scholar] [CrossRef]
- Mohammed, I.H.; Ataiwe, T.N.; Al Sharaa, H. Accuracy Assessment of a Variety of GPS Data Processing, Online Services and Software. Geomat. Environ. Eng. 2021, 15, 5–19. [Google Scholar] [CrossRef]
- Apollo, M.; Andreychouk, V.; Moolio, P.; Wengel, Y.; Myga-Piątek, U. Does the altitude of habitat influence residents’ attitudes to guests? A new dimension in the residents’ attitudes to tourism. J. Outdoor Recreat. Tour. 2020, 31, 100312. [Google Scholar] [CrossRef]
- Gabryszuk, J. The Potential to Use Smartphone-based GNSS Receivers for Surveying. Geomat. Environ. Eng. 2020, 14, 49–57. [Google Scholar] [CrossRef]
- Lipatnikov, L.A.; Shevchuk, S.O. Cost Effective Precise Positioning with GNSS; FIG Publication: Copenhagen, Denmark, 2019. [Google Scholar]
- Weston, M.D.; Schwieger, V. Cost Effective GNSS Positioning Techniques; FIG Publication: Copenhagen, Denmark, 2010; ISBN 9788790907792. [Google Scholar]
- Specht, C.; Dabrowski, P.S.; Pawelski, J.; Specht, M.; Szot, T. Comparative analysis of positioning accuracy of GNSS receivers of Samsung Galaxy smartphones in marine dynamic measurements. Adv. Space Res. 2019, 63, 3018–3028. [Google Scholar] [CrossRef]
- Zangenehnejad, F.; Gao, Y. GNSS smartphones positioning: Advances, challenges, opportunities, and future perspectives. Satell. Navig. 2021, 2, 24. [Google Scholar] [CrossRef]
- Skorupa, B. The problem of GNSS positioning with measurements recorded using Android mobile devices. Bud. i Archit. 2019, 18, 51–62. [Google Scholar] [CrossRef] [Green Version]
- European GNSS Agency. GNSS Market Report; EUSPA: Prague, Czechia, 2019. [Google Scholar]
- Psychas, D.; Bruno, J.; Massarweh, L.; Darugna, F. Towards Sub-meter Positioning using Android Raw GNSS Measurements. In Proceedings of the 32nd International Technical Meeting of the Satellite Division of the Institute of Navigation, ION GNSS+, Miami, FL, USA, 16–20 September 2019; pp. 3917–3931. [Google Scholar]
- Karki, B.; Won, M. Characterizing Power Consumption of Dual-Frequency GNSS of Smartphone. In Proceedings of the GLOBECOM 2020—2020 IEEE Global Communications Conference, Taipei, Taiwan, 7–11 December 2020; IEEE: New York, NY, USA, 2020; pp. 1–6. [Google Scholar]
- Elmezayen, A.; El-Rabbany, A. Precise point positioning using world’s first dual-frequency GPS/galileo smartphone. Sensors 2019, 19, 2593. [Google Scholar] [CrossRef] [Green Version]
- Robustelli, U.; Baiocchi, V.; Pugliano, G. Assessment of dual frequency GNSS observations from a Xiaomi Mi 8 android smartphone and positioning performance analysis. Electronics 2019, 8, 91. [Google Scholar] [CrossRef] [Green Version]
- Adam, C.; Grzegorz, G. Karolina, Ł. Analiza dokładności pozycjonowania pojazdu w ruchu miejskim za pomocą smartfonów wyposażonych w chipset GPS oraz GPS_GLONASS. Logistyka 2015, 3, 737–743. [Google Scholar]
- Merry, K.; Bettinger, P. Smartphone GPS accuracy study in an urban environment. PLoS ONE 2019, 14, e0219890. [Google Scholar] [CrossRef] [PubMed] [Green Version]
- Paziewski, J.; Fortunato, M.; Mazzoni, A.; Odolinski, R. An analysis of multi-GNSS observations tracked by recent Android smartphones and smartphone-only relative positioning results. Meas. J. Int. Meas. Confed. 2021, 175, 109162. [Google Scholar] [CrossRef]
- Uradziński, M.; Bakuła, M. Assessment of static positioning accuracy using low-cost smartphone GPS devices for geodetic survey points’ determination and monitoring. Appl. Sci. 2020, 10, 5308. [Google Scholar] [CrossRef]
- Wanninger, L.; Heßelbarth, A. GNSS code and carrier phase observations of a Huawei P30 smartphone: Quality assessment and centimeter-accurate positioning. GPS Solut. 2020, 24, 64. [Google Scholar] [CrossRef] [Green Version]
- Pesyna, K.M.; Heath, R.W.; Humphreys, T.E. Centimeter positioning with a smartphone-Quality GNSS antenna. In Proceedings of the 27th International Technical Meeting of the Satellite Division of the Institute of Navigation, ION GNSS, Tampa, FL, USA, 8–12 September 2014; Volume 2. [Google Scholar]
- Ziętala, M. Stability of GPS and GLONASS onboard clocks on a monthly basis. Sci. J. Silesian Univ. Technol. Ser. Transp. 2022, 114, 193–209. [Google Scholar] [CrossRef]
- Krasuski, K.; Bakuła, M. Operation and reliability of an onboard GNSS receiver during an in-flight test. Sci. J. Silesian Univ. Technol. Ser. Transp. 2021, 111, 75–88. [Google Scholar] [CrossRef]
- Ng, H.F.; Zhang, G.; Hsu, L.T. GNSS NLOS pseudorange correction based on skymask for smartphone applications. In Proceedings of the 32nd International Technical Meeting of the Satellite Division of the Institute of Navigation, ION GNSS+, Miami, FL, USA, 16–20 September 2019; pp. 109–119. [Google Scholar]
- Xiao, A.; Chen, R.; Li, D.; Chen, Y.; Wu, D. An indoor positioning system based on static objects in large indoor scenes by using smartphone cameras. Sensors 2018, 18, 2229. [Google Scholar] [CrossRef] [Green Version]
- Poulose, A.; Eyobu, O.S.; Han, D.S. An indoor position-estimation algorithm using smartphone IMU sensor data. IEEE Access 2019, 7, 11165–11177. [Google Scholar] [CrossRef]
- Shinghal, G.; Bisnath, S. Conditioning and PPP processing of smartphone GNSS measurements in realistic environments. Satell. Navig. 2021, 2, 10. [Google Scholar] [CrossRef] [PubMed]
- Wang, G.; Bo, Y.; Yu, Q.; Li, M.; Yin, Z.; Chen, Y. Ionosphere-constrained single-frequency ppp with an android smartphone and assessment of gnss observations. Sensors 2020, 20, 5917. [Google Scholar] [CrossRef] [PubMed]
- Tunalioglu, N.; Ocalan, T.; Dogan, A.H. Precise Point Positioning with GNSS Raw Measurements from an Android Smartphone in Marine Environment Monitoring. Mar. Geod. 2022, 45, 274–294. [Google Scholar] [CrossRef]
- Lachapelle, G.; Gratton, P.; Horrelt, J.; Lemieux, E.; Broumandan, A. Evaluation of a low cost hand held unit with GNSS raw data capability and comparison with an android smartphone. Sensors 2018, 18, 4185. [Google Scholar] [CrossRef] [PubMed] [Green Version]
- Paziewski, J.; Sieradzki, R.; Baryla, R. Signal characterization and assessment of code GNSS positioning with low-power consumption smartphones. GPS Solut. 2019, 23, 98. [Google Scholar] [CrossRef] [Green Version]
- Lu, X.; Wang, H.; Tang, S.; Huang, H.; Li, C. DM-SLAM: Monocular SLAM in Dynamic Environments. Appl. Sci. 2020, 10, 4252. [Google Scholar] [CrossRef]
- Andriyanov, N.; Khasanshin, I.; Utkin, D.; Gataullin, T.; Ignar, S.; Shumaev, V.; Soloviev, V. Intelligent System for Estimation of the Spatial Position of Apples Based on YOLOv3 and Real Sense Depth Camera D415. Symmetry 2022, 14, 148. [Google Scholar] [CrossRef]
- Chaplot, D.S.; Gandhi, D.; Gupta, S.; Gupta, A.; Salakhutdinov, R. Learning to Explore using Active Neural SLAM. arXiv 2020. [Google Scholar] [CrossRef]
- Ali, S.H. Technical Report: Determination of the orthometric height inside Mosul University campus by using GPS data and the EGM96 gravity field model. J. Appl. Geod. 2007, 1, 241–247. [Google Scholar] [CrossRef]
- Hanagan, C.; Mershon, B. Geoid Height Calculator; UNAVCO: Boulder, CO, USA, 2020. [Google Scholar]
- GUGiK. Transpol v.2.06; ALGORES-SOFT Roman Kadaj i Tomasz Świętoń: Warsaw, Poland, 2013. [Google Scholar]
- Kuna, D.; Santhosh, N.; Perumalla, N.K. Preliminary Analysis of Standalone Galileo and NavIC in the context of Positioning Performance for Low Latitude Region. Procedia Comput. Sci. 2020, 171, 225–234. [Google Scholar] [CrossRef]


| Receiver | Mode | Marking |
|---|---|---|
| Xiaomi Mi 2 | GPS | X_1 |
| GPS | X_2 | |
| GPS | X_3 | |
| Garmin eTrex 3 | GPS | G_1 |
| GPS+GLONASS | G_2 |
| Object | Coordinate/Error [m] | Receiver | ||||
|---|---|---|---|---|---|---|
| G_1 | G_2 | X_1 | X_2 | X_3 | ||
| Point | N/σN | 3.0/2.0 | 0.8/0.7 | 2.8/2.4 | 0.6/0.3 | 2.0/0.0 |
| E/σE | 4.8/3.0 | 0.9/0.7 | 1.2/2.5 | 1.1/1.2 | 1.4/0.0 | |
| U/σU | 9.1/1.0 | 8.7/0.4 | - | - | - | |
| Line | N/σN | 3.0/2.5 | 3.4/2.5 | 43.0/28.5 | 8.1/3.7 | 10.5/4.0 |
| E/σE | 1.4/1.1 | 2.0/1.5 | 4.1/2.7 | 1.8/1.6 | 2.0/1.2 | |
| U/σU | 3.0/3.2 | 42.1/6.6 | - | - | - | |
| Circle | N/σN | 2.6/1.9 | 1.9/1.6 | 20.4/11.6 | 5.6/3.2 | 5.5/3.1 |
| E/σE | 2.8/1.8 | 1.9/1.4 | 30.3/25.6 | 5.1/3.2 | 4.4/2.8 | |
| U/σU | 2.6/2.6 | 40.1/7.1 | - | - | - | |
Publisher’s Note: MDPI stays neutral with regard to jurisdictional claims in published maps and institutional affiliations. |
© 2022 by the authors. Licensee MDPI, Basel, Switzerland. This article is an open access article distributed under the terms and conditions of the Creative Commons Attribution (CC BY) license (https://creativecommons.org/licenses/by/4.0/).
Share and Cite
Magiera, W.; Vārna, I.; Mitrofanovs, I.; Silabrieds, G.; Krawczyk, A.; Skorupa, B.; Apollo, M.; Maciuk, K. Accuracy of Code GNSS Receivers under Various Conditions. Remote Sens. 2022, 14, 2615. https://0-doi-org.brum.beds.ac.uk/10.3390/rs14112615
Magiera W, Vārna I, Mitrofanovs I, Silabrieds G, Krawczyk A, Skorupa B, Apollo M, Maciuk K. Accuracy of Code GNSS Receivers under Various Conditions. Remote Sensing. 2022; 14(11):2615. https://0-doi-org.brum.beds.ac.uk/10.3390/rs14112615
Chicago/Turabian StyleMagiera, Weronika, Inese Vārna, Ingus Mitrofanovs, Gunārs Silabrieds, Artur Krawczyk, Bogdan Skorupa, Michal Apollo, and Kamil Maciuk. 2022. "Accuracy of Code GNSS Receivers under Various Conditions" Remote Sensing 14, no. 11: 2615. https://0-doi-org.brum.beds.ac.uk/10.3390/rs14112615