
Assessing the Applications of Earth Observation Data for Monitoring Artisanal and Small-Scale Gold Mining (ASGM) in Developing Countries

 ,
,  , ,
, ,
Abstract
:
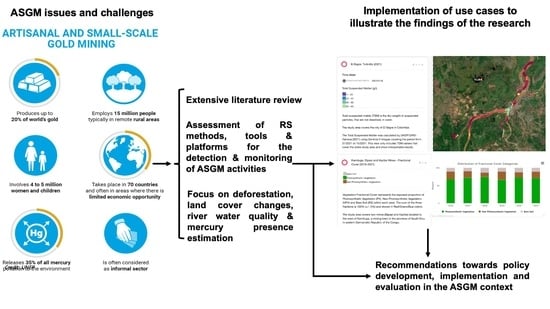
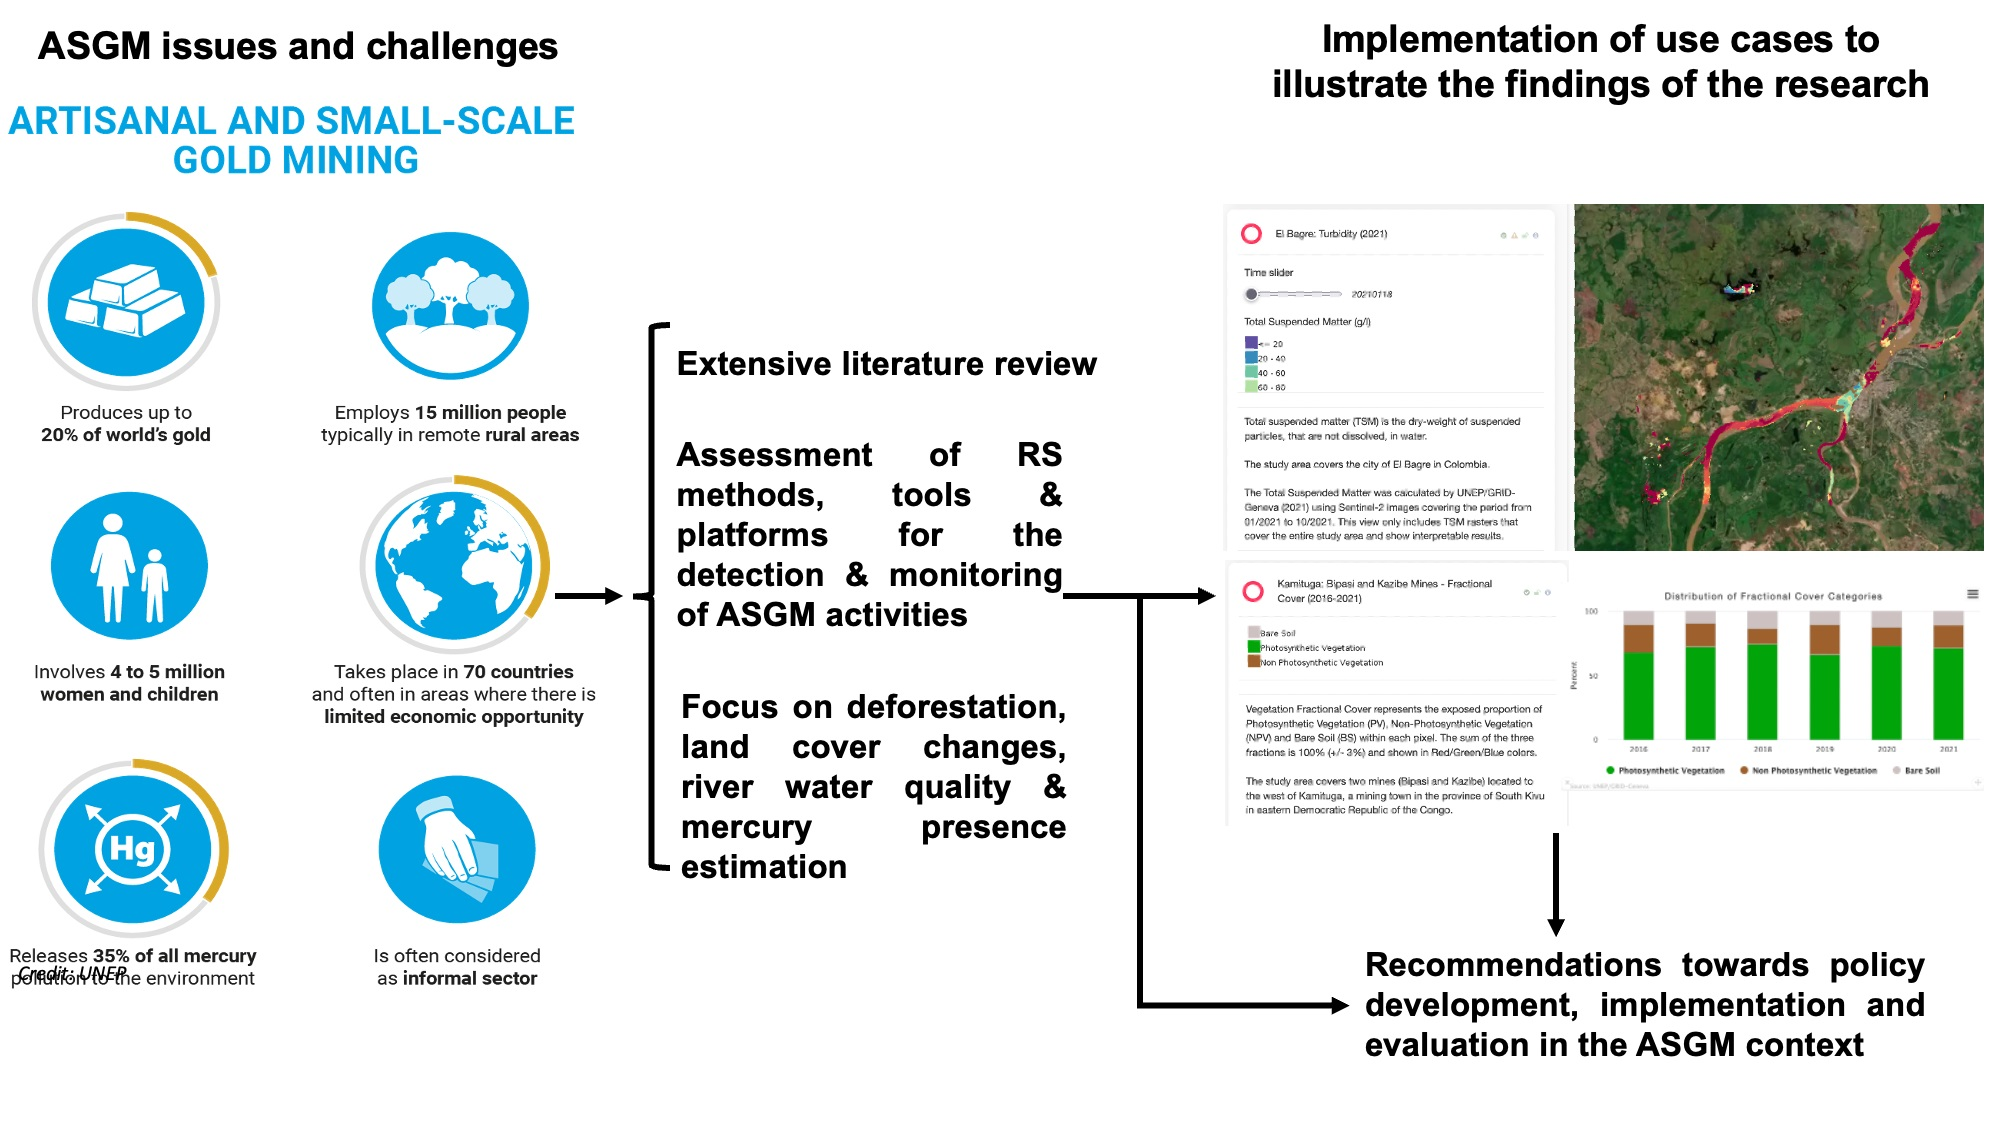
1. Introduction
2. Materials and Methods
2.1. Literature Review
2.2. Assessment of RS Methods Applied to ASGM Sector
2.2.1. Overview
- The evaluation of deforestation or land cover change caused by the mining processes (generally related to alluvial mines and open pit mines) [31].
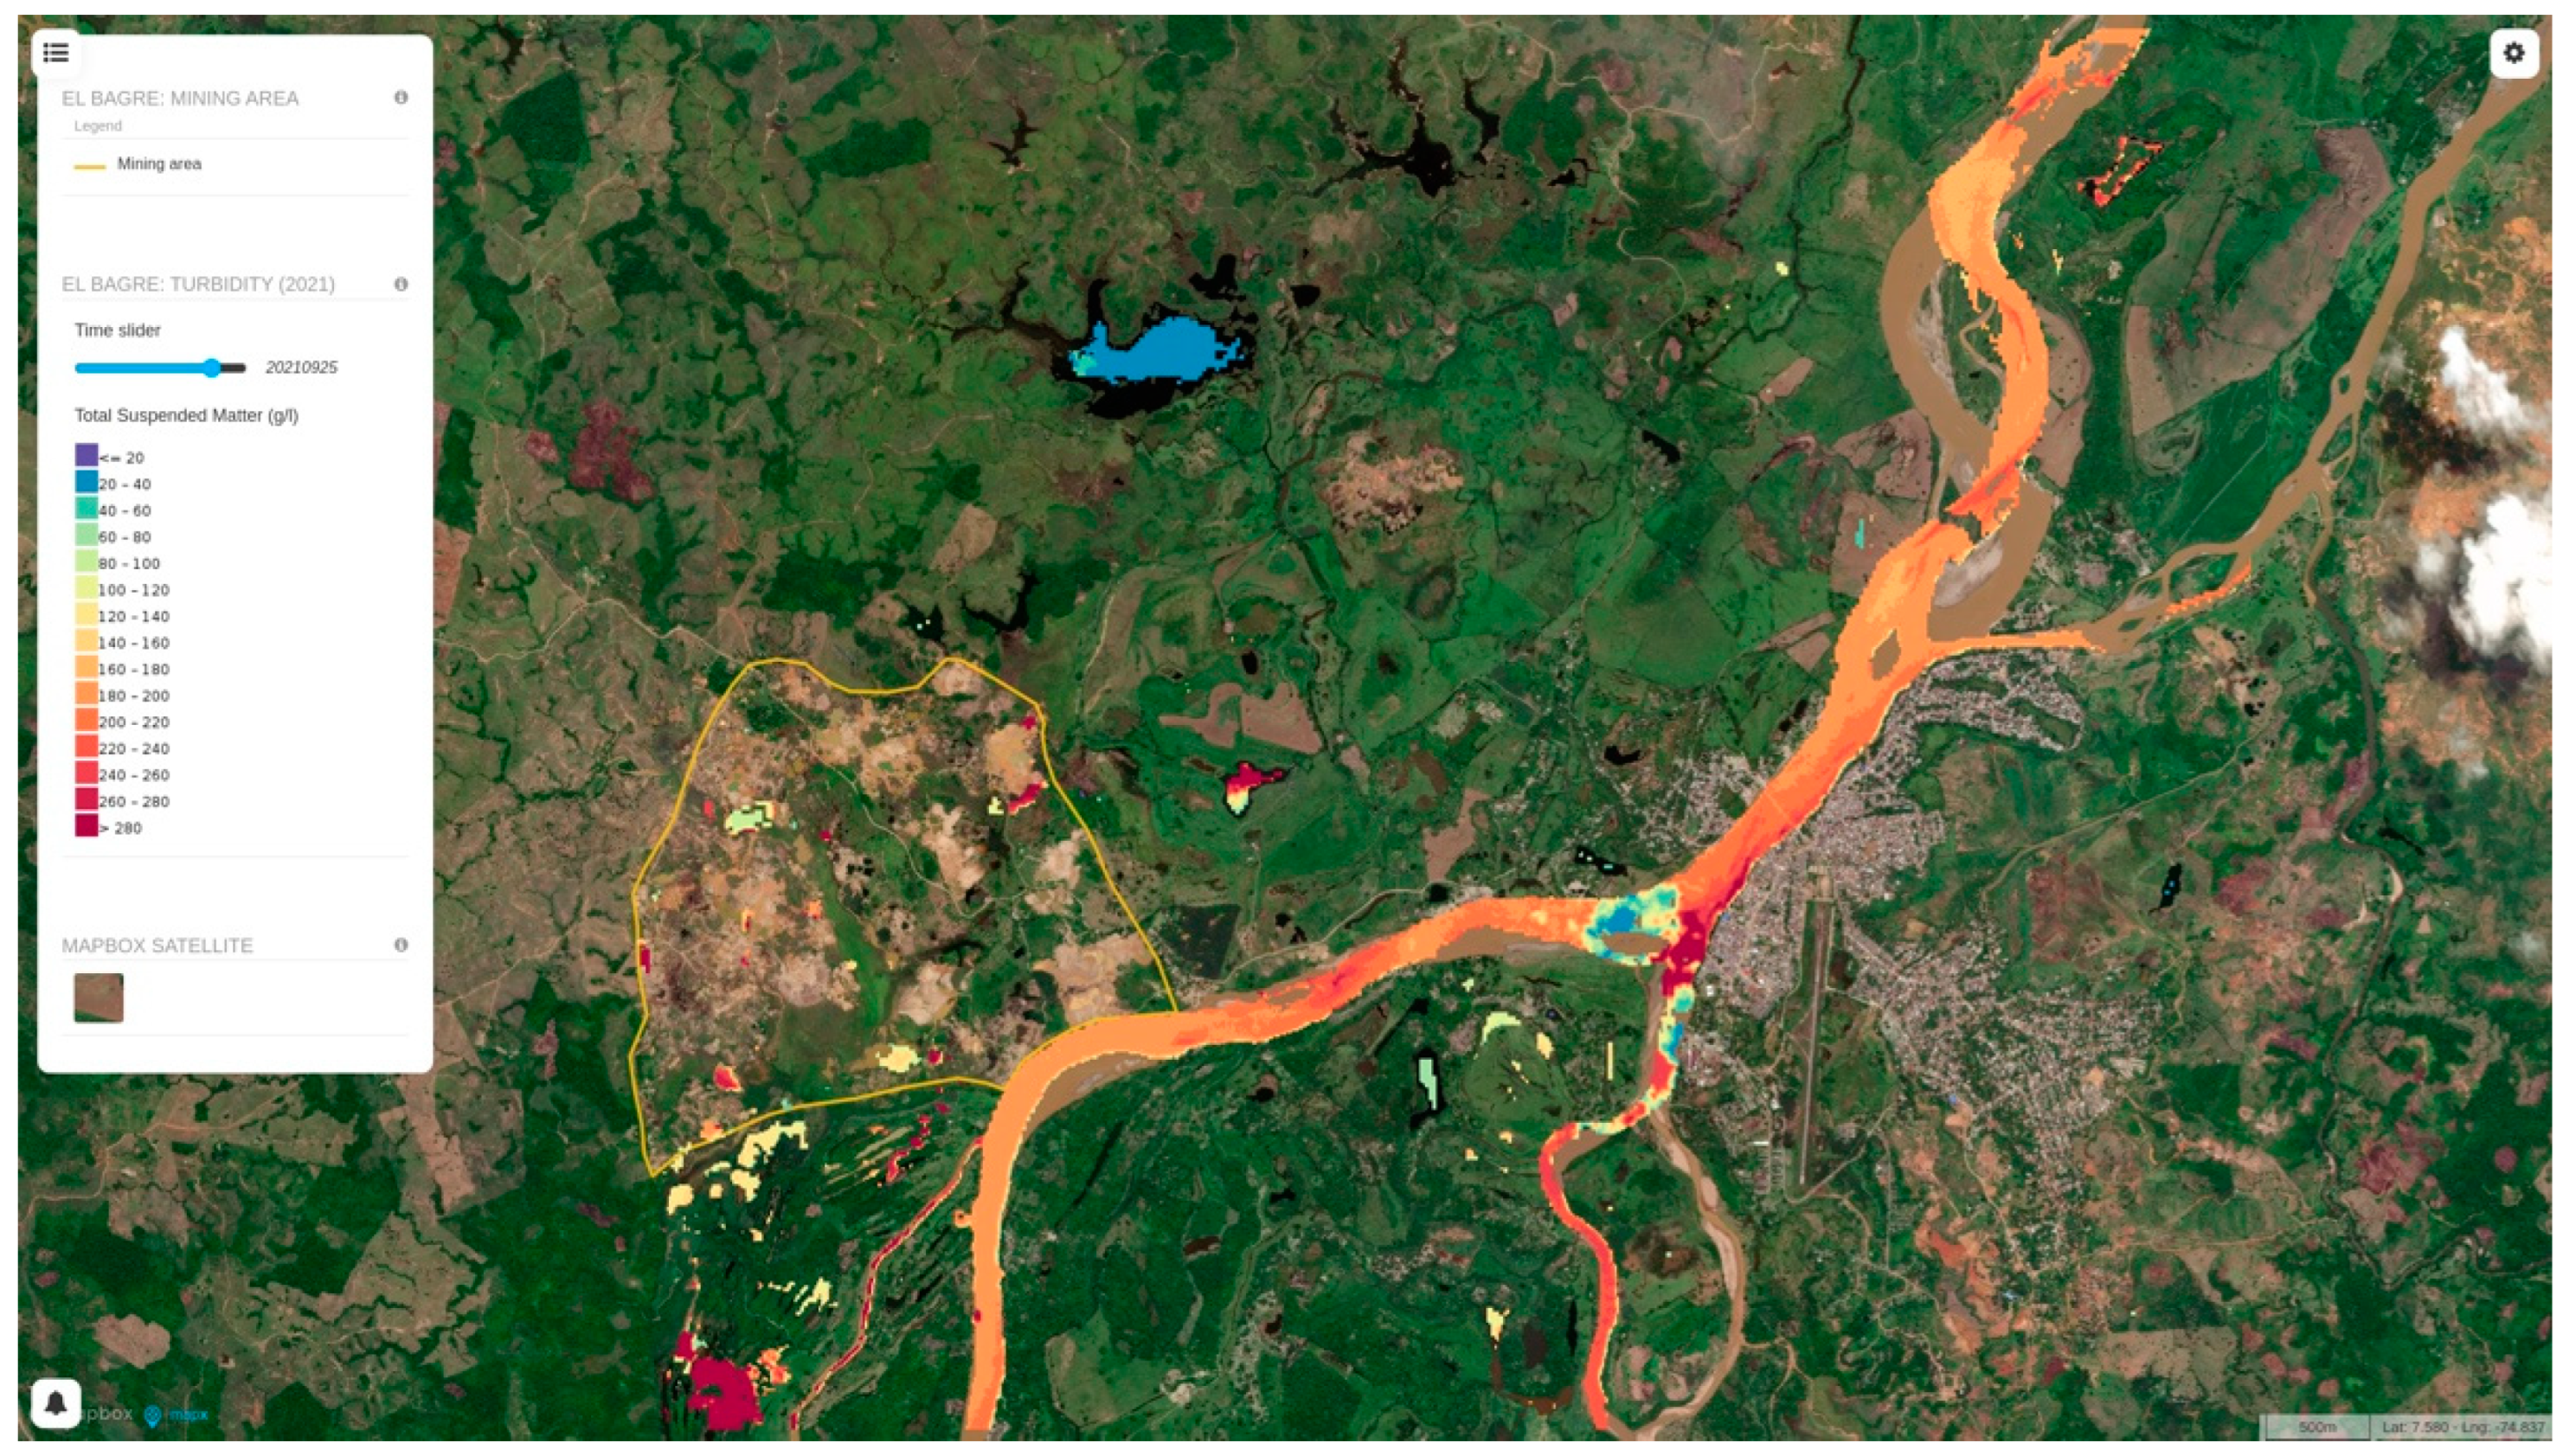
- The evaluation of water pollution caused by the mining activity in proximity to rivers or on river channels by detecting water turbidity levels in stream channels.
- Detecting and estimating mercury presence using spectral signatures and assay laboratory confirmations.
2.2.2. Utilized Platforms and Sensors
2.2.3. Approaches and Tools for Data Analysis
2.2.4. RS for Deforestation and Landcover Change
2.2.5. RS for Detecting Impact on Rivers
2.2.6. RS Supporting Mercury Presence Estimation
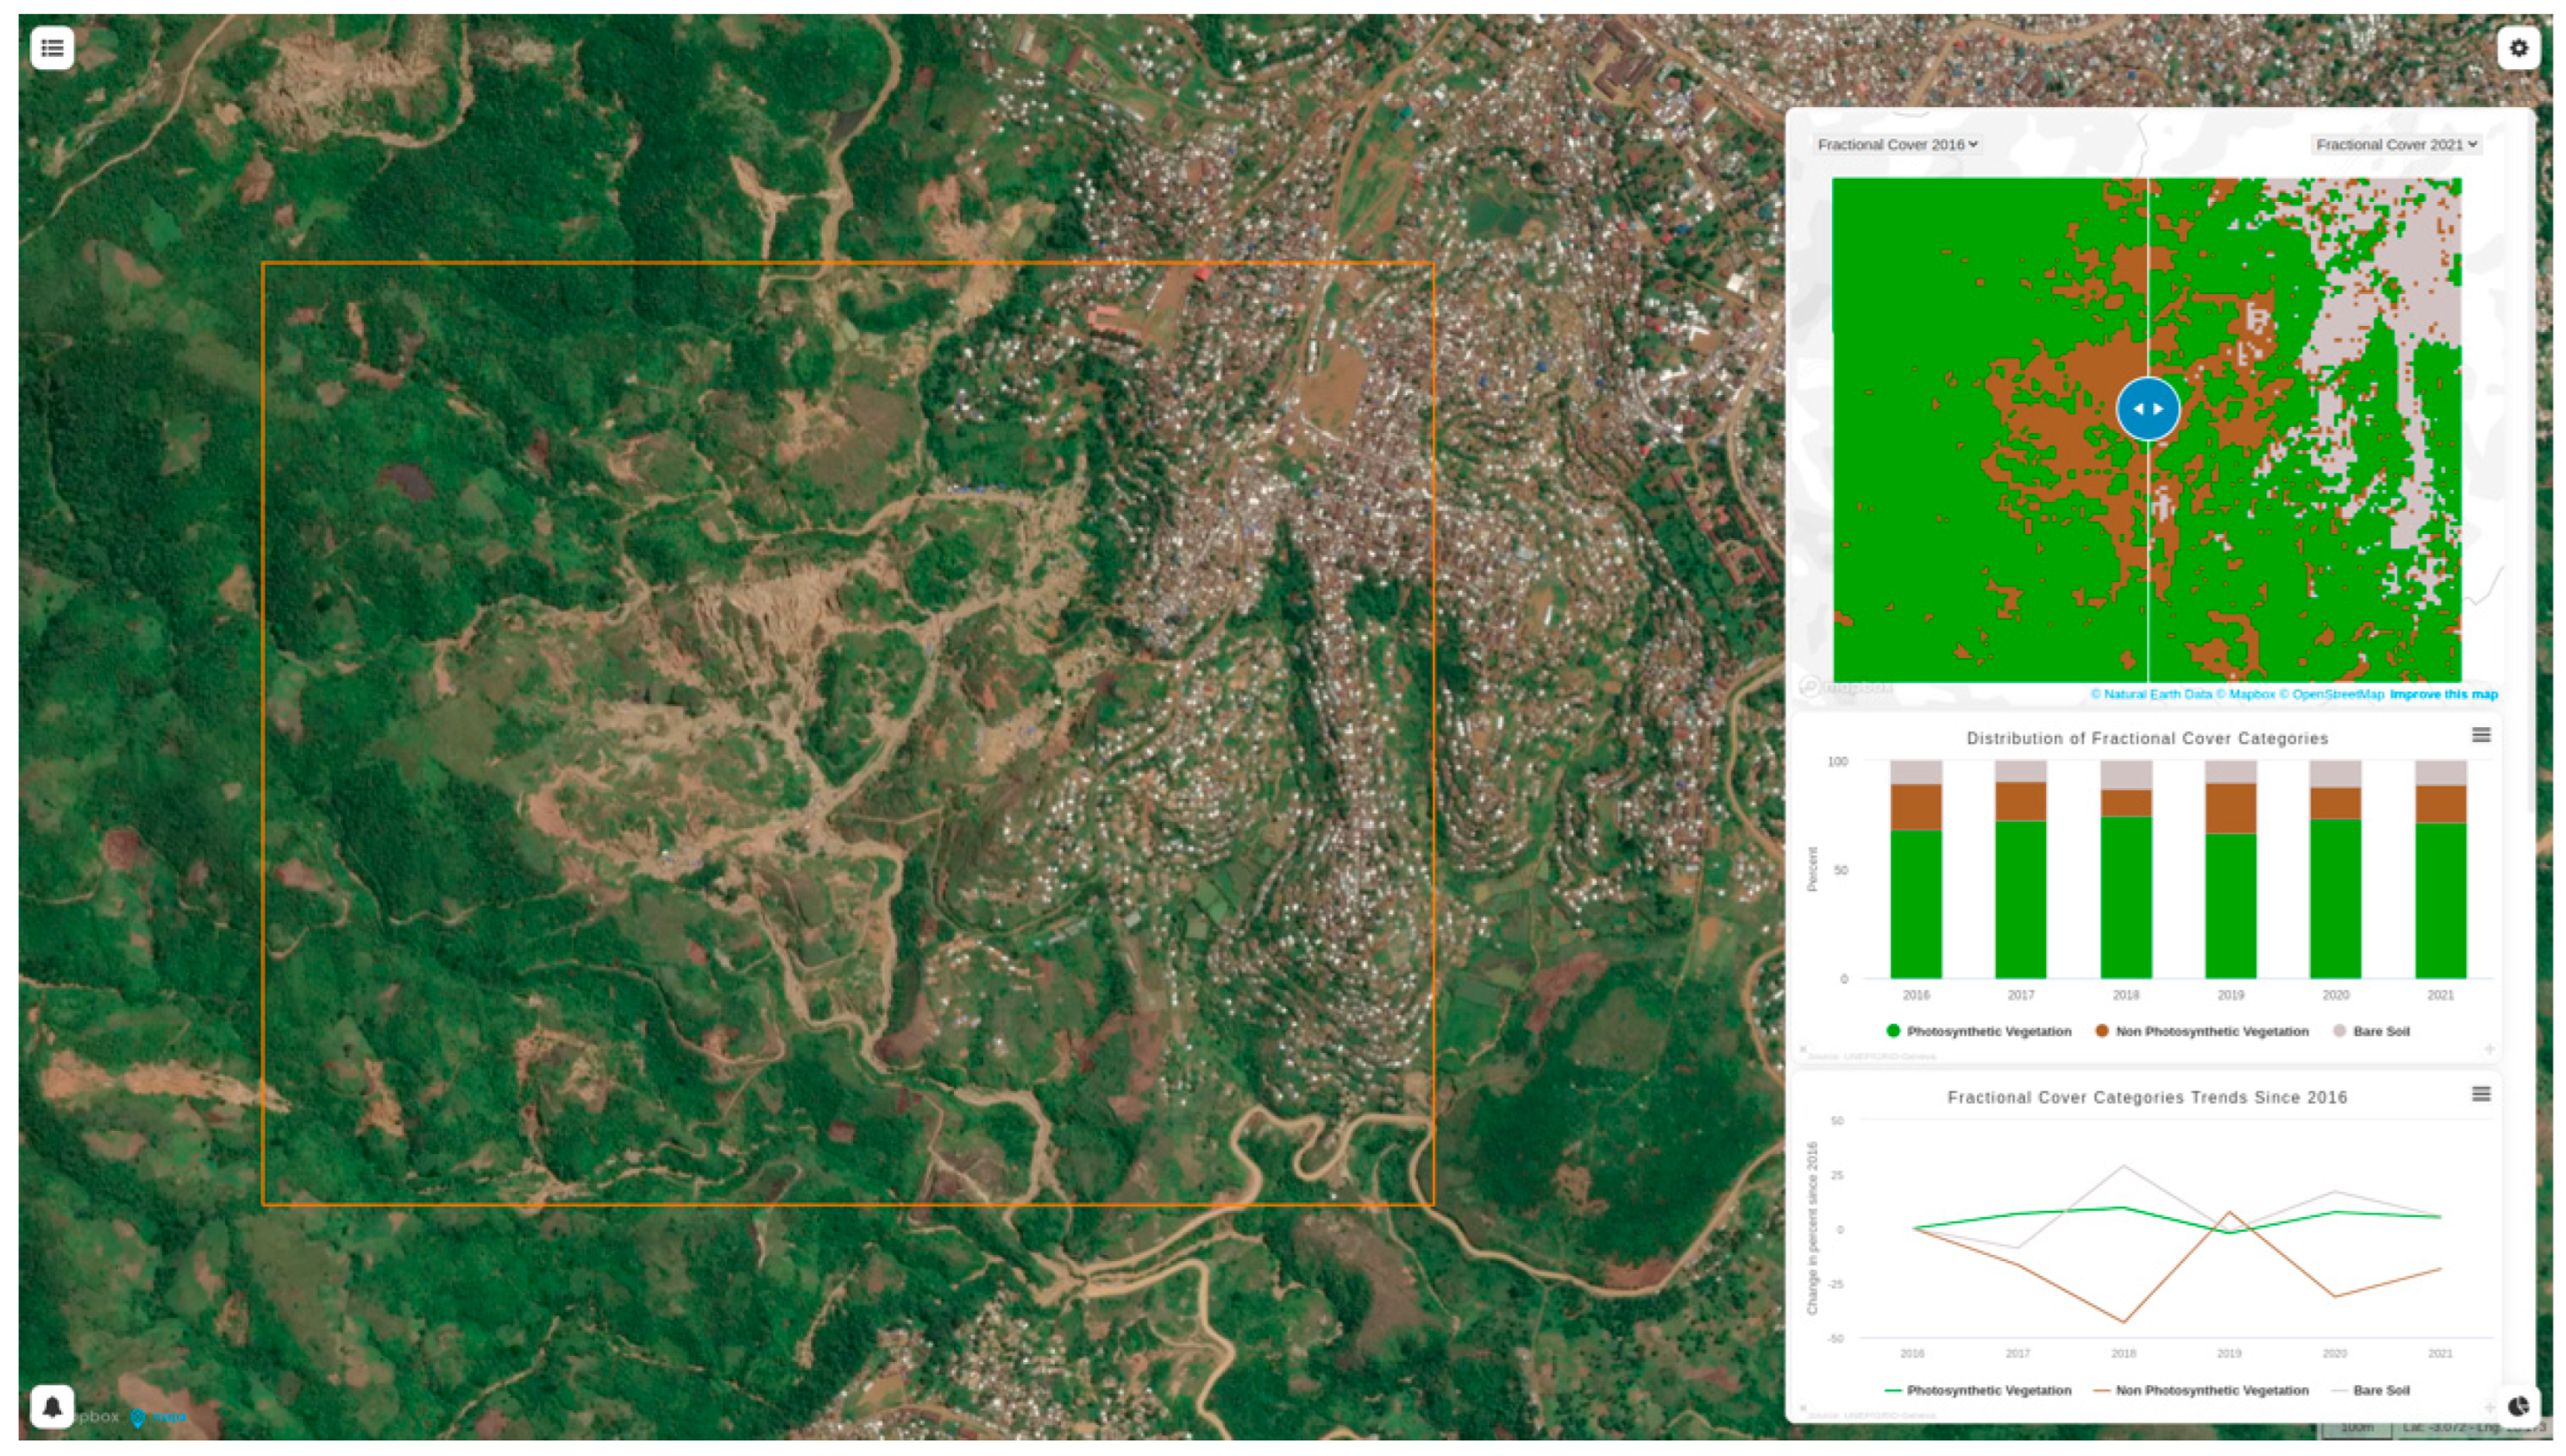
3. Case studies Using the Open Data Cube and MapX
3.1. Overview
3.2. The Case of Land Cover/Land Use Monitoring
3.3. The Case of Water Turbidity
4. Discussion
4.1. Observations
Study Limitations and Prospects
4.2. Recommendations
5. Conclusions
Author Contributions
Funding
Data Availability Statement
Acknowledgments
Conflicts of Interest
References
- Tsang, V.W.L.; Lockhart, K.; Spiegel, S.J.; Yassi, A. Occupational Health Programs for Artisanal and Small-Scale Gold Mining: A Systematic Review for the WHO Global Plan of Action for Workers’ Health. Ann. Glob. Health 2019, 85, 128. [Google Scholar] [CrossRef]
- United Nations Department of Economic and Social Affairs, Resources and Transport Division. Small-Scale Mining in the Developing Countries; United Nations: New York, NY, USA, 1972. [Google Scholar]
- Labonne, B. Seminar on artisanal and small-scale mining in Africa. Identifying best practices and building the sustainable livelihoods of communities. In Recommendations: Yaounde Vision Statement; CRC Press: Yaounde, Cameroun, 2002. [Google Scholar]
- Africa Mining Vision; UNECA: Addis Ababa, Ethiopia, 2009.
- Franks, D.M.; Ngonze, C.; Pakoun, L.; Hailu, D. Voices of Artisanal and Small-Scale Mining, Visions of the Future: Report from the International Conference on Artisanal and Small-Scale Mining and Quarrying. Extr. Ind. Soc. 2020, 7, 505–511. [Google Scholar] [CrossRef]
- World Bank. 2020 State of the Artisanal and Small-Scale Mining Sector; World Bank: Washington, DC, USA, 2020. [Google Scholar]
- Rajaee, M.; Obiri, S.; Green, A.; Long, R.; Cobbina, S.J.; Nartey, V.; Buck, D.; Antwi, E.; Basu, N. Integrated Assessment of Artisanal and Small-Scale Gold Mining in Ghana—Part 2: Natural Sciences Review. Int. J. Environ. Res. Public Health 2015, 12, 8971–9011. [Google Scholar] [CrossRef] [Green Version]
- Gari, S.R.; Ortiz Guerrero, C.E.; A-Uribe, B.; Icely, J.D.; Newton, A. A DPSIR-Analysis of Water Uses and Related Water Quality Issues in the Colombian Alto and Medio Dagua Community Council. Water Sci. 2018, 32, 318–337. [Google Scholar] [CrossRef] [Green Version]
- Esdaile, L.J.; Chalker, J.M. The Mercury Problem in Artisanal and Small-Scale Gold Mining. Chem. Eur. J. 2018, 24, 6905–6916. [Google Scholar] [CrossRef] [Green Version]
- UNEP. Global Mercury Assessment 2018; UNEP: Nairobi, Kenya, 2019. [Google Scholar]
- Rettberg, A.; Ortiz-Riomalo, J.F. Golden Opportunity, or a New Twist on the Resource–Conflict Relationship: Links between the Drug Trade and Illegal Gold Mining in Colombia. World Dev. 2016, 84, 82–96. [Google Scholar] [CrossRef]
- Li, Y.; Zhao, H.; Fan, J. Application of Remote Sensing Technology in Mine Environment Monitoring. MATEC Web Conf. 2015, 22, 04008. [Google Scholar] [CrossRef] [Green Version]
- Barenblitt, A.; Payton, A.; Lagomasino, D.; Fatoyinbo, L.; Asare, K.; Aidoo, K.; Pigott, H.; Som, C.K.; Smeets, L.; Seidu, O.; et al. The Large Footprint of Small-Scale Artisanal Gold Mining in Ghana. Sci. Total Environ. 2021, 781, 146644. [Google Scholar] [CrossRef]
- Bruno, D.E.; Ruban, D.A.; Tiess, G.; Pirrone, N.; Perrotta, P.; Mikhailenko, A.V.; Ermolaev, V.A.; Yashalova, N.N. Artisanal and Small-Scale Gold Mining, Meandering Tropical Rivers, and Geological Heritage: Evidence from Brazil and Indonesia. Sci. Total Environ. 2020, 715, 136907. [Google Scholar] [CrossRef]
- Isidro, C.; Mcintyre, N.; Lechner, A.; Callow, I. Applicability of Earth Observation for Identifying Small-Scale Mining Footprints in a Wet Tropical Region. Remote Sens. 2017, 9, 945. [Google Scholar] [CrossRef] [Green Version]
- Ibrahim, E.; Jiang, J.; Lema, L.; Barnabé, P.; Giuliani, G.; Lacroix, P.; Pirard, E. Cloud and Cloud-Shadow Detection for Applications in Mapping Small-Scale Mining in Colombia Using Sentinel-2 Imagery. Remote Sens. 2021, 13, 736. [Google Scholar] [CrossRef]
- Lobo, F.D.L.; Costa, M.; Novo, E.M.L.M.; Telmer, K. Distribution of Artisanal and Small-Scale Gold Mining in the Tapajós River Basin (Brazilian Amazon) over the Past 40 Years and Relationship with Water Siltation. Remote Sens. 2016, 8, 579. [Google Scholar] [CrossRef] [Green Version]
- Lobo, F.; Novo, E.; Barbosa, C.; Vasconcelos, V. Monitoring Water Siltation Caused by Small-Scale Gold Mining in Amazonian Rivers Using Multi-Satellite Images. In Limnology: Some New Aspects of Inland Water Ecology; IntechOpen: London, UK, 2018; ISBN 978-1-83880-788-7. [Google Scholar]
- Nyamekye, C.; Ghansah, B.; Agyapong, E.; Kwofie, S. Mapping Changes in Artisanal and Small-Scale Mining (ASM) Landscape Using Machine and Deep Learning Algorithms—A Proxy Evaluation of the 2017 Ban on ASM in Ghana. Environ. Chall. 2021, 3, 100053. [Google Scholar] [CrossRef]
- Telmer, K.; Stapper, D. Evaluating and Monitoring Small Scale Gold Mining and Mercury Use: Building a Knowledge-Base with Satellite Imagery and Field Work; United Nations Industrial Development Organization: Victoria, BC, Canada, 2007. [Google Scholar]
- Forkuor, G.; Ullmann, T.; Griesbeck, M. Mapping and Monitoring Small-Scale Mining Activities in Ghana Using Sentinel-1 Time Series (2015–2019). Remote Sens. 2020, 12, 911. [Google Scholar] [CrossRef] [Green Version]
- Adler Miserendino, R.; Bergquist, B.A.; Adler, S.E.; Guimarães, J.R.D.; Lees, P.S.J.; Niquen, W.; Velasquez-López, P.C.; Veiga, M.M. Challenges to Measuring, Monitoring, and Addressing the Cumulative Impacts of Artisanal and Small-Scale Gold Mining in Ecuador. Resour. Policy 2013, 38, 713–722. [Google Scholar] [CrossRef]
- Elsayed Zeinelabdein, K.A.; El-Nadi, A.H.H.; Babiker, I.S. Prospecting for Gold Mineralization with the Use of Remote Sensing and GIS Technology in North Kordofan State, Central Sudan. Sci. Afr. 2020, 10, e00627. [Google Scholar] [CrossRef]
- The Environment Protection Agency of Sierra Leone. The ASGM Overview of Sierra Leone; 685; Environment Protection Agency: Freetown, Sierra Leone, 2019.
- UNECA. Minerals and Africa’s Development; UNECA: Addis Ababa, Ethiopia, 2011. [Google Scholar]
- Pullin, A.S.; Stewart, G.B. Guidelines for Systematic Review in Conservation and Environmental Management. Conserv. Biol. 2006, 20, 1647–1656. [Google Scholar] [CrossRef]
- Collaboration for Environmental Evidence. Guidelines for Systematic Review in Environmental Management; Wiley: Hoboken, NJ, USA, 2013. [Google Scholar]
- Plummer, R.; de Loë, R.; Armitage, D. A Systematic Review of Water Vulnerability Assessment Tools. Water Resour. Manag. 2012, 26, 4327–4346. [Google Scholar] [CrossRef] [Green Version]
- Lillesand, T.; Kiefer, R.W.; Chipman, J. Remote Sensing and Image Interpretation, 7th ed.; Wiley: Hoboken, NJ, USA, 2015. [Google Scholar]
- Russell, E.W. Aerial Photography and Remote Sensing for Soil Survey. Exp. Agric. 1978, 14, 400. [Google Scholar] [CrossRef]
- Mhangara, P.; Tsoeleng, L.T.; Mapurisa, W. Monitoring the Development of Artisanal Mines in South Africa. J. S. Afr. Inst. Min. Metall. 2020, 120, 299–306. [Google Scholar] [CrossRef]
- Soudani, K.; François, C.; le Maire, G.; Le Dantec, V.; Dufrêne, E. Comparative Analysis of IKONOS, SPOT, and ETM+ Data for Leaf Area Index Estimation in Temperate Coniferous and Deciduous Forest Stands. Remote Sens. Environ. 2006, 102, 161–175. [Google Scholar] [CrossRef] [Green Version]
- Du, Y.; Zhang, Y.; Ling, F.; Wang, Q.; Li, W.; Li, X. Water Bodies’ Mapping from Sentinel-2 Imagery with Modified Normalized Difference Water Index at 10-m Spatial Resolution Produced by Sharpening the SWIR Band. Remote Sens. 2016, 8, 354. [Google Scholar] [CrossRef] [Green Version]
- Maxwell, A.E.; Warner, T.A.; Fang, F. Implementation of Machine-Learning Classification in Remote Sensing: An Applied Review. Int. J. Remote Sens. 2018, 39, 2784–2817. [Google Scholar] [CrossRef] [Green Version]
- Alloghani, M.; Al-Jumeily, D.; Mustafina, J.; Hussain, A.; Aljaaf, A.J. A Systematic Review on Supervised and Unsupervised Machine Learning Algorithms for Data Science. In Supervised and Unsupervised Learning for Data Science; Berry, M.W., Mohamed, A., Yap, B.W., Eds.; Unsupervised and Semi-Supervised Learning; Springer International Publishing: Cham, Switzerland, 2020; pp. 3–21. ISBN 978-3-030-22475-2. [Google Scholar]
- Bivand, R.S. Progress in the R Ecosystem for Representing and Handling Spatial Data. J. Geogr. Syst. 2021, 23, 515–546. [Google Scholar] [CrossRef]
- Gomes, V.C.F.; Queiroz, G.R.; Ferreira, K.R. An Overview of Platforms for Big Earth Observation Data Management and Analysis. Remote Sens. 2020, 12, 1253. [Google Scholar] [CrossRef] [Green Version]
- Blaschke, T.; Hay, G.J.; Kelly, M.; Lang, S.; Hofmann, P.; Addink, E.; Queiroz Feitosa, R.; van der Meer, F.; van der Werff, H.; van Coillie, F.; et al. Geographic Object-Based Image Analysis—Towards a New Paradigm. ISPRS J. Photogramm. Remote Sens. 2014, 87, 180–191. [Google Scholar] [CrossRef] [Green Version]
- Ibrahim, E.; Lema, L.; Barnabé, P.; Lacroix, P.; Pirard, E. Small-Scale Surface Mining of Gold Placers: Detection, Mapping, and Temporal Analysis through the Use of Free Satellite Imagery. Int. J. Appl. Earth Obs. Geoinf. 2020, 93, 102194. [Google Scholar] [CrossRef]
- Ngom, N.M.; Mbaye, M.; Baratoux, D.; Baratoux, L.; Catry, T.; Dessay, N.; Faye, G.; Sow, E.H.; Delaitre, E. Mapping Artisanal and Small-Scale Gold Mining in Senegal Using Sentinel 2 Data. GeoHealth 2020, 4, e2020GH000310. [Google Scholar] [CrossRef]
- Kimijima, S.; Sakakibara, M.; Nagai, M. Detection of Artisanal and Small-Scale Gold Mining Activities and Their Transformation Using Earth Observation, Nighttime Light, and Precipitation Data. Int. J. Environ. Res. Public Health 2021, 18, 10954. [Google Scholar] [CrossRef]
- Novellino, A.; Fleming, C. Footprint of Mining Sites along the Migori River Using Earth Observation. Available online: http://nora.nerc.ac.uk/id/eprint/529987/ (accessed on 11 January 2022).
- UNODC. Colombia Explotación de Oro de Aluvión Evidencias a Partir de Percepción Remota 2020; UNODC: Vienna, Austria, 2021. [Google Scholar]
- Gallwey, J.; Robiati, C.; Coggan, J.; Vogt, D.; Eyre, M. A Sentinel-2 Based Multispectral Convolutional Neural Network for Detecting Artisanal Small-Scale Mining in Ghana: Applying Deep Learning to Shallow Mining. Remote Sens. Environ. 2020, 248, 111970. [Google Scholar] [CrossRef]
- Torres, R.M.; Yuen, P.W.T.; Yuan, C.; Piper, J.; McCullough, C.; Godfree, P. Spatial Spectral Band Selection for Enhanced Hyperspectral Remote Sensing Classification Applications. J. Imaging 2020, 6, 87. [Google Scholar] [CrossRef]
- Finer, M.; Novoa, M.S.; Saurez, D.; Mamni, N. MAAP #140: Detecting Illegal Gold Mining in Rivers with Specialized Satellites; MAAP: Washington DC, USA, 2021. [Google Scholar]
- Caballero Espejo, J.; Messinger, M.; Román-Dañobeytia, F.; Ascorra, C.; Fernandez, L.E.; Silman, M. Deforestation and Forest Degradation Due to Gold Mining in the Peruvian Amazon: A 34-Year Perspective. Remote Sens. 2018, 10, 1903. [Google Scholar] [CrossRef] [Green Version]
- Asner, G.P.; Llactayo, W.; Tupayachi, R.; Luna, E.R. Elevated Rates of Gold Mining in the Amazon Revealed through High-Resolution Monitoring. Proc. Natl. Acad. Sci. USA 2013, 110, 18454–18459. [Google Scholar] [CrossRef] [Green Version]
- Asner, G.P.; Tupayachi, R. Accelerated Losses of Protected Forests from Gold Mining in the Peruvian Amazon. Environ. Res. Lett. 2016, 12, 094004. [Google Scholar] [CrossRef]
- Ding, Q.; Cheng, G.; Wang, Y.; Zhuang, D. Effects of Natural Factors on the Spatial Distribution of Heavy Metals in Soils Surrounding Mining Regions. Sci. Total Environ. 2017, 578, 577–585. [Google Scholar] [CrossRef]
- Dethier, E.N.; Sartain, S.L.; Lutz, D.A. Heightened Levels and Seasonal Inversion of Riverine Suspended Sediment in a Tropical Biodiversity Hot Spot Due to Artisanal Gold Mining. Proc. Natl. Acad. Sci. USA 2019, 116, 23936–23941. [Google Scholar] [CrossRef]
- Le Tourneau, F.-M.; Albert, B. Usage de La Télédétection Dans Un Contexte Pluridisciplinaire: Impact de l’orpaillage, Agriculture Amérindienne et Régénération Naturelle Dans Une Région Du Territoire Yanomami (Amazonie Brésilienne). Teledetection 2005, 4, 335–371. [Google Scholar]
- Linarès, S.; Joubert, P.; Gond, V. Contre l’orpaillage clandestin: La télédétection. Espaces Nat. 2008, 23, 32–33. [Google Scholar]
- Brognoli, C. Détection par L’imagerie Satellite des Sites D’orpaillage sur le Territoire de la Guyane Française: Compte-rendu de Mission en Guyane Française, 8 Février–7 Avril 2004. Available online: https://agritrop.cirad.fr/538587/ (accessed on 11 January 2022).
- Giuliani, G.; Chatenoux, B.; Piller, T.; Moser, F.; Lacroix, P. Data Cube on Demand (DCoD): Generating an Earth Observation Data Cube Anywhere in the World. Int. J. Appl. Earth Obs. Geoinf. 2020, 87, 102035. [Google Scholar] [CrossRef]
- Lacroix, P.; Moser, F.; Benvenuti, A.; Piller, T.; Jensen, D.; Petersen, I.; Planque, M.; Ray, N. MapX: An Open Geospatial Platform to Manage, Analyze and Visualize Data on Natural Resources and the Environment. SoftwareX 2019, 9, 77–84. [Google Scholar] [CrossRef]
- Kilosho, J.; Stoop, N.; Verpoorten, M. The Social Minefield of Gold Digging in South-Kivu, DRC. The Case of Kamituga; Universiteit Antwerpen, Institute of Development Policy (IOB): Antwerpen, Belgium, 2015. [Google Scholar]
- Guerschman, J.P.; Scarth, P.F.; McVicar, T.R.; Renzullo, L.J.; Malthus, T.J.; Stewart, J.B.; Rickards, J.E.; Trevithick, R. Assessing the Effects of Site Heterogeneity and Soil Properties When Unmixing Photosynthetic Vegetation, Non-Photosynthetic Vegetation and Bare Soil Fractions from Landsat and MODIS Data. Remote Sens. Environ. 2015, 161, 12–26. [Google Scholar] [CrossRef]
- IPIS. Interactive Map of Artisanal Mining Exploitation in Eastern DR Congo—2018 Update; IPIS: Antwerpen, Belgium, 2018. [Google Scholar]
- Lymburner, L.; Botha, E.; Hestir, E.; Anstee, J.; Sagar, S.; Dekker, A.; Malthus, T. Landsat 8: Providing Continuity and Increased Precision for Measuring Multi-Decadal Time Series of Total Suspended Matter. Remote Sens. Environ. 2016, 185, 108–118. [Google Scholar] [CrossRef]
- Xing, Q.; Lou, M.; Chen, C.; Shi, P. Using in Situ and Satellite Hyperspectral Data to Estimate the Surface Suspended Sediments Concentrations in the Pearl River Estuary. IEEE J. Sel. Top. Appl. Earth Obs. Remote Sens. 2013, 6, 731–738. [Google Scholar] [CrossRef]
- Mueller, N.; Lewis, A.; Roberts, D.; Ring, S.; Melrose, R.; Sixsmith, J.; Lymburner, L.; McIntyre, A.; Tan, P.; Curnow, S.; et al. Water Observations from Space: Mapping Surface Water from 25 Years of Landsat Imagery across Australia. Remote Sens. Environ. 2016, 174, 341–352. [Google Scholar] [CrossRef] [Green Version]
- Gorelick, N.; Hancher, M.; Dixon, M.; Ilyushchenko, S.; Thau, D.; Moore, R. Google Earth Engine: Planetary-Scale Geospatial Analysis for Everyone. Remote Sens. Environ. 2017, 202, 18–27. [Google Scholar] [CrossRef]
- Tondapu, G.; Markert, K.; Lindquist, E.J.; Wiell, D.; Díaz, A.S.P.; Johnson, G.; Ashmall, W.; Chishtie, F.; Ate, P.; Tenneson, K.; et al. A SERVIR FAO Open Source Partnership: Co-Development of Open Source Web Technologies Using Earth Observation for Land Cover Mapping. In AGU Fall Meeting Abstracts; American Geophysical Union: Washington, DC, USA, 2018; Volume 21. [Google Scholar]
- Martin, P.G.; Payton, O.D.; Fardoulis, J.S.; Richards, D.A.; Scott, T.B. The Use of Unmanned Aerial Systems for the Mapping of Legacy Uranium Mines. J. Environ. Radioact. 2015, 143, 135–140. [Google Scholar] [CrossRef] [Green Version]
- Moomen, A.-W.; Bertolotto, M.; Lacroix, P.; Jensen, D. Inadequate Adaptation of Geospatial Information for Sustainable Mining towards Agenda 2030 Sustainable Development Goals. J. Clean. Prod. 2019, 238, 117954. [Google Scholar] [CrossRef]
- Moomen, A.-W.; Jensen, D.; Lacroix, P.; Bertolotto, M. Assessing the Policy Adoption and Impact of Geoinformation for Enhancing Sustainable Mining in Africa. J. Clean. Prod. 2019, 241, 118361. [Google Scholar] [CrossRef]


Publisher’s Note: MDPI stays neutral with regard to jurisdictional claims in published maps and institutional affiliations. |
© 2022 by the authors. Licensee MDPI, Basel, Switzerland. This article is an open access article distributed under the terms and conditions of the Creative Commons Attribution (CC BY) license (https://creativecommons.org/licenses/by/4.0/).
Share and Cite
Moomen, A.-W.; Lacroix, P.; Benvenuti, A.; Planque, M.; Piller, T.; Davis, K.; Miranda, M.; Ibrahim, E.; Giuliani, G. Assessing the Applications of Earth Observation Data for Monitoring Artisanal and Small-Scale Gold Mining (ASGM) in Developing Countries. Remote Sens. 2022, 14, 2971. https://0-doi-org.brum.beds.ac.uk/10.3390/rs14132971
Moomen A-W, Lacroix P, Benvenuti A, Planque M, Piller T, Davis K, Miranda M, Ibrahim E, Giuliani G. Assessing the Applications of Earth Observation Data for Monitoring Artisanal and Small-Scale Gold Mining (ASGM) in Developing Countries. Remote Sensing. 2022; 14(13):2971. https://0-doi-org.brum.beds.ac.uk/10.3390/rs14132971
Chicago/Turabian StyleMoomen, Abdul-Wadood, Pierre Lacroix, Antonio Benvenuti, Marion Planque, Thomas Piller, Kenneth Davis, Manoela Miranda, Elsy Ibrahim, and Gregory Giuliani. 2022. "Assessing the Applications of Earth Observation Data for Monitoring Artisanal and Small-Scale Gold Mining (ASGM) in Developing Countries" Remote Sensing 14, no. 13: 2971. https://0-doi-org.brum.beds.ac.uk/10.3390/rs14132971