Article

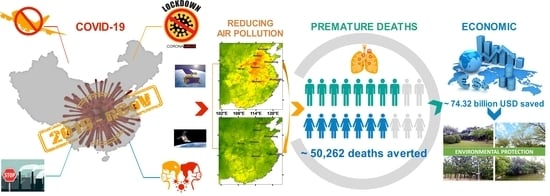
Air Quality Improvement Following COVID-19 Lockdown Measures and Projected Benefits for Environmental Health

1
Center for Space and Remote Sensing Research, National Central University, No. 300, Jhongda Road, Jhongli District, Taoyuan City 320317, Taiwan
2
Taiwan Group on Earth Observations, Zhubei City 32001, Taiwan
3
Institute of Geography, Vietnam Academy of Science and Technology, 18 Hoang Quoc Viet Road, Cau Giay District, Hanoi 100000, Vietnam
4
College of Natural and Health Sciences, Zayed University, Dubai 19282, United Arab Emirates
*
Author to whom correspondence should be addressed.
Submission received: 20 October 2022 / Revised: 9 December 2022 / Accepted: 7 January 2023 / Published: 16 January 2023
(This article belongs to the Special Issue Earth Observations for Sustainable Development Goals)

Abstract

:
Many regions worldwide suffer from heavy air pollution caused by particulate matter (PM2.5) and nitrogen dioxide (NO2), resulting in a huge annual disease burden and significant welfare costs. Following the outbreak of the COVID-19 global pandemic, enforced curfews and restrictions on human mobility (so-called periods of ‘lockdown’) have become important measures to control the spread of the virus. This study aims to investigate the improvement in air quality following COVID-19 lockdown measures and the projected benefits for environmental health. China was chosen as a case study. The work projects annual premature deaths and welfare costs by integrating PM2.5 and NO2 pollutant measurements derived from satellite imagery (MODIS instruments on Terra and Aqua, and TROPOMI on Sentinel-5P) with census data archived by the Organization for Economic Co-operation and Development (OECD). A 91-day timeframe centred on the initial lockdown date of 23 January 2020 was investigated. To perform the projections, OECD data on five variables from 1990 to 2019 (mean population exposure to ambient PM2.5, premature deaths, welfare costs, gross domestic product and population) were used as training data to run the Autoregressive Integrated Moving Average (ARIMA) and multiple regression models. The analysis of the satellite imagery revealed that across the regions of Beijing, Hebei, Shandong, Henan, Xi’an, Shanghai and Hubei, the average concentrations of PM2.5 decreased by 6.2, 30.7, 14.1, 20.7, 29.3, 5.5 and 17.3%, while the NO2 decreased by 45.5, 54.7, 60.5, 58.7, 63.6, 50.5 and 66.5%, respectively, during the period of lockdown restrictions in 2020, as compared with the equivalent period in 2019. Such improvements in air quality were found to be beneficial, reducing in 2020 both the number of premature deaths by approximately 97,390 and welfare costs by over USD 74 billion.

Graphical Abstract

1. Introduction

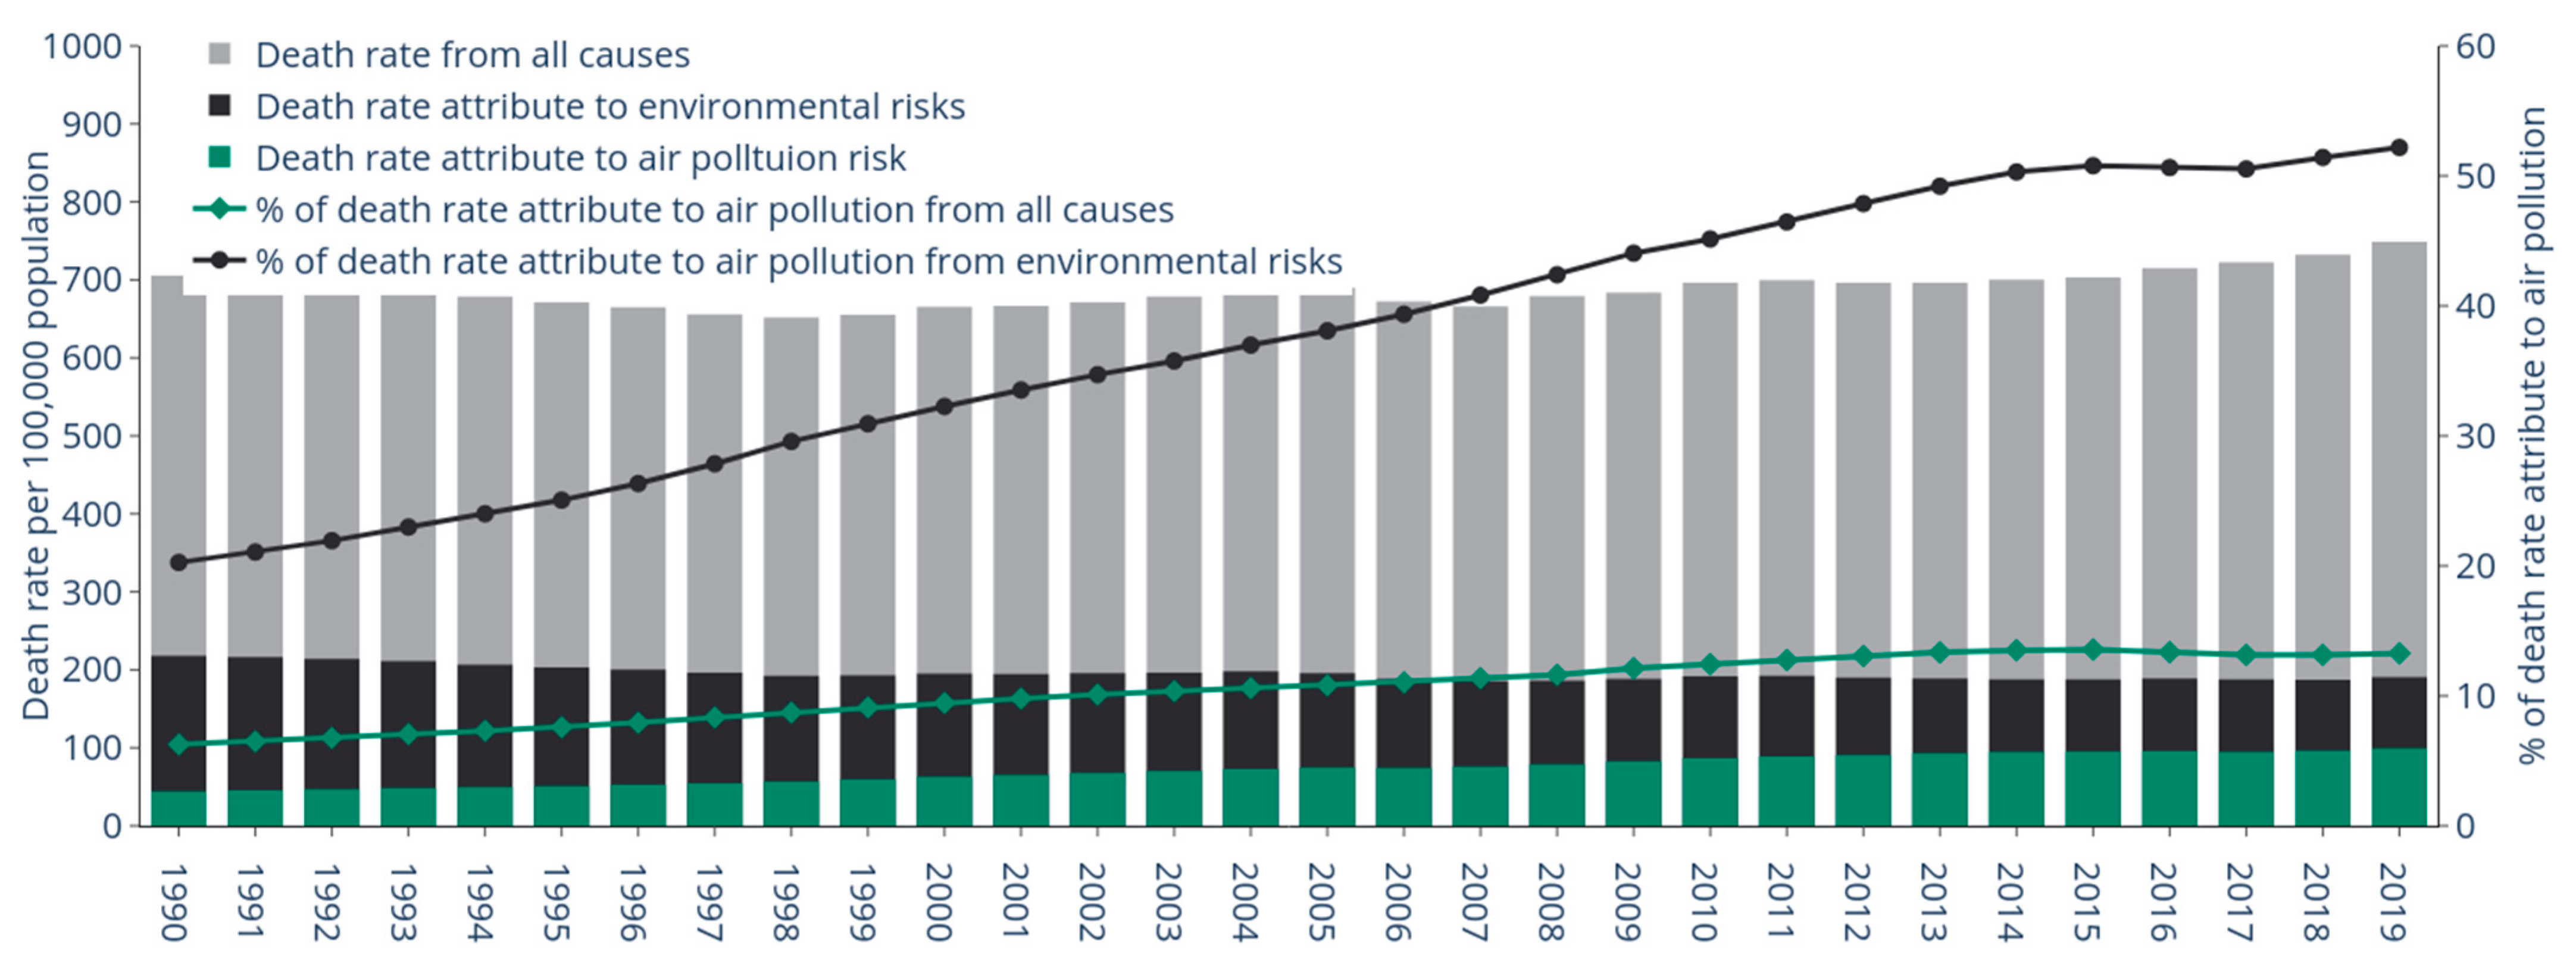
1.1. Air Pollution and Health

According to the World Health Organization [1], air pollution is responsible for seven million premature deaths worldwide every year. It has been warned that an ‘air-pollution pandemic’ could reduce the global average human life expectancy by nearly three years and cause 8.8 million premature deaths every year [2]. The world region most affected by air pollution is Asia. China and India are two Asian countries characterized by high eco-environmental vulnerability due to natural and anthropogenic disturbances [3,4]. Recurring seasonal air pollution in India has been responsible for past health emergencies [5], while in China there are over one million premature deaths each year, and air pollution may cause a higher rate of premature deaths than that attributed to traffic accidents and HIV-AIDS [6].
Among air pollutants, fine particulate matter with a diameter of less than 2.5 μm (PM2.5) and gases, including ozone (O3) and tropospheric nitrogen dioxide (NO2), has major impacts on environmental health. PM2.5 is a common air pollutant, consisting of a mixture of solid and liquid particles that are suspended in the air. It can come from natural sources, such as wildfires, desert dust, volcanic ash, plant pollen and fungal spores. However, the most harmful types of PM2.5 are emitted by anthropogenic coal combustion, oil and biomass, as well as industrial processes, such as cement production and construction [7]. Fine particulate matter pollution has devastating impacts on health, even with exposure to low-level concentrations. PM2.5 can penetrate the lung barrier and enter the blood system. Chronic exposure contributes to the risk of developing cardiovascular and respiratory diseases, as well as lung cancer.
Common nitrogen oxides in the air are NO and NO2, which are formed through chemical reactions between N2 and O2 under high-temperature conditions. They are usually only detected in industrial parks and large conurbations. NO2 is a gas released by all kinds of combustion processes, such as the combustion of coal, oil and gas in power plants and industries, as well as the combustion of fuel in motor vehicles. Increases in atmospheric NO2 concentrations during episodes of heavy air pollution are also influenced by transportation activities [8,9]. High NO2 concentrations may cause a variety of health problems and irreversible damage to the respiratory system [10]. Furthermore, NOx reacts with ammonia, moisture and other compounds to form small particles. These small particles can penetrate deeply into sensitive parts of the lungs. China is the largest NOx emitter, contributing 18% of global NOx emissions [11].
O3 at ground level is a harmful air pollutant with more severe health impacts than NO2, although the relationship between ozone exposure and consequent mortality rates remains inconclusive. However, in the troposphere, the complexity of O3 chemistry requires a three-dimensional chemistry/climate model to determine the global O3 distribution and to assess related climate feedbacks [12]. Moreover, it is difficult to measure near-surface O3 from space, in large part due to the massive stratospheric O3 column dominating the signal. Satellite-derived tropospheric O3 datasets therefore remain a “work in progress” (see Tropospheric Ozone Assessment Report (TOAR), available online: https://igacproject.org/activities/TOAR, accessed on 10 July 2022). Thus, this pollutant is considered outside the scope of this paper.
Although ground observation stations can accurately measure both PM2.5 and NO2 concentrations, the application of point-wise measurements is limited. In contrast, satellite-based observations provide wider spatial coverage across both urban and rural areas [13]. Consequently, with the aid of long-term Earth observations by the Ozone Monitoring Instrument (OMI) onboard the AURA satellite, investigations have revealed hotspots of air pollution across the United States, United Kingdom, Russia, India, China and elsewhere [14]. Although OMI-AURA sensors generally measure NO2 column density, previous studies have shown strong positive correlations (r > 0.8) between ground-based NO2 concentrations and column density measurements [15]. Similarly, Ialongo et al. [16] studied the applicability of the TROPOospheric Monitoring Instrument (TROPOMI) on the Sentinel-5 Precursor (S5P) satellite, and confirmed that the TROPOMI can monitor surface NO2 concentrations at the country or city level. Accordingly, Li et al. [14] utilized OMI-AURA data to assess tropospheric NO2 over China during 2016–2019. Their study indicated that NO2 declined from 2011 to 2015, but then increased across most Chinese provinces from 2016 onwards.
Satellite monitoring can also provide aerosol optical depth (AOD) with a high spatial resolution and continuous spatial coverage. Although ground-level PM2.5 concentration cannot be directly measured, various methodologies have been proposed to determine surface PM2.5 concentrations based on their relationship with satellite AOD data. A variety of recently developed models have been widely applied, including the multiple least squares linear regression [17], humidity correction [18], linear mixed-effects [19], land-use regression [20] and Specific Particle Swarm Extinction Mass Conversion Algorithm (SPSEMCA) [21] models.

1.2. The COVID-19 Pandemic and Reduced Air Pollution

Since early 2020, the novel coronavirus disease (COVID-19) has spread worldwide, causing more than 260 million human infections and 5.2 million deaths as of 1 December 2021 [22]. The COVID-19 pandemic has been called the first global “NASECH disaster”, because of its natural hazard (NA) origin and unprecedented ensuing impacts on global society (S), economies (EC) and health (H) [23]. Owing to the worldwide repercussions, a large number of studies have been conducted to assess the impacts of the pandemic on different sectors, such as health [24,25,26], economies [27,28,29], and the environment [30,31,32,33,34].
When facing this growing public health emergency as cases of COVID-19 infections spread in early 2020, one measure many governments adopted was to impose periods of curfew and home confinement on affected populations in order to limit disease transmission. The global media soon coined the term “COVID lockdowns” to refer to various forms of mass home quarantine orders that were mandated by authorities across many countries.
Since air pollution has important implications for public health, a number of studies have investigated the effects of imposed lockdown measures on environmental air quality. In northern China, Shi and Brasseur [34] showed marked reductions in the mean concentrations of PM2.5 (35% reduction) and NO2 (60% reduction), whereas Wang et al. [35] found decreased PM2.5 in Beijing (9.2 μg/m3), Shanghai (6.4 μg/m3), Guangzhou (5.4 μg/m3) and Wuhan (30.8 μg/m3). Furthermore, comparing the first two months of 2019 and 2020, Marlier et al. [33] identified spatio-temporal changes in air pollution concentrations across China. Moreover, climatic zones and urbanization in China have been examined to determine their effects on air quality during the COVID-19 outbreak [36,37]. Cole et al. [38] quantified the effects of the lockdown using ground station data by a machine learning approach, while Nichol et al. [39] and Ghahremanloo et al. [40] used the one-degree spatial resolution of MODIS AOD to examine changes in air pollution. Recently, Pal et al. [41] examined the effects of lockdown on air quality, land surface temperature (LST) and anthropogenic heat flux (AHF) in an industrial belt of India. In their study area during the lockdown, a large number of industries were on standby, resulting in a reduction in anthropogenic heat. Their results showed that the lockdown reduced PM10 by 84 μg/m3, LST by 5 °C and AHF by 76 W/m2. All of these studies demonstrated a clear association between governments’ implementation of lockdown measures to control the COVID-19 pandemic and subsequent reductions in air pollution.
That said, however, none of the abovementioned studies examined the decrease in annual premature deaths and welfare costs associated with premature deaths that result from reduced PM2.5 and NO2 emissions following the introduction of lockdown measures. In response, this study has two principal aims. The first aim is to assess improvements in air quality based on NO2 and PM2.5 measurements. The second aim is to use the PM2.5 data to make projections on premature deaths and welfare costs. This is achieved by modelling reductions in premature deaths and welfare costs following air pollution improvements. According to the OECD [42], welfare costs are calculated using estimations of individuals’ willingness-to-pay to reduce their risk of premature death. This is tackled by integrating satellite-based air pollution measurements with the Autoregressive Integrated Moving Average (ARIMA) and multiple regression models. Projections are carried out for two scenarios, with and without the COVID-19 pandemic, over the five years from 2020 to 2025. The main focus is on 2020, the year of pandemic’s outbreak. However, given that there are continuing restrictions on movement in many parts of China as the country tries to tackle new surges in COVID cases in 2022, it is worthwhile to project links between improved air quality and reduced premature deaths for several years into the immediate future. The study’s outcomes will thereby quantify the potential long-term implications on environmental health of improved air quality stemming from pandemic control measures.

2. Materials and Methods

2.1. Materials

2.1.1. Satellite Aerosol Optical Depth (AOD) Data

We utilized the Multi-Angle Implementation of Atmospheric Correction (MAIAC) Land AOD gridded Level 2, a new generic algorithm applied to collection 6 (C6) MODIS measurements to retrieve AOD over land at high spatial resolution (1 km). In comparison with AERONET AOD, MAIAC AOD shows better accuracy than both previous Dark Target (DT) and Deep Blue (DB) AOD products [43]. This product (MCD19A2) combines measurements from two Moderate Resolution Imaging Spectroradiometer (MODIS) instruments onboard NASA’s Earth Observing System (EOS) satellites, Terra and Aqua. Terra and Aqua satellites pass the equator at about 10:30 am and 1:30 pm local time, respectively. Only AOD retrievals with ‘best quality’ assurance were used to ensure accuracy. The MODIS AOD product is validated with Aerosol Robotic Network (AERONET) ground-based scanning radiometry data [44]. The data can be found at https://lpdaac.usgs.gov/products/mcd19a2v006/ (accessed on 22 March 2020), and have been integrated into the Google Earth Engine.

2.1.2. Satellite Nitrogen Dioxide (NO2) Data

Retrieved NO2 column density data from the Sentinel-5 Precursor (S5P) satellite, product level 3 were used in this study. The S5P satellite is one of the missions of the European Space Agency (ESA). It is a polar satellite with a low Earth orbit, providing information on air quality, climate and the ozone layer as part of the Global Monitoring of the Environment and Security (GMES/COPERNICUS) space program. The arrangement consists of a satellite bus, the TROPOMI instrument and a ground receiver system. TROPOMI is a single payload onboard S5P that operationally retrieves tropospheric and stratospheric NO2 column density. The TROPOMI NO2 data products represent improvements over previous datasets, particularly in their better spatial resolution (7 × 3.5 km), in the separation of stratospheric and tropospheric NO2 contributions along the slant direction and in the calculation of the air mass factors used to convert slant to total column data [45]. The data can be found at https://scihub.copernicus.eu/dhus/#/home (accessed on 22 March 2020), and have been integrated into the Google Earth Engine. The original Sentinel 5P L2 product is converted to L3, keeping a single grid per orbit by the “harpconvert” tool (harp-1.5) of the Google Earth Engine provider.
We utilized versions that correspond to the study periods due to processor changes over time (22 December 2018–22 March 2019 for pre-pandemic and 11 December 2019–10 March 2020 for the pandemic)—that is, V1.2 for 22 December 2018 to 22 March 2019 and V1.3 for 11 December 2019 to 10 March 2020. Both are OFFL products recommended by the provider, with a spatial resolution of 7 × 3.5 km2. Version V1.3 uses the same NO2 algorithm as V1.2, but with an improvement in the input cloud data from FRESCO that affects the NO2 VCDs of some of the ground pixels but without impact on subsequent analysis [46].

2.1.3. Surface Meteorology and PM2.5 Data

Meteorological data were obtained from the Global Forecast System (GFS) of the US National Centers for Environmental Prediction (NCEP). The GFS dataset comprises 16-day forecast data at 0.25 degree spatial resolution. It includes hourly surface temperature (T), relative humidity (RH), wind speed (WS) and wind direction (WD). Ground PM2.5 measurements in China were collected with hourly temporal resolution for seven established stations: Beijing, Hebei, Shandong, Xian, Quanzhou, Shanghai and Hubei. Data were retrieved from the Ministry of Ecology and Environment, People’s Republic of China (http://english.mee.gov.cn/, accessed on 10 March 2020), the website of Real-time Air Quality Index (https://aqicn.org, accessed on 10 March 2020), the US Department of State Air Quality Monitoring Program (http://www.stateair.net/, accessed on 10 March 2020) and the China Meteorological Data Service Center (https://data.cma.cn, accessed on 10 March 2020).

2.1.4. Health and Socioeconomic Data

Health and socioeconomic data were downloaded from OECD.Stat (https://stats.oecd.org, accessed on 20 April 2021). This is the online platform of the Organization for Economic Co-operation and Development, in which users can access and search the statistical database. The database consists of health-related air pollution and socioeconomic data, including mean population exposure to PM2.5 (ExpoPM2.5), premature deaths (PD), welfare costs (WFC) of premature deaths, disability-adjusted life years (DALYs), value of a statistical life (VSL), gross domestic product (GDP) and population (P) for 194 countries from 1990 to 2019. Our study focuses on the high-population-density areas in the north, centre and south of mainland China between latitude of 20 and 40°N and longitude of 100 and 125°E.

2.2. Methods

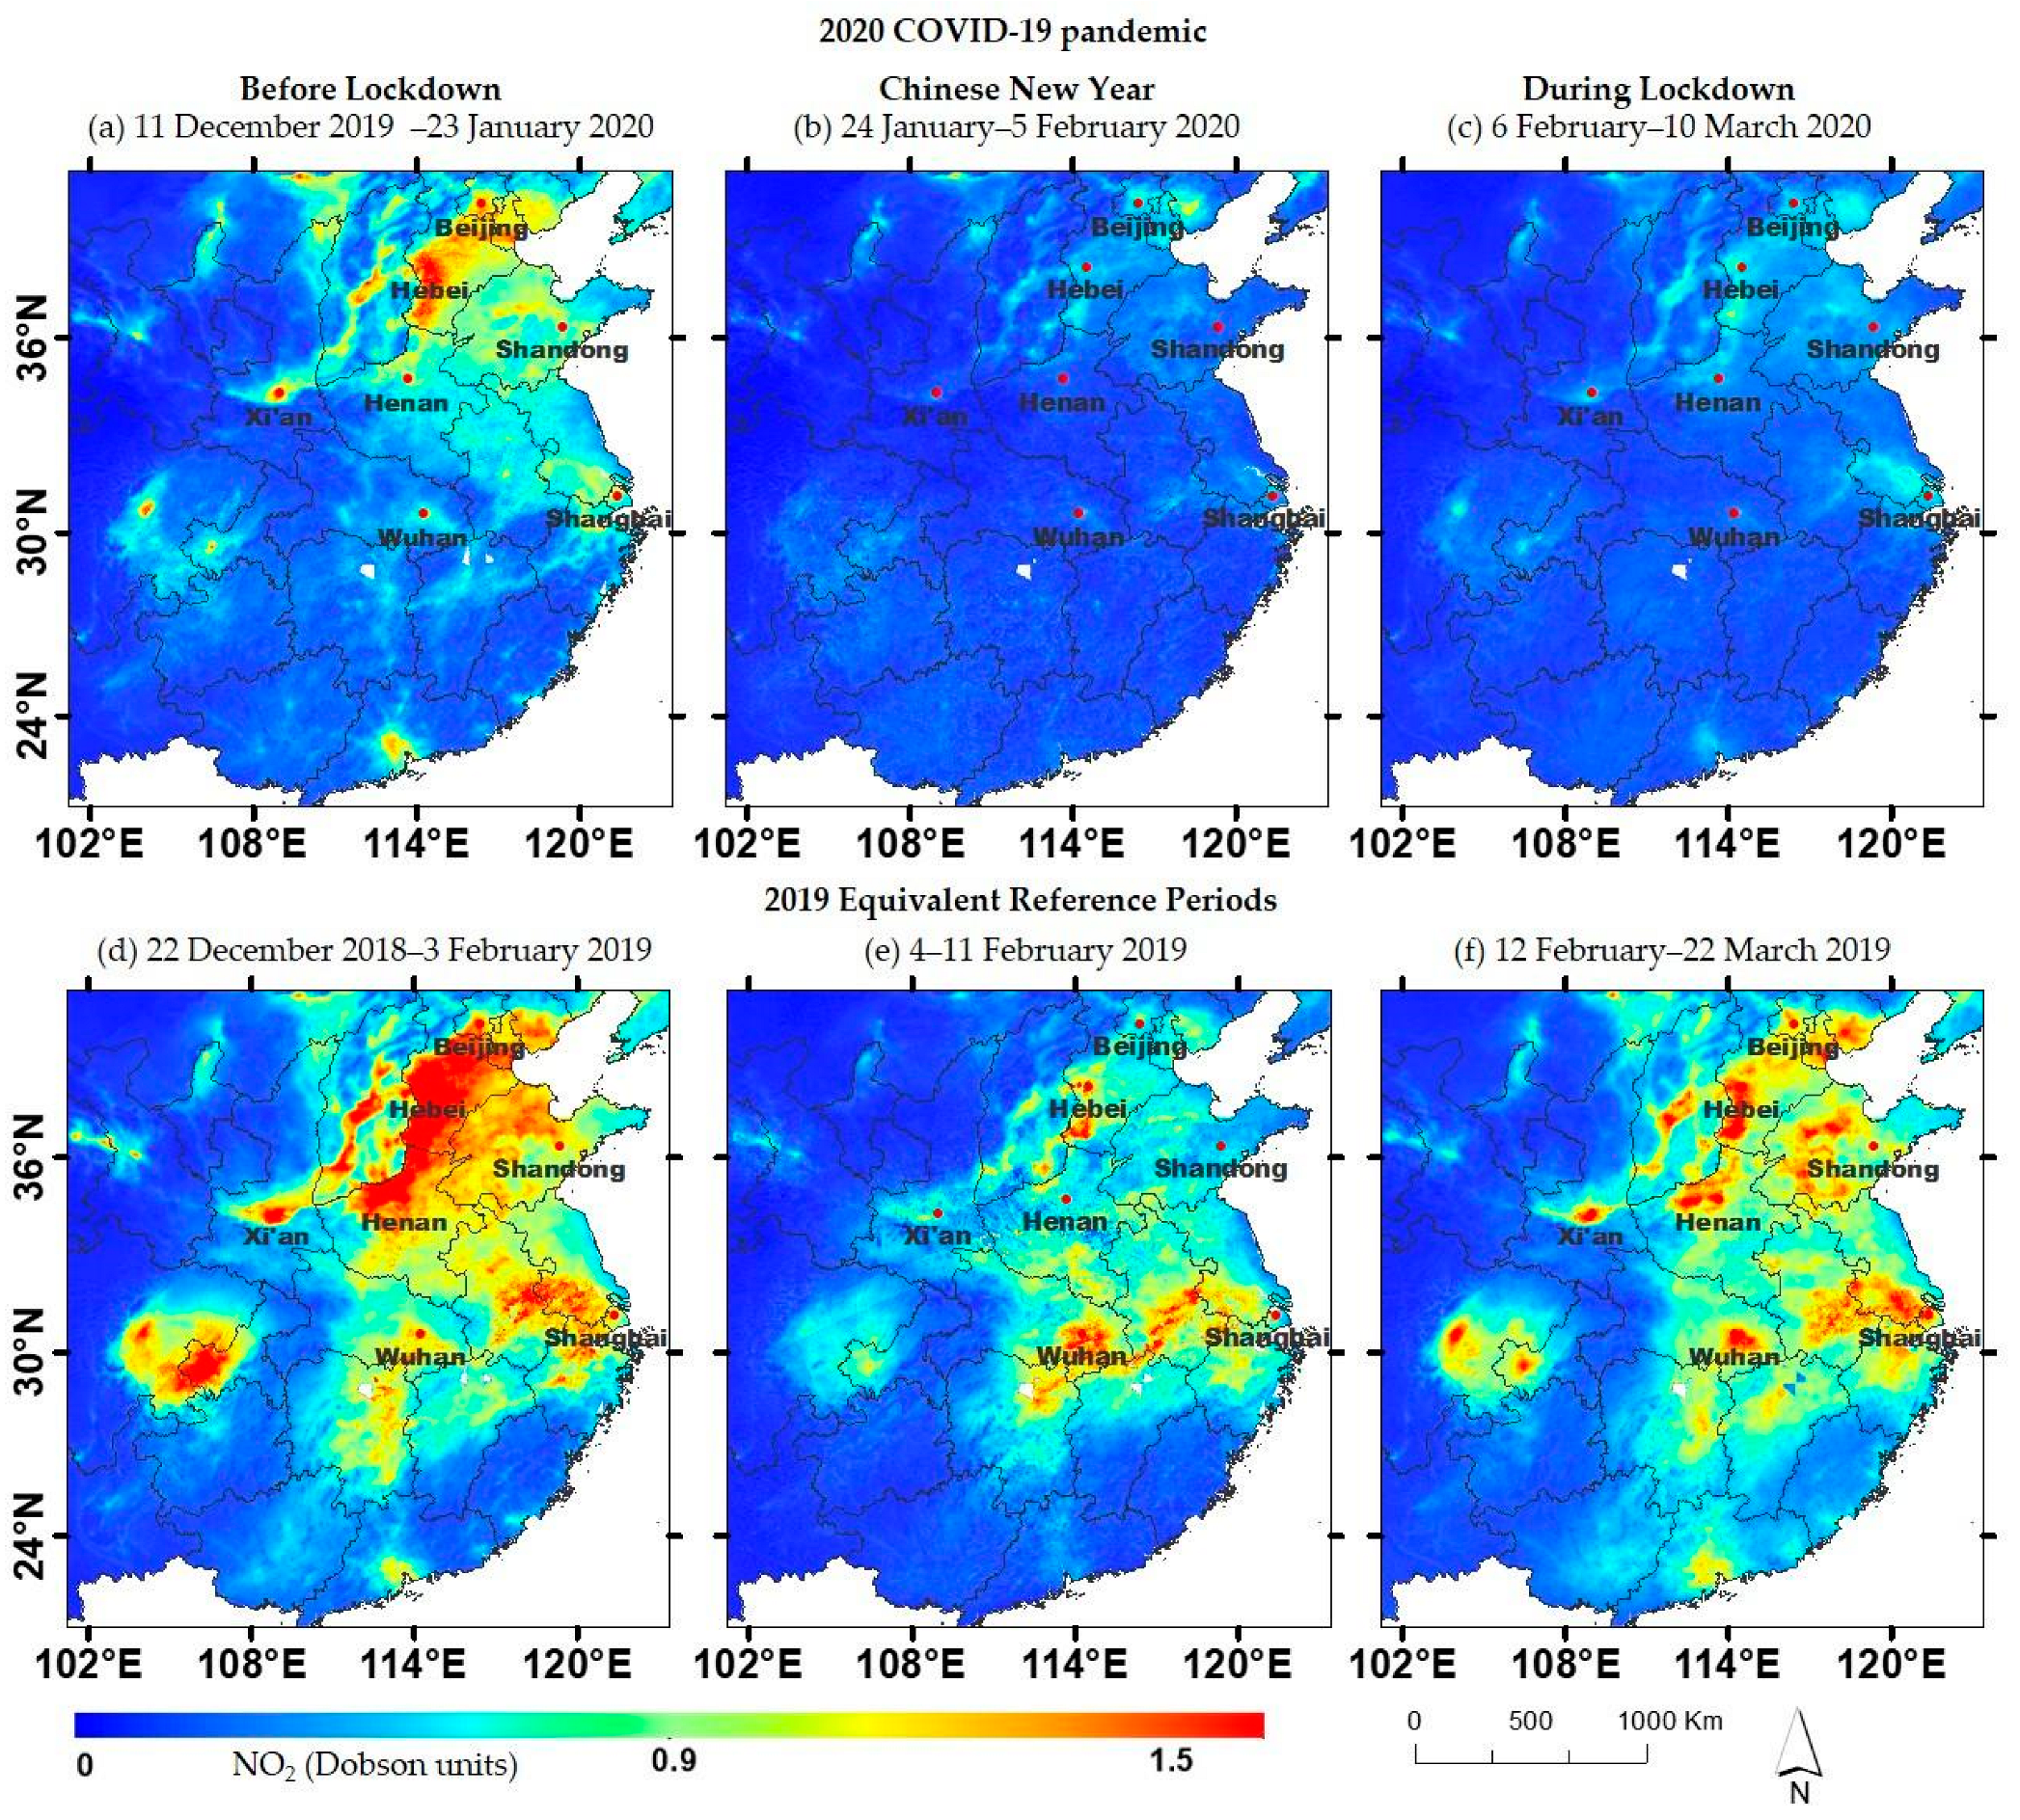
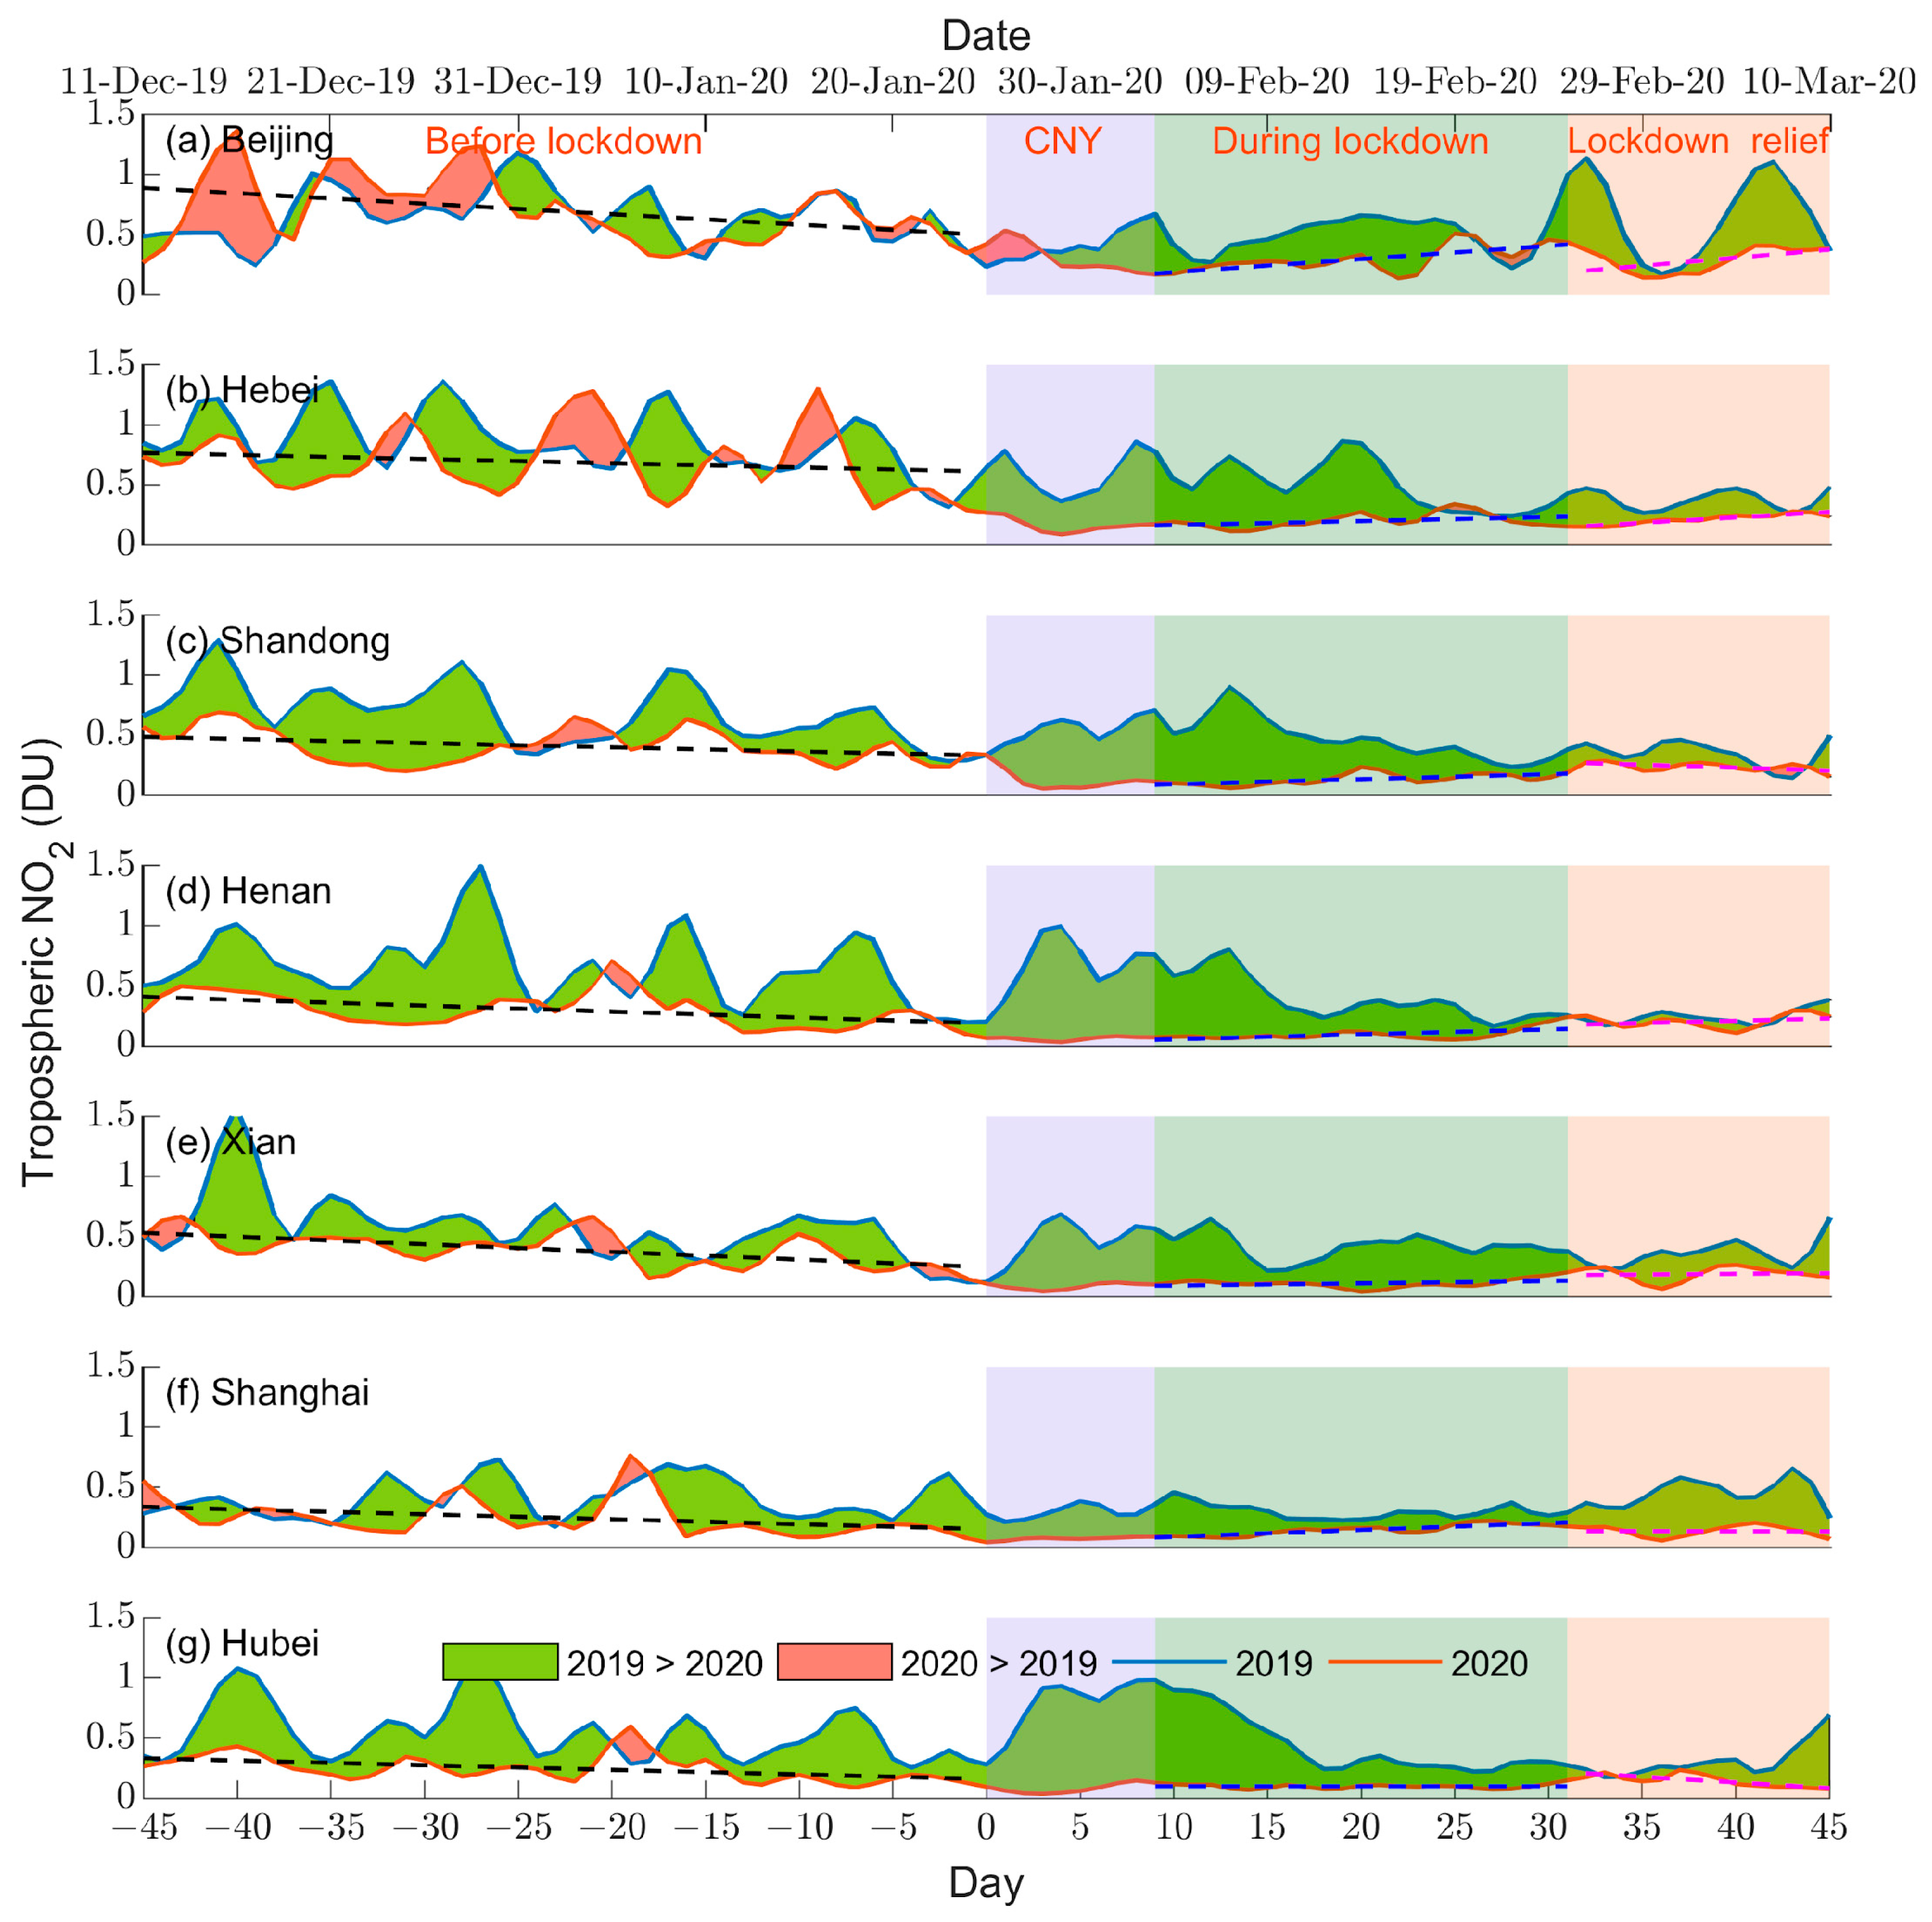
2.2.1. Study Timeframe

To investigate the effects on air quality over China of the lockdown measures imposed in early 2020 to control the COVID-19 outbreak, a 91-day timeframe was first selected for analysis. This timeframe is centred on 23 January 2020, the day before the start of the Chinese New Year (CNY) holiday. The 91-day study timeframe was divided into three consecutive sub-periods for comparison at the onset of the pandemic (Table 1): before lockdown measures were introduced (BLK), the Chinese New Year holiday (CNY) and during lockdown measures (DLK) that continued following the end of the holiday. An equivalent pre-pandemic 91-day reference timeframe was also selected in 2019. This was also divided with respect to the timing of start of CNY in 2019 into three sub-periods of equivalent durations for comparison. The CNY holiday is the most important holiday in Chinese society. The manufacturing industry essentially ceases operations, such that air pollution normally drops to its lowest levels at this time of the year [46]. In contrast, manufacturers return to normal operations during the five weeks after the CNY holiday. These crucial timeframes therefore offer the best opportunity to observe any impacts of lockdown measures in 2020 on reduced air pollution, compared with a normal year.
Second, PM2.5 and NO2 data over the study areas across China were retrieved for the 91-day timeframe for 2020 and also for the equivalent timeframe in 2019. The contrast in the concentrations of the two air pollutants of interest, if any, between 2019 and 2020, is considered to reflect the effect of the 2020 lockdown measures on air quality in China. Preprocessing of the MODIS data consists of four steps: (1) data scaling, (2) quality assurance filtering, (3) time collocation with NCEP data and (4) data assimilation with NCEP data. The S5P image preprocessing consists of two steps: (1) quality assurance filtering and (2) unit conversion.
Third, data validation was carried out. Satellite-derived AOD and PM2.5 data, retrieved from MODIS, were compared against ground-based AOD data from AERONET and PM2.5 measurements. Fourth, annual premature deaths and welfare costs due to air pollution were modelled and projected. A flowchart of the steps involved to enable the projections is shown in Figure 1. Data processing and modelling were conducted with the aid of MATLAB 9.4, the Google Earth Engine, ArcGIS 10.5 and the Statistical Package for the Social Sciences version 26 (SPSS developed by The International Business Machines Corporation (IBM), New York, U.S) (see below).

2.2.2. Derivation of Atmospheric PM2.5 and NO2

PM2.5 Derivation

An algorithm-based level-2 gridded AOD product called MCD19A2 was used to derive PM2.5 pollutant distribution at high spatial resolution [43]. Meteorological factors have a significant influence on the formation, deposition and transformation of air pollution. Therefore, a semi-empirical multiple lognormal regression (MLR) model was used to estimate surface PM2.5 concentration in China (Equation (1)). The MLR model incorporates ground-based point measurements of PM2.5, satellite-based AOD from MODIS and several meteorological variables. The meteorological data, including 2 m air temperature (T), 10 m wind speed (WS), 10 m wind direction (WD) and relative humidity (RH), were extracted from the NCEP database at timestamps corresponding to when the Terra and Aqua satellites passed over China:
Ln(PM2.5ij) = b0,ij + b1,ij Ln(AODij) + b2,ijRHij + b3,ijTij + b4,ijWSij + b5,ijWDij
where b0, b1, b2, b3, b4 and b5 are the regression coefficients; i and j are the position of a pixel at location (i, j).
Validation was carried out with data obtained from China’s Ministry of Ecology and Environment, the Real-time Air Quality index and the U.S. Department of State Air Quality Monitoring Program. The correlation coefficient (r), absolute root-mean-square error (RMSE) and relative root-mean-square error (RRMSE = RMSE/mean measured PM2.5), were calculated. Results show that a significant correlation exists between the outcomes derived from satellite data and ground measurements for the seven selected study stations across China, with r = 0.88, RMSE = 6.32 and RRMSE = 26.9%. The residual statistics errors and P–P plots indicate that the model produced low level of bias. Our model results were compared with the results of other studies [17,18]. The comparisons show that our satellite-derived PM2.5 model results are reliable.

NO2 Derivation

For NO2, we obtained column density data directly from the Sentinel-5 Precursor (S5P) satellite, product level 3. The SP5 satellite collects atmospheric NO2 data within both the troposphere and stratosphere. Tropospheric NO2 is an important indicator of health-related air pollution. Here, tropospheric NO2 column density from S5P was therefore used in preference to ground-based measurements for analysing regional variations in air pollution during the study period. A number of studies have shown the recognized low level of bias by comparing TROPOMI observations of nitrogen dioxide (NO2) with ground-based data. Results also indicated that S5P bias has a clear multiplicative component, implying that relative changes before and after COVID-19 are rarely influenced [47,48].
Furthermore, to ensure data quality, the data are filtered to remove pixels with QA values less than 80% for AER_AI and 75% for the tropospheric_NO2_column_number_density band of NO2.

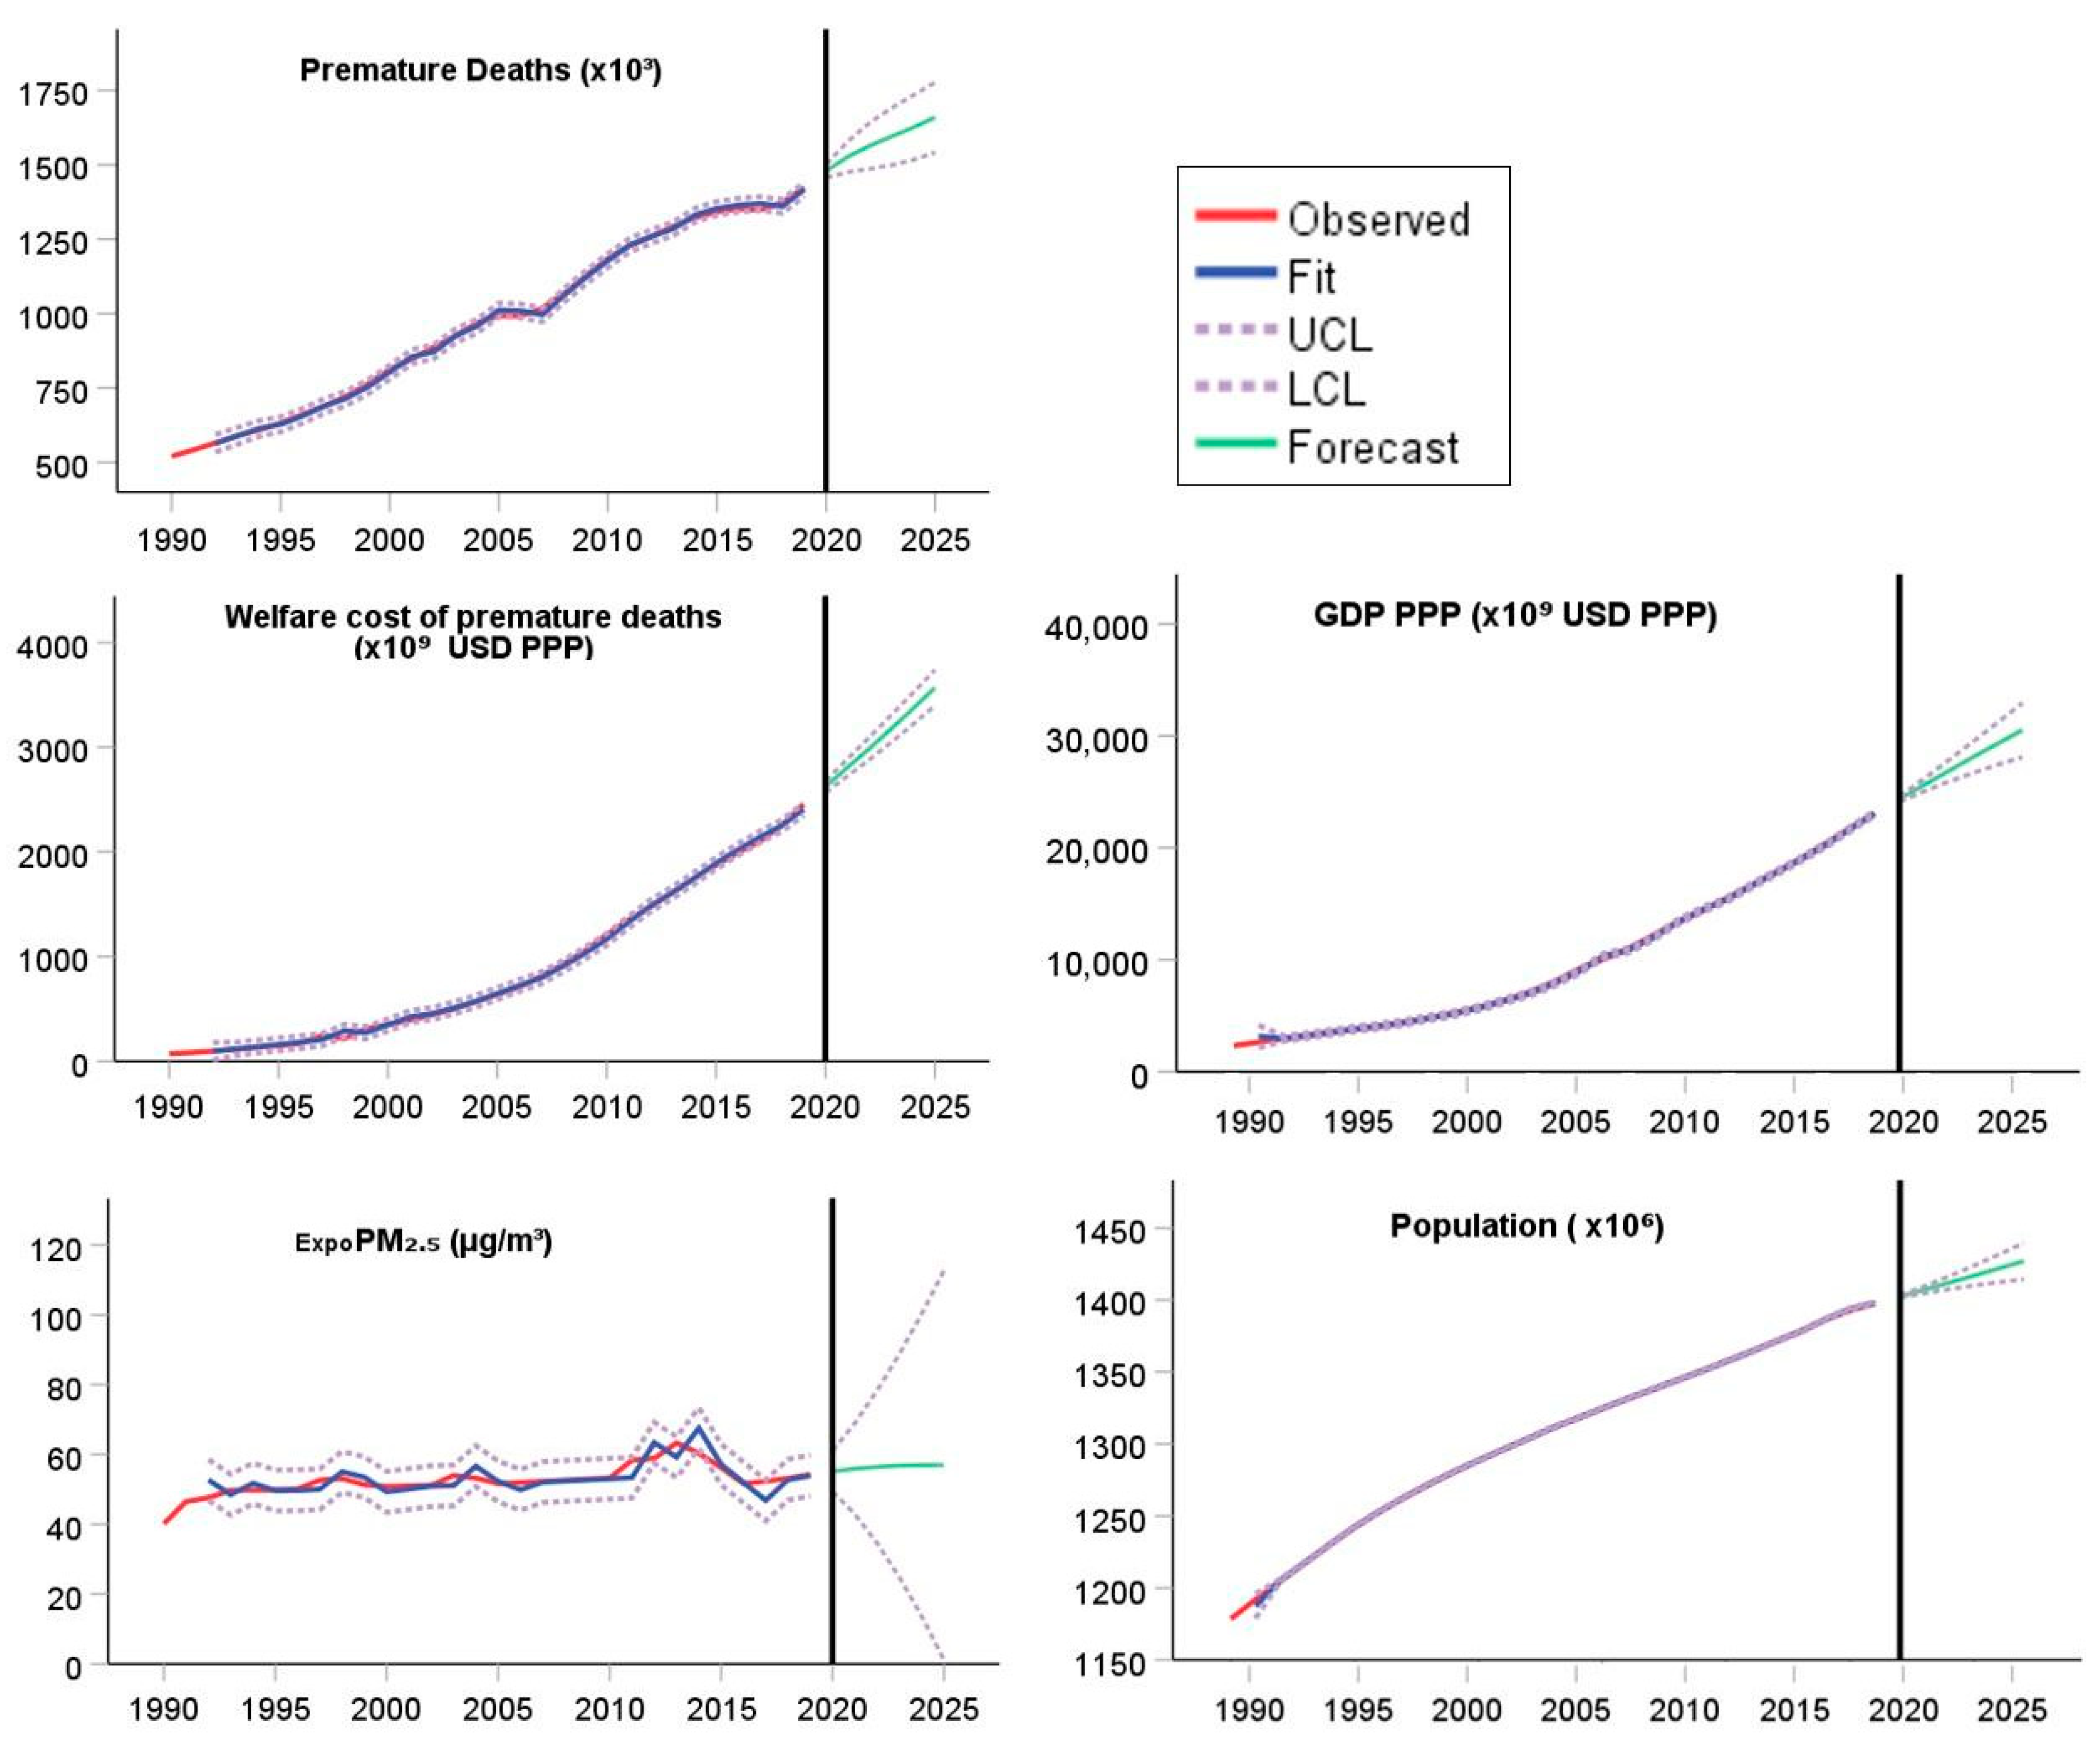
2.2.3. Projected Reduced Annual Premature Deaths and Welfare Cost

In order to quantify the number of premature deaths (PD) (the number of deaths attributed to exposure to air-pollution-related risks) and welfare costs (WFC) per year resulting from air pollution exposure, relevant annual data comprising PD, WFC, mean population exposed to ambient PM2.5 (ExpoPM2.5) (the average level of exposure of a nation’s population to concentrations of suspended particles measuring less than 2.5 microns), population (P) and gross domestic product (GDP) for China were obtained from the OECD for the years 1990 to 2019. Information over this three-decade period was used as the training dataset for the regression model. Note that 2019 is the latest available data year for China in the OCED statistics database. In this study, exposure to PM2.5 (ExpoPM2.5) is used as an indicator for quantifying the number of premature deaths attributable to air pollution.
Projections are performed by integrating calculations from Autoregressive Integrated Moving Average (ARIMA) and various regression models, as described in the following steps. ARIMA is a widely used statistical method for time series forecasting [46].
Step 1: Future projections of the parameters of interest (PD, WFC, P, GDP and ExpoPM2.5) under normal conditions, i.e., without any implementation of COVID-19 lockdown measures, are forecast by applying the ARIMA model, based on the training dataset from 1990 to 2019. The specific ARIMA (p, q, d) model applied for each parameter is identified by assigning the order for the three terms: p for AR, q for MA and d for the number of difference steps [49]. The autocorrelation function (ACF) and partial autocorrelation function (PACF) are used to determine the values of p and q parameters and selection of the best-fit model. The model selection can be based on the values of specific criteria, such as normalized Bayesian information criteria (BIC). The best-fit models to generate the forecasts for PD, WFC, ExpoPM2.5, P and GDP are (1) ARIMA (2,2,1), (2) ARIMA (2,2,1), (3) ARIMA (0,2,0), (4) ARIMA (1,1,1) and (5) ARIMA (1,1,1), respectively. Refer to Appendix A for parameter details of each model applied.
Step 2: The projected PD and WFC values as a consequence of reduced air pollution following the implementation of lockdown measures are estimated using regression models.
These models (Equations (2) and (3)) have been developed by multi-regression, which is widely used to obtain estimates of parameter significance as well as predictions of the response variable at arbitrary points in the design space. Preliminary analyses were performed to ensure that there was no violation of the assumptions of normality, linearity and multicollinearity. Details of the models are provided in Appendix A.3.
General Model 1: Change in premature deaths (ΔPDi) is the parameter to be projected. ExpoPM2.5 and population (P) are the predictors (independent variables):
We adapted cause-specific integrated exposure–response (IER) functions developed for studies of the Global Burden of Disease by Burnett et al. [50], Apte et al. [51],and Li et al. [52] to evaluate how China’s improvements in ambient air quality could reduce PM2.5-related premature death. This function constrains the shape of the concentration–response (C–R) relationship (Figure A10). The premature deaths (PD) attributed to ambient PM2.5 in a given year are calculated as follows:
P D i = P i   ×   I i   ×   H R i E x p o P M 2.5 i 1 H R i E x p o P M 2.5 i
where:
i is the year of estimation;
Pi is the average population for year i;
Ii is the average premature death rate for year i;
ExpoPM2.5i is the average PM2.5 concentration to which the population of China is exposed for year i;
HRi is the hazard ratio at concentration PM2.5i (estimated using the look-up table from Li et al. [52]).
When PM2.5 concentrations fall below a certain concentration (reference range: 5.8–8.0 μg/m3), the hazard ratio, HRi, equals 1, indicating that there is no excess risk.
Based on General Model 1 (Equation (2)), we utilize the following relationship (Equation (3)) to predict the change in premature deaths in year i ( P D i ) under a scenario in which PM2.5 concentrations are reduced from PM2.5i to a lower concentration PM2.5i* in the context of the COVID-19 pandemic:
P D i = P i   ×   I i   ×     H R i E x p o P M 2.5 i H R i E x p o P M 2.5 i * H R i E x p o P M 2.5 i × H R i E x p o P M 2.5 i *
General Model 2: Welfare cost (WFC) is the parameter to be projected (dependent variable). ExpoPM2.5 and GDP are predictors (independent variables) for year i:
WFCi = c0i + c1i GDPi + c2i ExpoPM2.5i
where:
c0, c1, and c2 are the regression coefficients;
i is the year of estimation.
Note that only the air pollution factor is taken into account for the above estimation, while other factors are assumed to remain normal (i.e., static).
To evaluate the robustness of the regression model, various measures of overall fit were examined. The variance inflation factor (VIF) was adopted to detect collinearity between variables. The VIF value is 1.06 for all independent variables, indicating there is no multicollinearity among the variables. Since the significance level is set to 5%, the p-values for the two models are less than 0.05, indicating that all variables added statistically and significantly to the prediction. The adjusted r2 value for the model is 0.96. A high value of adjusted r2 shows that the derived model adequately represents most of the variance. The two optimal models derived after parametric values are substituted are explicitly expressed as the following equations:
Explicit Model 1:
  P D i = P i   ×   I i   ×     1.8 1.6 1.8 × 1.6
Values for HRi and ExpoPM2.5i in Equation (3) are derived from the concentration–response relationship shown in Figure A10 and substituted into Equation (4).
Explicit Model 2:
WFC = −368281 + (0.112 × GDP) + (3894.69 × ExpoPM2.5)
The PD and WFC attributed to air pollution will be determined with and without the effects of COVID-19 lockdown measures. Accordingly, any difference between the two scenarios and any corresponding decreases in PD and WFC can be quantified and considered in further analyses.

3. Results

3.1. Effects of Lockdown Measures on Air Pollution Reduction

3.1.1. Nitrogen Dioxide (NO2)

Mapped Spatial Variations in Daily Mean Tropospheric NO2

The S5P-derived mean NO2 emissions were investigated over the 91-day study timeframe in early 2020 for the three consecutive sub-periods described earlier (Table 1): before lockdown (BLK), during the Chinese New Year (CNY) holiday and during lockdown (DLK). Equivalent periods (with respect to the start of the CNY) are compared for 2020 (the pandemic’s onset) and 2019 (pre-pandemic).
Figure 2 shows the daily mean tropospheric NO2 column density over China for the three periods of concern in early 2020: (a) BLK, (b) CNY and (c) DLK. The corresponding reference periods (d–f) for early 2019 are also shown for comparison. The yellow and red colours indicate heavy and very heavy column densities of NO2, respectively. The long-term mean column density of NO2 is considered heavily polluted and harmful to human health when its value exceeds 0.15 DU. Figure 2a demonstrates a heavy or very heavy NO2 column density before the pandemic lockdown measures were introduced in early 2020 over the most developed and populated clusters, such as the Yangtze River Delta (YRD), Pearl River Delta (PRD) and Beijing-Tianjin-Hebei (BTH) regions [53]. Similarly, the monthly mean tropospheric NO2 was high in December 2019 (BLK period) due to regional coal-burning activities and unfavourable meteorological conditions. Three severe air pollution episodes occurred from 11 to 31 December 2019, as indicated in Figure A1. The meteorological conditions during days with heavy air pollution were generally characterized by a low wind speed, high humidity, negative pressure variation and positive temperature variation. These meteorological conditions produce a stable atmosphere that is unfavourable for the dispersion of air pollutants, thereby increasing NO2 concentrations [54].
However, Figure 2b,c shows low (light blue) and very low (deep blue) air pollution across the whole of China during the Chinese New Year (CNY) and the later period with the imposed lockdown measures (DLK).
In contrast, Figure 2d–f shows many parts of China were suffering heavy or very heavy air pollution for all three reference periods in early 2019. Note that the colour bar in the key ranges from 0 to 1.5 Dobson units (DU). The top end of the range (orange and red) denotes very heavy pollution. Overall, a dramatic drop in NO2 emissions is clearly seen by comparing 2019 and 2020.
The column density of tropospheric NO2 in China is influenced mainly by anthropogenic activities, especially emissions from power plants and vehicles. Therefore, the NO2 spatiotemporal distribution is closely associated with patterns of development in China and fluctuations in the Chinese economy. The observation of tropospheric NO2 by the TROPOMI instrument confirmed the dramatic reduction in the use of fossil fuels in most industrial areas in early 2020 following the introduction of lockdown measures. The daily electricity production at coal-fired power plants was at its lowest value for four years, and steel producers hit a five-year low during the lockdown. Although there are slight variations in satellite imagery caused by cloud cover and changing weather, it is observed that the significant reduction in the measured tropospheric NO2 coincides with the lockdown in China, when traffic and industrial activities were curtailed. Such restrictions on human activities to contain the spread of COVID-19 which led to reductions in tropospheric NO2 concentrations were seen not only in large industrial cities in China but also worldwide [55,56,57].

Temporal Variations in Daily Mean NO2

To further quantify decreased NO2 emissions, seven provincial and metropolitan regions were subjected to further analyses (Beijing, Hebei, Shandong, Henan, Xi’an, Shanghai and Hubei). They represent highly polluted regions of China, with high coal consumption, cement production and steel production, as well as large numbers of civilian vehicles. The daily time series of tropospheric NO2 for the selected regions over the 91-day timeframes of our investigation for 2019 and 2020 are presented in Appendix A.
Figure 3 shows the time series of daily tropospheric NO2 over the seven study regions: (a) Beijing, (b) Hebei, (c) Shandong, (d) Henan, (e) Xian, (f) Shanghai and (g) Hubei for the duration of 91 days (45 days before and 45 days after Chinese New Year) of concern in the years 2019 and 2020.
During the equivalent 45-day reference period before CNY for both 2019 and 2020, the daily tropospheric NO2 levels varied considerably across the country. In general, the tropospheric NO2 emissions in 2020 were lower than those for the equivalent period in 2019. This may be the result of the Thirteenth Five-Year Plan of China, originally implemented to reduce total nitrogen dioxide emissions by 2020 to within 15.74 million tons, i.e., to achieve a 15% decline from the vales in 2015 [58,59]. Over the period of the Thirteenth Five-Year Plan, China has enhanced the efficiency of energy utilization and controlled atmospheric emissions. During the 2019 timeframe, peaks of daily tropospheric NO2 were over 1.2 DU for the study sites, except for Shanghai, which showed 0.7 DU. On the other hand, for the equivalent period of 2020, i.e., before lockdown, the peak value dropped to below 0.7 DU for mainland China, with the exceptions of Hebei and Beijing, which remained at high values near 1.2 DU and 1.4 DU, respectively. The Hebei–Beijing region is known as the largest urbanized megaregion in northern China, with a large inflow of people during CNY and no prohibition on fireworks, resulting in high levels of NO2. In addition, the significant decline in NO2 concentrations in Shanghai and its surrounding area was also attributed to higher temperatures and heavy precipitation over the period 22–26 January 2020 [56]. Nevertheless, the substantial decreasing trends in NO2 levels are pronounced for all the regions in China, as demonstrated by the dashed black lines in Figure 3.
It can be clearly observed that the daily tropospheric NO2 significantly decreased during the 45-day period after the lockdown started in 2020, as compared with the reference period in 2019 in all seven regions, while this is not the case for the period before CNY in both years. During the 9th to 31st days after the start of CNY in 2019, the peaks of tropospheric NO2 ranged from 0.4 to 1.3 DU for both the relatively remote Henan Province and highly populated city of Beijing, respectively. In contrast, for the equivalent period in 2020, i.e., during lockdown amid the COVID-19 pandemic, the NO2 values dropped to below 0.3 DU for all of mainland China, except for Beijing which had a value of approximately 0.5 DU. However, a slightly upward trend can be noticed in the Beijing, Hebei and Shandong regions, as shown by the dashed blue lines in Figure 3.
As the lockdown measures were lifted from March 2020 onwards, the NO2 levels began to rise slightly, mainly in Beijing, Hebei and Henan, although other regions maintained low levels and decreasing trends (dashed magenta lines). Meanwhile, the concentrations of NO2 in metropolitan cities, such as Beijing and Shanghai, had peaks over 1.2 DU and 0.8 DU, respectively, during the equivalent period of 2019. This observation indicates that the lockdown policy for transportation activities was not fully eased after February 2020, resulting in consistently low NO2 concentrations.
Meteorological conditions play a significant role in the mechanisms of particle formation, air convection and diffusion processes [60,61,62]. The data on wind speed (WS), temperature (T) and relative humidity (RH) for the seven study regions across China were obtained from NCEP for the equivalent 91-day timeframes of interest in 2019 and 2020. These data are presented by the box and whisker plots in Figure 4. Refer to Appendix A for details of the time series.
As seen in Figure 4, the regional wind speeds were largely comparable for the winters of 2019 and 2020. Wind speeds generally range from 2 to 5 m/s, except for Shanghai which has a range from 4 to 6 m/s, i.e., light air to a gentle breeze according to the Beaufort wind scale. The winter temperatures were low everywhere (0–10 °C), especially in Beijing and its surroundings, where the temperatures occasionally dropped below freezing. The relative humidity is related to the temperature; as the temperature decreases, the relative humidity increases. Compared with 2019, the relative humidity was higher in 2020.
The cloud cover is also shown and compared between the two winters (2019 and 2020) in Figure A1. It can be seen that the average cloud cover in early 2020 was less than that in early 2019, virtually everywhere south of the line between the cities of Xi’an, Henan and Shandong. Although the relationship between cloud cover and emissions is not a straightforward one, nonetheless it is likely that the difference in cloud cover would have exerted an influence on the lower NO2 readings during the lockdown period.
Overall, therefore, the weather data indicate that conditions during the winter of 2020 were generally conducive for air pollution build-up, broadly similar to those in 2019. Ipso facto, the improvement in air quality during the 2020 lockdown period cannot be easily credited to amelioration by meteorological factors alone.

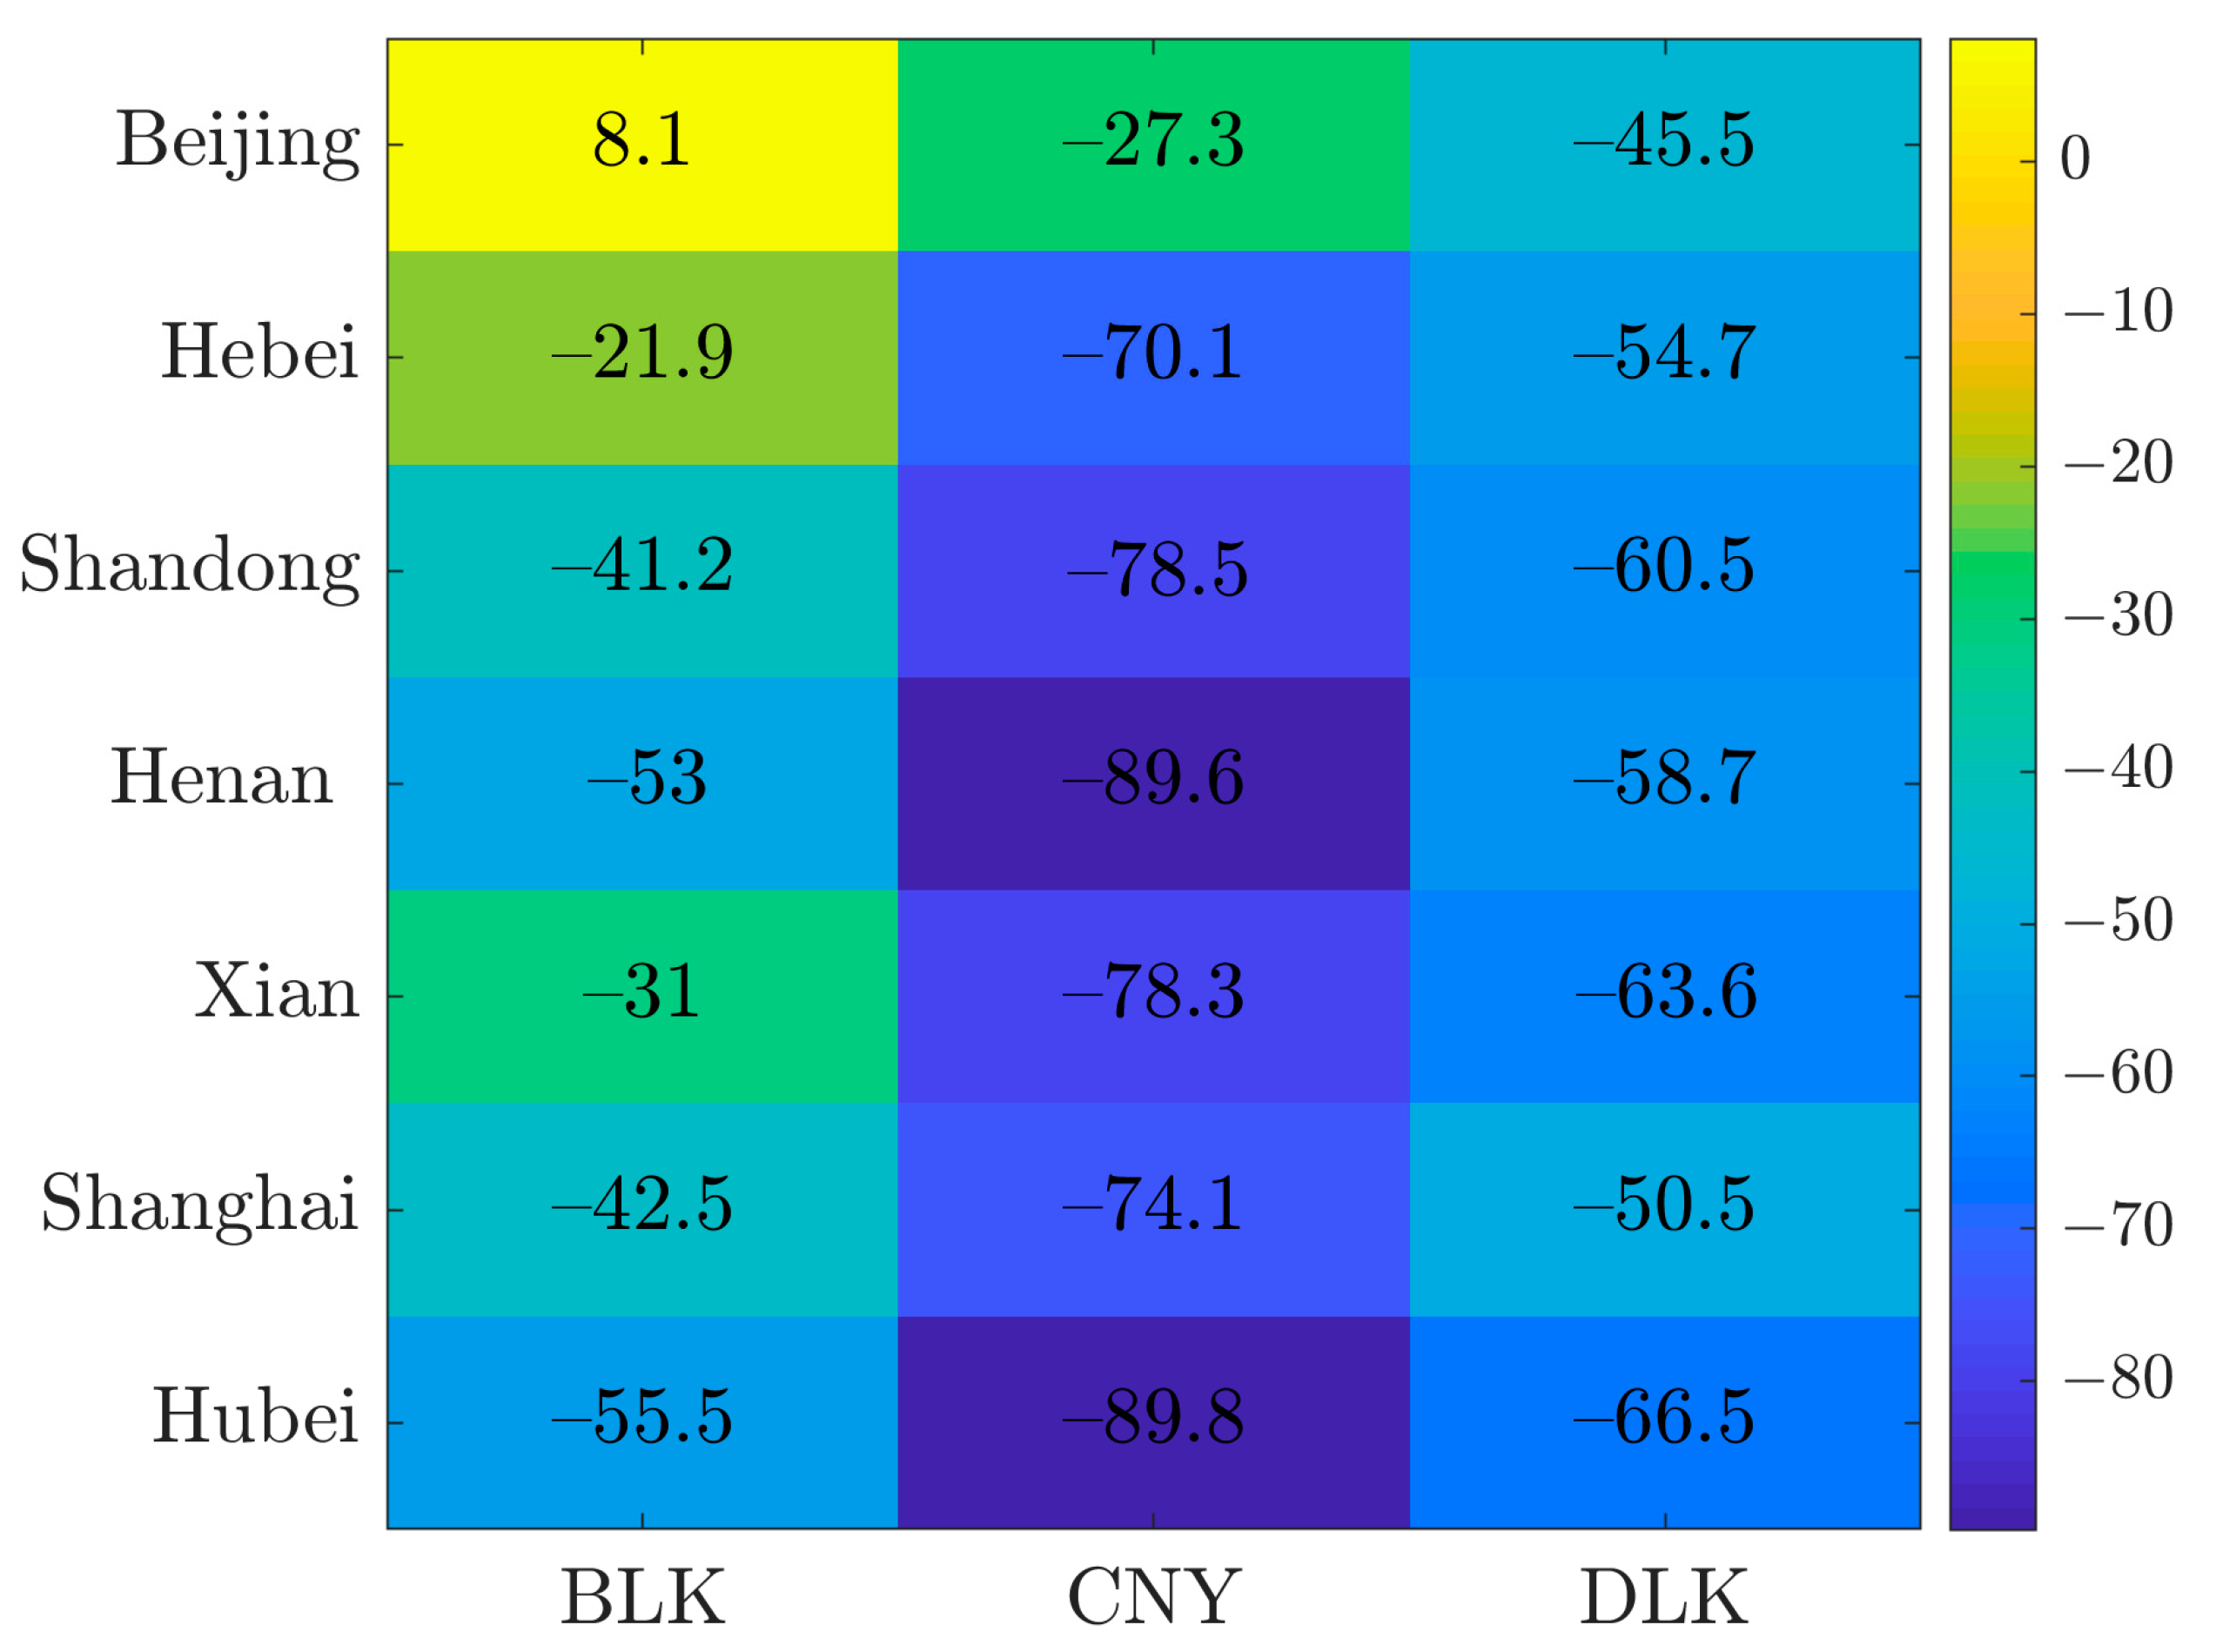
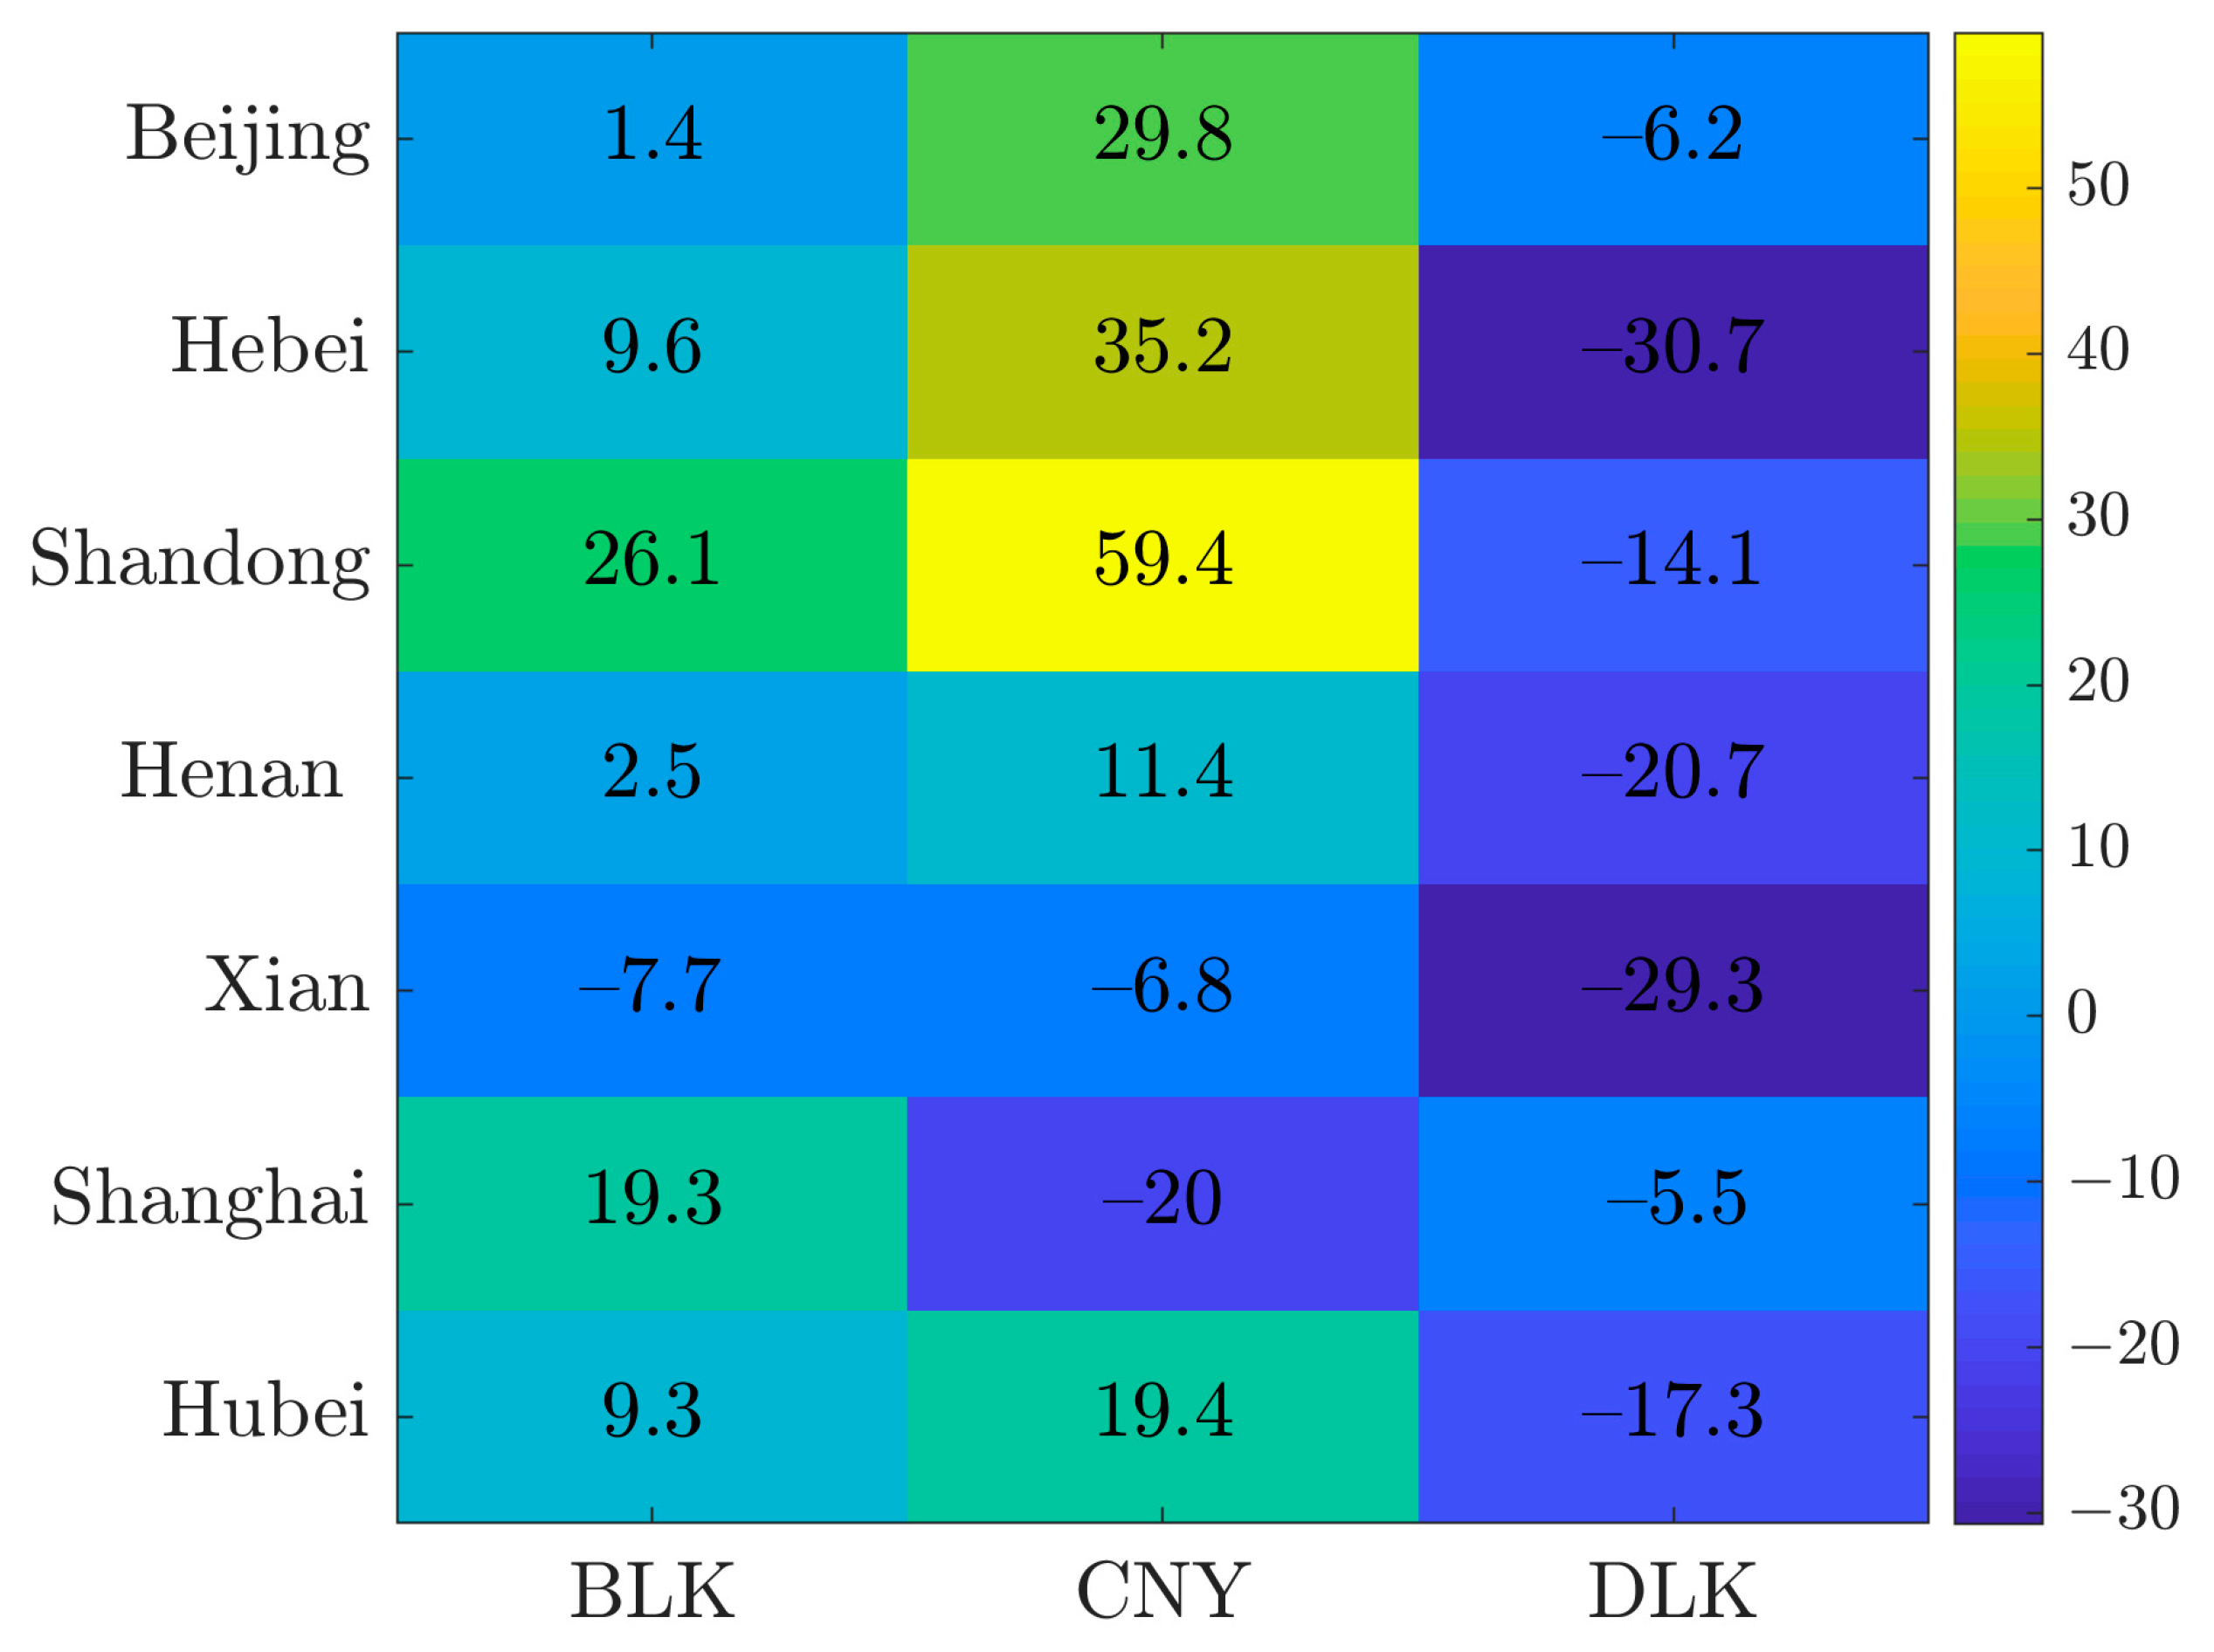
Percentage Reductions in Tropospheric NO2 between 2019 and 2020

Figure 5 shows the percentage change in the tropospheric NO2 between the reference years 2019 and 2020 over the three consecutive periods: BLK, CNY and DLK.
For most of the seven study regions across China, the observed decreases before the lockdown measures were introduced (BLK period) may have resulted from the Thirteenth Five-Year Plan of China, as mentioned above. Beijing, the capital city, is the exception, showing an 8.1% increase in NO2 during BLK. Being the third most populated city in China, with over 20 million people and 5 million vehicles, Beijing has suffered from severe air pollution episodes in recent years [63].
Not surprisingly, the tropospheric NO2 drops markedly from 2019 to 2020, for the subsequent two periods of interest (CNY holiday and the DLK period) across all seven regions of concern. Through comparisons with related studies [31,32,33], it is seen that other findings are broadly consistent with our work. Here, the NO2 in most regions showed the most significant decrease during CNY, ranging from −27.3% in Beijing to −89.8% in Hubei. The suggested reason is that the lockdown measures imposed at the start of the CNY in 2020 completely curtailed transportation activities and travel, as compared with the usual freedom of movement in 2019. As exemplified for Wuhan, population movement quickly dropped during CNY in 2020, as compared with the estimated five million people who had already left the city as of 26 January 2020 [64].
For the period following the CNY holiday, factories and industries in 2019 resumed normal operations. However, this was not the case for the DLK period in 2020. Consequently, the tropospheric NO2 in all the study regions again showed marked decreases in comparison to that of the 2019 equivalent reference period, between −45.5% and −66.5% for Beijing and Hubei, respectively.

Absolute Change in Tropospheric NO2 through Early 2020

The box and whisker plots in Figure 6 allow for the comparison of the average daily tropospheric NO2 across the seven selected regions of China, over the three study periods BLK, CNY and DLK in early 2020. The seven box plots overlap for each period of interest.
The values and differences between the regions were largest in the early phase before lockdown (BLK), indicating that the tropospheric NO2 was very high while factories, industries and transportation networks were operating normally. During the BLK period, the tropospheric NO2 in Beijing exhibited the highest and widest range in air pollution, with 0.2, 0.72 and 1.5 DU for its minimum, mean and maximum values, respectively. Particularly alarming are the outlier values, showing that the tropospheric NO2 reached exceptionally high readings, up to 2.2–2.5 DU on especially polluted days. For the same period, Hebei showed the second-highest tropospheric NO2, followed by Shandong, Xi’an, Henan, Hubei and Shanghai, with daily averages of 0.67, 0.41, 0.40, 0.32, 0.25 and 0.24 DU, respectively.
Moving forward in time, during the lockdown period following the annual CNY holiday (DLK period), the tropospheric NO2 in Hubei significantly declined to give the lowest measurement, followed by Shanghai, Henan, Xi’an, Shandong, Hebei and Beijing, with daily averages of 0.11, 0.13, 0.14, 0.15, 0.18, 0.21 and 0.30 DU, respectively. These values all represent significant decreases in the tropospheric NO2 from the BLK to the DLK periods.
Overall, the most important finding is that, although there were big differences across the seven study regions, a consistent and unidirectional trend can be identified. This trend is characterized by significant and rapid decreases in the mean tropospheric NO2 readings between the timeframes BLK→DLK. Furthermore, it is noteworthy that this decreasing trend through early 2020 does not conform to the usual ‘V-shape’ tendency of air pollution in China, in which marked decreases in emissions during the CNY are followed by sharp increases once again as industrial activities resume [65]. The unique contributing factor in 2020, leading to the atypical decreasing signal in tropospheric NO2 after the CNY in the most polluted regions of China, was the lockdown imposed by authorities to contain the spread of COVID-19.

3.1.2. Particulate Matter (PM2.5)

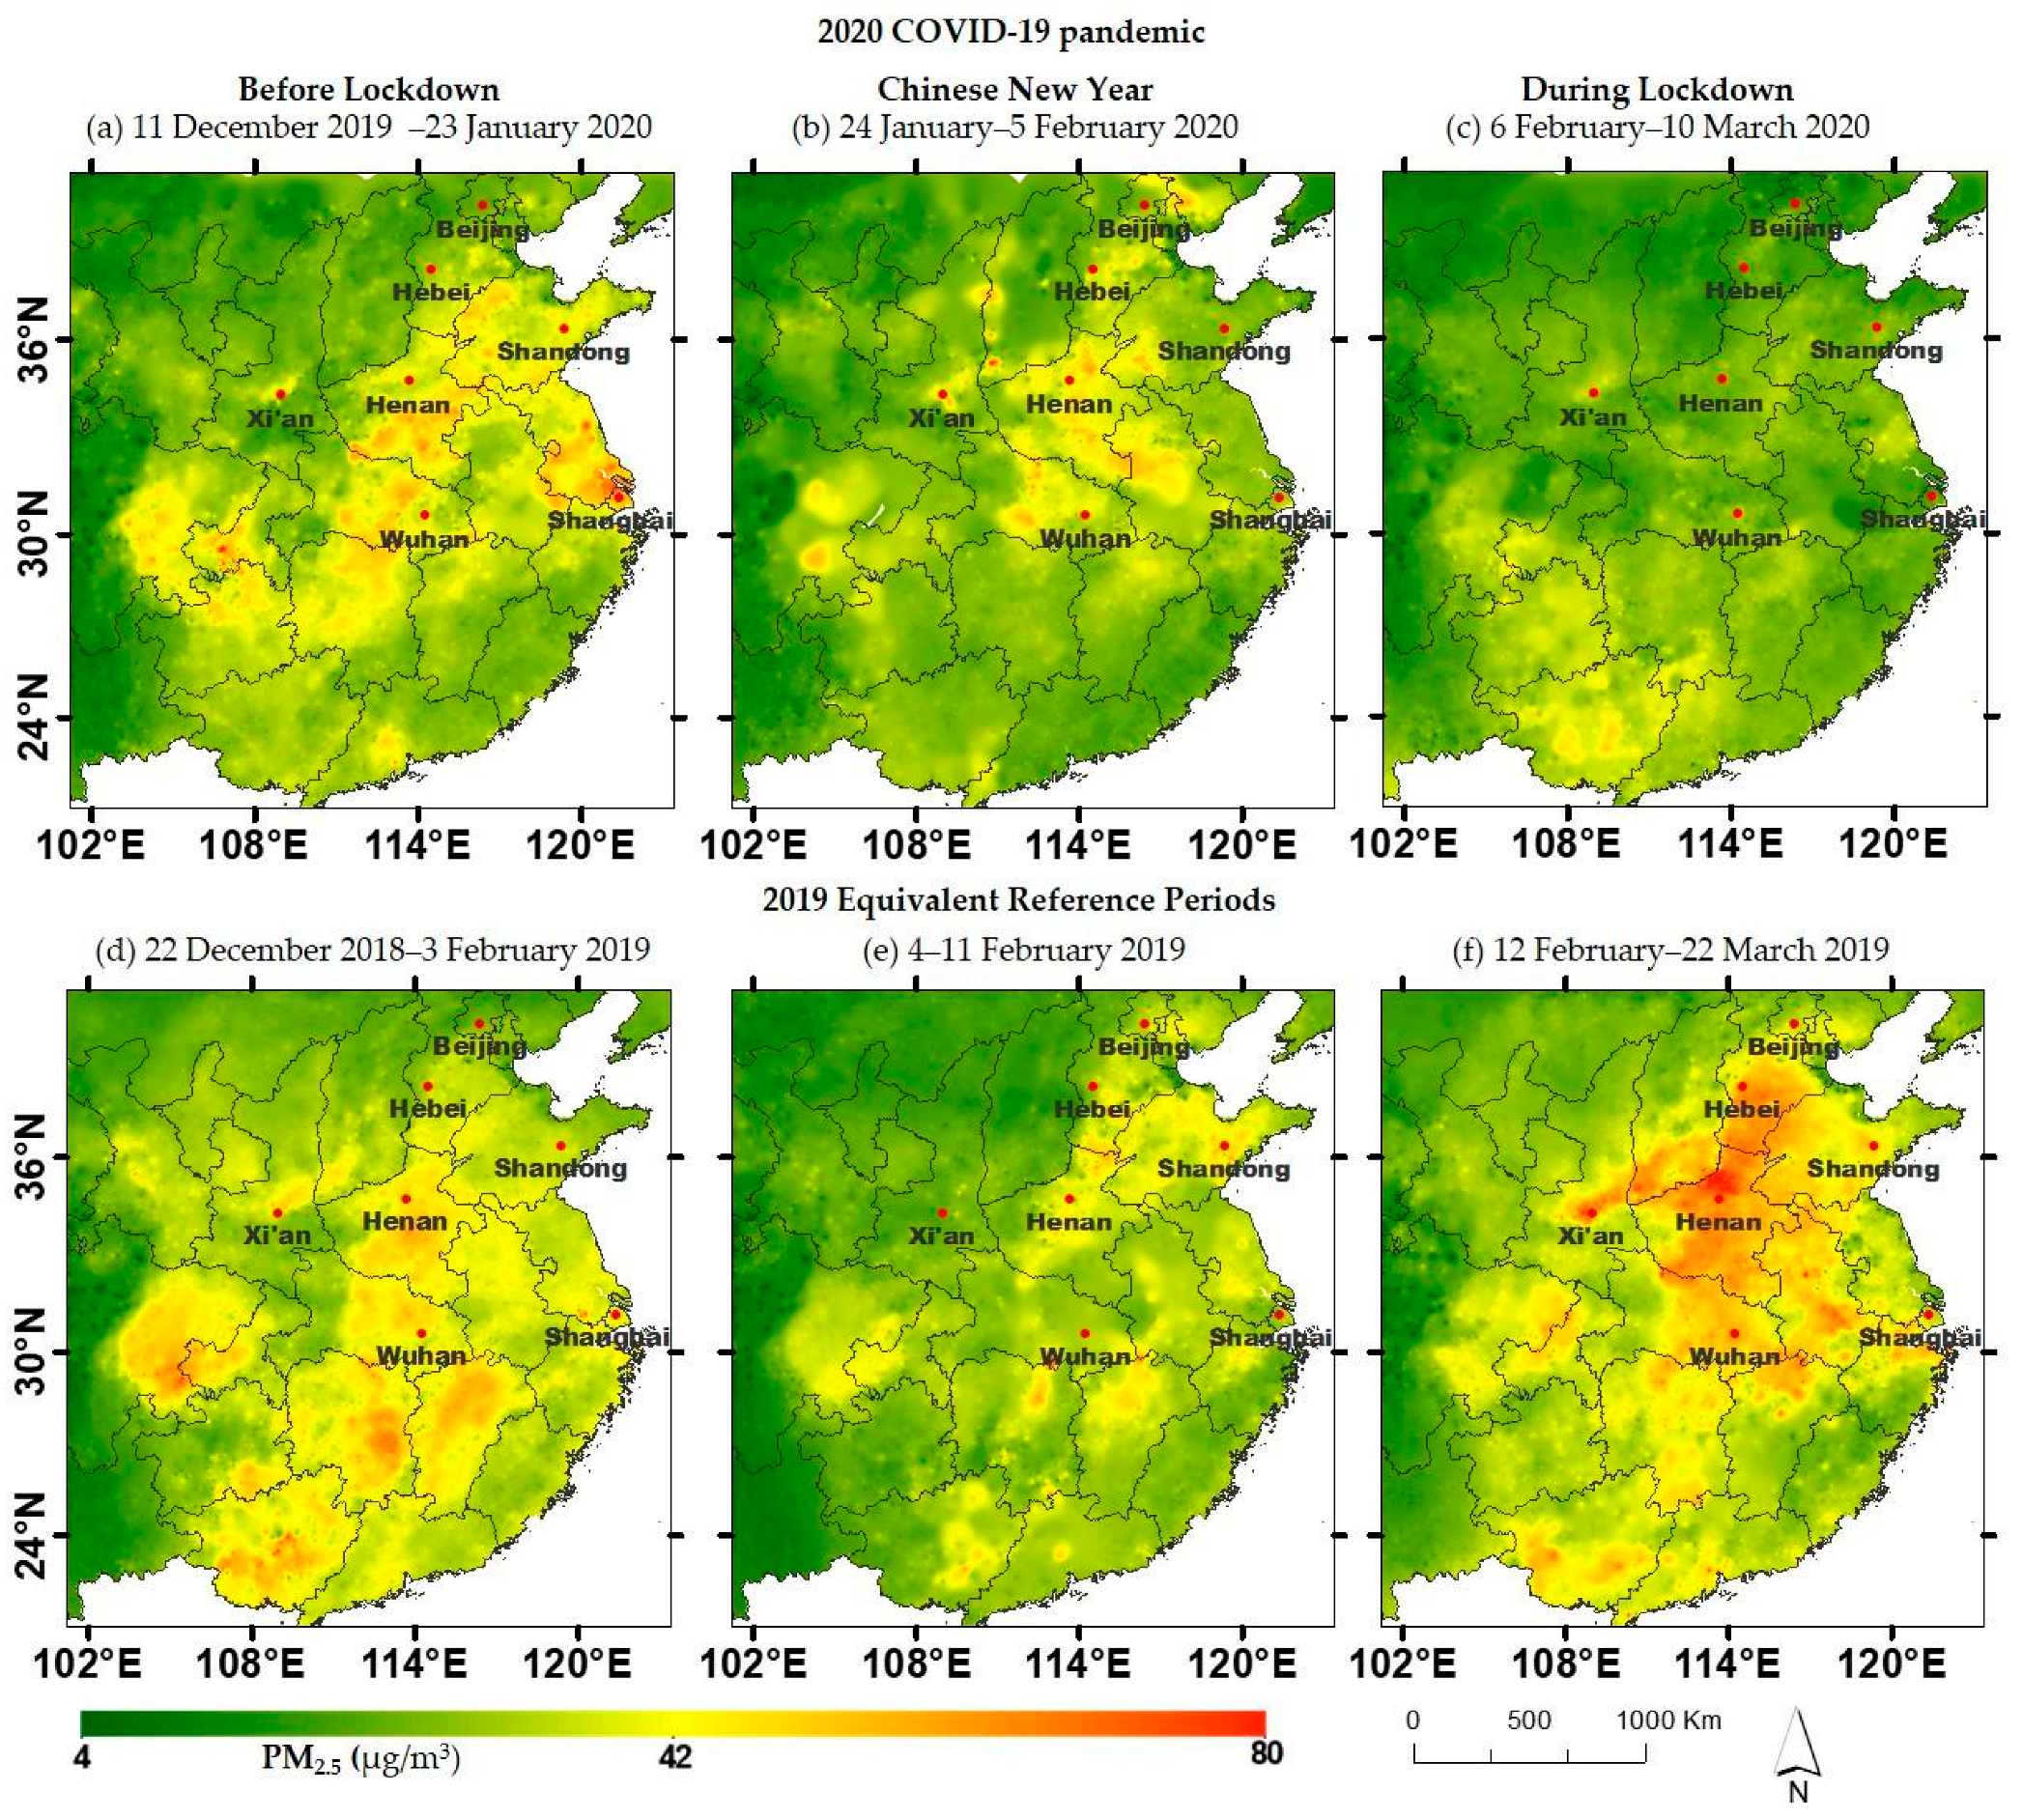
Mapped Spatial Variations in Daily Mean PM2.5

According to the China Air Quality Standard, annual mean and 24 h mean PM2.5 concentrations should ideally be less than 15 and 35 μg/m3, respectively. The surface PM2.5 concentrations derived from MAIAC AOD during the three consecutive periods of BLK, CNY and DLK within the 91-day study timeframe for 2020 and the equivalent periods in 2019 are shown in Figure 7. The green, yellow and red colours indicate low, high and very high PM2.5 concentrations, respectively.
Figure 7a demonstrates that the observed trend in the PM2.5 concentrations corresponds well with that of the tropospheric NO2 in Figure 2. It can be seen that before the lockdown (BLK), high or very high concentrations of PM2.5 characterized the Yangtze River Delta (YRD), Pearl River Delta (PRD) and Beijing-Tianjin-Hebei (BTH) regions. Subsequently, the green colour dominates mainland China throughout the CNY and DLK periods (Figure 7b,c, respectively), indicating low or very low PM2.5 concentrations. In contrast, a significant portion of China suffered high and very high PM2.5 pollution during the equivalent timeframes for the pre-pandemic year of 2019, as shown in Figure 7d,f. Overall, a decrease in PM2.5 concentrations is notable between 2019 and 2020.

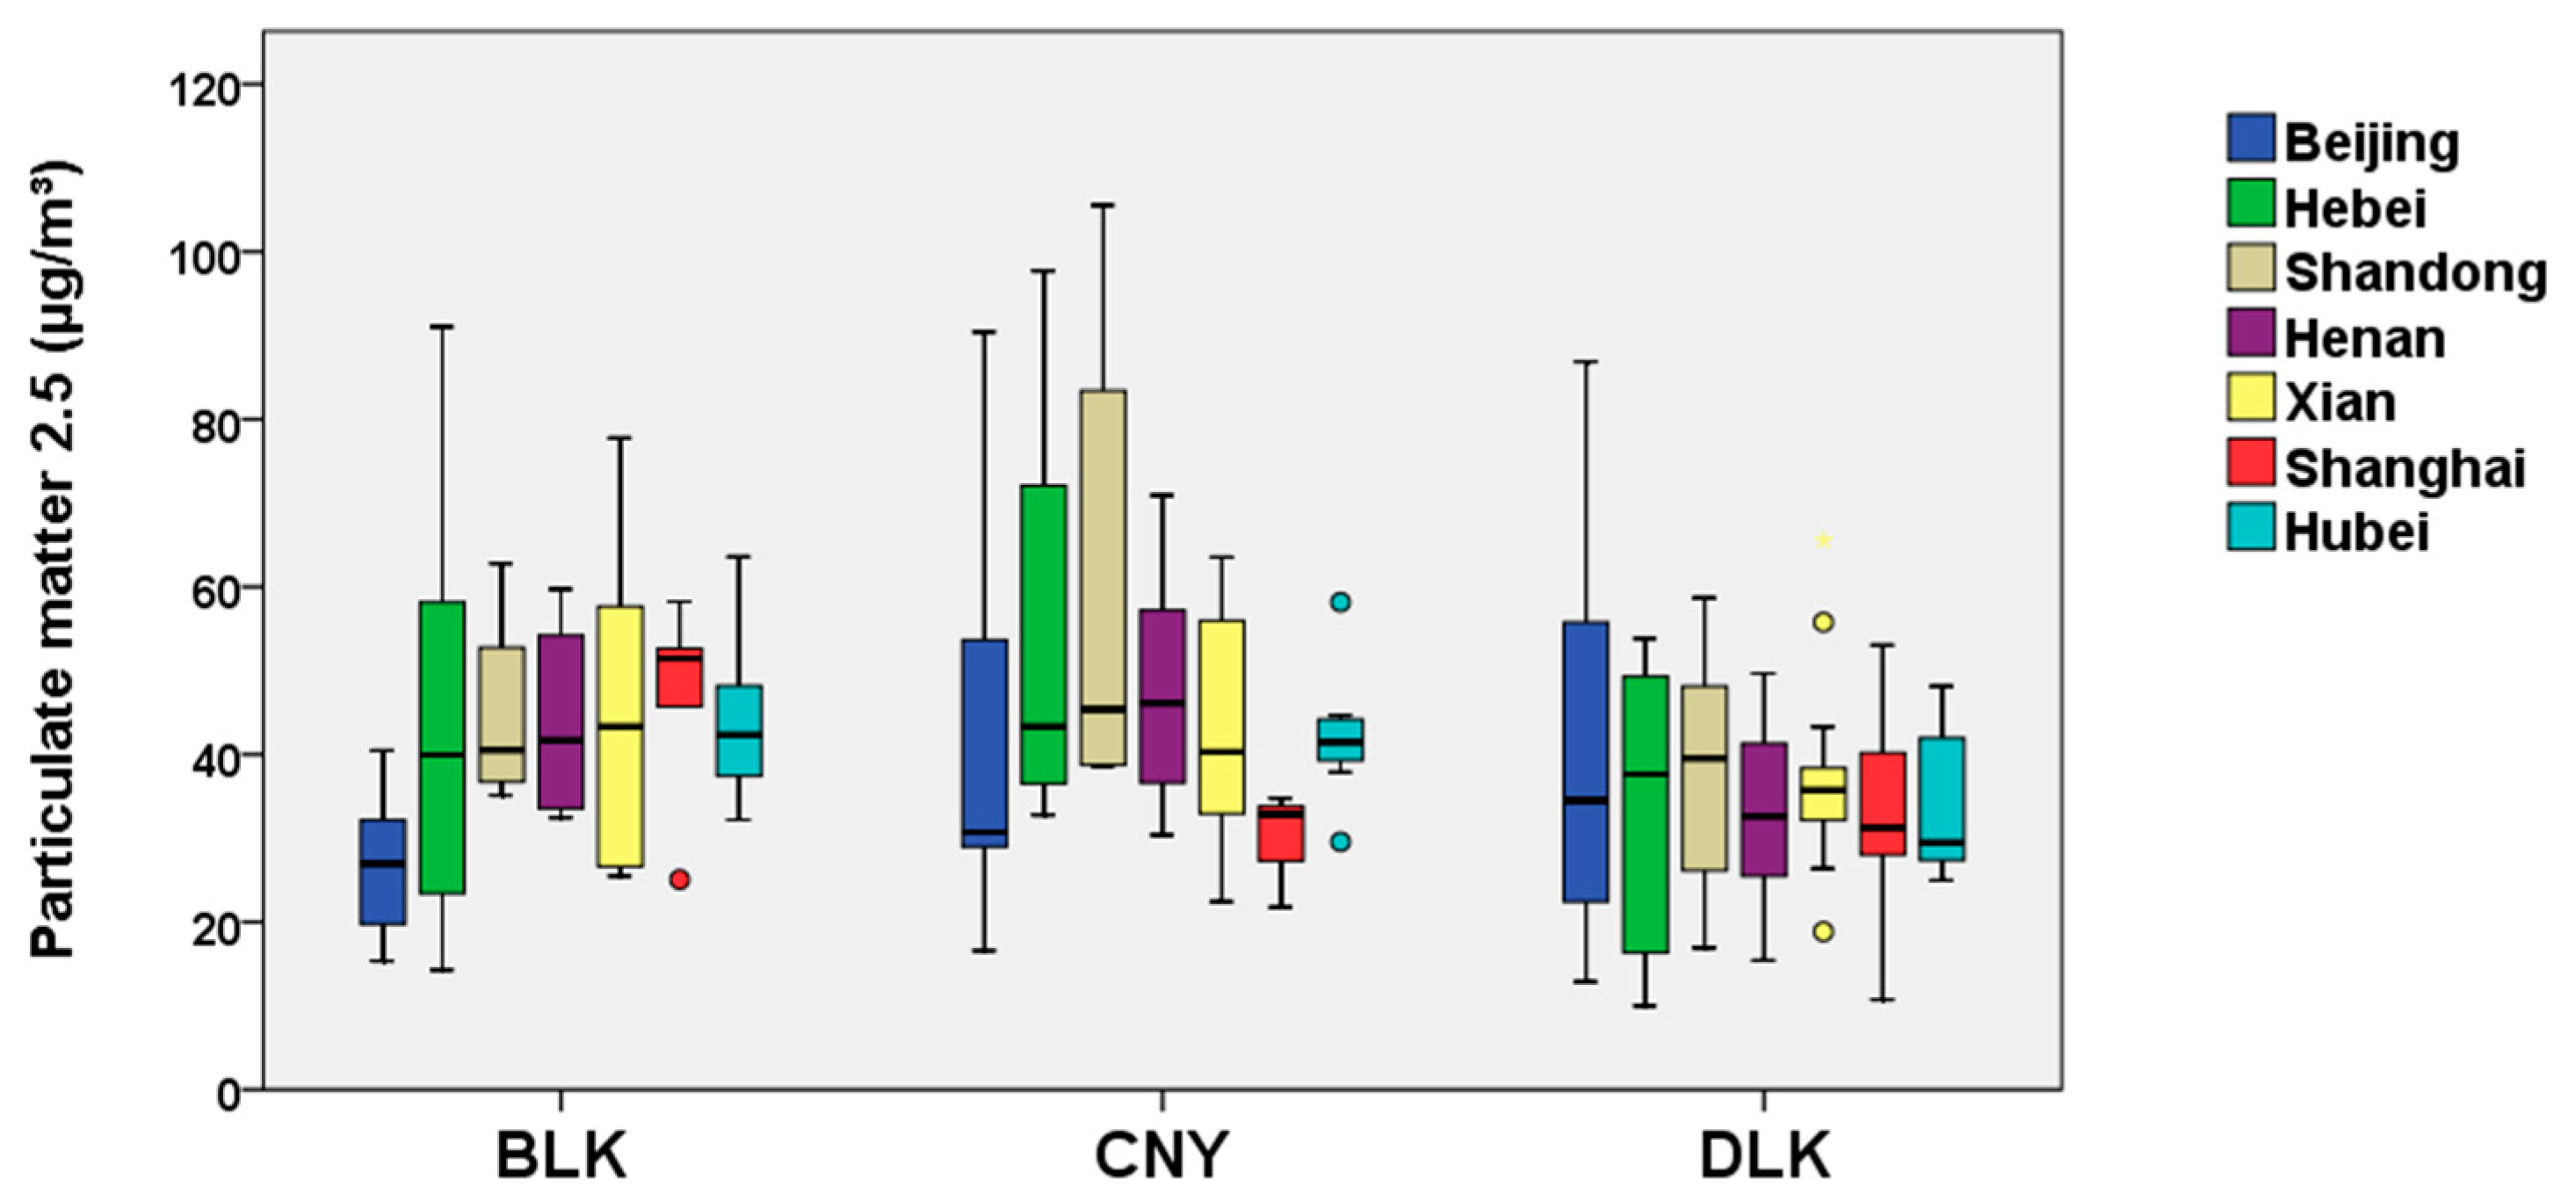
Temporal Variations in Daily Mean PM2.5

Figure 8 presents the time series of daily PM2.5 for the 91 days of investigation (45 days before and 45 days after Chinese New Year) over the seven selected regions for the years 2019 and 2020.
It is important to note that the lifetime of PM2.5 in the atmosphere is much longer in comparison to NO2. In addition, the transboundary transport of PM2.5 can occur [66,67]. Most regions except Beijing show substantial overall reductions in PM2.5 concentrations during the 45 days after Chinese New Year in 2020, as compared with the equivalent timeframe in 2019, as indicated by the green-filled areas on the plots in Figure 8. However, this pattern of reduction is not uniform across all the seven study regions. In northern cities, such as Beijing, the decreasing trend is not seen in the first haft of the lockdown period (days 9 to 20), which reveals the influence of various factors, including the climate conditions and heating activities in the winter. Beijing is located on the North China Plain, where the winter temperature is low, accompanied by low precipitation, low wind speed and high RH, which can result in higher air pollution, owing to the less effective removal of atmospheric particulates by natural processes (Figure 4). Moreover, noticeable discrepancies are also observed for the other regions. In northern regions, such as Hebei, Shandong and Xi’an, significant decreases in air pollution are pronounced because the pollution is mainly a result of transportation and industries. Yet, in regions of the Yangtze River Basin, such as Henan, Shanghai and Hubei, meteorological conditions are normally characterized by higher temperatures, more precipitation, higher RH and stronger wind speeds (Figure 4); thus, the relative reductions in PM2.5 were lower than in the northern regions.
Although the PM2.5 levels overall exhibited significant reductions after the lockdown started in the seven study areas, particularly in Hebei, Shandong, Henan, Xian and Hubei (Figure 8b,c,d,e,g, respectively), the PM2.5 concentrations showed fluctuating trends throughout the research period. There were increasing tendencies in all seven regions prior to lockdown (dashed black lines), but after the lockdown was imposed, noticeable downward trends in the PM2.5 levels were seen from CNY to 20 February (dashed blue line).
The lowest PM2.5 levels were recorded in all locations throughout the lockdown period, from day 11 to 26 following CNY (5–20 February). The values decreased to less than 60 μg/m3 across the whole of mainland China, with the exception of the Beijing region, where the values reached 80 μg/m3, presumably due to unfavourable meteorological circumstances and smog episodes, as stated above and elsewhere [68]. During the corresponding time after CNY in 2019 (day 11 to 26), the PM2.5 concentrations peaked at 60 to 90 μg/m3 in Hubei Province and the heavy industry heartland of Shandong Province. It is estimated that an average daily reduction of 5–17 μg/m3 in the PM2.5 was achieved from January to February 2020, compared with equivalent period in the previous year.
However, only a few weeks later, as a result of the cessation of the imposed lockdown measures (post-lockdown period in Figure 8), the PM2.5 again begins to increase (dashed magenta lines) in five out of the seven regions (except Beijing and Xi’an) from 20 February to 10 March 2020. This is likely due to the fact that social activities and factories in cities gradually returned to normal operations, and that any weather effects were diminishing. Moreover, the PM2.5 levels in all the regions were higher in 2019 than in 2020, as demonstrated by the salmon-shaded areas between the graphs.

Percentage Reductions in PM2.5 Concentrations between 2019 and 2020

Figure 9 shows the quantitative change in the PM2.5 concentrations during early 2020 for seven regions across China, compared with the corresponding reference periods in 2019. The percentage change in the PM2.5 concentration from 2019 to 2020 for the BLK and CNY periods is positive (showing increases) for most of the study regions. Xi’an is the exception, showing decreases of −7.7% and −6.8%, possibly due to the occurrence of unfavourable meteorological conditions and an associated pollution episode in late January (25 January 2020) [68].
During the 2020 lockdown period (DLK), it is noted that Hebei and Xi’an show the biggest percentage decreases in their PM2.5 concentrations: −30.7% and −29.3%, respectively. Hebei and Xi’an are home to China’s biggest steel factories [69] and are the most polluted regions. Henan and Shandong, known as China’s heavy industry heartland [70], also show notably reduced PM2.5 concentrations: −20.7% and −14.1%, respectively. Surprisingly, Shanghai shows a considerable decline (−20%) during CNY but only a slight decrease (−5.5%) for the later DLK period.
In Hubei Province, where the COVID-19 outbreak originated, the PM2.5 concentrations similarly showed a DLK fall of −17.3%, whereas Beijing and Shanghai had more modest decreases of −6.2% and −5.5%, respectively. Overall, for the DLK period following the Chinese New Year in 2020, the PM2.5 concentrations reduced by an average of about 18% nationwide, with the steepest drops in the central region, corresponding to the dramatic decline in the use of oil and coal as industries shut down their operations.

Absolute Change in PM2.5 Concentrations through Early 2020

The box and whisker plots in Figure 10 allow for comparisons of the PM2.5 concentrations in early 2020 through the three consecutive BLK, CNY, and DLK periods of interest across the seven study regions of China. Overall, there were significant fluctuations in PM2.5, mainly in the cities of Hebei, Shandong and Beijing.
Compared with before lockdown (BLK), the CNY period showed increases in mean PM2.5 concentrations, from 27.0 to 45.3 μg/m3, 43.5 to 54.3 μg/m3, 44.7 to 62.3 μg/m3 and 43.9 to 47.9 μg/m3 for Beijing, Hebei, Shandong and Henan, respectively, possibly owing to the use of firecrackers for traditional celebrations during the Chinese New Year holiday. Note that the Hebei–Beijing region is the largest urbanized megaregion in northern China, with a substantial inflow of people during CNY and with no prohibition on fireworks. In contrast, Xi’an, Shanghai and Hubei showed slight decreases in the PM2.5 concentrations during the CNY, from 46.3 to 42.6 μg/m3, 46.6 to 30.5 μg/m3 and 43.8 to 42.3 μg/m3, respectively.
However, by the later DLK period, the mean PM2.5 concentrations dropped to within the range of 33.7–41.8 μg/m3 for most of the regions except Beijing. Although differences are observed among the seven study regions, most regions experienced a fall in PM2.5 concentrations owing to lockdown measures.
In summary, although restrictions of movement and the cessation of industrial activity imposed across major cities in the campaign to prevent the spread of coronavirus caused hardships, such measures are seen to have had positive effects on ameliorating the levels of air pollution that increasingly plague much of China. The average concentrations of PM2.5 and NO2 dropped dramatically in February 2020 to their lowest levels since 2014 across most of mainland China.

3.2. Projected Annual Premature Deaths and Welfare Cost

Mean exposure to PM2.5 is highly relevant to the assessment of air pollution’s impacts on health. It is used as an indicator for quantifying the burden of disease associated with air pollution in the OECD statistical database. Mean exposure to PM2.5 data are therefore utilized here for the projection of premature deaths and welfare loss.
Figure 11 shows the time series variation in five indicators for China from 1990 to 2019. Besides gross domestic product (GDP), the other indicators include premature deaths (PD), disability-adjusted life years (DALYs), welfare costs (WFC) and value of a statistical life (VSL), as attributed to exposure to PM2.5. According to the OECD [71], DALYs are defined as the sum of years of life lost from living with disability and premature mortality. The WFC of premature deaths related to air pollution are estimated from the willingness-to-pay for risk reduction. Willingness to pay (WTP) in this study is the maximum price an individual is willing to pay to avoid negative air pollution-related health impacts. The aggregated costs individuals would pay to reduce the average number of deaths by one is the VSL.
To better compare the trends in these five indicators through time, the data have been standardized. By calculating the z-scores from the original values, all the values in the dataset are standardized onto the same scale without distorting the differences in the ranges of values. It is of no surprise to observe increasing trends for all five indicators resulting from rapid economic development and population growth in China.
The rapid economic development of China over the past three decades, from 1990 to 2019, is indicated by the huge increase in its annual GDP (PPP) from USD 1653 billion to 23,036 billion. Furthermore, the value of a statistical life (VSL) climbed from USD 0.14 million to 1.72 million, in parallel with the growth in GDP. However, these achievements have been accompanied by worrisome increases in premature deaths and welfare costs related to air pollution over the same period. Between 1990 and 2019, the number of premature deaths related to exposure to ambient PM2.5 more than doubled, from 520,214 to 1,423,633 deaths per year [71]. In 2019, more than 32,863 years of life were lost (DALYs) owing to pollution exposure.
The devastating number of lives lost per year due to air pollution imposes a high economic cost on China. For instance, the welfare costs related to PM2.5 pollution grew from USD 73.6 billion in 1990 to USD 2455.3 billion in 2019, which is equivalent to nearly 10% of China’s GDP. (Welfare costs are expressed as a percentage of GDP only to provide a convenient relative scale and do not suggest that welfare is a share of GDP) [72].
The death rate per population and the percentage attributable to air pollution from 1990 to 2019 in China have been analysed, as shown in Figure 12. The death rate from all causes (grey bars) fluctuates around 688 deaths per 100,000 population over the 30-year period shown, with a slight increase shown over the last decade. Deaths from all causes include three risk categories: environmental/occupational risks, behavioural risks and metabolic risk factors. The environmental/occupational risks specifically include unsafe water, sanitation and handwashing; air pollution; non-optimal temperature; and other environmental risks, such as occupational exposure to noise, asbestos, arsenic and benzene [73].
Notably, there has been a steady, overall improvement in the death rate attributable to all environmental risks (black bars), with a 12.7% reduction between 1990 and 2019. Similarly, the percentage of all deaths from environmental risks (comparing grey and black bars) decreased from 30.9% to 25.4% for the whole period.
That said, however, the death rate attributable to air pollution (green bars) made no progress whatsoever over the period of 1990–2019. Indeed, there has been an alarming increase in the proportion of air-pollution-related deaths compared with deaths from other causes (comparing the green, black and grey bars). The percentage of deaths associated with ambient air pollution is likewise rising rapidly. By 2019, air pollution deaths made up the majority (52.1%) of deaths attributed to all types of environmental risks (black line). This is more than double the value recorded in 1990, which was 20.1%. Similarly, the deaths attributable to air pollution as a percentage of all deaths (green line) also show an upward trend. These worsening trends in death rates that can be attributed to air pollution are strongly reinforced by the significantly increasing population, which thereby exposes many more people over time to air pollution (Figure 11).
Following on from above, projections were made for the six years from 2020 to 2025, in the number of premature deaths and welfare costs associated with air pollution exposure (Figure 13). Two alternative scenarios were assumed, namely with and without the effects of lockdown measures implemented to contain the COVID-19 pandemic in China. Accordingly, the values of PD, WFC, ExpoPM2.5, P and GDP from 2020 onwards were first projected for normal circumstances (without lockdown measures) by the ARIMA models described in Section 2.2.3. Figure 13 illustrates the projections in PD, WFC, P, GDP and ExpoPM2.5 for 2020–2025. Subsequently, premature deaths and welfare costs were projected using regression models (Equations (2) and (4)) to include the effects of the 2020 lockdown measures in reducing the levels of air pollution (Figure 12).
The 18% average nationwide decline in PM2.5 concentrations across China as a result of lockdown measures, as estimated in Section 3.1.2, was applied to the two projection regression models (2 and 4). It is further assumed that similar reductions in air pollution will continue in the near future up to 2025, as the pandemic is ongoing.
Pearson correlation coefficients (r) were calculated between the mean exposure to PM2.5 (ExpoPM2.5) and the other parameters (PD, WFC, GDP, DALYs, VSL and Population), for the 1990–2019 dataset to assess the strength of these relationships. Figure 14 illustrates the resulting correlation coefficients as a heat map. Moderate-to-strong linear relationships are shown between the exposure to PM2.5 and the other variables of interest, yielding r-values in the range of 0.605–0.732. These positive correlations imply that, within a normal pre-pandemic scenario, air pollution would continue to worsen in the future with the growing population and GDP in China; moreover, premature deaths, welfare costs and years of life lost would continue to increase.
Since strong correlations are found to exist between the variables investigated, the detection of any multicollinearity is important before any variables can be included in the regression model used for future projections of air quality and associated effects in the COVID-19 scenario. The VIF and p-values were tested for statistical significance using a stepwise regression in order to remove multicollinearity and for the selection of independent variables to be used in the final regression model. Only those variables were selected that fulfilled the following selection criteria: VIF < 2 and p-value < 0.01. Details are described in Section 2.2 and Appendix A.3.
Finally, future projections were obtained using the mean population exposure to PM2.5 (ExpoPM2.5) as the predictor variable to estimate the future PD and WFC values (explicit regression models in Equations (4) and (5)). The projected PD and WFC values for the years 2020–2025 for the two scenarios with and without the implementation of COVID-19 lockdown measures are presented in Figure 15
Figure 15 shows comparisons of the predicted premature deaths and welfare costs between the two scenarios of interest from 2020 to 2025. It is seen that both the PD and WFC attributed to air pollution are markedly less after 2020 in the case in which COVID-19 lockdown measures are implemented. The trend is particularly less steep for PD, as premature deaths are closely related to air pollution. Quantifying these relative reductions in projected the PD and WFC is possible by subtracting between the values modelled from the non-pandemic and pandemic scenarios. Under normal circumstances, the projected PD and WFC for 2020 would be 1,479,450 people and USD 2623.28 billion PPP, respectively. However, these figures decrease to 1,382,057 people and USD 2548.96 billion PPP, in the COVID-19 scenario. This means that up to approximately 97,393 premature deaths and USD 74.32 billion PPP might be saved owing to the reductions in the mean population exposure to PM2.5 in 2020.
Furthermore, if the decline in exposure to PM2.5 could be maintained in the years up to 2025, as assumed in the model, the improved air quality would continue to bring benefits for human health in terms of reducing the forecast of premature deaths and associated welfare costs, as indicated in Figure 15.

4. Discussion

Although this study has produced substantial findings, there still exist several concerns that require further clarification. First, some major air pollutants were not investigated, including ozone, carbon monoxide and sulfur dioxide, owing to insufficient available data in the research region and the complex relationships of these pollutants with climatic parameters and environmental health. Furthermore, the models employed here have certain advantages and limitations associated with their own characteristics and conditions, such as the assumption of linearity between the dependent and independent variables, multicollinearity tendencies, homoscedasticity requirements and data availability.
In addition, our analysis of the air pollution parameters is based on satellite data, validated with in situ data published by Chinese authorities. The results generally show good agreement with previous research in which only in situ data were used. Although limitations exist in comparison with the in situ data, including the accuracy and the sparsity of temporal measurements related to satellite overpass time, the current study nonetheless demonstrates the advantages of using remote sensing techniques in epidemiological studies, owing to its usefulness in acquiring near real-time information across large regions and, importantly, over regions where there are no in situ measurements on the ground.
Finally, it is seen that significant numbers of premature deaths and the welfare costs of premature deaths might be saved following the reductions in air pollution resulting from lockdown measures imposed to contain the COVID-19 pandemic in China. Otherwise, deaths and associated costs are projected to further increase in the future. Since the COVID-19 pandemic has affected every country worldwide, it has globally impacted many different economic sectors, including transportation, trade, tourism and hospitality, which have needed to radically adapt. Such effects of the pandemic, however, also offer authorities an opportunity to recognize how air pollution can be significantly reduced by applying social interventions to stimulate behavioural changes in travel and the movement patterns of large populations within people’s daily lives.

5. Conclusions

This study examined air pollution levels across China during the initial outbreak of the COVID-19 pandemic in early 2020. The beneficial effects of improved air quality on the number of premature deaths and welfare costs were evaluated accordingly. The features of NO2 and PM2.5 were found to vary between the study regions before lockdown, during Chinese New Year (CNY), and through the course of the following lockdown. Over CNY and the subsequent lockdown period, the tropospheric NO2 dropped to the lowest levels in all the regions. The effect was particularly notable for Hubei, which had the lowest daily average value, followed by Shanghai, Henan, Xi’an, Shandong, Hebei and Beijing, at 0.11, 0.13, 0.14, 0.15, 0.18, 0.21 and 0.30 DU, respectively. In contrast, the increased use of firecrackers was noticeable during CNY, with increasing PM2.5 concentrations from 27.0 to 45.3 μg/m3, 43.5 to 54.3 μg/m3, 44.7 to 62.3 μg/m3 and 43.9 to 47.9 μg/m3, for Beijing, Hebei, Shandong and Henan, respectively, compared with the period before lockdown. However, during the lockdown period, the mean PM2.5 concentrations dropped to their lowest levels, ranging between 33.7 and 41.8 μg/m3 for most of the regions, except for Beijing.
Although differences are observed among the seven study regions across China, the results demonstrate that the introduction of lockdown measures by authorities to restrict human mobility and control the spread of COVID-19 led to significantly decreased air pollution, as anticipated from similar findings globally. During the 2020 lockdown period, the average concentrations of PM2.5 and NO2 declined by 5.5–30.7% and 45.5–66.5%, respectively, across the Beijing, Hebei, Shandong, Henan, Xi’an, Shanghai and Hubei regions, as compared with the equivalent timeframe in 2019. Accordingly, by modelling and contrasting scenarios with and without the pandemic, it can be determined that the improved air quality had consequent benefits in 2020, saving 97,393 people from premature deaths and USD 74.32 billion (PPP) in associated welfare costs. This study highlights that the lockdown measures imposed in 2020 significantly improved air quality, potentially substantial benefiting environmental health across China in the future.

Author Contributions

Conceptualization, Y.-A.L., T.-H.V. and K.-A.N.; Methodology, Y.-A.L., T.-H.V. and K.-A.N.; Software, T.-H.V.; Validation, T.-H.V.; Formal analysis, Y.-A.L., T.-H.V. and J.P.T.; Investigation, Y.-A.L., T.-H.V. and K.-A.N.; Resources, Y.-A.L.; Writing—original draft, Y.-A.L., T.-H.V. and K.-A.N.; Writing—review & editing, Y.-A.L. and J.P.T.; Visualization, Y.-A.L.; Supervision, Y.-A.L.; Project administration, Y.-A.L.; Funding acquisition, Y.-A.L. All authors have read and agreed to the published version of the manuscript.

Funding

This work was supported by the Ministry of Science and Technology under Grant MOST 108-2111-M-008-036-MY2, 110-2111-M-008-008 and 110-2634-F-008-008. J.P. Terry acknowledges the receipt of research support from Zayed University.

Data Availability Statement

All the data used in the manuscript are available from the corresponding official website. Below are the links for the selected data sources: https://lpdaac.usgs.gov/products/mcd19a2v006, http://english.mee.gov.cn, https://aqicn.org, http://www.stateair.net, https://data.cma.cn, https://stats.oecd.org.

Acknowledgments

The suggestions of the editor and anonymous reviewers were helpful to the authors for significantly improving the original manuscript.

Conflicts of Interest

The authors declare no competing interest.

Appendix A

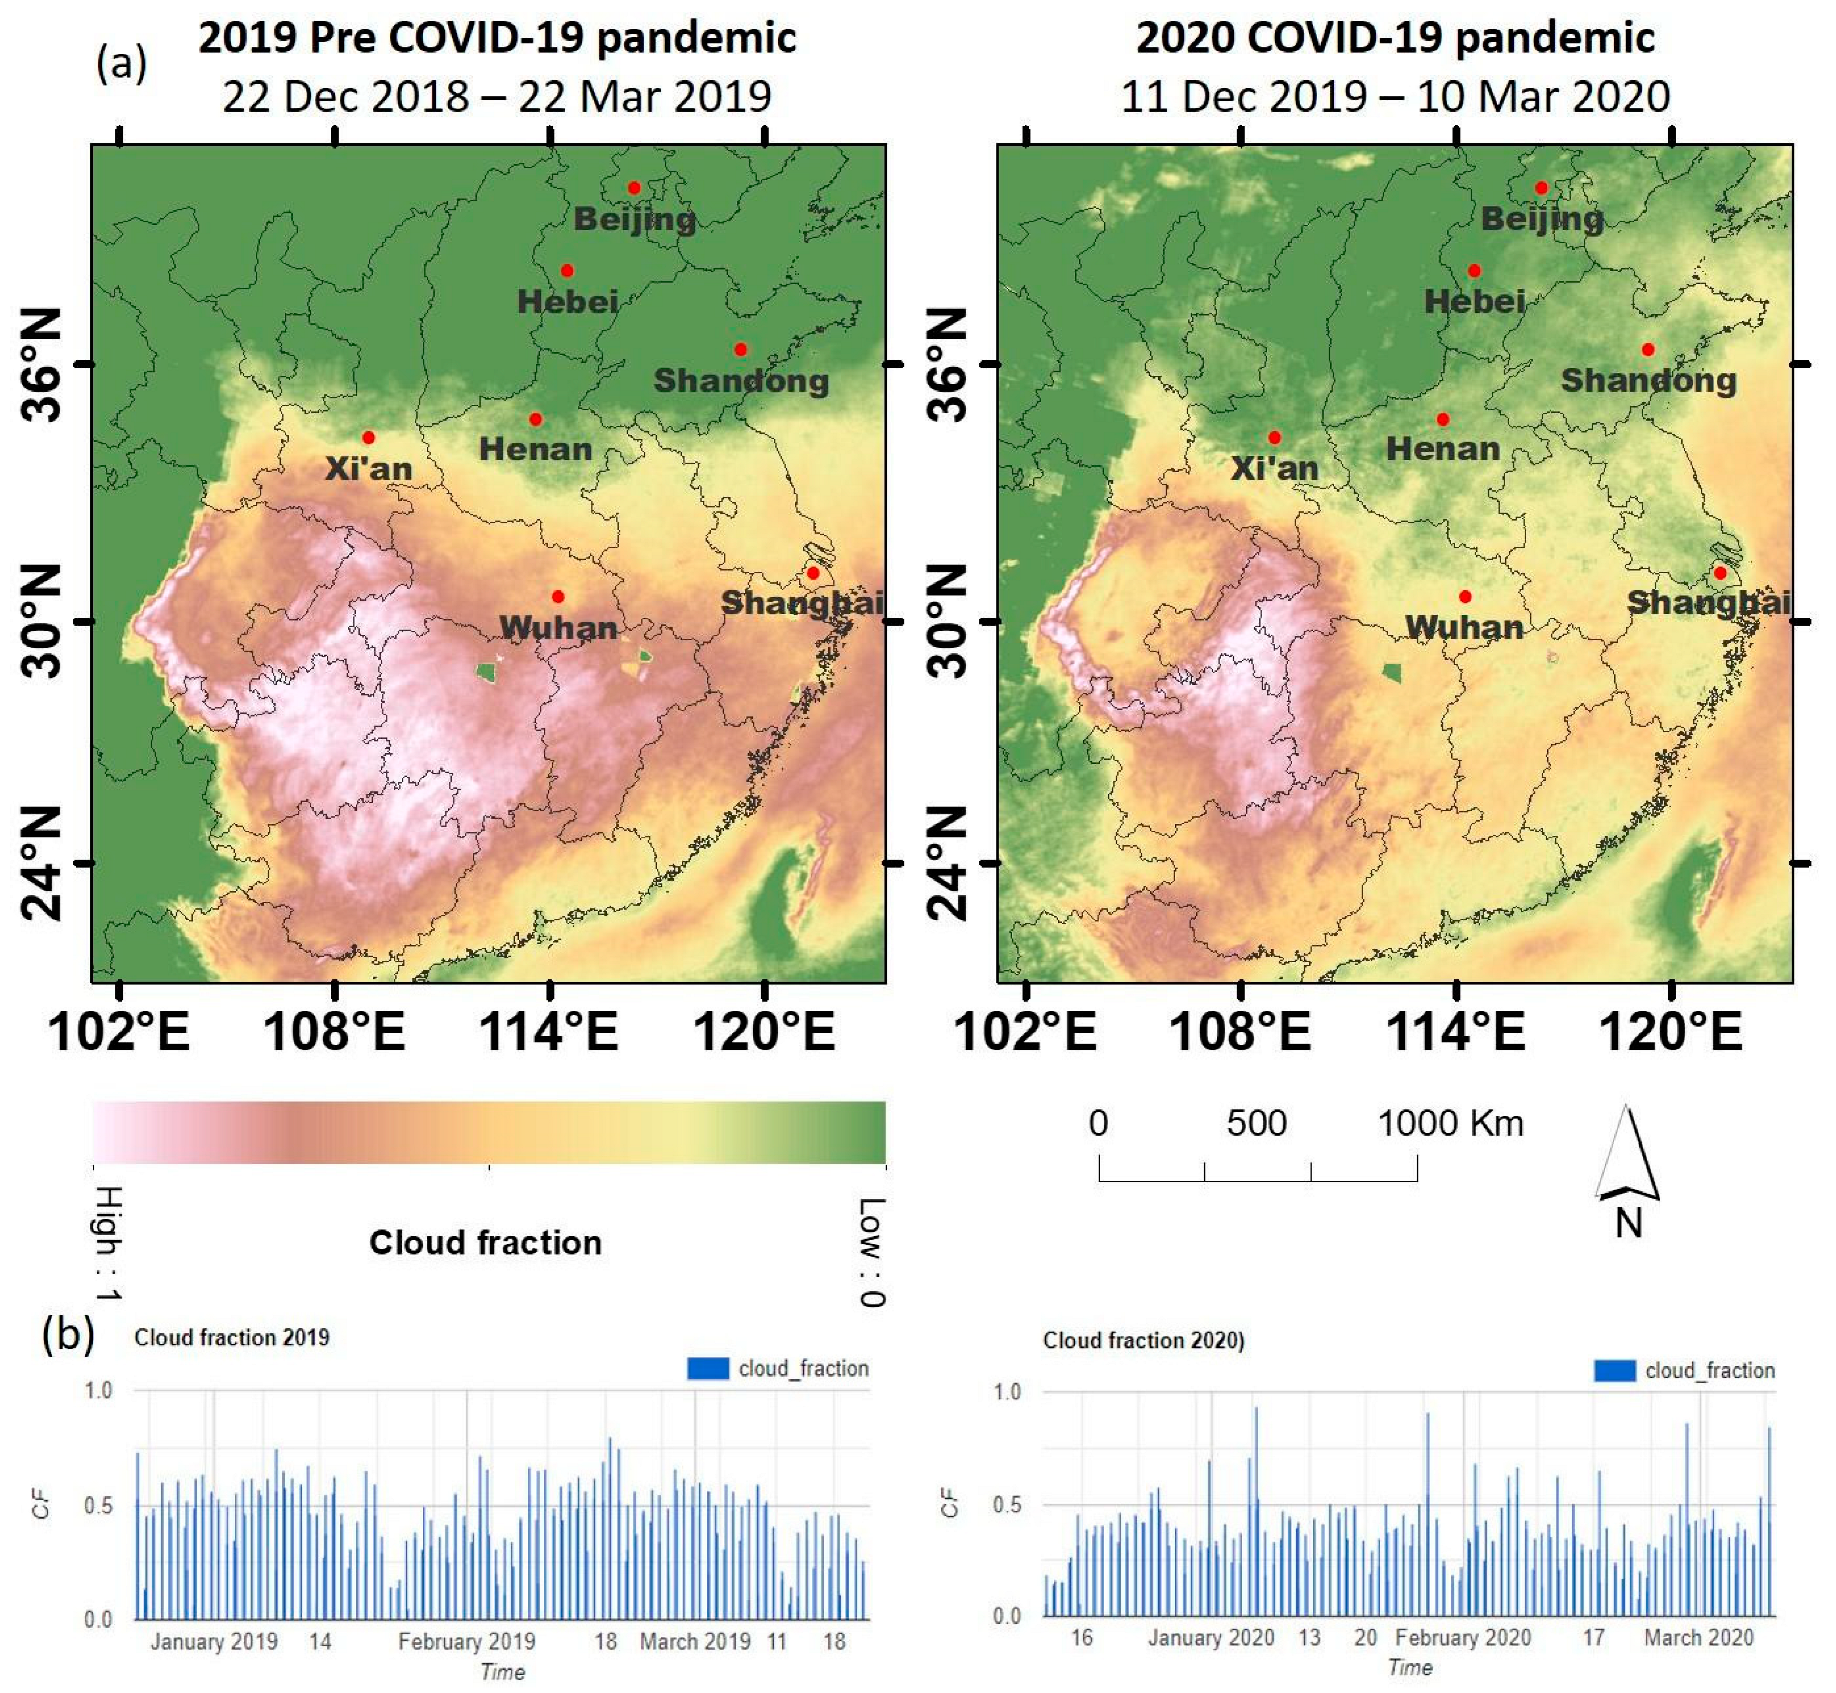
Appendix A.1. Cloud Fraction

Figure A1. The differences in cloud cover between 2019 and 2020. (a) The mean cloud fraction for each period. (b) Daily cloud fraction variation.
Remotesensing 15 00530 g0a1

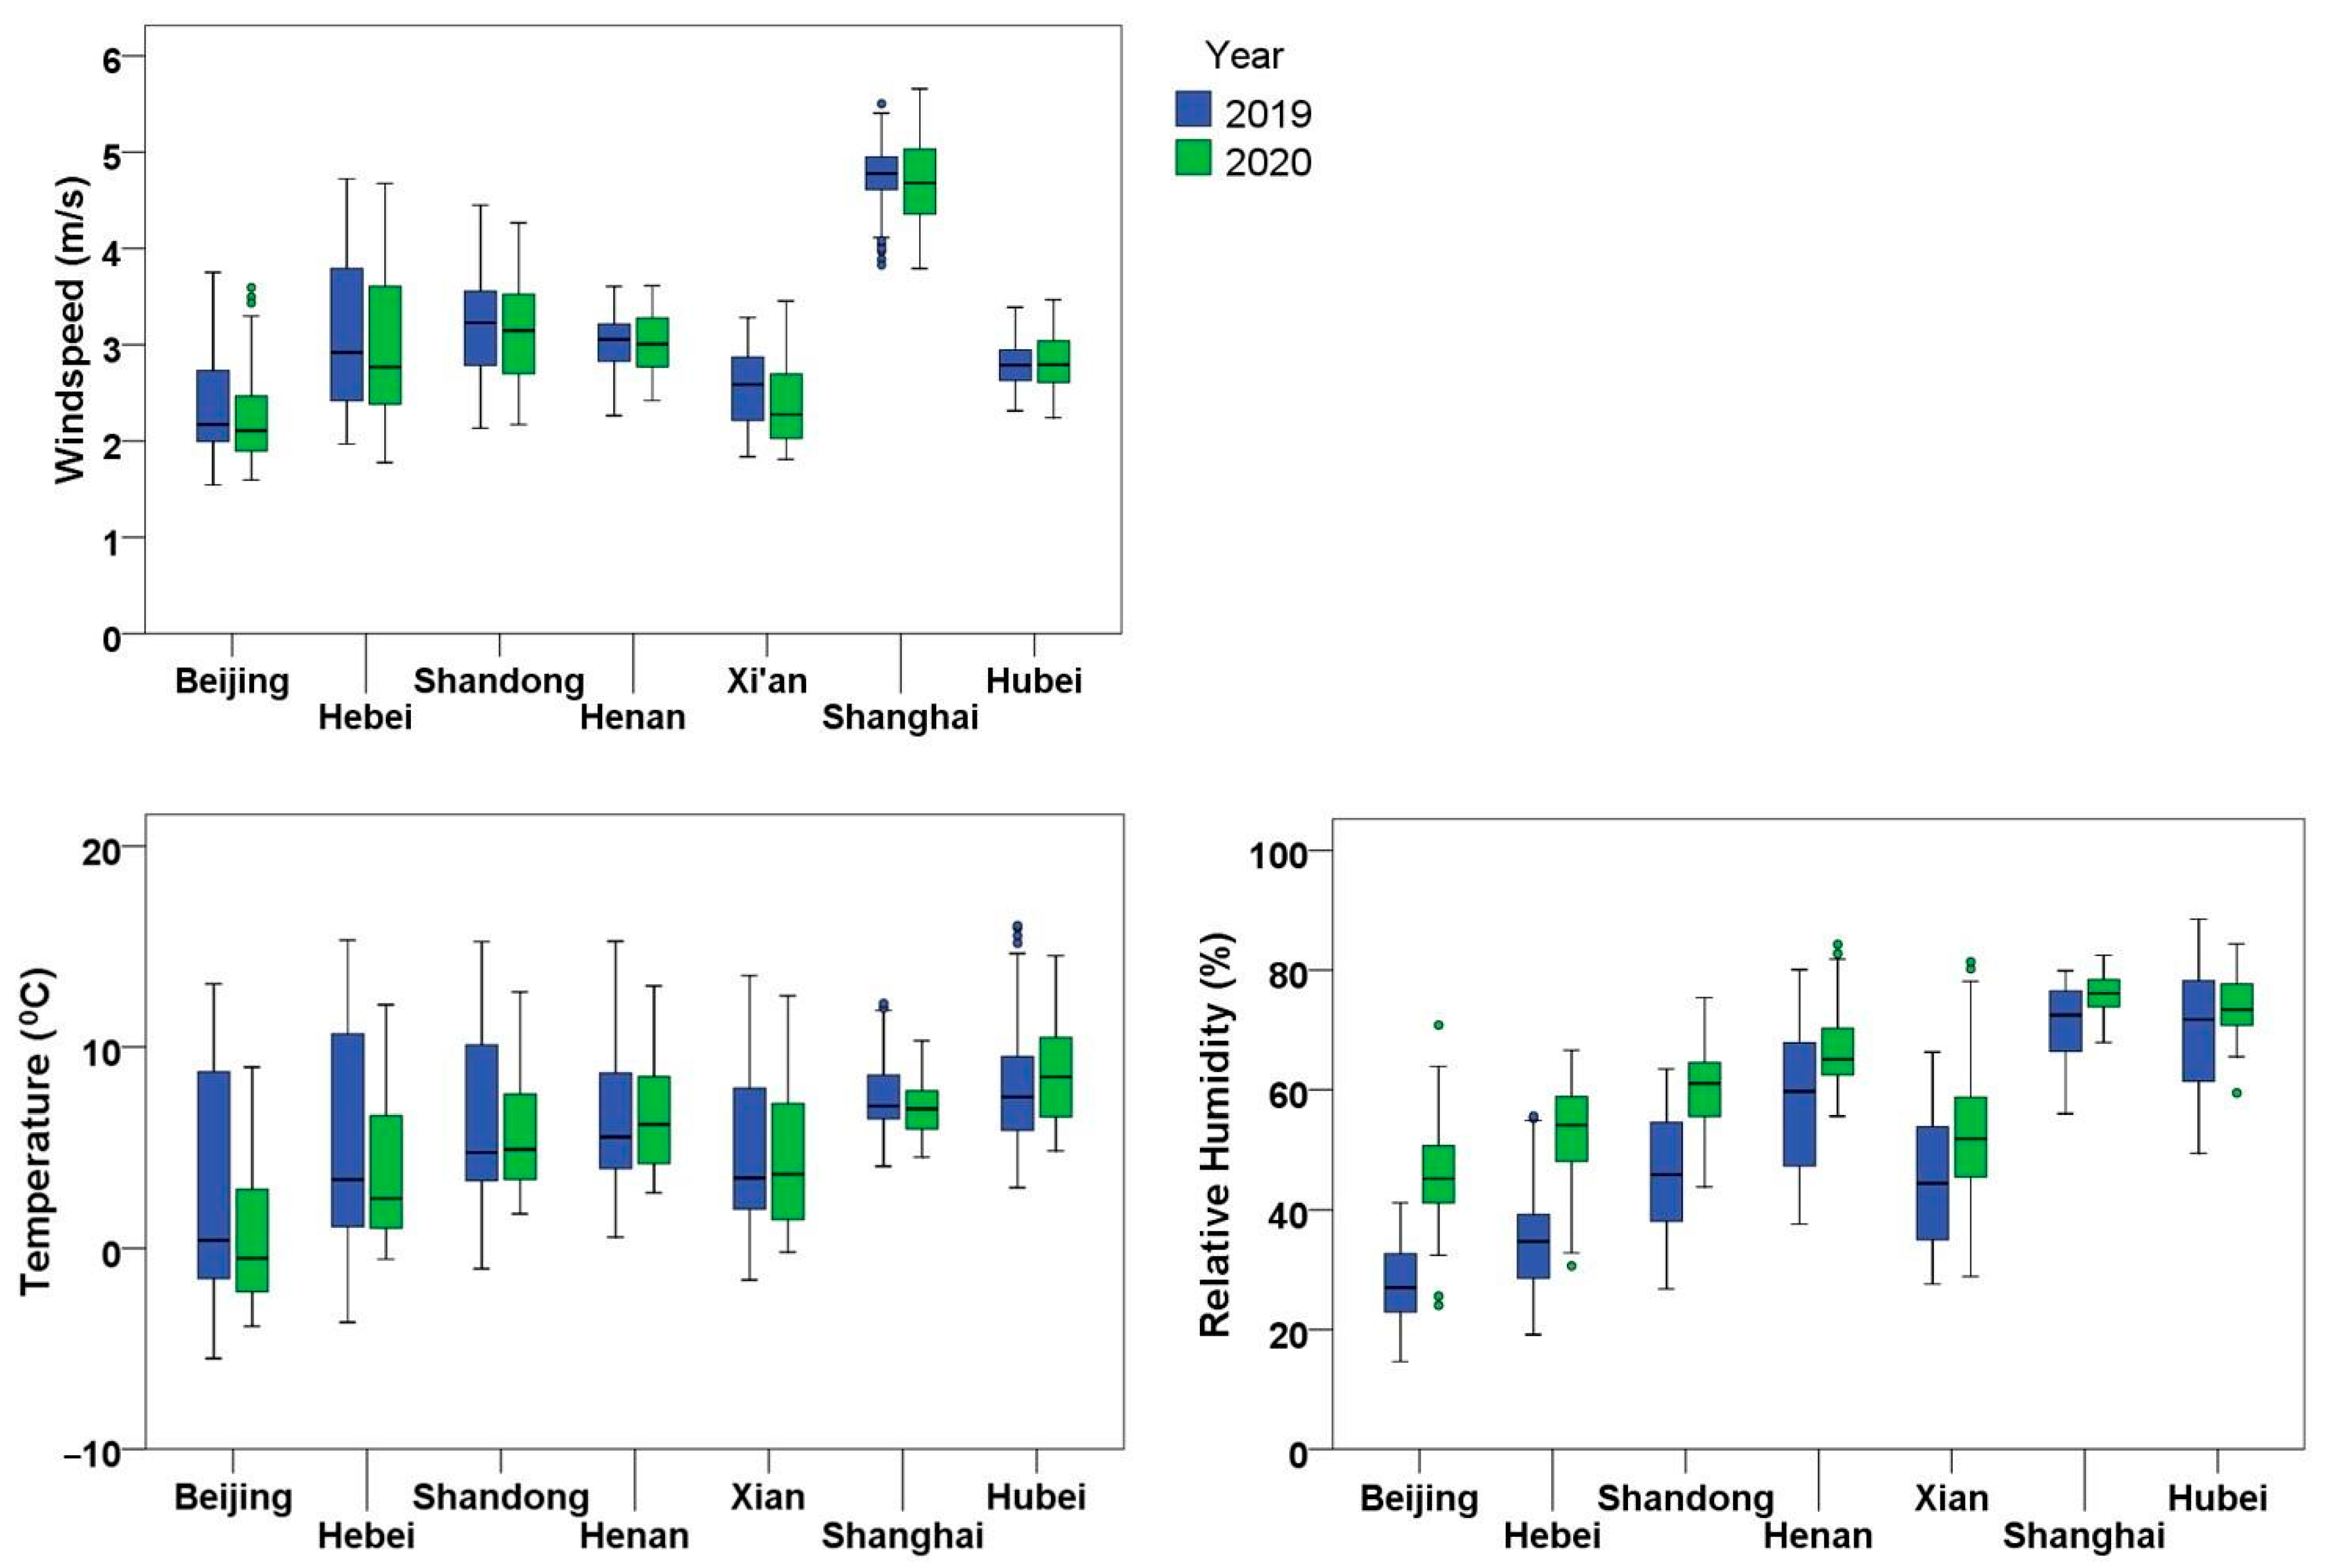
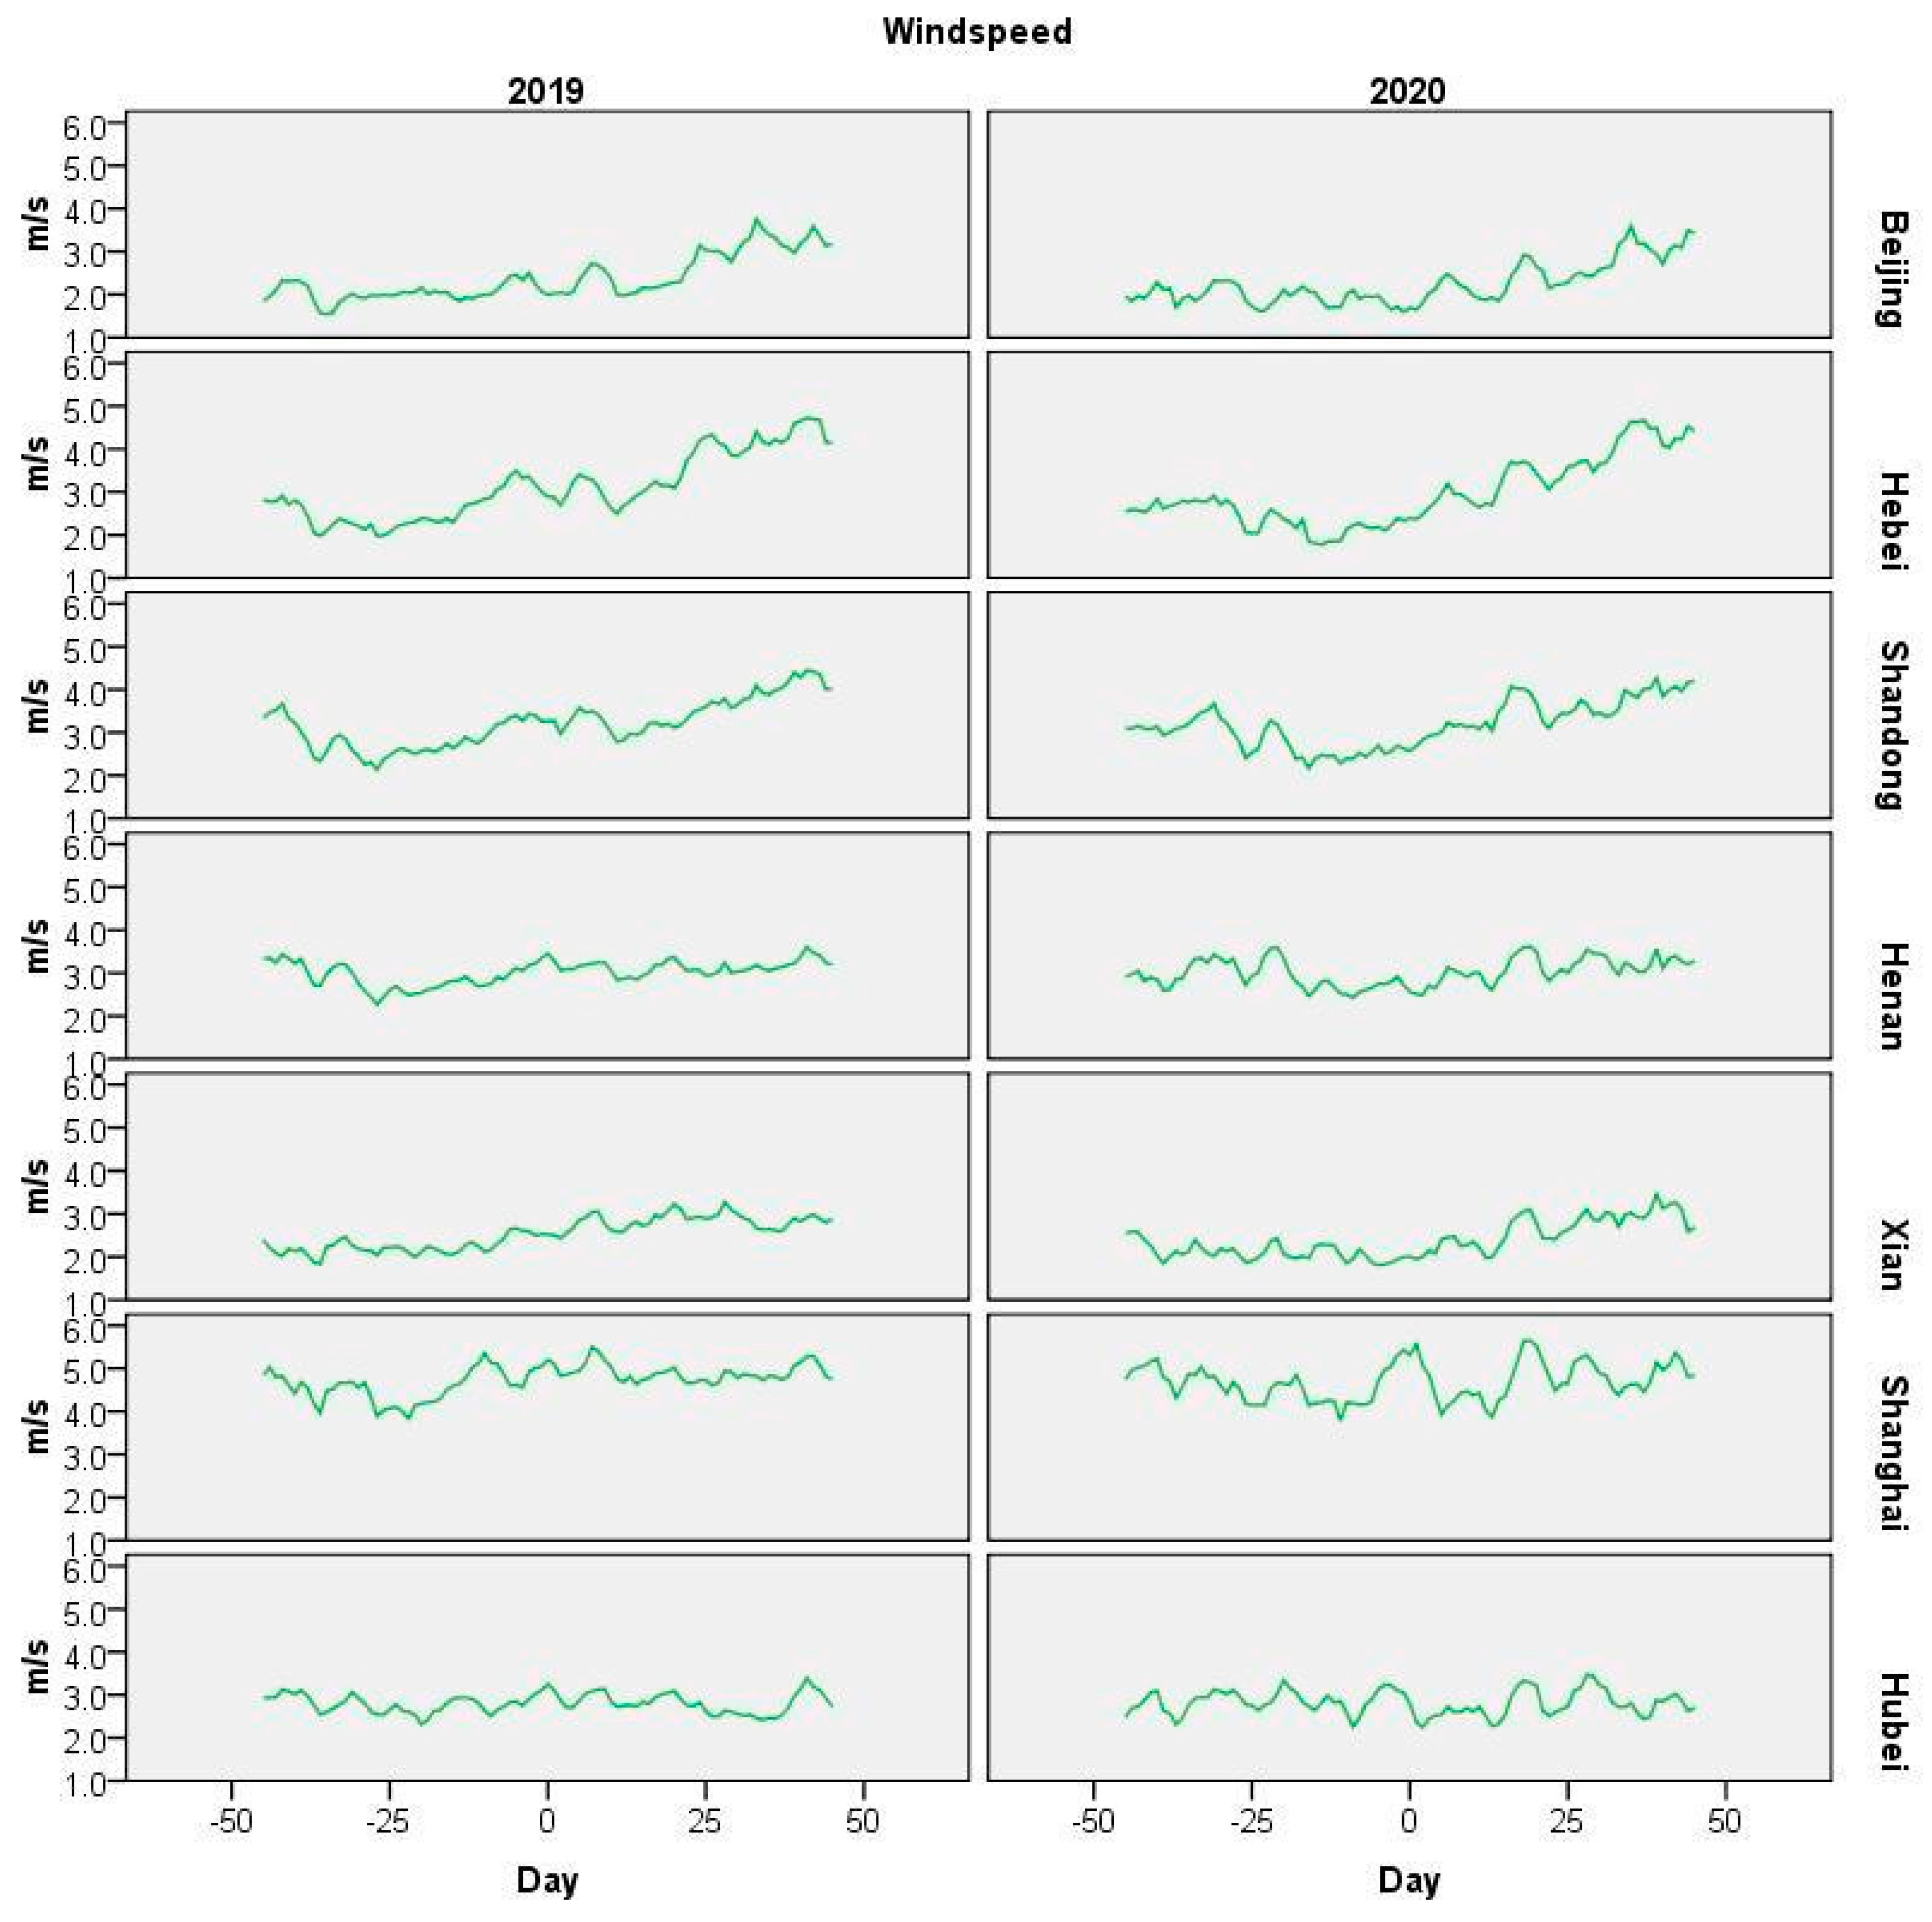
Appendix A.2. Meteorological Conditions Data

Figure A2. Daily time series of wind speed during equivalent 91-day timeframes of investigation for 2019 and 2020, across seven regions of China.
Remotesensing 15 00530 g0a2
Figure A3. Daily time series of air temperature during equivalent 91-day timeframes of investigation for 2019 and 2020, across seven regions of China.
Remotesensing 15 00530 g0a3
Figure A4. Daily time series of relative humidity during equivalent 91-day timeframes of investigation for 2019 and 2020, across seven regions of China.
Remotesensing 15 00530 g0a4

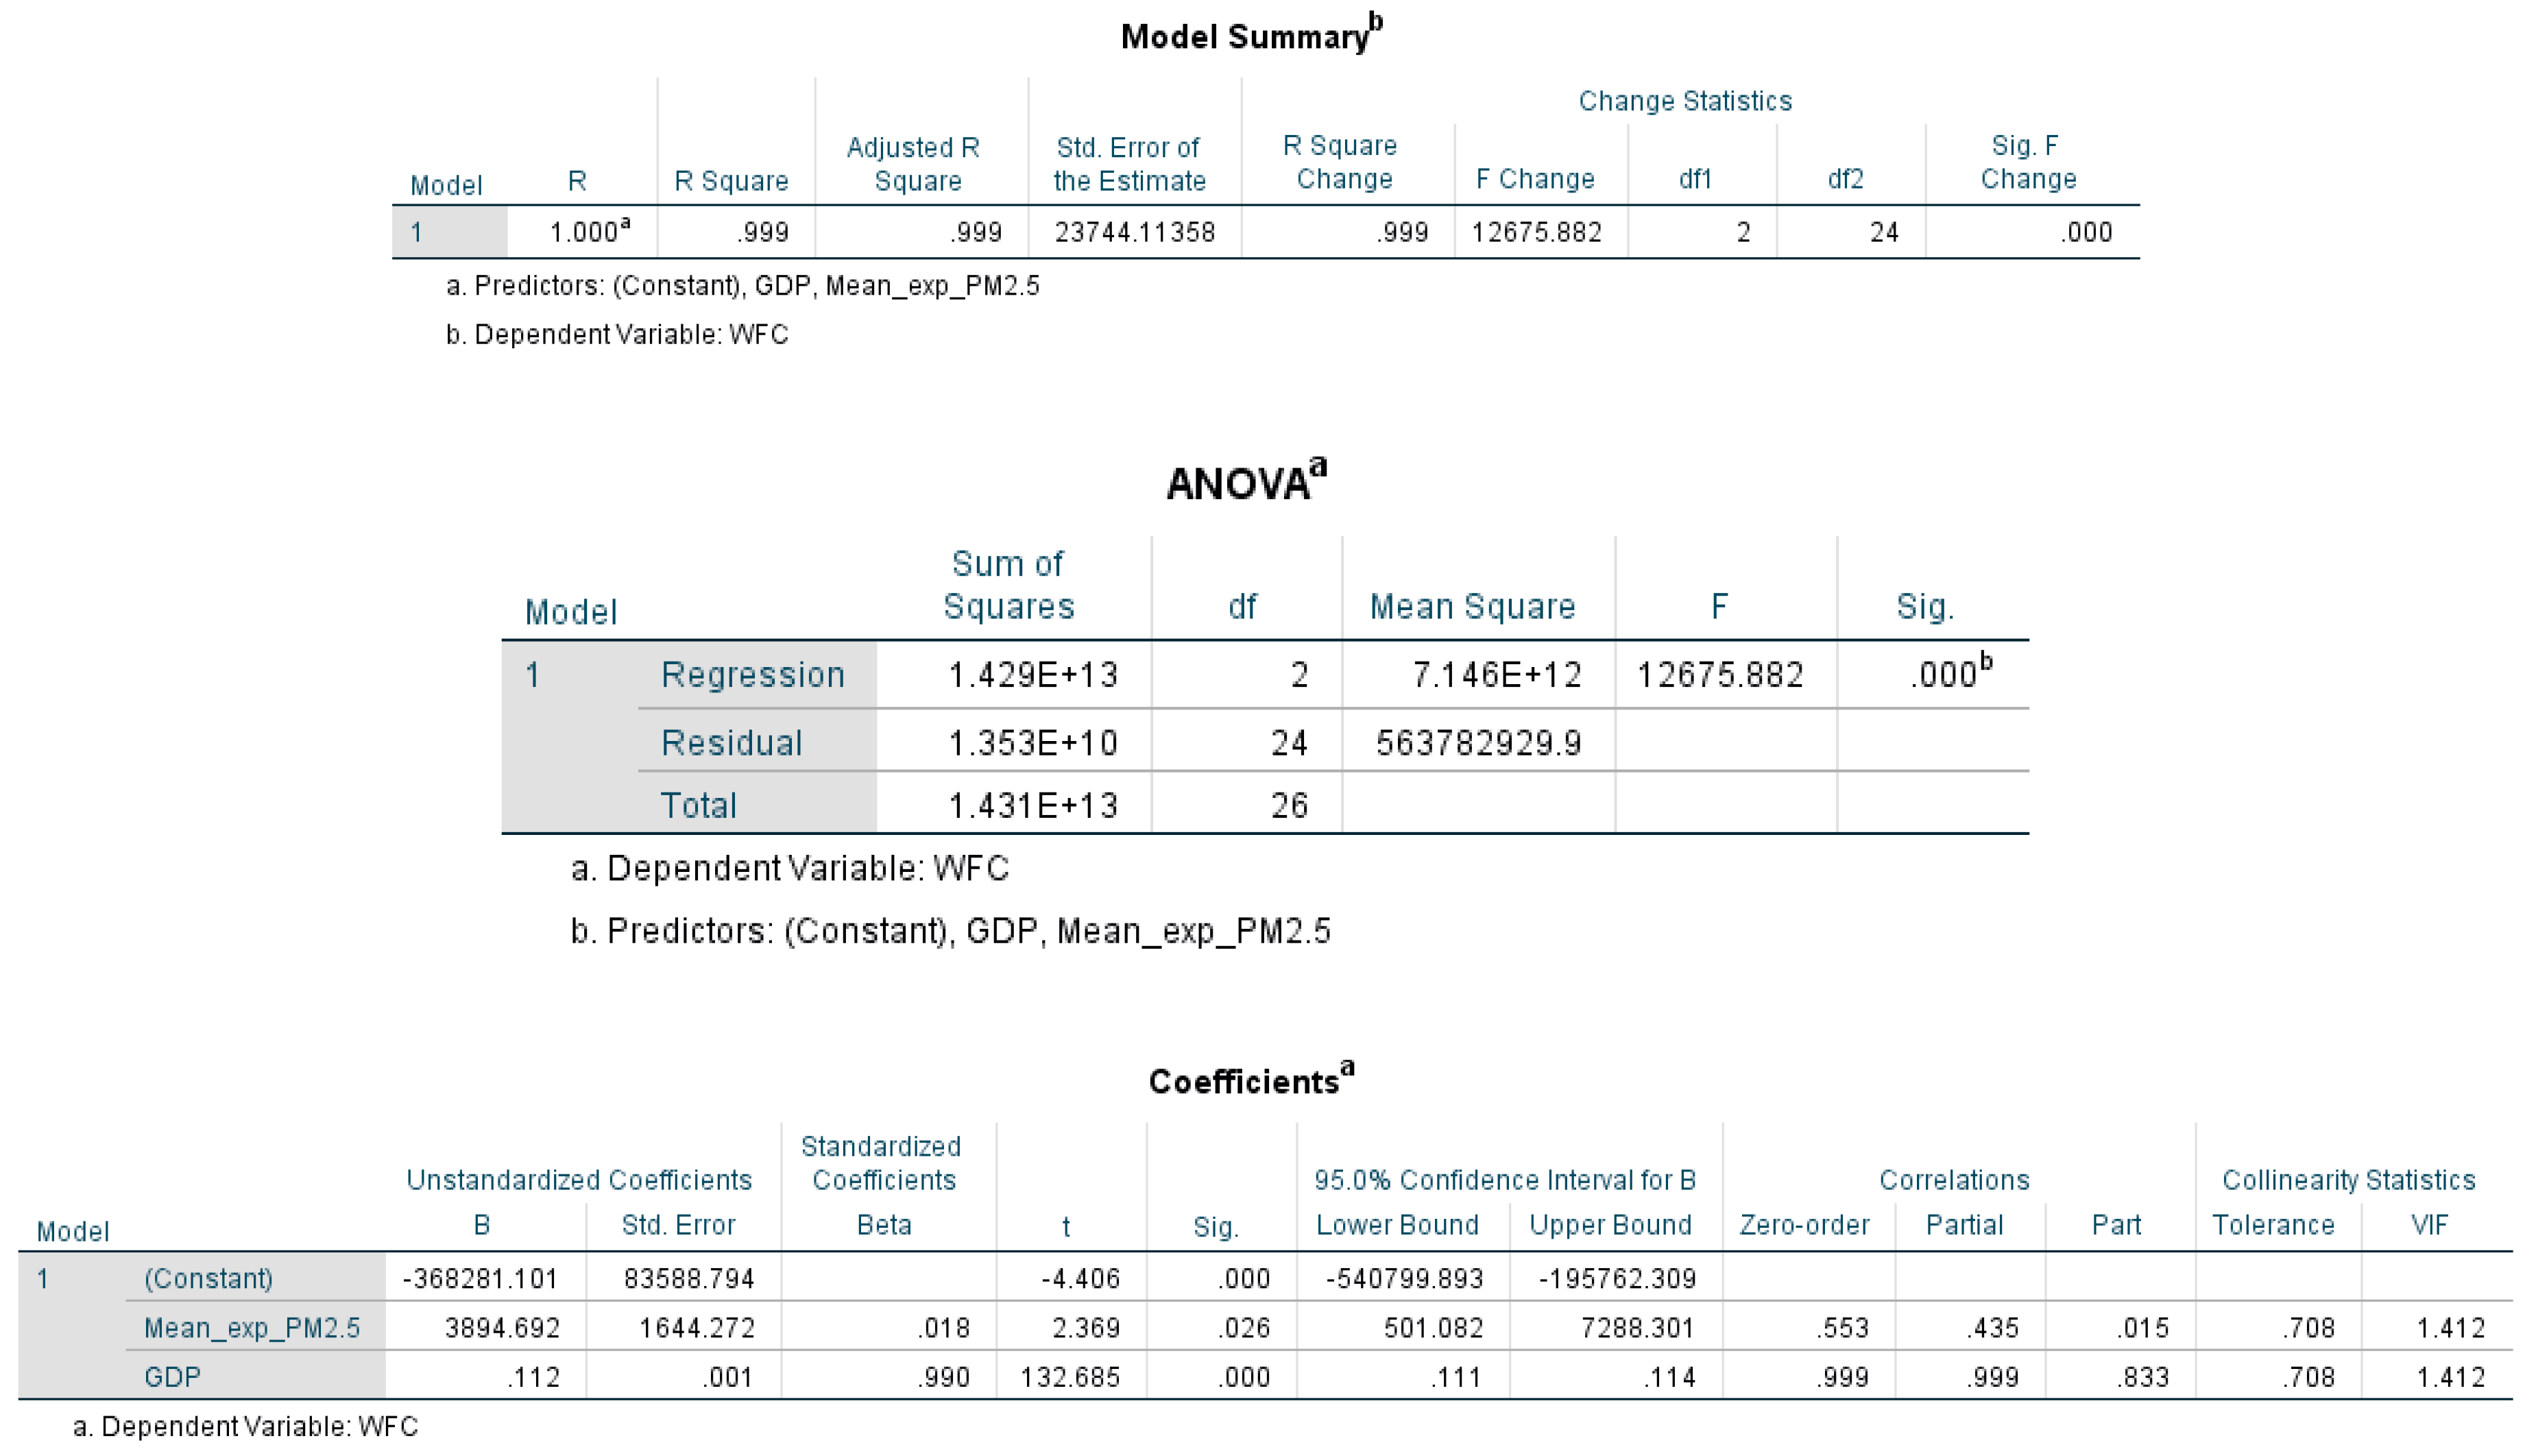
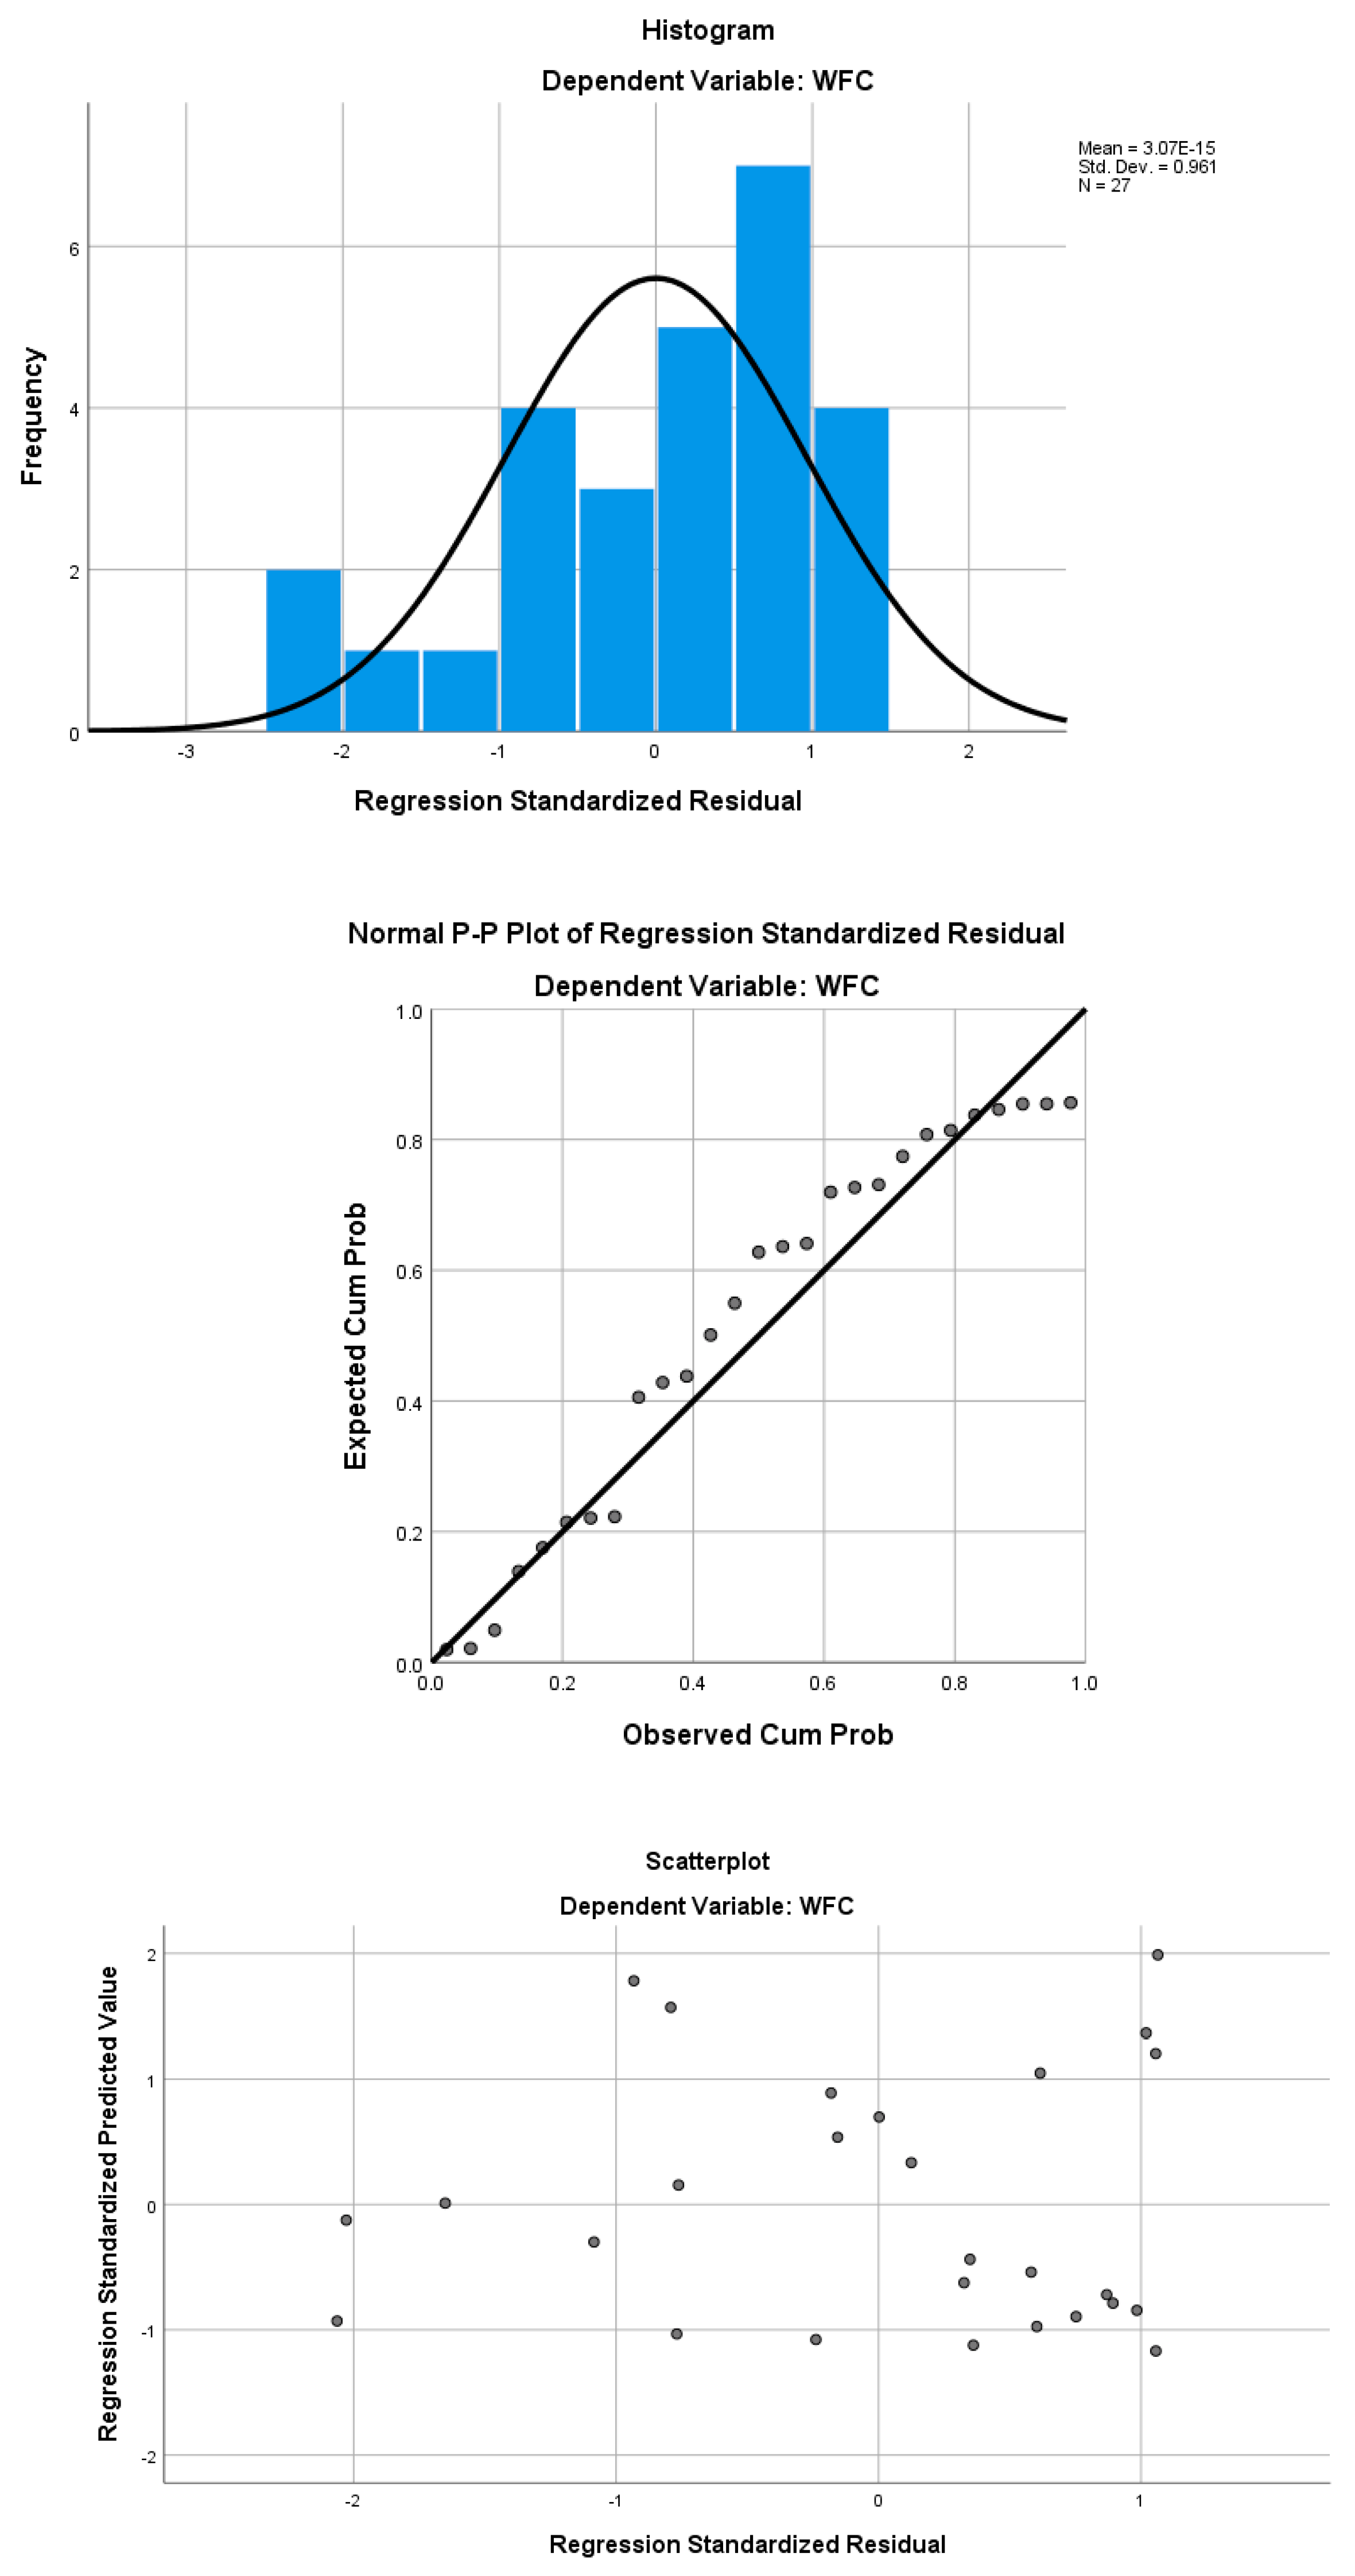
Appendix A.3. Projection Models

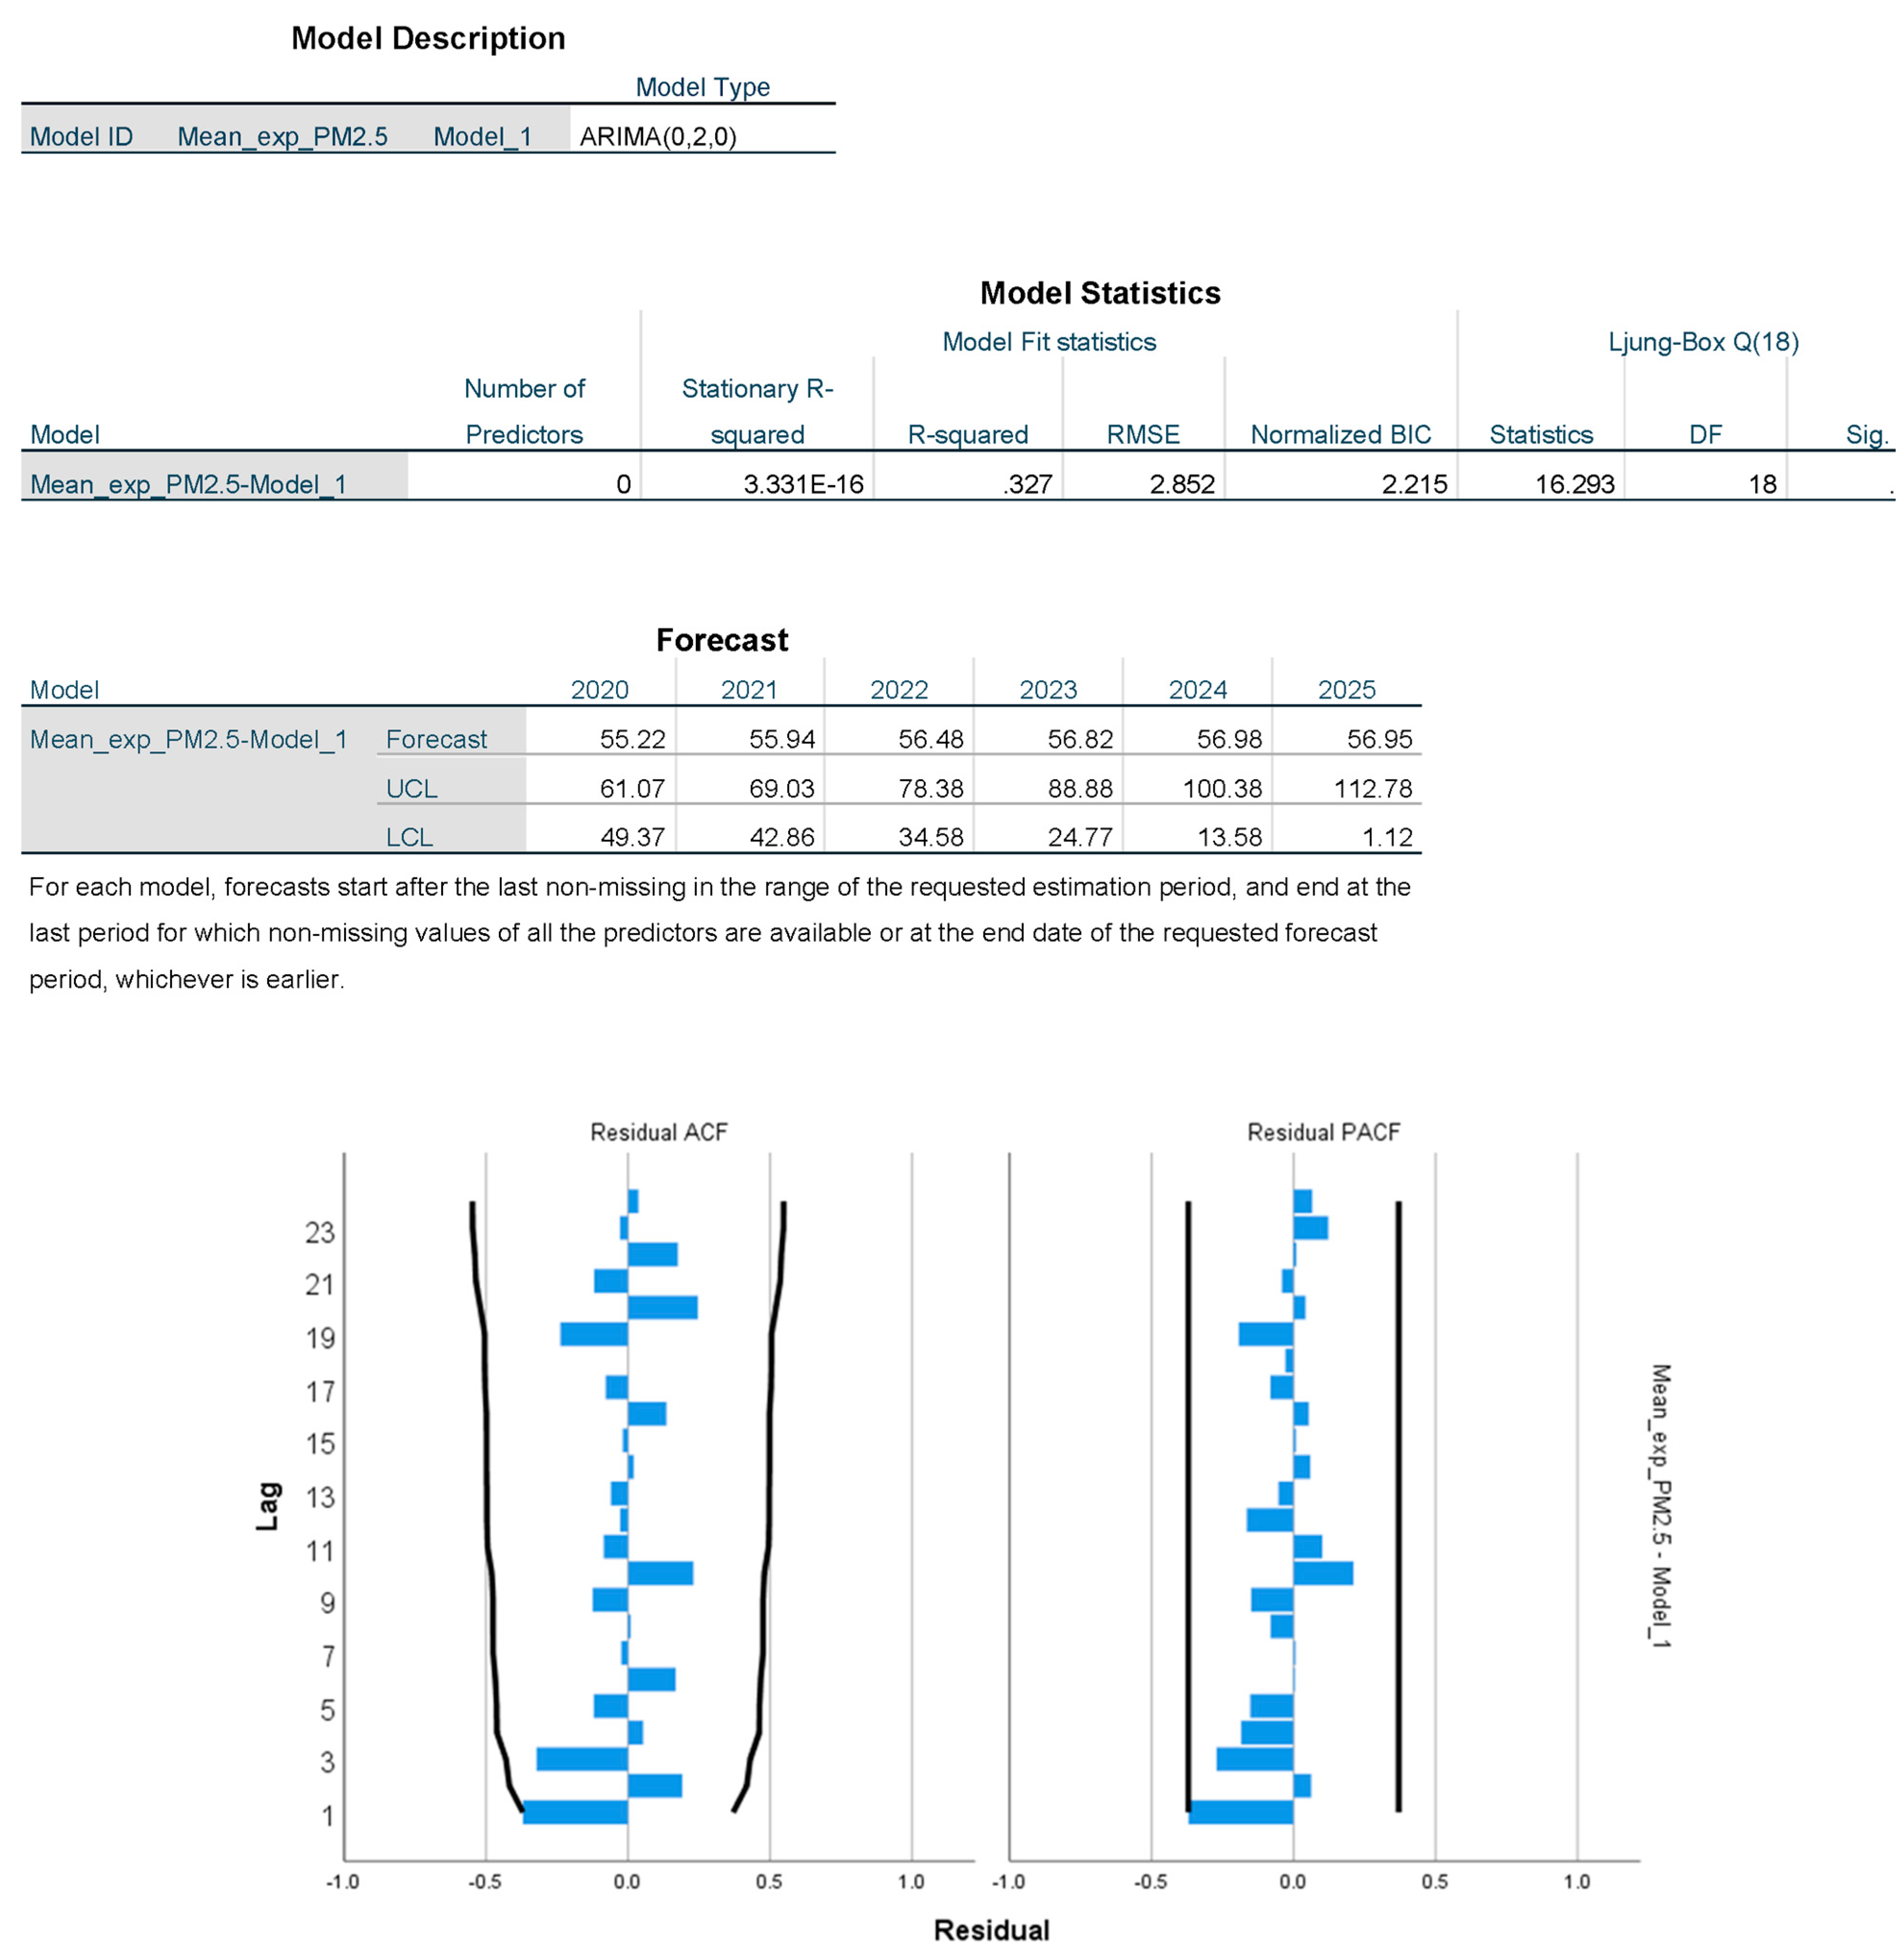
Appendix A.3.1. ARIMA Models

Figure A5. Model (1): forecast in premature deaths.
Remotesensing 15 00530 g0a5
Figure A6. Model (2) forecast in welfare costs.
Remotesensing 15 00530 g0a6
Figure A7. Model (3) Forecast in mean population exposure to PM2.5.
Remotesensing 15 00530 g0a7
Figure A8. Model (4) Forecast in population.
Remotesensing 15 00530 g0a8
Figure A9. Model (5) Forecast in GDP.
Remotesensing 15 00530 g0a9

Appendix A.3.2. Models 1 and 2

Figure A10. Model 1: Concentration-response (C-R) relationship between hazard ratio and PM2.5 concentration. The red shaded area represents the standard deviation.
Remotesensing 15 00530 g0a10
Figure A11. Model 2: WFC projection by GDP and ExpoPM2.5.
Remotesensing 15 00530 g0a11aRemotesensing 15 00530 g0a11b

References

  1. WHO. Ambient Air Pollution: A global Assessment of Exposure and Burden of Disease; World Health Organization: Geneva, Switzerland, 2016.
  2. Lelieveld, J.; Pozzer, A.; Pöschl, U.; Fnais, M.; Haines, A.; Münzel, T. Loss of life expectancy from air pollution compared to other risk factors: A worldwide perspective. Cardiovasc. Res. 2020, 116, 1910–1917. [Google Scholar] [CrossRef]
  3. Nguyen, K.A.; Liou, Y.A. Global mapping of eco-environmental vulnerability from human and nature disturbances. Sci. Total Environ. 2019, 664, 995–1004. [Google Scholar] [CrossRef]
  4. Nguyen, K.A.; Liou, Y.A. Mapping global eco-environment vulnerability due to human and nature disturbances. MethodsX 2019, 6, 862–875. [Google Scholar] [CrossRef]
  5. Terry, J.P.; Jia, G.; Boldi, R.; Khan, S. The Delhi ‘gas chamber’: Smog, air pollution and the health emergency of November 2017. Weather 2018, 73, 348–352. [Google Scholar] [CrossRef]
  6. Yang, G.; Wang, Y.; Zeng, Y.; Gao, G.F.; Liang, X.; Zhou, M.; Wan, X.; Yu, S.; Jiang, Y.; Naghavi, M.; et al. Rapid health transition in China, 1990–2010: Findings from the Global Burden of Disease Study 2010. Lancet 2013, 381, 1987–2015. [Google Scholar] [CrossRef]
  7. WHO. Ambient (Outdoor) Air Pollution; World Health Organization: Geneva, Switzerland, 2020.
  8. van der A, R.; Eskes, H.J.; Boersma, K.F.; van Noije, T.P.C.; Van Roozendael, M.; De Smedt, I.; Peters, D.H.M.U.; Meijer, E.W. Trends, seasonal variability and dominant NOx source derived from a ten year record of NO2 measured from space. J. Geophys. Res. 2008, 113, 13. [Google Scholar] [CrossRef]
  9. Liu, X.; Mizzi, A.P.; Anderson, J.L.; Fung, I.Y.; Cohen, R.C. Assimilation of satellite NO2 observations at high spatial resolution using OSSEs. Atmos. Chem. Phys. 2017, 17, 7067–7081. [Google Scholar] [CrossRef] [Green Version]
  10. WHO. WHO Air Quality Guidelines for Particulate Matter, Ozone, Nitrogen Dioxide and Sulfur Dioxide; World Health Organization: Geneva, Switzerland, 2006.
  11. European Commission. Global Emissions EDGAR v4.2. Available online: https://edgar.jrc.ec.europa.eu/overview.php?v=42 (accessed on 10 March 2021).
  12. Zhang, X.; Yin, Y.; van der A, R.; Eskes, H.; van Geffen, J.; Li, Y.; Kuang, X.; Lapierre, J.L.; Chen, K.; Zhen, Z.; et al. Influence of convection on the upper-tropospheric O3 and NOx budget in southeastern China. Atmos. Chem. Phys. 2022, 22, 5925–5942. [Google Scholar] [CrossRef]
  13. Bechle, M.J.; Millet, D.B.; Marshall, J.D. Remote sensing of exposure to NO2: Satellite versus ground-based measurement in a large urban area. Atmos. Environ. 2013, 69, 345–353. [Google Scholar] [CrossRef]
  14. Li, R.; Bo, H.; Wang, Y. Slowing-down reduction and Possible Reversal Trend of Tropospheric NO2 over China during 2016 to 2019. arXiv 2019, arXiv:1907.06525. [Google Scholar]
  15. Celarier, E.A.; Brinksma, E.J.; Gleason, J.F.; Veefkind, J.P.; Cede, A.; Herman, J.R.; Ionov, D.; Goutail, F.; Pommereau, J.P.; Lambert, J.C.; et al. Validation of Ozone Monitoring Instrument nitrogen dioxide columns. J. Geophys. Res. Atmos. 2008, 113, 23. [Google Scholar] [CrossRef]
  16. Ialongo, I.; Virta, H.; Eskes, H.; Hovila, J.; Douros, J. Comparison of TROPOMI/Sentinel-5 Precursor NO2 observations with ground-based measurements in Helsinki. Atmos. Meas. Tech. 2020, 13, 205–218. [Google Scholar] [CrossRef] [Green Version]
  17. Goldberg, D.L.; Gupta, P.; Wang, K.; Jena, C.; Zhang, Y.; Lu, Z.; Streets, D.G. Using gap-filled MAIAC AOD and WRF-Chem to estimate daily PM2.5 concentrations at 1 km resolution in the Eastern United States. Atmos. Environ. 2019, 199, 443–452. [Google Scholar] [CrossRef]
  18. Lin, C.; Li, Y.; Yuan, Z.; Lau, A.K.H.; Li, C.; Fung, J.C.H. Using satellite remote sensing data to estimate the high-resolution distribution of ground-level PM2.5. Remote Sens. Environ. 2015, 156, 117–128. [Google Scholar] [CrossRef]
  19. Jung, C.R.; Hwang, B.F.; Chen, W.T. Incorporating long-term satellite-based aerosol optical depth, localized land use data, and meteorological variables to estimate ground-level PM2.5 concentrations in Taiwan from 2005 to 2015. Environ. Pollut. 2018, 237, 1000–1010. [Google Scholar] [CrossRef]
  20. Hsu, C.-Y.; Wu, C.-D.; Hsiao, Y.-P.; Chen, Y.-C.; Chen, M.-J.; Lung, S.-C. Developing Land-Use Regression Models to Estimate PM2.5-Bound Compound Concentrations. Remote Sens. 2018, 10, 1971. [Google Scholar] [CrossRef] [Green Version]
  21. Li, Y.; Xue, Y.; Guang, J.; She, L.; Fan, C.; Chen, G. Ground-Level PM2.5 Concentration Estimation from Satellite Data in the Beijing Area Using a Specific Particle Swarm Extinction Mass Conversion Algorithm. Remote Sens. 2018, 10, 1906. [Google Scholar] [CrossRef] [Green Version]
  22. WHO. Coronavirus Disease (COVID-2019) Situation Reports; World Health Organization: Geneva, Switzerland, 2021.
  23. Thomas, J.; Terry, J.P. Containing COVID-19 risk in the UAE: Mass quarantine, mental health, and implications for crisis management. Risk Hazards Crisis Public Policy 2022, 13, 9–27. [Google Scholar] [CrossRef]
  24. Hui, D.S.; Azhar, E.I.; Madani, T.A.; Ntoumi, F.; Kock, R.; Dar, O.; Ippolito, G.; McHugh, T.D.; Memish, Z.A.; Drosten, C.; et al. The continuing 2019-nCoV epidemic threat of novel coronaviruses to global health—The latest 2019 novel coronavirus outbreak in Wuhan, China. Int. J. Infect. Dis. 2020, 91, 264–266. [Google Scholar] [CrossRef] [Green Version]
  25. Lai, C.C.; Shih, T.P.; Ko, W.C.; Tang, H.J.; Hsueh, P.R. Severe acute respiratory syndrome coronavirus 2 (SARS-CoV-2) and coronavirus disease-2019 (COVID-19): The epidemic and the challenges. Int. J. Antimicrob. Agents 2020, 55, 105924. [Google Scholar] [CrossRef]
  26. Peters, A.; Vetter, P.; Guitart, C.; Lotfinejad, N.; Pittet, D. Understanding the emerging coronavirus: What it means for health security and infection prevention. J. Hosp. Infect. 2020, 104, 440–448. [Google Scholar] [CrossRef]
  27. Hanke, M.; Kosolapova, M.; Weissensteiner, A. COVID-19 and market expectations: Evidence from option-implied densities. Econ. Lett. 2020, 195, 109441. [Google Scholar] [CrossRef]
  28. Heyden, K.J.; Heyden, T. Market reactions to the arrival and containment of COVID-19: An event study. Financ. Res. Lett. 2021, 38, 101745. [Google Scholar] [CrossRef] [PubMed]
  29. So, M.K.P.; Chu, A.M.Y.; Chan, T.W.C. Impacts of the COVID-19 pandemic on financial market connectedness. Financ. Res. Lett. 2021, 38, 101864. [Google Scholar] [CrossRef]
  30. Chen, K.; Wang, M.; Huang, C.; Kinney, P.L.; Anastas, P.T. Air pollution reduction and mortality benefit during the COVID-19 outbreak in China. Lancet Planet. Health 2020, 4, e210–e212. [Google Scholar] [CrossRef] [PubMed]
  31. Fan, C.; Li, Y.; Guang, J.; Li, Z.; Elnashar, A.; Allam, M.; de Leeuw, G. The Impact of the Control Measures during the COVID-19 Outbreak on Air Pollution in China. Remote Sens. 2020, 12, 1613. [Google Scholar] [CrossRef]
  32. Lian, X.; Huang, J.; Huang, R.; Liu, C.; Wang, L.; Zhang, T. Impact of city lockdown on the air quality of COVID-19-hit of Wuhan city. Sci. Total Environ. 2020, 742, 140556. [Google Scholar] [CrossRef] [PubMed]
  33. Marlier, M.E.; Xing, J.; Zhu, Y.; Wang, S. Impacts of COVID-19 response actions on air quality in China. Environ. Res. Commun. 2020, 2, 075003. [Google Scholar] [CrossRef]
  34. Shi, X.; Brasseur, G.P. The Response in Air Quality to the Reduction of Chinese Economic Activities during the COVID-19 Outbreak. Geophys Res Lett 2020, 47, e2020GL088070. [Google Scholar] [CrossRef]
  35. Wang, P.; Chen, K.; Zhu, S.; Wang, P.; Zhang, H. Severe air pollution events not avoided by reduced anthropogenic activities during COVID-19 outbreak. Resour. Conserv. Recycl. 2020, 158, 104814. [Google Scholar] [CrossRef]
  36. Zhao, X.; Wang, G.; Wang, S.; Zhao, N.; Zhang, M.; Yue, W. Impacts of COVID-19 on air quality in mid-eastern China: An insight into meteorology and emissions. Atmos. Environ. 2021, 266, 118750. [Google Scholar] [CrossRef]
  37. Wu, Q.; Li, T.; Zhang, S.; Fu, J.; Seyler, B.C.; Zhou, Z.; Deng, X.; Wang, B.; Zhan, Y. Evaluation of NOx emissions before, during, and after the COVID-19 lockdowns in China: A comparison of meteorological normalization methods. Atmos. Environ. 2022, 278, 119083. [Google Scholar] [CrossRef] [PubMed]
  38. Cole, M.A.; Elliott, R.J.R.; Liu, B. The Impact of the Wuhan COVID-19 Lockdown on Air Pollution and Health: A Machine Learning and Augmented Synthetic Control Approach. Environ. Resour. Econ. 2020, 76, 553–580. [Google Scholar] [CrossRef]
  39. Nichol, J.E.; Bilal, M.; Ali, M.A.; Qiu, Z. Air Pollution Scenario over China during COVID-19. Remote Sens. 2020, 12, 2100. [Google Scholar] [CrossRef]
  40. Ghahremanloo, M.; Lops, Y.; Choi, Y.; Jung, J.; Mousavinezhad, S.; Hammond, D. A comprehensive study of the COVID-19 impact on PM2.5 levels over the contiguous United States: A deep learning approach. Atmos. Environ. 2022, 272, 118944. [Google Scholar] [CrossRef]
  41. Pal, S.; Das, P.; Mandal, I.; Sarda, R.; Mahato, S.; Nguyen, K.-A.; Liou, Y.-A.; Talukdar, S.; Debanshi, S.; Saha, T.K. Effects of lockdown due to COVID-19 outbreak on air quality and anthropogenic heat in an industrial belt of India. J. Clean. Prod. 2021, 297, 126674. [Google Scholar] [CrossRef]
  42. OECD. Statistic Dataset; OECD: Paris, France, 2019. [Google Scholar]
  43. Lyapustin, A.; Wang, Y. MODIS Multi-Angle Implementation of Atmospheric Correction (MAIAC) Data User’s Guide; NASA: Washington, DC, USA, 2018; Collection 6, pp. 1–19.
  44. Holben, B.N.; Eck, T.F.; Slutsker, I.; Tanré, D.; Buis, J.P.; Setzer, A.; Vermote, E.; Reagan, J.A.; Kaufman, Y.J.; Nakajima, T.; et al. AERONET—A federated instrument network and data archive for aerosol characterization. Remote Sens. Environ. 1998, 66, 1–16. [Google Scholar] [CrossRef]
  45. ESA. Sentinel-5 Precursor/TROPOMI Level 2 Product User Manual KNMI Level Support Products; European Space Agency: Paris, France, 2018. [Google Scholar]
  46. van Geffen, J.; Eskes, H.; Compernolle, S.; Pinardi, G.; Verhoelst, T.; Lambert, J.C.; Sneep, M.; ter Linden, M.; Ludewig, A.; Boersma, K.F.; et al. Sentinel-5P TROPOMI NO2 retrieval: Impact of version v2.2 improvements and comparisons with OMI and ground-based data. Atmos. Meas. Tech. 2022, 15, 2037–2060. [Google Scholar] [CrossRef]
  47. Tan, P.-H.; Chou, C.; Liang, J.-Y.; Chou, C.; Shiu, C.-J. Air Pollution “Holiday Effect” Resulting from the Chinese New Year. Atmos. Environ. 2009, 43, 2114–2124. [Google Scholar] [CrossRef]
  48. Douros, J.; Eskes, H.; van Geffen, J.; Boersma, K.F.; Compernolle, S.; Pinardi, G.; Blechschmidt, A.M.; Peuch, V.H.; Colette, A.; Veefkind, P. Comparing Sentinel-5P TROPOMI NO2 column observations with the CAMS-regional air quality ensemble. EGUsphere 2022, 2022, 1–40. [Google Scholar] [CrossRef]
  49. Alzahrani, S.I.; Aljamaan, I.A.; Al-Fakih, E.A. Forecasting the spread of the COVID-19 pandemic in Saudi Arabia using ARIMA prediction model under current public health interventions. J. Infect. Public Health 2020, 13, 914–919. [Google Scholar] [CrossRef] [PubMed]
  50. Burnett, R.T.; Pope, C.A., 3rd; Ezzati, M.; Olives, C.; Lim, S.S.; Mehta, S.; Shin, H.H.; Singh, G.; Hubbell, B.; Brauer, M.; et al. An integrated risk function for estimating the global burden of disease attributable to ambient fine particulate matter exposure. Env. Health Perspect. 2014, 122, 397–403. [Google Scholar] [CrossRef]
  51. Apte, J.S.; Marshall, J.D.; Cohen, A.J.; Brauer, M. Addressing global mortality from ambient PM2.5. Environ. Sci. Technol. 2015, 49, 8057–8066. [Google Scholar] [CrossRef] [PubMed]
  52. Li, T.; Zhang, Y.; Wang, J.; Xu, D.; Yin, Z.; Chen, H.; Lv, Y.; Luo, J.; Zeng, Y.; Liu, Y.; et al. All-cause mortality risk associated with long-term exposure to ambient PM(2.5) in China: A cohort study. Lancet Public Health 2018, 3, e470–e477. [Google Scholar] [CrossRef] [Green Version]
  53. Zhang, Y.L.; Cao, F. Fine particulate matter (PM 2.5) in China at a city level. Sci. Rep. 2015, 5, 14884. [Google Scholar] [CrossRef] [PubMed] [Green Version]
  54. Guo, S.; Hu, M.; Zamora, M.L.; Peng, J.; Shang, D.; Zheng, J.; Du, Z.; Wu, Z.; Shao, M.; Zeng, L.; et al. Elucidating severe urban haze formation in China. Proc. Natl. Acad. Sci. USA 2014, 111, 17373–17378. [Google Scholar] [CrossRef] [Green Version]
  55. Biswal, A.; Singh, T.; Singh, V.; Ravindra, K.; Mor, S. COVID-19 lockdown and its impact on tropospheric NO2 concentrations over India using satellite-based data. Heliyon 2020, 6, e04764. [Google Scholar] [CrossRef]
  56. Bassani, C.; Vichi, F.; Esposito, G.; Montagnoli, M.; Giusto, M.; Ianniello, A. Nitrogen dioxide reductions from satellite and surface observations during COVID-19 mitigation in Rome (Italy). Environ. Sci. Pollut. Res. 2021, 28, 22981–23004. [Google Scholar] [CrossRef]
  57. The Chinese Government Website. Circular of the State Council on the Issuance of the Comprehensive Work Plan on Energy Saving and Emission; The Chinese Government Website: Beijing, China, 2016.
  58. Yang, N.; Zhang, Z.; Xue, B.; Ma, J.; Chen, X.; Lu, C. Economic Growth and Pollution Emission in China: Structural Path Analysis. Sustainability 2018, 10, 2569. [Google Scholar] [CrossRef] [Green Version]
  59. Wang, M.; Jiang, A.; Gong, L.; Lu, L.; Guo, W.; Li, C.; Zheng, J.; Li, C.; Yang, B.; Zeng, J.; et al. Temperature significantly change COVID-19 transmission in 429 cities. medRxiv 2020. [Google Scholar] [CrossRef] [Green Version]
  60. Goyal, S.K.; Chalapati Rao, C.V. Assessment of atmospheric assimilation potential for industrial development in an urban environment: Kochi (India). Sci. Total Environ. 2007, 376, 27–39. [Google Scholar] [CrossRef]
  61. Kayes, I.; Shahriar, S.; Hasan, K.; Akhter, M.; Kabir, M.; Salam, M. The relationships between meteorological parameters and air pollutants in an urban environment. Glob. J. Environ. Sci. Manag. 2019, 5, 265–278. [Google Scholar]
  62. Zhang, H.; Wang, Y.; Hu, J.; Ying, Q.; Hu, X.-M. Relationships between meteorological parameters and criteria air pollutants in three megacities in China. Environ. Res. 2015, 140, 242–254. [Google Scholar] [CrossRef] [PubMed]
  63. Cao, C.; Jiang, W.; Wang, B.; Fang, J.; Lang, J.; Tian, G.; Jiang, J.; Zhu, T.F. Inhalable microorganisms in Beijing’s PM2.5 and PM10 pollutants during a severe smog event. Environ. Sci. Technol. 2014, 48, 1499–1507. [Google Scholar] [CrossRef] [PubMed]
  64. Zhang, C.; Chen, C.; Shen, W.; Tang, F.; Lei, H.; Xie, Y.; Cao, Z.; Tang, K.; Bai, J.; Xiao, L.; et al. Impact of population movement on the spread of 2019-nCoV in China. Emerg. Microbes Infect. 2020, 9, 988–990. [Google Scholar] [CrossRef] [Green Version]
  65. Nikkei. Blue Skies Return to China as Coronavirus Cuts Coal Consumption. Available online: https://asia.nikkei.com/Spotlight/Coronavirus/Blue-skies-return-to-China-as-coronavirus-cuts-coal-consumption (accessed on 26 February 2022).
  66. Wang, L.; Liu, Z.; Sun, Y.; Ji, D.; Wang, Y.J.A.R. Long-range transport and regional sources of PM2.5 in Beijing based on long-term observations from 2005 to 2010. Atmos. Res. 2015, 157, 37–48. [Google Scholar] [CrossRef]
  67. Quan, J.; Dou, Y.; Zhao, X.; Liu, Q.; Sun, Z.; Pan, Y.; Jia, X.; Cheng, Z.; Ma, P.; Su, J.; et al. Regional atmospheric pollutant transport mechanisms over the North China Plain driven by topography and planetary boundary layer processes. Atmos. Environ. 2020, 221, 117098. [Google Scholar] [CrossRef]
  68. CREA. Why Does the Smog Strike Beijing Even When the City is Closed Down? Available online: https://energyandcleanair.org/why-does-the-smog-strike-beijing-even-when-the-city-is-closed-down/ (accessed on 11 March 2022).
  69. Reuters. China Steel Hub Hebei Moves 2019 Industrial Capacity Cutting Targets Forward. Available online: https://www.reuters.com/article/us-china-pollution-steel/china-steel-hub-hebei-moves-2019-industrial-capacity-cutting-targets-forward-idUSKCN1U30BP (accessed on 20 February 2022).
  70. Reuters. China’s Industrial Heartland Shandong to Overhaul Energy Intensive Industries. Available online: https://www.reuters.com/article/china-shandong-economy/ (accessed on 19 February 2022).
  71. OECD. The Economic Consequences of Outdoor Air Pollution; OECD: Paris, France, 2016. [Google Scholar] [CrossRef]
  72. WB. The Cost of Air Pollution: Strengthening the Economic Case for Action. Available online: http://documents.worldbank.org/curated/en/781521473177013155/The-cost-of-air-pollution-strengthening-the-economic-case-for-action (accessed on 26 March 2022).
  73. Murray, C.J.L.; Aravkin, A.Y.; Zheng, P.; Abbafati, C.; Abbas, K.M.; Abbasi-Kangevari, M.; Abd-Allah, F.; Abdelalim, A.; Abdollahi, M.; Abdollahpour, I.; et al. Global burden of 87 risk factors in 204 countries and territories, 1990–2019: A systematic analysis for the Global Burden of Disease Study 2019. Lancet 2020, 396, 1223–1249. [Google Scholar] [CrossRef] [PubMed]
Figure 1. Flowchart of the steps taken in projecting reduced premature deaths and welfare costs associated with improved air quality in China following the implementation of COVID-19 lockdown measures, using remote sensing and census data.
Remotesensing 15 00530 g001
Figure 2. Above: Daily mean satellite-derived tropospheric NO2 over China in early 2020 for sequential periods (a) before lockdown (BLK), (b) Chinese New Year (CNY), and (c) during lockdown (DLK). Below: Corresponding reference periods of equal duration (d,e,f, respectively) with respect to the start of the Chinese New Year in 2019.
Remotesensing 15 00530 g002
Figure 3. Time series of daily NO2 concentrations across seven study regions of China, comparing equivalent periods in 2019 and 2020. The times when NO2 concentrations were higher in 2019 than in 2020 are shaded in yellow-green, while the times when the concentrations were higher in 2020 than in 2019 are shaded in salmon. Trends are also plotted for the three separate periods of before lockdown, during lockdown, and after lockdown for 2020.
Remotesensing 15 00530 g003
Figure 4. Mean daily wind speed, relative humidity and temperature for the 91-day period of analysis for 2019 and 2020 across seven study regions of China.
Remotesensing 15 00530 g004
Figure 5. Percentage change (%) in satellite-derived tropospheric NO2 for three consecutive periods in early 2020 (BLK, CNY and DLK) for seven regions across China, as compared with equivalent periods in the reference year 2019.
Remotesensing 15 00530 g005
Figure 6. Daily mean satellite-derived tropospheric NO2 over seven regions of China during the consecutive study periods of BLK, CNY and DLK in early 2020. The horizontal bar dividing each interquartile range (box) represents the median value. The upper and lower quartiles represent the 75th and 25th percentiles, respectively. The upper and lower whiskers represent maximum and minimum values, excluding outliers. Individual dots represent statistical outliers.
Remotesensing 15 00530 g006
Figure 7. Above: Daily mean satellite-derived PM2.5 over China in early 2020 for three sequential periods (a) before lockdown (BLK), (b) Chinese New Year (CNY), and (c) during lockdown (DLK). Below: Corresponding reference periods of equal duration (d,e,f, respectively) with respect to the start of the Chinese New Year in 2019.
Remotesensing 15 00530 g007
Figure 8. Time series of daily PM2.5 values across seven study regions of China, comparing equivalent periods in 2019 and 2020. The times when PM2.5 concentrations are higher in 2019 than in 2020 are shaded in yellow-green, while the times when PM2.5 concentrations are higher in 2020 than in 2019 are shaded in salmon. Trends are also plotted for the three separate periods of before lockdown, during lockdown and after lockdown for 2020.
Remotesensing 15 00530 g008
Figure 9. Percentage change (%) in satellite-derived PM2.5 concentrations for three consecutive timeframes in early 2020 (BLK, CNY and DLK) for seven regions across China, compared with equivalent periods for the reference year 2019.
Remotesensing 15 00530 g009
Figure 10. Daily mean satellite-derived PM2.5 over seven regions of China during the consecutive study periods of BLK, CNY and DLK in early 2020. The horizontal bar dividing each interquartile range (box) represents the median value. The upper and lower quartiles represent the 75th and 25th percentiles, respectively. The upper and lower whiskers represent maximum and minimum values, excluding outliers. Individual dots represent statistical outliers.
Remotesensing 15 00530 g010
Figure 11. GDP growth in China and simultaneous increases in premature deaths (PD), disability-adjusted life years (DALYs), welfare costs of premature deaths (WFC) and value of a statistical life (VSL), as attributed to exposure to PM2.5, from 1990 to 2019. (Original data source: OECD Stat.).
Remotesensing 15 00530 g011
Figure 12. Death rates in China from 1990 to 2019 (Original data source: GDB database).
Remotesensing 15 00530 g012
Figure 13. Projection results from ARIMA models for five parameters from 2020 to 2025, without including effects of COVID-19 lockdown control measures on air quality. Fit: measured discrepancies between observed and model generalizations; LCL: lower control limit; UCL: upper control limit; Forecast: estimated future dataset.
Remotesensing 15 00530 g013
Figure 14. A heat map of values of the Pearson correlation coefficient (r) between seven variables. All r-values are significant at the 0.01 level (p-value < 0.01, two-tailed).
Remotesensing 15 00530 g014
Figure 15. Predicted premature deaths (left) and welfare costs (right) from 2020 to 2025 for two scenarios: one with and one without the effect of COVID-19 lockdown measures on air pollution.
Remotesensing 15 00530 g015
Table 1. Division of the 91-day study timeframe in early 2020 into three consecutive periods of investigation, and the corresponding reference periods in 2019 for comparison.
Pandemic OnsetBefore Lockdown (BLK)Chinese New Year Holiday (CNY)During Lockdown (DLK)
202011 December 2019–23 January 202024 January–5 February 20206 February–10 March 2020
Pre-PandemicEquivalent PeriodChinese New Year Holiday (CNY)Equivalent Period
201922 December 2018–3 February 20194–11 February 201912 February–22 March 2019
Disclaimer/Publisher’s Note: The statements, opinions and data contained in all publications are solely those of the individual author(s) and contributor(s) and not of MDPI and/or the editor(s). MDPI and/or the editor(s) disclaim responsibility for any injury to people or property resulting from any ideas, methods, instructions or products referred to in the content.

