
Spatiotemporal Distribution Patterns and Exposure Risks of PM2.5 Pollution in China


1
CAS Key Laboratory of Forest Ecology and Management, Institute of Applied Ecology, Chinese Academy of Sciences, Shenyang 110016, China
2
College of Geography and Environment, Shandong Normal University, Jinan 250300, China
3
Jangho Architecture College, Northeastern University, Shenyang 110819, China
*
Author to whom correspondence should be addressed.
Remote Sens. 2022, 14(13), 3173; https://0-doi-org.brum.beds.ac.uk/10.3390/rs14133173
Submission received: 31 May 2022
/
Revised: 23 June 2022
/
Accepted: 30 June 2022
/
Published: 1 July 2022
(This article belongs to the Special Issue Remote Sensing in Applied Ecology)
Abstract
:The serious pollution of PM2.5 caused by rapid urbanization in recent years has become an urgent problem to be solved in China. Annual and daily satellite-derived PM2.5 datasets from 2001 to 2020 were used to analyze the temporal and spatial patterns of PM2.5 in China. The regional and population exposure risks of the nation and of urban agglomerations were evaluated by exceedance frequency and population weight. The results indicated that the PM2.5 concentrations of urban agglomerations decreased sharply from 2014 to 2020. The region with PM2.5 concentrations less than 35 μg·m−3 accounted for 80.27% in China, and the average PM2.5 concentrations in 8 urban agglomerations were less than 35 μg·m−3 in 2020. The spatial distribution pattern of PM2.5 concentrations in China revealed higher concentrations to the east of the Hu Line and lower concentrations to the west. The annual regional exposure risk (RER) in China was at a high level, with a national average of 0.75, while the average of 14 urban agglomerations was as high as 0.86. Among the 14 urban agglomerations, the average annual RER was the highest in the Shandong Peninsula (0.99) and lowest in the Northern Tianshan Mountains (0.76). The RER in China has obvious seasonality; the most serious was in winter, and the least serious was in summer. The population exposure risk (PER) east of the Hu Line was significantly higher than that west of the Hu Line. The average PER was the highest in Beijing-Tianjin-Hebei (4.09) and lowest in the Northern Tianshan Mountains (0.71). The analysis of air pollution patterns and exposure risks in China and urban agglomerations in this study could provide scientific guidance for cities seeking to alleviate air pollution and prevent residents’ exposure risks.
1. Introduction
In the decades since the reform and opening up, China’s rapid economic development, urbanization and population have caused severe damage to air quality [1]. Meanwhile, the major fossil energy consumption of transportation, industry, and residents’ living needs is a direct source of PM2.5 pollution, which has further exacerbated the problem of air pollution characterized by atmospheric particulate matter [2,3]. PM2.5 refers to fine particulate matter with a dynamic diameter less than 2.5 μm, which is composed of a variety of complex chemical substances discharged from various natural and anthropogenic sources [4]. PM2.5 is an important air pollutant that poses serious risks to public health all over the world and has become an issue of widespread concern to scientists and residents [5]. Since 2000, the Chinese government has issued a series of air pollution control policies, such as the 12th five-year plan on prevention and control of air pollution in key regions, the air pollution prevention and control action plan, and the three-year action plan for the defense of the blue sky [6,7,8]. Although many policies and measures have been taken and air pollution has been significantly reduced, it has not yet reached the PM2.5 pollution standard stipulated by the World Health Organization (WHO).
The temporal and spatial distribution patterns of PM2.5 in China have been analyzed by many previous studies. Cheng et al., (2019) analyzed aerosol particle measurements in Southeast China from 2001 to 2016 and found that the PM2.5 concentration showed a significant downward trend [9]. Using the spatiotemporal extra tree model, Wei et al., (2021) concluded that the air quality in the Pearl River Delta and the Yangtze River Delta improved significantly, and the pollution in the North China Plain was serious [10]. Jin et al., (2020) illustrated that the spatial pattern of PM2.5 exposure maintained a stable structure over the Beijing-Tianjin-Hebei (BTH) region’s distinct terrain, which has been described as “high in the northwest, low in the southeast” [11]. Wang et al., (2020) revealed that PM2.5 presented a step-shaped decline from northwest to southeast in space and significant multiscale temporal variations in the Yangtze River Delta Urban Agglomeration during recent decades [12].
Urban agglomeration refers to the spatial layout pattern formed by different numbers and sizes of cities gathered within a certain spatial range, in which the population, production and economic activities are closely related [13]. The dense population, intense enterprise production and human activities in the urban agglomeration aggravate regional air pollution. Relevant studies revealed that there was a significant positive spatial correlation between PM2.5 concentration and urbanization [14,15,16], and exploring the relationship between urban agglomerations and PM2.5 has become a hot topic for urban sustainable development [17]. Many previous studies on PM2.5 pollution from the perspective of urban agglomeration have mainly focused on the eastern coastal urban agglomerations of China. Wang and Fang (2016) studied the temporal and spatial distribution of PM2.5 in the Bohai Rim urban agglomeration and indicated that the PM2.5 concentration was high in southern Hebei and western Shandong in winter and autumn, and the per capita GDP, urbanization rate and urban construction had greater impacts on PM2.5 [18]. Wu et al., (2021) evaluated the spatial distribution of nine Chinese key urban agglomerations by using spatial autocorrelation analysis and dynamic time warping and reported that from 2000 to 2017, the PM2.5 concentration first increased and then fluctuated and decreased, and the concentration was high in the plains areas where the core cities of urban agglomerations were located [19].
According to epidemiological studies, air pollution, especially PM2.5, has different kinds and degrees of impact on the human body [20]. PM2.5 pollution ranks sixth among all risk factors for global early death rate and disability-adjusted life years [21], posing serious threats to the life and health of residents. Exposure to PM2.5 directly increases the risks of stroke, ischemic heart disease, chronic obstructive pulmonary disease, and lung cancer and can lead to premature death [4,21,22]. It can also lead to metabolic disorders and aggravate other chronic diseases [23]. Liu et al., (2016) predicted that the number of diseases directly caused by exposure to PM2.5 in China was 1.37 million, including stroke (690,000), ischemic heart disease (380,000), lung cancer (130,000) and chronic obstructive pulmonary disease (170,000) [24]. Air pollution is closely related to different aspects of mental health, and the acceptable public risk rate decreases as the PM2.5 concentration increases [25]. Wang et al., (2021) reported that the PM2.5 concentration in urban areas decreased by 42.95% between 2013 and 2018, and the premature deaths in long- and short-term PM2.5 exposure decreased by 10.13% and 72.49%, respectively, in 2018 compared with 2013 [26]. Song et al., (2019) indicated that approximately half of the population living in the BTH region was exposed to monthly mean PM2.5 concentrations greater than 80μg·m−3 in 2015, and the premature deaths of all causes and from cardiovascular and respiratory diseases attributed to PM2.5 were estimated to be 138,150, 80,945, and 18,752, respectively [27]. Fu et al., (2020) used the exposure response relationship model to analyze the impact of PM2.5 on health from 2015 to 2017 and found that the health effect economic loss (mainly caused by chronic bronchitis and premature death) accounted for 1.73%, 1.53% and 1.41% of GDP in these years, respectively [28]. The carcinogenic risk caused by exposure to PM2.5 has obvious urban–rural differences. With increased PM2.5 exposure, the risks for ovarian and prostate cancer rise significantly in urban areas, while risks for lung cancer and leukemia rise significantly in rural areas [29].
Over the past two decades, China’s economy and society have developed rapidly, and intense industrialization and urbanization have led to serious air pollution, especially the PM2.5 pollution in urban agglomerations. As urban agglomerations have a concentrated population distribution, a large number of people in these areas are exposed to high concentrations of PM2.5. In this study, ground-level PM2.5 data of China with a spatial resolution of 1 km from 2001 to 2020 were used to investigate the spatiotemporal distribution patterns and exposure risks. The main purposes of this study were (1) to reveal the temporal and spatial distribution of PM2.5 concentrations in China from 2001 to 2020 and (2) to analyze the regional and population exposure risks of China and 14 urban agglomerations. The methods and results in this study are expected to deepen the understanding of PM2.5 exposure risks under changes in pollution patterns and population distributions in China and provide a theoretical basis for policies to improve air quality and alleviate residents’ air pollution exposure risks.
2. Materials and Methods
2.1. Study Area
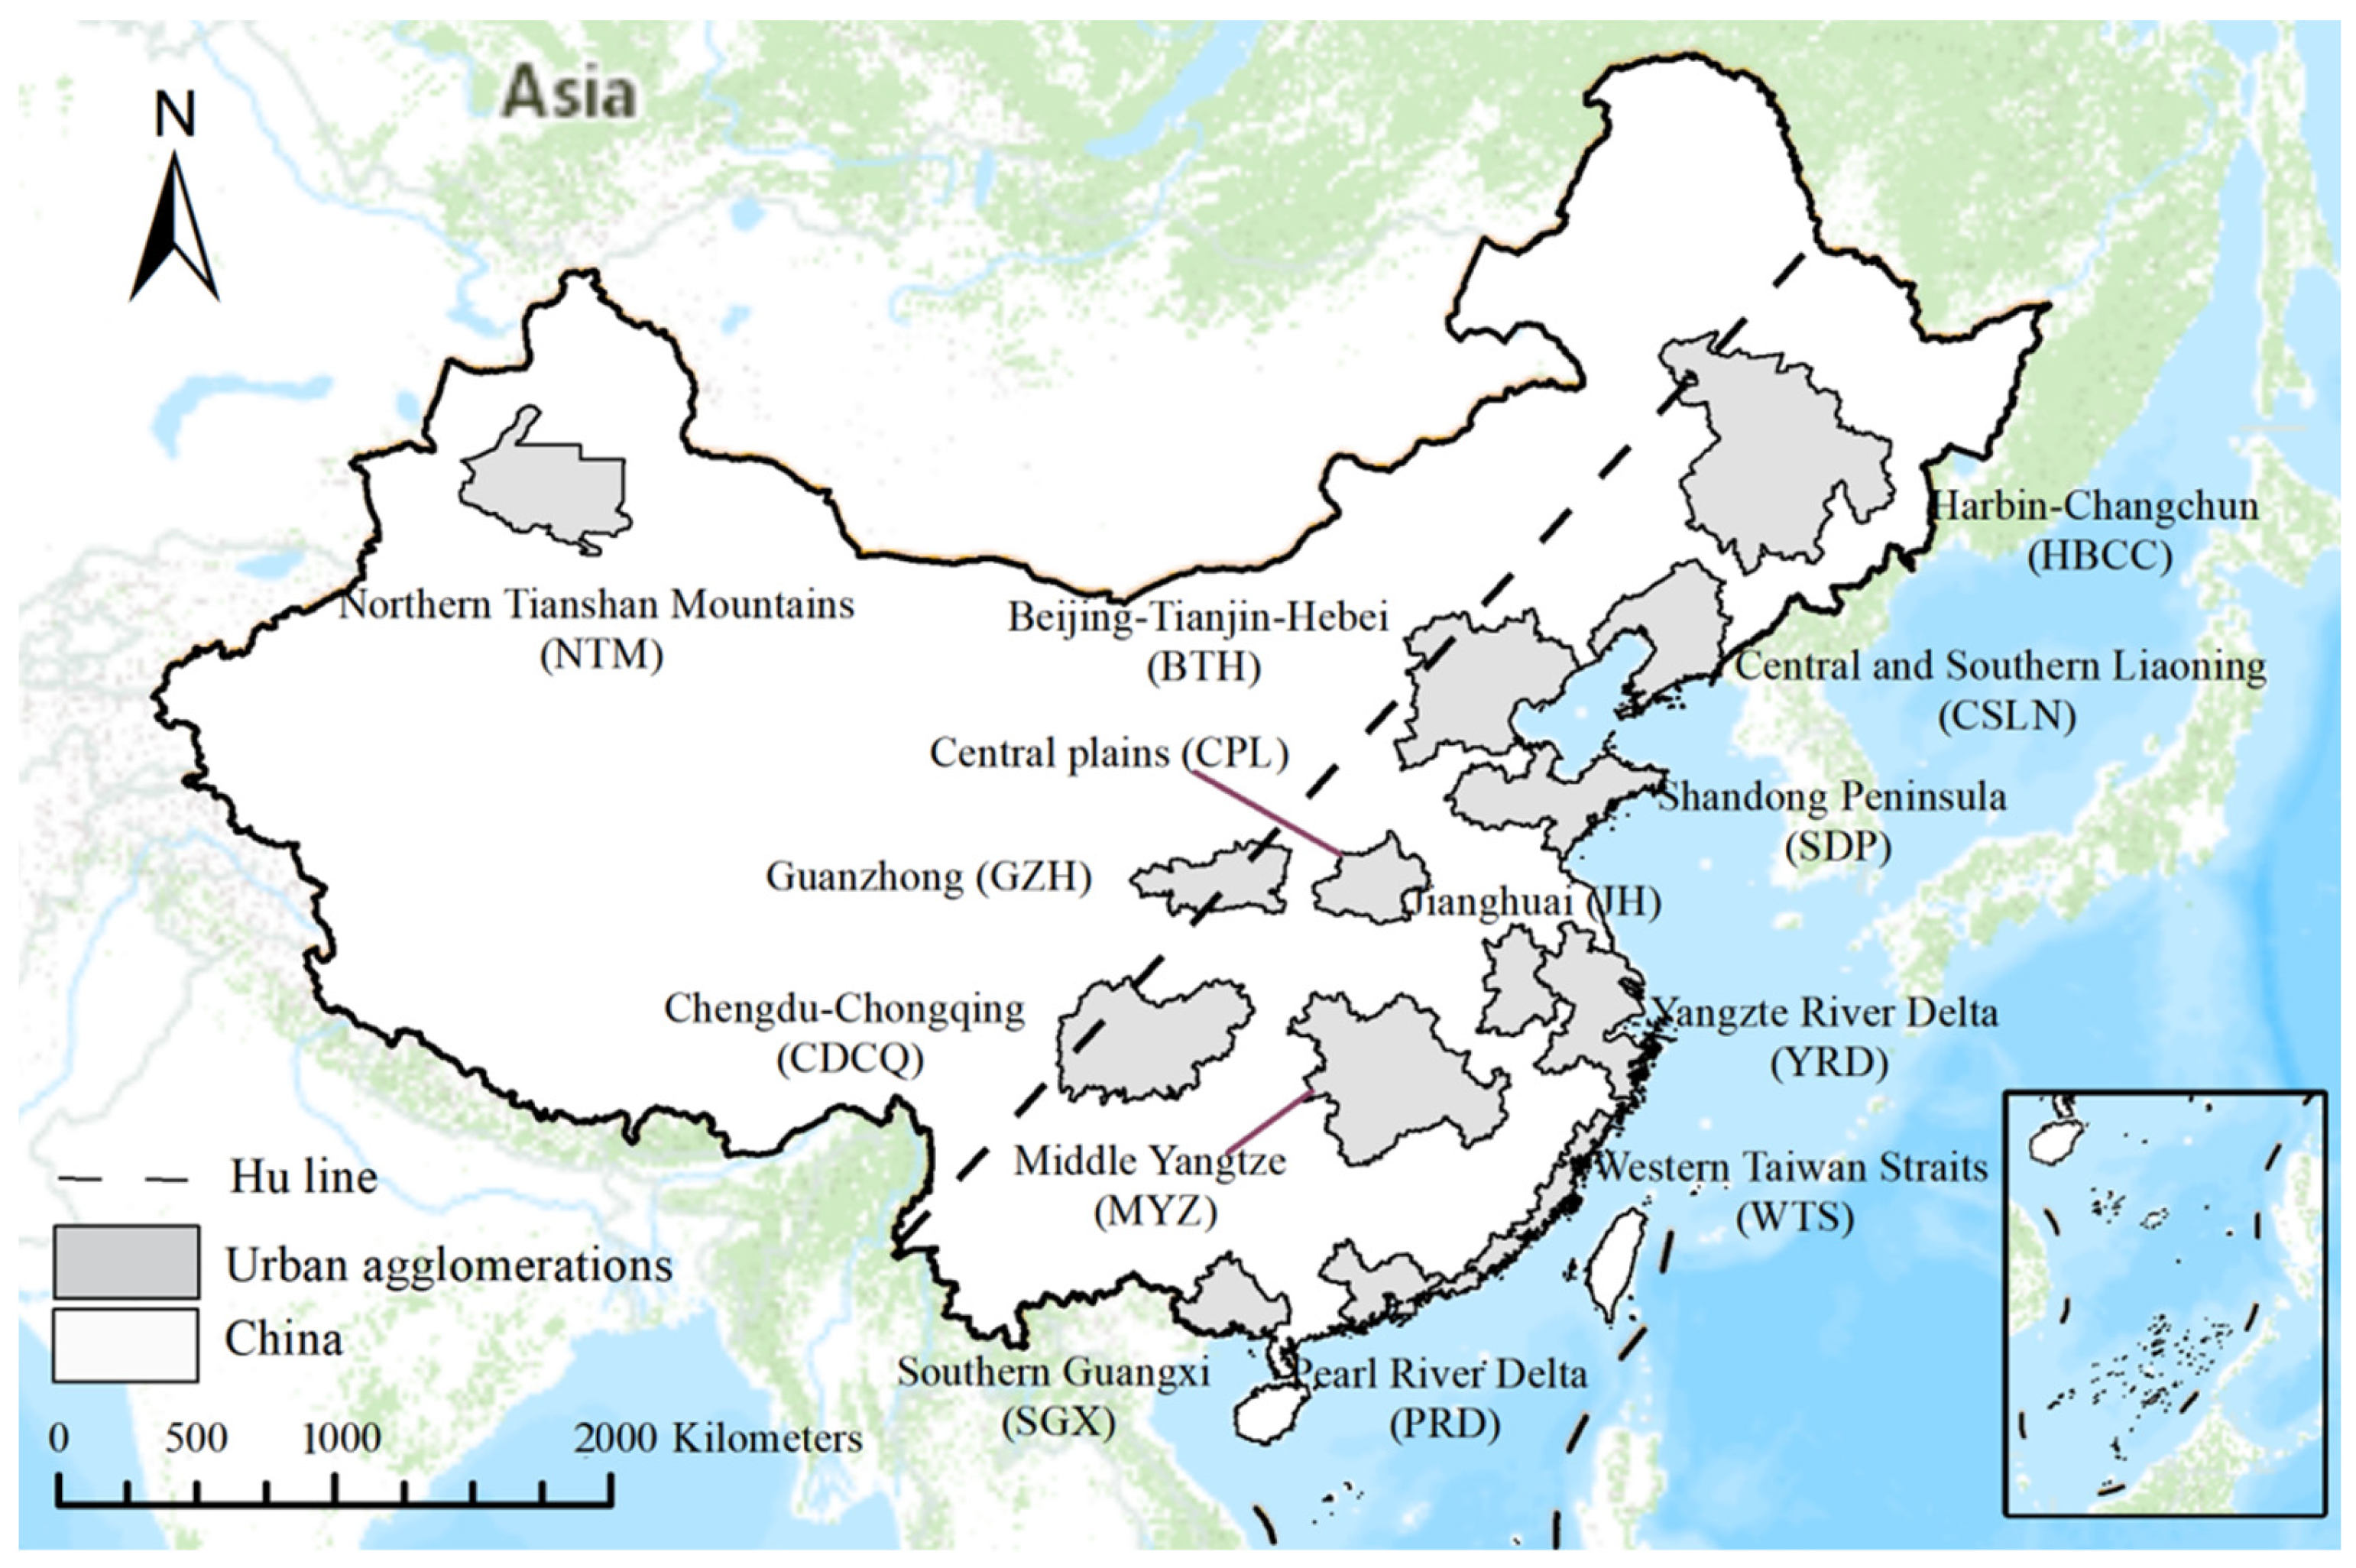
The study area of this research is China and its 14 major urban agglomerations. Among the selected urban agglomerations, 13 are distributed east of the Hu Line, and 1 is distributed west of the Hu Line (Figure 1). The Hu Line, also known as the “Hu Huanyong Line”, is an imaginary line stretching from Heihe (a city in northern China located on the Russian border) to Tengchong (a southwestern city bordering Myanmar), which divides the area of China into two roughly equal parts [30]. The Hu Line is also recognized as the dividing line of China’s ecological environment, socioeconomic development, population distribution and urbanization level [31,32,33].
Among the 14 major urban agglomerations, there are five national urban agglomerations, including the Yangtze River Delta (YRD), Pearl River Delta (PRD), Beijing-Tianjin-Hebei (BTH), Middle Yangtze (MYZ), and Chengdu-Chongqing (CDCQ), accounting for 9.06%, 31.39% and 46.48% of the total land area, population and GDP in China, respectively. The others are regional urban agglomerations, including Harbin-Changchun (HBCC), Central and Southern Liaoning (CSLN), Shandong Peninsula (SDP), Western Taiwan Straits (WTS), Central Plains (CPL), Guanzhong (GZH), Southern Guangxi (SGX), Jianghuang (JH), and Northern Tianshan Mountains (NTM), accounting for 9.84%, 24.67% and 28.00% of the total land area, population and GDP in China, respectively [34].
2.2. Data
2.2.1. Ground-Level PM2.5 Data
The PM data of China from 2001 to 2020 were obtained from the ChinaHighPM2.5 data set, with a spatial resolution of 1km [10,35]. ChinaHighPM2.5 is one of a series of long-term, full-coverage, high-resolution, and high-quality datasets of ground-level air pollutants for China. Considering the spatiotemporal heterogeneity of air pollution, the PM2.5 concentration at 1 km resolution was estimated by using the spatiotemporal extra tree (STET) model and the atmospheric correction (MAIAC) algorithm. At the same time, auxiliary data that may affect PM2.5 concentration, including meteorological variables, surface conditions, pollutant emissions and population distribution, were collected to improve data accuracy. In the evaluation process, several main meteorological variables were analyzed and extracted from ERA-Interim, including temperature, relative humidity, precipitation, evaporation, surface pressure, wind speed and wind direction. The results showed that the dataset captured variations in PM2.5 concentrations at different spatiotemporal scales well, with higher accuracies (cross-validation coefficient of determination, CV-R2 = 0.86–0.90) and stronger predictive powers (R2 = 0.80–0.82) than previously reported. The annual average PM2.5 concentration data were used to analyze the changes in the pollutant interannual distribution pattern and exposure risk, and the daily average PM2.5 concentration data of 2020 were used to analyze the changes in the pollutant seasonal distribution pattern and exposure risk.
2.2.2. Population Density Data
The population density from 2001 to 2020 in China was obtained from the Worldpop gridded population dataset (https://www.worldpop.org/methods/populations (accessed on 1 March 2022). The resolution of this dataset is 30 arc seconds, which is about 1 km for longitude resolution and latitude resolution at the equator. The population density data were used to calculate the population exposure risks under the condition of different population distributions.
2.3. Method
2.3.1. Trend Analysis
Ordinary least-squares regression is widely used in trend analysis of sequence data evolution. In this study, trend analysis was used to characterize the change trends of annual PM2.5 concentrations from 2001 to 2020 and determine the degree of its increase or decrease. The calculation formula is:
where T is the change trends of the PM2.5 concentration of each grid, n is the time span, i is the number of years, and pi is the annual average concentration of PM2.5 in the ith year. If T is greater than 0, it indicates that the PM2.5 concentration has an increasing trend; if T is less than 0, it indicates that the PM2.5 concentration has a decreasing trend.
where r is the correlation coefficient; t is the time series from 1 to 20; and and are the mean values of p and t, respectively. The value of r ranges from −1 to 1.
2.3.2. Regional Exposure Risk Analysis
The regional exposure risk (RER) of air pollution refers to the time when the air pollutant concentration exceeds the limitation in a region, which reflects the length or proportion of time people in this region are exposed to air pollution. The exceedance frequency was used to estimate the annual and seasonal RER of PM2.5, and the calculation formula is:
where RERj is the RER of PM2.5 in grid j; Cj is the PM2.5 concentration in grid j; S is the interim target 1 (IT-1) of the WHO; the IT-1 for annual PM2.5 concentration is 35 μg·m−3, and that for daily PM2.5 concentration is 75 μg·m−3. The annual and seasonal RERs were calculated based on the annual PM2.5 concentration and daily PM2.5 concentration, respectively. n represents the time span, which is years for annual RER and days of each season for seasonal RER. The value of RER ranges from 0 to 1. A value of 0 indicates that there is no event exceeding the pollution standard of IT-1, while the larger the value of RER is, the greater the proportion of pollution events, and a value of 1 means that the PM2.5 concentration exceeds the standard of IT-1 throughout the whole period.
2.3.3. Population Exposure Risk Analysis
High concentrations of PM2.5 pose serious threats to human life and health. However, due to the uneven distribution of population density, the RER cannot fully reflect the exposure risk of PM2.5 for residents. To solve this problem, it is necessary to quantify the risk under different population densities. In this study, population exposure risk (PER) was used to quantify the population exposure risk of PM2.5 pollution on a spatial scale. The calculation formula is:
where PERij is the PER of PM2.5 in grid j in the ith year, Cij is the average annual PM2.5 concentration of grid j in the ith year, Pij is the population density of grid j in the ith year, and m is the total number of grids in the study area. PER was divided into five levels, including level 0 (0 ≤ PER ≤ 1), level 1 (1 < PER ≤ 2), level 2 (2 < PER ≤ 3), level 3 (3 < PER ≤ 5) and level 4 (PER > 5).
3. Results
3.1. Distribution Patterns of PM2.5 Concentrations
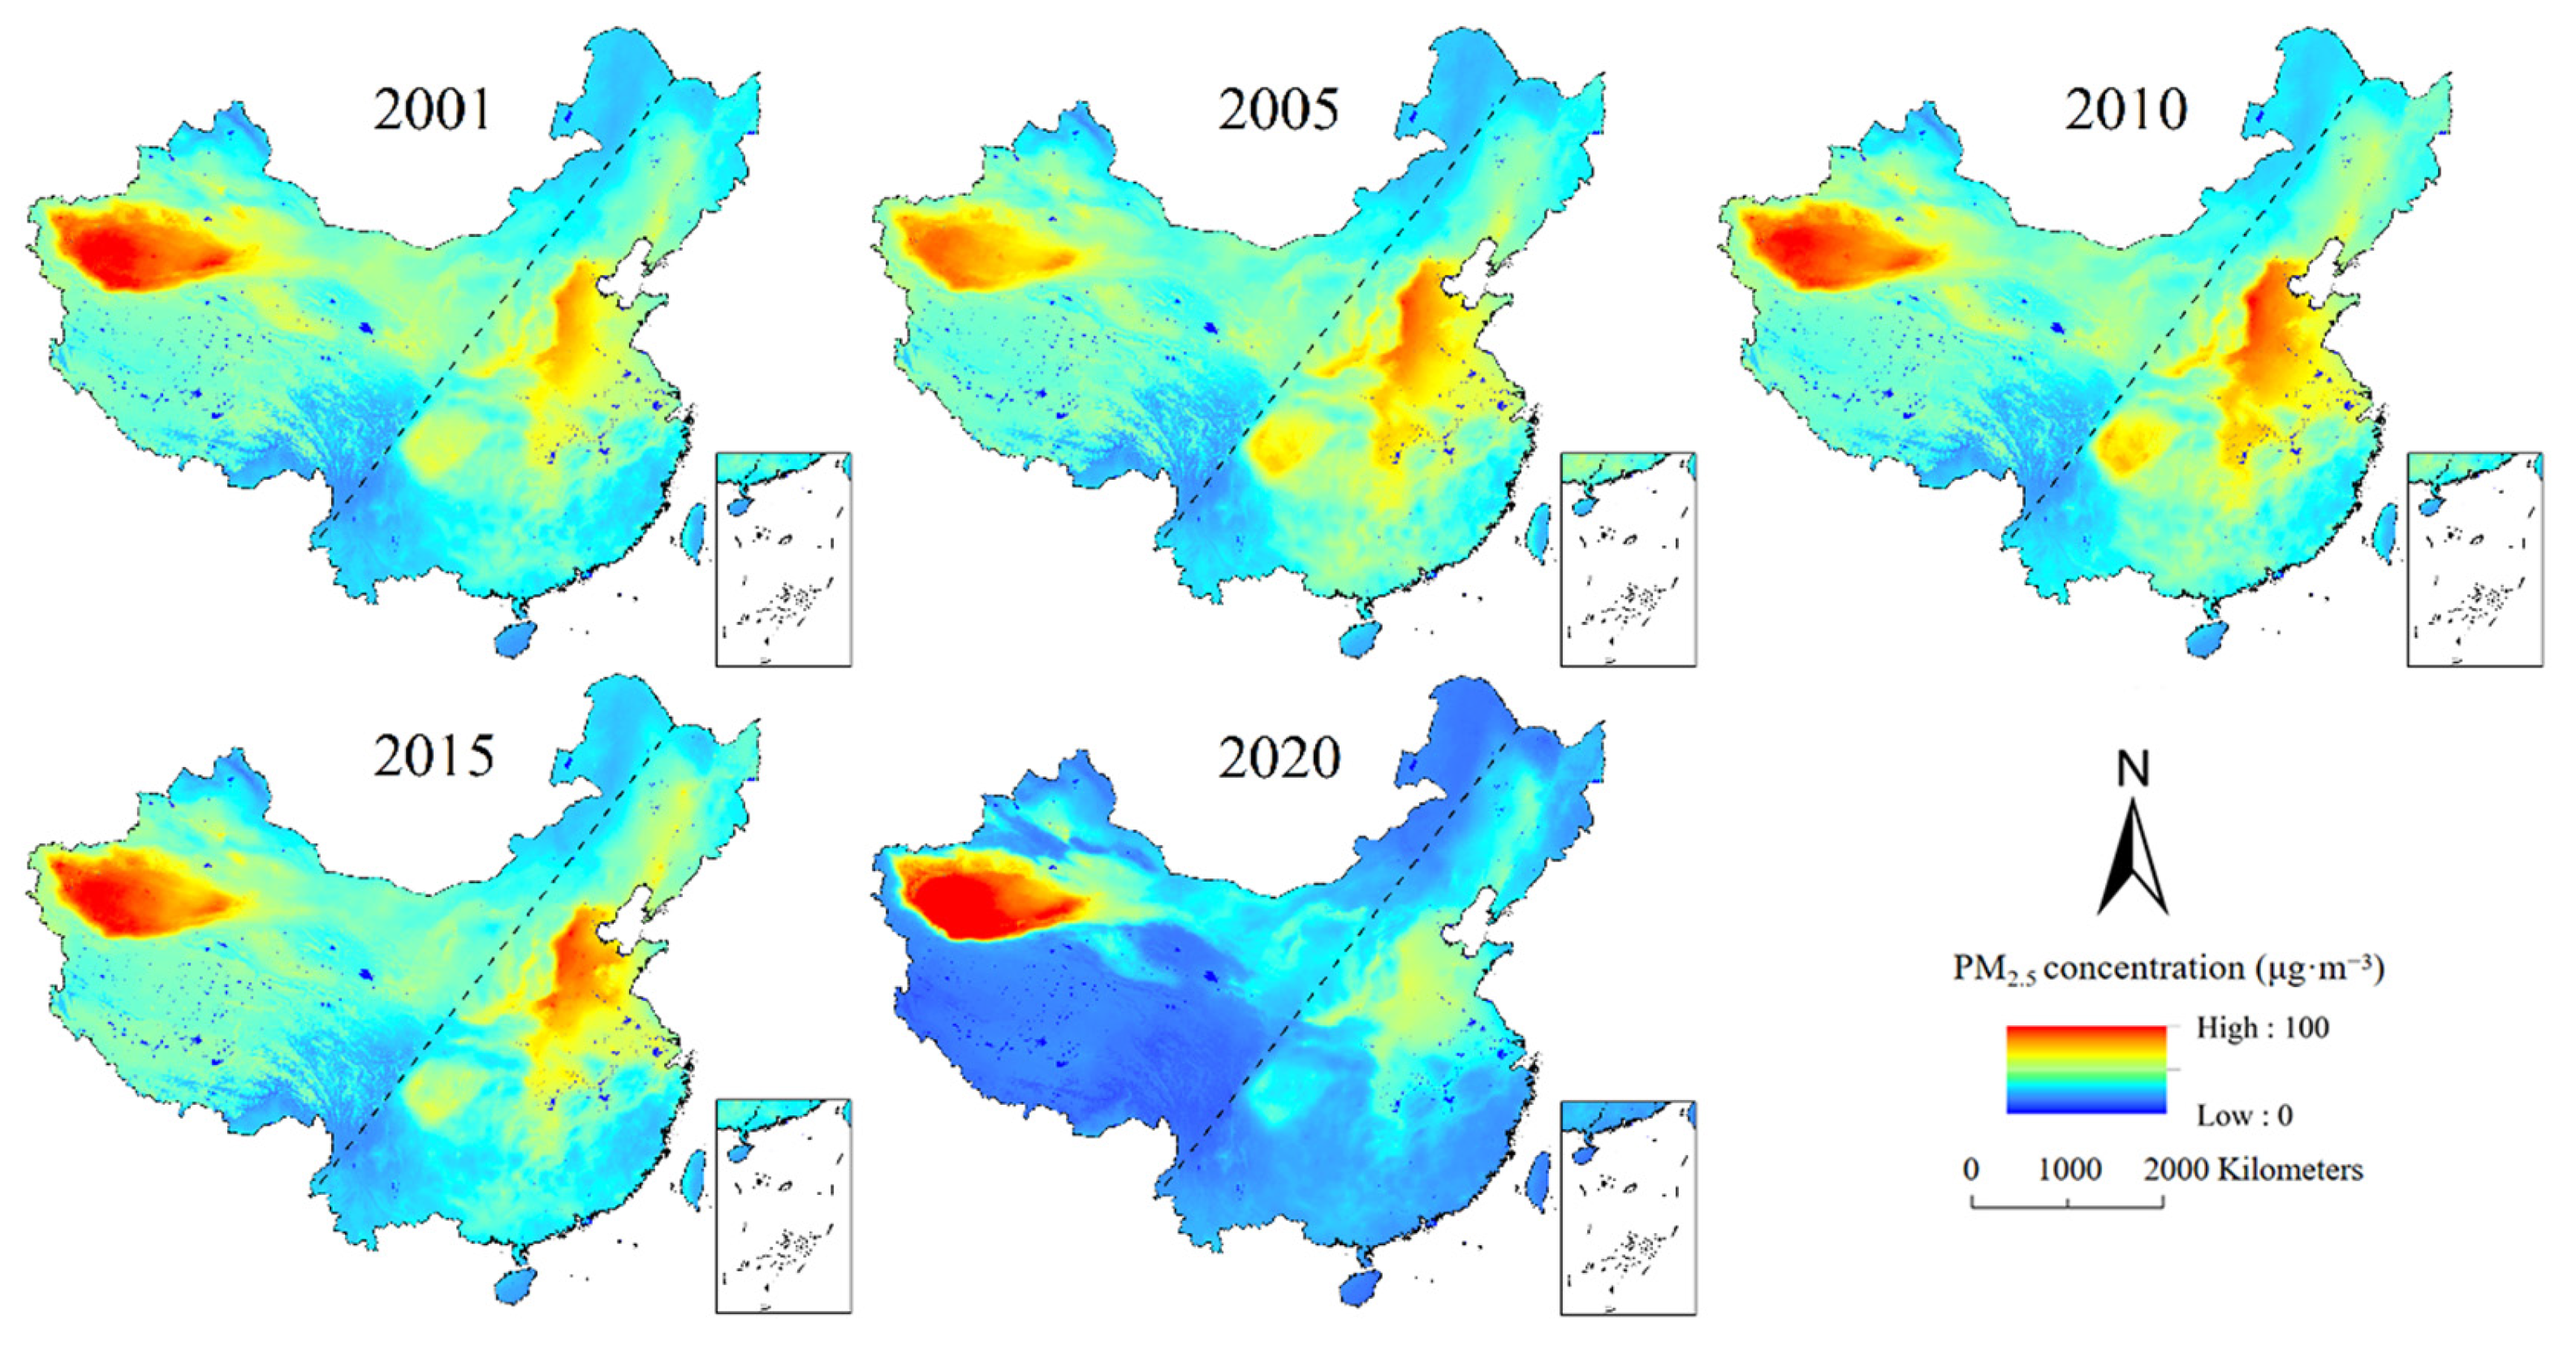
The temporal and spatial distribution patterns of annual average PM2.5 from 2001 to 2020 were calculated by annual ground-level PM2.5 data. The distribution patterns of PM2.5 concentrations in 5 representative years are displayed in Figure 2. Over the past 20 years, the distribution patterns of PM2.5 in China have been roughly divided by the Hu Line. The PM2.5 concentration in the eastern region was higher, and the concentration in the western region was lower, except for the Tarim Basin in Western China. From the overall distribution of PM2.5 concentrations in the five representative years, it can be clearly found that the PM2.5 pollution in most regions of China was obviously reduced from 2001 to 2020.
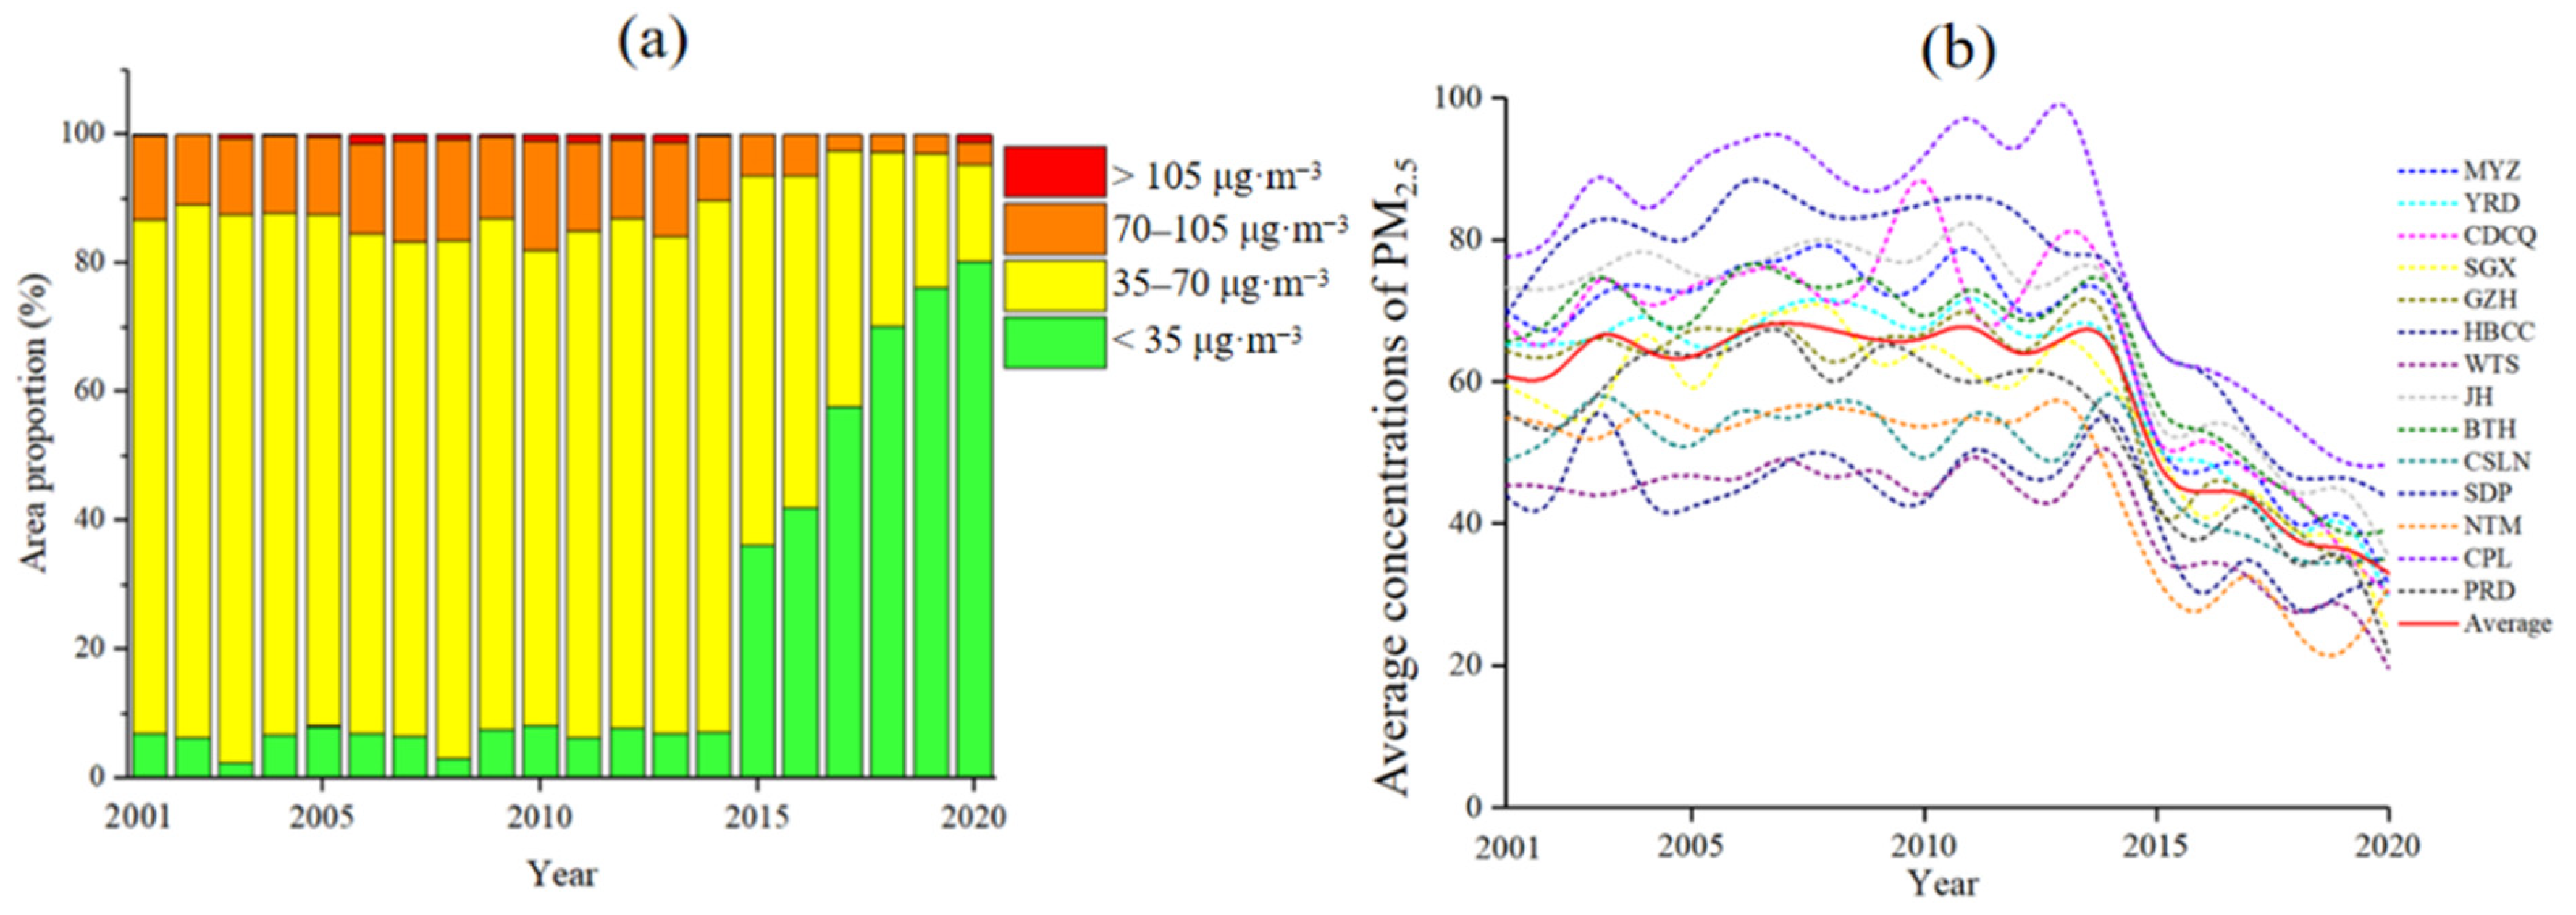
Based on the WHO global air quality guidelines, the IT-1 of the annual average PM2.5 (35 μg·m−3) was used as the standard. The value range of PM2.5 was divided into four categories according to the IT-1 value, which were <35 μg·m−3, 35–70 μg·m−3, 70–105 μg·m−3, and >105 μg·m−3. The area proportion of each category in the past 20 years is shown in Figure 3a. From 2001 to 2014, the area with PM2.5 concentrations less than 35 μg·m−3 accounted for a small proportion (approximately 6.49%), while the concentrations in most areas were between 35 and 70 μg·m−3 (79.57%). Since 2015, the proportion of regions with PM2.5 concentrations of less than 35 μg·m−3 has increased considerably, from 7.06% in 2014 to 80.27% in 2020. The area with PM2.5 concentrations between 35 and 70 μg·m−3 decreased accordingly, from 82.69% in 2014 to 14.98% in 2020. The area with PM2.5 concentrations greater than 75 μg·m−3 decreased slightly, from 7.46% in 2001 to 4.38% in 2020. The changes in the PM2.5 concentrations of 14 urban agglomerations over the past 20 years revealed that the PM2.5 concentrations of urban agglomerations decreased sharply from 2014 to 2020 (Figure 3b). In particular, the concentrations in most urban agglomerations, except GZH, JH, BTH, CSLN, SDP and CPL, decreased below the specified limit of 35 μg·m−3 in 2020.
From 2001 to 2020, the concentrations of PM2.5 in 14 urban agglomerations showed two obvious categories, with different trends (Table 1). In the first stage (2001–2014), the concentration did not decrease significantly, and even seemed to increase with the passage of time for some urban agglomerations. Both the increase and decrease were small. In the second stage (2015–2020), 14 urban agglomerations showed an obvious downward trend. Among them, CDCQ (−6.14 μg·m−3/year), MYZ (−5.65 μg·m−3/year) and JH (−5.47 μg·m−3/year) decreased the most, while NTM (−2.24 μg·m−3/year) and HBCC (−3.30 μg·m−3/year) decreased the least. It can be seen that the relevant policies adopted by China to control PM2.5 in recent years have achieved remarkable results.
3.2. Distribution Patterns of PM2.5 Trends
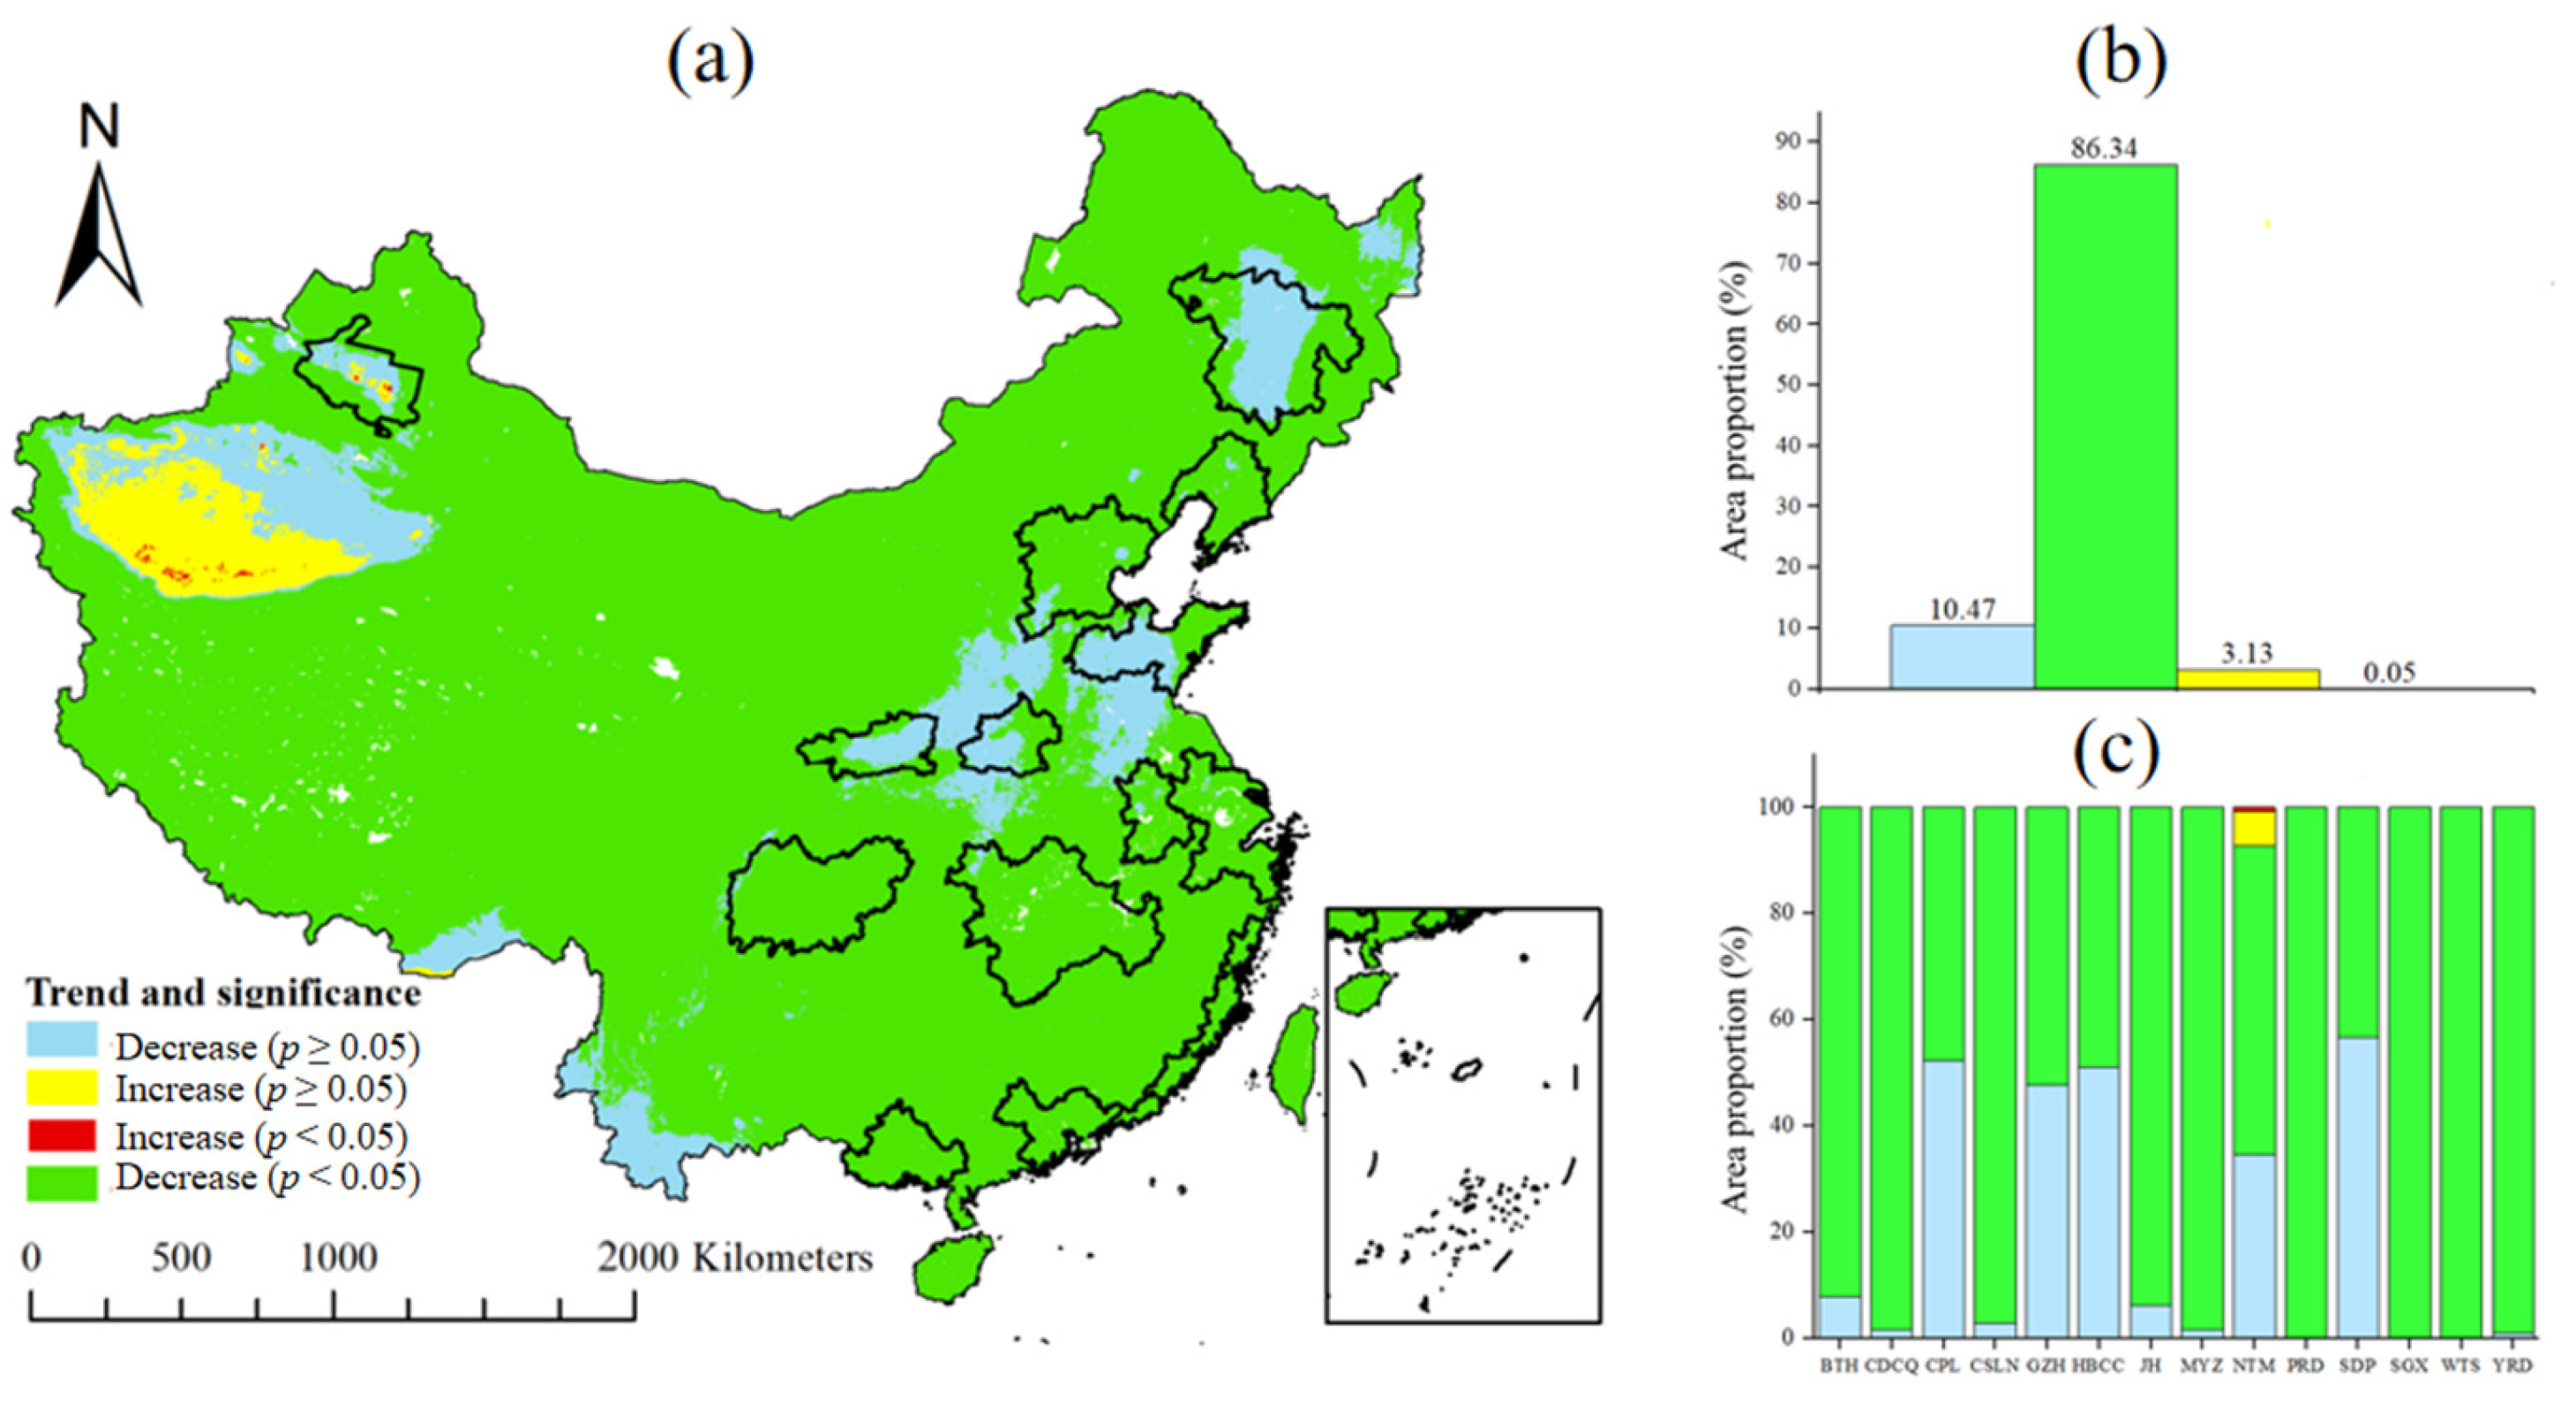
The change trends of annual PM2.5 concentrations from 2001 to 2020 were explored by the ordinary least-squares regression method, and the spatial distribution of trends is presented in Figure 4. The T value was negative in most regions of China, indicating that the PM2.5 concentration has gradually decreased in the past two decades (Figure 4a). The area with a significant decrease (p < 0.05) in the PM2.5 concentration accounted for 86.34% of the total national area (Figure 4b). There were few areas with significant (p < 0.05) and nonsignificant (p ≥ 0.05) increases in PM2.5 concentrations, accounting for 0.05% and 3.13% of the national area, respectively, and they were mainly concentrated in Western China. For urban agglomerations, except NTM, the PM2.5 concentration in other urban agglomerations illustrated a complete decreasing trend (Figure 4c). The trends of PM2.5 concentration in SGX, PRD and WTS showed a significant decrease, and other urban agglomerations revealed a significant and nonsignificant decrease from 2001 to 2020.
3.3. Regional Exposure Risks of PM2.5
The annual RERs of the PM2.5 concentration in China and 14 urban agglomerations from 2001 to 2020 are presented in Figure 5. Overall, the annual RER in China was at a high level, with a national average of 0.75, while the average of 14 urban agglomerations was as high as 0.86. The annual RERs in Central, Eastern and Northwest China were the highest, and those in Northeast and Southwest China were the lowest (Figure 5a). Among the 14 urban agglomerations, the average annual RER was the highest in SDP (0.99), followed by CPL (0.98) and JH (0.97), and the lowest annual RERs were in WTS (0.79), HBCC (0.78) and NTM (0.76) (Figure 5b).
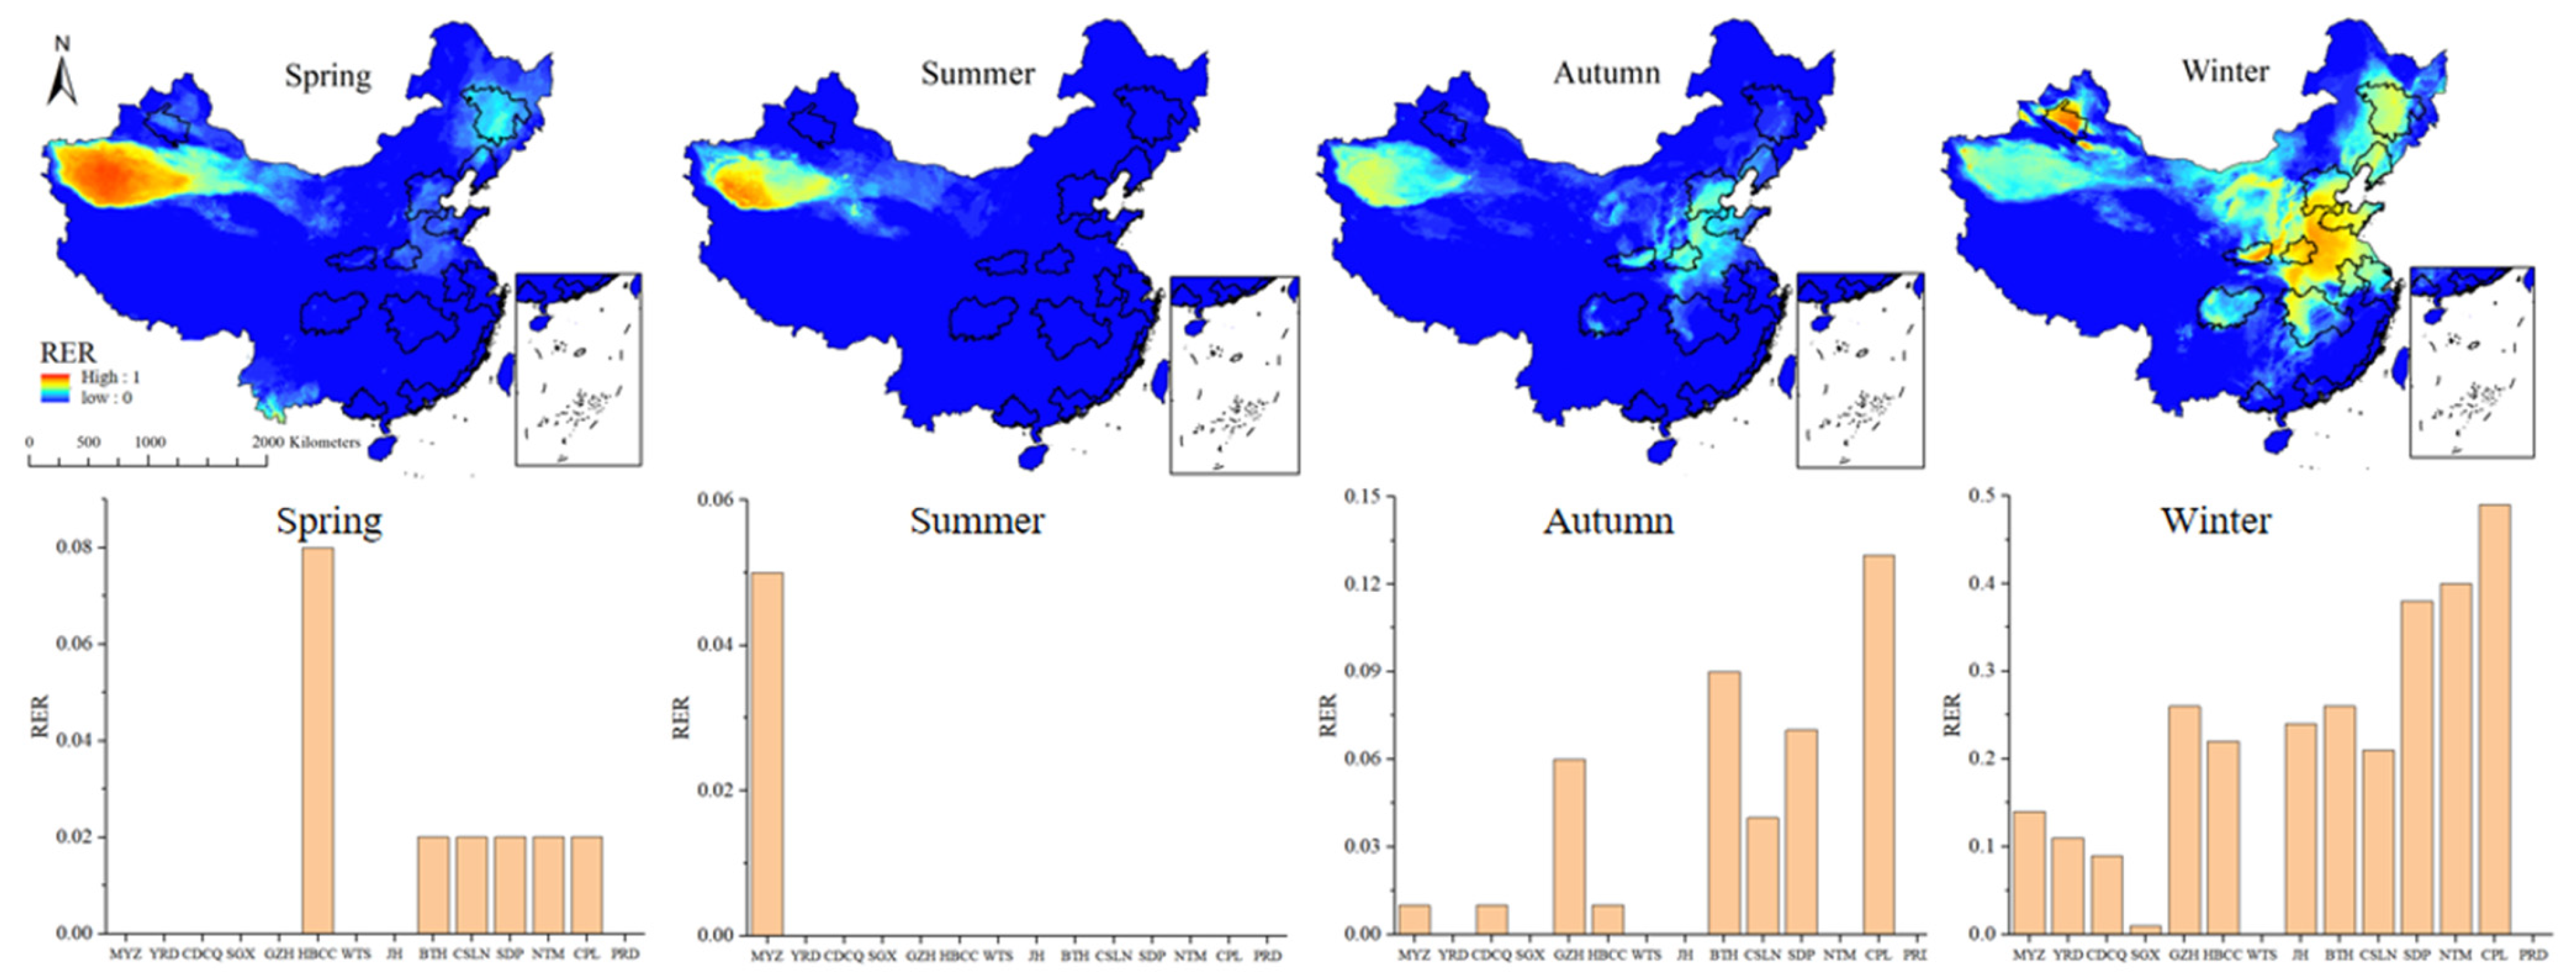
To analyze the RER of PM2.5 concentrations in each season, the 24 h average concentration limitation (75 μg·m−3) of WHO’s IT-1 was set as the standard. The proportion of days exceeding the limitation in each season of 2020 was calculated, and the results of the seasonal RER are presented in Figure 6. The RER in China has obvious seasonality; the most serious was winter, and the least serious was summer. Among the different urban agglomerations, the RER of HBCC in spring was the highest (0.08). In summer, except for MYZ, for which the RER was 0.05, the RERs of the other urban agglomerations were very low. The high RER values in autumn were mainly concentrated in Central and Eastern China, where the RERs of BTH, SDP and CPL were relatively high. In winter, the RERs of all urban agglomerations except SGX and WTS were high, and the highest RER was in CPL (0.49). The RERs of SGX, WTS and PRD along the southern coast of China were low throughout the year. The RERs of HBCC, NTM and CSLN in northern China were higher in spring and winter.
3.4. Population Exposure Risks of PM2.5
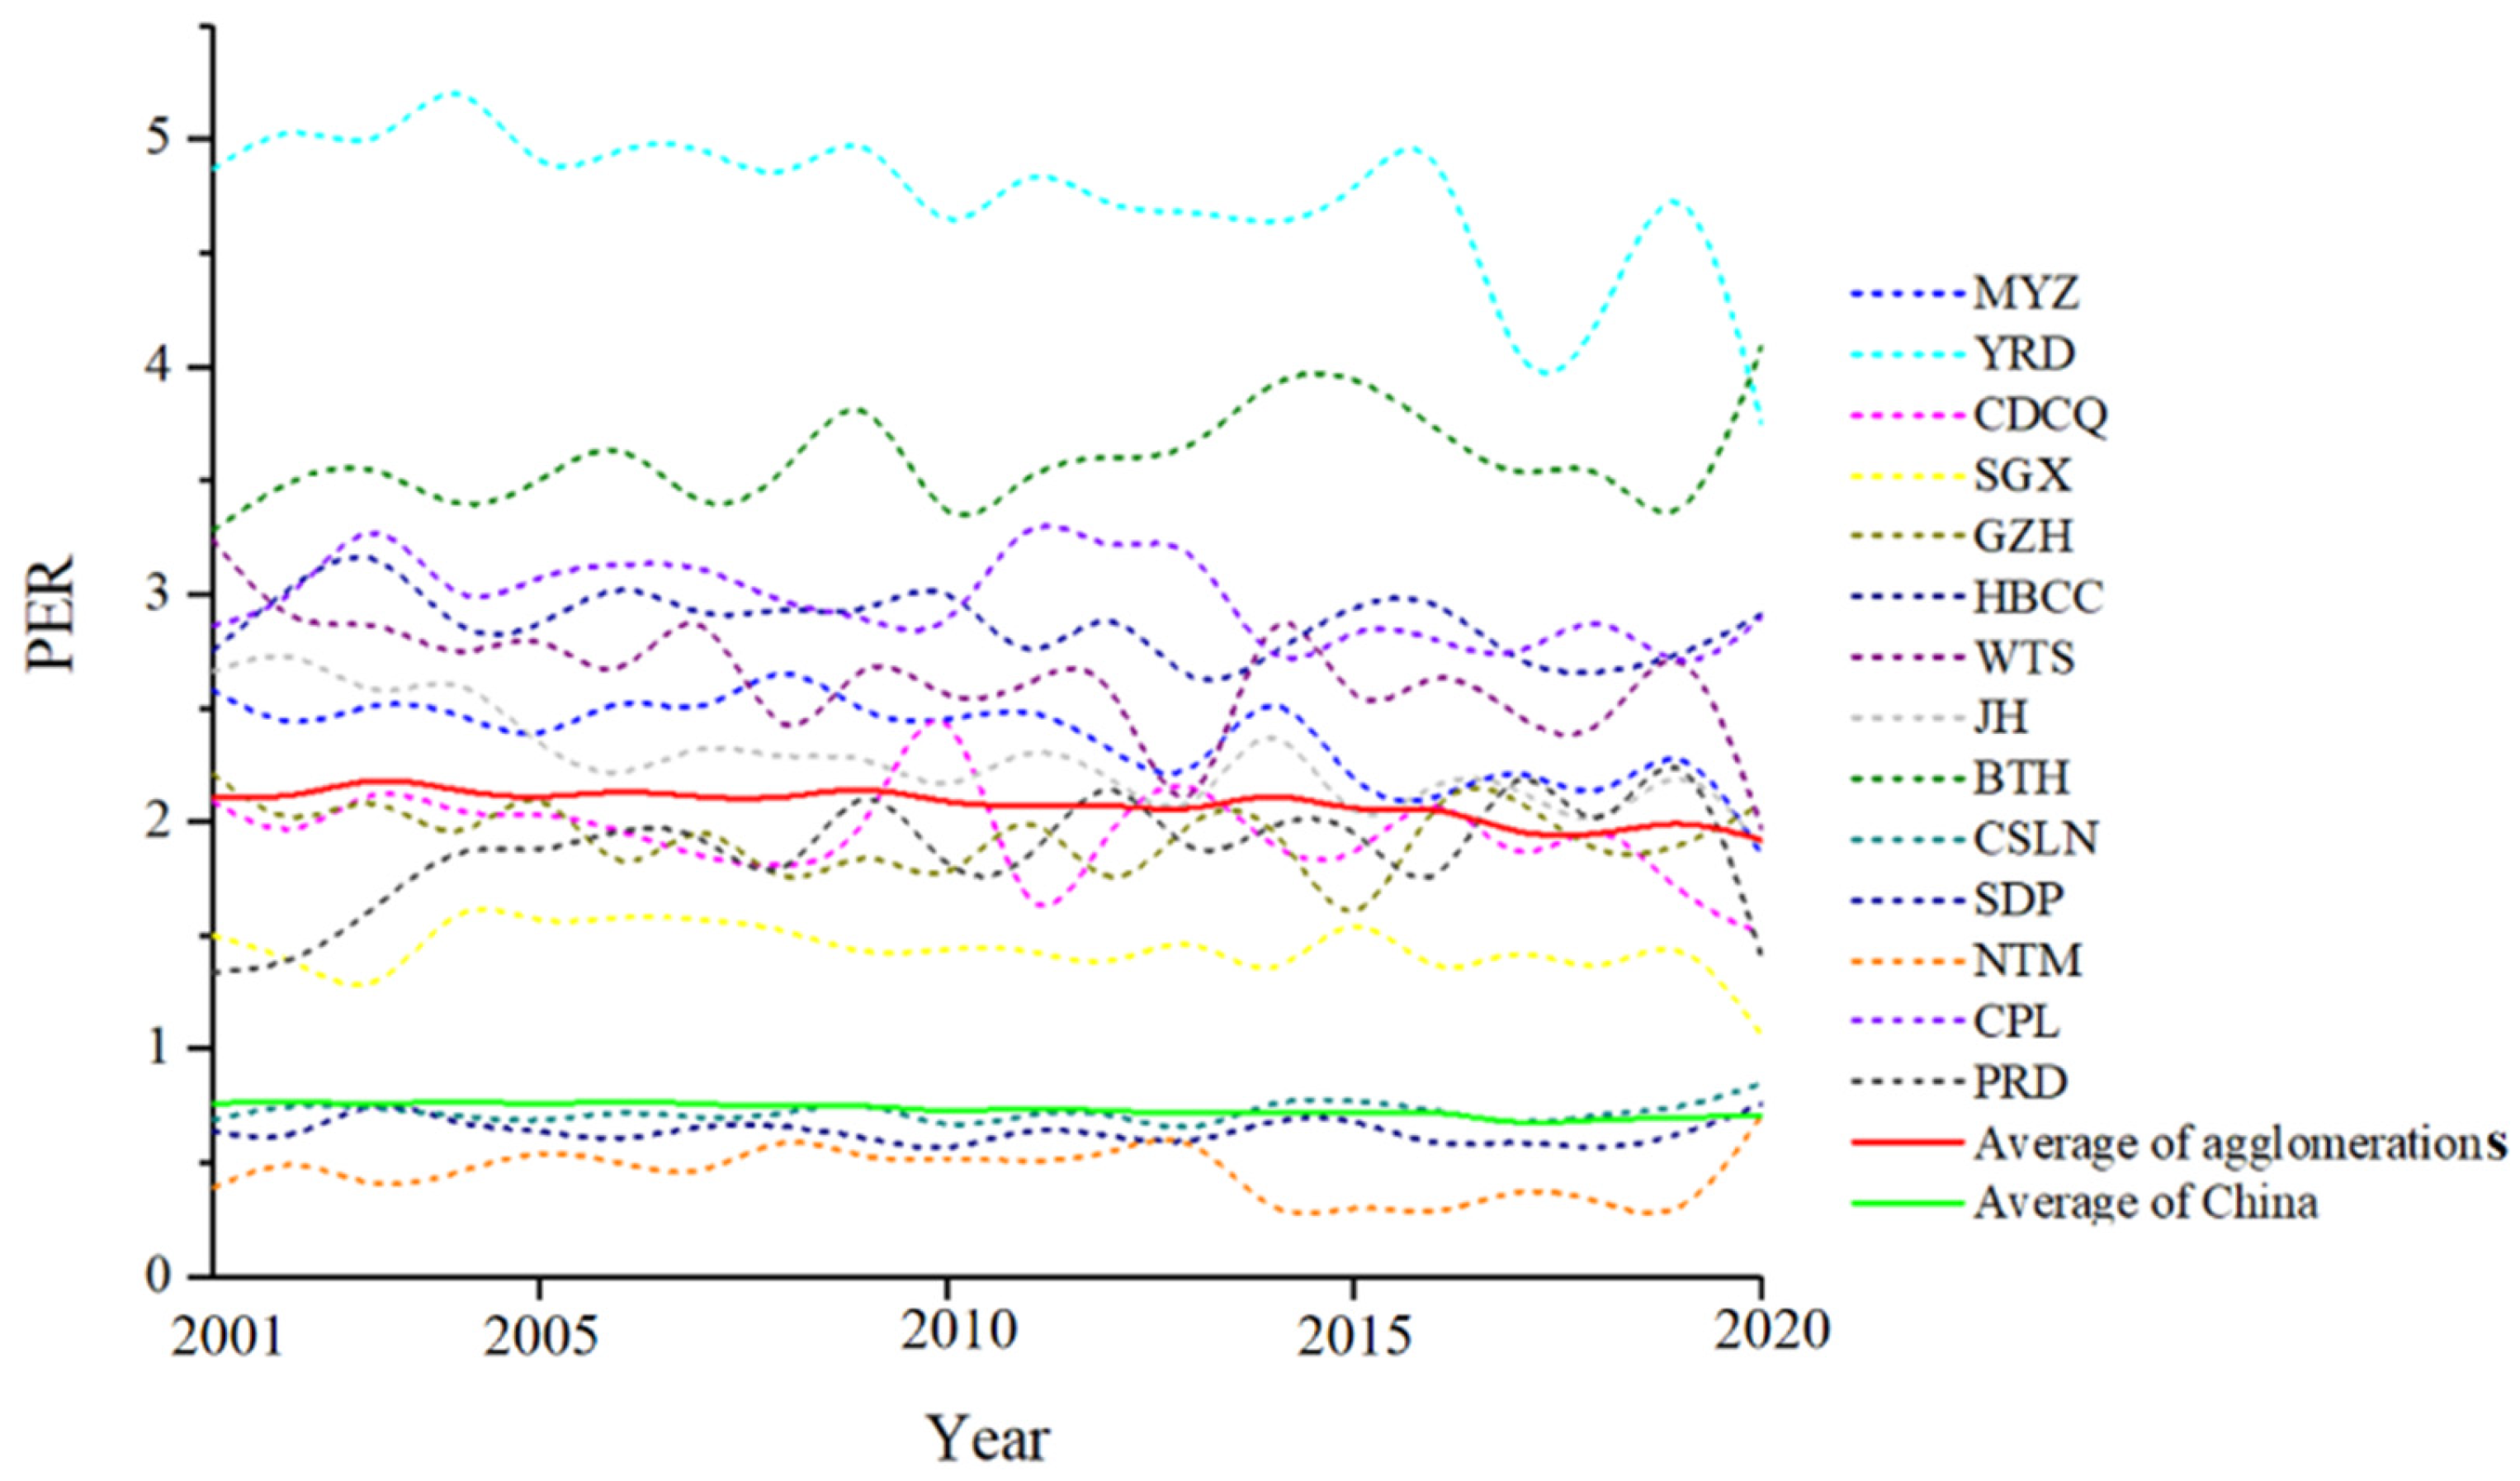
The PERs of PM2.5 concentrations in China and 14 urban agglomerations from 2001 to 2020 are presented in Figure 7. The PERs of the 14 urban agglomerations showed a fluctuating trend, with no significant change in 20 years. The average PER of urban agglomerations was higher than that of China as a whole. Among the 14 urban agglomerations, the PERs of BTH, YRD, SDP and CPL were higher, while the PERs of CSLN, HBCC and NTM were lower than the national average.
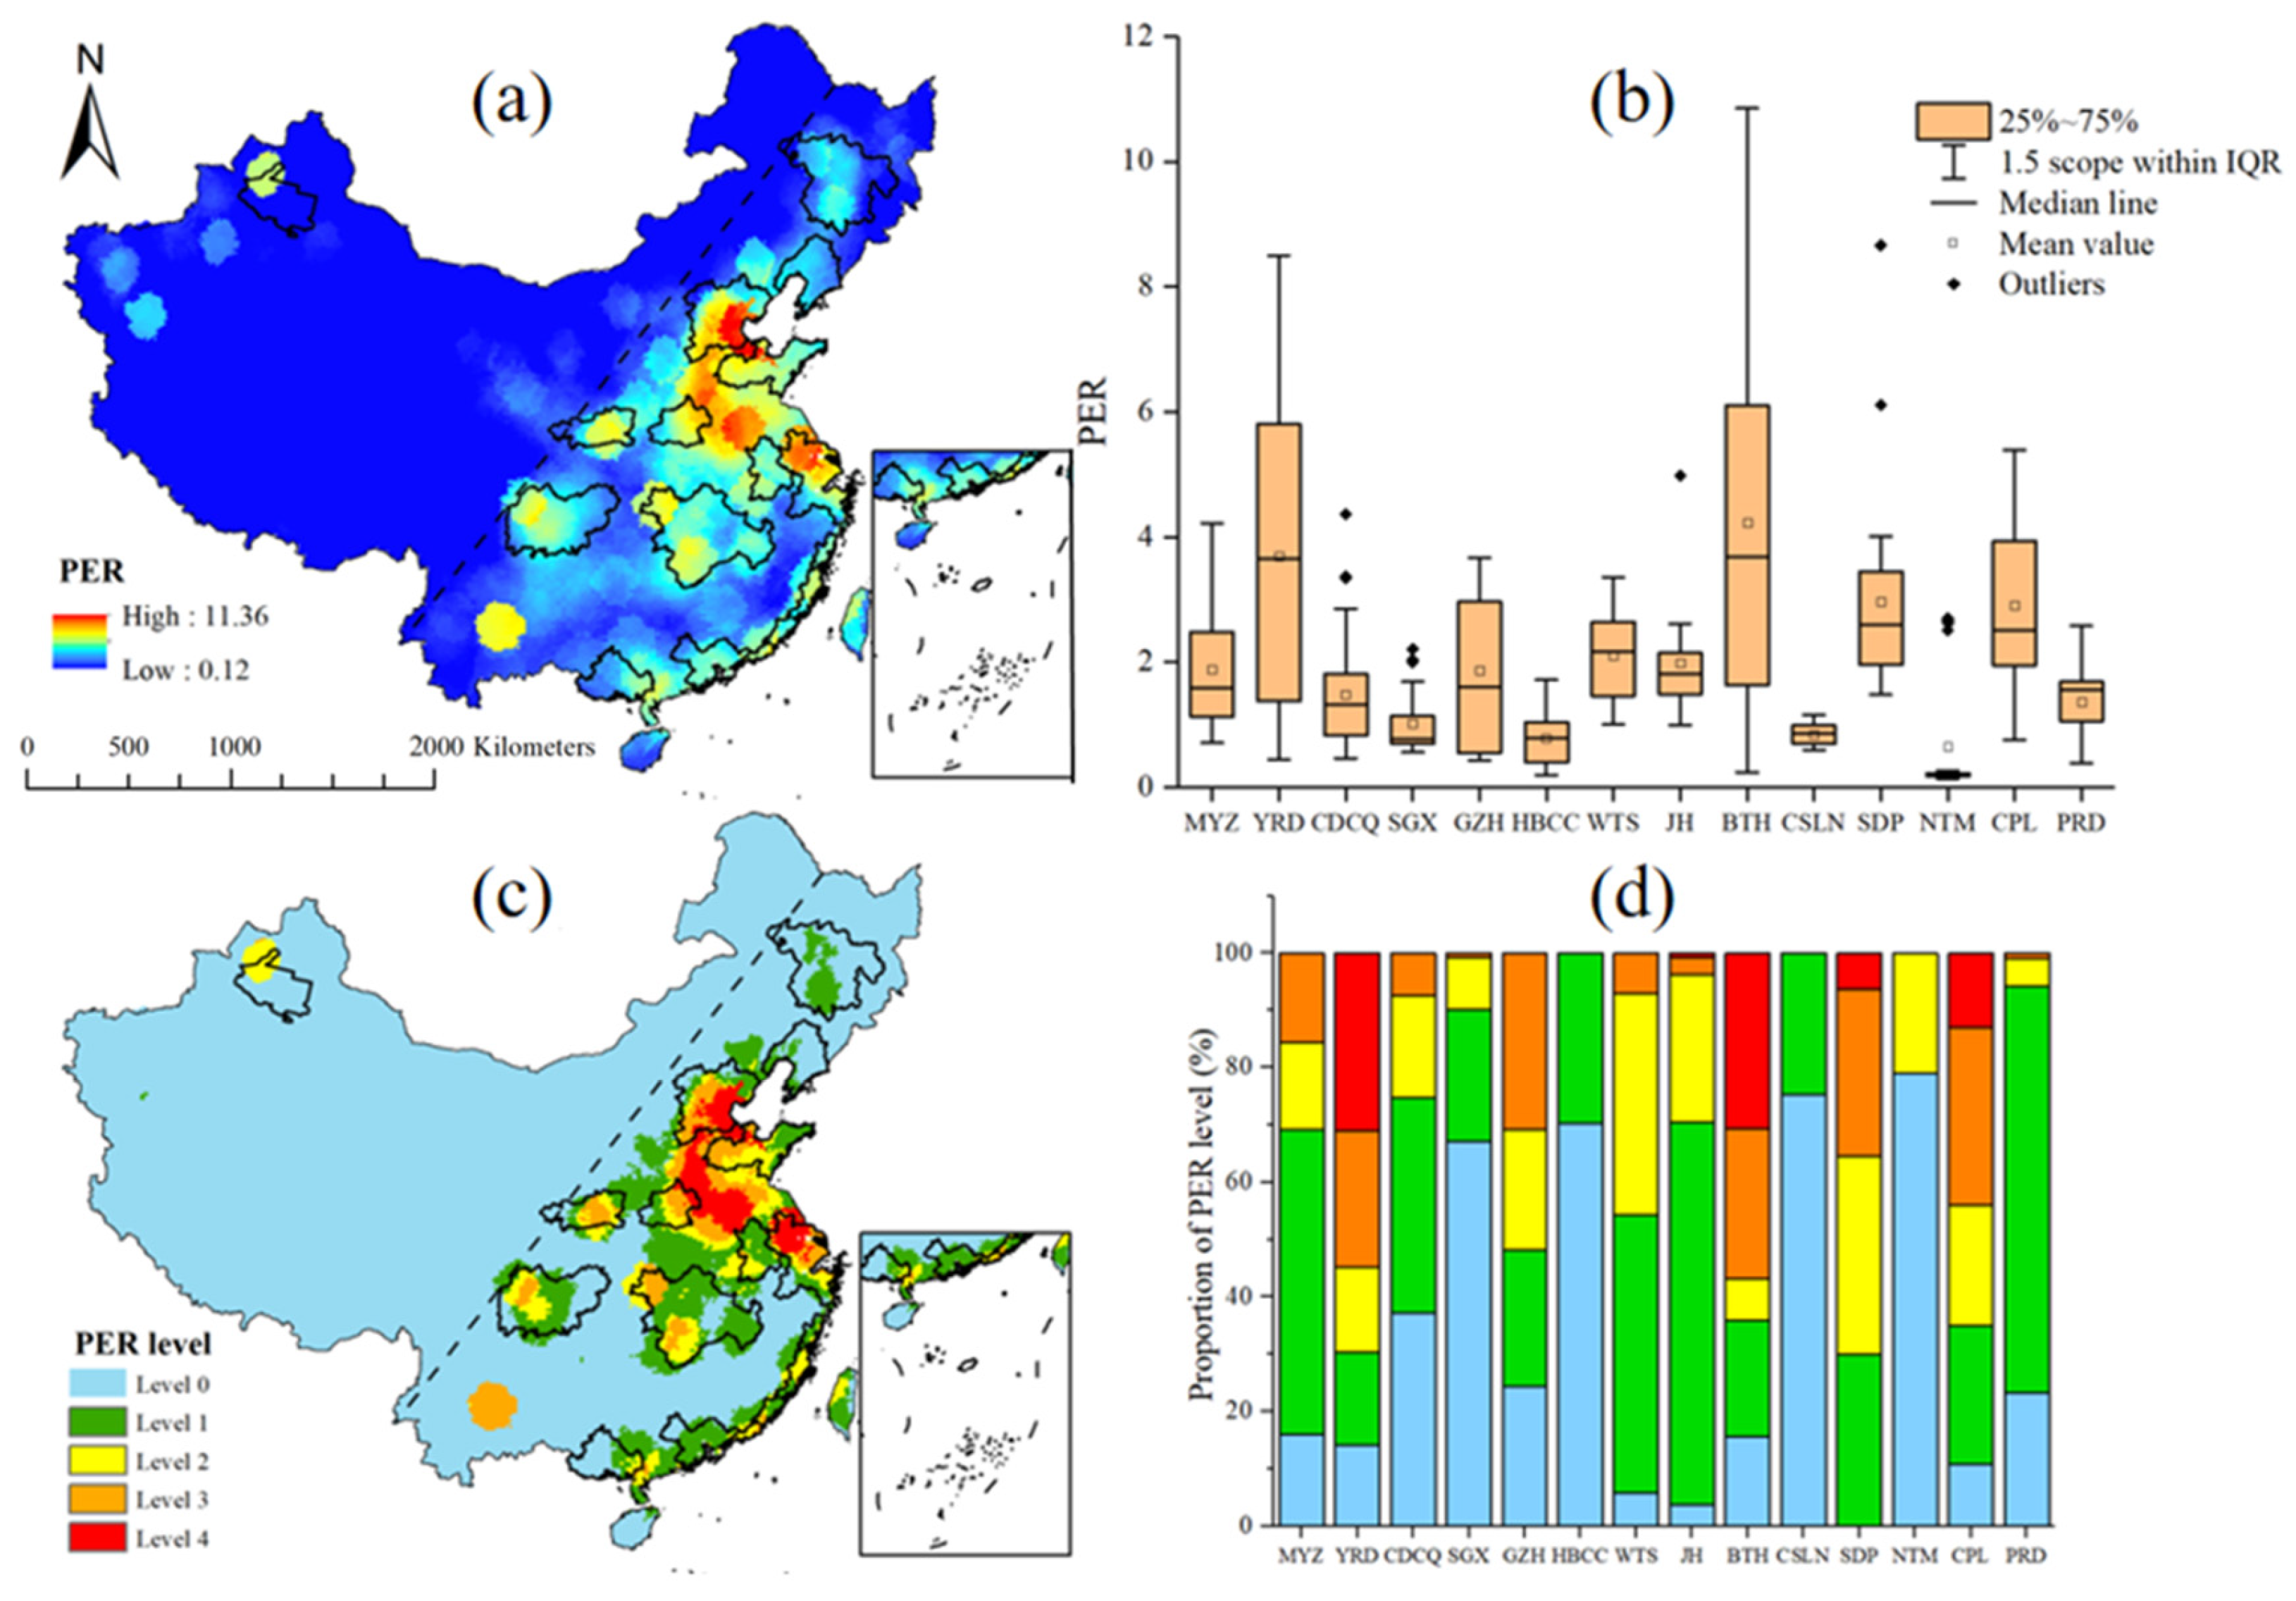
Since the PER from 2001 to 2020 was basically the same, the PER distribution pattern of China and urban agglomerations was analyzed by using the PER in 2020 (Figure 8). The PER east of the Hu Line was significantly higher than that west of the Hu Line, and the PER in the eastern coastal and central regions was higher (Figure 8a). Among the 14 urban agglomerations, the average PER was the highest in BTH (4.09), followed by YRD (3.75), SDP (2.91) and CPL (2.9), and the lowest in CSLN (0.85), HBCC (0.76) and NTM (0.71) (Figure 8b). The PER level east of the Hu Line was higher than that west of the Hu Line (Figure 8c). The PERs of urban agglomerations were higher than those of other regions. For 14 urban agglomerations, BTH, YRD, SDP and CPL have the highest risk level of PER, and level 3 and level 4 account for the largest proportion. SGX, CSLN, HBCC and NTM have the lowest risk level of PER, with the largest proportions at level 0, level 1 and level 2 (Figure 8d).
4. Discussion
4.1. Influencing Factors of the Evolution of PM2.5 Distribution
The distribution patterns of PM2.5 concentrations in China illustrated obvious regional differences. The general trend of PM2.5 distributions in China is high in the East and low in the West. PM2.5 concentration is closely related to urbanization level, energy use, production mode, population density, etc. [36,37,38]. From 2001 to 2010, PM2.5 in China rose rapidly, especially in eastern China [39]. Due to large population, energy consumption, frequent economic activities and rapid urbanization process, the PM2.5 concentration in eastern China maintained at a high level. Subsequently, the Chinese government realized the serious harm caused by PM2.5 and began to adopt a series of policies to reduce PM2.5 concentration to balance the relationship between economic development and pollution emissions [7].Therefore, PM2.5 concentrations in China began to decrease significantly, especially after 2013.Due to the dust transported by the Taklimakan Desert and the Kunlun Mountains block the northeast wind, the PM2.5 concentration in Taklimakan Desert in Xinjiang (yellow area in the Figure 4a) is unstable from 2001 to 2020 [40,41], therefore, the results showed an upward trend(p > 0.05).
Meanwhile, there were seasonal differences of PM2.5 concentrations in China. The PM2.5 concentrations in densely populated areas of North China were significantly higher than those in other areas. Due to the cold winter weather in northern China, coal-fired heating is an important pollution emission source, emitting a large amount of fine particulates, sulfides and nitrogen oxides [42]. In addition, straw burning in agricultural planting areas is also an important factor in seasonal PM2.5 pollution [43].
The outbreak of COVID-19 pandemic in 2020 has brought abnormal impact on the analysis of air quality. In different cities and regions in China, PM2.5 is significantly affected by COVID-19 [44]. In response to the epidemic, China has adopted the city closure policy, reducing human activities and some economic production, resulting in a decrease of PM2.5 concentration in some areas. Wuhan, the most severely affected city, was blocked for 76 days, and the PM2.5 concentration decreased by 35% compared with the same period in previous years [45]. However, the closure of the city does not strictly mean the reduction of pollution, which may cause a significant impact on the short-term air pollution [46]. For example, during the COVID-19 blockade, severe haze still occurred in northern China due to high relative humidity and poor air [47]. Other factors such as transportation and secondary pollution offset the reduction of PM2.5 concentration [48].
Meteorology is an important factor affecting PM2.5 pollution. PM2.5 is negatively correlated with daily temperature, relative humidity, precipitation and wind speed, and positively correlated with atmospheric pressure [49]. However, atmospheric circulation is conducive to the dissipation of PM2.5 [50]. At the same time, PM2.5 concentration is affected by traffic. The most important local factor causing air pollution is the exhaust gas emitted by road vehicles, especially heavy diesel powered vehicles [51]. In addition, tire wear, road dust resuspension, traffic facilities area, road width and length also affect PM2.5 concentration [52,53,54].
4.2. Exposure Risk Characteristics and Evaluation Methods
Two methods based on exceedance frequency and population weight were used to evaluate the exposure risk in China. For RER, all of China was at a high-risk level, with an annual average of 0.75, while the average of 14 urban agglomerations was as high as 0.86. The RER in China has obvious seasonality; the most serious occurs in winter and the least serious in summer. The PERs of PM2.5 east of the Hu Line were obviously higher than those west of the Hu Line. The PER of urban agglomeration was higher, and that of other regions was at a lower level. The great differences in PER distribution patterns are mainly due to the dense population in the east and sparse population in the west in China [55].
RER and PER have both advantages and disadvantages in assessing the exposure risks of air pollution. RER provides a better understanding and a better basis for the spatial management of pollution prevention. Due to the vulnerability of air pollutants to climate, PM2.5 in a certain area may vary greatly in different years [56]. This study uses 20 years of data to calculate the multiyear cumulative RER to provide a long-term mechanism for formulating management strategies to improve air quality as additional information beyond the widely accepted global disease burden research [57]. However, RER ignores the uneven spatial distribution of the population, which makes it difficult to reflect the difference in exposure risk in areas with different population densities under the same PM2.5 concentration [58]. And many previous studies revealed that the severity of PM2.5 pollution is closely related to population density [59]. PER considers the spatial distribution of the population and compares the exposure risks in different regions [60]. To assess the level of PM2.5 exposure risk, especially in specific regions, it is more appropriate to use PER which considering the population distribution [61]. Therefore, due to the uneven distribution of China’s population, PER seems to be a more appropriate method for assessing PM2.5 exposure risks in China.
4.3. Advantages and Limitations
Due to the development of remote sensing technology, high time resolution remote sensing products promote the application of environmental issue analysis. In this study, daily average PM2.5 concentration data were used to assess the seasonal variation in exposure risks. Moreover, the RER and PER were proposed to comprehensively evaluate the exposure risk of air pollution, and this assessment and analysis framework can avoid the deviation of risk estimation by a single index. Urban agglomerations are the areas with the most intense human activities, so the analysis of air pollution patterns and exposure risks of urban agglomerations in this study could provide scientific guidance to help cities alleviate air pollution and prevent residents’ exposure risks. The air pollution data obtained from fixed meteorological stations and mobile monitoring can better reflect the pollution distribution pattern and exposure risk [62,63]. However, due to the limited number of monitoring stations, the monitoring data based on stations cannot meet the spatial resolution requirements [64,65]. Due to the wide space and time coverage of satellite observations, remote sensing estimation of PM2.5 concentration is a powerful supplement to the limited ground observations [66], but may be different from the real pollutant concentration near the ground. Therefore, a model considering both monitoring station and satellite remote sensing data was a good choice [27]. The ChinaHighPM2.5 dataset used in this paper used the STET model, which contained auxiliary information about meteorological variables, land use, pollutant emissions and population [10,35]. Therefore, compared with previous studies, the data used in this paper were more accurate and the research results were much more reliable.
In addition to the advantages of the methods and results of air pollution exposure risk assessment described above, there are some shortcomings. Population mobility, such as the population distribution during the day and at night, annual population migration, and Spring Festival transportation, will bring considerable uncertainty about the exposure risks of air pollution [67]. However, it is very difficult to obtain real-time dynamic population data, and with the development of science and technology, big data could help in this regard, such as mobile phone signaling data and software location data [68,69].
In this study, only the influence of PM2.5 pollutant was considered, but there are other air pollutants that will cause adverse effects. China has a high incidence rate of asthma due to NO2 exposure [70]. SO2 will lead to the formation of haze, and increase the mortality and incidence rate of cardiopulmonary diseases [71]. In addition, there are atmospheric pollutants such as CO, CO2 and PM10, which also have a great impact on the environment and human health.
5. Conclusions
In this study, the PM2.5 remote sensing inversion data and population density data of China from 2001 to 2020 were used to explore the PM2.5 concentration distribution patterns and exposure risks. Regional and population exposure risks of PM2.5 based on exceedance frequency and population weight were proposed to evaluate the exposure risks in China and 14 urban agglomerations. The results indicated that the PM2.5 concentrations of urban agglomerations decreased sharply from 2014 to 2020. The region with PM2.5 concentrations less than 35 μg·m−3 accounted for 80.27% of the area of China, and the average PM2.5 concentrations in 8 urban agglomerations were less than 35 μg·m−3 in 2020. The spatial distribution patterns of PM2.5 concentrations in China were higher to the east of the Hu Line and lower to the west. The annual RER in China was at a high level, with a national average of 0.75, while the average of 14 urban agglomerations was as high as 0.86. Among the 14 urban agglomerations, the average annual RER was the highest in SDP (0.99), followed by CPL (0.98) and JH (0.97), and the lowest annual RERs were in WTS (0.79), HBCC (0.78) and NTM (0.76). The RER in China has obvious seasonality; the most serious was in winter, and the least serious was in summer. The PER east of the Hu Line was significantly higher than that west of the Hu Line, and the PER in the eastern coastal and central regions was higher. The average PER was the highest in BTH (4.09), followed by YRD (3.75), SDP (2.91) and CPL (2.9), and the lowest in CSLN (0.85), HBCC (0.76) and NTM (0.71). The analysis of air pollution patterns and exposure risks in China and urban agglomerations in this study could better provide scientific guidance to help cities alleviate air pollution, and reduce residents’ exposure risks.
Author Contributions
Conceptualization, J.S. and C.L.; methodology, J.S. and M.L.; software, Y.H.; writing—original draft preparation, J.S.; writing—review and editing, C.L. and W.W. All authors have read and agreed to the published version of the manuscript.
Funding
This research was funded by the National Natural Science Foundation of China, grant number (Nos. 41871192, 41730647 and 32071580) and the Youth Innovation Promotion Association of CAS, grant number (2021194).
Institutional Review Board Statement
Not applicable.
Informed Consent Statement
Not applicable.
Data Availability Statement
The data presented in this study are available on request from the corresponding author.
Conflicts of Interest
The authors declare no conflict of interest.
References
- Dong, F.; Li, J.; Li, K.; Sun, Z.; Yu, B.; Wang, Y.; Zhang, S. Causal chain of haze decoupling efforts and its action mechanism: Evidence from 30 provinces in China. J. Clean. Prod. 2020, 245, 118889. [Google Scholar] [CrossRef]
- Guan, X.; Wei, H.; Lu, S.; Dai, Q.; Su, H. Assessment on the urbanization strategy in China: Achievements, challenges and reflections. Habitat Int. 2018, 71, 97–109. [Google Scholar] [CrossRef]
- Wang, K.; Zhao, X.; Peng, B.; Zeng, Y. Can energy efficiency progress reduce PM2.5 concentration in China’s cities? Evidence from 105 key environmental protection cities in China, 2004–2015. J. Clean. Prod. 2021, 288, 125684. [Google Scholar] [CrossRef]
- Yan, D.; Lei, Y.; Shi, Y.; Zhu, Q.; Li, L.; Zhang, Z. Evolution of the spatiotemporal pattern of PM2.5 concentrations in China—A case study from the Beijing-Tianjin-Hebei region. Atmos. Environ. 2018, 183, 225–233. [Google Scholar] [CrossRef] [Green Version]
- Tan, S.H.; Roth, M.; Velasco, E. Particle exposure and inhaled dose during commuting in Singapore. Atmos. Environ. 2017, 170, 245–258. [Google Scholar] [CrossRef]
- Feng, L.; Liao, W. Legislation, plans, and policies for prevention and control of air pollution in China: Achievements, challenges, and improvements. J. Clean. Prod. 2016, 112, 1549–1558. [Google Scholar] [CrossRef]
- Gao, J.; Yuan, Z.; Liu, X.; Xia, X.; Huang, X.; Dong, Z. Improving air pollution control policy in China—A perspective based on cost–benefit analysis. Sci. Total. Environ. 2016, 543, 307–314. [Google Scholar] [CrossRef]
- Jiang, X.; Li, G.; Fu, W. Government environmental governance, structural adjustment and air quality: A quasi-natural experiment based on the Three-year Action Plan to Win the Blue Sky Defense War. J. Environ. Manag. 2021, 277, 111470. [Google Scholar] [CrossRef] [PubMed]
- Cheng, B.; Wang-Li, L.; Meskhidze, N.; Classen, J.; Bloomfield, P. Spatial and temporal variations of PM2.5 mass closure and inorganic PM2.5 in the Southeastern U.S. Environ. Sci. Pollut. Res. 2019, 26, 33181–33191. [Google Scholar] [CrossRef] [PubMed]
- Wei, J.; Li, Z.; Lyapustin, A.; Sun, L.; Peng, Y.; Xue, W.; Su, T.; Cribb, M. Reconstructing 1-km-resolution high-quality PM2.5 data records from 2000 to 2018 in China: Spatiotemporal variations and policy implications. Remote. Sens. Environ. 2021, 252, 112136. [Google Scholar] [CrossRef]
- Jin, N.; Li, J.; Jin, M.; Zhang, X. Spatiotemporal variation and determinants of population’s PM2.5 exposure risk in China, 1998–2017: A case study of the Beijing-Tianjin-Hebei region. Environ. Sci. Pollut. Res. 2020, 27, 31767–31777. [Google Scholar] [CrossRef] [PubMed]
- Wang, J.; Lu, X.; Yan, Y.; Zhou, L.; Ma, W. Spatiotemporal characteristics of PM2.5 concentration in the Yangtze River Delta urban agglomeration, China on the application of big data and wavelet analysis. Sci. Total. Environ. 2020, 724, 138134. [Google Scholar] [CrossRef] [PubMed]
- Huang, C.; Liu, K.; Zhou, L. Spatio-temporal trends and influencing factors of PM2.5 concentrations in urban agglomerations in China between 2000 and 2016. Environ. Sci. Pollut. Res. 2021, 28, 10988–11000. [Google Scholar] [CrossRef] [PubMed]
- Han, L.; Zhou, W.; Li, W. City as a major source area of fine particulate (PM2.5) in China. Environ. Pollut. 2015, 206, 183–187. [Google Scholar] [CrossRef] [PubMed]
- Hao, Y.; Liu, Y.-M. The influential factors of urban PM2.5 concentrations in China: A spatial econometric analysis. J. Clean. Prod. 2016, 112, 1443–1453. [Google Scholar] [CrossRef]
- Wang, Q.; Kwan, M.-P.; Zhou, K.; Fan, J.; Wang, Y.; Zhan, D. The impacts of urbanization on fine particulate matter (PM2.5) concentrations: Empirical evidence from 135 countries worldwide. Environ. Pollut. 2019, 247, 989–998. [Google Scholar] [CrossRef]
- Shi, K.; Wang, H.; Yang, Q.; Wang, L.; Sun, X.; Li, Y. Exploring the relationships between urban forms and fine particulate (PM2.5) concentration in China: A multi-perspective study. J. Clean. Prod. 2019, 231, 990–1004. [Google Scholar] [CrossRef]
- Wang, Z.-b.; Fang, C.-l. Spatial-temporal characteristics and determinants of PM2.5 in the Bohai Rim Urban Agglomeration. Chemosphere 2016, 148, 148–162. [Google Scholar] [CrossRef]
- Wu, Q.; Guo, R.; Luo, J.; Chen, C. Spatiotemporal evolution and the driving factors of PM2.5 in Chinese urban agglomerations between 2000 and 2017. Ecol. Indic. 2021, 125, 107491. [Google Scholar] [CrossRef]
- Xu, F.; Qiu, X.; Hu, X.; Shang, Y.; Pardo, M.; Fang, Y.; Wang, J.; Rudich, Y.; Zhu, T. Effects on IL-1β signaling activation induced by water and organic extracts of fine particulate matter (PM2.5) in vitro. Environ. Pollut. 2018, 237, 592–600. [Google Scholar] [CrossRef] [PubMed]
- Song, C.; He, J.; Wu, L.; Jin, T.; Chen, X.; Li, R.; Ren, P.; Zhang, L.; Mao, H. Health burden attributable to ambient PM2.5 in China. Environ. Pollut. 2017, 223, 575–586. [Google Scholar] [CrossRef] [PubMed]
- Kaiser, J. Mounting Evidence Indicts Fine-Particle Pollution. Science 2005, 307, 1858–1861. [Google Scholar] [CrossRef]
- Xu, M.-X.; Ge, C.-X.; Qin, Y.-T.; Gu, T.-T.; Lou, D.-S.; Li, Q.; Hu, L.-F.; Feng, J.; Huang, P.; Tan, J. Prolonged PM2.5 exposure elevates risk of oxidative stress-driven nonalcoholic fatty liver disease by triggering increase of dyslipidemia. Free. Radic. Biol. Med. 2019, 130, 542–556. [Google Scholar] [CrossRef]
- Liu, J.; Han, Y.; Tang, X.; Zhu, J.; Zhu, T. Estimating adult mortality attributable to PM2.5 exposure in China with assimilated PM2.5 concentrations based on a ground monitoring network. Sci. Total. Environ. 2016, 568, 1253–1262. [Google Scholar] [CrossRef]
- Liu, L.; Yan, Y.; Nazhalati, N.; Kuerban, A.; Li, J.; Huang, L. The effect of PM2.5 exposure and risk perception on the mental stress of Nanjing citizens in China. Chemosphere 2020, 254, 126797. [Google Scholar] [CrossRef]
- Wang, F.; Qiu, X.; Cao, J.; Peng, L.; Zhang, N.; Yan, Y.; Li, R. Policy-driven changes in the health risk of PM2.5 and O3 exposure in China during 2013–2018. Sci. Total. Environ. 2021, 757, 143775. [Google Scholar] [CrossRef]
- Song, Y.; Huang, B.; He, Q.; Chen, B.; Wei, J.; Mahmood, R. Dynamic assessment of PM2.5 exposure and health risk using remote sensing and geo-spatial big data. Environ. Pollut. 2019, 253, 288–296. [Google Scholar] [CrossRef]
- Fu, X.; Li, L.; Lei, Y.; Wu, S.; Yan, D.; Luo, X.; Luo, H. The economic loss of health effect damages from PM2.5 pollution in the Central Plains Urban Agglomeration. Environ. Sci. Pollut. Res. 2020, 27, 25434–25449. [Google Scholar] [CrossRef]
- Wang, H.; Gao, Z.; Ren, J.; Liu, Y.; Chang, L.T.-C.; Cheung, K.; Feng, Y.; Li, Y. An urban-rural and sex differences in cancer incidence and mortality and the relationship with PM2.5 exposure: An ecological study in the southeastern side of Hu line. Chemosphere 2019, 216, 766–773. [Google Scholar] [CrossRef]
- Chen, D.; Zhang, Y.; Yao, Y.; Hong, Y.; Guan, Q.; Tu, W. Exploring the spatial differentiation of urbanization on two sides of the Hu Huanyong Line—Based on nighttime light data and cellular automata. Appl. Geogr. 2019, 112, 102081. [Google Scholar] [CrossRef]
- Chen, M.; Gong, Y.; Li, Y.; Lu, D.; Zhang, H. Population distribution and urbanization on both sides of the Hu Huanyong Line: Answering the Premier’s question. J. Geogr. Sci. 2016, 26, 1593–1610. [Google Scholar] [CrossRef]
- Qi, W.; Liu, S.; Zhao, M.; Liu, Z. China’s different spatial patterns of population growth based on the “Hu Line”. J. Geogr. Sci. 2016, 26, 1611–1625. [Google Scholar] [CrossRef]
- Weixia, H.U.; Jiaming, L.I.U.; Ming, L.I. Exploration of substitute industry for Shanxi’s coal economy: On the path of key scenic spots propelling regional eco⁃ nomic development. China Popul. Resour. Environ. 2016, 26, 168–176. [Google Scholar]
- Fang, C. Important progress and future direction of studies on China’s urban agglomerations. J. Geogr. Sci. 2015, 25, 1003–1024. [Google Scholar] [CrossRef] [Green Version]
- Wei, J.; Li, Z.Q.; Cribb, M.; Huang, W.; Xue, W.H.; Sun, L.; Guo, J.P.; Peng, Y.R.; Li, J.; Lyapustin, A.; et al. Improved 1 km resolution PM2.5 estimates across China using enhanced space-time extremely randomized trees. Atmos. Chem. Phys. 2020, 20, 3273–3289. [Google Scholar] [CrossRef] [Green Version]
- Liu, H.; Cui, W.; Zhang, M. Exploring the causal relationship between urbanization and air pollution: Evidence from China. Sustain. Cities Soc. 2022, 80, 103783. [Google Scholar] [CrossRef]
- Liu, H.; Fang, C.; Zhang, X.; Wang, Z.; Bao, C.; Li, F. The effect of natural and anthropogenic factors on haze pollution in Chinese cities: A spatial econometrics approach. J. Clean. Prod. 2017, 165, 323–333. [Google Scholar] [CrossRef]
- Lyu, W.; Li, Y.; Guan, D.; Zhao, H.; Zhang, Q.; Liu, Z. Driving forces of Chinese primary air pollution emissions: An index decomposition analysis. J. Clean. Prod. 2016, 133, 136–144. [Google Scholar] [CrossRef] [Green Version]
- He, Q.; Gao, K.; Zhang, L.; Song, Y.; Zhang, M. Satellite-derived 1-km estimates and long-term trends of PM2.5 concentrations in China from 2000 to 2018. Environ. Int. 2021, 156, 106726. [Google Scholar] [CrossRef]
- He, W.; Meng, H.; Han, J.; Zhou, G.; Zheng, H.; Zhang, S. Spatiotemporal PM2.5 estimations in China from 2015 to 2020 using an improved gradient boosting decision tree. Chemosphere 2022, 296, 134003. [Google Scholar] [CrossRef]
- Wang, X.; Li, T.; Ikhumhen, H.O.; Sá, R.M. Spatio-temporal variability and persistence of PM2.5 concentrations in China using trend analysis methods and Hurst exponent. Atmos. Pollut. Res. 2022, 13, 101274. [Google Scholar] [CrossRef]
- Xu, Y.; Ying, Q.; Hu, J.; Gao, Y.; Yang, Y.; Wang, D.; Zhang, H. Spatial and temporal variations in criteria air pollutants in three typical terrain regions in Shaanxi, China, during 2015. Air Qual. Atmos. Health 2018, 11, 95–109. [Google Scholar] [CrossRef]
- Zhang, L.; Yang, L.; Bi, J.; Liu, Y.; Toriba, A.; Hayakawa, K.; Nagao, S.; Tang, N. Characteristics and unique sources of polycyclic aromatic hydrocarbons and nitro-polycyclic aromatic hydrocarbons in PM2.5 at a highland background site in northwestern China. Environ. Pollut. 2021, 274, 116527. [Google Scholar] [CrossRef]
- Zhao, Y.; Wang, L.; Huang, T.; Tao, S.; Liu, J.; Gao, H.; Luo, J.; Huang, Y.; Liu, X.; Chen, K.; et al. Unsupervised PM2.5 anomalies in China induced by the COVID-19 epidemic. Sci. Total. Environ. 2021, 795, 148807. [Google Scholar] [CrossRef]
- Chu, B.; Zhang, S.; Liu, J.; Ma, Q.; He, H. Significant concurrent decrease in PM2.5 and NO2 concentrations in China during COVID-19 epidemic. J. Environ. Sci. 2021, 99, 346–353. [Google Scholar] [CrossRef]
- Yang, K.; Wu, C.; Luo, Y. The impact of COVID-19 on urban PM2.5—Taking Hubei Province as an example. Environ. Pollut. 2022, 294, 118633. [Google Scholar] [CrossRef]
- Bai, Y.-Q.; Wang, Y.; Kong, S.-F.; Zhao, T.-L.; Zhi, X.-F.; Zheng, H.; Sun, X.-Y.; Hu, W.-Y.; Zhou, Y.; Xiong, J. Modelling the effect of local and regional emissions on PM2.5 concentrations in Wuhan, China during the COVID-19 lockdown. Adv. Clim. Chang. Res. 2021, 12, 871–880. [Google Scholar] [CrossRef]
- Wen, L.; Yang, C.; Liao, X.; Zhang, Y.; Chai, X.; Gao, W.; Guo, S.; Bi, Y.; Tsang, S.-Y.; Chen, Z.-F.; et al. Investigation of PM2.5 pollution during COVID-19 pandemic in Guangzhou, China. J. Environ. Sci. 2022, 115, 443–452. [Google Scholar] [CrossRef]
- Li, L.; Qian, J.; Ou, C.-Q.; Zhou, Y.-X.; Guo, C.; Guo, Y. Spatial and temporal analysis of Air Pollution Index and its timescale-dependent relationship with meteorological factors in Guangzhou, China, 2001–2011. Environ. Pollut. 2014, 190, 75–81. [Google Scholar] [CrossRef]
- Luo, Y.; Zhao, T.; Yang, Y.; Zong, L.; Kumar, K.R.; Wang, H.; Meng, K.; Zhang, L.; Lu, S.; Xin, Y. Seasonal changes in the recent decline of combined high PM2.5 and O3 pollution and associated chemical and meteorological drivers in the Beijing–Tianjin–Hebei region, China. Sci. Total. Environ. 2022, 838, 156312. [Google Scholar] [CrossRef]
- Brønnum-Hansen, H.; Bender, A.M.; Andersen, Z.J.; Sørensen, J.; Bønløkke, J.H.; Boshuizen, H.; Becker, T.; Diderichsen, F.; Loft, S. Assessment of impact of traffic-related air pollution on morbidity and mortality in Copenhagen Municipality and the health gain of reduced exposure. Environ. Int. 2018, 121, 973–980. [Google Scholar] [CrossRef]
- Amato, F.; Zandveld, P.; Keuken, M.; Jonkers, S.; Querol, X.; Reche, C.; Denier van der Gon, H.A.C.; Schaap, M. Improving the modeling of road dust levels for Barcelona at urban scale and street level. Atmos. Environ. 2016, 125, 231–242. [Google Scholar] [CrossRef]
- Lee, J.-H.; Wu, C.-F.; Hoek, G.; de Hoogh, K.; Beelen, R.; Brunekreef, B.; Chan, C.-C. LUR models for particulate matters in the Taipei metropolis with high densities of roads and strong activities of industry, commerce and construction. Sci. Total. Environ. 2015, 514, 178–184. [Google Scholar] [CrossRef]
- Luo, Z.; Wan, G.; Wang, C.; Zhang, X. Urban pollution and road infrastructure: A case study of China. China Econ. Rev. 2018, 49, 171–183. [Google Scholar] [CrossRef]
- Nam, K.-M. Is spatial distribution of China’s population excessively unequal? A cross-country comparison. Ann. Reg. Sci. 2017, 59, 453–474. [Google Scholar] [CrossRef]
- Zhao, S.Y.; Feng, T.; Tie, X.X.; Long, X.; Li, G.H.; Cao, J.J.; Zhou, W.J.; An, Z.S. Impact of Climate Change on Siberian High and Wintertime Air Pollution in China in Past Two Decades. Earths Future 2018, 6, 118–133. [Google Scholar] [CrossRef] [Green Version]
- Cohen, A.J.; Brauer, M.; Burnett, R. Estimates and 25-year trends of the global burden of disease attributable to ambient air pollution: An analysis of data from the Global Burden of Diseases Study 2015 (vol 389, pg 1907, 2017). Lancet 2018, 391, 1576. [Google Scholar] [CrossRef] [Green Version]
- Dong, J.; Wang, Y.; Wang, L.; Zhao, W.; Huang, C. Assessment of PM2.5 exposure risk towards SDG indicator 11.6.2—A case study in Beijing. Sustain. Cities Soc. 2022, 82, 103864. [Google Scholar] [CrossRef]
- He, Q.; Huang, B. Satellite-based high-resolution PM2.5 estimation over the Beijing-Tianjin-Hebei region of China using an improved geographically and temporally weighted regression model. Environ. Pollut. 2018, 236, 1027–1037. [Google Scholar] [CrossRef]
- Li, R.; Cui, L.; Meng, Y.; Zhao, Y.; Fu, H. Satellite-based prediction of daily SO2 exposure across China using a high-quality random forest-spatiotemporal Kriging (RF-STK) model for health risk assessment. Atmos. Environ. 2019, 208, 10–19. [Google Scholar] [CrossRef]
- Wang, H.; Li, J.; Gao, Z.; Yim, S.H.L.; Shen, H.; Ho, H.C.; Li, Z.; Zeng, Z.; Liu, C.; Li, Y.; et al. High-Spatial-Resolution Population Exposure to PM2.5 Pollution Based on Multi-Satellite Retrievals: A Case Study of Seasonal Variation in the Yangtze River Delta, China in 2013. Remote Sens. 2019, 11, 2724. [Google Scholar] [CrossRef] [Green Version]
- Song, R.-f.; Wang, D.-s.; Li, X.-b.; Li, B.; Peng, Z.-r.; He, H.-d. Characterizing vertical distribution patterns of PM2.5 in low troposphere of Shanghai city, China: Implications from the perspective of unmanned aerial vehicle observations. Atmos. Environ. 2021, 265, 118724. [Google Scholar] [CrossRef]
- Li, C.; Liu, M.; Hu, Y.; Zhou, R.; Huang, N.; Wu, W.; Liu, C. Spatial distribution characteristics of gaseous pollutants and particulate matter inside a city in the heating season of Northeast China. Sustain. Cities Soc. 2020, 61, 102302. [Google Scholar] [CrossRef]
- Jerrett, M.; Turner Michelle, C.; Beckerman Bernardo, S.; Pope, C.A.; van Donkelaar, A.; Martin Randall, V.; Serre, M.; Crouse, D.; Gapstur Susan, M.; Krewski, D.; et al. Comparing the Health Effects of Ambient Particulate Matter Estimated Using Ground-Based versus Remote Sensing Exposure Estimates. Environ. Health Perspect. 2017, 125, 552–559. [Google Scholar] [CrossRef] [Green Version]
- Miao, C.; Yu, S.; Hu, Y.; Bu, R.; Qi, L.; He, X.; Chen, W. How the morphology of urban street canyons affects suspended particulate matter concentration at the pedestrian level: An in-situ investigation. Sustain. Cities Soc. 2020, 55, 102042. [Google Scholar] [CrossRef]
- He, Q.; Zhang, M.; Song, Y.; Huang, B. Spatiotemporal assessment of PM2.5 concentrations and exposure in China from 2013 to 2017 using satellite-derived data. J. Clean. Prod. 2021, 286, 124965. [Google Scholar] [CrossRef]
- Setton, E.; Marshall, J.D.; Brauer, M.; Lundquist, K.R.; Hystad, P.; Keller, P.; Cloutier-Fisher, D. The impact of daily mobility on exposure to traffic-related air pollution and health effect estimates. J. Expo. Sci. Environ. Epidemiol. 2011, 21, 42–48. [Google Scholar] [CrossRef] [Green Version]
- Dewulf, B.; Neutens, T.; Lefebvre, W.; Seynaeve, G.; Vanpoucke, C.; Beckx, C.; Van de Weghe, N. Dynamic assessment of exposure to air pollution using mobile phone data. Int. J. Health Geogr. 2016, 15, 14. [Google Scholar] [CrossRef] [Green Version]
- Rout, A.; Nitoslawski, S.; Ladle, A.; Galpern, P. Using smartphone-GPS data to understand pedestrian-scale behavior in urban settings: A review of themes and approaches. Comput. Environ. Urban Syst. 2021, 90, 101705. [Google Scholar] [CrossRef]
- Wang, H.; Tang, R.; Liu, Y. Potential Health Benefit of NO2 Abatement in China’s Urban Areas: Inspirations for Source-specific Pollution Control Strategy. Lancet Reg. Health—West. Pac. 2022, 24, 100482. [Google Scholar] [CrossRef]
- Zhu, S.; Xia, L.; Wu, J.; Chen, S.; Chen, F.; Zeng, F.; Chen, X.; Chen, C.; Xia, Y.; Zhao, X.; et al. Ambient air pollutants are associated with newly diagnosed tuberculosis: A time-series study in Chengdu, China. Sci. Total. Environ. 2018, 631–632, 47–55. [Google Scholar] [CrossRef]
Figure 1.
China and 14 urban agglomerations. Abbreviations for the 14 urban agglomerations: Beijing-Tianjin-Hebei (BTH), Central and Southern Liaoning (CSLN), Harbin-Changchun (HBCC), Shandong Peninsula (SDP), Jianghuai (JH), Yangtze River Delta (YRD), Western Taiwan Straits (WTS), Middle Yangtze (MYZ), Pearl River Delta (PRD), Southern Guangxi (SGX), Chengdu-Chongqing (CDCQ), Guanzhong (GZH), Central Plains (CPL) and Northern Tianshan Mountains (NTM).

Figure 2.
Temporal and spatial distribution patterns of annual average PM2.5 concentrations in 5 representative years in China.
Figure 2.
Temporal and spatial distribution patterns of annual average PM2.5 concentrations in 5 representative years in China.

Figure 3.
Temporal and spatial patterns of PM2.5 concentrations from 2001 to 2020. (a) Area proportion of 4 categories of PM2.5 concentrations in China; (b) average concentrations of PM2.5 in 14 urban agglomerations.
Figure 3.
Temporal and spatial patterns of PM2.5 concentrations from 2001 to 2020. (a) Area proportion of 4 categories of PM2.5 concentrations in China; (b) average concentrations of PM2.5 in 14 urban agglomerations.

Figure 4.
Spatial distribution patterns of the PM2.5 trend in China and 14 urban agglomerations. (a) Distribution of trend and significance in China and 14 urban agglomerations; (b) area proportion of 4 categories of PM2.5 trend in China; (c) area proportion of 4 categories of PM2.5 trend in 14 urban agglomerations.

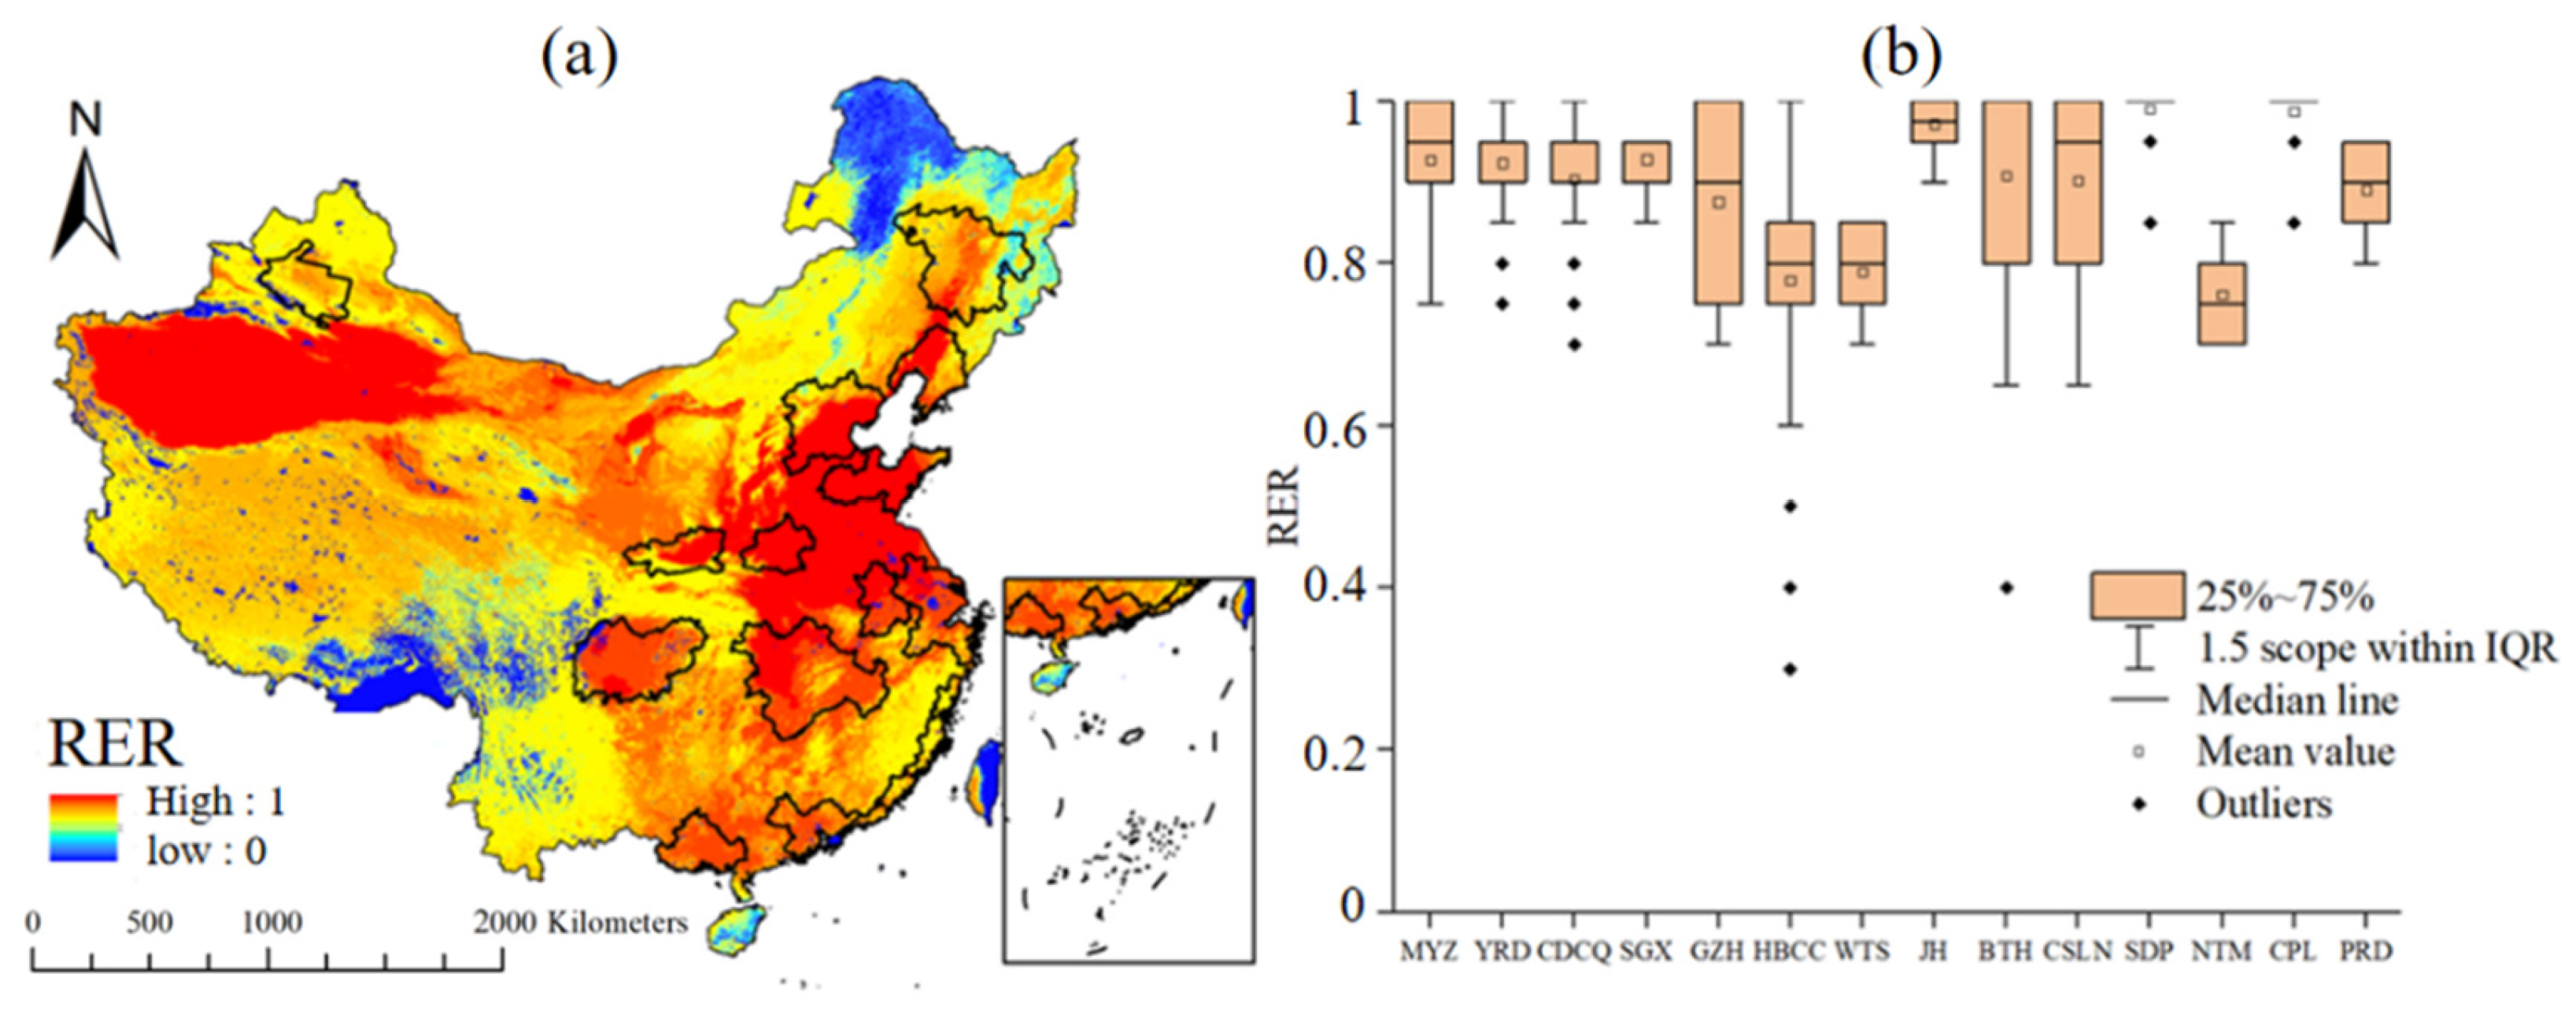
Figure 5.
Regional exposure risks of PM2.5 concentrations in China and 14 urban agglomerations. (a) Distribution of regional exposure risks in China and 14 urban agglomerations; (b) regional exposure risks of 14 urban agglomerations.
Figure 5.
Regional exposure risks of PM2.5 concentrations in China and 14 urban agglomerations. (a) Distribution of regional exposure risks in China and 14 urban agglomerations; (b) regional exposure risks of 14 urban agglomerations.

Figure 6.
Regional exposure risk of PM2.5 concentrations in each season in 2020.

Figure 7.
Population exposure risks of PM2.5 in China and 14 urban agglomerations from 2001 to 2020.
Figure 7.
Population exposure risks of PM2.5 in China and 14 urban agglomerations from 2001 to 2020.

Figure 8.
Distribution and classification of population exposure risks of PM2.5 in 2020. (a) Population exposure risks in China and 14 urban agglomerations in 2020; (b) population exposure risks of 14 urban agglomerations; (c) population exposure risk classification in China and 14 urban agglomerations in 2020; (d) area proportion of population exposure risk in five levels of urban agglomerations.


Table 1.
Characteristics of two stages of PM2.5 concentrations in 14 urban agglomerations from 2001 to 2020.
Table 1.
Characteristics of two stages of PM2.5 concentrations in 14 urban agglomerations from 2001 to 2020.
| Regions | PM2.5 in 2001 (μg·m−3) | PM2.5 in 2014 (μg·m−3) | PM2.5 in 2020 (μg·m−3) | Average Change from 2001 to 2014 (μg·m−3) | Average Change from 2015 to 2020 (μg·m−3) |
|---|---|---|---|---|---|
| MYZ | 70.14 | 71.08 | 31.54 | 0.07 | −5.65 |
| PRD | 65.20 | 65.62 | 29.37 | 0.03 | −5.18 |
| CDCQ | 68.12 | 73.34 | 30.36 | 0.37 | −6.14 |
| SGX | 59.40 | 59.95 | 24.71 | 0.04 | −5.03 |
| GZH | 64.36 | 67.48 | 35.07 | 0.22 | −4.63 |
| HBCC | 43.87 | 55.12 | 32.05 | 0.80 | −3.30 |
| WTS | 45.33 | 50.31 | 19.71 | 0.36 | −4.37 |
| JH | 73.25 | 73.60 | 35.30 | 0.02 | −5.47 |
| BTH | 65.60 | 73.37 | 39.07 | 0.56 | −4.90 |
| CSLN | 48.82 | 58.29 | 35.20 | 0.68 | −3.30 |
| SDP | 69.48 | 76.47 | 43.67 | 0.50 | −4.69 |
| NTM | 54.89 | 46.77 | 31.11 | −0.58 | −2.24 |
| CPL | 77.62 | 81.15 | 48.26 | 0.25 | −4.70 |
| PRD | 55.76 | 54.08 | 21.90 | −0.12 | −4.60 |
| Average | 60.83 | 65.08 | 32.99 | 0.30 | −4.58 |
Publisher’s Note: MDPI stays neutral with regard to jurisdictional claims in published maps and institutional affiliations. |
© 2022 by the authors. Licensee MDPI, Basel, Switzerland. This article is an open access article distributed under the terms and conditions of the Creative Commons Attribution (CC BY) license (https://creativecommons.org/licenses/by/4.0/).
Share and Cite
MDPI and ACS Style
Song, J.; Li, C.; Liu, M.; Hu, Y.; Wu, W. Spatiotemporal Distribution Patterns and Exposure Risks of PM2.5 Pollution in China. Remote Sens. 2022, 14, 3173. https://0-doi-org.brum.beds.ac.uk/10.3390/rs14133173
AMA Style
Song J, Li C, Liu M, Hu Y, Wu W. Spatiotemporal Distribution Patterns and Exposure Risks of PM2.5 Pollution in China. Remote Sensing. 2022; 14(13):3173. https://0-doi-org.brum.beds.ac.uk/10.3390/rs14133173
Chicago/Turabian StyleSong, Jun, Chunlin Li, Miao Liu, Yuanman Hu, and Wen Wu. 2022. "Spatiotemporal Distribution Patterns and Exposure Risks of PM2.5 Pollution in China" Remote Sensing 14, no. 13: 3173. https://0-doi-org.brum.beds.ac.uk/10.3390/rs14133173
Note that from the first issue of 2016, this journal uses article numbers instead of page numbers. See further details here.