
Vegetation Dynamics and Their Influencing Factors in China from 1998 to 2019


1
College of Urban and Environmental Sciences, Northwest University, Xi’an 710127, China
2
Shaanxi Key Laboratory of Earth Surface System and Environmental Carrying Capacity, Northwest University, Xi’an 710127, China
3
School of Geographic and Oceanographic Sciences, Nanjing University, Nanjing 210023, China
*
Author to whom correspondence should be addressed.
Remote Sens. 2022, 14(14), 3390; https://0-doi-org.brum.beds.ac.uk/10.3390/rs14143390
Submission received: 28 March 2022
/
Revised: 6 July 2022
/
Accepted: 12 July 2022
/
Published: 14 July 2022
(This article belongs to the Special Issue Remote Sensing for Climate Extremes and Water Resources)
Abstract
:Vegetation is a critical component of ecosystems that is influenced by climate change and human activities. It is therefore of great importance to investigate trends in vegetation dynamics and explore how these are influenced by climate and human activities. This will help formulate effective ecological restoration policies and ensure sustainable development. As the Normalized Difference Vegetation Index (NDVI) is strongly correlated with vegetation dynamics and may be used as a proxy measure for vegetation condition, the spatiotemporal characteristics of NDVI derived from SPOT/VEGETATION NDVI data in China over the 1998–2019 period were assessed using the Mann–Kendall test and the Hurst exponent. The Pearson correlation analysis and residual analysis methods were employed to analyze the influencing factors of NDVI dynamics. Integrating the results of the Hurst exponent and the NDVI trend analysis, it was found that the majority area of China is presenting an increasing NDVI trend at present but is likely to reverse in the future. A significant positive correlation between the NDVI and temperature was observed on the southeast coast of China and the north Qinghai–Tibet Plateau. Precipitation was the dominant factor affecting vegetation dynamics as indicated by a positive correlation with the NDVI for most parts of China except for the inland area in the Northwest and the Hengduan Mountains in Southwest China. Extreme temperature and extreme precipitation have also shown varying degrees of influence on vegetation dynamics at various locations. In addition, this study revealed trends of increasing NDVI, suggesting improved vegetation condition attributable to the implementation of ecological engineering projects. This study is helpful for studying the interaction mechanisms between terrestrial ecosystems and climate and for sustaining the ecological environment.
1. Introduction
Vegetation is an important component of terrestrial ecosystems, plays an irreplaceable role in the material circulation and energy flow of the terrestrial ecosystems [1,2,3,4], and constitutes a major guarantee for natural ecosystems and human production and life [5,6,7]. There are two important driving factors affecting vegetation dynamics, namely: (1) climate-related factors, such as temperature and precipitation [8,9,10,11], which provide necessary conditions for vegetation growth; and (2) disturbance factors caused by either human activities or the natural environment, such as land-use change, urbanization and forest development, forest fire, and plant pests and diseases [12,13,14,15]. The influence of climate on vegetation dynamics has long been proved [16]. Meanwhile, rational use of resources by humans may also improve regional ecological environmental quality by alleviating environmental pollution, improving energy consumption structure, or implementing large-scale green projects [17,18]. Many studies on the QTP have proved that ecological projects, such as the restoration of grasslands from farmlands and the establishment of national forests and nature reserves, can improve the regional ecological environment and promote an increase in vegetation condition [19,20,21].
Researchers have devoted considerable attention to vegetation responses to external disturbances worldwide [22,23,24,25]. Among all the driving factors that may influence vegetation growth, temperature and precipitation have been studied most frequently, and they are proved to be closely related to the changes of vegetation condition [26,27]. Many studies have proven the correlation between vegetation dynamics and climate variables for different regions [28,29,30]. In particular, a series of studies focused on studying vegetation variation and its response to climatic factors for different regions in China [31,32,33,34,35,36,37]. These studies provide useful insights into the spatial dynamics of vegetation and corresponding influencing mechanisms. Few studies [28,38,39], however, have been conducted at the national scale. While these studies mainly focused on the impact of climate and soil moisture on vegetation dynamics, other factors, such as anthropogenic factors [22] and climate extremes [37], were overlooked or remained unquantified. China is characterized by diverse vegetation types, complex ecological environments, and its vegetation status is strongly spatially heterogeneous due to the combined influence of many factors including not only the climate. Therefore, assessing the spatiotemporal vegetation dynamics in China and the response to not only the climate, but also climate extremes and human factors, is critical. This would be beneficial for maintaining terrestrial ecosystems under a changing environment.
Remote sensing techniques serve as an ideal tool for this purpose, providing the ability to capture the vegetation dynamics in response to climate shifts at high temporal resolutions over long time series [40,41,42,43]. The Normalized difference vegetation index (NDVI) has been widely used for studying vegetation dynamics, as it is a simple and effective proxy measure for vegetation condition (i.e., vegetation health, cover, and phenology) [39,44,45]. The most commonly used NDVI datasets are SPOT/VEGETATION NDVI, AVHRR NDVI, and MODIS NDVI [18,46]. Long time series of NDVI datasets acquired by satellite sensors, such as the SPOT/VEGETATION instrument and MODIS, have been used to monitor vegetation dynamics, detect land use/land cover change, vegetation mapping, and estimating net primary productivity for different regions [19,44,47]. Recently, an NDVI variation and its relationship with the changing climate have attracted a lot of attention [48,49]. NDVI time series data have been widely used to assess spatiotemporal dynamics of regional vegetation [50] in response to regional climates as well as human activities using multiple residual regression analysis [51,52]. Analyzing the vegetation condition variation allows us to determine the vegetation trend over a specific period and predict possible future directions [20]. The Hurst exponent is an effective method for measuring long-term memory of time series data to indicate future trends. It has been widely used in many fields, including meteorology and hydrology [50], and it has been widely used to predict vegetation trends [20,21,50,53].
In this study, we tried to conduct a most recent long-term (1998–2019) analysis on the spatiotemporal vegetation dynamics in China. Both the climate factors and anthropogenic factors were analyzed using a series of methods, including the Mann–Kendall (MK) trend test, the Pearson correlation analysis, residual trend analysis, and the Hurst exponent. The objectives include: (1) to analyze the temporal trend and spatial distribution of vegetation in China over the 1998–2019 period, which was determined according to data availability; and (2) to understand the mechanisms of climate and anthropogenic factors influencing vegetation dynamics in China over the period. It is hoped that this study could provide a comprehensive understanding of the vegetation dynamics and the corresponding driving factors of vegetation dynamics in China under a changing environment.
2. Study Area and Materials
2.1. Study Area
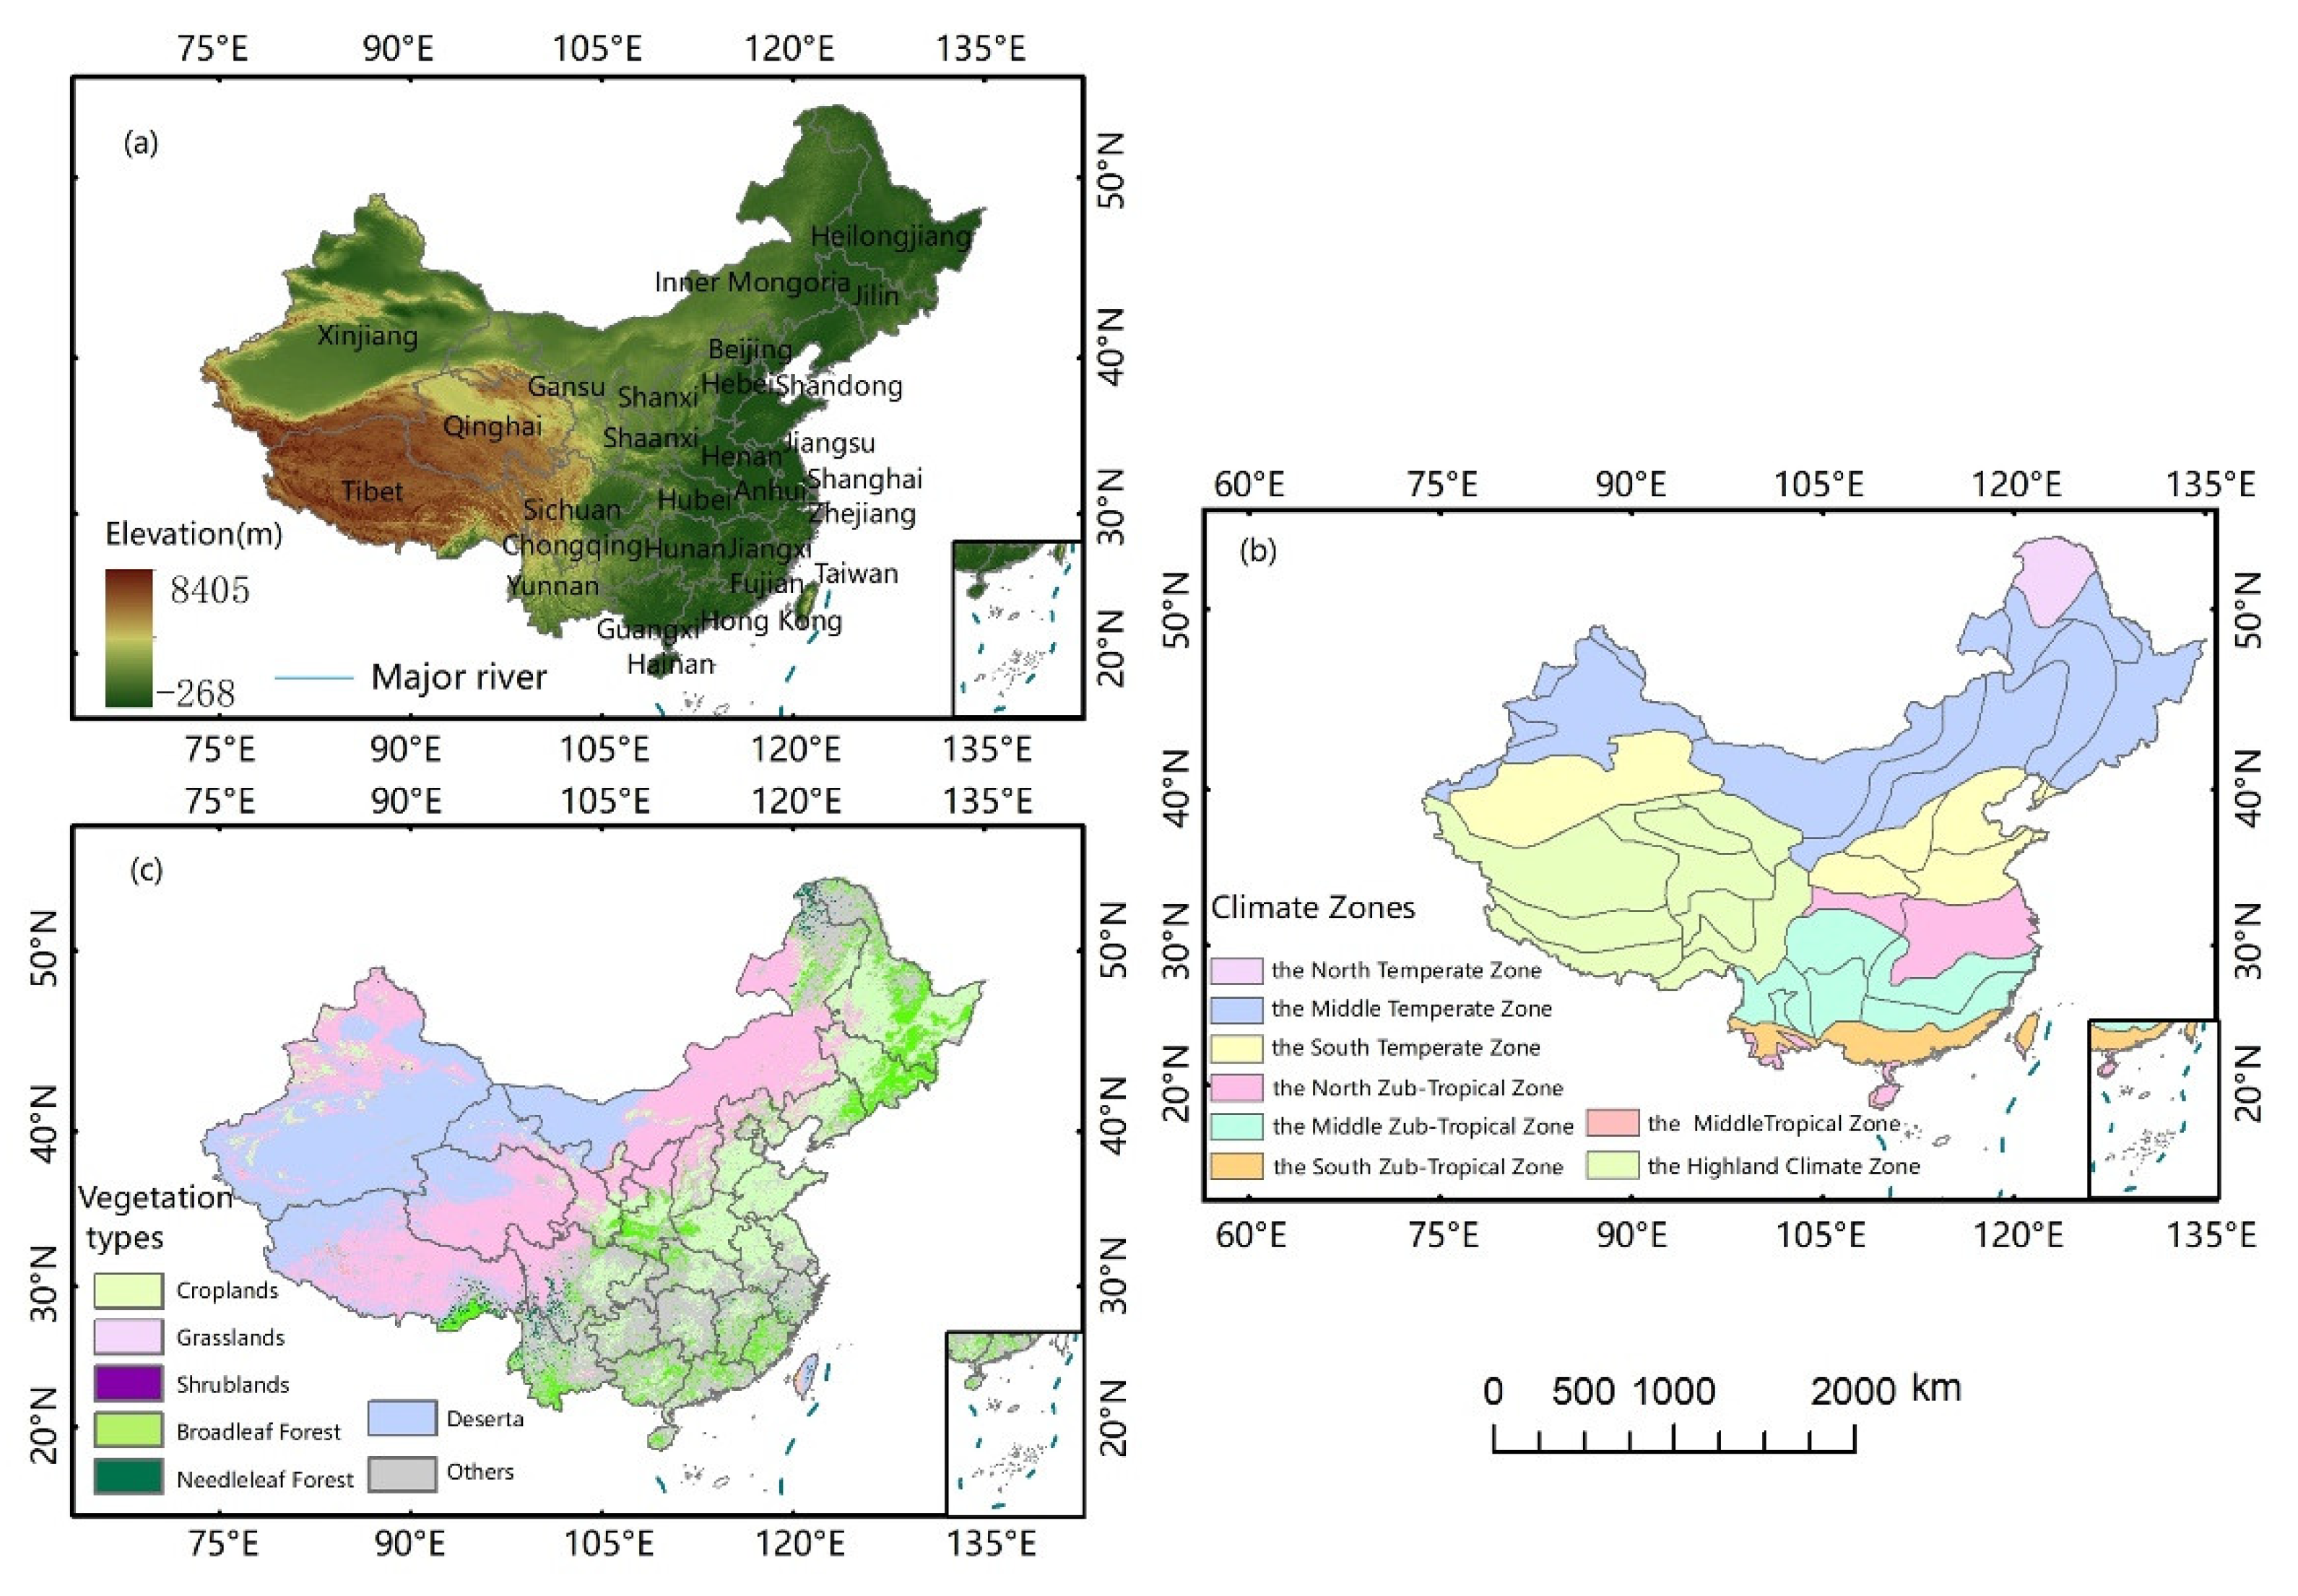
China has a land area of ~9.63 × 10⁶ km2, with a variety of topography and terrain types (Figure 1). There are complex combinations of temperature and precipitation and a variety of climate types, such as temperate continental, temperate monsoon, subtropical monsoon, tropical monsoon, and alpine climate. The high and low precipitation amounts are observed in summer and winter, respectively, with a large interannual variation. In addition, the annual precipitation varies considerably across regions, from 1600 mm on the southeast coast to less than 50 mm in many areas in the northwest inland area. The major vegetation types include grassland, cropland, evergreen broadleaf forest, deciduous broadleaf forest, and needleleaf forest [54].
2.2. Materials
2.2.1. NDVI Dataset
In this study, considering the data availability and popularity, we used the annual SPOT/VEGETATION NDVI satellite remote sensing dataset from 1998 to 2019 provided by the Resource and Environmental Science and Data Center (http://www.resdc.cn, accessed on 1 July 2021). It is an annual maximum NDVI product that has a spatial resolution of 1 km. According to [55], an NDVI value smaller than 0.2 was considered as non-vegetation.
2.2.2. Climate Dataset
Average annual temperature and precipitation data from 1998 to 2019 were collected from China’s surface climate daily data (V3.0) distributed by China Meteorological Data Network (http://cdc.cma.gov.cn/home.do, accessed on 1 May 2021). They were obtained from 832 meteorological stations and then interpolated to 1 km resolution using ANUSPLIN [56]. ANUSPLIN is commonly used in the field of meteorology for interpolation purposes [56], providing a tool for analyzing and interpolating multivariable data using a smooth spline function and conducting statistical analysis and data diagnosis.
2.2.3. Extreme Climate Dataset
An extreme climate dataset called HadEx3 (www.metoffice.gov.uk/hadobs/hadex3, accessed on 1 December 2020) was used in this study. It consists of 29 climate extremes indices (CEIs), calculated from about 7000 temperature stations and 17,000 precipitation stations worldwide and interpolated into a 1.875° longitude × 1.25° latitude global grid (~142.67 km × 159.38 km) [57]. These indices were developed by the World Meteorological Organization (WMO) Expert Team on Climate Change Detection and Indices (ETCCDI) [58]. The indices comprehensively reflect the frequency and intensity of extreme weather (precipitation and temperature) events, represent seasonal/annual values derived from daily station data, and have been widely used for studying climate extremes events [59,60]. Since this dataset has been only updated to 2018, this study only analyzes the correlation between climate extremes and NDVI from 1998–2018, resampled to 1 km resolution for assessing the impact of extreme climate factors on vegetation dynamics. Based on the spatial distribution of temperature and precipitation in the study area, six indices that accurately reflect the extreme temperature and extreme precipitation events in the study area, consisting of four extreme temperature indices and two extreme precipitation indices (Table 1), were selected to assess the correlation between vegetation and extreme climate indices in China.
2.2.4. Land Cover Dataset
The MODIS land cover type product (MCD12Q1) derived based on the International Geosphere-biosphere Program (IGBP) classification scheme was adopted for this study to indicate vegetation types [61]. The scheme defines 17 classes of land cover types, including a series of vegetation and non-vegetation classes. Therefore, the land cover was reclassified by aggregating similar vegetation classes and combining all other unconcerned classes into one. Finally, seven classes, including needleleaf forest, broadleaf forest, shrubland, grassland, croplands, deserta (desert vegetation), and others (see Figure 1c), were generated to analyze the vegetation dynamics under different vegetation types and their responses to climate factors. Transient of vegetation types is ignored to simplify the analysis, and only the 2019 classification data were used. However, when analyzing the human impact on vegetation dynamics, the whole time series of land cover (2001–2019) were used.
3. Methods
The Mann–Kendall (MK) trend test was first used to reveal the trend of vegetation dynamics in China from 1998 to 2019, then combined with the Hurst exponent to predict the future NDVI trend. The Pearson correlation analysis was used to assess the impacts of climate factors on vegetation growth and change. The residual trend analysis method [51,52] was used to quantify the impact of human activities on vegetation condition. Vegetation classification information extracted from the MODIS land cover dataset was employed to further analyze the differences in responses of vegetation types. The overall flowchart of methodology is shown in Figure 2.
3.1. Mann–Kendall Trend Analysis
The Mann–Kendall statistical test (MK) is a distribution-free test (non-parametric statistical test) [62]. This test can be used without data distribution requirements, thus the results are not affected by abnormal values [63,64]. To determine the significance of a trend, the standardized Z test statistic was first computed, then the standard normal distribution of the S statistic was calculated, using the following equation [65,66]:
where Xi and Xj are the ith and jth values in the time series, respectively; n is the length of the time series. S values greater or less than 0 indicate upward and downward trends of the time series, respectively.
If n ≥ 10, the statistic S approximates the standard normal distribution, and the Z-value can be used to test the trend, using the following equation:
where n is the number of data points; m is the number of repeated datasets; ti is the number of repeated data values in ith group.
At a given significance level, 95% (α = 0.05) for example, the threshold of the normal distribution is Z1–α/2 = 1.96. When |Z| > 1.96, the trend is significant, otherwise the trend is insignificant.
3.2. Hurst Exponent
The Hurst exponent (H) is a popular method used to describe the phenomenon of self-similarity and long-term dependence [67]. The Hurst exponent can be estimated using a series of methods. The most commonly used Rescaled Range Analysis (R/S) method, was adopted to calculate the Hurst exponent [19]. The calculation process of R/S can be found in [19], which was then employed to estimate H using a linear regression.
H is the Hurst exponent ranging from 0 to 1. It is classified as follows [42]: H < 0.5 indicates anti-persistency in the NDVI time series, and an opposite trend in the NDVI time series will occur in the future. For H = 0.5, the NDVI time series is a stochastic series without persistency, indicating that the trend in the future time series is unrelated to the study period. Finally, H > 0.5 indicates persistency of the NDVI time series, and the NDVI time series will have the same trend in the future.
3.3. Correlation Analysis
The relationships between the vegetation and temperature, precipitation, and extreme climate indices were evaluated using Pearson correlation analysis. A correlation coefficient greater than 0 indicates a positive correlation, while a correlation coefficient less than 0 indicates a negative correlation. A greater absolute value of the correlation coefficient indicates a closer correlation between the two variables. The P value was used to test the significance of the correlation coefficient between the two variables; p < 0.05 indicates a significant correlation coefficient at the 95% confidence level [21].
3.4. Residual Analysis
Residual analysis was used to determine and quantify the impact of human activities on vegetation dynamics [21,68]. This is achieved by eliminating the influence of precipitation and temperature on long-term NDVI variation, which is supposed to be affected by a combination of climate factors and human factors. Using the NDVI, temperature, and precipitation data observed over the last 22 years, a multiple linear regression model was established using the least square method.
The difference between the observed and predicted values of the NDVI was taken as the residual value of the NDVI (δ). It indicates the unexplained part in addition to the effect of temperature and precipitation on vegetation dynamics. In this study, we assume that human activities contribute the most to this part. Therefore, a positive δ value indicates that human activities are positively affecting vegetation condition change and promoting an increase in regional vegetation condition, while a negative δ value indicates that human activities are negatively affecting vegetation dynamics, reducing the vegetation condition. The trend of residuals was obtained using linear regression between residuals and years [69], which reflects how the vegetation condition has been affected by factors other than temperature and precipitation in the last 22 years.
4. Results
4.1. Spatio-Temporal Variations of Vegetation
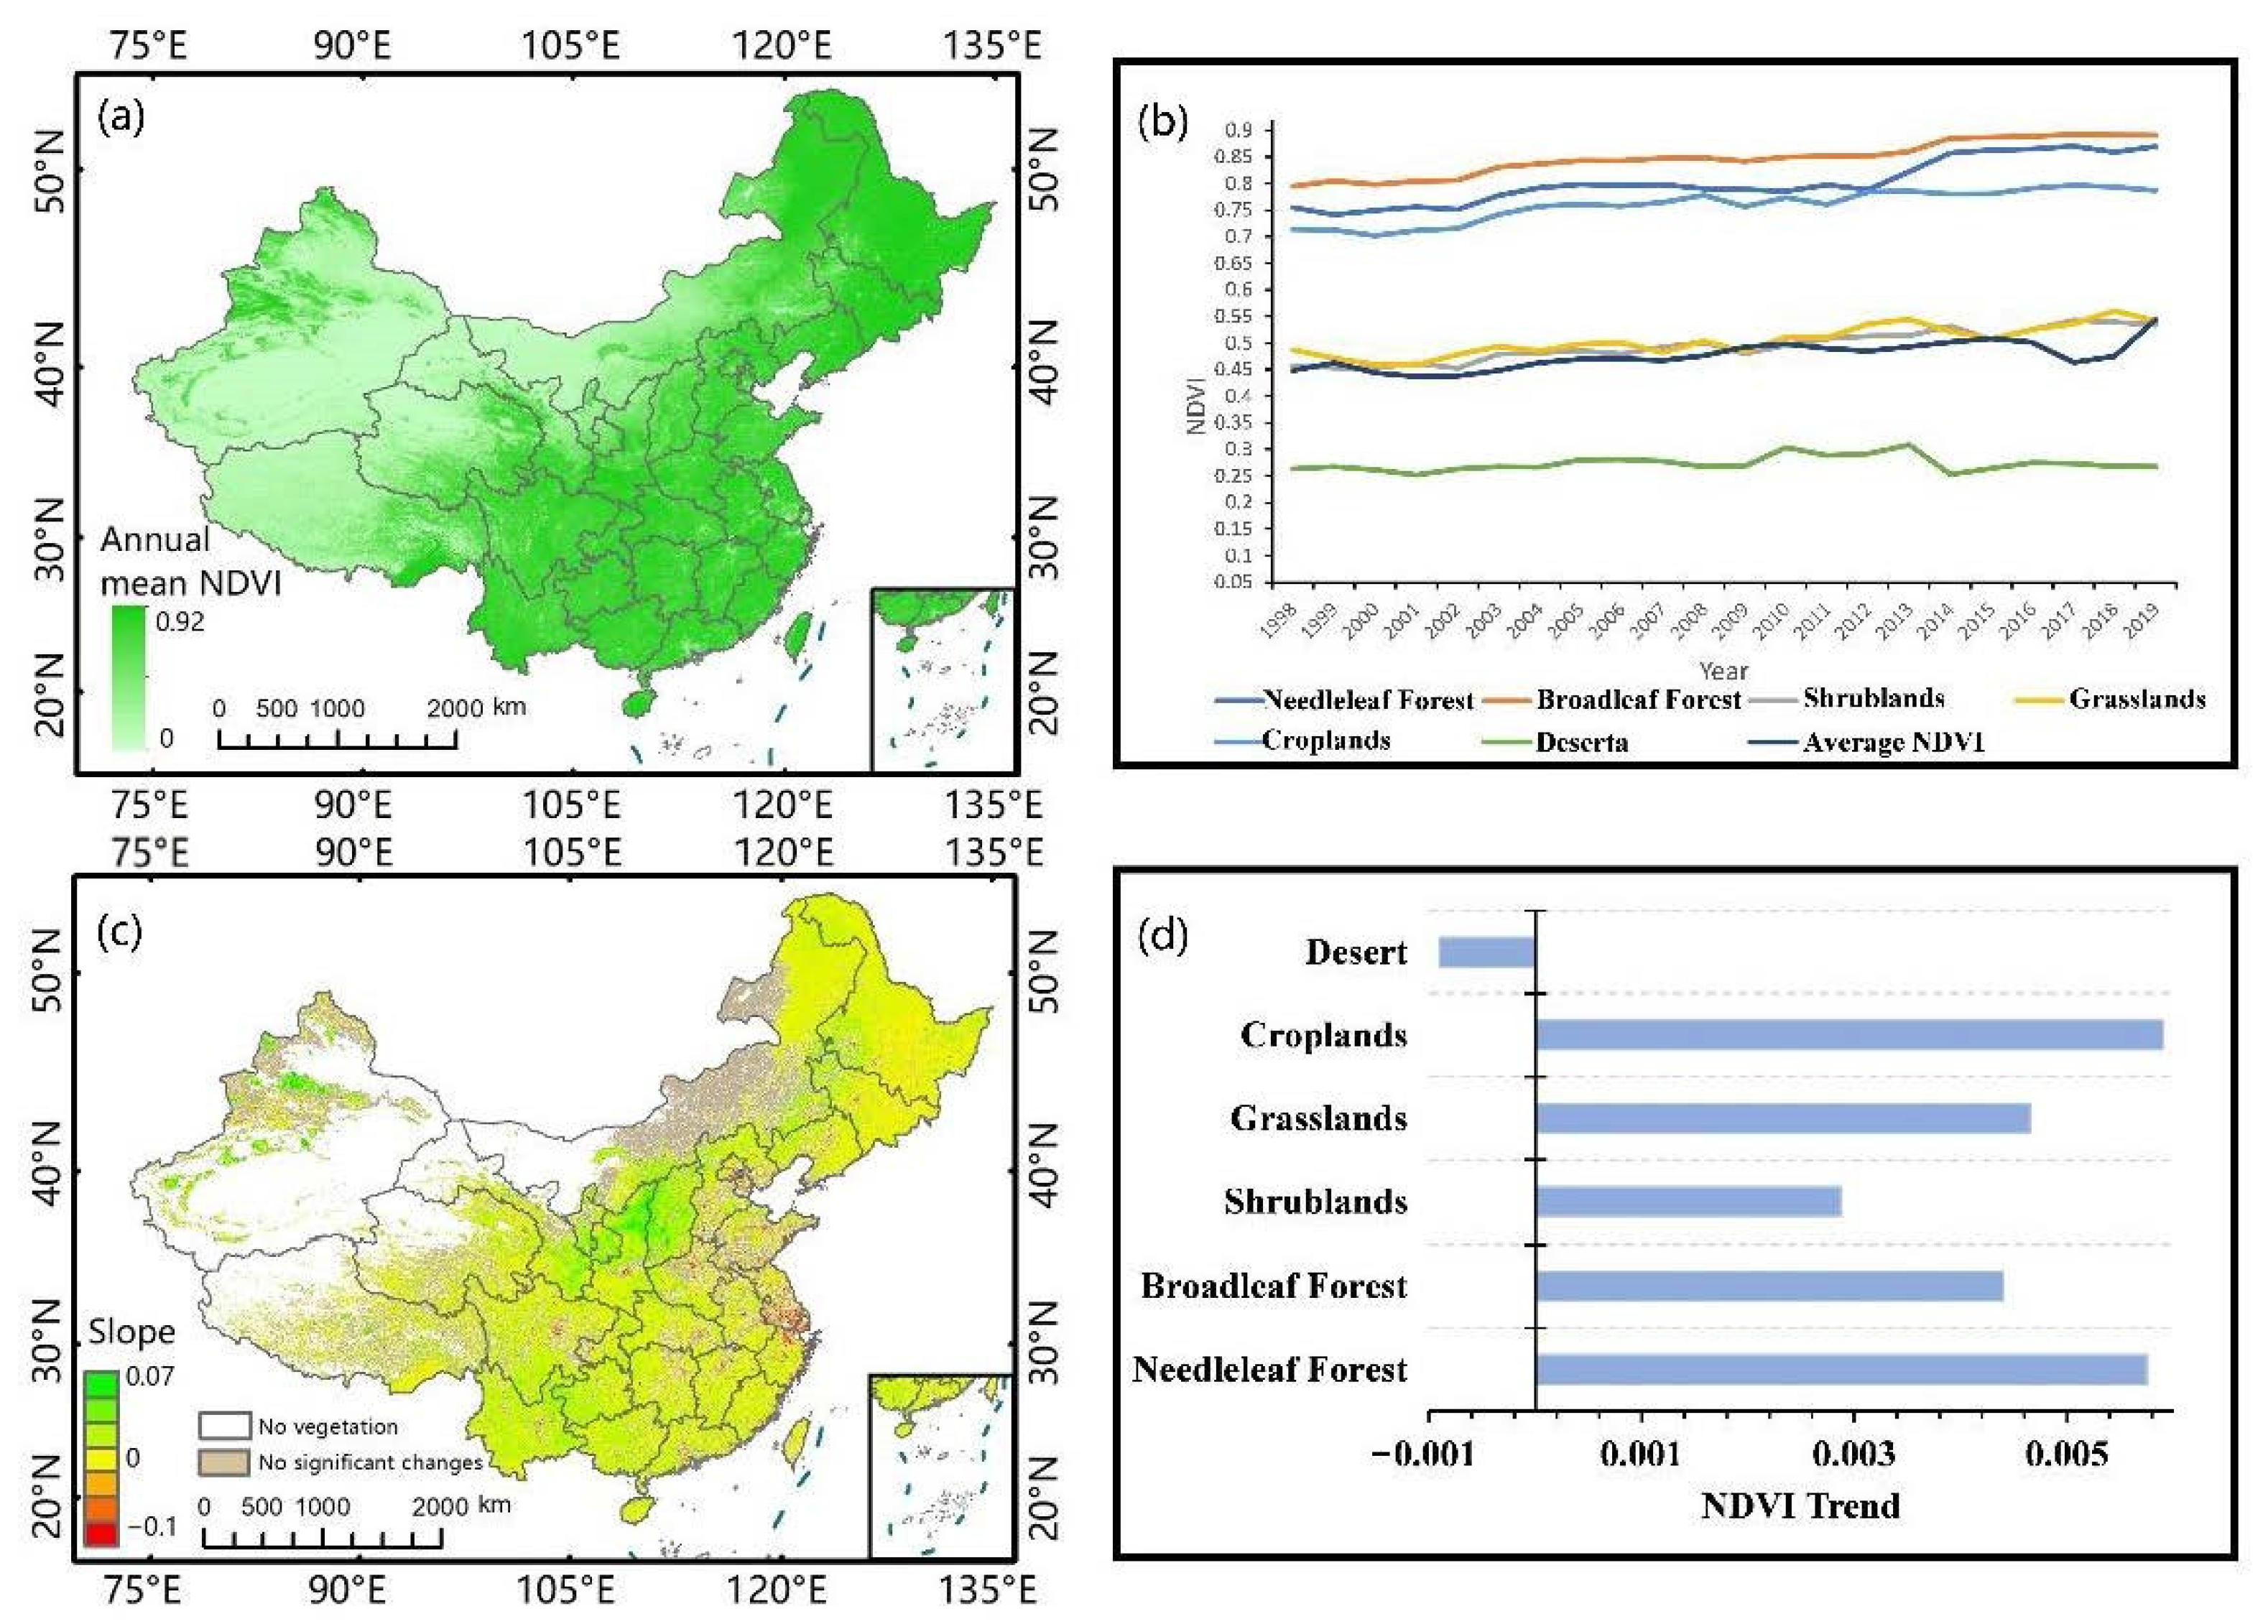
Figure 3a shows the annual average NDVI in China over the 1998–2019 period. The spatial patterns of the NDVI showed a decreasing trend from southeast to northwest. High NDVI values were observed in the eastern part of China, especially in the southeast coastal area. Since the climate in these areas is suitable for vegetation growth, the average NDVI value was more than 0.6, with the average NDVI in South China and Qinling areas going above 0.8. Areas with low vegetation condition occur mainly in Northwest China. The trend of annual average NDVI change was obtained by averaging annual NDVI values (Figure 3b). The annual average NDVI showed an overall increasing trend. Its value reached a minimum in 2017, followed by an upward trend. The NDVI for different vegetation types showed similar fluctuations with quite different NDVI values. The needleleaf/broadleaf forests and croplands have the highest NDVI, and the deserta has the lowest. The results of MK trend analysis (Figure 3c) showed overall increasing trends in the NDVI values in most areas. Some 67% of the surface area of China exhibited a significant upward trend, and 33% of the regions showed a slight downward trend. On the other hand, the areas with a slight downward trend in NDVI changes were mainly distributed in the Hengduan Mountains, the West Sichuan Basin, the Jungar Basin, around the Northeast Plain, and in economically developed cities, especially in the Yangtze River Delta.
The results of the change trends for different types of vegetation revealed some differences between vegetation types (Figure 3d). The NDVI change rate of deserta was negative, while the NDVI of other vegetation types showed an overall increasing trend, whose rates range from 0.0028~0.0064. Among them, the NDVI increase rate of needleleaf forest was the highest, except for those of croplands.
4.2. Future Trend of Vegetation Dynamics Based on the Hurst Exponent
Figure 4 shows the Hurst exponent of China’s annual average NDVI time series. The Hurst exponent values varied from 0.13 to 0.97. Taking 0.5 as the threshold, it was found that the regions where the NDVI trend was expected to remain consistent with the current state (0.5 < H < 1) account for 43.58% of the total area. Regions where the NDVI trend is expected to reverse (0 < H < 0.5) account for 56.42% of the total area. Overall, the anti-persistence of the NDVI changes nationwide was slightly stronger than the persistence, with persistence areas distributed sporadically. Areas with stronger anti-continuity mainly include the Qaidam Basin, the Jungar Basin, the Hengduan Mountains, the Eastern Loess Plateau/Inner Mongolia Plateau, and surrounding areas of the Northeast Plain.
We combine the results of trend analysis and results of the Hurst exponent to predict the sustainability of vegetation variations. Following [21], we set 0.05 as the significance level and used 20 > |Zc| > 1.96 as the reference range for significant increases or decreases. A value of H = 0.5 was used as a criterion to judge whether the change in the NDVI would continue in the same direction. Four different classes can be used for revealing future vegetation trends based on the sustainability of the current variation trend (Table 2): “reduction–increase trend” indicates that the NDVI is presenting a decreasing trend at present but likely to reverse in the future; “increase–reduction trend” indicates that the NDVI is presenting an increasing trend at present but likely to exhibit a decreasing trend in the future; “continuously increasing status” indicates that the NDVI is currently increasing and likely to exhibit an increasing trend in the future; and “continuously reducing status” indicates that the NDVI is currently decreasing and likely to exhibit a decreasing trend in the future.
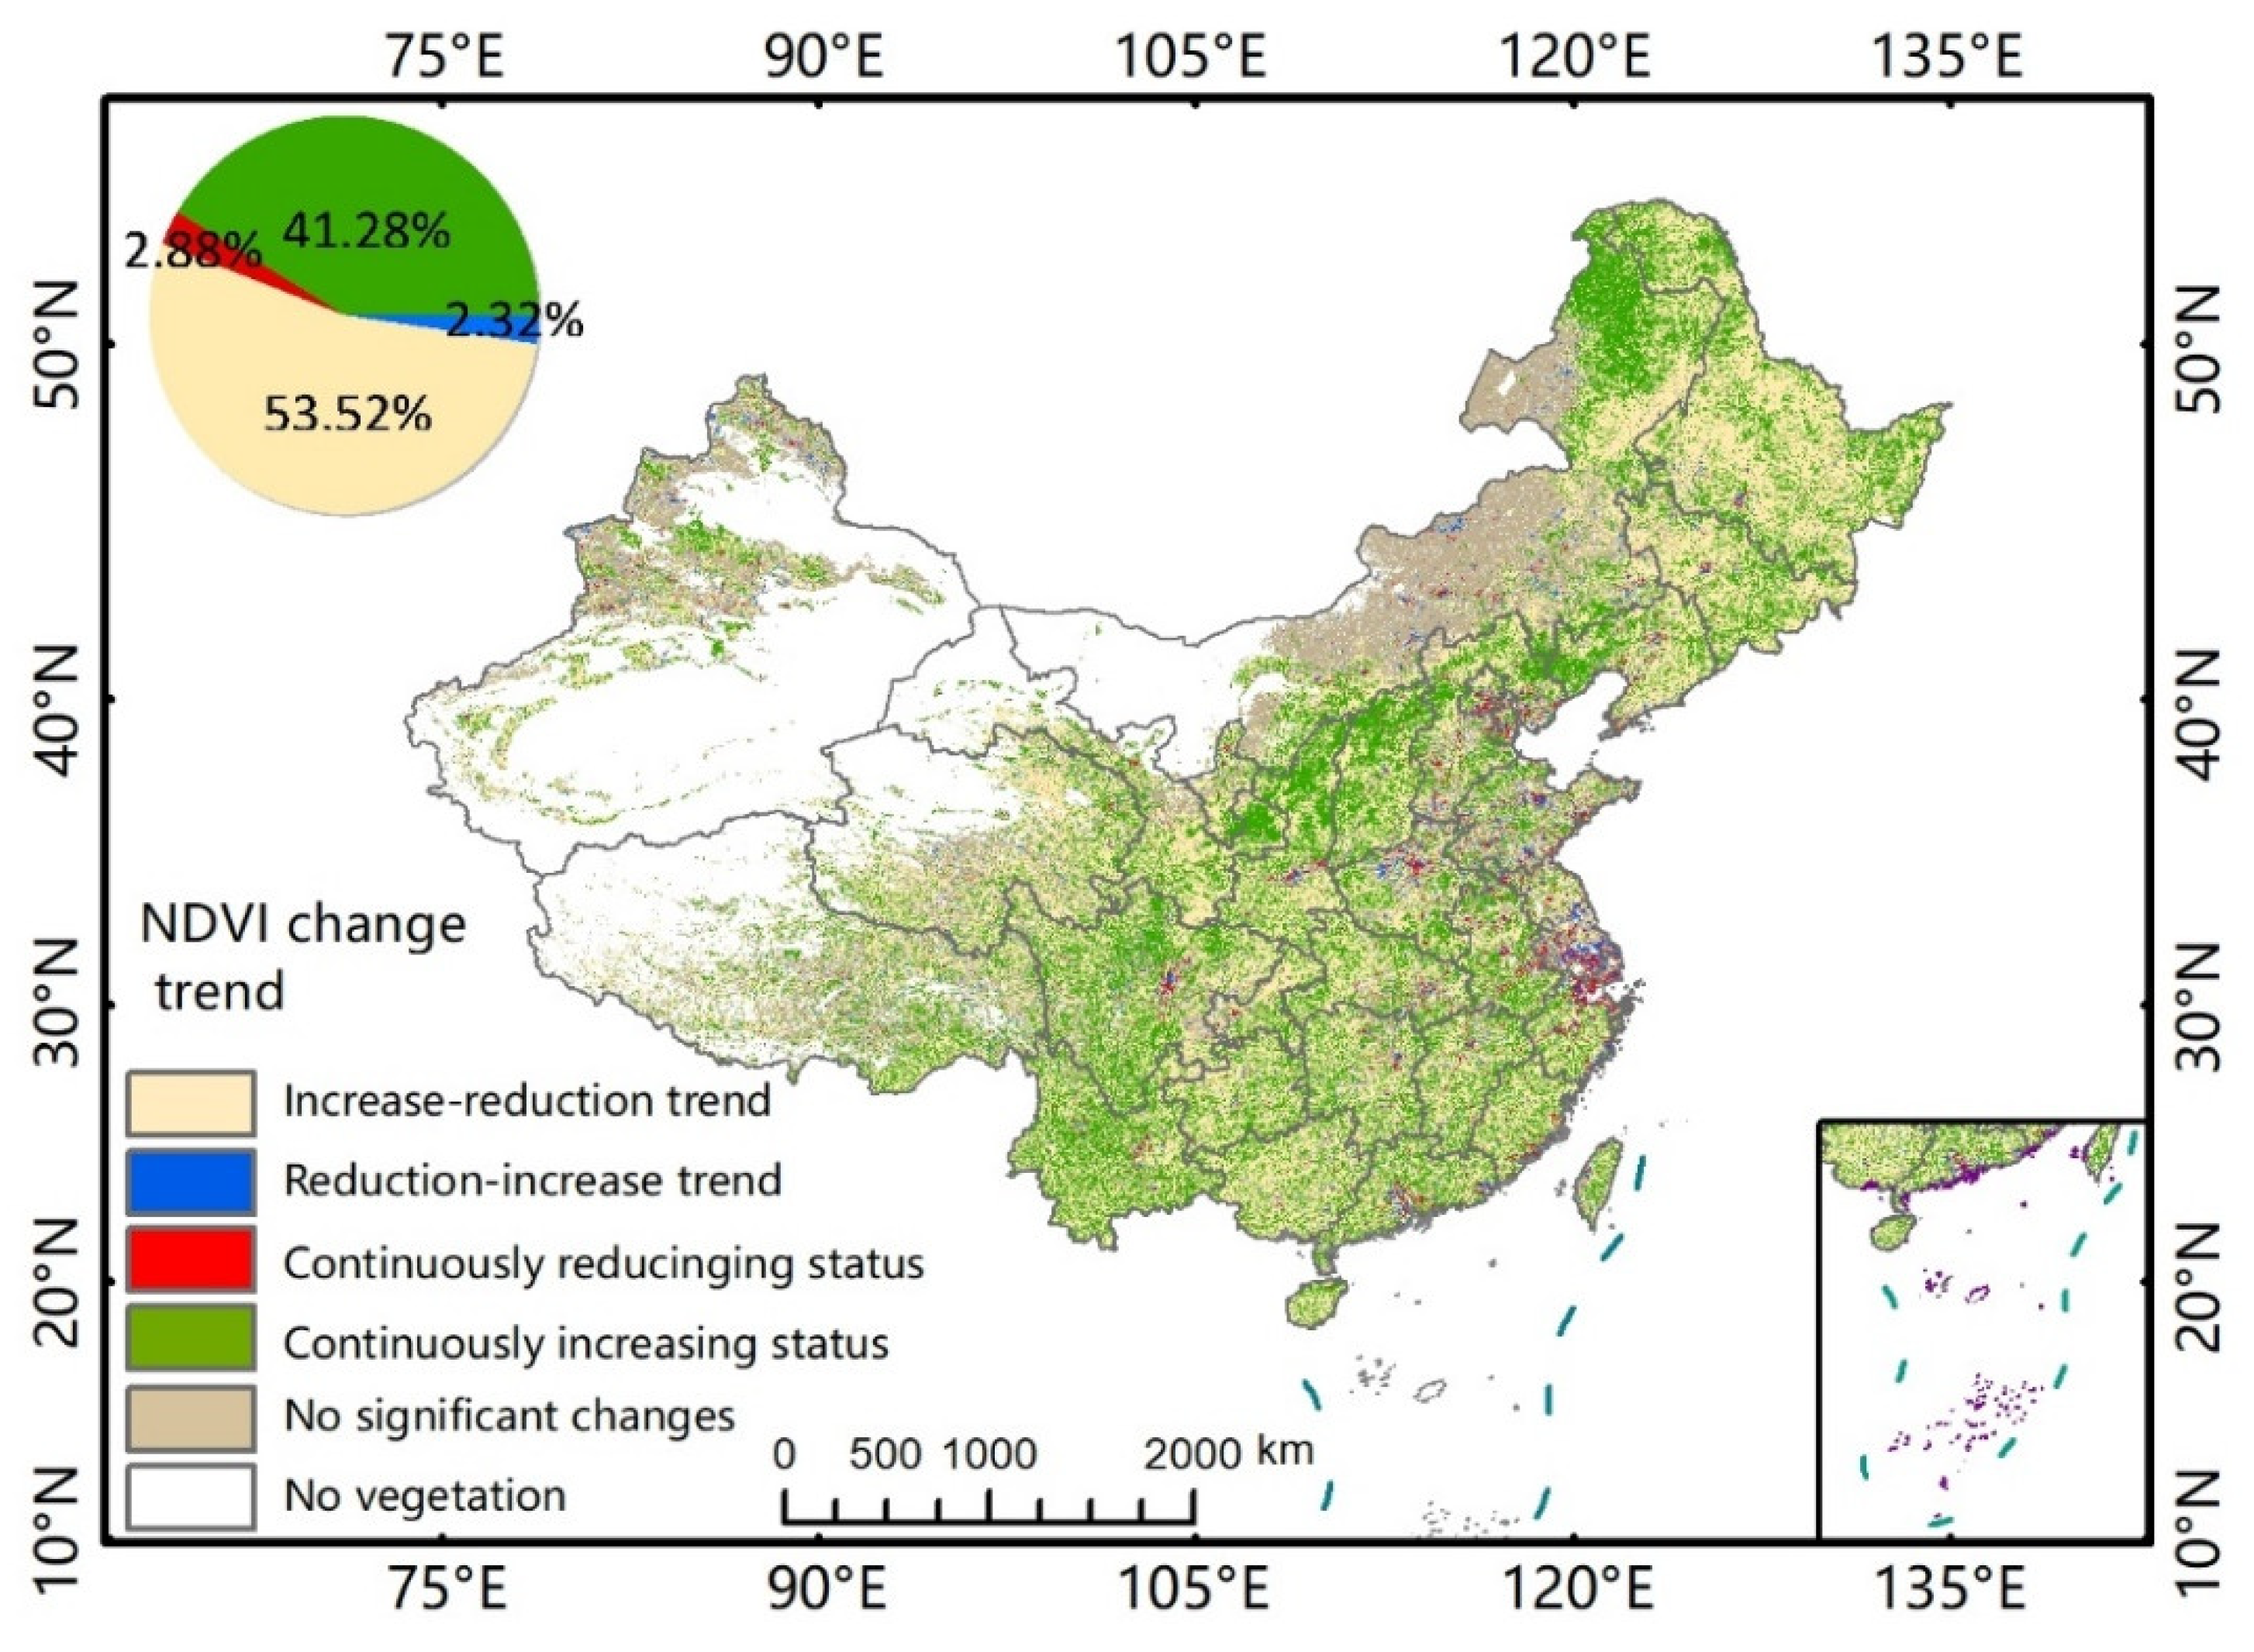
Figure 5 shows the mapping results of vegetation variation sustainability. It is observed that the areas of “continuously increasing status” and “reduction–increase trend” classes account for 41.28% and 2.32% of the total area, respectively. While those of “continuously reducing status” and “increase–reduction trend” classes account for 2.88% and 53.52% of the total area, respectively. The future status of NDVI reducing shows a scattered distribution in China. The areas of the “continuously reducing status” class are mainly observed in the Guanzhong Plain, cities in the middle and lower reaches of the Yangtze River, and economically developed cities (e.g., Beijing, Shanghai, Tianjin, Guangzhou, Chengdu). The areas of “continuously increasing status” class are distributed along the Heihe–Kunming line, while the western areas fall in “reduction–increase trend” and “continuously increasing status” classes, except for the QTP, indicating remarkable achievements in recent years through the implementation of ecological protection and restoration of vegetation projects in the central and western regions.
4.3. Analysis of the Factors Influencing Vegetation Growth
4.3.1. Relationships between Climatic Factors and Vegetation Dynamics
Figure 6 shows the Pearson correlation between the annual average NDVI and temperature/precipitation. It is observed that over 50% of the areas have a positive correlation between the NDVI and precipitation, significantly higher than that between the NDVI and temperature (42.2%), indicating that precipitation may be a more important factor affecting vegetation growth in China. The areas with significant positive correlations between the NDVI and temperature account for 6.42% of the total surface area, observed on the southeast coast, the north of the Qinghai–Tibet Plateau, and the Qaidam Basin. On the other hand, areas showing a significant positive correlation between the NDVI and precipitation account for 12% of the total surface area, observed mainly in Inner Mongolia Plateau, the North China Plain, the Loess Plateau, the Jungar Basin, and North China. In addition, a weak negative correlation between the NDVI and precipitation was found in the Eastern Qinghai–Tibet Plateau and the Hengduan Mountains, while a negative correlation between these two variables was found in Eastern Inner Mongolia and Southeastern China. In addition, significant negative correlations were observed between the NDVI and temperature/precipitation in some areas of Southeast China, indicating that high temperature or rich precipitation in these areas may restrict vegetation growth.
Figure 7 shows the differences in the correlation between the NDVI and temperature/precipitation for different vegetation types. Except for broadleaf forest, needleleaf forest, and grassland, the NDVI of other vegetation types showed a positive correlation with both temperature and precipitation. Among them, deserta and shrubland were both highly positively correlated with precipitation. Needleleaf forest showed a significant negative correlation with temperature and precipitation, with a higher response to temperature than that to precipitation. In addition, the NDVI of the broadleaf forest showed a negative correlation with temperature and a weak positive correlation with precipitation. The NDVI of grassland revealed a high positive correlation with precipitation and a weak correlation with temperature (r = −0.0019). These results further confirmed that the influence of precipitation on the growth of most vegetation types was more significant than that of temperature.
We used a multiple regression model in residual analysis to reveal how the climatic variables influence the NDVI trend. The regression coefficients can reflect the relative impact of each climate driver on the NDVI, with larger coefficients having a greater impact on NDVI changes. Figure 8 shows the regression coefficients of temperature and precipitation. The regression coefficients of temperature are generally smaller than those of precipitation in most regions, indicating that precipitation is the major factor affecting the growth of vegetation in China in most regions. This is consistent with the findings we obtained using the Pearson correlation coefficient. Temperature and precipitation generally show opposite effects on vegetation in the inland areas of Northwest China, while they show similar effects in Southeast China. This means that for arid and semi-arid areas, vegetation condition tends to be promoted when the climate becomes colder and wetter, while for relatively humid areas, vegetation condition is likely to be improved under a warmer and wetter climate.
4.3.2. Relationships between Climate Extremes and Vegetation Dynamics
Figure 9 reveals the correlation between the extreme climate index and the NDVI over the 1998–2018 period. The annual NDVI was generally poorly correlated with extreme temperatures (DTR, TNn, TXn, and TXx) in China. The NDVI showed a positive correlation with extreme cold (TNn) in 67.62% of total surface area and a significant positive correlation (p < 0.05) in 4.06% of the total surface area. The latter was observed mainly in the Qinghai–Tibet Plateau and in Northeast China. These findings indicate that the rise in the lowest daily temperature reduces the risk of low-temperature damaging vegetation during the day, thus promoting the growth of vegetation. The negative correlation between the NDVI and DTR was more frequently observed than the positive correlation in which the areas with significant negative correlation (p < 0.05) account for 11.4% of the total surface area, distributed mainly in the temperate desert area of the Tarim Basin, the Northern Qinghai–Tibet Plateau, the Qilian Mountains, and the Hengduan Mountains.
The regions with a positive correlation between the NDVI and extreme precipitation index (Rx1day and Rx5day) accounted for 60.41 and 67.62%, respectively, of the total surface area of which 7.04% and 4.06% showed significant positive correlations (p < 0.05), respectively. The regions with significant positive correlations between the NDVI and Rx1day were mainly observed in the Qaidam Basin, Inner Mongolia Plateau, while the regions with significant positive correlations between the NDVI and Rx5day were mainly observed in the Tianshan Mountains, the Great Xing’an Mountains.
By analyzing the correlation between the NDVI of different vegetation types and extreme climate indices (Figure 10), it is found that the NDVI of different vegetation types exhibits different responses to extreme precipitation and temperature factors. The NDVI of most vegetation types showed a positive correlation with extreme precipitation (Rx1day and Rx5day), suggesting that precipitation can promote vegetation growth. Shrubland and grassland revealed poor positive correlations with extreme temperature factors (TNn, TXx, and TXn). Deserta showed negative correlations with all climate extremes indices except Rx1day and DTR. For most vegetation types, the NDVI showed negative correlations with extreme temperature indices (DTR and TXn). The strongest negative correlations were found between DTR and the NDVI, indicating that the greater the daily temperature difference, the more obvious the inhibition effect on the NDVI.
4.3.3. Relationships between Human Activities and Vegetation Dynamics
Figure 11a mainly shows an increasing residual trend in most areas, indicating that NDVI dynamics are increasingly difficult to be explained by climate factors only, particularly on the Northeast Plain, the Loess Plateau, the middle and lower reaches of the Yangtze River Plain, and in Yunnan and Guizhou provinces. A prevailing increasing residual trend is also observed on the Mongolian Plateau, which is consistent with [21]. Areas showing a decreasing trend in residual are relatively smaller and sporadically distributed, observed mainly in big cities and urban agglomerations, concentrated particularly in the middle and lower reaches of the Yangtze River. A decreasing residual trend indicates that vegetation growth is lagging behind that predicted by the climate [28].
To conjecture how much human activities contribute to the residual trend, we selected four zones (shown as rectangles in Figure 11a) that have high negative (zone1, zone2, and zone3) and positive (zone4) values. Figure 11b shows the variation of proportion of croplands and urban/built-up during the 2001–2019 period. It is observed that zone1 (mainly in Shanghai and in Jiangsu and Zhejiang provinces) was dominated by increasing urban/built-up and decreasing cropland areas in the period. While the urban/built-up increased relatively steadily, the rate of croplands decreasing was moderate, which leads to the significant negative NDVI residual trend there. Zone2 (mainly in Henan province) has a similar situation as zone1 but with smaller changing rates. Zone3 (mainly in the northwest part of Xinjiang Province) has a small proportion of croplands and almost no urbanization. Therefore, the negative residual trend in this zone cannot be explained by either the area changes of croplands or urban/built-up classes. Zone4 (mainly in Gansu and Ningxia provinces) has a generally increasing proportion of croplands, and the rate has improved significantly since 2009, which contributes significantly to the positive NDVI residual trend there.
From these four demonstration zones, it is clear that most of the residuals could be explained by human factors, in the forms of croplands and urbanization. However, it is also noted that these are not the only factors that caused NDVI residuals over the country. It is possible that non-human factors, such as other climatic factors (i.e., evaporation, extreme events, non-linear responses to climate) in addition to temperature and precipitation may contribute to the residuals.
5. Discussion
The results of this study showed an upward trend of the vegetation in China from 1998 to 2019, which is consistent with the results of the greening trend in Central Asia reported in previous studies [6]. The rapid increase in air temperature since the 1980s [43] has extended the growth cycle of vegetation and promoted vegetation growth to some extent. Moreover, we found that the regions with slightly decreasing NDVI change rates are mainly located around the plains and the economically developed urban clusters which may be mainly caused by intense human activities. Regional differences in vegetation development were due to the vertical zonal distribution of climate, complex terrain, severe climate, and warming, resulting in an offset between the average NDVI values in areas with improved vegetation and those observed in areas with reduced vegetation condition caused by environmental degradation, which results in significant fluctuation trends of vegetation zones.
In this study, we used the Hurst exponent to analyze the sustainability of the NDVI trend to predict possible vegetation future trends. The Hurst exponent mean value obtained using the NDVI data (1998–2019) of China was 0.49, indicating an uncertainty in vegetation trends. In addition, the areas showing continuously increasing status and a reduction–increase trend account for 43.6% of the surface area and are located near the Heihe–Kunming line. This finding demonstrates the remarkable achievements of the ecological restoration and protection of vegetation projects in recent years in the central and western parts of China. Weak continuity was observed in the Yellow River Basin, Northeast China. This may be mainly because that vegetation condition is under the combined action of many factors (natural and human activities). However, the Hurst exponent is an estimation made merely on the time series of the NDVI value, with no influencing factors being involved in consideration. As both climatic and human factors may affect NDVI variation with different intensities, it is possible that the results of the Hurst exponent would have considerable bias. In addition, there is no explicit temporal information for the trend predicted with the Hurst exponent. Therefore, determination of the possible duration is an important issue that needs further investigation [20].
Vegetation dynamics in China are the combined result of climate change and human activities. The NDVI and temperature are mainly positively correlated in the northern part of the QTP and the southeastern coastal areas. This finding suggests that the increased temperature would directly promote photosynthesis of vegetation and break the restriction of low temperature on vegetation growth [70,71]. The correlation between the NDVI and temperature was observed in eastern Inner Mongolia and southeastern China, indicating that vegetation growth may be inhibited due to the increased respiration caused by high temperature [72]. We also quantitatively analyzed the influence of different factors on the NDVI through multiple linear regression models. The NDVI is influenced by a combination of factors, and the regression coefficient of precipitation is larger than that of temperature as shown by the multiple regression models; therefore, precipitation may be the dominant factor affecting the NDVI, which is consistent with the conclusions obtained from the correlation analysis of temperature and precipitation with the NDVI separately. For instance, the negative impact of human activities on vegetation growth is frequent in large cities and urban agglomerations due to the urban expansion into farmland and forest [73]. Moreover, human activities have significant promoting effects on vegetation growth due to ecological engineering construction, agricultural development, closing hillsides for afforestation, and grazing prohibition and delaying stocking. Human activities, such as intensive agriculture, involving fertilization and irrigation practices, and the implementation of vegetation construction projects (i.e., returning farmland to forests) have effectively increased the vegetation condition at local and regional scales. Ecological protection and vegetation restoration projects (e.g., Three North Shelterbelt, Grain for Green, Establishment of Nature Reserves) are able to effectively promote vegetation growth to protect and improve the ecological environment.
In addition, the regression coefficients also show the dominant factors influencing the NDVI can vary from place to place. For example, the influence of precipitation on the NDVI was stronger than that of temperature in several areas, including North China, the Loess Plateau, and other regions, while in economically developed coastal cities, such as the North China Plain and the middle and lower reaches of the Yangtze River, both human activities and climate factors have important impacts on the NDVI. Moreover, the influence of precipitation on high mountain forests was more significant than that of temperature. The NDVI in the Yellow River Source Region was found to be weakly impacted by human activities but highly impacted by climate factors. However, with the gradual implementation of the ecological protection project in these areas, the positive impact of human activities on the NDVI is likely to increase in the future. The areas where either climate change or human activities are impacting the NDVI account for a small area, with a relatively scattered distribution. Overall, the NDVI was broadly changing under the combined influence of climate factors and human factors. The impact of human activities and climate change on vegetation dynamics in China, in particular their driving mechanisms, needs further investigation in the future.
6. Conclusions
In this study, the changing trend and driving factors influencing the NDVI of vegetation in China over the 1998–2019 period were analyzed, based on the data of temperature, precipitation, climate extremes indices, and the NDVI, using trend analysis, correlation analysis, and multiple regression residual analysis methods. The main conclusions are as follows:
- (1)
- The NDVI of vegetation in China showed an overall increasing trend from 1998 to 2019, with a slight fluctuation in the interannual variability. The areas with significant increases in the NDVI are located on the North China Plain, the Loess Plateau, and in the Qinling Mountains–Huaihe River area, while the areas with significant decreases in NDVI are located in the Jungar Basin, around the Northeast Plain, and in several economically developed cities.
- (2)
- According to the Hurst exponent analysis results, the anti-continuity of the NDVI change is greater than the continuity. The predicted vegetation growth will remain consistent with past trends in 44.16% of the area.
- (3)
- The impact of climate factors on the NDVI showed significant spatial variation. The correlation between the NDVI and precipitation was overall higher than that with temperature. Areas showing significant positive correlations between the NDVI and precipitation are located on the Inner Mongolia Plateau, the North China Plain, and the Loess Plateau. Areas showing significant positive correlations between the NDVI and temperature are located on the southeast coast, in the north of the Qinghai–Tibet Plateau, and in the Qaidam Basin. Extreme temperatures and precipitation have spatially different impacts on vegetation dynamics. The NDVI of most vegetation types showed positive correlations with extreme precipitation, while showing negative correlations with extreme temperature.
- (4)
- The residual trend provides a preliminary investigation about the driving factors of vegetation dynamics in addition to the precipitation and temperature. While human activities are likely to contribute significantly to it, it was found that the residual trend in some areas could be explained by human activities but could not in other places.
This study provides a basis for a comprehensive understanding of the dynamics and influencing factors of vegetation condition in China. However, there are some shortcomings. First, due to the limited data, only precipitation, temperature, climate extremes, and human activities were considered as driving factors of the NDVI change in this study. Sunshine duration, wind speed, soil moisture, and transpiration can also affect vegetation growth. Second, the spatial resolution of the extreme climate dataset is coarser than the NDVI dataset. As extreme precipitation usually happens in a small region, resampling it to a finer resolution may exaggerate the effect of extreme precipitation on the NDVI in some areas. Last, only interannual scale analysis was carried out in this study, but the response of vegetation to climate could be delayed at monthly and seasonal scales. Therefore, analysis at various temporal scales may be necessary in future studies.
Author Contributions
J.C.: methodology, software, validation, visualization and writing—original draft; Q.L.: data curation and software; S.W.: data curation and software; C.H.: conceptualization, methodology, writing—reviewing and editing, supervision, resources and funding acquisition. All authors have read and agreed to the published version of the manuscript.
Funding
This research was funded by Shaanxi Natural Science Foundation, grant number 2021JM314, the National Key R&D Program of China, grant number 2017YFC0404302, and Undergraduate Students’ innovation and entrepreneurship training program, grant number 2021422.
Acknowledgments
The authors would like to thank NASA for providing MODIS data for this study. The land cover dataset was obtained from MODIS land cover type product (MCD12Q1) (https://modis.gsfc.nasa.gov/data/dataprod/mod12.php, accessed on 1 May 2021). The NDVI dataset was obtained from resource and environment science and data center (http://www.resdc.cn/data.aspx?DATAID=49, accessed on 22 April 2021). The extreme climate dataset was obtained from Met Office Hadley Center (www.metoffice.gov.uk/hadobs/hadex3, accessed on 1 December 2020). The climate dataset was obtained from China’s surface climate daily data (V3.0) (http://cdc.cma.gov.cn/home.do, accessed on 1 April 2021). The authors would like to thank three anonymous reviewers for their constructive comments that helped us greatly improve this manuscript.
Conflicts of Interest
The authors declare no conflict of interest.
References
- Jin, L.; Ganopolski, A.; Chen, F.; Claussen, M.; Wang, H. Impacts of snow and glaciers over Tibetan Plateau on Holocene climate change: Sensitivity experiments with a coupled model of intermediate complexity. Geophys. Res. Lett. 2005, 32, L17709. [Google Scholar] [CrossRef] [Green Version]
- Yang, K.; Ye, B.; Zhou, D.; Wu, B.; Foken, T.; Qin, J.; Zhou, Z. Response of hydrological cycle to recent climate changes in the Tibetan Plateau. Clim. Chang. 2011, 109, 517–534. [Google Scholar] [CrossRef]
- Yao, T.; Thompson, L.G.; Mosbrugger, V.; Zhang, F.; Ma, Y.; Luo, T.; Xu, B.; Yang, X.; Joswiak, D.R.; Wang, W. Third pole environment (TPE). Environ. Dev. 2012, 3, 52–64. [Google Scholar] [CrossRef]
- Zhang, Y.; Li, T.; Wang, B. Decadal change of the spring snow depth over the Tibetan Plateau: The associated circulation and influence on the East Asian summer monsoon. J. Clim. 2004, 17, 2780–2793. [Google Scholar] [CrossRef] [Green Version]
- Fang, J.Y.; Song, Y.C.; Liu, H.Y.; Piao, S.L. Vegetation-climate relationship and its application in the division of vegetation zone in China. J. Integr. Plant Biol. 2002, 44, 1105–1122. [Google Scholar]
- Kong, D.; Zhang, Q.; Singh, V.P.; Shi, P. Seasonal vegetation response to climate change in the Northern Hemisphere (1982–2013). Glob. Planet. Chang. 2017, 148, 1–8. [Google Scholar] [CrossRef] [Green Version]
- Piao, S.; Friedlingstein, P.; Ciais, P.; Zhou, L.; Chen, A. Effect of climate and CO2 changes on the greening of the Northern Hemisphere over the past two decades. Geophys. Res. Lett. 2006, 33, L23402. [Google Scholar] [CrossRef] [Green Version]
- Nemani, R.R.; Keeling, C.D.; Hashimoto, H.; Jolly, W.M.; Piper, S.C.; Tucker, C.J.; Myneni, R.B.; Running, S.W. Climate-driven increases in global terrestrial net primary production from 1982 to 1999. Science 2003, 300, 1560–1563. [Google Scholar] [CrossRef] [Green Version]
- Pearson, R.G.; Phillips, S.J.; Loranty, M.M.; Beck, P.S.; Damoulas, T.; Knight, S.J.; Goetz, S.J. Shifts in Arctic vegetation and associated feedbacks under climate change. Nat. Clim. Chang. 2013, 3, 673–677. [Google Scholar] [CrossRef]
- Peng, S.; Chen, A.; Xu, L.; Cao, C.; Fang, J.; Myneni, R.B.; Pinzon, J.E.; Tucker, C.J.; Piao, S. Recent change of vegetation growth trend in China. Environ. Res. Lett. 2011, 6, 044027. [Google Scholar] [CrossRef]
- Peteet, D. Sensitivity and rapidity of vegetational response to abrupt climate change. Proc. Natl. Acad. Sci. USA 2000, 97, 1359–1361. [Google Scholar] [CrossRef] [PubMed] [Green Version]
- Bala, G.; Caldeira, K.; Wickett, M.; Phillips, T.; Lobell, D.; Delire, C.; Mirin, A. Combined climate and carbon-cycle effects of large-scale deforestation. Proc. Natl. Acad. Sci. USA 2007, 104, 6550–6555. [Google Scholar] [CrossRef] [PubMed] [Green Version]
- Brando, P.M.; Balch, J.K.; Nepstad, D.C.; Morton, D.C.; Putz, F.E.; Coe, M.T.; Silvério, D.; Macedo, M.N.; Davidson, E.A.; Nóbrega, C.C. Abrupt increases in Amazonian tree mortality due to drought-fire interactions. Proc. Natl. Acad. Sci. USA 2014, 111, 6347–6352. [Google Scholar] [CrossRef] [PubMed] [Green Version]
- Choat, B.; Jansen, S.; Brodribb, T.J.; Cochard, H.; Delzon, S.; Bhaskar, R.; Bucci, S.J.; Feild, T.S.; Gleason, S.M.; Hacke, U.G. Global convergence in the vulnerability of forests to drought. Nature 2012, 491, 752–755. [Google Scholar] [CrossRef] [PubMed] [Green Version]
- Malhi, Y.; Roberts, J.T.; Betts, R.A.; Killeen, T.J.; Li, W.; Nobre, C.A. Climate change, deforestation, and the fate of the Amazon. Science 2008, 319, 169–172. [Google Scholar] [CrossRef] [PubMed] [Green Version]
- Pettorelli, N.; Vik, J.O.; Mysterud, A.; Gaillard, J.-M.; Tucker, C.J.; Stenseth, N.C. Using the satellite-derived NDVI to assess ecological responses to environmental change. Trends Ecol. Evol. 2005, 20, 503–510. [Google Scholar] [CrossRef]
- Sun, W.; Song, X.; Mu, X.; Gao, P.; Wang, F.; Zhao, G. Spatiotemporal vegetation cover variations associated with climate change and ecological restoration in the Loess Plateau. Agric. For. Meteorol. 2015, 209, 87–99. [Google Scholar] [CrossRef]
- Wang, J.; Wang, K.; Zhang, M.; Zhang, C. Impacts of climate change and human activities on vegetation cover in hilly southern China. Ecol. Eng. 2015, 81, 451–461. [Google Scholar] [CrossRef]
- Chen, J.; Yan, F.; Lu, Q. Spatiotemporal variation of vegetation on the Qinghai–Tibet Plateau and the influence of climatic factors and human activities on vegetation trend (2000–2019). Remote Sens. 2020, 12, 3150. [Google Scholar] [CrossRef]
- Peng, J.; Liu, Z.; Liu, Y.; Wu, J.; Han, Y. Trend analysis of vegetation dynamics in Qinghai-Tibet Plateau using Hurst Exponent. Ecol. Indic. 2012, 14, 28–39. [Google Scholar] [CrossRef]
- Tong, S.; Zhang, J.; Bao, Y.; Lai, Q.; Lian, X.; Li, N.; Bao, Y. Analyzing vegetation dynamic trend on the Mongolian Plateau based on the Hurst exponent and influencing factors from 1982–2013. J. Geogr. Sci. 2018, 28, 595–610. [Google Scholar] [CrossRef] [Green Version]
- Chen, B.; Zhang, X.; Tao, J.; Wu, J.; Wang, J.; Shi, P.; Zhang, Y.; Yu, C. The impact of climate change and anthropogenic activities on alpine grassland over the Qinghai-Tibet Plateau. Agric. For. Meteorol. 2014, 189, 11–18. [Google Scholar] [CrossRef]
- Hall, F.G.; Huemmrich, K.F.; Goetz, S.J.; Sellers, P.J.; Nickeson, J.E. Satellite remote sensing of surface energy balance: Success, failures, and unresolved issues in FIFE. J. Geophys. Res. Atmos. 1992, 97, 19061–19089. [Google Scholar] [CrossRef]
- Li, Z.T.; Kafatos, M. Interannual variability of vegetation in the United States and its relation to El Nino/Southern Oscillation. Remote Sens. Environ. 2000, 71, 239–247. [Google Scholar] [CrossRef]
- Xiu, L.; Yan, C.; Li, X.; Qian, D.; Feng, K. Changes in wetlands and surrounding land cover in a desert area under the influences of human and climatic factors: A case study of the Hongjian Nur region. Ecol. Indic. 2019, 101, 261–273. [Google Scholar] [CrossRef]
- Birtwistle, A.N.; Laituri, M.; Bledsoe, B.; Friedman, J.M. Using NDVI to measure precipitation in semi-arid landscapes. J. Arid Environ. 2016, 131, 15–24. [Google Scholar] [CrossRef] [Green Version]
- Georganos, S.; Abdi, A.M.; Tenenbaum, D.E.; Kalogirou, S. Examining the NDVI-rainfall relationship in the semi-arid Sahel using geographically weighted regression. J. Arid Environ. 2017, 146, 64–74. [Google Scholar] [CrossRef]
- Liu, Y.; Lei, H. Responses of natural vegetation dynamics to climate drivers in China from 1982 to 2011. Remote Sens. 2015, 7, 10243–10268. [Google Scholar] [CrossRef] [Green Version]
- Xu, H.; Wang, X.; Yang, T. Trend shifts in satellite-derived vegetation growth in Central Eurasia, 1982–2013. Sci. Total Environ. 2017, 579, 1658–1674. [Google Scholar] [CrossRef]
- Lamchin, M.; Lee, W.-K.; Jeon, S.W.; Wang, S.W.; Lim, C.H.; Song, C.; Sung, M. Long-term trend and correlation between vegetation greenness and climate variables in Asia based on satellite data. Sci. Total Environ. 2018, 618, 1089–1095. [Google Scholar] [CrossRef]
- Liu, H.; Song, X.; Wen, W.; Jia, Q.; Zhu, D. Quantitative Effects of Climate Change on Vegetation Dynamics in Alpine Grassland of Qinghai-Tibet Plateau in a County. Atmosphere 2022, 13, 324. [Google Scholar] [CrossRef]
- Yang, Y.; Xu, J.; Hong, Y.; Lv, G. The dynamic of vegetation coverage and its response to climate factors in Inner Mongolia, China. Stoch. Environ. Res. Risk Assess. 2012, 26, 357–373. [Google Scholar] [CrossRef]
- Xie, B.; Jia, X.; Qin, Z.; Shen, J.; Chang, Q. Vegetation dynamics and climate change on the Loess Plateau, China: 1982–2011. Reg. Environ. Chang. 2016, 16, 1583–1594. [Google Scholar] [CrossRef]
- Sun, J.; Qin, X.; Yang, J. The response of vegetation dynamics of the different alpine grassland types to temperature and precipitation on the Tibetan Plateau. Environ. Monit. Assess. 2016, 188, 20. [Google Scholar] [CrossRef] [Green Version]
- Ren, Y.; Liu, J.; Liu, S.; Wang, Z.; Liu, T.; Shalamzari, M.J. Effects of Climate Change on Vegetation Growth in the Yellow River Basin from 2000 to 2019. Remote Sens. 2022, 14, 687. [Google Scholar] [CrossRef]
- Wang, Y.; Peng, D.; Shen, M.; Xu, X.; Yang, X.; Huang, W.; Yu, L.; Liu, L.; Li, C.; Li, X. Contrasting effects of temperature and precipitation on vegetation greenness along elevation gradients of the Tibetan plateau. Remote Sens. 2020, 12, 2751. [Google Scholar] [CrossRef]
- Wang, S.; Liu, Q.; Huang, C. Vegetation Change and Its Response to Climate Extremes in the Arid Region of Northwest China. Remote Sens. 2021, 13, 1230. [Google Scholar] [CrossRef]
- Zhang, B.; Cui, L.; Shi, J.; Wei, P. Vegetation dynamics and their response to climatic variability in China. Adv. Meteorol. 2017, 2017, 8282353. [Google Scholar] [CrossRef] [Green Version]
- Jin, H.; Chen, X.; Wang, Y.; Zhong, R.; Zhao, T.; Liu, Z.; Tu, X. Spatio-temporal distribution of NDVI and its influencing factors in China. J. Hydrol. 2021, 603, 127129. [Google Scholar] [CrossRef]
- Beck, H.E.; McVicar, T.R.; van Dijk, A.I.; Schellekens, J.; de Jeu, R.A.; Bruijnzeel, L.A. Global evaluation of four AVHRR–NDVI data sets: Intercomparison and assessment against Landsat imagery. Remote Sens. Environ. 2011, 115, 2547–2563. [Google Scholar] [CrossRef]
- Bradley, B.A.; Jacob, R.W.; Hermance, J.F.; Mustard, J.F. A curve fitting procedure to derive inter-annual phenologies from time series of noisy satellite NDVI data. Remote Sens. Environ. 2007, 106, 137–145. [Google Scholar] [CrossRef]
- Gu, J.; Li, X.; Huang, C.; Okin, G.S. A simplified data assimilation method for reconstructing time-series MODIS NDVI data. Adv. Space Res. 2009, 44, 501–509. [Google Scholar] [CrossRef]
- Jacquin, A.; Sheeren, D.; Lacombe, J.-P. Vegetation cover degradation assessment in Madagascar savanna based on trend analysis of MODIS NDVI time series. Int. J. Appl. Earth Obs. 2010, 12, S3–S10. [Google Scholar] [CrossRef] [Green Version]
- Pang, G.; Wang, X.; Yang, M. Using the NDVI to identify variations in, and responses of, vegetation to climate change on the Tibetan Plateau from 1982 to 2012. Quat. Int. 2017, 444, 87–96. [Google Scholar] [CrossRef]
- Piao, S.; Fang, J.; Zhou, L.; Guo, Q.; Henderson, M.; Ji, W.; Li, Y.; Tao, S. Interannual variations of monthly and seasonal normalized difference vegetation index (NDVI) in China from 1982 to 1999. J. Geophys. Res. Atmos. 2003, 108, 4401. [Google Scholar] [CrossRef]
- Tucker, C.J.; Pinzon, J.E.; Brown, M.E.; Slayback, D.A.; Pak, E.W.; Mahoney, R.; Vermote, E.F.; El Saleous, N. An extended AVHRR 8-km NDVI dataset compatible with MODIS and SPOT vegetation NDVI data. Int. J. Remote Sens. 2005, 26, 4485–4498. [Google Scholar] [CrossRef]
- Mao, D.; Wang, Z.; Luo, L.; Ren, C. Integrating AVHRR and MODIS data to monitor NDVI changes and their relationships with climatic parameters in Northeast China. Int. J. Appl. Earth Obs. 2012, 18, 528–536. [Google Scholar] [CrossRef]
- Park, H.S.; Sohn, B. Recent trends in changes of vegetation over East Asia coupled with temperature and rainfall variations. J. Geophys. Res. Atmos. 2010, 115, D14101. [Google Scholar] [CrossRef]
- Piao, S.; Fang, J.; He, J. Variations in vegetation net primary production in the Qinghai-Xizang Plateau, China, from 1982 to 1999. Clim. Chang. 2006, 74, 253–267. [Google Scholar] [CrossRef]
- Gu, Z.; Duan, X.; Shi, Y.; Li, Y.; Pan, X. Spatiotemporal variation in vegetation coverage and its response to climatic factors in the Red River Basin, China. Ecol. Indic. 2018, 93, 54–64. [Google Scholar] [CrossRef]
- Evans, J.; Geerken, R. Discrimination between climate and human-induced dryland degradation. J. Arid Environ. 2004, 57, 535–554. [Google Scholar] [CrossRef]
- Wessels, K.J.; Prince, S.D.; Malherbe, J.; Small, J.; Frost, P.E.; VanZyl, D. Can human-induced land degradation be distinguished from the effects of rainfall variability? A case study in South Africa. J. Arid Environ. 2007, 68, 271–297. [Google Scholar] [CrossRef]
- Tian, Y.; Bai, X.; Wang, S.; Qin, L.; Li, Y. Spatial-temporal changes of vegetation cover in Guizhou Province, Southern China. Chin. Geogr. Sci. 2017, 27, 25–38. [Google Scholar] [CrossRef] [Green Version]
- He, Y.; Lee, E.; Warner, T.A. A time series of annual land use and land cover maps of China from 1982 to 2013 generated using AVHRR GIMMS NDVI3g data. Remote Sens. Environ. 2017, 199, 201–217. [Google Scholar] [CrossRef]
- Zhang, P.; Cai, Y.; Yang, W.; Yi, Y.; Yang, Z.; Fu, Q. Multiple spatio-temporal patterns of vegetation coverage and its relationship with climatic factors in a large dam-reservoir-river system. Ecol. Eng. 2019, 138, 188–199. [Google Scholar] [CrossRef]
- Hutchinson, M.F. Interpolation of rainfall data with thin plate smoothing splines. Part I: Two dimensional smoothing of data with short range correlation. J. Geogr. Inf. Decis. Anal. 1998, 2, 139–151. [Google Scholar]
- Dunn, R.J.; Alexander, L.V.; Donat, M.G.; Zhang, X.; Bador, M.; Herold, N.; Lippmann, T.; Allan, R.; Aguilar, E.; Barry, A.A. Development of an updated global land in situ-based data set of temperature and precipitation extremes: HadEX3. J. Geophys. Res. Atmos. 2020, 125, e2019JD032263. [Google Scholar] [CrossRef]
- Wong, M.; Mok, H.; Lee, T. Observed changes in extreme weather indices in Hong Kong. Int. J. Climatol. 2011, 31, 2300–2311. [Google Scholar] [CrossRef]
- You, Q.; Kang, S.; Aguilar, E.; Yan, Y. Changes in daily climate extremes in the eastern and central Tibetan Plateau during 1961–2005. J. Geophys. Res. Atmos. 2008, 113, D07101. [Google Scholar] [CrossRef] [Green Version]
- You, Q.; Kang, S.; Aguilar, E.; Pepin, N.; Flügel, W.-A.; Yan, Y.; Xu, Y.; Zhang, Y.; Huang, J. Changes in daily climate extremes in China and their connection to the large-scale atmospheric circulation during 1961–2003. Clim. Dyn. 2011, 36, 2399–2417. [Google Scholar] [CrossRef]
- Jin, K.; Wang, F.; Li, P. Responses of vegetation cover to environmental change in large cities of China. Sustainability 2018, 10, 270. [Google Scholar] [CrossRef] [Green Version]
- Tošić, I. Spatial and temporal variability of winter and summer precipitation over Serbia and Montenegro. Theor. Appl. Clim. 2004, 77, 47–56. [Google Scholar] [CrossRef]
- Hirsch, R.M.; Slack, J.R. A nonparametric trend test for seasonal data with serial dependence. Water Resour. Res. 1984, 20, 727–732. [Google Scholar] [CrossRef] [Green Version]
- Yue, S.; Wang, C. The Mann-Kendall test modified by effective sample size to detect trend in serially correlated hydrological series. Water Resour. Manag. 2004, 18, 201–218. [Google Scholar] [CrossRef]
- De Jong, R.; de Bruin, S.; de Wit, A.; Schaepman, M.E.; Dent, D.L. Analysis of monotonic greening and browning trends from global NDVI time-series. Remote Sens. Environ. 2011, 115, 692–702. [Google Scholar] [CrossRef] [Green Version]
- Douglas, E.; Vogel, R.; Kroll, C. Trends in floods and low flows in the United States: Impact of spatial correlation. J. Hydrol. 2000, 240, 90–105. [Google Scholar] [CrossRef]
- Xie, P.; Chen, G.; Lei, H. Hydrological alteration analysis method based on Hurst coefficient. J. Basic Sci. Eng. 2009, 17, 32–39. [Google Scholar]
- Ibrahim, Y.Z.; Balzter, H.; Kaduk, J.; Tucker, C.J. Land degradation assessment using residual trend analysis of GIMMS NDVI3g, soil moisture and rainfall in Sub-Saharan West Africa from 1982 to 2012. Remote Sens. 2015, 7, 5471–5494. [Google Scholar] [CrossRef] [Green Version]
- Geerken, R.; Ilaiwi, M. Assessment of rangeland degradation and development of a strategy for rehabilitation. Remote Sens. Environ. 2004, 90, 490–504. [Google Scholar] [CrossRef]
- Michaletz, S.T.; Cheng, D.; Kerkhoff, A.J.; Enquist, B.J. Convergence of terrestrial plant production across global climate gradients. Nature 2014, 512, 39–43. [Google Scholar] [CrossRef]
- Yu, L.; Huang, L.; Shao, X.; Xiao, F.; Wilmking, M.; Zhang, Y. Warming-induced decline of Picea crassifolia growth in the Qilian Mountains in recent decades. PLoS ONE 2015, 10, e0129959. [Google Scholar] [CrossRef] [PubMed]
- Lu, J.; Ji, J. A simulation and mechanism analysis of long-term variations at land surface over arid/semi-arid area in north China. J. Geophys. Res. Atmos. 2006, 111, D09306. [Google Scholar] [CrossRef]
- Zhou, L.; Tucker, C.J.; Kaufmann, R.K.; Slayback, D.; Shabanov, N.V.; Myneni, R.B. Variations in northern vegetation activity inferred from satellite data of vegetation index during 1981 to 1999. J. Geophys. Res. Atmos. 2001, 106, 20069–20083. [Google Scholar] [CrossRef]
Figure 1.
Geographical features of China: (a) geographical settings with elevation information; (b) climate zones; (c) vegetation types.
Figure 1.
Geographical features of China: (a) geographical settings with elevation information; (b) climate zones; (c) vegetation types.

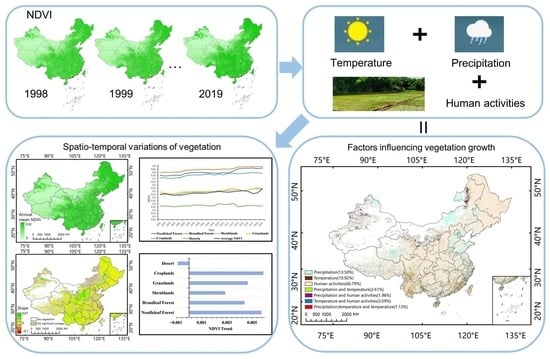
Figure 2.
Flow chart of this study.

Figure 3.
(a) Average NDVI; (b) annual NDVI values of different vegetation; (c) NDVI trend; and (d) NDVI trends of different vegetation in China from 1998 to 2019.
Figure 3.
(a) Average NDVI; (b) annual NDVI values of different vegetation; (c) NDVI trend; and (d) NDVI trends of different vegetation in China from 1998 to 2019.

Figure 4.
Hurst exponent for the annual average NDVI time series in China from 1998 to 2019.

Figure 5.
Vegetation variation sustainability in China.

Figure 6.
(a) Correlation between the NDVI and temperature in China from 1998 to 2019; (b) correlation between the NDVI and precipitation in China from 1998 to 2019. Positive/Negative (n.s.) represents positive/negative correlation that did not pass the significance test. Positive/Negative (p < 0.05) indicates positive/negative correlation at 95% significance level.

Figure 7.
Correlation between the NDVI and climatic factors for different vegetations in China from 1998 to 2019.
Figure 7.
Correlation between the NDVI and climatic factors for different vegetations in China from 1998 to 2019.

Figure 8.
(a) Regression coefficient of temperature; (b) regression coefficient of precipitation, derived from multiple linear regression modelling.
Figure 8.
(a) Regression coefficient of temperature; (b) regression coefficient of precipitation, derived from multiple linear regression modelling.

Figure 9.
Spatial correlation between the NDVI and climate extremes indices in China over the 1998–2018 period. Positive/Negative (n.s.) represents positive/negative correlation that did not pass the significance test. Positive/Negative (p < 0.05) indicates positive/negative correlation at 95% significance level: (a) DTR (°C); (b) TNn (°C); (c) TXn (°C); (d) Rx5day (mm); (e) TXx (°C); (f) Rx1day (mm). A bar chart showing the statistics is placed inside each map.

Figure 10.
Spatial correlation between the NDVI of different vegetation types and climate extremes indices in China over the 1998–2018 period: (a) DTR (°C); (b) Rx5day (mm); (c) Rx1day (mm); (d) TXn (°C); (e) TNn (°C); (f) TXx (°C).
Figure 10.
Spatial correlation between the NDVI of different vegetation types and climate extremes indices in China over the 1998–2018 period: (a) DTR (°C); (b) Rx5day (mm); (c) Rx1day (mm); (d) TXn (°C); (e) TNn (°C); (f) TXx (°C).

Figure 11.
(a) Spatial distribution of residual NDVI trends in China over the 1998–2019 period; (b) variation of human-dominated land cover (croplands and urban/built-up) in percentage in four typical zones over the 2001–2019 period.
Figure 11.
(a) Spatial distribution of residual NDVI trends in China over the 1998–2019 period; (b) variation of human-dominated land cover (croplands and urban/built-up) in percentage in four typical zones over the 2001–2019 period.


Table 1.
Climate extremes indices used in this study.
| Indices | Indices Name | Definition | Units | |
|---|---|---|---|---|
| Temperature Extremes Indices | DTR | Diurnal temperature range | Annual mean difference between daily max. and min. temperature | °C |
| TXx | Hottest day | Monthly and annual highest value of daily max. temperature | °C | |
| TNx | Warmest night | Monthly and annual highest value of daily min. temperature | °C | |
| TXn | Coldest day | Monthly and annual lowest value of daily max. temperature | °C | |
| Precipitation Extremes Indices | Rx1day | Max. 1 day precipitation amount | Monthly and annual maximum 1-day precipitation | mm |
| Rx5day | Max. 5-day precipitation amount | Monthly and annual maximum consecutive 5-day precipitation | mm |
Table 2.
Classification of sustainability of vegetation variations.
| −20 < Zc < −1.96 | 1.96 < Zc < 20 | |
|---|---|---|
| H < 0.5 | Reduction–increase trend | Increase–reduction trend |
| H > 0.5 | Continuously reducing status | Continuously increasing status |
Publisher’s Note: MDPI stays neutral with regard to jurisdictional claims in published maps and institutional affiliations. |
© 2022 by the authors. Licensee MDPI, Basel, Switzerland. This article is an open access article distributed under the terms and conditions of the Creative Commons Attribution (CC BY) license (https://creativecommons.org/licenses/by/4.0/).
Share and Cite
MDPI and ACS Style
Chang, J.; Liu, Q.; Wang, S.; Huang, C. Vegetation Dynamics and Their Influencing Factors in China from 1998 to 2019. Remote Sens. 2022, 14, 3390. https://0-doi-org.brum.beds.ac.uk/10.3390/rs14143390
AMA Style
Chang J, Liu Q, Wang S, Huang C. Vegetation Dynamics and Their Influencing Factors in China from 1998 to 2019. Remote Sensing. 2022; 14(14):3390. https://0-doi-org.brum.beds.ac.uk/10.3390/rs14143390
Chicago/Turabian StyleChang, Jiahui, Qihang Liu, Simeng Wang, and Chang Huang. 2022. "Vegetation Dynamics and Their Influencing Factors in China from 1998 to 2019" Remote Sensing 14, no. 14: 3390. https://0-doi-org.brum.beds.ac.uk/10.3390/rs14143390
Note that from the first issue of 2016, this journal uses article numbers instead of page numbers. See further details here.